Steel Plate Shear Wall Design - SEAoT
Steel Plate Shear Wall Design - SEAoT
Steel Plate Shear Wall Design - SEAoT
- No tags were found...

Create successful ePaper yourself
Turn your PDF publications into a flip-book with our unique Google optimized e-Paper software.
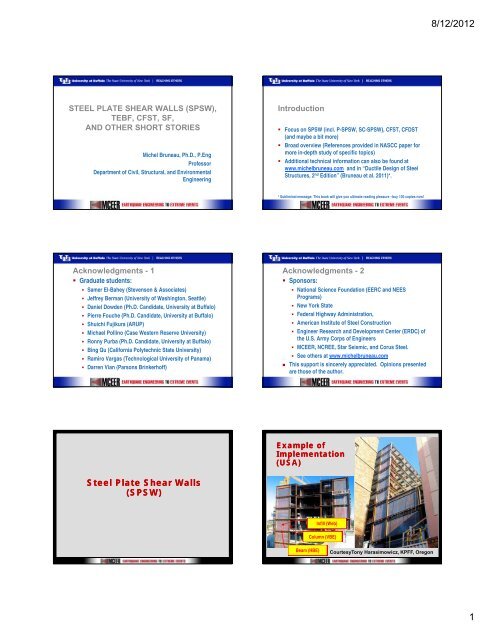
8/12/2012STEEL PLATE SHEAR WALLS (SPSW),TEBF, CFST, SF,AND OTHER SHORT STORIESMichel Bruneau, Ph.D., P.EngProfessorDepartment of Civil, Structural, and EnvironmentalEngineeringIntroduction• Focus on SPSW (incl. P-SPSW, SC-SPSW), CFST, CFDST(and maybe a bit more)• Broad overview (References provided in NASCC paper formore in-depth study of specific topics)• Additional technical information can also be found atwww.michelbruneau.com and in “Ductile <strong>Design</strong> of <strong>Steel</strong>Structures, 2 nd Edition” (Bruneau et al. 2011)*.* Subliminal message: This book will give you ultimate reading pleasure –buy 100 copies now!Acknowledgments - 1• Graduate students:• Samer El-Bahey (Stevenson & Associates)• Jeffrey Berman (University of Washington, Seattle)• Daniel Dowden (Ph.D. Candidate, University at Buffalo)• Pierre Fouche (Ph.D. Candidate, University at Buffalo)• Shuichi Fujikura (ARUP)• Michael Pollino (Case Western Reserve University)• Ronny Purba (Ph.D. Candidate, University at Buffalo)• Bing Qu (California Polytechnic State University)• Ramiro Vargas (Technological University of Panama)• Darren Vian (Parsons Brinkerhoff)Acknowledgments - 2• Sponsors:• National Science Foundation (EERC and NEESPrograms)• New York State• Federal Highway Administration,• American Institute of <strong>Steel</strong> Construction• Engineer Research and Development Center (ERDC) ofthe U.S. Army Corps of Engineers• MCEER, NCREE, Star Seismic, and Corus <strong>Steel</strong>.• See others at www.michelbruneau.com• This support is sincerely appreciated. Opinions presentedare those of the author.Example ofImplementation(USA)<strong>Steel</strong> <strong>Plate</strong> <strong>Shear</strong> <strong>Wall</strong>s(SPSW)Infill (Web)Column (VBE)Beam (HBE)CourtesyTony Harasimowicz, KPFF, Oregon1
8/12/2012Examples of Implementation(USA)Examples of Implementation(USA)• LA Live• 56 storiesCourtesy Lee Decker – Herrick Corporation, Stockton, CACourtesy of GFDS Engineers, San Francisco, and Matthew Eatherton, Virginia TechAnalogy to Tension-onlyonlyBraced Frame• Flat bar brace V• Very large braceslenderness (e.g. inexcess of 200)• Pinchedhysteretic curves• Increasing driftto dissipatefurther hystereticenergy• Not permitted byAISC SeismicProvisions• Permitted byCSA-S16 withinspecific limits ofapplicationAnalogy to Tension-onlyonlyBraced FrameAnalogy to Tension-onlyonlyBraced Frame• Steps to “transform”into a SPSW• 1) Replace braces byinfill plate (like addingbraces)VAnchor Beam• Steps to “transform”into a SPSW• 1) Replace braces byinfill plate (like addingbraces)• 2) For best seismicperformance, fullywelded beam-columnconnectionsV2
8/12/2012End-Result• Cyclic (Seismic)behavior of SPSW• Sum of• Fuller hysteresisprovided by momentconnections• Stiffness andredundancy providedby infill plateVBerman/Bruneau June 12 2002 TestL/t w = 3740h/L = 0.5(centerlinedimensions)Example of Structural Fuse600400Base <strong>Shear</strong> (kN)2000-200-400-600Specimen F2Boundary FrameBase <strong>Shear</strong> (kN)-3 -2 -1 0 1 2 3600 Drift (%)4002000-200-400-600-3 -2 -1 0 1 2 3Drift (%)Forces from Diagonal Tension FieldKnowing L, σ y , and α,Can calculate neededthickness (t)σ ·tω V = σ t cos 2 (α)ω H = σ t sin(α) cos(α) = ½ σ t sin(2α)F H = ω H L = ½ σ L t sin(2α)PANEL TENSION FIELDBrace and Strip ModelsαSTRESS ACROSS UNITUNIT PANEL WIDTHALONG DIAGONALα·cos αV =P·dsα P = σ ·t·ds· H =P·sin αDIAGONAL WIDTH, σRESULTANT TENSION FIELDFORCE, P AND COMPONENTStwiθ2 Aisin θisin 2 θi=2L sin 2 αiSPSW WEBPLATEω V =V /dxω H =H /dxHORIZONTAL, ω H, ANDVERTICAL, ω V,DISTRIBUTED LOADINGhshsdxUNIT LENGTHALONG BEAMSPSWHBELEquivalent Brace Model (Optional)LStrip Model3
8/12/2012Strip Model• Developed by Thorburn, Kulak, andMontgomery (1983), refined by Timler andKulak (1983))• Verified experimentally by• Elgaaly et al. (1993)• Driver et al. (1997)• Many othersStrips models in retrofit projectusing steel plate shear wallsCourtesy of Jay Love, Degenkolb EngineersAISC Guide <strong>Design</strong> of SPSW(Sabelli and Bruneau 2006)• Review of implementations to date• Review of research results• <strong>Design</strong> requirements and process• <strong>Design</strong> examples• Region of moderate seismicity• Region of high seismicity• Other design considerations (openings, etc.)Recent Observations on SPSW(Bruneauet al. 2011)• Capacity design from PlasticAnalysis• Demands on VBEs Flexibility Factor’s purpose• Demands on HBEs HBE in-span yielding RBS connections in HBEs• P-SPSW (reduced demands)• Repair and drift demandsPlastic Analysis Approach• Yielding strips• Plastic Hinges• For designstrength,neglectplastic hingescontributionV14 ⋅ M= ⋅ Fy⋅t⋅ L ⋅sin 2α+2hpUsed to developFree Body Diagramsof VBEs and HBEs4
8/12/2012Capacity <strong>Design</strong> of VBECapacity <strong>Design</strong> of VBEImportance ofCapacity <strong>Design</strong>Flexibility Limit Issue• Lubell et al. (2000)observed poorbehavior of someSPSWs (pull-in ofcolumns)• Others suggestedflexibility limitdesirable to preventslender VBEsSPSW-4 UBC Test (Lubell et al. 2000)SPSW-2 UBC Test (Lubell et al. 2000)Flexibility Limit (cont’d)• <strong>Plate</strong> girder analogyInfill PanelInfill Panel<strong>Steel</strong> <strong>Plate</strong> <strong>Shear</strong> <strong>Wall</strong>where ω = 0.7htsi4twi2I LStiffnerL• Flexibility factorxuoαuηuI-Beam <strong>Plate</strong> GirderFlange can be modeled as a continuousbeam on elastic foundation<strong>Plate</strong> Girder⎛ ⎛ωt ⎞ ⎛ωt ⎞ ⎛ωt ⎞ ⎛ωt⎞⎞sin cosh cos sinhεgL⎜ ⎜2⎟ ⎜2⎟+⎜2⎟ ⎜2⎟⎟( ηu− ηo) = ⎜1−⎝ ⎠ ⎝ ⎠ ⎝ ⎠ ⎝ ⎠⎟max 2sin α ⎜ ⎛ωt ⎞ ⎛ωt ⎞ ⎛ωt ⎞ ⎛ωt⎞sin cos + sinh cosh⎟⎜ ⎜2⎟ ⎜2⎟ ⎜2⎟ ⎜2⎟⎟⎝ ⎝ ⎠ ⎝ ⎠ ⎝ ⎠ ⎝ ⎠⎠cFlangeηoohsδVxessIncrease in streFlexibility Limit (cont’d)1.00.90.807 0.70.60.50.40.30.20.10.0UBC SPSW-2 and SPSW-4: ωt= 3.35Other specimensthat behaved well:ωt≤ 2.520%0 0.5 1 1.5 2 2.5 3 3.5 4ω tEmpirically basedflexibility limit:ω =tSolvingtwi0.7hsi4 ≤2.52ILc40.00307t wihIsic≥LIntroduced in theCAN/CSA S16-01 and2005 AISC SeismicProvisions5
8/12/2012Flexibility Limit (cont’d)• SPSWs tested by Tsai and Lee (2007) exceeded flexibilitylimit, yet performed comparably to SPSWs meeting limitSPSW N (ω t =2.53>2.5)SPSW S (ω t =3.01>2.5)Column <strong>Design</strong> Issues (cont’d)• Prevention of In-Plane <strong>Shear</strong> Yielding• Evaluation of previous specimensCaseResearcherSpecimen Number ofωidentification storiestV V n sap2000(kN) (kN)Vu − design(kN)<strong>Shear</strong> Yielding(i) single-story specimen1 Driver Lubell et al, et 1997, al (2000) ω SPSW2 1 3.35t =1.73 Park et al, 2007 75 108 113 Yes2 Berman and Bruneau (2005) F2 1 1.01 ω t =1.58 932 259 261 No(ii) multi-story specimen -ab3 Driver et al (1998) - 4 173 1.73 766 1361 1458 YesPark et al, 2007, ω4 Park et al (2007) SC2T 3 1.24 999 676 1011 t =1.62No5 SC4T 3 1.44 999 984 1273 No6 SC6T 3 1.58 999 1218 1469 Yes7 WC4T 3 1.62 560 920 1210 Yes8 WC6T 3 1.77 560 1151 1461 Yes9 Qu and Bruneau (2007) - b 2 1.95 2881 1591 2341 No10 Tsai and Lee (2007) SPSW N 2 2.53 968 776 955 No11 SPSW S 2 3.01 752 675 705 NoaFor multi-story specimens, VBEs at the first story are evaluated.bNot applicable.Lubell et al, 2000, ω t =3.35Excessive flexibility example• Theoretically, with infinitely elastic beam/columns, couldpurposely assign high L/h ratio and low stiffness to theboundary elements (Bruneau and Bhagwadar 2002)• Truss members 1 to 8 in compression as a result of beam andcolumn deflections induced by the other strips in tension –entire tension field is taken by the last four truss members.• Behavior even worse if bottom beam free to bend.• This extreme (not practical) example nonetheless illustrateshow non-uniformyielding can occurolαTension FieldsxBase <strong>Shear</strong> (N)Base <strong>Shear</strong> (N)1.2E+0061.0E+0068.0E+0056.0E+0054.0E+005Specimen: Two-story SPSW (SPSW S)2.0E+005 Flexibility factor: ω t =3.01Researchers: Tsai and Lee (2007)0.0E+0003.5E+0063.0E+0062.5E+0062.0E+0061.5E+0061.0E+006 Specimen: Four-story SPSWFlexibility factor: ω5.0E+005t =1.73Researcher: Driver (1997)0.0E+0000.0 0.5 1.0 1.5 2.0 2.5 3.0 3.5 4.0 4.5 5.0 5.51F Drift (%)σ / fyσ / fyσ / fyσ / fyσ / fy1.21F Drift = 0.1%1.00.80.60.40.20.01.21F Drift = 0.2%1.00.80.60.40.20.01.21F Drift = 0.3%1.00.80.60.40.20.01.21F Drift = 0.6%1.00.80.60.40.20.01.21F Drift = 2.0%1.00.80.6Lee and Tsai (2008)0.4Driver (1997)0.20.00.0 0.1 0.2 0.3 0.4 0.5 0.6 0.7 0.8 0.9 1.0x/lαHBEFBDωxbi+1• Compressionstrut betweencolumns• Resultant forcesfrom yieldingof stripsωxbioV v(x)oV h(x)SPSW+ωybi+1fish plate web of intermediate beam flange of intermediate beam(B)ωybiLV + VV - Vωybi-ωybi+1(ωybi+ωybi+1)(d+2hf)/2--dHBE Moment Diagram: M(x) / (ωL 2 /8)Normalized Moment:2.01.51.00.50.0-0.5-1.0-1.5κ=0.0κ=0.5κ=1.0κ=1.5κ=2.0MaximumOptional Alternative:RBS at HBE endsIn-Span HBEHinging-2.00 0.1 0.2 0.3 0.4 0.5 0.6 0.7 0.8 0.9 1Fraction of span from left support<strong>Design</strong> forwL 2 /46
s n ss n s8/12/2012Case Study: <strong>Design</strong> Outputs10 ft10 ft10 ftW16x40W24x62 W18x x50(0.96)(0.91 1)(0.99)W16x36(0.88)tplate = 0.036 inS = 19.69 inAstrip = 0.72 in 2W12x22(0.98)tplate = 0.059 inS = 19.69 inAstrip = 1.17 in 2W12x19(0.92)tplate = 0.072 inS = 19.69 inAstrip = 1.42 in 2W24x62(0.91)20 ftSPSW-IDW24x62 W18x x50 W16x40(0.99) (0.91 1) (0.96)W16x89W24x146 W18x x76(0.98)(0.99 9)(0.96)W18x76(0.99)tplate = 0.036 inS = 19.69 inAstrip = 0.72 in 2W14x61(0.99)tplate = 0.059 inS = 19.69 inAstrip = 1.17 in 2W12x45(0.95)tplate = 0.072 inS = 19.69 inAstrip = 1.42 in 2W24x117(0.98)20 ftSPSW-CDW24x146 W18x x76 W16x89(0.96) (0.99 9) (0.98)<strong>Design</strong> HBEs for wL 2 /4Monotonic PushoverVi+2Vi+1ViθΔi+2Δi+1ΔiL1L2L 1 θ / L 2 +θPlastic HingeLpαωbbL2L1ωcL 1 θ / L 2 +θHiHi+1Hi+2Strips remainedelasticSway and Beam Combined Mechanismn∑ViHi=1n1+ ∑ 2+i=1Fyp⎛ L p ⎜i = 2⎝ L p − L1tw1FypLp( t wi⎞⎟∑ M⎠ i=0pbiPlastic Hinge on the HBEsL21∑ 2−twi+ 1 )sin (2α) H i − FyptwiL1sin (2α)i=1Horizontal component of the strip yield forcesn s2 L1cos α + ∑ F2i=1yp( twiL2−twi+1Lp)2cosVertical component of the strip yield forcesCase Study: Strength per thisplastic mechanism is 13% lessthan per sway mechanismαL12H iCyclic Pushover Analysis• Monotonic: in-span plastic hinge + significant HBE vertical deformation• Cyclic: to investigate whether phenomenon observed in monotonicanalysis may lead to progressively increasing deformations• Loading history: 14.44%(in)Top Floor Displacement, Δ10.87.23.60-3.6-7.2-10.83%2%1%0%-1%-2%-3%Lateral Drift (%)Cyclic Pushover Analysiscement (in) .Vertical Displac0.0-0.5-1.0-1.5 15-2.0-2.5-3.0Lateral Drift-4% -3% -2% -1% 0% 1% 2% 3% 4%SPSW-CDSPSW-ID-14.4 -10.8 -7.2 -3.6 0 3.6 7.2 10.8 14.4Lateral Displacement (in) Significantaccumulation of plasticincremental deformationon SPSW-IDTime history analysesshow same behavior, withvertical displacementsincreasing with severity ofground excitation level-14.41 2 3 4 5 6Number of Cycles, N-4%HBE3 Vertical DisplacementsCyclic Pushover Analysis• Comparing rotation demands atbeam to column connection• Curves bias toward one direction• Maximum Rotations:SPSW-ID = 0.062 radiansSPSW-CD = 0.032 radians• AISC 2005 Seismic Specifications:Ordinary-type connections beused in SPSWdeserve more attentionin future researchM/M pM/M p1.00.50.0-0.5-1.01.00.50.0-0.5SPSW-IDSPSW-CDHBE2-1.0HBE2-2.5 -2.0 -1.5 -1.0 -0.5 0.0 0.5 1.0θ/θ 0.03Normalized Moment Rotation (θ/0.03)Plastic Analysis Approach• Yielding strips• Plastic Hinges• For designstrength,neglectplastic hingescontribution14 ⋅ MV = ⋅ Fy⋅t⋅ L ⋅sin 2α+2hp7
8/12/2012Plastic Analysis Approach• Interpretation #2:Lateral load Vu=• Interpretation #1:Lateral load V u =14 ⋅ MV = ⋅ Fy⋅t⋅ L ⋅sin 2α+2hpSingle Story SPSW Example<strong>Design</strong>Force assigned to infill panelLα1κ ⋅ Vdesign=2h( α )f t Lhsin 2yp wSingle Story SPSW ExampledesignVplastic/ Vd2.252.001.751.50125 1.251.000.750.500.25L/h=0.8L/h=1.00L/h=1.5L/h=2L/h=2.5α = 45β = 1.0Balance point−1⎡ 1 L β ⎤κbalance= ⎢1 + ⋅ ⎥h ⎢⎣+2−β⎥⎦2 1 1<strong>Design</strong> force to be assignedto boundary moment frameOverstrength fromcapacity designCase Studyht (lb)Weigh50000400003000020000100000AISC PROPOSED 75% 40%Panel HBE VBE Total0.000 0.1 0.2 0.3 0.4 0.5 0.6 0.7 0.8 0.9 1κQuantifyingPerformance• Time history analyses of SPSWsdesigned with various k valuerevealed different drift response• Need to rigorously quantifysignificance in terms of seismicperformance• FEMA P695 procedure is auseful tool for that purposeSeismic Performance FactorsParameter SW320 SW320K Reference1. <strong>Design</strong> StageR 7 7 ATC63 <strong>Design</strong> 3-Story SPSW Big Size 100%.xlsV design 176 176 ATC63 <strong>Design</strong> 3-Story SPSW Big Size 49%.xls2. Nonlinear Static (Pushover) AnalysisV max 495 226δ y,eff 1.80 1.8 Pushover Curve for SW320 and SW320K.xlsδ u 8.86 8.64Ω = V max/V design 2.81 1.29 Included SH = 2%, Ω d = 1.2 and φ = 0.9μ T = δ u/δ y,eff 4.92 4.803. Incremental Dynamic Analysis (IDA)S CT 3.60 2.29 IDA Curve for SW320 Sa PDGravity+Leaning.xlsS MT 1.50 1.50 IDA Curve for SW320K Sa PDGravity+Leaning.xlsCMR = S CT/S MT 2.40 1.538
8/12/2012Typical Archetype ModelDual Strip ModelP-Δ LeaningColumnOPENSEES Model:• Fiber Hinges on HBE andVBE ends• Axial Hinges on Strips• Gravity loads applied onSPSW according to itstributary area.• Remaining loads applied onLeaning columnsComponent Degradation ModelSymmetricMSH =M y 2%EI-θ y θ y-M y(a) BoundaryElements0.039 0.064M cap0.081θNoCompressionStrengthPP yδ ySH =2%EA(b) Strips9.0δ y 10.7δy0.015 0.018(AxialStrain)Failure mode developed based on 33 previously tested SPSW specimensDegradation model verified on 1 to 4 story SPSW specimensP capδIncremental Dynamic Analysis (IDA) Results - SaSW0320Seismic Performance FactorsSW0320KProbability ofCollapse10.80.60.4SW3200.2Lognormal SW320SW320KLognormal SW320K00 5 10Spectral Acceleration, ST (Tn = 0.36 Sec.), gParameter SW320 SW320K Reference1. <strong>Design</strong> StageR 7 7 ATC63 <strong>Design</strong> 3-Story SPSW Big Size 100%.xlsV design 176 176 ATC63 <strong>Design</strong> 3-Story SPSW Big Size 49%.xls2. Nonlinear Static (Pushover) AnalysisV max 495 226δ y,eff 1.80 1.8 Pushover Curve for SW320 and SW320K.xlsδ u 8.86 8.64Ω = V max/V design 2.81 1.29 Included SH = 2%, Ω d = 1.2 and φ = 0.9μ T = δ u/δ y,eff 4.92 4.803. Incremental Dynamic Analysis (IDA)S CT 3.60 2.29 IDA Curve for SW320 Sa PDGravity+Leaning.xlsS MT 1.50 1.50 IDA Curve for SW320K Sa PDGravity+Leaning.xlsCMR = S CT/S MT 2.40 1.53Seismic Performance Factors, Cont.Parameter SW320 SW320K Reference4. Performance EvaluationT 0.36 0.36 FEMA P695 (ATC63) Eq. 5-5SDC D max D max FEMA P695 (ATC63) Table 5-1SSF (T, μ T) 1.25 1.25 FEMA P695 (ATC63) Table 7-1bACMR = SSF (T, μ T) x CMR 3.00 1.91β RTR 0.4 0.4 FEMA P695 (ATC63) Section 7.3.1β DR 0.2 0.2 FEMA P695 (ATC63) Table 3-1: (B - Good)β TD 0.35 0.35 FEMA P695 (ATC63) Table 3-2: (C - Fair)β MDL 0.2 0.2 FEMA P695 (ATC63) Table 5-3: (B - Good)β tot = sqrt (β 2 RTR + β 2 DR + β 2 TD + β 2 MDL ) 0.60 0.60ACMR 20% (β tot) 1.66 1.66 FEMA P695 (ATC63) Table 7-3ACMR 10% (β tot) 2.16 2.16 FEMA P695 (ATC63) Table 7-3Status i Pass Pass FEMA P695 (ATC63) Eq. 7-6Status PG Pass NOT Pass FEMA P695 (ATC63) Eq. 7-75. Final ResultsR 7 Try AgainΩ 2.8 Try Againμ T 4.9 Try AgainC d = R 7 Try AgainFragility Curve: DM (Inter-story Drift) for SW320Probability ofExceedance10.80.60.40.20<strong>Design</strong> LevelSa = 1.5gDM: 1% DriftDM: 2% DriftDM: 3% DriftDM: 4% DriftDM: 5% DriftDM: 6% DriftDM: 7% DriftDM: Collapse Point0 2 4 6 8 10Spectral Acceleration, ST (Tn = 0.36 Sec.), g9
8/12/2012Fragility Curve: DM (Inter-story Drift) for SW320K1Probability ofExceedance0.80.60.4DM: Drift 1%DM: Drift 2%DM: Drift 3%DM: Drift 4%DM: Drift 5%Perforated <strong>Steel</strong> <strong>Plate</strong> <strong>Shear</strong><strong>Wall</strong>s (P-SPSW)(to reduce tonnage of steelin low-rise SPSWs)0.2DM: Drift 6%DM: Drift 7%DM: Collapse Point0<strong>Design</strong> LevelSa = 1.5g0 2 4 6 8 10Spectral Acceleration, ST (Tn = 0.36 Sec.), gInfill OverstrengthPerforated <strong>Wall</strong> Concept• Available infill plate material might bethicker or stronger than required by design.• Several solution to alleviate this concern• Light-gauge cold-rolled steel• Low Yield <strong>Steel</strong> (LYS) steel• Perforated <strong>Steel</strong> <strong>Plate</strong> <strong>Shear</strong> <strong>Wall</strong>4321A B C D E FSpecimen P at 3.0% DriftPerforated Layout, Cont.S diagθ“Typical”diagonal strip10
8/12/2012Typical Perforated Strip (Vian2005)S diag = 400 mmTypical Strip Analysis Results (ST1)At monitored strain e max = 20%, D = 100 mm (D/S diag = 0.25)DABAQUS S4 “Quadrant” Model2δ(a) Strip Mesh and Deformed Shape (Deformation Scale Factor = 4)L = 2000 mm½ Lt = 5 mmδ(b) Maximum In-Plane Principal Stress Contours½ S diag S diagD = variablenot actual mesh(c) Maximum In-Plane Principal Strain ContoursFLTB Model: Typical Panel ResultsAt monitored strain ε max = 20%, D = 200 mm (D/S diag = 0.471)FLTB ModelTotal Uniform Str rip Elongation, ε un (%)5.04.54.03.53.02.52.01.51.00.5Strip emax = 20% Panel emax = 20%Strip emax = 15% Panel emax = 15%Strip emax = 10% Panel emax = 10%Strip emax = 5% Panel emax = 5%Strip emax = 1% Panel emax = 1%0.00.0 0.1 0.2 0.3 0.4 0.5 0.6 0.7Maximum In-Plane Principal Strain ContoursPerforation Ratio, D/Sdiag<strong>Shear</strong> Strength vs. Frame Drifttrength, Vy (kN)Total <strong>Shear</strong> St300025002000150010005000emax = 20%emax = 15%emax = 10%emax = 5%emax = 1%SolidD050 (D/Sdiag = 0.12)D100 (D/Sdiag = 0.24)D150 (D/Sdiag = 0.35)D200 (D/Sdiag = 0.47)D250 (D/Sdiag = 0.59)D300 (D/Sdiag = 0.71)Bare0.0 1.0 2.0 3.0 4.0 5.0Frame Drift, γInfill <strong>Shear</strong> Strength: RFModelVyp.perf / Vyp1.00.90.80.70.60.50.40.30.20.10.0Predicted (Eq. 4.3)γ = 5%γ = 4%γ = 3%γ = 2%γ = 1%Linear Reg.0.0 0.1 0.2 0.3 0.4 0.5 0.6 0.7 0.8 0.9 1.0D/SdiagV51.5%⎡ = 1−yp. perf ⎢ α⎣ S diagD ⎤⎥⋅V⎦correction factor: α = 0.7yp11
8/12/2012Implementation of P-SPSWReplaceability of Web <strong>Plate</strong>in SPSWCourtesy of Robert Tremblay, Ecole Polytechnique, et Eric Lachapelle, Lainco Inc, MontrealExperimental Program• Phase I: Pseudo-dynamic load to anearthquake having a 2% in 50 yearsprobability of occurrence.(Chi_Chi_CTU082EW--2╱50 CTU082EW--2╱50 PGA=0.67g)• Cut-out and replace webs at both levels• Phase II: Repeat of pseudo-dynamic load toan earthquake having a 2% in 50 yearsprobability of occurrence.• Subsequently cyclic load to failure.Web replacement• Buckled web platefrom first pseudo-dynamic test cut outand new web platewelded in placePseudo-dynamic dynamic Test (cont’d)Pseudo-dynamic dynamic Test (cont’d)1st story2nd storySpecimen after the maximum peak drifts of 2.6% at lowerstory and 2.3% at upper story in pseudo-dynamic test.12
8/12/2012Subsequently Cyclic TestSubsequently Cyclic Test (cont’d)• Severe plate damage and intermediate beam damage alsooccurred at drifts between 2.5% and 5%2 nd story after interstory drift of 5%1 st Story after interstory drift of 5%Self-Centering SPSWSelf-Centering(Resilient) SPSWs(SC-SPSWs) SPSWs)Concept:Replace rigid HBE to VBE joint connectionsof a conventional SPSW with a rockingconnection combined with Post-Tensionelements.• Energy dissipation provided by yieldingof infill plate only (not shown in figure)• HBE, VBE and P.T. componentsdesigned to remain essentially elastic• Elastic elongation of P.T. about a rockingpoint provides a self-centeringmechanismUB Test-Setup (Full Infill <strong>Plate</strong> Frames)UB Specimen (Rocking about Flanges)13
8/12/2012(kips)Base <strong>Shear</strong>UB Test Results – NewZ-BREAKSS6040200Top Story Drift (%)-6 -4.5 -3 -1.5 0 1.5 3 4.5 6SAP2000: 10% Comp.-20PT Yielding Occured At-40Approx. 4.5% Top StoryDrift-60-10.5 -7.5 -4.5 -1.5 1.5 4.5 7.5 10.5Top Story Displacement (in)•No separation of theinfill strips occurred(also observed withthe flange rockingcase).•Testing stopped tobe able to reusedVBEs for subsequentshake table testing.Eccentrically Braced FrameTubular-link link EccentricallyBraced Frames (TEBF)a.k.a.EBF with Built-up up Box LinksTubular-link link EBFProof-of-Concept Testing• EBFs with wide-flange (WF) links requirelateral bracing of the link to prevent lateraltorsional buckling• Lateral bracing is difficult to provide inbridge piersb• Development of a laterallyt w Fstable EBF link is warrantedyf• Consider rectangular cross-F ywt fsection – No LTBd16
8/12/2012Finite Element Modeling ofProof-of-Concept TestingLink Testing – ResultsLarge Deformation Cycles of Specimen X1L1.6Hysteretic Results for Refined ABAQUS Model and Proof-of-ConceptExperiment1.67<strong>Design</strong> SpaceStiffened LinksUnstiffened Links0.64dt wEF ywEF ywbt f0.64EF yfρ = 1.6Some slenderness limitsaccidentally missingfrom AISC 341-10ρImplementationof TEBF• Towers of temporarystructure to supportand provide seismicresistance to deck ofself-anchoredsuspension segment ofEast Span of San-Francisco-Oakland BayBridge during itsconstructionEarthquakesMulti-Hazard <strong>Design</strong> ConceptWhy Multi-Hazard Engineering Makes Sense?17
8/12/2012CFST Piles• “The Loma Prieta andNorthridge earthquakes inCalifornia and the Kobe,Japan quake, along with reexaminationof large-diameter cylinder-pilebehavior in the Alaskanearthquake of 1964, havedemonstrated the superiorductility of concrete-filledsteel tubular piles.”(Ben C. Gerwick Jr., ASCE CivilEngineering Magazine, May 1995)• Bridge carrying Broadway Ave. over the railroad in City of Rensselaer, NY• Built 1975. No major rehab, although joints and wearing surface were redoneCFST Column Specimen (1 st Series)164”CFST Column Test ResultsTest 5: Bent 1, C5 (1.3X, W, Z=0.75m)CAP-BEAM16.5”C6 C5 C468.5” 69.5”6” 5” 4”59”FOUNDATIONBEAM164”32”D max= 76 mmGap= 3 mmConcrete (no rebars)Concrete-Filled <strong>Steel</strong>TubeDamage Progress of CFST Column(Column Deformations)1.2 deg(0.021 rad) 2.2 deg(0.038 rad)5.0 deg(0.088 rad)3.8 deg(0.067 rad)PlasticDeformation(Test 6 : B2-C4)10.5 deg(0.182 rad)Explosion8.3 deg(0.144 rad)CoveredConcretePlasticDeformation(Test 9 : B2-C6)4.9 deg(0.085 rad)21.9 deg(0.382 rad)17.0 deg(0.297 rad)Buckling of<strong>Steel</strong> TubeFracture of<strong>Steel</strong> TubeOn-set ofColumn Fracture(Test 10 : B2-C5)18.7 deg(0.327 rad)BlewAwayFracture ofColumnPost-fractureof Column(Test7 : B2-C4)Seismically<strong>Design</strong>edDuctile Column• <strong>Shear</strong> Failure• Seismic <strong>Design</strong>Alone is not aGuarantee of Multi-Hazard Performance• Need OptimalSeismic/Blast<strong>Design</strong>19
8/12/2012Jacketed Non-Ductile Column(Seismic Retrofit)• Again <strong>Shear</strong> Failure• Same conclusionsComparison of Blast ParametersReactionFrame750250Test 5Test 4CFST Tests RC, SJ TestsWW0.55W0.10WTest 3 Test 2Test 9,10 Test 6Test 1Test 7Test 1,3 Test 2,40.80.6 1.11.31.62 32.16 3.25StandoffDistance(in X)Comparison of Column DamageHorizontalDeformation(mm)Calibration Work1.2 deg(0.021 rad)18385980130.7 deg5(0.012 rad)7161017161015Fracture ofColumn102819191231121231441224271651228311881332352161437392421540442631645492851650523091552563.8 deg(0.067 rad)24(Max)32834736737916151413576267All longitudinal71bars fractured.756165717479Explosion250BlewAwayTest 6 CFST C4(x = 1.6 X)All longitudinalbars fractured.Test 1 RC1(x = 2.16 X)Test 2 RC2(x = 3.25 X)2.9 deg(0.051 rad)Test 3 SJ2(x = 2.16 X)Test 4 SJ1(x = 3.25 X)Blast Simulation Resultse)Post-fractureof Column(Test7 : B2-C4)Proposed Multi Hazard Concept• Analysis of concrete filled double skin tubes (CFDST)showed they can offer similar performance as CFST• CFDST concentrates materials where needed for higherstrength-to-weight ratio20
8/12/2012Blast Test ResultsS1 @ 3% Drift S1 @ 7.5% Drift S1 @ 10% DriftS5 @ 3% Drift S5 @ 6% Drift S5 @ 7.5% DriftEnhanced <strong>Steel</strong> Jacketed Column21
8/12/2012ERDC Test on ESJC• ResultsStructural Fuses (SF)Analogy• Sacrificial element to protect the rest of thesystem.mass, mstructural fuse, dbraces, bframe, fGround Motion, ü g (t)Benefits of Structural Fuse Concept:Model withNippon <strong>Steel</strong> BRBs• Seismically induced damage isVconcentrated on the fusesV p• Following a damagingearthquake only the fusesV yVwould need to be replaced ydV yf• Once the structural fuses areremoved, the elastic structurereturns to its original position(self-recentering capability)TotalαK 1 = K fK 1Structural FusesK aFrameK fΔ ya Δ yf uEccentric Gusset-<strong>Plate</strong>22
8/12/2012Test 1(PGA = 1g)al Force (kips)1st Story AxiaTest 1First Story BRB403020100-0.5 -0.4 -0.3 -0.2 -0.1 0-100.1 0.2 0.3 0.4 0.5-20-30-40Axial Deformation (in)ns <strong>Shear</strong> (kN)1st Story ColumnTest 1 (Nippon <strong>Steel</strong> BRB Frame)First Story Columns <strong>Shear</strong>1007550250-5 -4 -3 -2 -1 0 1 2 3 4 5-25-50-75-100Inter-Story Drift (mm)ABC Bridge Pier withStructural FusesSpecimen S2-1New “Short Length” BRBDeveloped by Star Seismic23
8/12/2012Specimen with BRB FusesSpecimen with BRB FusesControlled Rocking/EnergyDissipation SystemRocking Frames (RF)• Absence of base of legconnection creates a rockingbridge pier system partiallyisolating the structure• Installation of steel yieldingdevices (buckling-restrainedbraces) at the steel/concreteinterface controls the rockingresponse while providingenergy dissipationRetrofitted TowerExisting Rocking BridgesSouth Rangitikei Rail BridgeLions Gate Bridge North ApproachStatic, Hysteretic Behavior of ControlledRocking PierF PED =0F PED =w/2Device Response24
8/12/2012<strong>Design</strong> Procedure<strong>Design</strong> Chart:• <strong>Design</strong> Constraints10h/d=4• Acceleration⇒Limit forces throughvulnerable membersusing structural “fuses”• Velocity⇒Control impact energy tofoundation and impulsiveloading on tower legsby limiting velocityAub (in2)ubA u864• Displacement Ductility⇒Limit μ L ofspecially detailed,ductile “fuses”• β