ghana climate change vulnerability and adaptation assessment
ghana climate change vulnerability and adaptation assessment
ghana climate change vulnerability and adaptation assessment
- No tags were found...

Create successful ePaper yourself
Turn your PDF publications into a flip-book with our unique Google optimized e-Paper software.
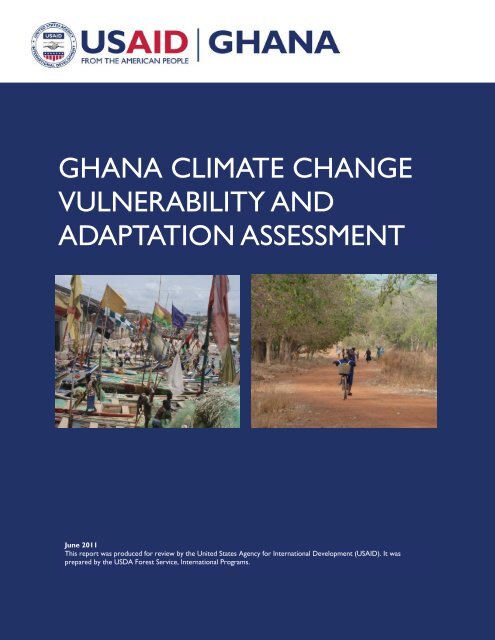
GHANA CLIMATE CHANGEVULNERABILITY ANDADAPTATION ASSESSMENTJune 2011This report was produced for review by the United States Agency for International Development (USAID). It wasprepared by the USDA Forest Service, International Programs.
COVER PHOTOS: Courtesy of USFS, IP
GHANACLIMATE CHANGEVULNERABILITY ANDADAPTATION ASSESSMENTPrepared by John A. Stanturf, Melvin L. Warren, Jr., Susan Charnley, Sophia C. Polasky, Scott L.Goodrick, Frederick Armah, <strong>and</strong> Yaw Atuahene NyakoJUNE 2011DISCLAIMERThe author’s views expressed in this publication do not necessarily reflect the views of the United States Agency forInternational Development or the United States Government
TABLE OF CONTENTSACKNOWLEDGEMENTS ··········································································· IXEXECUTIVE SUMMARY ··············································································· 1Climate Overview .............................................................................................................................................. 1Climate Variability <strong>and</strong> Change ....................................................................................................................... 2Uncertainty of Climate Projections ................................................................................................................ 3Climate Policy Framework ............................................................................................................................... 3Agriculture <strong>and</strong> Livelihoods ............................................................................................................................. 5Ecological Vulnerability ...................................................................................................................................... 7Social Vulnerability ............................................................................................................................................. 8Adaptation ............................................................................................................................................................ 9Energy Sector..................................................................................................................................................... 10Northern Savanna Case Study ....................................................................................................................... 11Mainstreaming Climate Change ..................................................................................................................... 12New Interventions for USAID Programming ............................................................................................. 151. INTRODUCTION ·············································································· 172. APPROACH ······················································································ 183. GHANA’S CLIMATE AND PROJECTED CHANGES ······························ 20General Climate ................................................................................................................................................ 20Climate Trends <strong>and</strong> Modeled Climate Change: Sources ........................................................................ 24Recent Climate Trends ................................................................................................................................... 26Climate Scenarios ............................................................................................................................................. 274. CLIMATE CHANGE POLICY FRAMEWORK ········································ 36Climate Change Activities in Ghana ............................................................................................................. 36REDD+ Policy Framework ............................................................................................................................. 37L<strong>and</strong> Tenure in Ghana ..................................................................................................................................... 455. PHYSIOGRAPHY, ECOLOGICAL ZONES, AND LIVELIHOODS ············ 52Physiographic Zones ........................................................................................................................................ 52Ecological Zones ............................................................................................................................................... 53Agriculture .......................................................................................................................................................... 58Population <strong>and</strong> Economy ................................................................................................................................ 83Crop production ............................................................................................................................................... 85Livestock rearing ............................................................................................................................................... 85Fisheries .............................................................................................................................................................. 86Urban Verses Rural Livelihoods .................................................................................................................... 87Rural Livelihoods on the Coast ..................................................................................................................... 88Rural Livelihoods in the Forest ..................................................................................................................... 88Rural Livelihoods in the Savanna ................................................................................................................... 896. VULNERABILITY TO CLIMATE CHANGE ··········································· 91Natural Systems Vulnerability ........................................................................................................................ 917. SOCIAL VULNERABILITY TO CLIMATE CHANGE IN GHANA ··········· 118Defining <strong>and</strong> Assessing Social Vulnerability to Climate Change .......................................................... 118
ACRONYMSCAADPCBOCCCDCSCEACEPFCFMCICIDACITESCPUECRCCREMACRMUCSIRCSOCSPDADSDSARIEPAETOAEUFAOFAAFASDEPFCFDMPComprehensive African Agricultural Development Programmecommunity-based organizationsClimate ChangeCountry Development Cooperation StrategyCountry Environmental AnalysisCritical Ecosystem Partnership FundCollaborative Forest ManagementConservation InternationalCanadian International Development AgencyConvention on International Trade of Endangered SpeciesCatch Per Unit of EffortCoastal Resources CenterCommunity Resource Management AreaCollaborative Resource Management UnitCouncil for Scientific <strong>and</strong> Industrial ResearchCivil Society OrganizationCountry Strategic PlanDistrict Assemblydry semi-deciduousSavanna Agricultural Research InstituteEnvironmental Protection AgencyEnvironmental Threats <strong>and</strong> Opportunities AssessmentEuropean UnionFood <strong>and</strong> Agriculture Organization, UNForeign Assistance ActFood <strong>and</strong> Ag. Sector Development PolicyForestry CommissionForestry Development Master PlanGHANA CLIMATE CHANGE VULNERABILITY AND ADAPTATION ASSESSMENTv
FRFSDFtFFYGCMsGDPGEFGFTNGoGGPRSGSBAHDIGWSIBAIEEIPCCIPMITCZIUCNJICALMEMEMETASIPMESTMEOMLNRMOFAMSDNAPNEPADNDPCForest ReservesForestry Services DivisionFeed the Future (USAID multi-year strategy)fiscal yearGlobal Circulation ModelsGross Domestic ProductGlobal Environment FacilityGlobal Forest Trade NetworkGovernment of GhanaGhana Poverty Reduction StrategyGlobally Significant Biodiversity AreasHuman Development IndexGhana Wildlife SocietyImportant Bird AreasInitial Environmental ExaminationIntergovernmental Panel on Climate ChangeIntegrated Pest ManagementIntertropical Convergence ZoneInternational Union for the Conservation of NatureJapan international development agencyLarge Marine Ecosystemmoist evergreenMedium Term Ag. Sector Investment PlanMinistry of Env., Science <strong>and</strong> TechnologyMission Environmental OfficerMinistry of L<strong>and</strong>s <strong>and</strong> Natural ResourcesMinistry of Food <strong>and</strong> Agriculturemoist semi-deciduousNational Action ProgrammeNew Partnership for Africa's DevelopmentNational Development Planning CommissionviGHANA CLIMATE CHANGE VULNERABILITY AND ADAPTATION ASSESSMENT
NGONCRCNREGNRMNTFPPAPAMSCPPGRCRAMSARREDDREDD+SEASEIASMSNVSOSOWTESUEUNCCCUNCCDUNDPUSAIDVBAVPAWAPCAWDWEWRCWWFNon-Governmental OrganizationNature Conservation Research CentreNatural Resources <strong>and</strong> Environmental Governance programnatural resources managementnon-timber forest productsprotected areaProtected Areas Management <strong>and</strong> Wildlife Conservation ProjectPlant Genetic Resources CentreConvention on Wet L<strong>and</strong>s, Ramsar IranReduced Emissions from Deforestation <strong>and</strong> DegradationREDD including sustainable forest management, conservation, <strong>and</strong> enhancement offorest carbon stocksStrategic Environmental AssessmentSocial Environmental Impact Assessmentsouthern marginalNetherl<strong>and</strong>s development agencyStrategic ObjectiveScope of Workthreatened <strong>and</strong> endangered speciesupl<strong>and</strong> evergreenUnited Nations Convention on Climate ChangeUnited Nations Convention to Combat DesertificationUnited Nations Development ProgramU.S. Agency for International DevelopmentVolta Basin AuthorityVoluntary Partnership AgreementWest African Primate Conservation ActionWildlife Divisionwet evergreenWater Resources CommissionWorld Wildlife FundGHANA CLIMATE CHANGE VULNERABILITY AND ADAPTATION ASSESSMENTvii
ACKNOWLEDGEMENTSThe team would like to acknowledge the support of the many individuals who contributed to this <strong>assessment</strong>.We would like to thank the USAID liaisons, Nino Nadiradze (Senior Environmental Officer) <strong>and</strong> JusticeOdoi (Environmental Specialist) in Accra, Ghana for providing technical support to the team. Nino <strong>and</strong>Justice helped both in planning the report <strong>and</strong> in setting up interviews <strong>and</strong> contacts during the three-week incountryfact-finding phase of the project. More than 100 people, representing a variety of governmentalorganizations, non-governmental organizations, civil society, <strong>and</strong> industry were interviewed <strong>and</strong>/orcontributed papers to this report. The full list of those interviewed is contained in Appendix 1. We aregrateful to these individuals for their generous contributions of time.The Climate Change Assessment was conducted simultaneously with another effort, an EnvironmentalThreats <strong>and</strong> Opportunties Assessment (ETOA). The ETOA was conducted by Steven Brady <strong>and</strong> JosephKrueger <strong>and</strong> we appreciated the time spent with them, conducting interviews <strong>and</strong> discussing what we learned.We were also supported by many in our home units <strong>and</strong> would like to acknowledge their valuablecontributions. We thank Amy Carson-Commens, Anthony Rietl, <strong>and</strong> Elizabeth McQuire, all of the Centerfor Bottoml<strong>and</strong> Hardwoods Research, Southern Research Station, for assistance with literature <strong>and</strong> graphics.Administrative support <strong>and</strong> travel logistics were provided by Cathy Jenkins, CBHR-SRS, <strong>and</strong> Janet Revell,Center for Forest Disturbance Science, Southern Research Station. David Banis <strong>and</strong> Ross Calhoun ofPortl<strong>and</strong> State University made our maps. Francis Kwabena Dwomoh, Forest Reseaerch Institute of Ghana<strong>and</strong> Visiting Scientist at the Center for Forest Disturbance Science, provided GIS support as well as cultural,political, <strong>and</strong> resource interpretations. We especially thank Zinede Minia, formerly of Ghana MeteorologicalAgency, who provided historical meteorological data.Finally, we want to single out Matthew Edwardsen <strong>and</strong> Stephanie Otis of the US Forest Service InternationalPrograms for selecting us for this opportunity <strong>and</strong> for their indispensible assistance; without them, this wouldnot have happened.All photos were taken by the team.GHANA CLIMATE CHANGE VULNERABILITY AND ADAPTATION ASSESSMENTIX
EXECUTIVE SUMMARYCountries in Africa are among the most vulnerable globally to the effects of <strong>climate</strong> <strong>change</strong> because of thedependence of much of the population on agriculture, particularly rain-fed agriculture, <strong>and</strong> widespreadpoverty that renders them unable to withst<strong>and</strong> <strong>climate</strong> stress. Additional constraints (disease burden, debtburden, political instability, <strong>and</strong> conflict) reduce the adaptive capacity <strong>and</strong> increase the <strong>vulnerability</strong> of ruralpopulations. Recurrent drought in many countries has demonstrated the effects of <strong>climate</strong> variability on foodresources. Widespread poverty in many countries places many people facing food insecurity even in goodtimes. Additionally, <strong>climate</strong> variability <strong>and</strong> <strong>change</strong> threaten other resources including water, forests, <strong>and</strong>fisheries. Communities in coastal areas will be impacted by projected rise in sea-level of up to 1 m in thiscentury; some countries already experience coastal erosion <strong>and</strong> flooding.The West African country of Ghana is located on the Gulf of Guinea <strong>and</strong> extends northward from a lowlyingcoastal zone through the Volta River basin to the savanna zone on the border with Burkina Faso.Ghana is bordered on the west by Côte d’Ivoire <strong>and</strong> the east by Togo. Ghana’s economy relies on agriculture,which accounted for >25 percent of Gross Domestic Product (GDP) in 2008 <strong>and</strong> employed half of theeconomically active population. The main exports are cocoa, gold, timber, diamonds, bauxite, manganese, <strong>and</strong>hydropower. Ghana is designated a Low Income Country, making it one of only four West African countriesthat are not classified as Least Developed Countries. Among Ghana’s advantages are its political <strong>and</strong> socialstability as well as internal energy resources <strong>and</strong> natural resources in dem<strong>and</strong> in world markets.This Climate Change Assessment of Ghana was prepared by a team of US Forest Service scientists <strong>and</strong>Ghanaian counterparts, based in part on interviews with government officials, staff of non-governmentalorganizations (NGOs), <strong>and</strong> representatives of civil society organizations (CSOs) over a two-week period. Inaddition to interviews, the Team collected geospatial <strong>and</strong> demographic data from agencies <strong>and</strong> electronicpublic sources, as well as conducted an extensive literature review. The Assessment was focused at two levels,a national overview <strong>and</strong> a targeted <strong>assessment</strong> of the northern savanna zones, comprised of the threenorthern administrative regions in Ghana (Northern, Upper West, <strong>and</strong> Upper East). Additionally, the Teamexamined the coastal zone <strong>and</strong> the energy sector in light of recent development of oil <strong>and</strong> gas resourcesoffshore in the Gulf of Guinea.CLIMATE OVERVIEWThe <strong>climate</strong> of Ghana is dominated by the interaction of the Inter-Tropical Convergence Zone (ITCZ) <strong>and</strong>the West African Monsoon. The ITCZ, also known as the Equatorial Convergence Zone or Inter-TropicalFront, is a region of calm winds separating the northeasterly <strong>and</strong> southeasterly trade winds. The location ofthe ITCZ annually moves, reaching its northernmost extent during the northern hemisphere summer <strong>and</strong> itssouthernmost extent during the northern hemisphere winter. The principal feature of the <strong>climate</strong> of Ghana isthe alternate wet <strong>and</strong> dry seasons caused by the movements of the ITCZ <strong>and</strong> West African Monsoon. Insouthern Ghana there are two distinct wet seasons, but Northern Ghana has only one.Available temperature data indicates a warming <strong>climate</strong> in Ghana with the drier northern area warming morerapidly than southern Ghana. Since 1960 for Ghana as a whole, mean annual temperature rose by 1.0°C. Therate of increase generally was more rapid in the northern than southern regions. The frequency of “Hot” days<strong>and</strong> nights in Ghana increased from 1961 to 2003. A “Hot” day or night is defined by the temperatureexceeded on 10 percent of days or nights in the current <strong>climate</strong>. Annual rainfall in Ghana is highly variablemaking identification of long-term trends difficult. In the 1960s, rainfall in Ghana was particularly high <strong>and</strong>decreased to particularly low levels in the late 1970s <strong>and</strong> early 1980s. There was no evidence that extreme rainevents have either increased or decreased since 1960.GHANA CLIMATE CHANGE VULNERABILITY AND ADAPTATION ASSESSMENT 1
CLIMATE VARIABILITY AND CHANGEThe <strong>climate</strong> of West Africa is subject to considerable spatial <strong>and</strong> temporal variability. This variability is linkedto variations in the movement <strong>and</strong> intensity of the ITCZ as well as variations in the timing <strong>and</strong> intensity ofthe West African Monsoon. The most documented cause of these variations on an inter-annual timescale isthe El Niño Southern Oscillation (ENSO). The West African Monsoon is influenced either during thedeveloping phase of ENSO or during the decay of some long-lasting La Niña events. In general, El Niño isconnected to below normal rainfall in West Africa.When assessing <strong>climate</strong> <strong>change</strong>, it is important to note that it will affect regions of Ghana differently. Inaddition, predictions from <strong>climate</strong> models can vary significantly. Information derived from any model mustbe used judiciously, being cognizant of the uncertainty inherent in these tools. Specifically for Ghana,although Global Circulation Models (GCMs) agree generally that mean temperatures will rise, little agreementexists on future precipitation amounts or seasonality; some GCMs project increased precipitation in thenorthern three regions <strong>and</strong> others project decreases.All <strong>climate</strong> projections through the 21 st century we examined, including our own analysis, indicated increasingtemperatures across Ghana. For example, across most ecological zones of Ghana, dry season meantemperatures are projected to rise by about 1.5 to 2.0 o C to about 3 o C by 2080. Because of the complexity ofcorrectly reproducing a number of key features of the atmospheric circulation patterns over West Africa,projections of rainfall by <strong>climate</strong> models are mixed <strong>and</strong> uncertain.. Our ensemble modeling projections ofrainfall among seven representative meteorological stations also gave mixed <strong>and</strong> inconclusive results, lackingconsistency <strong>and</strong> predicting decreases <strong>and</strong> increases in rainfall across stations. The results are summarized foreach station as follows:Accra (Coastal Savanna Zone): Forecasted <strong>change</strong>s in precipitation ranged from 52 percentdecreases to 44 percent increases in wet season rainfall by 2080. The variability among the models'precipitation <strong>change</strong>s is not very different from the inter-annual variability currently experienced inthe region.Kumasi (Deciduous Forest Zone): Forecasted <strong>change</strong>s in precipitation range from 48 percentdecreases to 45 percent increases in wet season rainfall by 2080. The variability among the models'precipitation <strong>change</strong>s is not very different from the inter-annual variability currently experienced inthe region. The A2 scenario, which generally shows the largest greenhouse gas (GHG) impact,predicts the weakest increase in wet season rainfall, 1.13 percent.Tarkwa (Rain Forest Zone): Forecasted <strong>change</strong>s in precipitation range from 45 percent decreasesto 31 percent increases in wet season rainfall. The variability among the models' precipitation <strong>change</strong>sis not very different from the inter-annual variability currently experienced in the region. Techiman (Forest-Savanna Transition Zone): Forecasted <strong>change</strong>s in precipitation range from 46percent decreases to 36 percent increases in wet season rainfall. The variability among the models'precipitation <strong>change</strong>s is not very different from the inter-annual variability currently experienced inthe region. The A2 scenario, which generally shows the largest GHG impact, predicts the largestdecrease in wet season rainfall, -2.94 percent.Tamale (Guinea Savanna Zone): Forecasted <strong>change</strong>s in precipitation range from 36 percentdecreases to 32 percent increases in wet season rainfall. The variability among the models'precipitation <strong>change</strong>s is not very different from the inter-annual variability currently experienced inthe region. The Northern Region where Tamale is located is the southern-most region in Ghana toshow a consistent trend toward decreased rainfall. Walembelle (northern Guinea Savanna Zone): Forecasted <strong>change</strong>s in precipitation range from 25percent decreases to 24 percent increases in wet season rainfall. The variability among the models'2 GHANA CLIMATE CHANGE VULNERABILITY AND ADAPTATION ASSESSMENT
precipitation <strong>change</strong>s is not very different from the inter-annual variability currently experienced inthe region.Bawku (Sudan Savanna Zone): Forecasted <strong>change</strong>s in precipitation range from 28 percentdecreases to 30 percent increases in wet season rainfall. The variability among the models'precipitation <strong>change</strong>s is not very different from the inter-annual variability currently experienced inthe region.Projections also indicate sea-surface temperatures will increase in Ghana’s waters with potential negativeimplications for the dynamic <strong>and</strong> critical link between timing <strong>and</strong> intensity of the coastal upwelling <strong>and</strong> fisheryproductivity. Associated in part with sea temperature increases is sea-level rise which is also projected to risefrom 0.13-0.60 m by the late 21 st century, depending on development scenarios modeled.UNCERTAINTY OF CLIMATE PROJECTIONSThese results illustrate the uncertainty in <strong>climate</strong> <strong>change</strong> projections, especially for future precipitation.Climate science is an exp<strong>and</strong>ing field <strong>and</strong> more reliable projections of future <strong>climate</strong> should become availablesoon. Improved methods exist now in terms of more realistically modeling current <strong>climate</strong> at scales useful fordecision-making, suggesting that improved projections of future <strong>climate</strong> are available. Even so, uncertaintyremains because these dynamically down-scaled regional <strong>climate</strong> models begin with the boundary conditionsset by the global circulation models. Government agencies, NGOs, <strong>and</strong> CSOs in Ghana seem to have littleaccess to detailed <strong>climate</strong> projections <strong>and</strong> seemingly little underst<strong>and</strong>ing of the uncertainties surroundingprojections. Tools to assess the impact of <strong>climate</strong> <strong>change</strong> on agriculture are critical components of povertyreduction programs.Modeling is best tempered with observation <strong>and</strong> experience. Northern Ghana has the highest poverty levelsin the country <strong>and</strong> is also where temperatures are hottest, rainfall is low <strong>and</strong> there is only one rainy season.The actual experience of people interviewed during our field visit to the north reported delays in the onset ofthe rainy season, heavier rains late in the rainy season, <strong>and</strong> increased flooding, causing crop damage. Theexperience of our interviewees is congruent with observed trends of decreasing rainfall <strong>and</strong> increasingtemperatures in the last several decades. These factors combine to make the north the most vulnerable regionof Ghana to adverse affects from <strong>climate</strong> <strong>change</strong>.CLIMATE POLICY FRAMEWORKResponsibility for developing, coordinating, <strong>and</strong> implementing Ghana’s <strong>climate</strong> policy is underst<strong>and</strong>ablydispersed among several agencies. The Environment <strong>and</strong> Natural Resources Advisory Council (ENRAC)operates at the Cabinet level <strong>and</strong> is in place to coordinate among ministries. Within ministries with <strong>climate</strong>relatedresponsibilities, there are coordinating <strong>and</strong> consultative activities. For example, a Carbon Credit PolicyCommittee operates in the Ministry of Environment, Science <strong>and</strong> Technology (MEST) to clearly define rules<strong>and</strong> procedures affecting carbon credit generating activities, allocation of carbon rights, <strong>and</strong> participation insub-national carbon activities. The Environmental Protection Agency within MEST is responsible fordeveloping national <strong>climate</strong> <strong>change</strong> policy <strong>and</strong> integrating priorities into sectoral plans. The National ClimateChange Coordinator is located within the Energy Resource <strong>and</strong> Climate Change Unit of the EnvironmentalProtection Agency (EPA).The MEST developed a list of 55 actions <strong>and</strong> policies the Government of Ghana (GoG) could take to reduceGHG emissions. These Nationally Appropriate Mitigation Actions (NAMAs) were appended to Ghana’ssubmission to the Copenhagen Accord. Most NAMAs align with development priorities in the Ghana SharedGrowth <strong>and</strong> Development Agenda 2010 (GSGDA), <strong>and</strong> most are energy-related but do not specificallymention biofuels, other than waste as renewable sources, <strong>and</strong> do not mention woodlots to meet communitycooking needs. Eight of the 55 NAMAs address l<strong>and</strong> use, l<strong>and</strong> use <strong>change</strong>, <strong>and</strong> forestry, including sustainableforest management, REDD+, plantation development, <strong>and</strong> rehabilitation of degraded l<strong>and</strong>s. The NAMAs aremostly broad statements without implementation details, cost estimates, likely funding sources or priorities.GHANA CLIMATE CHANGE VULNERABILITY AND ADAPTATION ASSESSMENT 3
Ghana is at the forefront of pilot efforts to implement REDD+ activities to mitigate <strong>climate</strong> <strong>change</strong>, withsignificant investments by The World Bank <strong>and</strong> other organizations. The greatest potential for REDD+ inGhana is in carbon enhancement, which means better management of the remaining small amount of forest<strong>and</strong> restoration of degraded forests. The potential so far has been regarded as mostly within the High ForestZone (HFZ), including shade-grown cocoa (cocoa culture is primarily carried out in the HFZ), althoughREDD+ could certainly be extended to the northern savanna woodl<strong>and</strong>s. However, major obstacles remainto be addressed before REDD+ will be successful, including l<strong>and</strong> <strong>and</strong> tree tenure issues, carbon rights,benefit sharing, illegal logging, cocoa production methods <strong>and</strong> carbon measurement, reporting, <strong>and</strong>verification (MRV) methods.Ghana has done little to develop forest-based carbon offset projects through the Kyoto Protocol’s CleanDevelopment Mechanism (CDM) to help mitigate <strong>climate</strong> <strong>change</strong>. The Environmental Protection Agency isthe designated national authority for CDM projects in Ghana. Ghana’s CDM strategy focuses on integratingCDM into its plantation development program, targeted at 30,000 acres/year both on <strong>and</strong> off of forestreserves. To date, only one CDM project – a rubber plantation located in the Western Region – has beenadvanced, though another plantation project is under development in Brong-Ahafo Region inside a GoGforest reserve that is mainly grassl<strong>and</strong>. Barriers to CDM projects include lack of financing to invest inplantation development, the rigor <strong>and</strong> high cost of verification <strong>and</strong> compliance, weak carbon markets, <strong>and</strong>uncertainty over CDM’s future once the Kyoto Protocol expires in 2012. Even so, Ghana seems to be slowlymoving to develop more CDM projects, though no plan is yet developed that identifies how money earnedby selling certified emission reduction credits will be distributed.Several gaps <strong>and</strong> various obstacles hamper mainstreaming <strong>climate</strong> <strong>change</strong> in the GoG. Within MEST, theTown <strong>and</strong> Country Planning Department has no specific <strong>climate</strong> responsibility although there is clearly a needto focus on low emissions development. National <strong>and</strong> regional level coastal development plans should include<strong>adaptation</strong> strategies for sea-level rise (e.g., relocation of transportation, housing, <strong>and</strong> business zones) <strong>and</strong>natural mitigation measures to slow coastal erosion (e.g., mangrove zones, s<strong>and</strong>-mining restrictions).The National Disaster Management Organization (NADMO) within the Ministry of the Interior (MOI) isresponsible for the management of disasters <strong>and</strong> similar emergencies. In addition, NADMO is charged withensuring Ghana is prepared to prevent disasters <strong>and</strong> to manage them well when they occur. Currently,NADMO needs strengthening of capacity to respond to extreme weather events (e.g., floods <strong>and</strong> drought)<strong>and</strong> should disaggregate its national level planning to local development plans. Disaster planning <strong>and</strong> <strong>climate</strong><strong>change</strong> <strong>adaptation</strong> are conceptually linked <strong>and</strong> should be explicitly coordinated within the GoG.Wildfires <strong>and</strong> biomass burning are a significant component of Ghana’s GHG emissions. The draft NationalWildfire Policy (as of 2006) seeks to overcome past policy limitations (unclear authorities, lack of deterrents,disregard of traditional practices, <strong>and</strong> no involvement of traditional authorities in policy formulation orimplementation). Nevertheless, the draft policy is overly focused on fire prevention <strong>and</strong> suppression, ignoringthe role of fire as an ecological agent <strong>and</strong> a traditional management tool. The policy assigns key roles to theGhana National Fire Service (Ministry of the Interior), including fire suppression <strong>and</strong> training programsthroughout the country <strong>and</strong> developing a fire detection <strong>and</strong> monitoring system. Neither of these roles hasbeen addressed, <strong>and</strong> the Fire Service is focused almost entirely on fighting structure fires.Underlying all resource issues <strong>and</strong> agricultural development is the difficulty posed by the seemingly perverseincentives arising from the complexity of l<strong>and</strong> rights (access to <strong>and</strong> tenure of l<strong>and</strong>, tree tenure, <strong>and</strong> benefitsharing) associated with both customary <strong>and</strong> statutory systems. Though an issue in <strong>and</strong> of itself, l<strong>and</strong> <strong>and</strong>resource tenure complicate the potential to use REDD+ incentives in reducing deforestation.Infrastructure needs, shortages of technical expertise, <strong>and</strong> institutional barriers that limit data-sharing aregeneral obstacles to mainstreaming <strong>climate</strong> policy within the GoG.4 GHANA CLIMATE CHANGE VULNERABILITY AND ADAPTATION ASSESSMENT
AGRICULTURE AND LIVELIHOODSAgriculture dominates the Ghanaian economy (>25 percent of GDP in 2008) in terms of income,employment, food security, <strong>and</strong> export earnings. Performance of the sector, however, has lagged othersegments of the economy at rates lower than growth in GDP. Positive growth rates within the agriculturesector come primarily from cocoa production <strong>and</strong> marketing. The livestock, fisheries, <strong>and</strong> food crops subsectors,on the other h<strong>and</strong>, have not shown appreciable improvements. Nevertheless, modernization of theagriculture sector is expected to be an important driver of growth in the medium-term on the basis ofimproved productivity; the growth goals cannot be met by simply exp<strong>and</strong>ing l<strong>and</strong> under cultivation. TheGoG considers agricultural modernization as a pre-condition for the structural transformation of theeconomy <strong>and</strong> sustainable reduction in the incidence of poverty. Central to this strategy are improvements infood crop production <strong>and</strong> expansion of cash crops with a heavy reliance on transforming smallholder farmersby increasing their market orientation. Commercialization <strong>and</strong> large-scale agriculture pose uncertainties withor without <strong>climate</strong> <strong>change</strong> interactions with regard to environmental effects <strong>and</strong> long-term sustainability,given likely increases in costs of oil, fuel, <strong>and</strong> petroleum-based agricultural chemicals.Cropping systems in Ghana are highly diverse, reflecting dynamic <strong>adaptation</strong>s to increasing populationpressure, l<strong>and</strong> insecurity, <strong>climate</strong> variability, <strong>and</strong> new trading opportunities or markets. Most smallholderfarmers combine strategies to meet food security <strong>and</strong> cash flow needs; farming systems may combinesedentary <strong>and</strong> shifting cropping systems as well as intercropping <strong>and</strong> rotational cropping. Even cocoa farmersretain some of their l<strong>and</strong> to grow food crops to meet their own needs. Traditional cropping systems in semiaridWest Africa, including the northern savanna zone in Ghana, are dominated by cereal-based systems,usually combining two or more crops in a field. Intercropping minimizes risk of crop failure from drought orflooding <strong>and</strong> spreads the need for labor over a longer period. With the risk spread over two crops, asmallholder can take advantage of a long growing season during a year of above-average precipitation. Maizeis the most important food crop for smallholders, who obtain 20 percent of their caloric intake from maize.Because maize is also used to meet their cash needs, about half of the maize produced is marketed. Low soilorganic matter <strong>and</strong> limited availability of plant nutrients, in particular phosphorus <strong>and</strong> nitrogen, are majorbottlenecks to agricultural productivity in Ghana, which is further hampered in the northern savanna zonesby substantial topsoil losses through wind <strong>and</strong> water erosion.Ghana is one of the world’s top producers <strong>and</strong> exporters of cocoa, <strong>and</strong> the sector has played a key role in thenation’s economic development. Cocoa yields in Ghana are below international averages; the potentialincrease from higher productivity could more than double the yields in 2005. Recent increases in productionhave come from expansion of the l<strong>and</strong> cropped to cocoa <strong>and</strong> higher inputs of family labor. Increasing l<strong>and</strong> incocoa production has been a driver of deforestation. Because cocoa was traditionally grown under shade,however, many valuable timber trees were retained in cocoa fields, augmented by planting of fruit <strong>and</strong> otheruseful trees. Thus shade-grown cocoa was an agroforestry practice with greater biodiversity value than slash<strong>and</strong> burn (bush fallow) agriculture. Research has demonstrated the technical advantages of fertilized, lowshade or full sun hybrids, <strong>and</strong> current recommendations from the Cocoa Research Institute of Ghana call forfertilizing densely planted hybrid cocoa in full sun or light shade with phosphorus, potassium, <strong>and</strong>micronutrients. In practice, smallholders have been able to adopt only the low shade/full sunrecommendation, as they lack resources to acquire hybrid seeds <strong>and</strong> fertilizer. Little research has beendirected towards increasing productivity of traditional shade grown cocoa, although that alternative wouldavoid the negative effects of full sun hybrid cocoa on biodiversity.Rice production accounts for 15 percent of agricultural GDP <strong>and</strong> 45 percent of the total area planted tocereal grains in Ghana. The main production systems are irrigated, rainfed lowl<strong>and</strong>, <strong>and</strong> rainfed upl<strong>and</strong>systems. Urban consumers prefer imported rice because the domestic rice is uneven in quality <strong>and</strong> oftencontains impurities. Thus, two challenges to commercialization of rice production are to increase productivity<strong>and</strong> improve quality of domestic rice. Optimal whole-farm production systems, including rice usingtraditional (grass fallow) methods, requires >9 ha of production l<strong>and</strong>, which is about twice as much as themean l<strong>and</strong> holding for farmers in the north. Transforming existing smallholders into commercial operationswill require increasing l<strong>and</strong> holdings. Replacing traditional grass fallow with short-duration leguminous coverGHANA CLIMATE CHANGE VULNERABILITY AND ADAPTATION ASSESSMENT 5
crop fallow would have to be accompanied by increasing mechanization to replace the labor needed to farmthe larger acreages.The agricultural sector has been a major driver of poverty reduction, almost exclusively dominating thelivelihoods of rural households. Smallholder farmers, who cultivate 1-2 ha plots of l<strong>and</strong>, produce 80 percentof the country’s agricultural output. The two most important cash crops for smallholders are maize <strong>and</strong>cocoa. Additional, albeit less lucrative, foods grown by smallholders include cassava, yam, plantain, cocoyam,<strong>and</strong> various fruits <strong>and</strong> vegetables. The remaining 20 percent of agricultural production comes from largerscale industrial plantations that produce palm oil, cotton, rubber, sugar cane, <strong>and</strong> tobacco. Raising livestock isanother important activity engaged in by >60 percent of households. Chicken is the most commonly rearedanimal (30 percent of households), along with goats (18 percent), sheep (11 percent), cattle (4 percent), <strong>and</strong>other poultry, including ducks, turkeys, <strong>and</strong> guinea fowl. A few households raise pigs, grasscutter (cane rats),<strong>and</strong> rabbits.Fish provide 40-60 percent of the protein in the Ghanaian diet, <strong>and</strong> fisheries contribute about 4.5 percent tothe national GDP. The fishing industry in Ghana is based primarily on a large marine fishery, <strong>and</strong> to a lesserbut important extent, on inl<strong>and</strong> or freshwater fisheries <strong>and</strong> aquaculture. The Volta Lake impoundment, otherreservoirs, aquaculture, <strong>and</strong> coastal lagoons are the sources of inl<strong>and</strong> or freshwater fish. Even withoutconsideration of <strong>climate</strong> <strong>change</strong>, clear evidence is available of over-exploitation of the marine fishery <strong>and</strong> atleast anecdotal evidence is available of declining fisheries in Lake Volta <strong>and</strong> Lake Botsumtwi. On the coast,overfishing of marine stocks is obvious <strong>and</strong> acknowledged by local fishers; however, the root causes are notclear. Foreign <strong>and</strong> reportedly domestic trawlers using illegal pair trawling <strong>and</strong> both inshore purse seiners <strong>and</strong>traditional canoe fishers using lights at night to attract fish deplete all sizes of fishes, <strong>and</strong> trawling is reportedlydegrading the bottom habitat for fishes. Likewise, traditional fishers are unsustainably harvesting near shorestocks using unselective methods <strong>and</strong> evidence suggests they are fishing down existing stocks (e.g., depletingall but the smallest sizes <strong>and</strong> species). Traditional fishers report they are catching smaller, fewer fishes despiteincreased fishing effort <strong>and</strong> going farther out to sea to fish.Continued expansion of the canoe fleet is also associated with fishery declines. The traditional fishers attemptto manage the fishery by limiting by traditional means the number of craft operating on a given day. Thepossible role of the loss or degradation of mangroves as breeding <strong>and</strong> rearing habitat should be investigated.Fisheries are under tremendous pressure, facing collapse, unless the government is ready to seriously monitor<strong>and</strong> regulate the resource. Any solution will involve a drastic cut in catch size <strong>and</strong> a reduction of the fishingseason. This means individuals that depend on the fisheries will need to find employment elsewhere. Reduceddomestic fish production seems to be likely, whether it is caused by collapse of the fisheries from overfishing,increased regulation in an attempt to avoid a collapse, <strong>climate</strong> <strong>change</strong> effects, or a combination of thesefactors. The unexplored question is how this critical protein source will be replaced in the Ghanaian diet <strong>and</strong>how will it impact nutrition <strong>and</strong> food security?Although growth rates in agricultural production have slowed since the 1980s, they have been positive, butfor most crops growth came from increases in the area harvested not from productivity gains. Rice <strong>and</strong> milletwere exceptions. For maize, substantial differences exist in regions of the country, both in terms of averagegrowth rates <strong>and</strong> the share of growth resulting from increasing the area under cultivation (extensification)versus improving yields per ha (intensification). Extensification has caused significant environmental damage(deforestation, desertification, <strong>and</strong> soil erosion) <strong>and</strong> is clearly unsustainable. Meeting the ambitious goals ofthe GoG for increased agricultural productivity will be challenging; intervention is needed to set agricultureon a different development trajectory.Commercialization of maize <strong>and</strong> rice production requires increased l<strong>and</strong> security in order to motivate farmersto invest in technology <strong>and</strong> inputs. Commercialization of maize production already has led to <strong>change</strong>s in thel<strong>and</strong> tenure patterns <strong>and</strong> a tendency to preferentially allocate l<strong>and</strong> to large-scale commercial farmers. Pressureon the available l<strong>and</strong> resource has already intensified conflict in the northern savanna zone. For example,conflicts have arisen between farmers <strong>and</strong> herdsmen on the alluvial plains; in other areas, l<strong>and</strong> fallowed byone family has been reallocated to another family. Transforming rice cropping in the northern savanna zone6 GHANA CLIMATE CHANGE VULNERABILITY AND ADAPTATION ASSESSMENT
would include concentrating access to l<strong>and</strong> in the h<strong>and</strong>s of wealthy producers, while smallholders would losetheir use rights.Crops are vulnerable to <strong>climate</strong> variability as evidenced by obviously lower yields during drought periods <strong>and</strong>less dramatically by year-to-year variation in productivity. Variability can take many forms, such as less totalannual precipitation, delayed onset of the rainy period, higher temperature or sub-optimum moisture duringcritical growth stages. Changes in average <strong>climate</strong> values in regions currently at the limit for growing somecrops could reduce yields to non-viable levels, for example, causing a shift towards agropastoral systems. Thecomplexity of crop growth requires <strong>climate</strong> data (short-term variability, frequency of extreme events) atspatial <strong>and</strong> temporal resolutions that are currently beyond the reach of <strong>climate</strong> <strong>change</strong> models. In addition toinadequate <strong>climate</strong> models, crop modeling research has favored the major global food crops <strong>and</strong> devoted lessattention to crops important to Ghana, such as millet <strong>and</strong> yams. Additionally, crop models generally arespecified for monocropping <strong>and</strong> rarely consider intercropping. Improvements in <strong>climate</strong> <strong>and</strong> crop models <strong>and</strong>the ability to model effects at scales from the farmer’s field to the region <strong>and</strong> nation will be critical toformulating <strong>adaptation</strong> options for agriculture <strong>and</strong> mainstreaming <strong>climate</strong> <strong>change</strong> into developmentprograms.ECOLOGICAL VULNERABILITYThe African continent is among the most likely to suffer adverse impacts of <strong>climate</strong> <strong>change</strong> because ofvulnerable social <strong>and</strong> natural systems, multiple interacting stresses, <strong>and</strong> low adaptive capacity. Ghana spans arange of climatic <strong>and</strong> edaphic zones from coastal mangroves <strong>and</strong> rainforests along the coast to savanna in thenorth. In much of sub-Saharan Africa, precipitation is inherently variable from year to year. This is oftenexpressed as recurrent drought <strong>and</strong> periodic flooding. Between 1991 <strong>and</strong> 2008, Ghana experienced six majorfloods with >2 million people affected by the floods in 1991. The northern savanna zone is exposed to floodsas well as drought. In 2007, floods followed a period of drought <strong>and</strong> affected >325,000 people. Because mostagriculture is rain-fed <strong>and</strong> rural populations in many countries lack resources to moderate or adapt todrought, the agricultural sector is particularly vulnerable.The major findings for Africa of the Fourth Assessment Report of the IPCC confirm earlier reports,including a warming trend since the 1960s. In West Africa, rainfall has declined 20 percent to 40 percent,although the decline in the tropical rainforest zone has been only 4 percent. Despite advances in ourunderst<strong>and</strong>ing of the complex mechanisms driving rainfall patterns, much uncertainty remains. Drought, amanifestation of extreme rainfall variability, has long been a feature of the continental West African <strong>climate</strong>with severe <strong>and</strong> long-lasting impacts on natural <strong>and</strong> social systems. The decline in rainfall from the 1970s tothe 1990s, for example, caused a 25-35 km southward shift of the savanna zone (Sahelian, Sudanese, <strong>and</strong>Guinean savanna zones) with loss of grassl<strong>and</strong> <strong>and</strong> woodl<strong>and</strong> <strong>and</strong> displacement of human populations.Besides long-term climatic trends <strong>and</strong> extreme events, ecosystems in West Africa have been degraded byhuman activity which often interacts with <strong>climate</strong>. Major stressors (drivers of degradation) are deforestation,wildfire, <strong>and</strong> soil erosion in upl<strong>and</strong> areas <strong>and</strong> overfishing in coastal areas. Here, we examine resource <strong>and</strong>social <strong>vulnerability</strong>.Climate <strong>change</strong> in conjunction with other destructive l<strong>and</strong> use practices could accelerate desertification innorthern Ghana (north of about 10° N latitude). Rapid l<strong>and</strong> use <strong>and</strong> l<strong>and</strong> cover <strong>change</strong>s suggest the process iswell underway. Even so, further rainfall declines, coupled with increasing temperatures, would make much ofnorthern Ghana even more vulnerable to desertification. The vulnerabilities are simply magnified given a hostof biophysical <strong>and</strong> human related issues in the region (e.g., erosive rainfall, soil qualities <strong>and</strong> fertility, recurringdrought, low input decreased fallow period farming, deforestation, frequent hot bush fires, <strong>and</strong> overgrazing).Regardless of <strong>climate</strong> <strong>change</strong> effects being negative or positive, the continuance along the current humannaturalresource trajectory of population growth, over-exploitation, <strong>and</strong> overall extensive l<strong>and</strong> degradation inthe desertification-prone zones of Ghana is clearly unsustainable. At best, the resilience <strong>and</strong> productivity ofmuch of the northern savanna zone will be progressively weakened <strong>and</strong> at worst those same areas, particularlythose in northern most Ghana, will succumb to desertification.GHANA CLIMATE CHANGE VULNERABILITY AND ADAPTATION ASSESSMENT 7
Estimates of forest cover in Ghana vary considerably <strong>and</strong> depend on how forest is defined <strong>and</strong> the<strong>assessment</strong> method. To date, no complete forest inventory of the country exists. Most estimates of forest inGhana focus on the High Forest Zone covering about the southern third of the country. Until 1900, it wasestimated that 33 percent of the country had forest cover. By the late 1980s, forest cover had declined 78percent (to 1.8 million ha), <strong>and</strong> forest areas are now fragmented. Deforestation, albeit poorly measured, isclearly happening at unsustainable rates over the entire country. In 1972, >98 percent of the northernsavanna zones were covered by savanna woodl<strong>and</strong> (>25 trees/ha) or open, cultivated savanna (6-25 trees/ha),respectively. By 2000, 33.6 percent of the northern savanna zone had been degraded to widely open,cultivated savanna (90 percent was dominated by open forest (25 trees/ha) but now 57 percent of the zone is widely open, cultivatedsavanna (60 percent canopy) butthat decreased to 34.2 percent by 2000. In contrast, the moderately dense bush forest (
of transparency pervade the current customary l<strong>and</strong> tenure system practiced over most of Ghana. Withoutsecure access to l<strong>and</strong>, farmers are less likely to invest in or develop long-term innovative agricultural systems.Nor are they likely to invest in new technologies. Rather, without secure access to l<strong>and</strong>, farmers are morelikely to try to maximize short-term profits, often at the expense of the l<strong>and</strong>’s long-term health. This isunsustainable in the long run. Without secure access to l<strong>and</strong>, farmers also have difficulty accessing credit orconnecting with investors, reducing overall production. Finding ways to secure l<strong>and</strong> assess, provide credit at alocal level, <strong>and</strong> strengthen local value chains (connecting farmers with local purchasers, etc.) could helpfarmers overcome these barriers.Women, migrants, <strong>and</strong> unconnected (socially) l<strong>and</strong>less farmers are among the most vulnerable groups inGhanaian society. Under normal circumstances these groups have difficulty accessing l<strong>and</strong> <strong>and</strong> securinglivelihoods. L<strong>and</strong> tenure reforms should not only focus on titling <strong>and</strong> registration but on ensuring that l<strong>and</strong> isdistributed equitably, affordably, <strong>and</strong> simply (meaning the process should be straightforward enough to benavigated by groups without much social or political capital.)Commercialized or mechanized farming could increase production <strong>and</strong> strengthen food security. However, itcould also create joblessness <strong>and</strong> contribute to increased poverty if done without full consideration ofpotential socioeconomic impacts. This is especially relevant given that most of the large-scale commercialagricultural operations likely will occur in portions of the country that are already marginalized. If reducedrainfall caused by <strong>climate</strong> <strong>change</strong> reduces the amount of arable l<strong>and</strong>, increased competition for l<strong>and</strong> will leadto even greater <strong>vulnerability</strong> of smallholders. Livestock rearing occurs primarily in the northern savannazones, <strong>and</strong> could be a viable livelihood diversification strategy for farmers. However, grazing rights threatento pose increasing conflicts, particularly if l<strong>and</strong> ownership <strong>and</strong> rights are unclear.ADAPTATIONFarmers are vulnerable to shocks (unexpected events such as flooding), seasonal variation, particularly timing<strong>and</strong> amount of rainfall, <strong>and</strong> long-term trends (e.g., increased mean temperature). Coping strategies commonlyin place to reduce <strong>vulnerability</strong> to seasonal variation include planting mixtures of crops <strong>and</strong> cultivars adaptedto different moisture conditions (reducing the risk of complete crop failure), using l<strong>and</strong>races resistant to<strong>climate</strong> stresses <strong>and</strong> mulching or water conservation. Multi-year droughts, however, will overpower theseshort-term coping strategies <strong>and</strong> may cause long-term impacts if capital assets are lost <strong>and</strong> no effective localor national support system is in place (Challinor, Wheeler et al. 2007). An alternative to rainfed agriculture forsome farmers may be small-scale irrigation; this requires suitable l<strong>and</strong>, access to water, <strong>and</strong> ideally, capital toinvest in a pump. In the northern savanna zones, dry season vegetable crops are grown in floodplain fieldsthat often are h<strong>and</strong> watered. Many irrigation options require infrastructure or cooperation among groups <strong>and</strong>are thus beyond the resources of a single farmer.Given the uncertainty of <strong>climate</strong> <strong>change</strong> projections for precipitation, the prudent <strong>adaptation</strong> strategy is oneof “no regrets.” Reducing <strong>vulnerability</strong> to current <strong>climate</strong> stress may increase adaptive capacity <strong>and</strong> increaseresilience to future <strong>climate</strong> <strong>change</strong>. Many options are available for adapting agriculture to <strong>climate</strong> variability<strong>and</strong> <strong>change</strong>. Some farmers may opt to leave agriculture by diversifying entirely into non-farm activity ormigrate to urban areas. Farm households in the Northern Region already send some family members south towork <strong>and</strong> return remittances. With increasing populations, this option may be unavailable, forcing somehouseholds to remain in agriculture (Challinor, Wheeler et al. 2007). Diversification of livelihoods in thecoastal region will be a necessity for fishing households. A promising industry is the emerging tourism sectoron the coast <strong>and</strong> eco-tourism near attractions such as national parks. Investment in infrastructure wouldprovide employment in short-term construction jobs as well as in the long-term. Infrastructure (especiallyrestaurants, lodging, developed recreational activities) would also enable local communities to capture morebenefits from tourism.Farmers who depend on annual rains have already demonstrated considerable ability to adapt to uncertain<strong>climate</strong> at least within the range of historic variation. Their ability to adapt to future <strong>climate</strong>s will depend inpart on a supportive institutional <strong>and</strong> macroeconomic environment. Ghana is fortunate among West AfricanGHANA CLIMATE CHANGE VULNERABILITY AND ADAPTATION ASSESSMENT 9
nations in that it is politically stable, yet its governance structures are weak <strong>and</strong> its public sectorunderperforms, especially in the northern savanna zones. Clarification of l<strong>and</strong> tenure, tree tenure, <strong>and</strong> carbonrights is necessary for smallholders to access capital <strong>and</strong> make long-term investments in conservationpractices, agroforestry, <strong>and</strong> improved crop varieties <strong>and</strong> inputs. Access to knowledge <strong>and</strong> assistance fromextension workers is needed for farmers to modify their cropping systems. Community-based approaches toidentifying <strong>climate</strong> <strong>change</strong> <strong>adaptation</strong> strategies as well as strategies for enhancing food security have beenimplemented in the northern regions <strong>and</strong> appear to hold promise.Focusing food security investments entirely on commercialization, mechanization, <strong>and</strong> large-scale agriculturewill result in adverse social impacts unless the needs of small farmers are simultaneously addressed. A multiscaledapproach to agricultural development appropriate to the local socio-cultural context should beconsidered. Farming for profit will require concentrating agriculture on fewer larger farms to take advantageof economies of scale, mechanization efficiencies, <strong>and</strong> market access. Such commercialization orrationalization of agriculture may be desirable from a national development perspective. However, given thetraditional l<strong>and</strong> tenure system <strong>and</strong> the insecurity of many smallholders, development of large-scale farms byoverseas investors may displace many smallholders. Moreover, the food insecurity of local populations couldbe worsened in bad crop years if they are priced out of the market for food. Given the likelihood that oil,fuel, <strong>and</strong> petroleum-based agricultural chemicals will increase in price in the future <strong>and</strong> most smallholderscannot afford such inputs without subsidies, questions of economic viability also arise. Commercialization<strong>and</strong> large-scale agriculture also pose uncertainties with or without <strong>climate</strong> <strong>change</strong> interactions with regard toenvironmental effects <strong>and</strong> long-term sustainability.ENERGY SECTORWood-based fuels (charcoal <strong>and</strong> firewood) are the dominant source of cooking fuel in Ghana with >90percent of households in most districts using them as their main source. Charcoal use is greatest along thecoast <strong>and</strong> in urban centers, though most households (>50 percent) in most districts use firewood as theirmain source of cooking fuel. Firewood dependency is greatest in the Guinea Savanna ecological zone(comprised of the Upper West, the Northern, <strong>and</strong> the northern portion of the Volta regions), where >80percent of households in most districts use firewood for cooking. Although much of the firewood reportedlycomes from dead wood on farm <strong>and</strong> fallow l<strong>and</strong>, fuelwood harvest is about 7.5-8.5 times the estimatednational volume of timber harvested for other purposes, a clear warning sign of the fuelwood pressure onGhana’s forests <strong>and</strong> the threat it poses for deforestation, forest degradation, <strong>and</strong> <strong>climate</strong> <strong>change</strong>. Althoughagroforestry <strong>and</strong> CDM projects may have potential for addressing the wood-based fuels issue through treeplanting, emphasis should also be placed on reducing fuelwood consumption through the development <strong>and</strong>distribution of affordable, efficient cook stoves that are compatible with Ghanaian cooking practices <strong>and</strong>food tastes <strong>and</strong> by improving forest management to promote sustainable fuelwood harvesting <strong>and</strong> use.Hydropower is an issue of some concern in the contexts of <strong>climate</strong> <strong>change</strong>, potential for regional conflict, <strong>and</strong>national energy strategies. Clearly, the issue of future hydropower production from Akosombo (<strong>and</strong> Kpong)dams is complex, is not simplistically related to potential <strong>climate</strong> <strong>change</strong>, <strong>and</strong> is replete with trans-boundaryimplications. First, the water development focus between the two major countries in the Volta River Basin isfundamentally different. Burkina Faso has <strong>and</strong> is concentrating effort in the Basin on improved use <strong>and</strong>increased retention of water for agriculture with dem<strong>and</strong>s in that country (as well as northern Ghana)expected to increase rapidly. In contrast, Ghana’s primary objective is to keep Lake Volta at optimal levels forpower production. Clearly, potential exists for major conflict. Second, past meteorological data <strong>and</strong>hydrological modeling indicate water levels in Lake Volta are highly sensitive to even small <strong>change</strong>s inrainfall. Rainfall projections of global <strong>climate</strong> models are mixed, adding to the uncertainty; however, trendsfrom historical data indicate fairly dramatic decreases from long-term averages. Third, the design ofAkosombo dam was premised on one of the wettest periods on record affecting optimal power productioneven during relatively short or modest dry periods in an inherently variable precipitation regime. Fourth,water allocation agreements are lacking among Ghana <strong>and</strong> the other riparian countries in the Lake VoltaBasin. Finally, the future power production at Akosombo dam clearly will affect Ghanaian choices for10 GHANA CLIMATE CHANGE VULNERABILITY AND ADAPTATION ASSESSMENT
alternate energy sources (i.e., fossil based or alternative) in an attempt to meet shortfalls <strong>and</strong> ever increasingdem<strong>and</strong>.In Ghana, the issue of gas flaring from the Jubilee Oil field has created concern <strong>and</strong> controversy in civilsociety <strong>and</strong> donor countries. Given the substantial production, the gas from the Jubilee Oil Field will need tobe stored, transported, or flared. Further, the infrastructure to pipe gas ashore will not be ready as oilproduction is initiated <strong>and</strong> ramped up, <strong>and</strong> re-injection of gas after ramp-up may not be feasible as oncethought. Long-term gas flaring at the Jubilee Field may be inevitable without accelerated development ofinfrastructure for storage, shipping, <strong>and</strong> processing of the gas.Prolonged gas flaring of the Jubilee natural gas would produce about 1.5 million tons of CO 2 annually (7percent of Ghana’s total national emissions). If the gas is used in a power plant, >13,000 barrels of oil/dayare saved <strong>and</strong> 0.9 million tons of CO 2 emissions are avoided. The total emissions reduction potential fromusing the gas for power production instead of flaring is 2.4 million tons CO 2 equivalent or 10 percent ofnational emissions. Unfortunately, if gas infrastructure development is projected to take four years to becomereality <strong>and</strong> high re-injection capacities are not feasible, the life of this valuable gas field will be reduced byabout 20 percent (16 versus 20 years), an estimated 152-228 billion st<strong>and</strong>ard cubic feet of gas will be lost forenergy production, <strong>and</strong> some 6 million tons of CO 2 will be released.Oil <strong>and</strong> gas development is in its infancy but pressure on l<strong>and</strong> prices <strong>and</strong> housing availability onshore hasalready occurred. Planned development of a gas pipeline <strong>and</strong> onshore uses (e.g., electric power generation,fertilizer plant, liquefied petroleum gas) likely will occur without adequate planning or mitigation of impactson local communities. The over-inflated expectations in the press of the wealth to be derived from oil <strong>and</strong> gasdevelopment could lead to social unrest in coastal communities, especially since the GoG has side-stepped anattempt to designate a fixed percentage of revenues to the region.NORTHERN SAVANNA CASE STUDYSome key vulnerabilities to <strong>climate</strong> <strong>change</strong> in Ghana’s three northern regions include high rates of illiteracy(>73 percent in most districts), <strong>and</strong> relatively underdeveloped infrastructure compared with other parts of thecountry (water sources, road infrastructure). USAID is well positioned to address these vulnerabilities.Significant obstacles to increasing the food security of farm communities in the northern regions areuncontrolled annual bushfires, declining soil fertility causing reduced productivity, <strong>and</strong> lack of access toaffordable operating capital. The attraction of quick cash from making <strong>and</strong> selling charcoal for sale in thesouth draws young people away from farming. Such harvesting appears to be unsustainable <strong>and</strong> will add tosoil erosion problems, affect local <strong>climate</strong>, perhaps accelerate desertification, <strong>and</strong> will eventually produce anunemployed segment of the population lacking in marketable skills. Adding to these problems is a shortage ofdry season grazing <strong>and</strong> water for livestock, free-ranging livestock, <strong>and</strong> an influx of migrant pastoralists fromthe north. These factors can <strong>and</strong> are interacting to produce a downward spiral for soils, forests, farming, <strong>and</strong>farmers. Climate variability contributes to current food insecurity, which will be exacerbated by a changing<strong>climate</strong>.A number of <strong>adaptation</strong>s to <strong>climate</strong> variability <strong>and</strong> <strong>climate</strong> <strong>change</strong> are documented in Ghana’s threepredominantly rural, agriculturally dependent northern regions. These <strong>adaptation</strong>s include changingagricultural practices, diversifying livelihood strategies outside of the agricultural sector, <strong>and</strong> increasingmigration to southern Ghana <strong>and</strong> urban areas. There are a number of opportunities to support <strong>climate</strong><strong>change</strong> <strong>adaptation</strong> in northern Ghana through USAID’s Feed the Future program because of its focus onincreasing the livelihood security of households. It is important to take a community-based approach todeveloping <strong>and</strong> implementing specific interventions to support both food security <strong>and</strong> <strong>climate</strong> <strong>change</strong><strong>adaptation</strong> to ensure that they are appropriate to the local context <strong>and</strong> will be beneficial. Such an approachcalls for helping communities identify their own vulnerabilities <strong>and</strong> develop their own <strong>adaptation</strong> strategies.Addressing food security by focusing on the entire value chain appears to be the most promising approach,although there is room for better alignment between needs <strong>and</strong> current activities. Community-basedGHANA CLIMATE CHANGE VULNERABILITY AND ADAPTATION ASSESSMENT 11
approaches to identifying <strong>climate</strong> <strong>change</strong> <strong>adaptation</strong> strategies (e.g., CARE) <strong>and</strong> strategies for enhancing foodsecurity (e.g., Canadian International Development Agency or CIDA) have been implemented in the northernregions <strong>and</strong> appear to hold promise. Activities include adopting agroforestry practices, crop diversification,planting drought-resistant <strong>and</strong> short-season varieties, practices to enhance soil moisture retention in fields,minimal tillage, composting for fertilizer, planting dry season vegetable gardens, developing surface wells,rearing small stock (chickens, guinea fowl, goats, sheep, <strong>and</strong> pigs), <strong>and</strong> actions to reduce burning of fields.Practices that are successful at the local level could potentially be scaled up.MAINSTREAMING CLIMATE CHANGEIncorporating or “mainstreaming” <strong>climate</strong> <strong>change</strong>, <strong>climate</strong> variability, <strong>vulnerability</strong>, <strong>and</strong> <strong>adaptation</strong> intoUSAID programming offers many opportunities for USAID to help the GoG prepare for the future. Thesuggestions summarized here are based on the analyses conducted by the Assessment Team. Many of theoptions are multi-level, in that the <strong>vulnerability</strong> addressed will have to be attacked at several levels withinGhanaian society. Underlying all the options is a need to address the disconnect between customary <strong>and</strong>statutory rights in l<strong>and</strong> that precludes improvements in many aspects of food security <strong>and</strong> environmentalmanagement. Without secure rights to l<strong>and</strong>, smallholders lack incentives to adopt new technologies, invest inagricultural improvements, <strong>and</strong> are unable to access the resources needed to increase crop productivitybecause they cannot obtain operating capital at less than usurious interest rates.We categorize intervention options into five types of barriers to <strong>climate</strong> <strong>change</strong> <strong>adaptation</strong> <strong>and</strong> mitigation:Policy Environment, Governance <strong>and</strong> Tenure, Capacity <strong>and</strong> Infrastructure, Information <strong>and</strong> Analysis, <strong>and</strong>Awareness <strong>and</strong> Implementation. Under each barrier, we briefly indicate intervention options <strong>and</strong>parenthetically identify USAID programs as we underst<strong>and</strong> them that could address that intervention(FtF=Feed the Future, Edu=Education, H&S=Health <strong>and</strong> Sanitation, Dem/Gov=Democracy <strong>and</strong>Governance, Gen=Gender). Options could have certainly been categorized differently, but the purpose is tocommunicate important information the Assessment Team gleaned regarding potential interventions.The policy environment barrier exposes vulnerabilities in areas directly <strong>and</strong> indirectly relevant to <strong>climate</strong><strong>change</strong>. Decided vulnerabilities arise from uncoordinated responses to <strong>climate</strong> <strong>change</strong>. Options forintervention include supporting the completion <strong>and</strong> implementation of the Ghana National Climate ChangeStrategy, focus in that strategy on <strong>adaptation</strong> responses <strong>and</strong> incorporation of <strong>climate</strong> <strong>change</strong> in urbanplanning efforts (FtF, Edu, H&S, Dem/Gov, Gen). A national energy policy is needed that includes <strong>climate</strong><strong>change</strong> mitigation <strong>and</strong> low emission strategies (i.e., advanced biofuels development, capturing not flaringnatural gas) (Dem/Gov, FtF). Integrated national <strong>and</strong> regional level coastal development <strong>adaptation</strong> planningis needed to address sea-level rise <strong>and</strong> coastal erosion (Dem/Gov, Edu, FtF). The FtF program focuses withjustification on the northern regions, but other areas exhibit high social <strong>vulnerability</strong> to <strong>climate</strong> <strong>change</strong>,indicating need for a more targeted, district-based approach (i.e., expansion to Brong-Ahafo <strong>and</strong> Voltaregions). Indirectly but most certainly related to <strong>climate</strong> <strong>change</strong> are uncoordinated policy responses to waterallocation among riparian countries in the Volta Basin (FtF, Dem/Gov) <strong>and</strong> lack of integrated firemanagement <strong>and</strong> regionally adapted policies (including traditional practices) focused on managingenvironmentally destructive fires (FtF, Dem/Gov). Because farmers need stable <strong>and</strong> favorable crop prices tomake commercial crop production profitable, a favorable policy environment is needed for cash cropproduction (FtF).The governance/tenure barriers <strong>and</strong> the associated vulnerabilities to <strong>climate</strong> <strong>change</strong> <strong>adaptation</strong> <strong>and</strong> mitigationin Ghana were viewed by the Team as overarching, keystone issues not only in the <strong>climate</strong> <strong>change</strong> arena butin development generally <strong>and</strong> FtF specifically. Key interventions include advocating for examination of l<strong>and</strong>tenure <strong>and</strong> property rights issues at the community level, capacity building with traditional l<strong>and</strong> managementauthorities (e.g., chiefs, Tendanas) for transparency <strong>and</strong> equality in l<strong>and</strong> use practices, <strong>and</strong> a nationalexamination <strong>and</strong> correction of tree tenure issues that result in perverse, counterproductive incentives againstcarbon sequestration <strong>and</strong> maintenance <strong>and</strong> creation of forests (all FtF, Dem/Gov, Gen). Retention of carbonbenefits at the national level without local benefits sharing creates yet another perverse incentive system12 GHANA CLIMATE CHANGE VULNERABILITY AND ADAPTATION ASSESSMENT
affecting carbon sequestration. Advocacy is needed for legislation defining carbon rights to provide equity tosmallholders (FtF, Dem/Gov, Gen).The l<strong>and</strong> tenure system also imposes insecurity on tenants <strong>and</strong> increasestheir <strong>vulnerability</strong> to <strong>climate</strong> <strong>change</strong> by restricting access to credit <strong>and</strong> discouraging if not precluding longtermplanning <strong>and</strong> investment by tenants <strong>and</strong> l<strong>and</strong>owners. Local strategies are needed to provide affordablecredit to l<strong>and</strong>owners <strong>and</strong> tenant farmers (FtF). The extreme reliance on wood-based fuels in Ghana is asignificant <strong>vulnerability</strong> that seems largely unaddressed by any sector at any level. The Team viewed thewood-based fuel situation as a critical issue from the perspectives of dramatically increasing social<strong>vulnerability</strong> to <strong>climate</strong> <strong>change</strong>, its clear unsustainability <strong>and</strong> environmental ramifications thereof, <strong>and</strong> forUSAID, the ability of FtF to succeed. Addressing forest management <strong>and</strong> tenure challenges to sustainablefirewood <strong>and</strong> charcoal production are sorely needed as are community-based approaches to managing woodbasedfuels sustainably (Dem/Gov, FtF). The FtF program emphasizes agricultural development which couldaffect l<strong>and</strong> access <strong>and</strong> allocation of water resources. Social impact <strong>assessment</strong>s of agricultural developmentprojects are needed to identify mitigation measures, to ensure people are not displaced or lose l<strong>and</strong> access,<strong>and</strong> to ensure conditions for marginalized groups (i.e., women <strong>and</strong> migrants) are improved not worsened(FtF). Irrigation development will redistribute water resources <strong>and</strong> perhaps increase competition for wateraccess. An equitable system of water allocation <strong>and</strong> management should be developed as an integral part ofany irrigation development project (FtF).Many vulnerabilities under the capacity <strong>and</strong> infrastructure barrier cascade directly from the policy <strong>and</strong>governance/tenure vulnerabilities. Several relate directly to carbon sequestration <strong>and</strong> forestry issues. FtFactivities need to be melded with reforestation <strong>and</strong> afforestation projects to meet community <strong>and</strong> familyneeds for fuel <strong>and</strong> construction wood, to produce non-timber forest products (NTFPs), to protect riparianareas, <strong>and</strong> to sequester carbon (FtF). Further, partners need to be identified who can link FtF activity tocarbon financing or payments for ecosystem services markets as part of carbon offset payments (FtF).Technical capacity is needed to develop more efficient wood-based stoves to reduce deforestation, carbonemissions, <strong>and</strong> smoke (FtF, H&S, Gen). Community fuelwood programs need to be developed with technicalassistance in species selection, plantation establishment, <strong>and</strong> management <strong>and</strong> governance structures (FtF,Gen, H&S, Dem/Gov). Scarce fuelwood most impacts women, the traditional gatherers of wood forcooking. A national integrated fire management program, including traditional practices, is needed to managedestructive bush fires to protect soil quality, increase forage quantity <strong>and</strong> quality, increase rates ofreforestation <strong>and</strong> afforestation, <strong>and</strong> mitigate trends toward desertification in vulnerable areas (e.g., northernGhana).Several interventions related to the agriculture sector (<strong>and</strong> thus FtF) fall under the capacity <strong>and</strong> infrastructurebarrier. Transportation infrastructure limits access to markets with most households in most districts ofnorthern Ghana traveling >30 minutes to reach a food market <strong>and</strong> in many districts
Given a declining fishery <strong>and</strong> the threat <strong>climate</strong> <strong>change</strong> poses for that resource, the GoG should be stronglyencouraging development of capacity <strong>and</strong> infrastructure to scientifically monitor, regulate, <strong>and</strong> manage allsectors of the marine <strong>and</strong> freshwater fisheries for long-term sustainability (FtF, H&S, Gen). Local monitoringauthorities should be strengthened <strong>and</strong> connected with local, regional, <strong>and</strong> national partners <strong>and</strong> counterparts(FtF, H&S, Gen). Most coastal residents are fisheries-dependent, are vulnerable to disruptions in theresource, <strong>and</strong> have few employment alternatives. Tourism, while promising, lacks the infrastructure toprovide substantial income. Investments in tourism infrastructure could provide coastal residents viablealternative livelihoods. Investments in education could broaden skill sets <strong>and</strong> widen employmentopportunities for youth <strong>and</strong> young adults (Edu).The energy sector is also hampered by significant capacity <strong>and</strong> infrastructure barriers. The GoG should beencouraged to develop as soon as possible natural gas processing capabilities to avoid prolonged (months toyears) gas flaring <strong>and</strong> increased GHG emissions from the Jubilee Field <strong>and</strong> use that gas to supplement analready inadequate national power grid. The lack of electricity in rural areas impedes entrepreneurial activity,calling for exploration of alternative energy systems (e.g. solar, biofuels) to meet local community needs.Because of education, training, <strong>and</strong> skill deficits, local populations are disadvantaged for competing for jobs inthe nascent oil <strong>and</strong> gas industry. The GoG should be encouraged to provide training to afford localsemployment opportunities in that industry (Edu).Several other interventions were identified under the capacity <strong>and</strong> infrastructure barrier. Mainstreaming<strong>climate</strong> <strong>change</strong> in GoG activities could be advanced by improving data sharing policies among agencies,especially for meteorology data (Dem/Gov) as well as partnering with institutions to supply <strong>climate</strong><strong>adaptation</strong> information (FtF, H&S, Gen). Lack of technical capacity <strong>and</strong> infrastructure limits the ability toshare large data files between agencies <strong>and</strong> could benefit from improved internet capabilities. Efforts todecentralize government are impeded in rural areas by lack of infrastructure. Cell phone texting featuresshould be explored for use in online registrations, permit applications, etc. to avoid long distance travel togovernment offices <strong>and</strong> to increase participation. Likewise, development of a practical system of farmercredit banks in rural areas is needed to establish farmer accounts that can be used remotely to conductfinancial transactions (FtF). As noted, this latter intervention needs to be superseded by addressing l<strong>and</strong>tenure issues that constrain credit <strong>and</strong> by making credit affordable to smallholders.Information <strong>and</strong> analysis represents a significant barrier to <strong>climate</strong> <strong>change</strong> <strong>adaptation</strong> <strong>and</strong> mitigation inGhana. Data is lacking for critical decision making, planning, <strong>and</strong> forecasting. Climate <strong>change</strong> should beinvestigated at a sub-national level using appropriately scaled GCM models <strong>and</strong> within the context ofdesertification, sea-level rise <strong>and</strong> coastal erosion, marine <strong>and</strong> inl<strong>and</strong> fishery sustainability, water supply in theVolta Basin, <strong>and</strong> hydropower production (FtF, Gen). Rates of coastal erosion should be investigagednationally with an emphasis on identifying causes <strong>and</strong> on impacts to coastal infrastructure <strong>and</strong> naturalresources (e.g., towns, ports, biodiversity hotspots, lagoonal <strong>and</strong> inshore fisheries) (FtF). Regionalorganizations (e.g., CILSS, AGRHYMET, CORAF, INSAH, FEWSNET) should be engaged in partnershipsto ensure availability of <strong>and</strong> access to data (e.g., weather data, hydrological data, ground cover <strong>change</strong>,agricultural expansion, improved l<strong>and</strong> productivity, fish populations) <strong>and</strong> projections (FtF).Several items identified under the information <strong>and</strong> analysis barrier relate directly to agriculture <strong>and</strong> foodsecurity. Research <strong>and</strong> technology development programs are needed in <strong>climate</strong> prediction, to improve cropmodels, <strong>and</strong> to link process-based crop models to high resolution regional <strong>climate</strong> models (FtF). To helpadapt to <strong>climate</strong> <strong>change</strong>, soil suitability analysis should be incorporated into agricultural development planning<strong>and</strong> updated with soil suitability analysis data on new crop varieties (FtF). The uncertainties of FtFcommercial <strong>and</strong> large-scale agriculture sustainability needs to be investigated in light of increasing future costsof petroleum-based fuels <strong>and</strong> agricultural chemicals <strong>and</strong> a changing <strong>climate</strong> (FtF, Gen). Likewise, FtFirrigation projects should be analyzed in regard to impacts on surface <strong>and</strong> ground water quantity <strong>and</strong> quality<strong>and</strong> downstream effects (FtF). An evaluation of the temporal pace of vegetation <strong>change</strong> <strong>and</strong> soil degradationis needed to assess desertification in northern Ghana, especially in the context of projected populationincreases, food security, water dem<strong>and</strong>s, ecological services, <strong>and</strong> <strong>climate</strong> <strong>change</strong>.14 GHANA CLIMATE CHANGE VULNERABILITY AND ADAPTATION ASSESSMENT
Information <strong>and</strong> analysis needs for forestry-related items are also apparent. L<strong>and</strong> cover/l<strong>and</strong> use inventories<strong>and</strong> forest inventories are needed to set baselines for deforestation, carbon pools under REDD+ <strong>and</strong> to meetMRV requirements. Investigation is needed in areas where carbon sequestration can complement FtF efforts,e.g., increasing mangroves, rangel<strong>and</strong> management, agro-forestry, farmer managed natural regeneration(FMNR), <strong>and</strong> riparian forest management (FtF). Optimized shade-grown cocoa management schemes areneeded that provide high levels of return to farmers, reduce deforestation <strong>and</strong> degradation <strong>and</strong> also offergreater biodiversity benefits than sun-grown cocoa (FtF).Many in Ghana lack the awareness <strong>and</strong> skills to use <strong>climate</strong> <strong>change</strong>, agricultural, natural resourcemanagement, or other information that would reduce their <strong>vulnerability</strong>. Partnerships with localimplementers would build the <strong>climate</strong> <strong>change</strong> awareness of end users (e.g., farmers, fishermen, media,government) <strong>and</strong> enhance their ability to use information (FtF, Edu). Workshops should be organized onvarious topics (e.g., <strong>climate</strong> <strong>change</strong>, <strong>adaptation</strong>, carbon sequestration) for agriculture sector partners <strong>and</strong> FtFimplementers. Cocoa producers lack the skills <strong>and</strong> knowledge to implement the whole technology package forsun-grown cocoa; cocoa productivity could be increased by intensification <strong>and</strong> access to inputs (FtF). Topdownapproaches to fire management are unsuccessful in part because of a lack of awareness of traditionalmethods. GoG agencies <strong>and</strong> personnel should be educated on modern integrated fire managementapproaches <strong>and</strong> traditional approaches <strong>and</strong> the two integrated on the ground. Not all <strong>adaptation</strong> measurescurrently used are sustainable <strong>and</strong> many are erosive to future economic health <strong>and</strong> well-being at thehousehold, community, <strong>and</strong> regional levels. Adaptations should be considered carefully so that unsustainableapproaches are avoided (e.g., marine fuel pre-mix program). Short-term temporary <strong>and</strong> long-term copingmechanisms should be distinguished <strong>and</strong> the difference communicated to the public (FtF, Edu). Livestockproduction in the north offers a potential to diversify livelihoods in the north <strong>and</strong> hence decrease<strong>vulnerability</strong> to <strong>climate</strong> <strong>change</strong>. This potentiality should be communicated <strong>and</strong> promoted; <strong>and</strong> support shouldbe given to schemes that help farmers adopt livestock keeping (FtF). Most crop yields in Ghana are belowpotential, requiring intensification to meet middle income country (MIC) goals. Agricultural productivitycould be increased by improving distribution channels <strong>and</strong> access to technology <strong>and</strong> inputs (e.g., fertilizer)<strong>and</strong> by providing farmers access to operating capital <strong>and</strong> crop insurance to mitigate effects of <strong>climate</strong>variability. (FtF). Farmers lack information on consumer quality expectations <strong>and</strong> fail to meet market dem<strong>and</strong>.Awareness of consumer expectations should be raised <strong>and</strong> quality assurance programs instituted for improvedmarketability (FtF).NEW INTERVENTIONS FOR USAID PROGRAMMINGTo mainstream <strong>climate</strong> <strong>change</strong> into USAID programming in Ghana, <strong>and</strong> indeed for the GoG <strong>and</strong> otherdonor partners to integrate <strong>climate</strong> <strong>change</strong> into their development efforts, the availability of meteorologicaldata <strong>and</strong> interpretive information must be increased. To effectively use available <strong>climate</strong> information, thecapacity within Ghana to use the information must also be enhanced. This need presents an opportunity forUSAID Ghana to develop programs or partner with others to build capacity. The two sides of the issue areincreasing available data <strong>and</strong> enhancing capacity to use the data <strong>and</strong> <strong>climate</strong> projections. Increasing dataavailability can be achieved by partnering with regional institutions <strong>and</strong> non-governmental partners toincrease meteorological monitoring capacity by increasing the number of weather stations, especially in ruralareas in the northern regions where the current monitoring network is sparse. Other initiatives could focus onbuilding relationships among regional institutions such as FAMNET, AGRHYMET, <strong>and</strong> others to deliverdata interpretation. Climate modeling at the scale of the Global Climate Models is already available over theinternet, but the expertise necessary to interpret these data, state their uncertainties, <strong>and</strong> effectively use themto downscale to regional <strong>climate</strong> models is generally lacking in Ghana <strong>and</strong> elsewhere in sub-Saharan Africa,except possibly in South Africa. Thus, another opportunity for USAID is to develop interpretation <strong>and</strong>communication capacity within Ghana, either at a university, within the GoG, or in a jointly funded <strong>and</strong>maintained center.Other options are more sectoral in nature. One need seems to be an integrated <strong>and</strong> realistic energy strategyfor Ghana that depends on internal resources. There are few opportunities to exp<strong>and</strong> hydropower; in fact, theGHANA CLIMATE CHANGE VULNERABILITY AND ADAPTATION ASSESSMENT 15
current capacity will likely diminish over time as precipitation within the Volta basin declines, <strong>and</strong>neighboring countries exp<strong>and</strong> their extractions for drinking water <strong>and</strong> irrigation. Ghana is developing oil <strong>and</strong>gas that will provide new energy sources, but they will have to be developed – for example, by capturing thenatural gas from the Jubilee Field <strong>and</strong> using it to power an energy plant. Perhaps the greatest opportunity forGhana is to develop advanced biofuels or at least to use advanced conversion technology along withcomparative advantages in growing woody feedstocks. Such a policy should, however, be integrated withagricultural <strong>and</strong> other uses of l<strong>and</strong> <strong>and</strong> is predicated upon raising the productivity of food crops to their fullpotential under intensification.Woody biomass for bioenergy already provides a large share of the energy needs of the average Ghanaian,specifically fuelwood for cooking. Currently, this use is inefficient (open fires, inefficient charcoal productionmethods) <strong>and</strong> often damaging to the environment. In addition to programs to increase fuelwood availability,improve cookstove efficiency, <strong>and</strong> improve charcoal production, the entire forestry sector of Ghana needs tobe transformed. One starting point would be the transformation of the Forestry Commission (FC) into a l<strong>and</strong>management <strong>and</strong> stewardship agency. Thus, a transformed FC would no longer be focused simply ongenerating income from timber concessions <strong>and</strong> permitting fees. Rather, the FC would be responsible forconserving the remaining high forests, restoring degraded forest reserves <strong>and</strong> wetl<strong>and</strong> forests, <strong>and</strong> providingtechnical assistance to communities in developing community forests <strong>and</strong> fuelwood plantations. In addition,the wood industry in Ghana needs to be rationalized to remove subsidies that maintain an inefficient exportmarket, <strong>and</strong> to improve provision to meet domestic lumber needs. Improved forest management will alsomaximize opportunities to capture payments for carbon <strong>and</strong> other ecosystem services.Ghana’s mid-term development strategy <strong>and</strong> goal of obtaining MIC status by 2015 depends heavily uponimprovements in the agricultural sector. Although we have suggested some interventions in the agriculturalsector, one <strong>change</strong> that requires multiple <strong>and</strong> continuing interventions is the need to overhaul agriculturalresearch <strong>and</strong> extension in Ghana. The GoG does not provide adequate support for applied agriculturalresearch internally, which causes research scientists to seek funding from outside sources. This usually meansthat agricultural research focuses more on basic research than is needed in Ghana, leading to the charge that itis irrelevant. Extension is also underfunded <strong>and</strong> is removed from the needs of the smallholder. Without astrong applied research focus on issues that matter to the smallholder, delivered by extension agents inaffordable technology packages, the existing agricultural research <strong>and</strong> extension infrastructure will notcontribute to meeting the needs of the Ghanaian farmer.Finally, <strong>climate</strong> <strong>change</strong> <strong>vulnerability</strong> <strong>and</strong> <strong>adaptation</strong> analyses need to be conducted at the community <strong>and</strong>household levels in the different regions. Because variability <strong>and</strong> <strong>change</strong>s in <strong>climate</strong> will be felt locally, <strong>and</strong> amyriad of possible <strong>adaptation</strong> responses exist, <strong>vulnerability</strong> analysis needs to be situated in a local spatialcontext. USAID Ghana, working with donor partners, GoG agencies, NGOs, <strong>and</strong> CSOs should develop<strong>vulnerability</strong> <strong>and</strong> <strong>adaptation</strong> analyses as part of the project planning <strong>and</strong> design phase <strong>and</strong> require that theresults be used to modify projects before embarking on them.16 GHANA CLIMATE CHANGE VULNERABILITY AND ADAPTATION ASSESSMENT
1. INTRODUCTIONThe West African country of Ghana is located on the Gulf of Guinea <strong>and</strong> extends northward from a lowlyingcoastal zone through the Volta River basin to the savanna zone on the border with Burkina Faso.Ghana is bordered on the west by Côte d’Ivoire <strong>and</strong> the east by Togo. The total area of Ghana isapproximately 238,500 km 2 . Ghana’s economy relies on agriculture, which accounted for>25 percent of GDPin 2008 <strong>and</strong> employed half of the economically active population (World Bank, 2009). The main exports arecocoa, gold, timber, diamonds, bauxite, manganese, <strong>and</strong> hydropower. Ghana is designated a Low IncomeCountry, making it one of only four West African countries that are not classified as Least DevelopedCountries.Countries in Africa are among the most vulnerable globally to the effects of <strong>climate</strong> <strong>change</strong> because of thedependence of much of the population on agriculture, particularly rain-fed agriculture <strong>and</strong> widespreadpoverty that renders them unable to withst<strong>and</strong> <strong>climate</strong> stress. Recurrent drought in many countries hasdemonstrated the effects of <strong>climate</strong> variability on food resources. Many people face food insecurity, even ingood times, due to widespread poverty in many countries (Dixon et al., 2003). Additionally, <strong>climate</strong> variability<strong>and</strong> <strong>change</strong> threaten other resources, including water, forests, <strong>and</strong> fisheries. Communities in coastal areas willbe impacted by projected rise in sea-level of up to 1 m in this century. Some countries, including Ghana,already experience coastal erosion <strong>and</strong> flooding (Boko et al., 2007).The team analyzed <strong>climate</strong> <strong>change</strong> <strong>vulnerability</strong> <strong>and</strong> <strong>adaptation</strong> challenges with respect to l<strong>and</strong>, water <strong>and</strong>forest resources, agriculture, energy, human health, human settlements, biodiversity, <strong>and</strong> coastal zoneresource management (including marine fisheries, <strong>and</strong> coastal l<strong>and</strong>-based resources). The team also analyzedthe country’s <strong>climate</strong> <strong>change</strong> policies, strategies <strong>and</strong> programs, <strong>and</strong> the outcomes <strong>and</strong> lessons learned frompast <strong>and</strong> ongoing <strong>climate</strong> <strong>change</strong> programs in Ghana. This included work supported by bilateral <strong>and</strong>multilateral agencies <strong>and</strong> donors.The purpose of this document is to provide the US Agency for International Development Mission to Ghana(USAID-Ghana) with an overview of <strong>climate</strong> <strong>change</strong> projections for Ghana, an interpretation of thesignificance of <strong>climate</strong> variability <strong>and</strong> <strong>change</strong> in terms of effects on natural resources <strong>and</strong> human populations,<strong>and</strong> to suggest potential <strong>adaptation</strong> measures with a view towards future USAID-Ghana programming.GHANA CLIMATE CHANGE VULNERABILITY AND ADAPTATION ASSESSMENT 17
2. APPROACHThis Climate Change Assessment (hereafter, Assessment) of Ghana was prepared by a team of US ForestService scientists <strong>and</strong> Ghanaian counterparts, based in part on interviews with government officials, staff ofnon-governmental organizations (NGOs), <strong>and</strong> representatives of civil society organizations (CSOs) over atwo-week period. In addition to interviews, the team collected geospatial data from agencies <strong>and</strong> electronicpublic sources, as well as an extensive literature review. The Assessment was conducted at two levels, anational overview <strong>and</strong> a targeted <strong>assessment</strong> of the Savanna Zone, comprised of the three northernadministrative regions in Ghana (Northern, Upper West, <strong>and</strong> Upper East).In the Assessment, we first set the context by describing the general <strong>climate</strong> of Ghana <strong>and</strong> the projected<strong>change</strong>s to 2080. We discuss <strong>vulnerability</strong> to <strong>climate</strong> <strong>change</strong> at the national level, by ecological zone, <strong>and</strong>derive key issues affecting <strong>vulnerability</strong>. Mitigation <strong>and</strong> <strong>adaptation</strong> opportunities <strong>and</strong> challenges are presentedfrom a national perspective. The level of analysis then shifts to an <strong>assessment</strong> of the savanna zone for whichUSAID-Ghana has targeted the Feed the Future (FtF) program for the next several years (USAID/Ghana,2010), <strong>and</strong> the Coastal zone where significant new developments in the energy sector are anticipated. Thereport concludes with some options for future USAID/Ghana programming in terms of integration intoexisting programs <strong>and</strong> new interventions.Our approach to <strong>climate</strong> <strong>change</strong> <strong>assessment</strong> follows a particular conceptual model, <strong>and</strong> some explanation is inorder of how we use terms such as <strong>vulnerability</strong>, mitigation, <strong>and</strong> <strong>adaptation</strong>. Assessing <strong>vulnerability</strong> of natural<strong>and</strong> human systems has developed from two disciplinary approaches, disaster risk reduction (natural hazards)<strong>and</strong> <strong>climate</strong> <strong>change</strong> <strong>adaptation</strong> (Renaud <strong>and</strong> Perez 2010) leading to multiple definitions of terms common toboth approaches. Reviews of these approaches <strong>and</strong> attempts to reconcile terminology abound (e.g., (Adger1999, Kelly <strong>and</strong> Adger 2000, Turner, Kasperson et al. 2003, Smit <strong>and</strong> W<strong>and</strong>el 2006, Fussel 2007, Birkmann<strong>and</strong> von Teichman 2010). The <strong>climate</strong> <strong>change</strong> literature that follows the definition of <strong>vulnerability</strong> given bythe Intergovernmental Panel on Climate Change (IPCC) (Carter, Jones et al. 2007; Schneider, Semenov et al.2007) uses a combined <strong>vulnerability</strong> that is a function of hazard, exposure <strong>and</strong> sensitivity (Brooks 2003)termed biophysical <strong>vulnerability</strong>. This approach focuses on human exposure to hazards with littleconsideration of how humans might cope with hazards that occur (Brooks, 2003).Our approach instead views <strong>vulnerability</strong> as a condition (or state) of a coupled human-environment system.We draw upon the conceptual framework of Sarewitz et al. (2003) who separate the likelihood of an eventoccurring that will affect a system (event risk) from the condition or internal state of the system (<strong>vulnerability</strong>)that makes it susceptible to harm from an event. The risk of a particular outcome (outcome risk) integrates theprobability of an event with the characteristics of the system that jointly results in an impact. Brooks (2003)explores how this framework can be applied to the different uses of <strong>vulnerability</strong> in the disaster risk reduction<strong>and</strong> <strong>climate</strong> <strong>change</strong> <strong>adaptation</strong> literature <strong>and</strong> O’Brien, Eriksen et al. (2004) examine the conflictinginterpretations of <strong>vulnerability</strong> in <strong>climate</strong> <strong>change</strong> research.Apparent equivalencies <strong>and</strong> dissimilarities of the two approaches are evident (Figure 2.1). Event risk issynonymous with hazard (as used in the disaster reduction literature) <strong>and</strong> with climatic event. Similarly, thereis little difference in meaning among outcome risk, disaster, <strong>and</strong> risk (as used in the natural hazards literature).18 GHANA CLIMATE CHANGE VULNERABILITY AND ADAPTATION ASSESSMENT
ABFigure 2.1 Two approaches to <strong>vulnerability</strong> analysis:(A) risk model of Sarewitz et al. (2003); (B) IPCC modelFigure 2.1 shows two approaches to assessing <strong>vulnerability</strong> to <strong>climate</strong> <strong>change</strong>. . The first approach is basedona risk model described by Sarewitz etal., (2003) where <strong>vulnerability</strong> is a systemcondition, shown here asconditionsof the natural <strong>and</strong> social sub-systems ina coupled model. In the second, <strong>vulnerability</strong> as defined bythe IPCC views <strong>vulnerability</strong> as the effects of <strong>climate</strong> <strong>change</strong> onn a biophysicall system (Carter et al., 2007;Schneider et al., 2007). Similarities <strong>and</strong> distinctionss are those suggested by Brooks (2003).The use of <strong>vulnerability</strong>by Sarewitz et al. (2003) encompasses both the <strong>vulnerability</strong> of social systems <strong>and</strong> theinherent <strong>vulnerability</strong> ofnatural systems. Many aspects of social <strong>vulnerability</strong> are generic inthat they arecommon across geographic scales; in contrast, aspects of inherent <strong>vulnerability</strong> are more location specific. AsBrooks (2003) emphasizes, <strong>vulnerability</strong> only makes sense in thee context of a specific system<strong>and</strong> range ofhazards, that is, <strong>vulnerability</strong> is “placebased” in that the scale off <strong>vulnerability</strong> <strong>assessment</strong> should match thescale of the decision-making (Schröter, Polsky et al. 2005).Mitigationmeasures aredirected toward reducing drivers of <strong>climate</strong> <strong>change</strong>; that is, reducing emissions ofCO 2 <strong>and</strong> other green house gases (GHG) or enhancing CO 2 sequestration. We examine some mitigationpolicies (Reducing Emissions from Deforestation <strong>and</strong> Degradation plus biodiversity or REDD+; CleanDevelopment Mechanism or CDM), strategies (conservation/low carbon agriculture, fire management, lowcarbon development), <strong>and</strong> practices (capturing <strong>and</strong>using naturall gas instead of flaring, biofuels). Oneimplicationof our approach is that <strong>adaptation</strong> measures are directed toward reducing <strong>vulnerability</strong>, whetherinherent, social, or both(Sarewitz, Pielke Jr et al. 2003). We examine <strong>vulnerability</strong> reductionfor threeresource sectors (agriculture, forestry, <strong>and</strong> fisheries) <strong>and</strong> locally sustainable <strong>adaptation</strong> measures for reducingsocial <strong>vulnerability</strong>.GHANA CLIMATE CHANGE VULNERABILITY ANDADAPTATION ASSESSMENT19
Mean Annual Precipitation (mm)Mean Precipitation (mm)250020002092.7150010009921115.31301.3 1303.4890.25000SudanGuineaTransition DeciduousEvergreenCoastalSavannaSavannaForestForestSavannaSource: Minia, 2008Figure 3.2 Mean annual precipitation (mm) estimated from a baseline periodfrom 1961-2000 for each of 6 eco-climatic zones in Ghana7006005004003002001000Jan Feb Mar Apr May Jun Jul Aug Sep Oct Nov DecSudan Savanna Guinea Savanna TransitionDeciduous Forest Evergreen Forest Coastal SavannaSource: Minia, 2008Figure 3.3 Mean monthly precipitation (mm) estimated from a baseline period 1961-2000for each of 6 eco-climatic zones in Ghana22 GHANA CLIMATE CHANGE VULNERABILITY AND ADAPTATION ASSESSMENT
Mean Annual Temperature (C)2928.528.62827.52726.527.52726.4 26.426.92625.525SudanGuineaTransition DeciduousEvergreenCoastalSavannaSavannaForestForestSavannaData from Minia, 2008Figure 3.4 Mean annual temperatures (°C) estimated from a baseline periodfrom 1961-2000 for each of 6 eco-climatic zones in GhanaGHANA CLIMATE CHANGE VULNERABILITY AND ADAPTATION ASSESSMENT 23
Mean Temperature (C)34323028262422Jan Feb Mar Apr May Jun Jul Aug Sep Oct Nov DecSudan Savanna Guinea Savanna TransitionDeciduous Forest Evergreen Forest Coastal SavannaSource: Minia, 2008Figure 3.5 Mean monthly temperatures (°C) estimated from a baseline period from 1961-2000 for each of 6 eco-climatic zones in GhanaCLIMATE TRENDS AND MODELED CLIMATE CHANGE: SOURCESWe consulted two primary <strong>and</strong> several secondary sources that summarized recent <strong>climate</strong> trends <strong>and</strong> modeled<strong>climate</strong> <strong>change</strong> in order to provide context for our <strong>assessment</strong>. We also ran a series of atmosphere-oceancoupled global <strong>climate</strong> models (AOGCMs) based on data from seven meteorological stations (50 kmprojections) arrayed across different eco-climatic zones in Ghana. Global <strong>climate</strong> model output from theWorld Climate Research Programme's (WCRPs) Coupled Model Intercomparison Project Phase 3 (CMIP3)multi-model dataset (Meehl et al., 2007) were downscaled as described by Maurer et al. (2009) using the biascorrection/spatialdownscaling method (Wood et al., 2004) to a 0.5° grid, based on the 1950-1999 griddedobservations of Adam <strong>and</strong> Lettenmaier (2003).First as a primary source, we used the country-level <strong>climate</strong> data summary report for Ghana (McSweeney etal., not dated a) prepared for the UNDP National Communication Support Programme (NSCP) <strong>and</strong> the UKGovernment Department for International Development (DFID). Second, we consulted <strong>climate</strong> datasummaries <strong>and</strong> <strong>change</strong> scenarios developed for each of six eco-climatic zones (i.e., Sudan Savanna, GuineaSavanna, Transitional Zone, Deciduous Forest, Coastal Savanna, <strong>and</strong> Rain Forest) in Ghana by theEnvironmental Protection Agency (EPA) <strong>and</strong> Ghana Meteorological Agency (GMA) (Minia 2008, pers.comm.) under the Netherl<strong>and</strong>s Climate Assistant Programme (NCAP) for use in an <strong>assessment</strong> of <strong>climate</strong><strong>change</strong> impacts, <strong>vulnerability</strong>, <strong>and</strong> <strong>adaptation</strong> (Agyemang-Bonsu, 2008). We also used a peer-reviewedanalysis of trends in rainfall in Ghana based on meteorological data from 1951-2000 from stations across thecountry (Owusu <strong>and</strong> Waylen, 2009). In that work, the country was divided into five meteorological zones,which corresponded approximately to eco-climatic zones of Minia (2008) as follows: Guinea <strong>and</strong> SudanSavanna zones combined, the Transitional Zone, Deciduous Forest <strong>and</strong> Rain Forest zones combined, <strong>and</strong> aCoastal Savanna Zone.24 GHANA CLIMATE CHANGE VULNERABILITY AND ADAPTATION ASSESSMENT
The UNDP-NSCP country-level <strong>climate</strong> data summary for Ghana made use of existing <strong>climate</strong> data (1960-2003) to generate a series of <strong>climate</strong> observations <strong>and</strong> multi-model projections made available through theWCRP CMIP3 (McSweeney et al., not dated a, b). Specifically the report provides a set of maps <strong>and</strong> diagramsillustrating the observed <strong>and</strong> projected <strong>climate</strong> of Ghana. An area‐average time series shows observed <strong>climate</strong>combined with model‐simulated recent <strong>and</strong> future <strong>climate</strong> under three Special Report on Emissions Scenarios(SRES) emissions scenarios (A2, A1B, <strong>and</strong> B1; explained below). For the models, the series depicts the recent<strong>climate</strong> <strong>and</strong> future <strong>change</strong>s as a “plume” that encompasses the range of the 15-model ensemble under eachscenario to demonstrate the degree of model uncertainty. A narrative summarizes the data in the figures <strong>and</strong>places it in the context of the country's general <strong>climate</strong>. In addition, maps depict projected <strong>change</strong>s for 10‐year‐average “time‐slices” for the 2030s, 2060s, <strong>and</strong> 2090s under SRES emissions scenario A21 on a 2.5 x2.5° grid demonstrating spatial variations in <strong>change</strong> across the country. The ensemble median <strong>change</strong> <strong>and</strong> theensemble range are given for each grid box. The report also includes a summary table of observed trends <strong>and</strong>projected <strong>change</strong>, averaged over the whole country, 2030s, 2060s, <strong>and</strong> 2090s under SRES emissions scenariosA2, A1B, <strong>and</strong> B1. In addition, the report includes a section estimating sea level rise in Ghana. Finally, thereport summarizes the data <strong>and</strong> places it in the context of the Ghana’s general <strong>climate</strong> <strong>and</strong> knowninadequacies in <strong>climate</strong> model performance affecting that region (McSweeney et al. not dated a, b).The EPA-NCAP report for Ghana used existing <strong>climate</strong> data (1961-2000) to quantify observed trends <strong>and</strong> togenerate a series of <strong>climate</strong> observations <strong>and</strong> scenarios of modeled future <strong>climate</strong> (air temperature <strong>and</strong>precipitation), mean sea level, <strong>and</strong> sea-surface temperatures using outputs of two global <strong>climate</strong> models(ECHAM4, CSIRO) <strong>and</strong> a simple <strong>climate</strong> model (MAGICC/SCENGEN; Minia 2008). The report providesa set of maps, diagrams, <strong>and</strong> tables illustrating the observed <strong>climate</strong> <strong>and</strong> projected <strong>climate</strong> under an A1FIemission scenario. Graphs of mean annual observed temperature <strong>and</strong> total observed annual rainfall werepresented for each eco-climatic region for the 1961-2000 time period. Climate variable observed meanbaselines <strong>and</strong> projections (mean monthly <strong>and</strong> annual temperatures <strong>and</strong> precipitation) were developed for sixeco-climatic regions of Ghana <strong>and</strong> sea-level <strong>and</strong> sea-surface temperature projections were developed forGhana’s coast for comparison with base level conditions. Thirty-year climatological projections for thesevariables centered at 2020 (2006-2035), 2050 (2036-2065), <strong>and</strong> 2080 (2066-2095) were generated (10-yearintervals, 2010-2080, for sea-level <strong>change</strong> with respect to 1990) (Minia, 2008). Many of the tables in Minia(2008) depicting the 2020, 2050, <strong>and</strong> 2080 medium <strong>and</strong> upper boundary projections for air temperature <strong>and</strong>rainfall appear to have been truncated during printing or are not clearly labeled; however we were able toobtain the complete appendices (Z. Minia, pers. comm.). In the GMA-NCAP report, we also consultedsummarized trends of meteorological data from six coastal stations in Ghana, including mean annual airtemperature, sea-surface temperature, precipitation, <strong>and</strong> salinity (Dontwi et al., 2008).Our own projections of <strong>climate</strong> <strong>and</strong> rainfall were modeled from data at seven meteorological stations selectedas representative of eco-climatic zones in Ghana. The projections were modeled from availablemeteorological data in Accra (Coastal Savanna Zone), Kumasi (Deciduous Forest Zone), Tarkwa (Rain ForestZone), Techiman (Forest-Savanna Transition Zone), Tamale (Guinea Savanna Zone), Wallembelle (northernGuinea Savanna Zone), <strong>and</strong> Bawku (Sudan Savanna Zone). The models were run to project potential <strong>change</strong>in temperature <strong>and</strong> percentage <strong>change</strong> in rainfall for the dry (December-February) <strong>and</strong> wet seasons (June-August) at each station. The projections are for 2050 <strong>and</strong> 2080 <strong>and</strong> are based on an ensemble of 16AOGCMs. Potential <strong>change</strong>s (mean, st<strong>and</strong>ard deviation, minimum, <strong>and</strong> maximum) were estimated for threeemission scenarios (B1, A1B, A2). The B1 scenario represents the most conservative emissions scenario, theA1B an intermediate “balanced” scenario, <strong>and</strong> the A2 scenario, the most impact from greenhouse gases. As asummary, mean <strong>change</strong>s were estimated from the overall ensemble of 16 <strong>climate</strong> models across the threeemission scenarios.GHANA CLIMATE CHANGE VULNERABILITY AND ADAPTATION ASSESSMENT 25
RECENT CLIMATE TRENDSTEMPERATURESince 1960, for Ghana as a whole, mean annual temperature rose by 1.0°C, an average rate of 0.21°C/decade.The rate of increase was most rapid in April through June (about 0.27°C/decade) (McSweeney et al., no datea). The rate of increase generally has been more rapid in the northern than southern regions (Minia 2008;McSweeney et al., no date a). Five-year moving averages from 1961 to 2000 indicate about a 1°C increase inthe Sudan Savanna <strong>and</strong> Guinea Savanna zones <strong>and</strong>
For most eco-climatic zones, five-year moving averages also indicate a trend toward decreased total annualprecipitation from 1961 to 2000 (Minia, 2008). Over this period, mean decreases occurred in the GuineaSavanna Zone (~120 mm decrease), Deciduous Forest Zone (~240 mm), <strong>and</strong> Rain Forest Zone (~750 mm)(interpolated from graphs in Minia, 2008). Inspection of graphs (Minia, 2008) did not indicate upward ordownward trends in total annual precipitation for the Sudan Savanna or Transitional zones. Along the coastof Ghana, total annual precipitation showed a significant linear decrease from 1961 to 2000 (decrease about1000 mm) with a marked cycling of high <strong>and</strong> low rainfall years with an apparent six-year lag (Dontwi et al.,2008).Comparison of the mean annual rainfall differences between 1951-1970 <strong>and</strong> 1981-2000 at meteorologicalstations across Ghana also indicated less rainfall (Owusu <strong>and</strong> Waylen, 2009). Significantly less rainfalloccurred in the latter period in the Deciduous Forest <strong>and</strong> Rain Forest zones (mean decreases ranged from136.9 to 335.3 mm) <strong>and</strong> the coast (Accra station, mean decrease 260.5 mm). As a percentage of total annualrainfall, southwestern Ghana (i.e., ~Rain Forest Zone) experienced reductions in rainfall as high as 20 percent(300 mm), twice the proportion experienced in the savanna zones (Owusu <strong>and</strong> Waylen, 2009). Rainfalldecreased, but not significantly so, for most stations in the Transitional Zone (mean decrease of 115.1-169.8mm) <strong>and</strong> combined Sudan <strong>and</strong> Guinea savanna zones (77.3-93.3 mm) (Owusu <strong>and</strong> Waylen, 2009). Smallsample size (number of stations) may have lowered statistical power <strong>and</strong> hence, the ability to detect statisticaldifferences between the two time periods in those areas. Another analysis based on comparison of annualrainfall data between 1950-1970 <strong>and</strong> 1971-1990 showed significant decreases in rainfall in the Sudan <strong>and</strong>Guinea savanna zones (1.5 percent reduction at Tamale, 2.3 percent at Yendi, 7.2 percent at Navrongo, <strong>and</strong>11.3 percent at Wa) (Gyau-Boakye <strong>and</strong> Tumbulto, 2000).CLIMATE SCENARIOSCLIMATE PROJECTIONSIn predicting future climatic conditions, assumptions must be made about how the human component of the<strong>climate</strong> system will evolve over the course of the forecast period. This is typically accomplished by developingdifferent scenarios of anthropogenic influences, basically different rates of GHG emissions. These scenariosdo not represent predictions, but are instead alternative views of how the future may unfold. The IPCCdeveloped four different families of scenarios. This work will focus on three of those families described invarious IPCC documents (IPCC 2007).A2 - The A2 storyline <strong>and</strong> scenario family describes a very heterogeneous world. The underlying theme isself-reliance <strong>and</strong> preservation of local identities. Fertility patterns across regions converge very slowly, whichresults in high population growth. Economic development is primarily regionally oriented <strong>and</strong> per capitaeconomic growth <strong>and</strong> technological <strong>change</strong>s are more fragmented <strong>and</strong> slower than in other storylines.A1B1 - The A1 storyline <strong>and</strong> scenario family describes a future world of very rapid economic growth, lowpopulation growth, <strong>and</strong> the rapid introduction of new <strong>and</strong> more efficient technologies. Major underlyingthemes are convergence among regions, capacity building <strong>and</strong> increased cultural <strong>and</strong> social interactions with asubstantial reduction in regional differences in per capita income. The A1 scenario family develops into fourgroups that describe alternative directions of technological <strong>change</strong> in the energy system.B1 - The B1 storyline <strong>and</strong> scenario family describes a convergent world with the same low population growthas in the A1 storyline, but with rapid <strong>change</strong>s in economic structures toward a service <strong>and</strong> informationeconomy with reductions in material intensity <strong>and</strong> the introduction of clean <strong>and</strong> resource-efficienttechnologies. The emphasis is on global solutions to economic, social, <strong>and</strong> environmental sustainability,including improved equity, but without additional <strong>climate</strong> initiatives.The first set of projections of potential <strong>change</strong>s in temperature <strong>and</strong> precipitation presented are the result ofaveraging 16 atmosphere-ocean general circulation models (AOGCMs) that have been downscaled to ahorizontal grid size of ~50 km following the statistical methodology described in Maurer et al. (2009). TheGHANA CLIMATE CHANGE VULNERABILITY AND ADAPTATION ASSESSMENT 27
use of an ensemble of models helps limit the influence of any bias present in any one model. Temperature<strong>and</strong> precipitation data are available from http://www.<strong>climate</strong>wizard.org .It should be noted that most GCMs have difficulty correctly reproducing a number of key features of theatmospheric circulation patterns over West Africa which contribute to uncertainty in estimates of futurerainfall (Douville et al., 2006; Joly et al., 2007; Caminade <strong>and</strong> Terray, 2009). Neither the Third nor FourthAssessment Report of the IPCC reached a consensus regarding the sign or magnitude of predicted <strong>change</strong>s inprecipitation over West Africa during this century (Hulme et al., 2001; Bernstein et al., 2007). The WestAfrican Monsoon is difficult for coarse resolution GCMs to describe considering the wide range ofmechanisms for variability acting at various time <strong>and</strong> space scales from global teleconnection patterns relatedto the El Nĩno-Southern Oscillation ENSO (Caminade <strong>and</strong> Terray, 2010) or the Atlantic Multi-DecadalOscillation (Shanahan et al., 2009) to the coupling of soil moisture to intra-seasonal variability (Lavender etal., 2010). Druyan (2010) provides a convincing argument for the need of more detailed (higher resolution)modeling to properly capture critical processes in this region. For this reason we focus on the <strong>change</strong>spredicted by an ensemble of <strong>climate</strong> models as this provides a means of examining not only the projected<strong>change</strong> in temperature <strong>and</strong> precipitation but also provides a measure of confidence in these projections.TEMPERATURE PROJECTIONSFrom country-wide projections for Ghana (McSweeney et al., no date a), the mean annual temperature isprojected to increase by 1.0 to 3.0°C by the 2060s <strong>and</strong> 1.5 to 5.2°C by the 2090s. The range of projections bythe 2090s under any one emission scenario used in the UNDP-NSCP work is about 1.5‐2.5°C. The projectedrate of warming is more rapid in the northern inl<strong>and</strong> regions of Ghana than the coastal regions (McSweeneyet al., no date a). All projections indicated substantial increases in the frequency of days <strong>and</strong> nights that areconsidered “Hot” in current <strong>climate</strong>, but the range of projections between different models was large.Annually, projections indicated that “Hot” days will occur on 18‐59 percent of days by the 2060s <strong>and</strong> 25‐90percent of days by the 2090s. Days considered “Hot” by current <strong>climate</strong> st<strong>and</strong>ards for their season mayincrease most rapidly in July through September occurring on 34‐99 percent of days of the season by the2090s. Nights considered “Hot” for the annual <strong>climate</strong> of 1970‐99 are projected to occur on 28‐79 percent ofnights by the 2060s <strong>and</strong> 39‐90 percent of nights by the 2090s. Nights considered “Hot” for each season by1970‐99 st<strong>and</strong>ards are projected to increase most rapidly in July through September occurring on 52‐99percent of nights in every season by the 2090s. Most projections indicated decreases in the frequency of days<strong>and</strong> nights considered “Cold” in the current <strong>climate</strong>. “Cold” days <strong>and</strong> nights are projected to occur on
increases generally were projected to occur in June, July, <strong>and</strong> August. Attempts to use current trends toforecast sea-surface temperature to 2021 were inconclusive (Dontwi et al., 2008, but see section 6.B. “FisheryResources <strong>and</strong> Overfishing”).Our projections of <strong>change</strong>s in temperature for meteorological stations across Ghana also indicated continuedincreases for 2050 <strong>and</strong> 2080. Notably, regardless of emission scenario the AOGCMs are consistent inpredicting slightly warmer conditions with only minor differences between the wet <strong>and</strong> dry seasons (Tables3.1-3.7).Perhaps the best estimate of the impact of future <strong>climate</strong> conditions on temperature is provided by the overallensemble of 16 <strong>climate</strong> models across the three emission scenarios which suggest the following increases intemperature.Accra (Coastal Savanna Zone): Wet Season,1.68 ± 0.38°C by 2050 <strong>and</strong> 2.54 ± 0.75°C by 2080; DrySeason, 1.74 ± 0.60°C by 2050 <strong>and</strong> 2.71 ± 0.91°C by 2080 during the dry season Kumasi (Deciduous Forest Zone): Wet Season, 1.71 ± 0.39°C by 2050 <strong>and</strong> 2.60 ± 0.77°C by 2080;Dry Season, 1.81 ± 0.68°C by 2050 <strong>and</strong> 2.83 ± 1.04°C by 2080Tarkwa (Rain Forest Zone): Wet Season, 1.69 ± 0.37°C by 2050 <strong>and</strong> 2.56 ± 0.75°C by 2080; DrySeason, 1.76 ± 0.67°C by 2050 <strong>and</strong> 2.76 ± 1.01°C by 2080Techiman (Forest-Savanna Transition Zone): Wet Season, 1.77 ± 0.43°C by 2050 <strong>and</strong> 2.71 ± 0.85°Cby 2080; Dry Season, 1.95 ± 0.79°C by 2050 <strong>and</strong> 3.05 ± 1.20°C by 2080 Tamale (Guinea Savanna Zone): Wet Season, 1.84 ± 0.46°C by 2050 <strong>and</strong> 2.83 ± 0.91°C by 2080;Dry Season 2.05 ± 0.75°C by 2050 <strong>and</strong> 3.18 ± 1.18°C by 2080 Wallembelle (northernmost Guinea Savanna Zone): Wet Season, 1.92 ± 0.52°C by 2050 <strong>and</strong> 2.96 ±0.98°C by 2080; Dry Season, 2.10 ± 0.71°C by 2050 <strong>and</strong> 3.27 ± 1.11°C by 2080Bawku (Sudan Savanna Zone): Wet Season, 1.92 ± 0.53°C by 2050 <strong>and</strong> 2.97 ± 0.98°C by 2080: DrySeason , 2.11 ± 0.68°C by 2050 <strong>and</strong> 3.25 ± 1.08°C by 2080Potential <strong>change</strong> in temperature (°C) <strong>and</strong> percentage <strong>change</strong> in rainfall for the dry (Dec-Feb) <strong>and</strong> wet (Jun-Aug) seasons at Accra (Coastal Savanna Zone) in 2050 <strong>and</strong> 2080 based on an ensemble of 16 atmosphereoceancoupled global <strong>climate</strong> models across three emissions scenarios (B1, A1B, A2). For each season, valuesare given by emission scenario <strong>and</strong> an overall mean across emission scenarios. For each parameter(temperature <strong>and</strong> precipitation) the ensemble average, st<strong>and</strong>ard deviation (Std Dev), minimum (Min) <strong>and</strong>maximum (Max) values are presented.GHANA CLIMATE CHANGE VULNERABILITY AND ADAPTATION ASSESSMENT 29
Table 3.1 Potential <strong>change</strong> in temperature <strong>and</strong> % <strong>change</strong> in rainfall, AccraAccra Dry Season Wet SeasonB1 A1B A2 Mean B1 A1B A2 Mean2050 Temperature Mean 1.41 1.95 1.86 1.74 1.36 1.85 1.82 1.68Std Dev 0.44 0.51 0.69 0.60 0.31 0.32 0.30 0.38Min 0.48 1.00 -0.17 -0.17 0.64 1.21 1.15 0.64Max 2.11 2.80 2.79 2.80 1.90 2.45 2.30 2.452080 Temperature Mean 1.95 2.91 3.27 2.71 1.82 2.67 3.13 2.54Std Dev 0.52 0.60 1.00 0.91 0.43 0.53 0.59 0.75Min 1.28 2.01 0.54 0.54 0.86 1.55 1.82 0.86Max 2.88 3.91 4.93 4.93 2.69 3.87 4.29 4.292050 Precipitation Mean 3.69 3.13 2.75 3.19 2.00 1.75 4.19 2.65Std Dev 13.40 18.31 17.36 16.14 14.63 14.53 13.47 13.96Min -19.00 -25.00 -23.00 -25.00 -32.00 -33.00 -27.00 -33.00Max 36.00 42.00 49.00 49.00 34.00 29.00 30.00 34.002080 Precipitation Mean 6.75 8.38 10.69 8.60 4.81 4.50 2.31 3.88Std Dev 17.51 27.78 26.84 24.02 17.23 22.47 19.36 19.41Min -19.00 -40.00 -40.00 -40.00 -41.00 -52.00 -47.00 -52.00Max 50.00 68.00 58.00 68.00 29.00 44.00 36.00 44.00Potential <strong>change</strong> in temperature (°C) <strong>and</strong> percentage <strong>change</strong> in rainfall for the dry (Dec-Feb) <strong>and</strong> wet (Jun-Aug) seasons at Kumasi (Deciduous Forest Zone) in 2050 <strong>and</strong> 2080 based on an ensemble of 16 atmosphereoceancoupled global <strong>climate</strong> models across three emissions scenarios (B1, A1B, A2). For each season, valuesare given by emission scenario <strong>and</strong> an overall mean across emission scenarios. For each parameter(temperature <strong>and</strong> precipitation) the ensemble average, st<strong>and</strong>ard deviation (Std Dev), minimum (Min) <strong>and</strong>maximum (Max) values are presented.30 GHANA CLIMATE CHANGE VULNERABILITY AND ADAPTATION ASSESSMENT
Table 3.2 Potential <strong>change</strong> in temperature <strong>and</strong> % <strong>change</strong> in precipitation, KumasiKumasi Dry Season Wet SeasonB1 A1B A2 Mean B1 A1B A2 Mean2050 Temperature Mean 1.45 2.05 1.93 1.81 1.38 1.89 1.85 1.71Std Dev 0.52 0.57 0.81 0.68 0.32 0.32 0.31 0.39Min 0.29 0.81 -0.42 -0.42 0.67 1.25 1.19 0.67Max 2.14 2.90 2.94 2.94 1.96 2.52 2.37 2.522080 Temperature Mean 2.01 3.04 3.43 2.83 1.85 2.74 3.21 2.60Std Dev 0.61 0.70 1.17 1.04 0.44 0.55 0.61 0.77Min 1.25 1.87 0.16 0.16 0.88 1.59 1.85 0.88Max 3.06 4.12 5.20 5.20 2.78 4.00 4.40 4.402050 Precipitation Mean 4.56 6.56 5.81 5.65 0.25 1.63 3.31 1.73Std Dev 15.02 20.89 23.54 19.72 12.78 14.93 13.14 13.42Min -24.00 -21.00 -27.00 -27.00 -28.00 -29.00 -23.00 -29.00Max 31.00 50.00 75.00 75.00 29.00 35.00 29.00 35.002080 Precipitation Mean 8.81 10.13 11.38 10.10 4.31 4.13 1.13 3.19Std Dev 16.71 27.04 28.69 24.21 16.33 22.40 18.79 18.98Min -23.00 -39.00 -43.00 -43.00 -36.00 -48.00 -40.00 -48.00Max 44.00 70.00 57.00 70.00 32.00 45.00 32.00 45.00Potential <strong>change</strong> in temperature (°C) <strong>and</strong> percentage <strong>change</strong> in rainfall for the dry (Dec-Feb) <strong>and</strong> wet (Jun-Aug) seasons at Tarkwa (Rain Forest Zone) in 2050 <strong>and</strong> 2080 based on an ensemble of 16 atmosphere-oceancoupled global <strong>climate</strong> models across three emissions scenarios (B1, A1B, A2). For each season, values aregiven by emission scenario <strong>and</strong> an overall mean across emission scenarios. For each parameter (temperature<strong>and</strong> precipitation) the ensemble average, st<strong>and</strong>ard deviation (Std Dev), minimum (Min) <strong>and</strong> maximum (Max)values are presented.Table 3.3 Potential <strong>change</strong> in temperature <strong>and</strong> % <strong>change</strong> in precipitation, TarkwaTarkwa Dry Season Wet SeasonB1 A1B A2 Mean B1 A1B A2 Mean2050 Temperature Mean 1.41 1.99 1.88 1.76 1.36 1.86 1.83 1.69Std Dev 0.51 0.55 0.79 0.67 0.30 0.30 0.30 0.37Min 0.27 0.77 -0.41 -0.41 0.68 1.25 1.19 0.68Max 2.15 2.84 2.90 2.90 1.86 2.40 2.27 2.402080 Temperature Mean 1.96 2.98 3.34 2.76 1.83 2.70 3.16 2.56Std Dev 0.59 0.68 1.13 1.01 0.42 0.51 0.58 0.75Min 1.18 1.84 0.19 0.19 0.87 1.59 1.85 0.87Max 2.91 4.05 5.07 5.07 2.64 3.81 4.22 4.222050 Precipitation Mean 4.06 4.44 3.38 3.96 1.25 2.81 3.69 2.58Std Dev 13.80 19.24 17.08 16.50 12.43 14.01 12.72 12.83Min -16.00 -26.00 -21.00 -26.00 -27.00 -29.00 -24.00 -29.00Max 37.00 39.00 45.00 45.00 25.00 31.00 24.00 31.002080 Precipitation Mean 8.81 9.38 11.44 9.88 4.69 3.56 0.69 2.98Std Dev 17.79 28.03 26.93 24.18 15.01 18.22 16.79 16.45Min -21.00 -45.00 -41.00 -45.00 -38.00 -45.00 -42.00 -45.00Max 51.00 69.00 61.00 69.00 25.00 31.00 24.00 31.00Potential <strong>change</strong> in temperature (°C) <strong>and</strong> percentage <strong>change</strong> in rainfall for the dry (Dec-Feb) <strong>and</strong> wet (Jun-Aug) seasons at Techiman (Forest-Savanna Transition Zone) in 2050 <strong>and</strong> 2080 based on an ensemble of 16atmosphere-ocean coupled global <strong>climate</strong> models across three emissions scenarios (B1, A1B, A2). For eachseason, values are given by emission scenario <strong>and</strong> an overall mean across emission scenarios. For eachGHANA CLIMATE CHANGE VULNERABILITY AND ADAPTATION ASSESSMENT 31
parameter (temperature <strong>and</strong> precipitation) the ensemble average, st<strong>and</strong>ard deviation (Std Dev), minimum(Min) <strong>and</strong> maximum (Max) values are presented.Table 3.4 Potential <strong>change</strong> in temperature <strong>and</strong> % <strong>change</strong> in precipitation, TechimanTechiman Dry Season Wet SeasonB1 A1B A2 Mean B1 A1B A2 Mean2050 Temperature Mean 1.56 2.22 2.07 1.95 1.42 1.97 1.92 1.77Std Dev 0.60 0.66 0.94 0.79 0.36 0.37 0.35 0.43Min 0.25 0.76 -0.59 -0.59 0.67 1.28 1.23 0.67Max 2.47 3.17 3.43 3.43 2.15 2.78 2.59 2.782080 Temperature Mean 2.18 3.26 3.70 3.05 1.92 2.87 3.35 2.71Std Dev 0.74 0.84 1.39 1.20 0.50 0.64 0.68 0.85Min 1.31 1.83 -0.10 -0.10 0.87 1.62 1.88 0.87Max 3.46 4.88 5.60 5.60 3.09 4.41 4.78 4.782050 Precipitation Mean 7.06 9.81 9.00 8.63 -2.31 -0.94 0.06 -1.06Std Dev 17.30 24.55 27.33 22.97 13.22 15.36 14.92 14.25Min -32.00 -26.00 -29.00 -32.00 -27.00 -24.00 -24.00 -27.00Max 34.00 63.00 83.00 83.00 27.00 31.00 25.00 31.002080 Precipitation Mean 14.00 20.31 20.19 18.17 0.31 0.13 -2.94 -0.83Std Dev 21.20 34.38 38.91 31.82 16.79 22.46 20.60 19.71Min -24.00 -36.00 -53.00 -53.00 -35.00 -46.00 -39.00 -46.00Max 57.00 98.00 96.00 98.00 31.00 36.00 29.00 36.00Potential <strong>change</strong> in temperature (°C) <strong>and</strong> percentage <strong>change</strong> in rainfall for the dry (Dec-Feb) <strong>and</strong> wet (Jun-Aug) seasons at Tamale (Guinea Savanna Zone) in 2050 <strong>and</strong> 2080 based on an ensemble of 16 atmosphereoceancoupled global <strong>climate</strong> models across three emissions scenarios (B1, A1B, A2). For each season, valuesare given by emission scenario <strong>and</strong> an overall mean across emission scenarios. For each parameter(temperature <strong>and</strong> precipitation) the ensemble average, st<strong>and</strong>ard deviation (Std Dev), minimum (Min) <strong>and</strong>maximum (Max) values are presented.Table 3.5 Potential <strong>change</strong> in temperature <strong>and</strong> % <strong>change</strong> in precipitation, TamaleTamale Dry Season Wet SeasonB1 A1B A2 Mean B1 A1B A2 Mean2050 Temperature Mean 1.65 2.32 2.17 2.05 1.49 2.06 1.99 1.84Std Dev 0.56 0.63 0.88 0.75 0.39 0.40 0.39 0.46Min 0.47 0.97 -0.34 -0.34 0.68 1.30 1.23 0.68Max 2.43 3.16 3.46 3.46 2.31 2.92 2.74 2.922080 Temperature Mean 2.31 3.36 3.86 3.18 2.01 3.00 3.49 2.83Std Dev 0.66 0.86 1.35 1.18 0.55 0.72 0.74 0.91Min 1.37 2.01 0.20 0.20 0.85 1.61 1.86 0.85Max 3.65 4.80 5.94 5.94 3.25 4.65 5.01 5.012050 Precipitation Mean 14.50 11.25 23.63 16.46 -1.88 -2.13 -0.38 -1.46Std Dev 30.32 23.32 31.36 28.44 8.52 11.16 11.67 10.35Min -47.00 -21.00 -26.00 -47.00 -20.00 -19.00 -19.00 -20.00Max 63.00 48.00 78.00 78.00 12.00 26.00 21.00 26.002080 Precipitation Mean 15.63 33.13 33.38 27.38 -1.44 -1.88 -3.25 -2.19Std Dev 29.19 43.41 52.18 42.58 11.87 16.91 17.31 15.25Min -28.00 -39.00 -53.00 -53.00 -28.00 -36.00 -31.00 -36.00Max 73.00 139.00 173.00 173.00 22.00 32.00 31.00 32.00Potential <strong>change</strong> in temperature (°C) <strong>and</strong> percentage <strong>change</strong> in rainfall for the dry (Dec-Feb) <strong>and</strong> wet (Jun-Aug) seasons at Walembelle (northern Guinea Savanna Zone) in 2050 <strong>and</strong> 2080 based on an ensemble of 16atmosphere-ocean coupled global <strong>climate</strong> models across three emissions scenarios (B1, A1B, A2). For eachseason, values are given by emission scenario <strong>and</strong> an overall mean across emission scenarios. For each32 GHANA CLIMATE CHANGE VULNERABILITY AND ADAPTATION ASSESSMENT
parameter (temperature <strong>and</strong> precipitation) the ensemble average, st<strong>and</strong>ard deviation (Std Dev), minimum(Min) <strong>and</strong> maximum (Max) values are presented.Table 3.6 Potential <strong>change</strong> in temperature <strong>and</strong> % <strong>change</strong> in precipitation, WalembelleWalembelle Dry Season Wet SeasonB1 A1B A2 Mean B1 A1B A2 Mean2050 Temperature Mean 1.67 2.37 2.26 2.10 1.55 2.17 2.04 1.92Std Dev 0.51 0.61 0.81 0.71 0.43 0.47 0.45 0.52Min 0.50 0.92 -0.21 -0.21 0.72 1.17 1.12 0.72Max 2.22 3.27 3.05 3.27 2.39 3.01 2.84 3.012080 Temperature Mean 2.39 3.45 3.98 3.27 2.09 3.14 3.65 2.96Std Dev 0.55 0.77 1.24 1.11 0.59 0.81 0.81 0.98Min 1.62 1.99 0.44 0.44 0.85 1.44 1.78 0.85Max 3.66 4.73 5.82 5.82 3.33 4.75 5.12 5.122050 Precipitation Mean 17.56 16.75 28.56 20.96 -0.56 -1.19 0.50 -0.42Std Dev 35.68 31.82 42.37 36.50 6.90 10.26 9.78 8.93Min -44.00 -34.00 -20.00 -44.00 -14.00 -18.00 -18.00 -18.00Max 68.00 82.00 139.00 139.00 11.00 21.00 15.00 21.002080 Precipitation Mean 14.50 35.69 43.56 31.25 -0.88 -1.00 -1.31 -1.06Std Dev 39.49 50.80 73.38 56.51 8.92 13.13 13.55 11.79Min -24.00 -33.00 -61.00 -61.00 -19.00 -24.00 -25.00 -25.00Max 141.00 153.00 235.00 235.00 16.00 24.00 23.00 24.00Potential <strong>change</strong> in temperature (°C) <strong>and</strong> percentage <strong>change</strong> in rainfall for the dry (Dec-Feb) <strong>and</strong> wet (Jun-Aug) seasons at Bawku (Sudan Savanna Zone) in 2050 <strong>and</strong> 2080 based on an ensemble of 16 atmosphereoceancoupled global <strong>climate</strong> models across three emissions scenarios (B1, A1B, A2). For each season, valuesare given by emission scenario <strong>and</strong> an overall mean across emission scenarios. For each parameter(temperature <strong>and</strong> precipitation) the ensemble average, st<strong>and</strong>ard deviation (Std Dev), minimum (Min) <strong>and</strong>maximum (Max) values are presented.Table 3.7 Potential <strong>change</strong> in temperature <strong>and</strong> % <strong>change</strong> in rainfall, BawkuBawku Dry Season Wet SeasonB1 A1B A2 Mean B1 A1B A2 Mean2050 Temperature Mean 1.69 2.36 2.27 2.11 1.54 2.18 2.05 1.92Std Dev 0.49 0.58 0.77 0.68 0.44 0.49 0.46 0.53Min 0.73 1.20 0.02 0.02 0.68 1.13 1.08 0.68Max 2.27 3.30 3.07 3.30 2.37 3.07 2.78 3.072080 Temperature Mean 2.37 3.42 3.95 3.25 2.11 3.15 3.65 2.97Std Dev 0.54 0.75 1.20 1.08 0.57 0.82 0.83 0.98Min 1.55 2.14 0.60 0.60 0.89 1.38 1.72 0.89Max 3.61 4.65 5.88 5.88 3.26 4.70 5.08 5.082050 Precipitation Mean 17.31 11.31 21.56 16.73 -0.13 -0.81 0.63 -0.10Std Dev 32.37 28.69 36.81 32.37 7.33 10.89 10.81 9.63Min -51.00 -28.00 -31.00 -51.00 -13.00 -20.00 -20.00 -20.00Max 73.00 72.00 107.00 107.00 14.00 23.00 19.00 23.002080 Precipitation Mean 18.19 35.13 34.19 29.17 -0.75 -0.56 -0.75 -0.69Std Dev 33.94 55.97 64.68 52.57 9.43 14.42 15.11 12.94Min -23.00 -41.00 -60.00 -60.00 -18.00 -25.00 -28.00 -28.00Max 105.00 166.00 193.00 193.00 19.00 30.00 29.00 30.00PRECIPITATION PROJECTIONSProjections of mean annual rainfall averaged over the country (UNDP report) from different models in theensemble project a wide range of <strong>change</strong>s in precipitation for Ghana with about half the models projectingincreases <strong>and</strong> half decreases (McSweeney et al., no date a). Seasonally, the projections tend towards decreasesGHANA CLIMATE CHANGE VULNERABILITY AND ADAPTATION ASSESSMENT 33
in January through June rainfall <strong>and</strong> increases in July through December rainfall. The proportion of totalannual rainfall that falls in “Heavy” events tends towards increases in the ensemble projections. Seasonally,this varies between tendencies to decrease in January through April to increases in July through December,but the range of <strong>change</strong>s projected by the ensemble includes both increases <strong>and</strong> decreases in all seasons.Projected <strong>change</strong>s in 1‐ <strong>and</strong> 5‐day rainfall maxima tend towards increases, but projections range betweenincreases <strong>and</strong> decreases in all seasons.At the eco-climatic level (Minia, 2008), rainfall is projected to decrease at 2020, 2050, <strong>and</strong> 2080 in all regions.Percentage decrease in rainfall at each projection period tend to increase from north to south from -1.1, -6.7,-12.8 percent in the Sudan Savanna Zone to -3.1, -12.3, -20.5 percent in the Coastal Savanna Zone for periods2020, 2050, <strong>and</strong> 2080, respectively. Absolute <strong>change</strong> in rainfall is projected to be highest in the DeciduousForest <strong>and</strong> Rain Forest Zones (243 <strong>and</strong> 423 mm decrease by 2080, respectively). Upper boundary projectionsindicate an annual decrease of 32.6 percent annual precipitation in the Sudan Savanna Zone <strong>and</strong> a 26.8percent decrease in the remaining eco-climatic zones. Inspection of the projection tables (Minia 2008 <strong>and</strong>pers. comm., Appendix 1.2; see Appendices V-X) reveals the same monthly percentage <strong>change</strong>s inprecipitation were applied to all but the Sudan Savanna Zone. Similar to the caveats about temperatureprojections for eco-climatic zones (see previous), scaling <strong>and</strong> suitability of the rainfall projections at the ecoclimaticlevel is questionable.Our AOGCM modeling projections of rainfall among seven representative meteorological stations gavemixed <strong>and</strong> inconclusive results (Tables 3.1-3.7). AOGCM predictions of precipitation lack any sense ofconsistency, predicting both decreases <strong>and</strong> increases in rainfall in at each station. The results are summarizedfor each station as follows:Accra (Coastal Savanna Zone): Forecasted <strong>change</strong>s in precipitation ranged from 52 percentdecreases to 44 percent increases in wet season rainfall by 2080. The overall ensemble predictionacross emission scenarios gives a slight increase in wet season rainfall of 2.65 ± 13.96 percent by2050 <strong>and</strong> 3.88 ± 19.41 percent by 2080. The variability among the models' precipitation <strong>change</strong>s isnot very different from the inter-annual variability currently experienced in the region.Kumasi (Deciduous Forest Zone): Forecasted <strong>change</strong>s in precipitation range from 48 percentdecreases to 45 percent increases in wet season rainfall by 2080. The overall ensemble predictionacross emission scenarios gives a slight increase in wet season rainfall of 1.73 ± 13.42 percent by2050 <strong>and</strong> 3.19 ± 18.98 percent by 2080. The variability among the models' precipitation <strong>change</strong>s isnot very different from the inter-annual variability currently experienced in the region. The A2scenario, which generally shows the largest greenhouse gas impact, predicts the weakest increase inwet season rainfall, 1.13 percent.Tarkwa (Rain Forest Zone): Forecasted <strong>change</strong>s in precipitation range from 45 percent decreasesto 31 percent increases in wet season rainfall. The overall ensemble prediction across emissionscenarios gives a slight increase in wet season rainfall of 2.58 ± 12.83 percent by 2050 <strong>and</strong> 2.98 ±16.45 percent by 2080. The variability among the models' precipitation <strong>change</strong>s is not very differentfrom the inter-annual variability currently experienced in the region. Techiman (Forest-Savanna Transition Zone): Forecasted <strong>change</strong>s in precipitation range from 46percent decreases to 36 percent increases in wet season rainfall. The overall ensemble predictionacross emission scenarios gives a slight decrease in wet season rainfall of -1.06 ± 14.25 percent by2050 <strong>and</strong> -0.83 ± 19.71 percent by 2080. The variability among the models' precipitation <strong>change</strong>s isnot very different from the inter-annual variability currently experienced in the region. The A2scenario, which generally shows the largest greenhouse gas impact, predicts the largest decrease inwet season rainfall, -2.94 percent.Tamale (Guinea Savanna Zone): Forecasted <strong>change</strong>s in precipitation range from 36 percentdecreases to 32 percent increases in wet season rainfall. The overall ensemble prediction across34 GHANA CLIMATE CHANGE VULNERABILITY AND ADAPTATION ASSESSMENT
emission scenarios gives a decrease in wet season rainfall of -1.46 ± 10.35 percent by 2050 <strong>and</strong> -2.19± 15.25 percent by 2080. The variability among the models' precipitation <strong>change</strong>s is not verydifferent from the inter-annual variability currently experienced in the region. The Northern Regionwhere Tamale is located is the southern-most region in Ghana to show a consistent trend towarddecreased rainfall. Walembelle (northern Guinea Savanna Zone): Forecasted <strong>change</strong>s in precipitation range from 25percent decreases to 24 percent increases in wet season rainfall. The overall ensemble predictionacross emission scenarios gives a slight decrease in wet season rainfall of -0.42 ± 8.93 percent by2050 <strong>and</strong> 1.06 ± 11.79 percent by 2080. The variability among the models' precipitation <strong>change</strong>s isnot very different from the inter-annual variability currently experienced in the region.Bawku (Sudan Savanna Zone): Forecasted <strong>change</strong>s in precipitation range from 28 percentdecreases to 30 percent increases in wet season rainfall. The overall ensemble prediction acrossemission scenarios gives a slight decrease in wet season rainfall of -0.10 ± 9.63 percent by 2050 <strong>and</strong> -0.69 ± 12.94 percent by 2080. The variability among the models' precipitation <strong>change</strong>s is not verydifferent from the inter-annual variability currently experienced in the region.SEA-LEVEL PROJECTIONSThe coastal regions of Ghana may be vulnerable to sea‐level rise, <strong>and</strong> two different <strong>climate</strong> modeling effortsare in reasonably close agreement. By the 2090s, sea level is projected by the UNDP-NSCP <strong>climate</strong> models torise by the following levels relative to the 1980‐1999 sea level: 0.13-0.43 m under SRES B1; 0.16-0.53 munder SRES A1B; <strong>and</strong> 0.18-0.56 m under SRES A2 (McSweeney et al., no date a). With respect to the 1990mean sea-level, the EPA-NCAP <strong>climate</strong> modeling (Minia 2008) also projected sea levels to increase. Thoseestimates range from 0.36 m (lower <strong>and</strong> upper boundaries of 0.16-0.60 cm) in 2010 to 0.35 m (0.16-0.58 m) in2080 (under SRES A1F1).CLIMATE VARIABILITYThe <strong>climate</strong> of West Africa is subject to considerable variability across a range of space <strong>and</strong> time scales (Lebelet al., 2000). This variability is linked to variations in the movement <strong>and</strong> intensity of the ITCZ as well asvariations in the timing <strong>and</strong> intensity of the West African Monsoon. The most documented cause of thesevariations on an inter-annual timescale is the El Niño Southern Oscillation (ENSO). The West AfricanMonsoon is influenced either during the developing phase of ENSO or during the decay of some long-lastingLa Niña events (Joly <strong>and</strong> Voldoire, 2009). In general, El Niño (positive sea surface temperature anomalies inthe equatorial Pacific Ocean) is connected to below normal rainfall in West Africa (Janicot et al., 1998). Othersources of variability at decadal, annual <strong>and</strong> intra-seasonal time scales include l<strong>and</strong>-atmosphere feedbacks(Taylor et al., 1997; Grodsky <strong>and</strong> Carton, 2001; Douville, 2002) <strong>and</strong> large-scale circulation features (Matthews,2004; Mournier et al., 2008; Lavender <strong>and</strong> Matthews, 2009). At intra-seasonal time scales, the West AfricanMonsoon system also exhibits variability, specifically at frequencies of 15 days <strong>and</strong> 25-60 days (Janicot <strong>and</strong>Sultan, 2001). The longer of these periods is associated with the Madden-Julian Oscillation (a major source ofintra-seasonal variability in the tropical atmosphere with a period of 30-90 days) <strong>and</strong> variability in the Asiansummer monsoon (Matthews, 2004; Lavender <strong>and</strong> Matthews, 2009; Janicot et al., 2009).GHANA CLIMATE CHANGE VULNERABILITY AND ADAPTATION ASSESSMENT 35
4. CLIMATE CHANGEPOLICY FRAMEWORKCLIMATE CHANGE ACTIVITIES IN GHANAResponsibility for developing, coordinating, <strong>and</strong> implementing Ghana’s <strong>climate</strong> policy is underst<strong>and</strong>ablydispersed among several agencies. The Environment <strong>and</strong> Natural Resources Advisory Council (ENRAC)operates at the Cabinet level <strong>and</strong> is in place to coordinate among ministries. Within ministries with <strong>climate</strong>relatedresponsibilities, there are coordinating <strong>and</strong> consultative activities. For example, a Carbon Credit PolicyCommittee operates in the Ministry of Environment, Science <strong>and</strong> Technology (MEST) to clearly define rules<strong>and</strong> procedures effecting carbon credit generating activities, allocation of carbon rights, <strong>and</strong> participation insub-national carbon activities.The Environmental Protection Agency (EPA) within MEST is responsible for developing national <strong>climate</strong><strong>change</strong> policy <strong>and</strong> integrating priorities into sectoral plans. The EPA is the main Country ImplementingInstitution (CII) for technical coordination of activities on <strong>climate</strong> <strong>change</strong>, the United Nations FrameworkConvention on Climate Change (UNFCCC) <strong>and</strong> some other environmental conventions ratified by Ghana.Within the Agency, a specialized unit on Energy Resources <strong>and</strong> Climate Change has been established to serveas the technical focal point on <strong>climate</strong> <strong>change</strong> <strong>and</strong> related issues in Ghana, including technical aspects forClean Development Mechanism (CDM) projects. The National Climate Change Coordinator is located withinthe Energy Resource <strong>and</strong> Climate Change Unit of the EPA.The Ministry of L<strong>and</strong>s <strong>and</strong> Natural Resources (MLNR) is the lead national entity responsible for overalloversight <strong>and</strong> direction on REDD+ activities in Ghana. The National REDD Steering Committee,established in 2009, provides support to MLNR. The Ministry is also represented at the National ClimateChange Committee (NCCC). The REDD+ secretariat at the Forestry Commission in collaboration with theNational REDD+ Steering Committee facilitated Forest Carbon Partnership Facility (FCPF) process withsupport from World Bank.The Ministry of Finance <strong>and</strong> Economic Planning (MoFEP) is represented on the NCCC <strong>and</strong> has beennominated for accreditation as the National Operating Entity to the Adaptation Fund Board. This is to legallyenable MoFEP to function as the fiduciary administrator of the Adaptation Fund in Ghana. MoFEP is alsoleading an inter-ministerial collaboration under the Forest Investment Programme (FIP) initiative by theWorld Bank to support REDD+ implementation in Ghana. The Natural Resource Governance desk atMoFEP centrally coordinates the budget support program under Natural Resource, EnvironmentalGovernance (NREG) program <strong>and</strong> the Forest Investment Programme Initiatives.Climate <strong>change</strong> is being mainstreamed into Ghana’s Shared Growth <strong>and</strong> Development Agenda <strong>and</strong>coordinated by the National Development Planning Commission (NDPC). Climate <strong>change</strong> was targeted forsupport by Donor Partners under the NREG program. The Ministry of Environment, Science <strong>and</strong>Technology is the lead institution for <strong>climate</strong> <strong>change</strong> <strong>and</strong> UNFCCC activities in the country <strong>and</strong> hosts theNational Committee on Climate Change. Representatives from relevant ministries, universities, researchinstitutions, the private sector, <strong>and</strong> NGOs serve on the committee. The NCCC is responsible for formulatinga National Climate Change Policy for Ghana that includes mitigation <strong>and</strong> <strong>adaptation</strong> actions that are to beintegrated into planning processes at national, regional, <strong>and</strong> district levels. Other duties of the NCCC arerecommending areas of study to the MEST for comparing <strong>climate</strong> <strong>change</strong> <strong>adaptation</strong> strategies; identifyingskills deficiencies <strong>and</strong> training needs; <strong>and</strong> developing harmonized <strong>climate</strong> <strong>change</strong> programs in the key sectors36 GHANA CLIMATE CHANGE VULNERABILITY AND ADAPTATION ASSESSMENT
of finance <strong>and</strong> economic planning, forestry, agriculture, l<strong>and</strong> <strong>and</strong> water, health, energy, <strong>and</strong> coastal zonesmanagement.The MEST developed a list of 55 actions <strong>and</strong> policies the GoG could take to reduce GHG emissions. TheseNationally Appropriate Mitigation Actions (NAMAs) were appended to Ghana’s submission to theCopenhagen Accord. Most NAMAs align with development priorities in the Ghana Shared Growth <strong>and</strong>Development Agenda 2010 (GSGDA), <strong>and</strong> most are energy related but do not specifically mention biofuels,other than waste as renewable sources, <strong>and</strong> do not mention woodlots to meet community cooking needs.Eight of the 55 NAMAs address l<strong>and</strong> use, l<strong>and</strong> use <strong>change</strong> <strong>and</strong> forestry including sustainable forestmanagement, REDD+, plantation development, <strong>and</strong> rehabilitation of degraded l<strong>and</strong>s. The NAMAs aremostly broad statements without implementation details, cost estimates, likely funding sources or priorities.REDD+ POLICY FRAMEWORKINTRODUCTIONReducing emissions from deforestation <strong>and</strong> degradation of tropical forests (REDD) is one means formitigating the effects of increased CO 2 on global <strong>climate</strong> (UNFCC 2007). One strategy for reducingemissions from l<strong>and</strong> conversion is to pay for maintaining <strong>and</strong> enhancing carbon stocks with the added benefitof halting deforestation (Kanninen, Murdiyarso et al. 2007). When the term REDD was formally recognizedat the United Nations Framework Convention on Climate Change Conference of Parties meeting in Bali,Indonesia in 2007, the last clause of the decision document added the “plus” to the term. This recognized therole of conservation <strong>and</strong> sustainable forest management in enhancing carbon stocks (Mayers et al., 2010). Theinternational community has invested heavily in preparing tropical countries to participate in an expectedprogram to pay to maintain or enhance forest carbon stocks. Funding has been streamed through twomechanisms, the Forest Carbon Partnership Facility of the World Bank <strong>and</strong> the United Nations REDD (UN-REDD) program. Additionally, there are voluntary carbon markets <strong>and</strong> the Clean DevelopmentMechanism/Afforestation <strong>and</strong> Reforestation mechanism (Westholm et al., 2009).The UNFCC REDD concept has four components that set the boundaries for an eventual program (Figure4.1): Scope, Reference Level, Distribution, <strong>and</strong> Financing. Because agreement on REDD+ has been illusive,most of the questions posed for these components have yet to be answered definitively. Thus, some details ofa REDD+ program in Ghana must await international clarification. Although experience from the voluntarycarbon markets <strong>and</strong> the CDM A/R provide some guidance, they essentially operated at the project-level. Thenational-scale envisioned for REDD presents new, more complex questions (Westholm et al., 2009). Oneissue is the necessity to monitor <strong>and</strong> verify that carbon stocks are being maintained; the Bali documentfeatured measurement (monitoring), reporting, <strong>and</strong> verification (MRV) as a central focus (Westholm et al.,2009). Until Scope <strong>and</strong> Reference Level issues have been resolved, MRV components remain in flux. Anotherissue is whether REDD approaches should be strictly national, sub-national, or both <strong>and</strong> the related concernsabout benefit-sharing among stakeholders. These <strong>and</strong> related issues for Ghana are discussed below.GHANA CLIMATE CHANGE VULNERABILITY AND ADAPTATION ASSESSMENT 37
Source: LittleREDD Book, 2009Figure 4.1 TheReduced Emissions from Deforestation <strong>and</strong> Degradation (REDD)frameworkunder the UNFCC, showing the key questions to be answeredBecause the details of REDD+ have not been finalized, necessary activities <strong>and</strong> components have yet tobespecified. In the meantime, some have suggested that REDD+ provides a vehicle for a more comprehensiveapproach to carbon accounting <strong>and</strong> l<strong>and</strong> use. The argument is that since in most of the tropics agriculturalexpansionn is the main proximate cause of deforestation, it should be considered in programs to addressdeforestation. Others have pointed tothe exclusionof some agroforestry practices from REDD+consideration because they occur on l<strong>and</strong> that is not designated forest. These other approaches, termedAFOLU (Agriculture, Forestry, Other L<strong>and</strong> Uses) <strong>and</strong> REALU (Reduced Emissions All L<strong>and</strong> Uses, includestrees not in forests), areopposed by those groups wishing to maintain the focus on forests.Alternatively,there has been discussion of using the REDD mechanism to develop payments for other ecosystem services,in additionto carbon sequestration (Karsenty, Guéneau et al. 2008).Nevertheless, there is broad consensus on the key elements of a national REDD+ program: developing areference scenario, transparency, <strong>and</strong>MRV (measurement [sometimes referred to as monitoring], reporting,<strong>and</strong> verification). A reference scenarioinvolves defining what a forest is <strong>and</strong> setting a baseline for carbonemissions from deforestation or degradation. It is from this baseline that carbon accumulation or loss is to beevaluated. The choice of baseline rules can greatly affect the amount of emissions reductions claimed(Griscom,Shoch et al. 2009). Transparency requires adequate consultation with stakeholders <strong>and</strong> affectedparties, including what constitutes adequate notification of farmers <strong>and</strong> otherss living in <strong>and</strong>around forests.Other aspects of transparency relate to forest law <strong>and</strong> governance, including forest management practices,policies <strong>and</strong> enforcement, illegal logging, etc. Indeed, REDD+ was attractive to many because of the potentialto support(or require) governance reform (Hansen, Lund et al. 2009; S<strong>and</strong>ker, Nyame et al. 2010). BecauseREDD has been envisioned <strong>and</strong> approached as a national-leveleffort, concern for social responsibility <strong>and</strong>effects on local communities was notinitially addressed. Social responsibility includes protecting the rights of38 GHANA CLIMATE CHANGE VULNERABILITY AND ADAPTATION ASSESSMENT
indigenous people <strong>and</strong> more recently, sharing benefits from carbon payments equitably among government,l<strong>and</strong> owners, <strong>and</strong> forest communities.Once the structure of a REDD+ program has been established, MRV focuses on its operation (Herold <strong>and</strong>Johns 2007; Herold <strong>and</strong> Skutsch 2009). It is concerned with ongoing carbon accounting <strong>and</strong> related issues –for example, permanence <strong>and</strong> leakages. Reporting originally was envisioned as a national responsibility butsub-national carbon accounting seems reasonable as a way to jump-start REDD+ programs <strong>and</strong> to encourageprivate party participation it must somehow be accommodated within the national accounting structure(Angelsen <strong>and</strong> Institute 2009). Nevertheless, exclusively sub-national accounting has been ruled out becauseof concerns over leakage <strong>and</strong> permanence <strong>and</strong> the difficulty of verification.REDD+ IN GHANAThe greatest potential for REDD+ in Ghana is in carbon enhancement, which means better management ofthe remaining small amount of forest <strong>and</strong> in restoring degraded forests. The potential so far has beenregarded as mostly within the High Forest Zone (HFZ), including shade-grown cocoa (cocoa culture isprimarily carried out in the HFZ) although there is no reason that REDD+ could not be extended to thesavanna woodl<strong>and</strong>s of northern Ghana.The focal point for REDD+ in Ghana is the Climate Change Unit of the Forestry Commission; this unitserves as the secretariat for the National REDD+ Technical Working Group, a multi-stakeholder body withinthe Ministry of L<strong>and</strong>s <strong>and</strong> Natural Resources. This working group provides oversight (advice <strong>and</strong> guidance)on REDD+ processes. (The FC is within this ministry). The institutional framework for REDD+ in Ghana isshown in Figure 4.2.At the Cabinet level is the Environment <strong>and</strong> Natural Resources Advisory Council, chaired by the Vice-President. This group provides oversight on national <strong>climate</strong> <strong>change</strong> issues, including REDD+, <strong>and</strong>coordinates cross-sectoral issues (i.e., settles disputes between ministries). This group was formed in May2010. The NREG Technical Coordination Committee (TCC+) coordinates several forest-related initiativeswithin Ghana, including REDD+. NREG is a multi-donor sector budget program that is an effectivegovernment-donor-civil society mechanism that provides oversight <strong>and</strong> ensures cohesion in policy <strong>and</strong>coordination of REDD+ with other initiatives. A Carbon Credit Policy Committee has been set up in theMinistry of Environment, Science <strong>and</strong> Technology to clearly define rules <strong>and</strong> procedures for carrying outcarbon credit generating activities, allocation of carbon rights, <strong>and</strong> participation in sub-national carbonactivities.GHANA CLIMATE CHANGE VULNERABILITY AND ADAPTATION ASSESSMENT 39
Environment <strong>and</strong> Natural Resources Advisory Council (ENRAC) Composed ofMinistries of MLG, MLNR, MoFEP, MEST, MoFA etc.Exp<strong>and</strong>ed NREG Technical Coordinating Committee -(To coordinate FIP/FCPF)(TCC+)MinisterialLevelNational REDD+ Steering Committee withinMLNRNational ClimateChange Committee in MESTImplementingAgency LevelVPA SC in FCFC Climate ChangeNational ClimateFC Climate Change Unitmainstreaming team Change Unit (EPA)Forest ForumsLocalStakeholderLevelCBODistrict AssemblyAcademicsAgricultural Extension OfficersCommunityNTFP GatherersLocal NGOsINGO Chainsaw OperatorsTimber IndustryFarmersTraditional AuthoritySource: Forestry Commission 2010Figure 4.2 REDD+ Management ArrangementsTechnical Sub-Working Groups have been formed under the National REDD+ Technical Working Group toexamine requirements in greater detail <strong>and</strong> recommend policies for implementing REDD+. The Sub-Working Group on Consultation <strong>and</strong> Participation is charged with developing a comprehensive StakeholderConsultation <strong>and</strong> Participation Plan <strong>and</strong> Communication Strategy, outlining how local institutions <strong>and</strong>communities should be engaged in the REDD+ process. Another sub-working group on Policy, Legislation,<strong>and</strong> Governance will facilitate ongoing policy <strong>and</strong> legal reforms that seek to address drivers of deforestation<strong>and</strong> degradation. This group is to identify gaps <strong>and</strong> strategies in the reform efforts in the agriculture, mining,<strong>and</strong> forestry sectors.Other key players in the REDD+ process are environmental non-governmental organization (ENGOs), suchas Forest Trends, Rainforest Alliance, Nature Conservation Research Centre (NCRC) <strong>and</strong> others. A civilsociety contact group with Ghana Forest Watch as the hub was established in an earlier process (theVoluntary Partnership Agreement with the European Union; discussed below) <strong>and</strong> will be used in theconsultation <strong>and</strong> participation processes.PREPARATION, CONSULTATION AND IMPLEMENTATION FRAMEWORKREDD+ in Ghana will proceed over a five-year period until fully implemented. The first phase consists ofbecoming REDD-Ready. A REDD Readiness Preparation Note (R-PIN) was submitted to the World Bank’sForest Carbon Partnership Facility, detailing how Ghana intended to prepare for REDD. The R-PIN wasapproved in July 2008. Subsequent to negotiations between the FCPF <strong>and</strong> the government of Ghana, a$200,000 Preparation Grant Agreement was signed in April 2009. This agreement provided the funding tounderwrite the costs of preparing the REDD Readiness Preparation Proposal (R-PP). Following some limitedconsultation with stakeholders, the R-PP was submitted to the FCPF in December 2009 <strong>and</strong> simultaneouslyunderwent external review. The R-PP was approved subject to revision by the FCPF in March 2010 <strong>and</strong> arevised R-PP was submitted to the FCPF in December 2010. At this time, a Readiness Grant is beingfinalized with the FCPF, including arrangements for fiduciary requi9rements to be met by dispersal of fundsthrough a private body, further World Bank due diligence, <strong>and</strong> preparation of the R-PP Assessment Note.This Phase 1 of the REDD+ process should be completed by the end of 2011.40 GHANA CLIMATE CHANGE VULNERABILITY AND ADAPTATION ASSESSMENT
Phase 1 REDD ReadinessConsultations begun with stakeholders toformulate R-PPR-PIN approved by World Bank, JulyFCPF Preparation Grant, AprilNational validation workshop held,OctoberThe R-PP submitted to the FCPF,DecemberRPP was approved subject to revision bythe FCPF, MarchRevised R-PP submitted to the FCPF,DecemberFCPF Readiness grant being finalizedR-PP Assessment Note preparedPhase 2 Implementation of REDD+strategyImplementation of the national plan,policies <strong>and</strong> measuresFurther capacity building, technologydevelopment <strong>and</strong> transferResults-based demonstration activities orpilot projectsPhase 3 (Implementation of Performance-Based ActionsResults-based actions on-goingFull implementation of MRV procedures2008 2009 2010 2011 2012 2013 2014-OnFigure 4.3 Schedule for REDD activity in GhanaTwo further phases will follow: Phase 2, which runs from (2011 through 2012), will implement the REDD+strategy. National plans, policies, <strong>and</strong> measures will have been finalized <strong>and</strong> implementation begun. Furthercapacity building, technology development, <strong>and</strong> transfer are needed to ensure that institutional capacity issufficient to effectively proceed with a REDD+ plan. During this phase, results-based demonstrationactivities or pilot projects will be undertaken in order to develop <strong>and</strong> test the activities that will be included inthe final program. The REDD+ Strategy will fall into two broad thematic areas – timber policy <strong>and</strong> supply<strong>and</strong> forest policy, including agroforestry, <strong>and</strong> other carbon conserving activities. To date, 14 c<strong>and</strong>idatestrategies have been identified in the R-PP. These will be subjected to social <strong>and</strong> environmental impact<strong>assessment</strong> during the consultation process <strong>and</strong> testing during the REDD+ piloting phase. A provisionrequiring a Strategic Environmental <strong>and</strong> Social Assessment was included in the R-PP. The SESA will promotedue diligence, identify <strong>change</strong>s in institutional arrangements <strong>and</strong> governance needed for the implementationof REDD+, <strong>and</strong> identify the likely socio-economic <strong>and</strong> environmental risks associated with REDDstrategies/policies. The SESA will also outline possible mitigation options, <strong>and</strong> assess potential additionalbenefits in terms of biodiversity conservation <strong>and</strong> poverty alleviation.The REDD Secretariat has begun compiling a registry of companies, institutions, <strong>and</strong> individuals that areengaged in various REDD/REDD+ projects in Ghana. Unfortunately, registration must be done at theGHANA CLIMATE CHANGE VULNERABILITY AND ADAPTATION ASSESSMENT 41
Forestry Commission offices outside of Accra <strong>and</strong> a non-refundable processing fee of GH¢500 is required,thereby providing disincentives for small farmers to participate.Phase 3 will run from 2012 to 2013 <strong>and</strong> will continue implementation of performance-based actions <strong>and</strong> fullyimplement the MRV procedures. An entity responsible for MRV will be established during this phase, alongwith setting of the Reference Emission Level. The carbon measurement, accounting, <strong>and</strong> MRV procedureswill be tested. New legislation will be passed by this phase (2012-2013) to define carbon rights <strong>and</strong> addressother legal requirements (GoG 2010).OTHER EFFORTS AND INITIATIVES RELATED TO REDD+The REDD+ program will not operate in a vacuum; there are several other initiatives <strong>and</strong> activities underwaythat should complement REDD+ <strong>and</strong> address some of the obstacles to realizing the full benefit of REDD+in terms of halting deforestation <strong>and</strong> degradation.Voluntary Partnership Agreement – A Voluntary Partnership Agreement (VPA) was signed between theGovernment of Ghana <strong>and</strong> the European Union (EU) on November 20, 2009. The VPA is meant to addresssustainability, particularly illegal logging, by governing trade between Ghana <strong>and</strong> the EU; legally producedtimber exported to the EU would be identified by a license issued in Ghana. Timber originating in Ghanawithout the license would be denied entry into the EU. As more than half of Ghana's annual commercialtimber harvest is exported to the EU, the VPA should enable considerable progress in tackling illegal loggingin the country. In the discussions leading up to the VPA, it was recognized that an agreement only aboutexports that did not include the sizeable domestic market largely served by illegal logging, would do little toaddress the underlying threats to the forests estate. A study by the International Institute for Environment<strong>and</strong> Development (Mayers et al. 2008) presented three scenarios: a baseline, business as usual scenario; ascenario with an effective timber regime that would meet the minimum requirements of a VPA; <strong>and</strong> a sectorreform scenario that would reflect a transition toward improved forest governance <strong>and</strong> sustainability. Thesector reform scenario would address important policy failures such as the highly protected processingindustry (Mayers et al. 2008). They concluded that even with a legitimate timber regime, the forests will besubstantially degraded. Nevertheless, many of the reform measures proposed in the Sector Reform scenariowould be critical to the success of a REDD+ program.Clean Development Mechanism – The Kyoto Protocol provided a Clean Development Mechanism that offereddeveloped countries (so-called Annex 1 countries) with emission reduction targets a chance to offset some oftheir greenhouse gas emissions by funding renewable energy <strong>and</strong> forestry development projects in developingcountries. The Kyoto Protocol itself makes no distinction between emission-avoiding <strong>and</strong> carbonsequestration or storage projects such as afforestation <strong>and</strong> reforestation. Some have questioned whetherafforestation <strong>and</strong> reforestation should be part of REDD+ since these activities are included in CDM; themost compelling justification for inclusion in REDD+ is that the CDM A/R has been a failure. The role ofCDM in Ghana is discussed in more detail below.Forestry Investment Program – The Forestry Investment Program is part of the Strategic Climate Fund (a multidonorTrust Fund within the Climate Investment Funds). The overall objective of FIP is to mobilize funds toreduce deforestation <strong>and</strong> forest degradation <strong>and</strong> to promote sustainable forest management. The mainpurpose of FIP is to support REDD-efforts by providing up-front bridge financing for readiness reforms <strong>and</strong>investments, taking into account opportunities to adapt to the impacts of <strong>climate</strong> <strong>change</strong> on forests,contribute conservation of biodiversity, <strong>and</strong> enhance rural livelihoods. Ghana is one of eight countries (oneof three in Africa) selected to pilot the program. The Minister of L<strong>and</strong>s <strong>and</strong> Natural Resources is the FIPFocal Point <strong>and</strong> the exp<strong>and</strong>ed NREG Technical Coordination Committee provides overall guidance of theFIP. The Government of Ghana has received a Preparation Grant to develop an Investment Plan for theFIP, which is expected to be submitted in November 2011. A joint multilateral development bank (MDB)mission will visit the countries to develop an investment plan (this was tentatively scheduled for April of2011). This plan will be approved by the FIP Sub-Committee (FIP-SC) <strong>and</strong> then specific projects <strong>and</strong>programs will be prepared <strong>and</strong> joint financing for these activities will be decided in more meetings of the FIP-42 GHANA CLIMATE CHANGE VULNERABILITY AND ADAPTATION ASSESSMENT
SC. A New National Plantation Development Program was launched in January 2010 by the ForestryCommission with an annual target of 30,000 ha. It is to be implemented nationwide, both within <strong>and</strong> outsideforest reserves using paid/contract labor. The Forestry Commission expects to have a good portion of itstargets met through financing from the FIP.National Forest Forum – Civil society platforms such as Forest Forums are existing structures used fordissemination of REDD+ information to grassroots forest communities. In January 2005, the ForestryCommission partnered with the United Nations Food <strong>and</strong> Agriculture Organization (FAO) to addresspriority gaps in the implementation of Ghana’s national forest program. A National Forest Program (NFP)has to be implemented by all stakeholders, not just the government acting alone. Thus the ForestryCommission established a National Forestry Forum (NFF) at the national, regional <strong>and</strong> district levels as agrassroots civil society organization to contribute to the development, implementation, <strong>and</strong> monitoring of keypolicies in the sector. The NFF was inaugurated at a meeting in November 2007 in Accra. The NFF is aimedat providing a national platform for forest stakeholders to discuss critical issues on forest governance, shareinformation <strong>and</strong> interact with forest managers <strong>and</strong> policy makers on best practice resource management. InMay 2002, the Forestry Commission, in conjunction with the donor-funded Forest Sector DevelopmentProject (FSDP) II <strong>and</strong> CARE, organized a workshop in Ghana together with NGOs <strong>and</strong> other civil societyorganizations in order to better underst<strong>and</strong> the unresolved issues in Collaborative Forest Management. Oneof the recommendations from this workshop (“Akosombo 1”) was the establishment of “Forest Forums” as“spaces” for district-level dialogue on forest issues. Forest Forums were a positive step, <strong>and</strong> one whichcontinues today with 15 forums in districts around the country having regular meetings.Modified Taungya Systems – In September 2001, the President of Ghana launched the National ForestPlantation Development Program with an ambitious annual planting target of 20,000 hectares using variety ofapproaches. One approach was the Modified Taungya System (MTS) whereby small-scale farmers couldpartner with the Forestry Commission to establish <strong>and</strong> manage tree plantations in degraded forest reserves<strong>and</strong> thus be entitled to a share in the monetary value of the tree crop. Legislation was passed to grant theserights but a farmer requires a certificate from the Forestry Commission to secure these benefits. Under thecurrent phase of the National Forest Program partnership with FAO, a priority is accomplishing plantationdevelopment by consolidating the benefits due to farmers engaged in the Modified Taungya System. Anestimated 100,000 hectares of MTS plantations have been established across the country through theinvolvement of over 100,000 rural farmers since its launching (Kalame 2009) but the signing of their benefitsharing agreement has become stalled due to inadequate resources <strong>and</strong> staff constraints within the ForestryCommission. To rectify the situation, the Forestry Commission is seeking proposals from qualified civilsociety groups (academic institutions, NGOs, CBOs <strong>and</strong> consulting firms) to complete the signing <strong>and</strong>registration of outst<strong>and</strong>ing benefit sharing agreements. A project funded by USAID-West Africa under theSTEWARD program has partnered with researchers at the Forest Research Institute of Ghana to pilot acommunity-based carbon monitoring method, working with three of these forest fringe communities thatused the MTS to restore degraded forest reserves (Blay et al. 2008). The rationale was if the communities owntimber rights, perhaps they could also obtain carbon rights.Non-Legally Binding Instrument – In 2008, Ghana became the first country to systematically implement the Non-Legally Binding Instrument (NLBI) on All Types of forests with technical support from FAO <strong>and</strong> theGerman Agency for Technical Cooperation (GTZ) <strong>and</strong> funding from the German Federal Ministry forEconomic Cooperation <strong>and</strong> Development (BMZ). Non-Legally Binding Instruments (NLBI) were developedat the sixth meeting of the United Nations Forum on Forests (UNFF-6) but negotiations for an NLBI onforests was put off until UNFF-7 (April 2007). The NLBI on Management, Conservation <strong>and</strong> SustainableDevelopment of All Types of Forests (the Forest Instrument) was adopted by the seventh session of UNFF<strong>and</strong> by the United Nations General Assembly in 2007. The Forest Instrument is to provide a comprehensiveframework for national action <strong>and</strong> international cooperation for Sustainable Forest Management. The NLBIon Forests focuses on promoting horizontal <strong>and</strong> vertical communication, securing rights, including rightsover resources, <strong>and</strong> clearly identify responsibilities, ensuring a transparent <strong>and</strong> participatory process of policydevelopment <strong>and</strong> implementation, including providing early <strong>and</strong> adequate information. The NLBI on ForestsGHANA CLIMATE CHANGE VULNERABILITY AND ADAPTATION ASSESSMENT 43
provides for periodic review <strong>and</strong> promotes coordination of forest-related policies, strategies <strong>and</strong> programs.Because the NLBI is an over-arching effort, REDD+ strategies <strong>and</strong> programs should fit comfortably withinthe NLBI framework. Several of the efforts undertaken in implementation of the NLBI have been used in theREDD+ process or share similar goals. For example, stakeholder participation begun under NLBI <strong>and</strong> theVPA are used by the REDD+ process. (A/RES/62/98; available at http://www.un.org/esa/forests/nlbi-GA.html)REDD+ IMPLEMENTATION ISSUESGhana is at the forefront of pilot efforts to implement REDD+ activities to mitigate <strong>climate</strong> <strong>change</strong>, withsignificant investments on the part of The World Bank <strong>and</strong> other organizations. However, major obstaclesremain to be addressed before REDD+ will be successful, including l<strong>and</strong> <strong>and</strong> tree tenure issues, carbonrights, benefit sharing, illegal logging, current methods of cocoa production, <strong>and</strong> carbon measurement,reporting, <strong>and</strong> verification methods. Three formidable technical issues arise when considering how Ghanawill implement REDD+: setting a baseline (reference scenarios), carbon accounting, <strong>and</strong> MRV.REFERERENCE SCENARIOTo begin carbon accounting for REDD+ it is necessary to set a baseline for how much forest exists <strong>and</strong> howmuch has been lost. Ghana has a high deforestation rate, 1.9 percent per year based on national reporting toFAO –but this figure is unreliable (see the section on deforestation for a discussion). There is no regularmonitoring or forest inventory system in place <strong>and</strong> until recently, remote sensing methods have been littleused. Thus, the first step in setting the baseline is to determine how much forest cover remains <strong>and</strong> howmuch carbon it contains, which is a function of how degraded it may have become. Forest cover can beestimated from remotely sensed data; for Ghana, the most practical approach is data gathered from satellite.Frequent cloud cover is one difficulty in using remotely sensing approaches <strong>and</strong> the problem is greatest in thehigh forest zone. In conjunction with the satellite imagery, ground measurements are needed to estimate treevolumes. Where an on-going forest inventory <strong>and</strong> monitoring program is in place, this is a relatively easy stepbut, as noted already, no such inventory exists in Ghana. The conversion from inventory to biomass requiresdestructive sampling of a representative number of trees of various sizes <strong>and</strong> species. There are few biomassmeasurements available <strong>and</strong> the few data that exist are for relatively local areas. The conversion from biomassto carbon content is straightforward <strong>and</strong> largely a function of how dense a tree is or it can be estimated fromgeneralized equations for tropical trees. Carbon estimates in Ghana have been based on a few regional forestinventories, from growing stock data <strong>and</strong> using generalized estimates from literature values.Recently, a carbon baseline map has been produced as a collaborative effort between Forestry Commission,the Katoomba Group, Nature Conservation Research Centre, <strong>and</strong> Oxford University (Prof. YadvinderMalhi). The ongoing carbon map project is supported by the Moore <strong>and</strong> Rockefeller Foundations. This mapwas not available for our examination although we did discuss the sampling methods with the field staff <strong>and</strong> itappears that the map is for the high forest zone only.CARBON ACCOUNTINGCarbon accounting begins with the baseline <strong>and</strong> through monitoring, determines flows into <strong>and</strong> out of forestover reporting intervals. A country may gain carbon by normal st<strong>and</strong> development; as trees grow, they notonly fix more carbon in their biomass but generally soil carbon increases. Carbon may also be gained byincreasing the area of forest l<strong>and</strong> through afforestation of farml<strong>and</strong> or restoration (rehabilitation) of degradedforest l<strong>and</strong>. There are also fluxes associated with timber harvesting <strong>and</strong> regrowth. Carbon is lost bydeforestation for agriculture, wildfire, <strong>and</strong> conversion to urban or insudtrial uses. In Ghana, the most likelylosses (leakages in the carbon accounting terminology) will be from expansion of farming especially for cocoa,illegal logging, <strong>and</strong> wildfires.Although the REDD+ framework envisions national-level accounting, the obstacles to implementing such asystem in Ghana <strong>and</strong> many tropical countries are formidable, as we have described. Sub-national accounting,where smaller areas <strong>and</strong> projects are used to jump-start the REDD+ process, is put forward as a useful firststep toward full REDD+ implementation. For sub-national accounting to be acceptable, methods will have44 GHANA CLIMATE CHANGE VULNERABILITY AND ADAPTATION ASSESSMENT
to be developed that provide rigorous estimates of carbon are compatible with national-level accounting.Ghana is pursuing the sub-national carbon accounting approach as a first step to manage the national carbonaccounting <strong>and</strong> actions related to crediting.MONITORING, REPORTING, AND VALIDATIONOnce a carbon accounting system has been developed it must be implemented as an ongoing function ofsome agency. Discussions by the MRV Sub-Working Group on how best to develop an effective MRVsystem are ongoing. The Remote Sensing & Forest Inventory Unit of the Forestry Commission <strong>and</strong> theCentre for Remote Sensing <strong>and</strong> Geographic Information Systems (CERSGIS) at the University of Ghana willbe key collaborators in the design of the MRV <strong>and</strong> carbon accounting system. The challenges to effectiveMRV come from lack of infrastructure <strong>and</strong> limited human resources capacity. Internet speed is relatively low<strong>and</strong> b<strong>and</strong>width is narrow, constraining the ability to obtain data over the internet <strong>and</strong> to share data <strong>and</strong>interpretive maps among agencies. Historical LANDSAT <strong>and</strong> some SPOT data are available for Ghana <strong>and</strong>could form the basis for a regular forest cover <strong>change</strong> monitoring system. Because of the high cloud cover,however, additional radar data will be needed to provide full coverage of the country. A fire monitoing systemis needed. At the present time, the state of the forest, trends, <strong>and</strong> functions are inadequate <strong>and</strong> must berevised to meet REDD+ st<strong>and</strong>ards. A true national continuous forest inventory must be established if carbonstock <strong>change</strong>s are to be monitored adequately. The forest area must be stratified into forest types; this effortshould be extended to the savanna zone as well. A system of permanent measurement plots is needed thatcan be re-visited <strong>and</strong> re-measured regularly, to establish trends.Technical capacity <strong>and</strong> expertise must be developed in both the remote sensing <strong>and</strong> field efforts. Technicalexpertise in optical <strong>and</strong> radar remote sensing acquisition, processing, <strong>and</strong> interpretation is required. Technicalcapacity is also needed to assess <strong>and</strong> validate the remote sensing interpretations using ground measurements.Technical capacity <strong>and</strong> expertise is needed for the field measurements <strong>and</strong> estimation of carbon stocks,including the research necessary to scale-up from individual tree diameter <strong>and</strong> height measurements tovolumes, weight, <strong>and</strong> carbon contents. Research on all carbon pools, including soil carbon <strong>and</strong> deadwood, isneeded for each forest type.CARBON RIGHTS AND BENEFIT SHARINGThe complex system of l<strong>and</strong> <strong>and</strong> tree tenure varies in the different regions of Ghana (see next section fordetails). Even where smallholders have gained rights to share in benefits from planted trees (e.g., the modifiedtaungya system) it is far from clear whether they have gained rights to share in carbon benefits. Without suchincentive for local people to share carbon benefits, it is doubtful that deforestation <strong>and</strong> degradation can beavoided. The effectiveness of REDD+ schemes are not assured until tree tenure <strong>and</strong> carbon rights issues areaddressed.LAND TENURE IN GHANAINTRODUCTIONL<strong>and</strong> tenure is generally understood as the mutually accepted terms <strong>and</strong> conditions under which l<strong>and</strong> is held,used, <strong>and</strong> traded (Adams & Sib<strong>and</strong>a, 1999). Tenure can further be defined as the “social relations <strong>and</strong>institutions that govern access to <strong>and</strong> use of l<strong>and</strong> <strong>and</strong> other natural resources” (Yaro & Zackaria, 2006, 25). Itis important to note that l<strong>and</strong> tenure is not a static system; it is a system <strong>and</strong> process that is continuallyevolving, <strong>and</strong> is influenced by factors such as the state of the economy, changing demographics, culturalinteractions, political discourse, or a changing natural <strong>and</strong> physical environment. However, l<strong>and</strong> tenure can, inturn, have an impact on these factors, which is why it should be considered in conversations concerningsocioeconomic development <strong>and</strong> environmental <strong>change</strong> (Akoto et al., 1996). In the case of Ghana, l<strong>and</strong>tenure is especially important. As a country with an agrarian-based economy, access to l<strong>and</strong> <strong>and</strong> l<strong>and</strong> usearrangements play an important role in determining economic productivity. Ghana aims to become a middleincome country by the year 2020, <strong>and</strong> meeting this goal will involve making serious improvements toagricultural production (Akoto et al., 2006). The literature suggests that l<strong>and</strong> tenure plays an important role inGHANA CLIMATE CHANGE VULNERABILITY AND ADAPTATION ASSESSMENT 45
determining the ways in which l<strong>and</strong>, labor, <strong>and</strong> other inputs can be organized <strong>and</strong> used to attain higheragricultural outputs within agrarian economies. This means issues relating to l<strong>and</strong> tenure, includingaccessibility <strong>and</strong> security, will have to be addressed in development plans.Many scholars purport that problems with l<strong>and</strong> tenure in Ghana are most pronounced in urban areas close tothe capital city of Accra (Yaro & Zackaria, 2006). However, l<strong>and</strong> tenure is important throughout the country,<strong>and</strong> it would be remiss to ignore the impacts that existing l<strong>and</strong> tenure systems play in rural agrarian areas.Many of the people we met with during our mission to Ghana raised l<strong>and</strong> tenure as a barrier to <strong>climate</strong><strong>change</strong> <strong>adaptation</strong> <strong>and</strong> mitigation.In this section we address l<strong>and</strong> tenure in rural Ghana, with a focus on the Western Region <strong>and</strong> the threenorthern regions (Northern, Upper East, <strong>and</strong> Upper West) where USAID/Ghana has a special interest. Inthe Western Region tenure issues are key, given the country’s interest in developing REDD+ projects for<strong>climate</strong> <strong>change</strong> mitigation. The Western Region holds the majority of the country’s remaining primary forestreserves <strong>and</strong> is experiencing a dramatic increase in cocoa farming (Osei-Owusu, 2011, Teal et al., 2006). Thecountry’s interest in increasing production means that further expansion of cocoa farms into the WesternRegion is likely. L<strong>and</strong> tenure will play an important role in developing successful REDD+ initiatives,promoting forest conservation, <strong>and</strong> managing the growth of the cocoa industry.Northern Ghana contains roughly 41 percent of the country’s l<strong>and</strong> base, <strong>and</strong> 23 percent of the totalpopulation – nearly three-quarters of which is employed mainly in agriculture. Given this reliance onagricultural production, l<strong>and</strong> is an important asset to households <strong>and</strong> local governments, being the base fromwhich crops are grown, livestock are raised, animals are hunted, <strong>and</strong> natural resources are harvested (Yaro &Zackaria 2006). Making a living requires some form of access to l<strong>and</strong>, without which many livelihoods wouldbe non-existent. An ineffective tenure system could have serious implications for agricultural development inthis region.FORMS OF LAND TENURE CURRENTLY OBSERVEDAll l<strong>and</strong> in Ghana can be considered occupied, in the sense that it has been claimed, over centuries, by tribes<strong>and</strong> lineages. Throughout colonialism <strong>and</strong> into Ghana’s statehood, some of this l<strong>and</strong> was seized <strong>and</strong> claimedfor private ownership, <strong>and</strong> eventually state ownership. As a result of both long-st<strong>and</strong>ing ancestral systems ofl<strong>and</strong> governance, <strong>and</strong> the need for state-managed l<strong>and</strong>s, Ghana has developed two distinct forms of l<strong>and</strong>governance: statutory tenure <strong>and</strong> customary tenure.The statutory tenure system is based on formal, legally-defined Ghanaian law, <strong>and</strong> governs l<strong>and</strong>s that areowned privately (registered with the state) or by the state. The state manages state l<strong>and</strong>s on behalf of thepeople through its established agencies, <strong>and</strong> private ownership is managed through the Ghana L<strong>and</strong>sCommission’s l<strong>and</strong> registration project. Statutory tenure provides for tenure rights that are legally enforceablein a Ghanaian court of law, regulated, <strong>and</strong> well documented. Penalties apply should the agreement not beupheld (Yaro & Zackaria, 2006).The customary system, by contrast, is largely undocumented, highly variable, <strong>and</strong> rights <strong>and</strong> leases grantedthrough customary authorities are rarely legally enforceable in a court of law. Customary tenure laws governl<strong>and</strong>s belonging to tribes, lineages, <strong>and</strong> families – which constitute the majority of l<strong>and</strong> in Ghana (Table 4.1).Ownership of these l<strong>and</strong>s, in the form of the allodial title, is vested in chiefs <strong>and</strong> lineage heads. Although thel<strong>and</strong>s are vested in chiefs <strong>and</strong> lineage heads, technically tribal l<strong>and</strong> is ancestral property <strong>and</strong> therefore belongsto the people. Customary tenure forbids sale, but does allow for long-term leasing. Management of triball<strong>and</strong>s occurs through sub-chiefs, elders, heads of lineages, or (in the North) Tendanas, all of which areindividuals recognized through tradition as the true custodians of the l<strong>and</strong>. These “headsmen” ensure that allmembers of the lineage, tribe, or clan have access to farml<strong>and</strong> by granting long-term leases to individualfarmers. Ownership is never technically relinquished, although transitory forms of proprietorship are granted(Gildea, 1964).46 GHANA CLIMATE CHANGE VULNERABILITY AND ADAPTATION ASSESSMENT
L<strong>and</strong>ownerTable 4.1 L<strong>and</strong> Ownership in Select Regions of Ghana (% of total l<strong>and</strong> base)Communally held (allodial title vested inchief, lineage head, family head)WesternRegionNorthernRegionUpper EastRegionUpper WestRegionGhana76.3 91.5 63.9 87.1 71Chief/Queen 16.6 63.3 8.7 28.7 21.5Clan/Lineage Head 36.5 24.7 45.2 56.4 32.5Father/Family Inheritance 14.9 2.8 7.0 0.0 9.8Other Family Relation 8.3 0.7 3.0 2.0 7.2Individual 11.0 2.5 28.7 6.9 17.8Government 0.6 0.0 0.0 2.0 2.9Other/Undefined 12.2 6.0 7.0 4.0 8.1In the Western Region (where the Akan ethnic group is dominant), l<strong>and</strong> is vested in the chief, who is both thereligious <strong>and</strong> political leader. However, l<strong>and</strong> is controlled by the elders or heads of lineages, who ensure thatall members of their lineage are granted access to l<strong>and</strong>. Individuals gain access to l<strong>and</strong> by applying to theheadsman <strong>and</strong> documenting their relation to the l<strong>and</strong>’s original settler. “If one asks a farmer how he came tosecure the right to farm where he does, he will relate that he established his right by tracing his descent in thematrilineal line to an ancestor known to have farmed there before him. This ancestor may have been one ofthe original l<strong>and</strong> settlers or a person who was rewarded with l<strong>and</strong> by a chief after a war. The right to use l<strong>and</strong>is inherited from the original settler or done by maternal kinsmen; thus a whole lineage acquires the right ofusufruct <strong>and</strong> can exercise such right in perpetuity, but cannot sell it.” (Gildea, 1964). Typically, usufruct rightsare granted free of charge, but as l<strong>and</strong> becomes more valuable, some headsmen charge individuals inex<strong>change</strong> for a lease. As l<strong>and</strong> has become increasingly valuable <strong>and</strong> scarce in the Western Region (dueprimarily to cocoa farming), the state has intervened to modify customary tenure slightly, <strong>and</strong> allow for agreater degree of individual control. A husb<strong>and</strong> who has been granted l<strong>and</strong> rights by the headsman is nowable to transfer a portion of his l<strong>and</strong> to his wife <strong>and</strong> children upon death. This individualization wasformalized by the passing of the Intestate Succession Law in 1985, which stipulated that upon death, onethirdof the l<strong>and</strong> be given to the surviving spouse, one-third to the surviving children, <strong>and</strong> one-third back tothe matrilineal family (Otsuka et al., nd). L<strong>and</strong> that is left fallow (regardless of any death) reverts back to thelineage head for redistribution.In Northern Ghana (Northern, Upper East, <strong>and</strong> Upper West Regions), tribal l<strong>and</strong>s are also managed under acustomary tenure system. Customary trustees hold the allodial title, from which all other rights are derived, onbehalf of the community. In the Northern Region (within the more centralized cultural states, such as theDagbong, Mamprugu, Nanumba, <strong>and</strong> Gonja), the allodial title is vested in the skins (chiefs) <strong>and</strong> managed bychiefs, sub-chiefs, <strong>and</strong> lineage heads, all of whom receive authority through the chief. In the Upper East <strong>and</strong>Upper West Regions, the title is vested in Tendanas, spiritual caretakers of the l<strong>and</strong>, who are unaffiliated withthe chiefs. (Tendanas are prevalent in less centralized states, such as the Tallensi, Kusai, Sissala, <strong>and</strong> Lobbi-Dagarba). In the Tendana systems, it is the Tendana himself who grants use of the l<strong>and</strong>, either personally orthrough clansmen <strong>and</strong> recognized lineage heads. In Tendana systems, as l<strong>and</strong> has become more valuable,chiefs have usurped the Tendana’s role, which has created controversy among the population. Unlike in theSouth, individuals in the North trace their lineages through patrilineal descent when applying to a headsmanfor l<strong>and</strong> rights. As in the South, traditionally long-term leases were granted free of charge, but increasingly theheadsman (subchief) or even the Tendana will expect payment. (Yaro & Zackaria, 2006, Akoto et al., 2006).When traditional methods of l<strong>and</strong> acquisition are insufficient for providing family members with enough l<strong>and</strong>to meet their needs, households typically seek additional acreage through renting agreements. Theseagreements might occur directly with a headsman, or they might occur with farmers who have been grantedl<strong>and</strong>, or they might occur with private l<strong>and</strong>owners. If the sharecropper is a member of a l<strong>and</strong>ed family, useGHANA CLIMATE CHANGE VULNERABILITY AND ADAPTATION ASSESSMENT 47
agreements are more fluid. Migrants who are not privy to an extended family networks are restricted toseeking tenancies under two forms of sharecropping arrangements: abunu (in which crops are shared equallybetween farmer <strong>and</strong> l<strong>and</strong>owner), <strong>and</strong> abusa (in which the owner receives one-third of the harvest, the farmertwo-thirds). The form of tenancy depends on which party cleared the l<strong>and</strong> for farming (Kasanga & Kotey,2001).Overlying the traditional tenure regime throughout Ghana are other “tenurial niches” that include grazingrights, rights to fuelwood, fruit trees, <strong>and</strong> forest products (including edible <strong>and</strong> medicinal plants), <strong>and</strong> waterrights (Yaro & Zackaria, 1996). Tree tenure in particular is relevant because of its role in potential <strong>climate</strong><strong>change</strong> mitigation strategies.TREE TENUREGhana’s constitution vests all minerals <strong>and</strong> natural resources (including trees) in the President, regardless ofwhether or not the resource is on public or private l<strong>and</strong>. Customary <strong>and</strong> statutory laws, while grantingownership of the l<strong>and</strong>, do not grant ownership over naturally-occurring resources that the l<strong>and</strong> holds (Osafo,2010). There are some 279 forest reserves in Ghana, where forests are vested in the state <strong>and</strong> held in trust forcommunities (Owubah et al., 2001). Many of these reserves have been sites of extensive encroachment <strong>and</strong>resource conflict. Outside of forest reserves, harvesting <strong>and</strong> selling merchantable trees is illegal unless anindividual has permission from the Forestry Commission, a tedious process. Protecting valuable, naturallyoccurringtrees is not generally in a farmer’s interest, however, because loggers who come to harvest themoften damage food <strong>and</strong> cash crops when harvesting such trees, <strong>and</strong> rarely compensate farmers for theselosses, despite legal requirements to do so. This system creates an incentive for farmers to cut downmerchantable trees before loggers can get to them, <strong>and</strong> potentially damage their fields, underminingsustainable forestry practices (Owubah et al., 2001). If a farmer plants trees on the l<strong>and</strong> himself, he can seek atitle for that tree, in which case he owns it outright, <strong>and</strong> can cut <strong>and</strong> sell it, keeping all profits. There is,however, a benefit-sharing system agreed upon, called the Modified Taungya System. The Modified TaungyaSystem stipulates that revenues from a timber sale should be divided as follows: the farmer that cared for thetree <strong>and</strong> the Ghana Forestry Commission (tasked with managing all of Ghana’s forest resources) each receive40 percent, l<strong>and</strong>owners (traditional authorities <strong>and</strong> tribal l<strong>and</strong>owners) receive 15 percent (to be split ifnecessary), <strong>and</strong> the remaining 5 percent goes to the forest adjacent community – typically distributed throughthe district assembly (Ghana Forestry Commission, 2011; Agyeman et al., 2003). Other benefit-sharingsystems exist for trees that occur on state owned forest reserves rather than communal l<strong>and</strong>s.CHALLENGES OF CUSTOMARY TENUREInfluenced by forces such as commercialization <strong>and</strong> urbanization, Ghana’s customary tenure system hasbecome unbalanced. “The efficacy of the traditional l<strong>and</strong> tenure system is now being questioned, especially asmost of the communal mechanisms – such as broader community consultation, social equity, <strong>and</strong> safetynets – that ensured easy access to l<strong>and</strong> <strong>and</strong> transparency in l<strong>and</strong> administration have been lost.” (Akoto et al.2006). Throughout Ghana, “High dem<strong>and</strong> for l<strong>and</strong> <strong>and</strong> its consequent translation into monetary value hasgenerated conflicts between chiefs, clans, kinsmen, <strong>and</strong> family members.” (Yaro & Zackaria 2006). Afunctioning customary l<strong>and</strong>holding system should distinguish between individual, family, <strong>and</strong> communalrights, thereby supporting both sustainable development <strong>and</strong> l<strong>and</strong> management. However, when these rightsare not clearly defined, access to l<strong>and</strong> may become restricted <strong>and</strong> individuals become more likely to departfrom farm-based livelihoods, thereby reducing the agricultural potential of the economy (Kasanga 1994).Farmers in Ghana acknowledge that customary tenure has “in the past contributed to increased agriculturalproduction, <strong>and</strong> therefore [improved] the economy of the country.” However, the system as it is presentlypracticed tends to be riddled with problems in many places, frustrating rural residents <strong>and</strong> inciting conflict.Table 4.2 highlights the main problems associated with Ghana’s current customary l<strong>and</strong> tenure system. Thedata are based on a survey conducted by the Institute of Statistical, Social, <strong>and</strong> Economic Research at theUniversity of Ghana.48 GHANA CLIMATE CHANGE VULNERABILITY AND ADAPTATION ASSESSMENT
ProblemTable 4.2 Problems Associated with Customary L<strong>and</strong> TenureWesternRegionn=554NorthernRegionn=229Upper EastRegionn=299Upper WestRegionn=383Countryof Ghanan=3232High price of l<strong>and</strong> 41.3% 55.9% 38.1% 38.6% 48.1%Disputes between tenants/users <strong>and</strong>l<strong>and</strong> owners17.8 4.8% 28.1% 13.1% 17.5%Insecurity of tenure 20.1 14.8% 22.7% 18.5% 14.4%Uncertainty about ownership of l<strong>and</strong> 10.8 19.2% 7.4% 6.3% 10.7%Sale of l<strong>and</strong> without owners approval 1.1% 0.9% 1.7% 2.1% 1.8%Disputes over family l<strong>and</strong> 5.6% 3.1% 1.3% 12.5% 4.8%L<strong>and</strong> is scarce 2.2% 0.4% 0.7% 6.0% 1.6%L<strong>and</strong> taxes are too high 0.2% 0% 0% 2.1% 0.5%L<strong>and</strong> is taken from you if you don’tbuild on it0.5% 0% 0.3% 0.2% 0.2%Not enough funds to farm with 0.4% 0% 0% 0.3% 0.2%Only administered by chief <strong>and</strong>Tendana0% 0.4% 0% 0.3% 0.1%Tribalism 0% 0.4% 0% 0% 0.1%Death 0% 0% 0% 0% 0%Source: ISSER, dataThe most prominent issue facing respondents to the survey, from all four regions, was the high cost of l<strong>and</strong>.The literature suggests that l<strong>and</strong> prices have been inflated through the cultivation of cash crops (particularly inthe Western Region, where cocoa farming has become lucrative) as well as processes like urbanization <strong>and</strong>commercialization. The result is that a greater variety of l<strong>and</strong> users are now applying to headsmen for l<strong>and</strong>rights, some of whom can afford to pay much more in ex<strong>change</strong> for a lease. Many headsmen simply leaserights to the highest bidder. In the South, this tends to mean that more l<strong>and</strong> is put towards cocoa production(as opposed to subsistence use). Another implication of high l<strong>and</strong> prices is that sharecropping arrangementstend to be less generous to the farmer, providing more benefit to the l<strong>and</strong>owner (Kasanga & Kotey 2001,Otsuka et. nd). In the North, where cash crops do not grow as well, headsmen are granting more <strong>and</strong> moreof the communal l<strong>and</strong>s under their control towards commercial or urban residential uses, often at the expenseof the greater community that depends on the l<strong>and</strong> for farming. “There is fierce competition for even thelowest hierarchy of chieftaincy […] with the main motivation of [acquiring l<strong>and</strong> to sell]” (Yaro <strong>and</strong> Zackaria2006). Not all headsmen lease l<strong>and</strong> for personal profit. But in many villages, anger arising from misdealings(the headsman collects fees from multiple users for the same plot of l<strong>and</strong>, or dem<strong>and</strong>s increasingly highpayments in ex<strong>change</strong> for a lease) has erupted into violence.Following high l<strong>and</strong> prices, the next set of problems facing respondents was the undocumented nature oftheir usufructory rights, <strong>and</strong> the lack of transparency surrounding tenure agreements. This confusion hasresulted in frequent disputes over who has rights over what plot of l<strong>and</strong>, often leading to conflict. “Thecurrent turbulence in l<strong>and</strong> tenure arrangements in Ghana is reflected in the countless inter-tribal conflicts,inter-village conflicts, inter-household conflicts <strong>and</strong> contra-household confrontations over l<strong>and</strong> ownership,use, <strong>and</strong> transfers. Problems of l<strong>and</strong> tenure insecurity <strong>and</strong> the resulting conflicts do not only result in manifestloss of life <strong>and</strong> property, but also covertly form the basis of underdevelopment of productive forces in anysociety.” (Yaro & Zackaria 2006).The insecure nature of tenure does not just create conflict at the community level; it also creates a host ofeconomic problems for Ghana. Undefined <strong>and</strong> undocumented agreements make it difficult to legally upholdtenure rights ownership in a court of law. Without established rights it is virtually impossible to obtain a lineGHANA CLIMATE CHANGE VULNERABILITY AND ADAPTATION ASSESSMENT 49
of credit or attract potential investors, reducing agricultural productivity. Furthermore, tentative <strong>and</strong> changingterms of tenure lead to uncertain, <strong>and</strong> therefore shorter, planning horizons. Short-term planning is less likelyto entail large investments in productive assets or new technologies, as there is little opportunity for thetenant to capture any benefits from long-term investments. The same is true for investments in tree planting<strong>and</strong> sustainable forestry. Tenants are much more likely to maximize profits in the short term to ensure thatthey do not lose their investment. Thus, insecure tenure often leads to l<strong>and</strong> degradation <strong>and</strong> is economicallyunsustainable in the long term (Place <strong>and</strong> Hazell 1993; Lopez 1995; Hayes et al. 1997; Place & Migot-Adholla1998).L<strong>and</strong> scarcity <strong>and</strong> disputes over family l<strong>and</strong> were less common survey responses, but are likely to becomelarger problems in the future <strong>and</strong> may be locally important. For each successive generation available farml<strong>and</strong>is reduced, either through processes of commercialization <strong>and</strong> urbanization, or by the natural fragmentation<strong>and</strong> parcelization that occurs when l<strong>and</strong> is split between family members. The resulting smaller <strong>and</strong> noncontinuousplots will not provide for productive livelihoods unless more l<strong>and</strong> is made available. This isalready a problem in cocoa farming regions of the South. A study conducted in 1963 began suggesting that inmany cases fragmentation <strong>and</strong> parcelization had occurred to the extent that remaining linear strips forfarming were not economically viable (Hunter 1963). “With the depletion of virgin forest l<strong>and</strong> in Ghana [as aresult of the rapid expansion of cocoa cultivation] it [became] difficult for farmers to acquire more l<strong>and</strong> fortheir children.” (Benneh 1970: 206). This process is threatening to repeat itself in the Western Region ascocoa farming exp<strong>and</strong>s, <strong>and</strong> in the North.SOCIALLY VULNERABLE GROUPSEven in a well functioning customary system, access to l<strong>and</strong> through inheritance or other means is based onpower <strong>and</strong> social connections, which can limit access for certain groups or individuals based on their positionin society. Acquiring a plot of l<strong>and</strong> requires an abundance of social, political, <strong>and</strong> (most limiting) financialcapital, assets not readily available to all members of society. In Ghana, “productive l<strong>and</strong>s for growingcommercial crops are denied to the less powerful in society such as widows, women, <strong>and</strong> migrants when theydo not possess the backing of powerful men.” (Yaro & Zackaria 1996, 6).Women in particular have a difficult time accessing l<strong>and</strong>. Ghanaian culture is arranged to allow for theeconomic productivity of men, while women are expected to be domestically productive. “Women are notsupposed to be as economically productive as men are, <strong>and</strong> even if they are, men control their resources…This explains why Ghanaian society seems to invest more inheritance rights [to l<strong>and</strong>] on men than women”(Gedzi, 2009: 2). Women are therefore considered to be a part of their husb<strong>and</strong>’s economic unit – a wife’sclaim to her husb<strong>and</strong>’s property is limited or nonexistent (Runger 2006). In the absence of a husb<strong>and</strong>, awoman is left to rely on her father, her brother, or her son (if she is a widow).Farmers that are not attached to a l<strong>and</strong> owning family (farmers who cannot trace their lineage back to a plotof l<strong>and</strong>) also experience difficulty obtaining l<strong>and</strong>. Typically, they are forced to work as sharecroppers, ormarry into a family with a lineage that provides access to l<strong>and</strong>.Often, the primary asset of socially marginalized groups is their relatively cheap <strong>and</strong> readily available labor,which is somewhat useless without l<strong>and</strong> on which to turn that labor into a living. “In Ghana, whereas sharecontracts were a means by which l<strong>and</strong>-poor but labor-rich households could gain access to a plot, thoseseeking sharecrop l<strong>and</strong> must now put forward a significant fee in order to gain access.” (Amanor 2001). Lowcostlabor is not enough on its own to build a bridge out of poverty; it dem<strong>and</strong>s access to l<strong>and</strong> in order to betransformed into useful capital. If trends in l<strong>and</strong> tenure persist, <strong>and</strong> access to l<strong>and</strong> is denied to the sociallymarginalized<strong>and</strong> poverty-stricken members of society, the poverty cycle in Ghana will persist (Akoto et al.2006).50 GHANA CLIMATE CHANGE VULNERABILITY AND ADAPTATION ASSESSMENT
TENURE CONSIDERATIONS IN LIGHT OF CLIMATE CHANGE AND FEED THEFUTUREThe current l<strong>and</strong> tenure system in Ghana poses challenges for <strong>climate</strong> <strong>change</strong> mitigation efforts <strong>and</strong>implementing USAID’s Feed the Future program. We outline below some of these challenges that should betaken into consideration in order to make progress with these programs.Current customary l<strong>and</strong> tenure practices have been impacted by processes of commercialization <strong>and</strong>urbanization, which drive up l<strong>and</strong> prices. Commercial operators are better able to pay high fees in ex<strong>change</strong>for access to l<strong>and</strong>, which makes headsmen less likely to grant l<strong>and</strong> to subsistence farmers who cannotcompete with commercial operators. If Feed the Future focuses primarily on commercialized forms ofagriculture, this trend could be reinforced, <strong>and</strong> small-scale subsistence farmers could experience increaseddifficulty accessing l<strong>and</strong> <strong>and</strong> securing a livelihood. Increased l<strong>and</strong>lessness <strong>and</strong> unemployment will furtherstrain food security <strong>and</strong> local economies.Tree tenure, <strong>and</strong> complicated systems of benefit-sharing for revenues generated by trees, poses a threat toemerging <strong>climate</strong> <strong>change</strong> mitigation efforts. The confusing nature of tree ownership prompts manyl<strong>and</strong>owners to thwart the system entirely <strong>and</strong> illegally harvest trees. This creates problems for potential<strong>climate</strong> <strong>change</strong> mitigation efforts. Unless benefits can be shared equitably <strong>and</strong> transparently, or farmers arecompensated for protecting trees, the risks of trees being illegally cut remains high.Marginalized groups experience difficulty accessing l<strong>and</strong>, particularly women <strong>and</strong> farmers that are notaffiliated with a lineage that can establish a history of farming on a plot of l<strong>and</strong>. Presently, these groups areforced to work as sharecroppers, or find other forms of employment. Women are dependent on men(husb<strong>and</strong>s, fathers, brothers, <strong>and</strong> sons) to access farml<strong>and</strong>. If men are unable to access l<strong>and</strong> for themselves, itis unlikely that they will be able to provide l<strong>and</strong> for the women in their households. Therefore, interventionsthat reduce the amount of available l<strong>and</strong> for farmers (by displacing them for large-scale farming schemes)could further marginalize these groups, as they are already the last to receive l<strong>and</strong> in the present system. Somethought should be given about ways to incorporate these groups into commercial systems so they are notignored.One of Ghana’s assets is a large pool of low cost labor. Commercialized <strong>and</strong> mechanized farming eliminatethe need for this asset, utilizing inputs that are far more costly <strong>and</strong> potentially unsustainable in the long runwithout further inputs of foreign aid money (rising oil prices, fertilizers, tractors, etc.). An agricultural systemthat utilizes the available labor would not only provide jobs, it would eliminate the need for long-term inputsof capital.Expected impacts of <strong>climate</strong> <strong>change</strong> are variable in nature, but point to <strong>change</strong>s in weather patterns that willimpact farming, both in the short term, <strong>and</strong> in the long term. The threat of <strong>climate</strong> <strong>change</strong> is increasing<strong>climate</strong> variability. To cope with variable conditions, farmers will need longer planning horizons to work withwhen it comes to farming. The current tenure system does not allow much room for long-term planning.The current tenure system encourages maximizing profits in the short term. Practices employed in profitmaximizing farming schemes have a tendency to degrade the l<strong>and</strong>, leaving it increasingly vulnerable toextreme weather events. (Poor soil quality as a result of over-farming leads to erosion, which is increasedduring flooding; the use of fire to clear l<strong>and</strong> leads to bush fires, further spurred on by later rains or increasedtemperatures; etc.) Short-term <strong>and</strong> insecure tenure also contribute to deforestation. Finding ways topromote tenure security will help support sustainable forestry in Ghana.GHANA CLIMATE CHANGE VULNERABILITY AND ADAPTATION ASSESSMENT 51
5. PHYSIOGRAPHY,ECOLOGICAL ZONES, ANDLIVELIHOODSPHYSIOGRAPHIC ZONESLike most of the West African mainl<strong>and</strong>, Ghana is largely flat or gently undulating <strong>and</strong> >50 percent of thecountry is 450-600m. The southwest part of the basin is bordered by the northwest to southwest trending Kwahu Plateau (animportant climatic <strong>and</strong> drainage divide in Ghana), which forms a natural part of the Ashanti Upl<strong>and</strong>s. Thewestern part of the basin is bordered by the Akwapim-Togo ranges, which begin just north of Accra <strong>and</strong>stretch northeastward into Togo. The highest peak in Ghana, Mount Afadjato (885 m elevation) is situated inthe Akwapim-Togo Range along the eastern border. The lowest lying areas in Ghana occur in the middleVolta Basin <strong>and</strong> in a broad belt along the coast (Dickson <strong>and</strong> Benneh, 1988; Owusu-Ansah, 1994; MSE, 2002;Borrow <strong>and</strong> Demey, 2010). From a geographic perspective, the country can be sub-divided into severaldistinct regions: Low Plains, Ashanti Upl<strong>and</strong>s, the Volta Basin, <strong>and</strong> the High Plains (Owusu-Ansah, 1994).LOW PLAINSThe Low Plains roughly parallel the coastline <strong>and</strong> can be divided into four subregions: the Coastal Savanna,the Accra-Ho-Keta Plains (including the Volta Delta), <strong>and</strong> the Akan Lowl<strong>and</strong>s. A narrow strip of grassy <strong>and</strong>scrubby coast runs from a point near Takoradi in the west to the Volta River in the east. This coastal savanna,only about 8-km wide at its western end, stretches eastward of Accra through the Accra Plains, where itwidens to >80 km <strong>and</strong> terminates at the southeastern corner of the country at the lower end of the Akwapim-Togo Ranges (Owusu-Ansah, 1994).The Accra-Ho-Keta Plains begin near the southern terminus of the Akwapim-Togo Ranges near Accra <strong>and</strong>stretch north <strong>and</strong> eastward forming a large triangle in southeast of the country near the border with Togo.The Plains are almost flat <strong>and</strong> featureless <strong>and</strong> descend gradually from an inl<strong>and</strong> height of about 150 m to theGulf of Guinea. East of Accra the Plains are marked by a succession of ridges <strong>and</strong> spoon-shaped valleys <strong>and</strong>just west of Accra, the low plains contain wider valleys <strong>and</strong> rounded low hills with occasional rockyheadl<strong>and</strong>s. In general, however, the l<strong>and</strong> is flat <strong>and</strong> covered with grass <strong>and</strong> scrub <strong>and</strong> classified as savanna.The Volta Delta (or Keta Plains), which extends into the Gulf of Guinea in the extreme southeast of Ghana,forms a rather distinct subregion of the Low Plains. The rock formation of the Delta, consisting of thicklayers of s<strong>and</strong>stone, some limestone, <strong>and</strong> silt deposits, is flat, featureless, <strong>and</strong> relatively young. As the Deltafanned outward over time, s<strong>and</strong>bars developed across the mouths of the Volta <strong>and</strong> smaller rivers that emptyinto the Gulf in the same area, forming numerous, often large, lagoons (Owusu-Ansah, 1994).The largest part of the Low Plains is the Akan Lowl<strong>and</strong>s, which lie to the west <strong>and</strong> north of the CoastalSavanna <strong>and</strong> Accra Plains. Some classify this region as a subdivision of the Ashanti Upl<strong>and</strong>s because of themany characteristics they share. Unlike the upl<strong>and</strong>s, however, the height of the Akan Lowl<strong>and</strong>s is generallysea level to 150 m. Some ranges <strong>and</strong> hills rise to about 300 m, but few are >600 m. The lowl<strong>and</strong>s that lie to52 GHANA CLIMATE CHANGE VULNERABILITY AND ADAPTATION ASSESSMENT
the south of the Ashanti Upl<strong>and</strong>s receive several rivers that drain into the Gulf of Guinea (Densu, Pra,Ankobara, <strong>and</strong> Tano rivers) (Owusu-Ansah, 1994).VOLTA BASINThe Volta Basin, lying in the central part of Ghana, covers about 45 percent of the country’s total l<strong>and</strong>surface. The Basin’s northern section, which lies above the upper part of Lake Volta, rises to a height of 150to 215 m above sea level. The western rim along the Konkori Scarp <strong>and</strong> northern rim along the GambagaScarp reach elevations of 300 to 460 m. To the south <strong>and</strong> the southwest, the basin is
extend into the forest zone. Of the remaining forest, most is now restricted to protected areas <strong>and</strong> little isprimary forest, having been modified by humans (Owusu-Ansah, 1994).Seven main forest types are recognized within the forest zone, based on environmental, physiognomonic, <strong>and</strong>geographical criteria (Hall <strong>and</strong> Swaine, 1981): wet evergreen, moist evergreen, upl<strong>and</strong> evergreen, moist semideciduous,dry semi-deciduous, southern marginal, <strong>and</strong> southeast outlier forest. Three savanna types aregenerally recognized: a transitional zone, Guinea savanna, <strong>and</strong> Sudan savanna. The <strong>change</strong> from one type offorest or savanna to another is usually progressive. For purposes of addressing <strong>climate</strong> <strong>change</strong>, we delineatedecological zones in Ghana based primarily on annual total rainfall <strong>and</strong> major natural vegetation types (Hall<strong>and</strong> Swaine, 1976; MSE, 2002; Menczer <strong>and</strong> Quaye, 2006; Minia, 2008). We recognize six major zones: theCoastal Savanna Zone, Wet <strong>and</strong> Moist Evergreen Forest Zone, Deciduous Forest Zone, Transitional Zone,Guinea Savanna Zone, <strong>and</strong> Sudan Savanna Zone.54 GHANA CLIMATE CHANGE VULNERABILITY AND ADAPTATION ASSESSMENT
Figure 5.1 Ecological Zones of GhanaaCOASTAL SAVANNA ZONEThe Coastal Savanna Zone is a narrowbelt paralleling the coast (Jenik <strong>and</strong> Hall, 1976; Dickson <strong>and</strong> Benneh,1988; Menczer <strong>and</strong> Quaye, 2006; Minia, 2008). Depending on exact boundaryy placement, estimates of thearea covered by the zone ranges from5,800 km 2 (Oppong-Anane, 2001) to 16,000 km 2 (Menczer <strong>and</strong> Quaye,2006). Annual total rainfall averages 890 mm (range 600-1,150 mm, Menczerr <strong>and</strong> Quaye, 2006; Minia, 2008)<strong>and</strong> occurs in two annual peaks, but rainfall in thesoutheastern n part of the zone is the lowest in Ghana (ca.GHANA CLIMATE CHANGE VULNERABILITY ANDADAPTATION ASSESSMENT55
600-800 mm per year, Jennik <strong>and</strong> Hall, 1976;. Dickson <strong>and</strong> Benneh, 1988; Menczer <strong>and</strong> Quaye, 2006). Themajor growing season is 100-110 days <strong>and</strong> the minor season 60 days (Oppong-Anane, 2001). From a taperedwestern point, the Coastal Savanna Zone widens to about 80 km inl<strong>and</strong> <strong>and</strong> along its width includes southernparts of the Central, Greater Accra, <strong>and</strong> Volta regions. In southeastern Ghana, the region encompasses muchof the Accra Plain <strong>and</strong> Keta Plain (Volta Delta) as well as the southern third of the Ho Plain (Jenik <strong>and</strong> Hall1976, Oppong-Anane, 2001; Minia, 2008). The zone consists of a coastline str<strong>and</strong> of vegetation along theseashore, mangrove vegetation (mostly degraded) associated with lagoons <strong>and</strong> coastal estuaries, <strong>and</strong> inl<strong>and</strong>vegetation primarily of scrub, grasses, <strong>and</strong> scattered trees with relatively poor soils. The major vegetationtypes are classified as southern marginal forest from about Accra westward, southern outlier forest in theAccra Plains, <strong>and</strong> savanna in the Ho Plains (Hall <strong>and</strong> Swaine, 1976; Menczer <strong>and</strong> Quaye, 2006). The southernmarginal forest type occurs in a narrow strip from Cape Coast to Akosombo within the vegetation zoneclassified as coastal savanna. Because of population growth, southern marginal forests now are reduced tofragments <strong>and</strong> mosaics of forest mainly restricted to rocky hills (Menczer <strong>and</strong> Quaye, 2006).EVERGREEN FOREST ZONEThe Evergreen (Rainforest) Forest Zone is located in the southwestern corner of Ghana in the WesternRegion. The zone covers about 7 percent of Ghana <strong>and</strong> about 20 percent of all high forest in the country(Menczer <strong>and</strong> Quaye, 2006). The forest types in the zone are wet evergreen <strong>and</strong> moist evergreen (Hall <strong>and</strong>Swaine, 1976). The wet evergreen forest type occurs in the southeastern-most corner of the country in anarea of about 750,000 ha (SRID, 2010), where rainfall is highest at 1500-2100 mm/year (Menczer <strong>and</strong> Quaye,2006), averages 2,092 mm/year, <strong>and</strong> occurs on average 143 days/year (Minia, 2008). The major growingseason is 150-160 days <strong>and</strong> the minor season 100 days (Oppong-Anane, 2001). The moist evergreen foresttype lies between the area of wet evergreen forest to the southwest <strong>and</strong> the moist semi-deciduous forest tothe northeast; the area receives annual rainfall of 1500-1750 mm. Although somewhat less diverse floristicallythan the wet evergreen forest, the moist evergreen forest contains more species of commercial timber trees<strong>and</strong> as a result has been subjected to more logging.DECIDUOUS FOREST ZONEThe Deciduous Forest Zone includes two primary forest types: moist semi-deciduous forest <strong>and</strong> dry semideciduousforest (Hall <strong>and</strong> Swaine, 1976). The northern boundary of the zone follows the Kwahu Plateau,<strong>and</strong> the southern edge blends into the moist evergreen forest type. The zone has a more clearly defined dryseason than the evergreen forest types (MSE, 2002). Moist semi-deciduous forest occurs in a region receivinga total annual rainfall of 1,250-1,700 mm/year <strong>and</strong> abuts the moist evergreen forest type to the south. To thenortheast along the Kwahu Plateau, the narrow belt of dry semi-deciduous forest type is in an area receivingannual rainfall of 1,250-1,500 mm. Here there is a pronounced dry season. The major growing season is 150-160 days <strong>and</strong> the minor season 90 days (Oppong-Anane, 2001). The dry semi-deciduous forest has twosubtypes based mainly on amount of rainfall <strong>and</strong> occurrence of fire, a wetter inner zone, <strong>and</strong> a drier fire zonesubject to frequent fires (Hall <strong>and</strong> Swaine, 1976). In the fire zone, the opening of the forest canopy forfarming, the subsequent invasion of grass, <strong>and</strong> the effect of fire has destroyed the original high forest <strong>and</strong>allowed the invasion of savanna trees resulting in a mosaic of forest <strong>and</strong> savanna vegetation, referred to asderived savanna. This type is described as forests containing clearings of savanna or savanna with clumps offorest trees (MSE, 2002). The fire zone, along with the Guinea Savanna to the north, supplies much ofGhana’s fuelwood <strong>and</strong> charcoal (Menczer <strong>and</strong> Quaye, 2006). The Deciduous Forest Zone includes areas inthe Western, Ashanti, Central, Eastern, southern Brong Ahafo, <strong>and</strong> northern Volta regions.FOREST-SAVANNA TRANSITIONAL ZONEAs the name implies, the Forest-Savanna Transitional Zone is an area largely of derived savanna between theDry Semi-deciduous Forest Zone along the Kwahu Plateau <strong>and</strong> the Guinea Savanna to the north. The area isexp<strong>and</strong>ing along forest fringes with grassl<strong>and</strong> replacing forest (Oppong-Anane, 2001) <strong>and</strong> is believed to havebeen derived from forest (Dickson <strong>and</strong> Benneh, 1988). The boundaries of this region are variously drawn.Menczer <strong>and</strong> Quaye (2006) indicated it occurs between about 120 <strong>and</strong> 275 m in elevation <strong>and</strong> receives a totalannual rainfall of about 1450 mm. Oppong-Anane (2001) similarly placed the zone between about 7 <strong>and</strong> 8°56 GHANA CLIMATE CHANGE VULNERABILITY AND ADAPTATION ASSESSMENT
North latitude. Minia (2008) delineated a transitional eco-climatic zone as being farther north (about 7.5-8.5°North) with an average annual total rainfall of 1,301 mm with rain occurring an average of 101 days/year.SRID (2001) indicated the zone encompassed 6,630,000 ha of central Ghana. Rainfall occurs in one peak insome years <strong>and</strong> two peaks in others, although most years show two peaks (Oppong-Anane, 2001) with major<strong>and</strong> minor growing seasons of 200-220 <strong>and</strong> 60 days, respectively (SRID, 2010). Within this transitional area,most of the tree species are similar to those in the forest zone to the south (Dickson <strong>and</strong> Benneh, 1988), <strong>and</strong>occur in association with tall to medium tall grasses. The soils are fairly fertile <strong>and</strong> support a wide variety ofcrops.GUINEA SAVANNA ZONEThe Guinea Savanna Zone (also called Tallgrass Savanna Zone or Interior Savanna Zone) lies to the north ofthe Forest-Savanna Transition Zone <strong>and</strong> is the largest zone, occupying the entire northern half of the country(northern Brong-Ahafo, Northern, Upper West, <strong>and</strong> Upper East regions, about 14,790,000 ha; SRID, 2010).The zone has an extension through the Akosombo gorge <strong>and</strong> into the Ho Plains in southwestern Ghana(southern Volta Region). The zone receives an average annual rainfall of about 1,115 mm allocated among anaverage of 99 days/year (Minia, 2008). The Guinea Savanna Zone has one distinct rainy season beginning inlate April or early May, peaking in August-September <strong>and</strong> abruptly declining in October-November.The rainyseason is followed by a long dry period (Dickson <strong>and</strong> Benneh, 1988; Oppong-Anane, 2001). The singlegrowing season ranges from 180-200 days (SRID, 2010). Much of the eastern part of the zone lies in therelatively low-lying Volta River Basin, but the northern <strong>and</strong> western parts of the zone are situated on adissected plateau (the High Plains of the Konkori <strong>and</strong> Gambarga escarpments) (Owusu-Ansah, 1994). Soilsare generally poor but are most productive in floodplains <strong>and</strong> along river banks. The vegetation is that ofwooded grassl<strong>and</strong>, consisting of a ground cover of grasses of varying heights interspersed with fire-resistant,deciduous, mostly broad-leaved trees, some of which also occur in the dry semi-deciduous forest type to thesouth. The other dominant feature of the vegetation in the zone is the grasses that grow under <strong>and</strong> betweenthe trees. Tree cover <strong>and</strong> tree height decrease from south to north along a decreasing rainfall gradient(Owusu-Ansah, 1994). In their most luxuriant state trees show varying completeness in canopy (Dickson <strong>and</strong>Benneh, 1988; Benneh <strong>and</strong> Agyepong, 1990). Likewise, the grasses in the Guinea Savanna Zone are notuniform but differ according to soil type <strong>and</strong> moisture regime (Oppong-Anane, 2001; MSE, 2002). Thegrasses tend be tall (2-3 m), dense perennial species which, with increased latitude, are replaced by smallerspecies, among which annuals become increasingly common (Owusu-Ansah, 1994). Bare, granitic inselbergsare a typical feature of the savanna l<strong>and</strong>scape. In the dry season, fires, most of which are set by humans, ragethrough the region.SUDAN SAVANNAThe Sudan Savanna (or Short-Grass Savanna) lies to the north of the Guinea Savanna <strong>and</strong> covers a greaterpart of Burkina Faso <strong>and</strong> Mali. Like the Forest-Savanna Transition zone, its boundaries are variously drawn.Some (Dickson <strong>and</strong> Benneh, 1988; MSE, 2002; Oppong-Anane, 2001; Menczer <strong>and</strong> Quaye, 2006) limit thezone to extreme northeastern Ghana in the Upper East Region in an area variously estimated as 1,900 (SRID,2010), 7,200 (Benneh <strong>and</strong> Agyepond, 1990), <strong>and</strong> 10,540 km 2 (MSE, 2002). Minia (2008) delimited a muchbroader eco-climatic belt of Sudan Savanna across northern Ghana, corresponding roughly to the southernboundary of the Upper East Region <strong>and</strong> the northern half of the Upper West Region (about 10.5° Nlatitude). Given the rather high population pressure in the area, the former small patch in the Upper EastRegion may simply be the result of degradation by man rather than a climatic biome (Oppong-Anane2001). Similarly, the broader belt (Minia, 2008) may likewise simply indicate degradation of Guinea Savannaby poor l<strong>and</strong> use practices. The natural vegetation of the Sudan Savanna Zone is characterized by fire-sweptshort grasses interspersed with low-density woodl<strong>and</strong> of short, low branching, thin-leaved, deciduous speciesthat are drought <strong>and</strong> fire-resistant (Dickson <strong>and</strong> Benneh, 1988). Grass cover is sparse <strong>and</strong> in areas the l<strong>and</strong> isbare <strong>and</strong> severely eroded (Menczer <strong>and</strong> Quaye, 2006).GHANA CLIMATE CHANGE VULNERABILITY AND ADAPTATION ASSESSMENT 57
AGRICULTUREAgriculture dominates the Ghanaian economy in terms of income, employment, food security, <strong>and</strong> exportearnings. Performance of the sector, however, has lagged other segments of the economy at rates lower thangrowth in GDP. Positive growth rates within the agriculture sector come primarily from cocoa production<strong>and</strong> marketing. The livestock, fisheries <strong>and</strong> food crops sub-sectors, on the other h<strong>and</strong>, have not shown anyappreciable improvements. Nevertheless, modernization of the agriculture sector is expected to be animportant driver of growth in the medium-term on the basis of improved productivity; the growth goalscannot be met by simply exp<strong>and</strong>ing l<strong>and</strong> under cultivation (Breisinger, Diao et al. 2008). The Government ofGhana considers agricultural modernization as a pre-condition for the structural transformation of theeconomy <strong>and</strong> the sustainable reduction in the incidence of poverty. Central to this strategy are improvementsin food crop production <strong>and</strong> expansion of cash crops with a heavy reliance on transforming smallholderfarmers by increasing their market orientation (Chamberlin 2007).The dominance of rain-fed agriculture in Africa makes its population vulnerable to <strong>climate</strong> <strong>change</strong>,particularly warmer temperatures <strong>and</strong> lowered rainfall, <strong>and</strong> some countries are more vulnerable than others(Kurukulasuriya, Mendelsohn et al. 2006; Dasgupta <strong>and</strong> Baschieri 2010). Additional constraints (diseaseburden, debt burden, political instability, <strong>and</strong> conflict) reduce the adaptive capacity <strong>and</strong> increase the<strong>vulnerability</strong> of rural populations (Challinor, Wheeler et al. 2007; Brown <strong>and</strong> Crawford 2008). Generally,however, African countries lag the rest of the world in adopting agricultural innovations, such as high-yieldingcrop varieties <strong>and</strong> capital intensive technologies such as irrigation (Evenson <strong>and</strong> Gollin 2003; Kurukulasuriya,Mendelsohn et al. 2006). Even as <strong>climate</strong>-neutral innovations could improve the lot of farmers currently <strong>and</strong>possibly increase their resilience in the face of future <strong>climate</strong> conditions, agricultural intensification could leadto other vulnerabilities. Intensification that led to higher incomes would likely attract migrants using lessadapted methods that resulted in degradation, especially at <strong>climate</strong> zone margins (Geist, Lambin et al. 2006).SMALLHOLDERSThe commonly held view of agriculture in Ghana is that smallholders predominate, with about 90 percent offarm holdings 2 ha).58 GHANA CLIMATE CHANGE VULNERABILITY AND ADAPTATION ASSESSMENT
Table 5.1 Percentage of producer households that grow maize <strong>and</strong> cassava,by farm size <strong>and</strong> ecological zone, 2005/2006MaizeCassavaFarm size (ha) Coast Forest Savanna Coast Forest Savanna5 63 67 86 85 81 35Average 70 66 61 88 82 27Source: Chamberlin, 2007Somewhat surprisingly, a significant share of smallholders sells some portion of their production although theproportion is greater for larger l<strong>and</strong>holders. Thus, even smallholders have multiple objectives of food security<strong>and</strong> generating cash to purchase clothing <strong>and</strong> other needs (Yiridoe, Langyintuo et al. 2006). With theexception of rice; the Savanna zone has the lowest rates of market participation. Nationally, groundnuts arethe most commercialized crop <strong>and</strong> millet the least.Although growth rates in agricultural production have slowed since the 1980s, they have been positive; annualgrowth over the period 1991-2000 was 3.97 percent (Chamberlin, 2007). Most of the growth, however, camefrom increases in the area harvested, not from productivity gains; rice <strong>and</strong> millet were exceptions. There aresubstantial differences in regions of the country, both in terms of average growth rates for maize <strong>and</strong> theshare of growth resulting from extensification versus intensification (Figure 5.2). The strategy ofextensification (increasing the area under cultivation) has led to significant environmental damage(deforestation, desertification <strong>and</strong> soil erosion) <strong>and</strong> is clearly unsustainable (FAO, 2003). Meeting theambitious goals set by the government for increased agricultural productivity will be challenging; interventionis needed to set agriculture on a different development trajectory (Breisinger, Diao et al. 2008).GHANA CLIMATE CHANGE VULNERABILITY AND ADAPTATION ASSESSMENT 59
Source: Chamberlin, 2007Figure 5. 2 Average annual growth rates due to increased harvestarea<strong>and</strong> yield (productivity gain), 1994-2003CROPPING AND FARMING SYSTEMSCropping systems in Ghana are highly diverse, reflecting dynamic <strong>adaptation</strong>ss to increasingpopulationpressure, l<strong>and</strong> insecurity, <strong>climate</strong> variability, <strong>and</strong> new trading opportunities or markets (Challinor, Wheeler etal. 2007). A generalized scheme (Table 5.2) differentiates cropping systems onthe basis of permanence,ranging from episodic to permanent cropping. Episodic cropping systems aree further differentiated by thelength of the fallow interval; traditional shifting cultivation, withh fallow periods of 10 years to recover structural stability, which can be less with covercrops (Valentin, Rajot et al. 2004).Most smallholder farmers combine strategies to meet their foodd security <strong>and</strong> cash flow needs; farmingsystems may combine sedentary <strong>and</strong> shifting cropping systems as well as intercropping <strong>and</strong>rotationalcropping. Even cocoa farmers retain some of theirl<strong>and</strong> to growfood crops tomeet their own needs(S<strong>and</strong>ker, Nyame et al. 2010). Traditional croppingsystems in semi-arid West t Africa, including the northernsavanna zones in Ghana, are dominated by cereal-based systems, usually combining two ormore crops in afield. Intercropping minimizes risk ofcrop failure from droughtt or flooding <strong>and</strong> spreads the need for labor60 GHANA CLIMATE CHANGE VULNERABILITY AND ADAPTATION ASSESSMENT
over a longer period. With the risk spread over two crops, a smallholder can take advantage of a long growingseason during a year of above average precipitation. In the savanna zones, farming systems have beenmodified from shifting cultivation to a combination of compound <strong>and</strong> bush fallow systems. Compoundcropping involves intensively cropping fields around the compound house with vegetables, millet, guineacorn, maize, cowpea, tobacco, <strong>and</strong> melons. These fields are kept fertile with household compost <strong>and</strong> livestockmanure. The next zone of short-fallow fields are rarely fertilized <strong>and</strong> grow millet, guinea corn, <strong>and</strong>groundnuts (EPA 2008). The surrounding area may have upl<strong>and</strong> or lowl<strong>and</strong> bush fallow fields for growingyams <strong>and</strong> other staples or communal l<strong>and</strong> for grazing. Crop residues from the bush fallow are the mainsource of livestock feed in the dry season (Bationo <strong>and</strong> Ntare 2000).GHANA CLIMATE CHANGE VULNERABILITY AND ADAPTATION ASSESSMENT 61
Table 5.2 Cropping Systems in GhanaCropping System Ecological Zone Crops Negatives PositivesShifting Cultivation/BushFallow/Grass Fallow(clear vegetation, burn; fallowperiod to restore soil fertility)Permanent Tree Crop(permanent tree crops usually amonocrop; cocoa is the mostextensive)Mixed(integrates bush fallow systemwith permanent tree crops;intercropping of food cropstemporary until trees grow <strong>and</strong>becomes too shaded)Compound(farms are cultivated within closevicinity of villages <strong>and</strong> commonlycombined with animal husb<strong>and</strong>ry;includes upl<strong>and</strong> <strong>and</strong> lowl<strong>and</strong> bushfallow <strong>and</strong> sometimes fadama)Irrigated, Floodplain, Fadama(swamp rice cultivation, irrigatedfarming, naturally moist valleys<strong>and</strong> depressions; fadama is aHausa word for irrigable l<strong>and</strong>)Special Horticultural Crops(mostly grown for export)Dominant farmingsystem throughoutGhanaRainforest, semideciduousforest <strong>and</strong>transition zones;cocoa cultivation hasmoved across Ghana,now mostly in therainforest (west)Rain forest <strong>and</strong> semideciduousforestzonesNothern savannazonesNothern savannazonesDepends on zone Soil exposed to erosion;fire alters microbialcommunities <strong>and</strong> canreduce long-term soilquality; nitrogen isvolatilized; deforestation;escaped agricultural firesdegrade the rurall<strong>and</strong>scapeCocoa, citrus, oilpalm, avocado,rubber, coffee,mangoCocoa with foodcrops or oil palmwith food crops;taungya to restoreforest trees is avariantCashew <strong>and</strong> cassavaintercrops <strong>and</strong> foodcrops such as yam,maize <strong>and</strong> cassava.tomato, okro,pepper <strong>and</strong> gardeneggsRice, dry seasonvegetablesSouthern Ghana pineapples,pawpaw, <strong>and</strong> exoticvegetablesDeforestation; increasinglysun-grown cocoa varietiesmean no tree cover cover(i.e., tree removal)Soil exposed to erosion<strong>and</strong> associated nutrient<strong>and</strong> water lossSoil erosion, leaching <strong>and</strong>eutrophication areprevalent in this zone;Deforestation of riparianor gallery forestsSoil erosion,Eutrophication, depletionof nutrients from s<strong>and</strong>ysoils.Long fallow can restore soil physical <strong>and</strong> chemicalconditions; correct mixture of crops (for example, cereals,<strong>and</strong> legumes) can augment soil fertility, promote waterretention, <strong>and</strong> prevent flooding. Within a field during thecropping period, farmer may rotate crops (shallow vs. deeprooted, nutrient dem<strong>and</strong>)Soil erosion prevention or restoration, groundwaterrecharge, watershed protection, air quality improvementthrough carbon sequestration, beautification of the rurall<strong>and</strong>scapeCarbon sequestration, forest restorationPermanent agriculture with soil fertility often maintained inthe compound fields62 GHANA CLIMATE CHANGE VULNERABILITY AND ADAPTATION ASSESSMENT
LAND SUITABILITYThe CSIR-Soil Research Institute has used an agro-ecological zoning method with a GIS to assess the suitability ofregions within Ghana for different crops <strong>and</strong> farming systems (Boateng 2005). The rationale for the method is thatcrops require a specific range of soil <strong>and</strong> <strong>climate</strong> conditions for best growth <strong>and</strong> some soil <strong>and</strong> terrain characteristicsconstrain cropping systems. A crop’s <strong>climate</strong> <strong>and</strong> soil requirements are defined based on knowledge <strong>and</strong> empiricalresearch. Soil <strong>and</strong> terrain factors such as soil type, texture, drainage, depth to impermeable layer, pH, salinity, <strong>and</strong>slope might be considered along with length of the growing season, temperature, <strong>and</strong> microclimatic factors duringcritical growth stages (Boateng 2005). Once the critical factors are defined, the range of values can be classified as tosuitability. Geo-referenced soil, <strong>climate</strong>, <strong>and</strong> terrain variables are then interpreted in terms of the suitability classes <strong>and</strong>map layers produced for each factor; the factor layers were st<strong>and</strong>ardized to a grid cell (pixel) size for further analysis.Combining <strong>climate</strong>, soil, <strong>and</strong> terrain feature suitability sequentially by limiting factors results in an interpretive map ofsoil-crop suitability (Map 5.2).Areas on the map in shades of green (S1a, S1b, S2a, S2b, <strong>and</strong> S2c) are suitable for extensive cultivation of export <strong>and</strong>food crops (soil descriptions are given in Table 5). The S1 soils are highly suitable for mechanized cropping (suitablecrops are shown in Table 5.3) <strong>and</strong> the S2 soils are suitable for mechanized cropping with some limitations. The S3soils (olive, yellow, <strong>and</strong> light tan colors on the suitability map) are not suitable for mechanized cropping but are stillfairly suitable for cultivating a variety of crops. The S4 soils are less suitable (fairly or marginal) for agriculture,forestry, <strong>and</strong> improved pasture. The N1 soils are unsuitable for arable agriculture, tree crops or grazing due to heavytexture <strong>and</strong> poor drainage; N2 soils are very unsuitable for crop or livestock production. The D soils developed inlagoons <strong>and</strong> their high salinity makes them unsuitable for crop or livestock production.Soil suitability for cropping is not the only consideration in agricultural development but is certainly a major factor insustainability. Although this map provides sufficient guidance for large-scale planning, more detailed soils informationis needed for project planning. A further limitation is that interpretations were made on currently available cropvarieties under current climatic conditions; breeding programs may produce varieties that overcome some limitations<strong>and</strong> <strong>climate</strong> <strong>change</strong> may alter agro-climatic zones.GHANA CLIMATE CHANGE VULNERABILITY AND ADAPTATION ASSESSMENT 63
Source: CSIR-Soil Research Institute, KumasiFigure 5.3 Soil-crop suitability map for Ghana64 GHANA CLIMATE CHANGE VULNERABILITY AND ADAPTATION ASSESSMENT
Table 5.3 Crop Suitability by Soil UnitsSoilClassMajor Crops Mechanized Soil Description LimitationsS1a Export – cocoa, coffee, black pepper, sweet berry,ginger, mango, cashew, avocado, nutmeg, sunflower,oil palm, jatropha, citronella grass; Food – maize,cassava, soybeans, cocoyam, plantain, bananaS1b Export – cashew, sunflower, mango, jatropha,citronella grass, soybeans; Food – pineapple, maize,guinea corn, millet, yams, groundnuts, tomatoesS2a Export – cashew, sunflower, mango, jatropha,citronella grass, soybeans; Food – pineapple, maize,guinea corn, millet, yams, groundnuts, tomatoes;lowl<strong>and</strong> soils suitable for rice, sugarcane, vegetablesS2b Valley inclusions only are suitable for cashew,sunflower, mango, jatropha, citronella grass,soybeans, pineapple, maize, guinea corn, millet, yams,groundnuts, tomatoes, avocado, pears, oil palm,jatropha, citronella grass, citrusS2c Export – cocoa, coffee, black pepper, sweet berry,ginger, mango, cashew, avocado, nutmeg, sunflower,oil palm, jatropha, citronella grass; Food – maize,cassava, soybeans, cocoyam, plantain, bananaS3a Maize, guinea corn, millet, citronella grass, vegetables,livestockS3b Export – cashew, sunflower, mango, jatropha,citronella grass, soybeans; Food – pineapple, maize,guinea corn, millet, yams, groundnuts, tomatoes;lowl<strong>and</strong> soils suitable for rice, sugarcane, vegetablesS3c Sugarcane, citronella grass, maize, pepper, tomatoes,onions, garden eggsS3d Cashew, sunflower, mango, jatropha, citronella grass,soybeans, pineapple, maize, guinea corn, millet, yams,groundnuts, tomatoes; inclusions only suitable forh<strong>and</strong> cultivation of cassava <strong>and</strong> pepperYes Deep red to yellowish red, well-drained loams, pale-colored lowerslope <strong>and</strong> valley bottom soils, silty clay loam to silty clay upl<strong>and</strong> driftsoilsYes Very deep to deep, non-gravelly, red to brownish or yellowish redhumus of fine s<strong>and</strong>y loam or clay loams; non-gravelly, imperfectly towell-drained, moderately shallow, red to brownish or pinkish grays<strong>and</strong>s, s<strong>and</strong>y loams pr clay loams or deep, imperfectly to welldrained,red to pale-colored clays or loamsLimited Gritty, red, yellowish brown, grayish yellow or gray alluvial coarseor loamy s<strong>and</strong>, well to poorly-drained, <strong>and</strong> are concretionary <strong>and</strong>gravelly in the upper soil or brown to gray brown clay loam, welldrained;brown, well to moderately well-drained concretionary siltyclay loams; poorly drained alluvial clays in valley bottomsNo Very shallow, well-drained, red soils on moderate slopes <strong>and</strong> hills,excessively drained, brown, brashy soils or red concretionary clayson summits <strong>and</strong> clay loams on middle slopes; valley soils yellowbrown <strong>and</strong> gray brown alluvial s<strong>and</strong>s <strong>and</strong> s<strong>and</strong>y clays; middle <strong>and</strong>steep slopes red to dark brown, well-drained humus loamsYes Similar to S2a but with considerable inclusions of very deep, red ordark reddish brown, well-drained s<strong>and</strong>y clay loam to non-gravellymedium textured soils on summits, upper <strong>and</strong> middle slopes; lowerslopes <strong>and</strong> valley bottoms are deep, yellowish brown to grayishbrown, poorly to imperfectly drained hill wash s<strong>and</strong>y loam, s<strong>and</strong>yclay loam or alluvial loamy s<strong>and</strong>sNone; summits, upper<strong>and</strong> middle slopesNone; upper <strong>and</strong> middleslopes; upper to almostflat valley bottomsUpl<strong>and</strong> soils cultivablebut gravelly subsoil <strong>and</strong>slopes limit mechanicalcultivation; erosiveShallow <strong>and</strong> skeletal soilssuitable for forestry only;lowl<strong>and</strong> soils suitable forcultivationNo Brown, calcareous clay loams Rainfall limitedNo Brown, calcareous clay loams, gravelly Slope, erosiveNo Deep brown to grayish brown, moderately to imperfectly drained,non-gravelly <strong>and</strong> medium-texturedNo Upl<strong>and</strong> soils red, well-drained concretionary clays, slopewashmaterials, deep red, well-drained loams with seasonally orperennially, ill-drained s<strong>and</strong>y or clayey, pale-colored lower-slope <strong>and</strong>bottomsLevees <strong>and</strong> terracesalong major riversInclusions of gravelly,shallow soils limitmechanical cultivationGHANA CLIMATE CHANGE VULNERABILITY AND ADAPTATION ASSESSMENT 65
S4a Cashew, sunflower, mango, jatropha, citronella grass,soybeans; Food – pineapple, maize, guinea corn,millet, yams, groundnuts, tomatoes; lowl<strong>and</strong> soilssuitable for rice, sugarcane, vegetablesNo ErosiveS4b Forestry, watershed protection No Summits of limited areas of gravelly soils, moderately to veryshallow to parent rockShallow but associatedwith extensive areas ofS1a soilsS4c Forestry, watershed protection No Summits of limited areas of shallow to very shallow gravelly soils Shallow but associatedwith extensive areas ofS1b soilsS4d A mix of soils; some are suitable for mechanized,irrigated cultivation of crops such as maize guineacorn, millet, tomatoes, peppers, onions, okro; someonly for pasture; valley bottoms suitable for rice,sugarcane, <strong>and</strong> vegetablesS4e Cashew, sunflower, mango, jatropha, citronella grass,soybeans, pineapple, maize, guinea corn, millet, yams,groundnuts, tomatoes can be grown withmechanization but major inclusions of poorly drainedsoils only suitable for swamp rice or pastureLimited Deep, brown to gray brown, moderately well-drained s<strong>and</strong>s tos<strong>and</strong>y loams; limited areas of gray, hard claypan soils <strong>and</strong> gray clayloam to clays in valley bottomsLimited Upl<strong>and</strong>s of deep to very deep, red, well-drained non-gravellymedium textured soils with inclusions on the flat lowl<strong>and</strong>s ofshallow, gray mottled brown, imperfectly to poorly drained, gravellys<strong>and</strong>y loams underlain by seepage iron pansInclusions of hardpansoils limit mechanicalcultivationLimited by inclusionsN1a Rice, sugarcane, vegetables No Deep, gray brown, imperfectly to very poorly drained s<strong>and</strong>y loamsto clay loams on levees <strong>and</strong> valley bottomsN1b Swamp rice, pasture No Groundwater laterites: gray s<strong>and</strong>y loams overlying gray mottledbrown gravelly clays underlain by iron pansPoor drainageWaterlogged in wetseasonN1c Rice, sugarcane, vegetables No Deep, heavy plastic clays on poorly drained lowl<strong>and</strong>s Poor drainageN1d Grass pasture, early crops No Humus-stained upper layer over yellowish brown s<strong>and</strong>y loamunderlain by weakly developed sub-angular blocky structure,frequent to abundant ironstone concretions, imperfectly drainedShallow, erosive,boulder-strewn surfaceN2 Watershed protection No Shallow, gravelly soils over parent rock on steep slopes Iron pan boulders onrocky, steep slopesD1 Salt mining No Lagoon-derived alluvial soils, heavy plastic clays Seasonally flooded withbrackish water(Source: CSIR-Soil Research Institute, Kumasi)66 GHANA CLIMATE CHANGE VULNERABILITY AND ADAPTATION ASSESSMENT
MAJOR CROPSMAIZEMaize is the most important food crop for smallholders, who obtain 20 percent of their caloric intake frommaize. Because maize also is used to meet their cash needs, about half of maize produced is marketed(Braimoh <strong>and</strong> Vlek 2006). The Northern Region once was Ghana’s leading producer of maize but yields havedeclined from an average yield in 1996 of >1200 kg/ha to less than 900 kg/ha in 2000 (Braimoh <strong>and</strong> Vlek2006). Soil quality is the most important factor in maize yields in northern Ghana; cropping systems areneeded that conserve soil organic matter (SOM) <strong>and</strong> minimize cultivation.Low soil organic matter <strong>and</strong> limited availability of plant nutrients, in particular phosphorus <strong>and</strong> nitrogen, aremajor bottlenecks to agricultural productivity in Ghana, which is further hampered in the Savanna Zone bysubstantial topsoil losses through wind <strong>and</strong> water erosion (Schlecht, Buerkert et al. 2006). Low soil organicmatter levels are due in part to “cut <strong>and</strong> carry” removals for livestock feed in the dry season. Residue burningto prepare fields for planting is another factor in low N inputs (Braimoh <strong>and</strong> Vlek 2006) <strong>and</strong> escapedagricultural fires are a problem throughout Ghana <strong>and</strong> is practically an annual event in parts of the savannazones.Braimoh <strong>and</strong> Vlek (2006) found that maize productivity in the Northern Region was limited by soil organiccarbon, low clay content (which affected moisture holding capacity), <strong>and</strong> low potential for chemical activity(ECEC, ex<strong>change</strong>able cation ex<strong>change</strong> capacity). The average level of nitrogen additions was 8.3 kg/ha/yr,well below the optimum level of 100 kg/ha/yr; fertilizer additions decreased as costs rose relative to pricesfor maize. Fertilizer use was a major policy strategy in the 1960s <strong>and</strong> 1970s with the government providingsubsidies. After subsidies were removed in the structural adjustments of the 1980s, mineral fertilizer use bysmallholders declined rapidly (FAO 2003). In addition to price constraints, the lack of access to credit, poormarketing, <strong>and</strong> distribution of fertilizer affect farmers’ decisions (Braimoh <strong>and</strong> Vlek 2006).Planted legume fallows have been tested that improve soil fertility <strong>and</strong> crop yields but cover crops are notattractive to farmers unless there is an additional benefit, e.g., livestock feed. Even with these organic systems,added fertilizer phosphorus <strong>and</strong> possibly potassium additions are required to sustain or maximize yields(Braimoh <strong>and</strong> Vlek 2004). For example, legumes that fix atmospheric nitrogen need phosphorus inputs foroptimum production (Braimoh <strong>and</strong> Vlek 2006).GHANA CLIMATE CHANGE VULNERABILITY AND ADAPTATION ASSESSMENT 67
Source: Chamberlin, 2007, Figure12Figure 5.4 Average annual district growth rates for maize, 1994-200368 GHANA CLIMATE CHANGE VULNERABILITY AND ADAPTATION ASSESSMENT
Source: Chamberlin, 2007, Figure 13Figure 5.5Share of district maizegrowth from area expansion, 1994-2003GHANA CLIMATE CHANGE VULNERABILITY ANDADAPTATION ASSESSMENT69
RICEOverall rice yields in sub-Saharan Africa are low; recent upward trends in rice production were mainly due tothe expansion of rice production into marginal areas in West Africa where rice is grown more for subsistencethan as a cash crop. Rice production accounts for 15 percent of agricultural GDP <strong>and</strong> 45 percent of the totalarea planted to cereal grains in Ghana (Yiridoe, Langyintuo et al. 2006). The main production systems areirrigated, rainfed lowl<strong>and</strong>, <strong>and</strong> rainfed upl<strong>and</strong> systems (Table 5.4). Urban consumers prefer imported ricebecause the domestic rice is of inferior quality; it is uneven in quality, with impurities. Thus two challenges tocommercialization of rice production in Ghana are to increase productivity <strong>and</strong> improve quality of domesticrice.Higher-yielding rice varieties have been developed by the West African Rice Development Association(WARDA). These ‘New Rice for Africa’ (NERICA) varieties are based on crossings between African rice(Oryza glaberrima Steud.) <strong>and</strong> Asian rice (O. sativa L.). The NERICA varieties have high yield potential <strong>and</strong>short growth cycle. Other desirable traits are early vigor during the vegetative growth phase (which may beuseful for competing with weeds), <strong>and</strong> some varieties are resistant to African pests <strong>and</strong> diseases, such as thedevastating blast, as well as rice stemborers <strong>and</strong> termites. They also have higher protein content <strong>and</strong> aminoacid balance than most of the imported rice varieties.RAINFED UPLANDYields in upl<strong>and</strong> systems average about 1 t ha-1. Factors responsible for low yields include weed competition,drought, blast disease, soil acidity <strong>and</strong> low fertility (especially P). Traditionally, a long period of bush fallowwas used to control weeds <strong>and</strong> maintain soil fertility but fallow periods have decreased. The increased weedcompetition increases labor needs during the main cropping season, which is already a problem in some areas,such as the northern savanna zones.RAINFED LOWLANDAdequate water control is the key to higher yields in rainfed lowl<strong>and</strong> rice grown on flood plains <strong>and</strong> in valleybottoms; typical yields vary from 1 to 3 t ha-1. Although these systems have a high potential forintensification, development faces socio-economic constraints from access to resources to increase inputs,production risk, farmer knowledge of appropriate management practices, l<strong>and</strong> insecurity, <strong>and</strong> human healthproblems, such as malaria (Tanser, Sharp et al. 2003; Haines, Kovats et al. 2006). Smallholder production inthe northern savanna zones is on lowl<strong>and</strong> fields (i.e., river alluvial plains); there is little upl<strong>and</strong> rice grown inthe northern savanna zones.IRRIGATED RICEIrrigated rice is mainly in the northern savanna zones <strong>and</strong> yield potential is much higher than in rainfedsystems, 10 t ha-1. Major challenges of irrigated rice production are adequate water control <strong>and</strong> maintainingthe irrigation system. Irrigated systems account for 25 percent of national production with access to irrigationsystems dominated by political elites <strong>and</strong> economic power groups. The few irrigated rice projects in theNorthern Region are controlled by the Ghana Irrigation Development Authority (Yiridoe, Langyintuo et al.2006).70 GHANA CLIMATE CHANGE VULNERABILITY AND ADAPTATION ASSESSMENT
Total area(ha)MangroveswampTable 5.4 Rice cropping systems in GhanaDeepwaterIrrigatedlowl<strong>and</strong>Rainfedlowl<strong>and</strong>Rainfedupl<strong>and</strong>81,000 0 0 12,150 12,150 56,700Rice production in the northern savanna zones is constrained by nutrient limitations, especially nitrogen(Yiridoe, Langyintuo et al. 2006) but financial constraints <strong>and</strong> production risks (drought <strong>and</strong> flooding) limitchemical inputs (Langyintuo, Yiridoe et al. 2005). Although improved fallow (leguminous cover crops) wouldincrease yields, optimal yields would only be possible with increased nutrient inputs (Langyintuo, Yiridoe et al.2005), which is also the case with upl<strong>and</strong> rice elsewhere in West Africa (Becker <strong>and</strong> Johnson 2001). Optimalwhole-farm production systems, including rice using traditional (grass fallow) methods, requires more than 9ha of production l<strong>and</strong>, which is about twice as much as the mean l<strong>and</strong> holding for Northern Ghana (Yiridoe,Langyintuo et al. 2006; Chamberlin 2007). Yiridoe et al. (2006) concluded from their modeling results thatthat transforming existing smallholders into commercial operations will require increasing l<strong>and</strong> holdings.Replacing traditional grass fallow with short-duration leguminous cover crop fallow would be accompaniedby increasing mechanization to replace the labor needed to farm the larger acreages.Boateng (2005) used the agro-ecology zone method to estimate the amount of l<strong>and</strong> in Ghana suitable forrain-fed rice agriculture. Three rice cultivars of differing maturation periods were used in the suitabilityevaluation. He found that 48 percent of the total l<strong>and</strong> area of Ghana could potentially support growth of thevery early-maturing variety that required < 100 days to mature, amounting to about 11 million ha. Of course,the same l<strong>and</strong> areas are also suitable for a variety of other crops, including maize; therefore, his estimatesshould be regarded as optimistic. The amount of l<strong>and</strong> suitable for the medium maturing cultivar (120-140days) dropped to 5 million ha (26 percent of the l<strong>and</strong> area). If only the areas judged very suitable for rainfedrice production were targeted for development as these should be the areas with the highest yield potential,then the suitable l<strong>and</strong> would be 9 percent (about 2 million ha). Although Boateng (2005) used a GIS to mapthe suitability for rainfed rice cultivation, the poor quality of the publication available online does not permitus to comment on the location of suitable soils.Commercialization of maize <strong>and</strong> rice production in the northern savanna zones requires increased l<strong>and</strong>security in order to motivate farmers to invest in technology <strong>and</strong> inputs. Commercialization of maizeproduction already has led to <strong>change</strong>s in the l<strong>and</strong> tenure patterns <strong>and</strong> a tendency to preferentially allocate l<strong>and</strong>to large-scale commercial farmers (Braimoh <strong>and</strong> Vlek 2006). Pressure on the available l<strong>and</strong> resource hasalready intensified conflict between farmers <strong>and</strong> herdsmen on the alluvial plains <strong>and</strong> among smallholderswhere l<strong>and</strong> fallowed by one family has been reallocated to another family (Braimoh <strong>and</strong> Vlek 2006).Transforming rice cropping in the northern savanna zones would include concentrating access to l<strong>and</strong> in theh<strong>and</strong>s of wealthy producers, while smallholders would lose their use rights (Yiridoe, Langyintuo et al. 2006).Because the optimal rice farming system integrates livestock with crop production, the current system ofopen grazing on communal l<strong>and</strong>s would not be compatible <strong>and</strong> would likely mean a transition toward foragebasedfeeding systems <strong>and</strong> year-round confinement (Yiridoe, Langyintuo et al. 2006). Forage-based feeding<strong>and</strong> livestock confinement begs the question of how the forage be raised (e.g., inputs, processing, storage)<strong>and</strong> how smallholders would confine livestock on already small l<strong>and</strong> holdingsCOCOAGhana is one of the world’s top producers <strong>and</strong> exporters of cocoa <strong>and</strong> the sector has played a key role in thenation’s economic development (Breisinger, Diao et al. 2008). Recent increases in production have comefrom expansion of the l<strong>and</strong> cropped to cocoa <strong>and</strong> higher inputs of family labor. Suitable cocoa l<strong>and</strong> is limitedto the Rainforest Zone (Figure 5.6) <strong>and</strong> production has moved across Ghana from east (Volta Region) towest, the so-called cocoa frontier. In 2006, fully 25 percent of cultivated l<strong>and</strong> in Ghana was devoted to cocoa(Breisinger, Diao et al. 2008) <strong>and</strong> little additional suitable l<strong>and</strong> is available (Chamberlin 2007). Increasing l<strong>and</strong>in cocoa production has been a driver of deforestation. Because cocoa was traditionally grown under shade,GHANA CLIMATE CHANGE VULNERABILITY AND ADAPTATION ASSESSMENT 71
however, many valuable timber trees were retained in cocoa fields, augmented by planting of fruit <strong>and</strong> otheruseful trees; thus, shade-grown cocoa was an agroforestry practice with greater biodiversity value than slash<strong>and</strong> burn agriculture (Duguma, Gockowski et al. 2001) <strong>and</strong> full sun cocoa farming.Cocoa yields in Ghana are below international averages; the potential increase from higher productivity couldbe more than double the yields in 2005 (FAO 2005; Breisinger, Diao et al. 2008). Increases could come fromnew varieties <strong>and</strong> increased use of fertilizer. Newer varieties have been shown to increase yields by at least 42percent <strong>and</strong> fertilizer use was associated with 19 percent higher cocoa yield per 50 kg bag of fertilizer (Edwin<strong>and</strong> Masters 2005). Research has demonstrated the technical advantages of fertilized, low shade or full sunhybrids <strong>and</strong> current recommendations from the Cocoa Research Institute of Ghana call for additions ofphosphorus, potassium, <strong>and</strong> micronutrient fertilizer, densely planted hybrid cocoa (1,111 trees ha -1 ), whileretaining at most 12-15 shade trees ha -1 (Gockowski <strong>and</strong> Sonwa). In practice, smallholders have been able toadopt only the low shade/full sun recommendation as they lack resources to acquire hybrid seeds <strong>and</strong>fertilizer. Little research has been directed towards increasing productivity of traditional shade grown cocoa(Gockowski <strong>and</strong> Sonwa ; Breisinger, Diao et al. 2008) although that is an alternative that would avoid thenegative effects of full sun hybrid cocoa on biodiversity (Belsky <strong>and</strong> Siebert 2003; Franzen <strong>and</strong> BorgerhoffMulder 2007).EFFECTS OF CLIMATE CHANGE ON AGRICULTURECrops are vulnerable to <strong>climate</strong> variability as evidenced most obviously by lowered yields during droughtperiods, less dramatically by year-to-year variation in productivity. Variability can take many forms; forexample less total annual precipitation, delayed onset of the rainy period, higher temperature or sub-optimummoisture during critical growth stages (too moist during establishment might favor diseases, such as dampingoff; too dry during grain-filling might lower yield). Changes in average <strong>climate</strong> values in regions currently atthe limit for growing some crops could reduce yields to non-viable levels, for example, causing a shift towardsagropastoral systems. The complexity of crop growth requires <strong>climate</strong> data (short-term variability, frequencyof extreme events) at spatial <strong>and</strong> temporal resolutions that are currently beyond the reach of <strong>climate</strong> <strong>change</strong>models (Challinor, Wheeler et al. 2007). In addition to inadequate <strong>climate</strong> models, crop modeling research hasfavored the major global food crops <strong>and</strong> devoted less attention to crops important to Ghana, such as millet<strong>and</strong> yams. Additionally, crop models generally are specified for monocropping <strong>and</strong> rarely considerintercropping. Improvements in both <strong>climate</strong> <strong>and</strong> crop models <strong>and</strong> the ability to model effects at scales fromthe farmer’s field to the region <strong>and</strong> nation will be critical to formulating <strong>adaptation</strong> options for agriculture <strong>and</strong>mainstreaming <strong>climate</strong> <strong>change</strong> into development programs (Challinor, Wheeler et al. 2007).Several <strong>assessment</strong>s have been made of the potential effect of <strong>climate</strong> <strong>change</strong> on crop yields in Africa(Challinor, Wheeler et al. 2007). They are not readily compared because they use different global circulationmodels, IPCC emission scenarios, <strong>and</strong> crop models, but they generally indicate negative effects for maize,rice, millet <strong>and</strong> cereals in general; effects range from +16 percent to -98 percent <strong>change</strong> in annual yields(Challinor, Wheeler et al. 2007). Linking five <strong>climate</strong> models <strong>and</strong> five emissions scenarios with a spatiallyexplicit agro-ecosystem model <strong>and</strong> a global food system (trade) model provided an integrated system toexamine not only <strong>climate</strong> <strong>change</strong> effects on agriculture but the effects of limited agronomic <strong>adaptation</strong>(Fischer, Shah et al. 2005). Effects of <strong>climate</strong> <strong>change</strong> on agricultural production were relatively minor globallybut significant regionally. Ghana was projected to gain cereal-production potential by 2080, depending uponemission scenario (Fischer, Shah et al. 2005) but generally, semi-arid zones within sub-Saharan Africa (such asthe northern savanna zones in Ghana) would experience reductions in cereal-crop production (Fischer, Shahet al. 2005; Zhang <strong>and</strong> Cai 2011).72 GHANA CLIMATE CHANGE VULNERABILITY AND ADAPTATION ASSESSMENT
Source: Chamberlin, 2007Figure 5.6 L<strong>and</strong> areas in Ghana suitable for cocoa farmingHigher resolution approaches to <strong>climate</strong> modeling may use statistical methods to downscale output fromaGCM to the regional level to model effects at the smallholder level. Limitations of the approach are several,including that statisticaldownscaling relies on a dense grid of meteorologicalstations to establish historicalrelationships among weather variables; such grids are generally lacking over sufficiently long time periods(minimally30 years); <strong>and</strong> empirical relationships based on historic data may not be relevantunder <strong>change</strong>dfuture <strong>climate</strong>s. Nevertheless, these downscaled data may have the temporal resolution to drive process-baseofmaize crops incrop models. Using thisapproach, Jones <strong>and</strong> Thornton (2003) simulated growth <strong>and</strong> yieldAfrica <strong>and</strong>Latin America until 2055. Maize is a C4 plant, thus tolerant of highh temperatures but still sensitiveto loweredprecipitation. Although the effects of <strong>climate</strong> <strong>change</strong>e were small inaggregate (Jones <strong>and</strong> Thornton2003), even the modest 10 percent decline in yield predicted for northern Ghana by Jones <strong>and</strong> Thorntonn(2003) would adversely affect smallholders. Improvements in <strong>climate</strong> modeling (both in theability of GCMsto better project precipitation <strong>and</strong> theuse of physically-based dynamic downscaling using regional <strong>climate</strong>models) <strong>and</strong> better underst<strong>and</strong>ing <strong>and</strong>modeling ofcrop responses to climaticc variables (Tubiello, Soussana etGHANA CLIMATE CHANGE VULNERABILITY ANDADAPTATION ASSESSMENT73
al. 2007; Challinor, Ewert et al. 2009; Soussana, Graux et al. 2010) are needed to effectively guide choiceamong <strong>adaptation</strong> options.Cocoa is highly susceptible to drought <strong>and</strong> the pattern of cropping of cocoa is related to rainfall distribution.Climate <strong>change</strong> could affect vigor of the cocoa plant as well as alter stages <strong>and</strong> rates of development of cocoapests <strong>and</strong> pathogens. Using drought-tolerant varieties <strong>and</strong> irrigation are possible <strong>adaptation</strong>s to <strong>climate</strong> <strong>change</strong>but farmers are conservative <strong>and</strong> unlikely to adopt new technology unless there is a support system, such aseffective technical assistance (i.e., extension agents) <strong>and</strong> credit systems to assist in financing new technology.Another <strong>adaptation</strong> is alternative; there is some evidence from the Volta region that this has occurred whencocoa farming becomes marginal. Alternative crops to cocoa include other plantation crops (e.g., oil palm <strong>and</strong>oranges) or food crops, such as maize <strong>and</strong> cassava (Anim-Kwapong <strong>and</strong> Frimpong). If the cocoa sector is torealize its potential <strong>and</strong> contribute to Ghana achieving MIC status by 2015, yield increases through someform of intensification are critical (Breisinger, Diao et al. 2008).ADAPTATION OPTIONSAdaptation to <strong>climate</strong> variability <strong>and</strong> <strong>change</strong> occurs (or not) at multiple levels, from the smallholder to thenational <strong>and</strong> even global level (Challinor, Wheeler et al. 2007). Farmers are vulnerable from shocks(unexpected events such as flooding from extreme weather), seasonal variation, particularly in timing <strong>and</strong>amount of rainfall, <strong>and</strong> long-term trends (such as increased mean temperature). Coping strategies commonlyare in place to reduce <strong>vulnerability</strong> to seasonal variation including planting mixtures of crops <strong>and</strong> cultivarsadapted to different moisture conditions (reducing the risk of complete crop failure); using l<strong>and</strong>races resistantto <strong>climate</strong> stresses; <strong>and</strong> mulching or water conservation (Challinor, Wheeler et al. 2007). Farmers may plantstarvation reserve crops such as cassava that has 14 local varieties <strong>and</strong> three improved varieties with differentmaturation periods <strong>and</strong> flexibility in how soon it must be harvested. For example, cassava acreage increasedsharply in 1984 because households with cassava farms during the drought in 1983 had food to eat after cropfailure in the drought year (Sagoe 2006). Multi-year droughts, however, will overpower these short-termcoping strategies <strong>and</strong> may cause long-term impacts if capital assets are lost (e.g., draft animals, seed stocks,savings, or social capital) <strong>and</strong> there is no effective local or national support system (Challinor, Wheeler et al.2007). An alternative to rainfed agriculture for some farmers may be small-scale irrigation; this requiressuitable l<strong>and</strong>, access to water, <strong>and</strong> ideally, capital to invest in a pump. A simple treadle pump is in use inGhana, mostly in the Volta <strong>and</strong> Ashanti regions (Adeoti, Barry et al. 2007). In the northern savanna zones,dry season vegetable crops are grown in floodplain fields that often are h<strong>and</strong>-watered. Many irrigation optionsrequire infrastructure or cooperation among groups <strong>and</strong> are thus beyond the resources of a single farmer;some examples for Northern Ghana are given in Table 5.5.Many options are available for adapting agriculture to <strong>climate</strong> variability <strong>and</strong> <strong>change</strong> (Kurukulasuriya <strong>and</strong>Rosenthal 2003); some of them are gathered in Table 5.6. Some farmers may opt to leave agriculture bydiversifying entirely into non-farm activity or migrate to urban areas (many farm households in the NorthernRegion already send some family members south to work <strong>and</strong> return remittances). With increasingpopulations, this option may not be available, forcing some households to remain in agriculture (Challinor,Wheeler et al. 2007). Rather than diversifying, intensifying agriculture is another <strong>adaptation</strong>. Farming forprofit, however, will require concentrating agriculture on fewer larger farms to take advantage of economiesof scale, mechanization efficiencies, <strong>and</strong> market access (Kurukulasuriya <strong>and</strong> Rosenthal 2003; Challinor,Wheeler et al. 2007). Such commercialization or rationalization of agriculture may be desirable from a nationaldevelopment perspective, but given the traditional l<strong>and</strong> tenure system <strong>and</strong> the insecurity of manysmallholders, development of large-scale farms by overseas investors may not only displace manysmallholders (Robertson <strong>and</strong> Pinstrup-Andersen 2010; Daniel 2011) but also increase the food insecurity oflocal populations in bad crop years if they are priced out of the market for food. Given the likelihood that oil,fuel, <strong>and</strong> petroleum-based agricultural chemicals will increase in price in the future <strong>and</strong> most smallholderscannot afford such inputs without subsidies, questions of economic viability arise. Commercialization <strong>and</strong>large-scale agriculture also pose uncertainties with or without <strong>climate</strong> <strong>change</strong> interactions with regard toenvironmental effects <strong>and</strong> long-term sustainability.74 GHANA CLIMATE CHANGE VULNERABILITY AND ADAPTATION ASSESSMENT
Farmers who depend on annual rains have already demonstrated considerable ability to adapt to uncertain<strong>climate</strong>, at least to the historic range of variation. Their ability to adapt to future <strong>climate</strong>s will depend in parton a supportive institutional <strong>and</strong> macroeconomic environment (Kurukulasuriya, Mendelsohn et al. 2006;Challinor, Wheeler et al. 2007). As noted by Challinor et al. (2007), coping with <strong>climate</strong> stresses will dependon “Good governance, political will, <strong>and</strong> positive economic development.” Ghana is fortunate among WestAfrican nations in that is politically stable yet its governance structures are weak <strong>and</strong> its public sectorunderperforms, especially in the northern savanna zones (Blench <strong>and</strong> Dendo 2007). Clarification of l<strong>and</strong>tenure, tree tenure, <strong>and</strong> carbon rights is necessary for smallholders to access capital <strong>and</strong> make long-terminvestments in conservation practices, agroforestry, <strong>and</strong> improved crop varieties <strong>and</strong> inputs. Access toknowledge <strong>and</strong> assistance from extension workers is needed for farmers to modify their cropping systems(Kurukulasuriya <strong>and</strong> Rosenthal 2003; Blench <strong>and</strong> Dendo 2007; Challinor, Wheeler et al. 2007; Breisinger,Diao et al. 2008). Community-based approaches to identifying <strong>climate</strong> <strong>change</strong> <strong>adaptation</strong> strategies (e.g.,CARE) <strong>and</strong> strategies for enhancing food security (e.g., Canadian International Development Agency orCIDA) have been implemented in the northern regions <strong>and</strong> appear to hold promise. Reducing <strong>vulnerability</strong> tocurrent <strong>climate</strong> stress may increase adaptive capacity <strong>and</strong> increase resilience to future <strong>climate</strong> <strong>change</strong> (Adger,Hughes et al. 2005; Challinor, Wheeler et al. 2007).Identifying <strong>climate</strong> risks <strong>and</strong> preparing for <strong>and</strong> mitigating <strong>climate</strong> disasters is a central role for governmentbut capability is poor or non-existent in Africa (Challinor, Wheeler et al. 2007). Weather monitoring <strong>and</strong>forecasting capability is necessary for effective disaster planning as well as for providing information forimproving crop <strong>and</strong> <strong>climate</strong> modeling. Government agencies, NGOs, <strong>and</strong> CSOs in Ghana seem to have littleaccess to detailed <strong>climate</strong> projections <strong>and</strong> seemingly little underst<strong>and</strong>ing of the uncertainties surroundingprojections. Tools to assess the impact of <strong>climate</strong> <strong>change</strong> on agriculture are critical components of povertyreduction programs (Challinor, Wheeler et al. 2007).OptionsSmall scale damsDugoutsCulverts/bridges forwater retention as adonfor feeder roadsPumping from riversNatural flood-plainirrigationWind pumpsDrip technologySource: Blench <strong>and</strong> Dendo 2007Table 5.5 Water development options in Northern GhanaStatusExtensively inserted by government, donor projects, <strong>and</strong> NGOs throughout the North. Generallysuccessful, but cost is high <strong>and</strong> maintenance pathways (for larger repairs) not well established. Poormitigation of health <strong>and</strong> environmental impacts.Extensively inserted by government, donor projects, <strong>and</strong> NGOs throughout the north. Generallysuccessful, but poor mitigation of health <strong>and</strong> environmental impacts. Rises in numbers of migrant cattlecould make these sites sources of friction.This technology works well with high maintenance <strong>and</strong> extensive supervision (as in the AFD project).However, post-project community maintenance is extremely poor <strong>and</strong> this technology will not work unlessmuch greater training investments are made.This is being tried informally on some river systems in Northern Ghana <strong>and</strong> undoubtedly produces the bestreturn (in terms of l<strong>and</strong> cultivated per dollar) of any of these technologies. Although collective pumpstheoretically have economic advantages, in practice households prefer small individual pumps because a)they control refueling <strong>and</strong> maintenance, <strong>and</strong> b) they can easily be moved by bicycle. One of the objectionsto pumps is that they introduce inequity, but experience from other West African countries suggests thatindividuals will cycle long distances in order to make use of their productive advantages.This technology is not established anywhere in Ghana, although it works well in some neighboring countries(Mali, Nigeria) <strong>and</strong> has potential along the White Volta. Advantages are that it makes maximum use ofnatural fish production <strong>and</strong> is environmentally beneficial (limited st<strong>and</strong>ing water <strong>and</strong> river-bank protection).Disadvantage is that it requires significant initial investment in earthworks, community training, <strong>and</strong>cooperation (does not work for an individual household).Just two wind-ups have been installed on an experimental basis in Northern Ghana <strong>and</strong> it appears thatneither pump is being properly maintained, nor are the gardens being irrigated to maximum efficiency.Should be treated with caution until proven to workAlthough potential is great on existing dams, drip irrigation is only now being implanted on an experimentalbasis by ICRISAT. Given the high maintenance <strong>and</strong> the short training time envisaged by ICRISAT, theviability of this technology is doubtful at best.GHANA CLIMATE CHANGE VULNERABILITY AND ADAPTATION ASSESSMENT 75
Table 5.6 Matrix of <strong>climate</strong> <strong>change</strong> <strong>adaptation</strong> options for agricultureAdaptation Options in Agriculture to Climate Change <strong>and</strong> VariabilityAdaptation Option Purpose Necessary supporting policies Other prerequisites LimitationsShort-termCrop InsurancePrivate/public programs Enabling improved risk coverage Improving access Synergies between governmentFormal/informal schemes Risk management through riskreduction <strong>and</strong> risk sharing<strong>and</strong> private sector in bearingrisksMinimizing informationasymmetriesImproving supervisory capacity Establishing enforcementmechanismsRevising pricing incentives Introducing measures for theImproving affordability/availabilityof coverage for catastrophescorrect estimation ofpremiumsInnovative schemes should bepursued (e.g., tradeablefinancial assets; catastrophicbonds; weather markets)Risk averse communities/insufficientcollateralHigh opportunity costs of publicfundsHigh monitoring costs (institutionallimitations)Adverse selection/moral hazardNeed to establish well-functioningproducerPortfolio (Crop/Livestock)DiversificationReplacement of plant types,cultivars, hybrids <strong>and</strong> animalbreeds with new varietiesAlternative productiontechniques (adjustment ofcapital <strong>and</strong> labor inputs)Risk-spreading/ promoting farmlevelrisk managementIncreasing productivity Financial support/ alternativesshould be provided by private <strong>and</strong>public sectorAvailability of extension services Tenure reform to ensureproperty rights are establishedL<strong>and</strong>-use regulations need tobe reviewed to enablediversificationMulti-cropping Defending against disease, pest Enable mobility of activities Education/training/ extensionservices need to be providedMixed farming systems ofcrops <strong>and</strong> livestockRemove subsidies on certaincrops/livestock production notconducive to <strong>change</strong>d climatic <strong>and</strong>resource conditionsTraditions, lack of awareness, <strong>and</strong>other limitations (high opportunitycosts) may dampen willingness todiversifyOver-dependence on governmentsupport mechanisms needs to bereducedNeed alternatives that maintainquantity <strong>and</strong> income fromproductionAdjusting Timing of FarmOperationsAdjusting croppingsequenceReducing risks of crop damage/maximizing output in light of newconditionsExtension services/training arenecessaryMechanisms for thedissemination of agronomic<strong>and</strong> <strong>climate</strong> informationInvestment in collection of <strong>climate</strong>data <strong>and</strong> disseminating informationrequiredGHANA CLIMATE CHANGE VULNERABILITY AND ADAPTATION ASSESSMENT 76
Adjusting timing ofirrigationPricing policies must be reviewed Institutional support must bestrengthenedLimitations of existing infrastructureChanging CroppingIntensityAdjusting fertilizer <strong>and</strong>Improving moisture <strong>and</strong> nutrientretentionExtension services must beimprovedother inputsChanging l<strong>and</strong> use practices Reducing soil erosion Pricing policy adjustments forincentives to make adjustmentsChanging location ofcrop/livestock productionRotating or shiftingproduction between crops<strong>and</strong> livestockAdjusting to changing length ofgrowing seasonLocation-specific solutionsshould be soughtAvailability of cultivable l<strong>and</strong>;availability of alternative l<strong>and</strong>sSocioeconomic (financial)Conflicts with other farmoperations at other times of theyearIncreasing plant protection Traditions, lack of awareness, <strong>and</strong>other limitations (high opportunitycosts) may dampen willingness todiversifyAb<strong>and</strong>onment of l<strong>and</strong> Concerns regarding maintainingsimilar production levelsChanging the timing ofactivities (of sowing,planting, spraying <strong>and</strong>harvesting)Changing the timing ofirrigationLivestock ManagementChange in biologicaldiversity, speciesAltering the breedingmanagement program (i.e.,changing composition, orspecies distribution)Change in grazingmanagement (timing,duration, <strong>and</strong> location)Changing the location ofwatering pointsChanges in rangel<strong>and</strong>management practicesModifying operationSpreading risks; increasingproductivityAdjusting to new <strong>climate</strong>conditionsProvision of extension services Promoting investment inlivestock managementInstitutional supportTraditions, lack of awareness <strong>and</strong>other limitations (high opportunitycosts) may dampen willingness todiversifyGHANA CLIMATE CHANGE VULNERABILITY AND ADAPTATION ASSESSMENT 77
production strategiesChanging market strategiesImplementing feedconservation techniques/varying supplementalfeedingChanges in Tillage Practices(Conservation Tillage)L<strong>and</strong> contouring <strong>and</strong>terracingConserving soil moisture <strong>and</strong>organic carbon contentsdecreases soil erosion <strong>and</strong>maintains soil fertility (nutrientmanagement)Maintaining crop residues Maintaining soil quality/provideprotection against wind erosionFallow <strong>and</strong> tillage practices Increasing production per unit ofevapotranspiration (water useefficiency)Planting of hedges Reducing water runoff/ improvingwater uptakeAlternative drainage Recharging water supplymethodsConstruction of diversions Reducing runoff <strong>and</strong> erosion<strong>and</strong> reservoirs <strong>and</strong> waterstorageIrrigation Nutrient restockingExtension services need to supportactivitiesPricing incentives to promoteconservationInvestmentL<strong>and</strong> tenure reformIndigenous knowledgeReducing water use in l<strong>and</strong>preparationConserving waterTemporary Migration Risk diversification strategy towithst<strong>and</strong> <strong>climate</strong> shocks <strong>and</strong>seasonal effectsEmployment training/opportunities Institutional support Availability of employmentopportunities in urban areas;growth elsewhere in economySkills <strong>and</strong> earnings potentialHigh population density in citiesShort-Term Forecasts Improve preparation for mediumtermclimatic impactsInstitutional support for collection<strong>and</strong> dissemination, informationdisseminationInfrastructure for monitoring Financial constraintsFood Reserves <strong>and</strong> Storage Temporary relief Delivery mechanisms Expensive/complacency78 GHANA CLIMATE CHANGE VULNERABILITY AND ADAPTATION ASSESSMENT
Transportation networkChanging Crop MixAdopting new crops Spreading risk of damage Revising pricing; food importation Promoting investment Institutional failurespolicyPlanting in different part of Move away from unstable cash Tenure; extension; pricingInstitutional support to Acceptance of <strong>change</strong> gradualfarmcrop systemsincentivesadministerConverting l<strong>and</strong> use Improving access <strong>and</strong> affordability Agricultural marketing policies Economic failures (maintainingincomes)Need viable alternatives (incomes) Review of agricultural credit schemesKnowledgeIrrigation Increase productivity; withst<strong>and</strong>precipitation shortages or timingInvestment by public <strong>and</strong> privatesectorsClear water managementpolicyInstitutional support <strong>and</strong>enforcement mechanismsModernization of FarmOperationsIncrease productivity Promoting the adoption oftechnological innovationsEstablishment ofintellectual property rightsConflicts betweennational/private objectivesResearch <strong>and</strong> development(biological <strong>and</strong> mechanicaloptions)Adoption of technology(e.g., use of sprinklers)Withst<strong>and</strong>ing <strong>climate</strong> effects Role of privatemultinationalsMaintaining similar productionlevelsSubsidization programs maycreate perverse incentivesPermanent MigrationDiversify incomeearningopportunitiesEducation <strong>and</strong> training foralternative opportunitiesInstitutional support(property rights)Impacts on resource baseTo overcome longlasting <strong>climate</strong>impactsRetraining L<strong>and</strong> pressureDefining L<strong>and</strong>use <strong>and</strong>Tenure RightsIncentives to makenecessaryinvestments inagricultural l<strong>and</strong> towithst<strong>and</strong> climaticLegal reform <strong>and</strong>enforcementGHANA CLIMATE CHANGE VULNERABILITY AND ADAPTATION ASSESSMENT 79
impactsEfficient Water UseImproving waterdistributionPromoting irrigationefficiencyChanging crop <strong>and</strong>irrigation schedulesWater recycling <strong>and</strong> theconjunctive use ofgroundwaterRehabilitation <strong>and</strong>modernizationWater conservation Pricing reforms for water Sustainable water projectsAvoid salinization increasemoisture; retentionClearly defined property rights Diffusion of technologicaladvances in water managementWater storage <strong>and</strong> flood control Develop open markets Institutional reforms Competing dem<strong>and</strong>sStrengthening farm level managerialcapacityCostFinancial crisesLow-cost recovery of theinvestment in the water systemPolitical economy issuesBoth short <strong>and</strong> long-termInvestment PromotionOvercome financial limitations toadaptProperty rights; designingSocial constraints against capitalinnovating financial toolsaccumulationInjection of initial capital Reluctance of agricultural traders tooffer inputs on creditDevelop Market EfficiencyPricing reform Promote more efficient use ofresourcesRemove barriers Institutional supportDevelop open markets Property rights; pricing policy The establishment of regionalconsultation centersImpart knowledge onReform of agriculturalmarketsAdjustment of agriculture inputsubsidies that constrain <strong>adaptation</strong><strong>adaptation</strong> alternativesL<strong>and</strong> use regulations Legislative reformPoor transport infrastructureAdoption of Technological<strong>and</strong> Other AdaptationMeasuresIncreasing agricultural yields Pricing incentives/ tax reform Community management <strong>and</strong>cooperation programsNatural constraints-if l<strong>and</strong> isavailableReducing average fixed costs Extension services for training Socioeconomic capacity to adaptReducing variable costs Finance schemes Complete removal of governmentsupportLower producer prices80 GHANA CLIMATE CHANGE VULNERABILITY AND ADAPTATION ASSESSMENT
Lower world food pricesAttitudes towards riskLevel of uncertainty of the futureAvailability of funds for investmentAccess to assets, capital, <strong>and</strong> creditHigh tariffs in export marketsPromoting Trade Promoting economic growthStrengthening long-term foodsupply <strong>and</strong> reducing productionlimitationsPricing <strong>and</strong> ex<strong>change</strong> rate reform<strong>and</strong> stabilizationReducing risks of food shortages Adjustment of agricultural subsidies<strong>and</strong> tariffsSocial policy Subsidies in developed marketsDeveloping ExtensionServicesImprove agricultural productivity Role of private, non- governmental<strong>and</strong> cooperative agenciesImprove awareness <strong>and</strong>knowledge of <strong>adaptation</strong>measuresEnsuring sufficient agents perfarmer/regionEnsure agents are productivethrough adequate incentivesLimit/remove managementfailuresPublic organization, resources,<strong>and</strong> institutional supportUtilize indigenous knowledgeImproving ForecastingMechanismsAssist planning Extension Information needs to bedistributed across all sectorsStrengthen ability of farmers tocopeInstitutional support (e.g.establishment of farmercooperatives to spread knowledge)Horizontal <strong>and</strong> verticalex<strong>change</strong>s of informationEnsure information is in ausable formFinancialConflicts with traditional practices/social conventionsSkepticismInstitutional Strengthening<strong>and</strong> Decision-makingStructuresTo support long-term planning Reform existing institutions thatsupport agricultural sectorParticipation of keystakeholdersReduce <strong>vulnerability</strong> Pricing incentives; improving Requires integrated Planning agencies formed byGHANA CLIMATE CHANGE VULNERABILITY AND ADAPTATION ASSESSMENT 81
Source: Kurukulasuriya <strong>and</strong> Rosenthal 2003Provide information on thechanging socioeconomicstructure, demographics,technology, <strong>and</strong> publicpreferencesImproving organizational capacity,responsibility <strong>and</strong> operationaleffectivenessregulations <strong>and</strong> technologyst<strong>and</strong>ardsLegal infrastructure (reform) forstimulating domestic <strong>and</strong>international investmentChanges in international <strong>and</strong>domestic competitionmanagement practices; need tofit specific institutional settingsComprehensive multi- sectoralmanagement plansResilience; flexibility; publiceducation programSocial policies Remove bureaucraticinefficienciesUpgrading of currentEqually well functioningphysical planning laws <strong>and</strong>institutions in otherregulationssectorsImprove coordinationbetween central <strong>and</strong> localgovernment82 GHANA CLIMATE CHANGE VULNERABILITY AND ADAPTATION ASSESSMENTadministrative resolution asopposed to being m<strong>and</strong>atory
POPULATION AND ECONOMYGhana contains 10 administrative regions that are divided into 170 districts. 1 As of 2010, Ghana’s population wasestimated at 24,233,431, a 28 percent increase over 2000 population levels (GoG, 2011). Between 2000 <strong>and</strong> 2010,the country had an estimated 2.5 percent average annual population growth rate (Table 5.7). The population isunevenly distributed across the country, with the southern regions generally having much higher populationdensities than the northern regions (Table 5.C.1, Map 5.C.1).Table 5.7 Population Growth Rate by RegionTotal Population Annual inter-censal growth rate (%)1960- 1970- 1984- 2000-Region 1960 1970 1984 2000 2010 1970 1984 2000 2010Western 626,155 770,097 1,157,807 1,924,577 2,325,597 2.1 3.0 3.2 1.9Central 751,392 890,135 1,142,335 1,593,823 2,107,209 1.7 1.8 2.1 2.8GreaterAccra541,933 903,447 1,431,099 2,905,726 3,909,764 5.2 3.3 4.5 3.0Volta 777,285 947,268 1,211,907 1,635,421 2,099,876 2.2 1.8 1.9 2.5Eastern 1,044,090 1,209,828 1,680,890 2,106,696 2,596,013 1.5 2.4 1.4 2.1Ashanti 1,109,133 1,481,698 2,090,100 3,612,950 4,725,046 2.9 2.5 3.5 2.7Brong-Ahafo 587,920 766,509 1,206,608 1,815,408 2,282,128 2.7 3.3 2.5 2.3Northern 531,573 727,618 1,164,583 1,820,806 2,468,577 3.2 3.4 2.8 3.1Upper East 468,638 542,858 772,744 920,089 1,031,478 1.5 2.8 1.1 1.1Upper West 288,706 319,865 438,008 576,583 677,763 1.0 2.3 1.7 1.6Ghana 6,276,815 8,669,313 12,296,081 18,912,079 24,223,431 2.4 2.6 2.7 2.5Sources: Ghana Statistical Service, 2000 Population <strong>and</strong> Housing Census; 2010 Population <strong>and</strong> Housing Census Provisional ResultsThe most densely populated administrative regions are Greater Accra, Central, <strong>and</strong> Ashanti, corresponding to theCoastal Savanna <strong>and</strong> Deciduous Forest ecological zones. The high population densities found in the GreaterAccra Region <strong>and</strong> districts containing regional capitals reflect the fact that 43.8 percent of Ghana’s totalpopulation lived in urban areas in 2000 (a locality having a population greater than 5,000 people, GSS, 2005). TheAkan ethnic group is the largest ethnic group in Ghana, <strong>and</strong> includes the Ashanti (whose power is centered inKumasi, in the Ashanti Region) <strong>and</strong> Fante (whose power is centered in Cape Coast, in the Central Region). Othermajor ethnic groups are the Dabomba of the north, the Ewe of the east, the Ga <strong>and</strong> Adangbe of the south, <strong>and</strong>the Guan of the northeast.1 In the late 1980s, Ghana’s districts were reorganized into 110 districts. By 2006, 28 more districts had been created by splitting some of theoriginal districts, for a total of 138. In 2008, new districts were again created, bringing the total to 170, where it st<strong>and</strong>s currently (Wikipedia,Ghana Districts). Because most of the socioeconomic data contained in this report date from before 2006, they are presented for the 110districts.GHANA CLIMATE CHANGE VULNERABILITY AND ADAPTATION ASSESSMENT 83
Figure 5.7 Ghana Population Densityy by Districtt (persons/km 2 )Source : Ghana 2000 Population <strong>and</strong> Housing CensusNote: Dots indicate regional capital cities.At a national level, Ghana’s economyis comprisedof three primary sectors: agriculture accounts for roughly 30percent ofGhana’s gross domestic product, industry accounts for roughly 20 percent, <strong>and</strong> service accounts forroughly 50percent (GSS, 2010a). There are three sectors that account for 80 percent of Ghana’s totalemployment. The majority (55 percent) of the working population is formallyy employed in agricultural activities,followed by 15 percent in trading, <strong>and</strong> 10 percent in manufacturing (GSS, 2008b). The agricultural sectorin84 GHANA CLIMATE CHANGE VULNERABILITY AND ADAPTATION ASSESSMENT
Ghana is comprised of crop <strong>and</strong> livestock production, which constitute 65 percent of all agricultural production;cocoa production <strong>and</strong> marketing, which make up 12 percent; forestry <strong>and</strong> logging, comprising 10 percent; <strong>and</strong>inl<strong>and</strong> <strong>and</strong> marine fishing, constituting 13 percent (GSS, 2008a). The agricultural sector has been a major driver ofpoverty reduction, <strong>and</strong> dominates the livelihoods of rural households; 85 percent of rural households engage inagricultural activities. By comparison, 28 percent of urban households report being engaged in agriculture (GSS,2008b).The official unit of currency in Ghana is the Ghana Cedi (Gh¢). One Ghana Cedi was equivalent to 0.66 U.S.dollars in early 2011 (according to www.ex<strong>change</strong>-rates.org). The Ghana Cedi was introduced in July of 2007, <strong>and</strong>was essentially a redenomination of the old currency. The former currency was the Cedi (as opposed to the newGhana Cedi); 10,000 (old) Cedis are equivalent to 1 (new) Ghana Cedi.Below we provide a general characterization of the Ghanaian economy – with a focus on the agricultural sector –in the coastal, forest, <strong>and</strong> savanna ecological zones.CROP PRODUCTIONSmallholder farmers, who cultivate 1-2 ha plots of l<strong>and</strong>, account for 80 percent of the country’s agricultural cropproduction (USAID, 2011). The two most important crops to smallholder farmers in terms of sales are maize,which brings in an estimated 412.29 million Ghana cedis in annual sales, <strong>and</strong> cocoa, which brings in 361.13million Ghana cedis. Additional, albeit less lucrative, food staples grown by smallholder farmers include cassava,yam, plantain, cocoyam, <strong>and</strong> various fruits <strong>and</strong> vegetables (Table 5.8) (GSS, 2008b). The remaining 20 percent ofthe agricultural crop production is comprised of larger scale industrial plantations that produce palm oil, cotton,rubber, sugar cane, <strong>and</strong> tobacco. With the exception of oil palms, Ghana’s plantation industries have suffered as aresult of the country's economic difficulties (Clark, 1994).LIVESTOCK REARINGIn Ghana, 60.5 percent of households are engaged in raising livestock. According to the Fifth Round GhanaLiving St<strong>and</strong>ards Survey, chicken is the most commonly reared animal; 30 percent of households reported thatthey kept chickens. Eighteen percent raise goats, 11 percent raise sheep, 4 percent raise cattle, <strong>and</strong> 4 percent ofhouseholds keep other poultry including duck, turkey, <strong>and</strong> guinea fowl. Much smaller numbers of householdsraise pigs, grasscutter rats, <strong>and</strong> rabbits (GSS, 2008b).CropTable 5.8 Estimated annual crop value by value of salesAnnual value of sales (thous<strong>and</strong> Ghana cedis*)Coastal Forest Savanna GhanaMaize 276,525 82,121 53,629 412,274Cocoa 8,081 313,381 39,670 361,132Groundnut 3,445 5,880 66,856 76,180Rice 2,273 3,904 23,661 29,839Cotton 20,742 20,742Beans/peas 408 2,444 12,726 15,578Sorghum 3 11,844 11,847Millet 14 11,633 11,647Coconut 8,275 390 31 8,696Tobacco 57 7472 7,529Cashew nut 54 165 3315 3,534Sugar cane 2,106 781 2,887Source: Ghana Statistical Service, Ghana Living St<strong>and</strong>ards Survey 5*1 Ghana Cedi is equivalent to 0.66 U.S. Dollars.GHANA CLIMATE CHANGE VULNERABILITY AND ADAPTATION ASSESSMENT 85
FISHERIESIn Ghana, the fisheries sector, dominated by males, employs roughly 3 percent of the population (GSS, 2008a).The sector supplies about 60 percent of all animal protein for human consumption nationwide, <strong>and</strong> contributesabout 4.5 percent to the national GDP (GSS, 2008a; USAID, 2011). Ghana’s fishing industry is predominantly amarine fishery; the Ghana Statistical Service (2008a) reports that in 2007, more than 75 percent of all fish catchesin Ghana were produced through marine fishing, while the remaining 25 percent occurred inl<strong>and</strong>. The marinefleet can be further broken down into three fleets: small-scale artisanal operators fishing out of wooden canoes,semi-industrial inshore operators fishing out of planked, wooden vessels equipped with inboard engines, <strong>and</strong>industrial offshore operators fishing out of steel-hulled foreign-built trawlers. In the 2001 census there were 9,981artisanal canoes (currently estimated at 13,500), 169 in-shore semi-industrial vessels (339 in 2008), <strong>and</strong> 88industrial offshore vessels (Finegold et al., 2010; UN FAO, 2011). It is estimated that more than 150,000individuals are engaged in marine capture fisheries (Mensah et al., 2003), <strong>and</strong> that an additional 1.5 – 2 millionpeople rely on or provide support to the industry. 2NON-FARM RELATED ENTERPRISESDespite the large size of the agricultural sector, a diverse array of industry groups can be found in Ghana (Table5.9). After agriculture, the next two sectors with high employment include trade, which employs roughly 15percent of the population, <strong>and</strong> manufacturing, which employs 11 percent (GSS, 2008b). Roughly 46 percent of allhouseholds in Ghana operate non-farm related enterprises. Half of these businesses involve trade; the rest areinvolved with some form of manufacturing. The main source of capital for non-farm related enterprises arehousehold savings <strong>and</strong> assistance from relatives or friends (GSS, 2008b). Although sectors such as tourism,mining, forestry, <strong>and</strong> others make notable contributions to Ghana’s overall GDP (Table 5.10), the impact of theseindustries on employment is minimal at a national level.Table 5.9 Distribution of employed population age 15-64 years, by industry group (%)Industry Ghana Urban RuralAgriculture 55.8 18.6 75.3Fishing 1.4 0.7 1.7Mining 0.7 0.9 0.6Manufacturing 10.9 16.6 7.9Electricity 0.2 0.5 0Construction 1.8 3.5 0.9Trade 15.2 30.4 7.2Hotel <strong>and</strong> restaurants 1.9 3.1 1.3Transport <strong>and</strong> communication 2.8 5.7 1.2Financial services 0.3 0.8 0Real estate 0.8 2.1 0.2Public administration 1.4 3.7 0.2Education 2.9 5.6 1.5Health <strong>and</strong> social work 0.8 1.7 0.4Other community services 2.7 5.3 1.4Activities of private households 0.3 0.7 0.1Extra territorial organizations 0 0.1 0All 100 100 100Source: GSS, 2008b; Ghana Living St<strong>and</strong>ards Survey 52 Estimates in Chapter I of FAO (2002) on the size of the labor force vary somewhat from this estimate.86 GHANA CLIMATE CHANGE VULNERABILITY AND ADAPTATION ASSESSMENT
URBAN VERSES RURAL LIVELIHOODS 3Livelihood strategies in Ghana’s urban areas differ considerably from those in rural areas. Urban livelihoods areimportant, given that 38 percent of Ghana’s population (43 percent of total households) was urban in 2005/2006(GSS 2008b). Urban areas can be further broken down into the Accra metro area, <strong>and</strong> other urban areas outsideof Accra (Ghana’s capital city). Accra contains 11.7 percent of the population, <strong>and</strong> 26.13 percent of thepopulation lives in an urban area outside of Accra.Urban households have a mean size of 3.5, which is slightly lower than the national mean household size of 4.0.Annual per capita income in urban areas is roughly 517 Ghana cedis, 120 Ghana cedis higher than the nationalaverage, <strong>and</strong> 212 Ghana cedis higher than in rural areas. Income in urban areas comes primarily from employmentwages, which constitute 42.7 percent of an average household’s income. After employment wages, nonagriculturalforms of self employment constitute 30.7 percent of household income.Table 5.10 Contributions of economic sectors to National GDPSector/subsector % of national GDP % of sectorAgriculture 37.58%Crops <strong>and</strong> livestock 24.83% 66.07%Cocoa production <strong>and</strong> marketing 4.34% 11.55%Forestry <strong>and</strong> logging 3.62% 9.63%Fishing 4.78% 12.72%Industry 28.42%Mining <strong>and</strong> quarrying 6.74% 23.71%Manufacturing 8.83% 31.06%Electricity <strong>and</strong> water 2.71% 9.52%Construction 10.16% 35.77%Services 34.00%Transport, storage, <strong>and</strong> communication 5.69% 16.75%Wholesale & retail trade, restaurants, <strong>and</strong> hotels 8.31% 24.45%Finance, insurance, real estate, <strong>and</strong> business services 5.35% 15.75%Producers of private non-profit services 0.88% 2.60%Government services 11.83% 34.79%Community, social, <strong>and</strong> personal services 1.97% 5.80%Source: GSS 2008a; Ghana in FiguresHousehold agricultural income constitutes 12.3 percent, <strong>and</strong> remittances constitute 10.7 percent. Within Accrathese numbers <strong>change</strong> slightly; much more income comes from wages, <strong>and</strong> little income can be attributed tohousehold agriculture. Outside of Accra less income comes from wage jobs, <strong>and</strong> more income comes from nonagriculturalforms of self employment, making these two sources equal in terms of overall contributions to totalhousehold income. About 1/3 of urban households have savings to fall back on in the case of economicdifficulty, which is significantly higher than the roughly 20 percent of households in rural areas who have savings(GSS, 2008b).3 The information in this section is based on the Ghana Living St<strong>and</strong>ards Survey, Fifth Round, from 2005/2006 (GSS 2008b). Note that the statisticswe provide from this source sometimes differ from those provided elsewhere in this section <strong>and</strong> this report that come from other sources (e.g.,the 2000 Population <strong>and</strong> Housing Census).GHANA CLIMATE CHANGE VULNERABILITY AND ADAPTATION ASSESSMENT 87
In terms of employment, three major industry groups dominate: 30.4 percent of the working population is intrade, 18.6 percent in agriculture, <strong>and</strong> 16.6 percent in manufacturing. Minor industries such as construction, hotel<strong>and</strong> restaurants, transport <strong>and</strong> communication, public administration, education, <strong>and</strong> community services play amuch larger role in urban than in rural areas (Table 5.9). Although only 18.6 percent of the urban populationclaims to be employed through agriculture, outside of Accra informal agriculture still plays a notable role in urbanhouseholds – 40.6 percent of urban households outside of Accra reported owning or operating a farm or raisinglivestock. Given l<strong>and</strong> restrictions, livestock rearing tends to dominate urban agriculture. Eight percent of thecountry’s draught animals, 9 percent of cattle, 12 percent of sheep, 13 percent of goats, 6 percent of pigs, 20percent of rabbits, <strong>and</strong> 13 percent of chickens are raised in urban areas (GSS, 2008b).Rural livelihoods vary much more by locality than do urban livelihoods. When discussing rural livelihoods, it istherefore best to subdivide them into coastal, forest, <strong>and</strong> savanna livelihoods, comparable to the broad ecologicalregions of Ghana described in the previous section.RURAL LIVELIHOODS ON THE COASTThe coastal ecological region is defined as the southernmost portion of the Western, Central, Greater Accra, <strong>and</strong>Volta administrative regions. Ghana’s rural coast supports roughly 10.81 percent of the country’s total population,<strong>and</strong> 12.19 percent of total households. Household size is on average 3.6, which is slightly lower than the nationalaverage of 4.0. Annual per capita income across the rural coast is roughly 368 Ghana cedis, close to the nationalaverage; however, households lying far from metro areas, particularly west of Sekondi-Takoradi, do experiencemore difficulty procuring income. Household income along the rural coast comes primarily from agriculture,which constitutes 48 percent, the largest share, of household income. 4 Wages from employment constitute 23percent, <strong>and</strong> non-farm related enterprises constitute 20 percent. Only 25 percent of households have savings tofall back on in the case of economic difficulty. Although a significant amount of Ghana’s tourism revenue isgenerated along the coast, the impact of that revenue on household income is relatively small <strong>and</strong> restricted tourban areas, where benefits are captured through secondary businesses (GSS, 2008b).The predominant occupation of coastal inhabitants is marine fishing (Owusu-Ansah, 1994). As stated in thenational overview, the 2001 census recorded 9,981 artisanal canoes (now projected at 13,500), 339 in-shore semiindustrialvessels, <strong>and</strong> 88 industrial off-shore vessels operating along the coast (Finegold et al. 2010, UN FAO2011). These three fleets are estimated to support over 150,000 individuals directly <strong>and</strong> 1.5 – 2 million peopleindirectly.Along the rural coast, 73 percent of households claim to engage in household agriculture. Only a small percentageof the country’s livestock is raised by coastal households: 6 percent cattle, 5 percent sheep, 6 percent goats, 9percent pigs, 1 percent rabbits, <strong>and</strong> 9 percent chickens. The silty Keta Plain east of Accra, with its abundance ofwater, supports shallot, corn, <strong>and</strong> cassava cultivation. The s<strong>and</strong>y soils of the river deltas also give rise to the copra(coconut oil) industry. Salt-making from the dried beds of coastal lagoons provides additional employment(Owusu-Ansah, 1994), however this practice is threatened in some areas by coastal recessions. Maize is the largestcash crop grown. Roughly 9 percent of households grow maize, bringing in 276,525,000 Ghana cedis in annualsales. The remaining agricultural production -- primarily cocoa, coconut, groundnuts, rice, <strong>and</strong> sugar cane – bringin 25,211,000 Ghana cedis annually (GSS, 2008b).RURAL LIVELIHOODS IN THE FORESTGhana’s rural forest areas, comprising portions of the Western, Central, Greater Accra, Eastern, Volta, Ashanti,<strong>and</strong> Brong-Ahafo administrative regions, support roughly 28 percent of the country’s total population. Householdsize is on average 4.1, roughly the same as the national average of 4.0. Annual per capita income across the ruralforest is roughly 323 Ghana cedis, 74 Ghana cedis below the national average. Household income within ruralforested areas comes primarily from agriculture, which constitutes 51 percent, the largest share, of household4 The Ghana Living St<strong>and</strong>ards Survey classification “agriculture” includes fishing.88 GHANA CLIMATE CHANGE VULNERABILITY AND ADAPTATION ASSESSMENT
income; non-farm related enterprises constitute 23 percent, <strong>and</strong> wages from employment constitute 17 percent.Only 27 percent of households have savings to fall back on in the case of economic difficulty (GSS, 2008b).Cash crops bring in a total of 416,828,000 Ghana cedis in annual sales. Cocoa farming is the most valuable cropto farmers in this eco-region, responsible for 313,381,000 Ghana cedis annually; however, only 12 percent ofhouseholds in the area farm cocoa. Twenty-two percent of households produce maize, which yields 82,121,000Ghana cedis in annual sales. Other cash crops in the area include groundnuts, beans, coconuts, rice, sugar, ginger,coffee, cashew, kenat, timber from wood lots, <strong>and</strong> rubber. As evidenced by their lower value, these are grown at amuch smaller scale. Most farmers also cultivate food crops; the forest eco-region produces the bulk of thenation’s cassava, cocoyam, garden eggs, leafy vegetables, oil palm, plantains, tomatoes, yams, <strong>and</strong> fruits (GSS,2008b). A fair number of households engage in livestock rearing, <strong>and</strong> a significant portion of the country’slivestock are raised by households in this eco-region: 1 percent of cattle, 22 percent of sheep, 21 percent of goats,11 percent of pigs, 45 percent of rabbits, <strong>and</strong> 32 percent of chickens (GSS, 2008b).Aside from agricultural production, the forest is rich in mineral deposits, such as gold, diamonds, manganese, <strong>and</strong>bauxite. At a national level, mining officially employs only 1 percent of the population, <strong>and</strong> tends to occur in areasclose to urban centers; however, a large informal <strong>and</strong> illegal mining industry also flourishes, employing individualsin primary <strong>and</strong> secondary forms of occupation. Most of this artisanal mining occurs in the forested areas, as wellas in the north (GSS, 2008b).In the Wet <strong>and</strong> Moist Evergreen Forest Eco-Region, soils are not highly fertile <strong>and</strong> are generally not suitable forcontinuous cultivation under mechanization. However, this eco-region does still support some cocoa production,the farming of starches like cassava, plantain, <strong>and</strong> cocoyam, <strong>and</strong> also tree crops such as rubber, coconut, <strong>and</strong> oilpalm (Menczer <strong>and</strong> Quaye, 2006). However, it is the Deciduous Forest Eco-Region, which forms about 80percent of the country’s forested area that supports most of the food crop <strong>and</strong> cocoa cultivation, <strong>and</strong> providesmost of the timber for local use <strong>and</strong> export in Ghana. The deciduous forest, as a result, is generally highlyfragmented. The deciduous forest is also rich in minerals, <strong>and</strong> mining is another major l<strong>and</strong> use (Menczer <strong>and</strong>Quaye, 2006). In the Forest-Savanna Transitional Eco-Region, soils are fairly fertile, <strong>and</strong> support a wide variety ofcrops. Maize, yam, <strong>and</strong> tobacco are important crops grown here; staples such as cassava <strong>and</strong> plantains are alsofound; <strong>and</strong> large-scale commercial farming is widespread. This is largely a peri-urban area, <strong>and</strong> the highpopulation density in this eco-region exerts significant pressure on remaining natural resources (Menczer <strong>and</strong>Quaye, 2006).RURAL LIVELIHOODS IN THE SAVANNAGhana’s rural savanna areas (covering portions of Brong-Ahafo, <strong>and</strong> the entirety of the Northern, Upper West,<strong>and</strong> Upper East administrative regions) support roughly 23 percent of the country’s total population, <strong>and</strong> 18percent of households. Household size is on average 5.4, higher than the national average. Annual per capitaincome across the rural savanna is roughly 232 Ghana cedis, 165 Ghana cedis below the national average.However, people in the northernmost reaches of the savanna have much lower per capita incomes. The UpperWest Region has an annual per capita average of 106 Ghana cedis, <strong>and</strong> the Upper East Region has an annual percapita average of 124 Ghana cedis. Income in the savanna comes primarily from agriculture, which constitutes 75percent, the largest share, of household income; non-farm related enterprises constitute 12 percent, <strong>and</strong> wagesfrom employment constitute 6 percent. Only 15 percent of households have savings to fall back on in the case ofeconomic difficulty (GSS 2008b).Cash crops bring in a total of 259,232,000 Ghana cedis in annual sales throughout the savanna. Groundnuts arethe most valuable cash crop to farmers in the savanna eco-region, responsible for 66,856,000 Ghana cedis inannual sales; however, only 12 percent of households in the area are farming groundnuts. Fifteen percent ofhouseholds produce maize, which yields 53,629,000 Ghana cedis in annual sales; 16 percent produce guinea corn,sorghum, or millet, which yield a combined 23,4770,00 Ghana cedis in annual sales. Other cash crops in the areainclude rice (23,661,000 Ghana cedis), cotton (20,742,000 Ghana cedis), beans (12,726,000 Ghana cedis), tobacco(7,472,000 Ghana cedis), cashew (3,315,000 Ghana cedis), sheanut (1,592,000 Ghana cedis), <strong>and</strong> mango (335,000Ghana cedis). Farmers also cultivate food crops, though with the exception of okra, production is dwarfed by theGHANA CLIMATE CHANGE VULNERABILITY AND ADAPTATION ASSESSMENT 89
high yields enjoyed in the south of the country (GSS, 2008b). Many farmers produce charcoal <strong>and</strong> firewood as asecondary source of income, which is often more profitable. However, charcoal <strong>and</strong> firewood production is ahighly unregulated, often illegal occupation, <strong>and</strong> statistics are not available to characterize the size <strong>and</strong> extent ofthe industry.The virtual absence of tsetse flies (which plague the forested <strong>and</strong> coastal areas, causing human sleepingsickness <strong>and</strong> animal trypanosomiasis) has led to a much larger livestock rearing industry across the savanna(Owusu-Ansah, 1994). Ninety-two percent of the country’s draught animals, 84 percent of cattle, 60 percent ofsheep, 73 percent of pigs, 34 percent of rabbits, <strong>and</strong> 46 percent of chickens are raised in the savanna (GSS,2008b).The savanna can be further classified as Guinea Savanna <strong>and</strong> Sudan Savanna, although some discrepancy existsregarding the delineation between the two. In the Guinea Savanna, soils are generally poor <strong>and</strong> are mostproductive in floodplains <strong>and</strong> along river banks (Menczer <strong>and</strong> Quaye, 2006). Moving north from the GuineaSavanna, grass cover becomes sparse, <strong>and</strong> erosion becomes more pronounced. Agricultural production begins todiminish, <strong>and</strong> livestock production plays a more important role in local livelihoods. In the Upper West <strong>and</strong> UpperEast administrative regions families begin to depend more on nonfarm forms of self-employment <strong>and</strong> wage jobsfor income (GSS, 2008b). Small-scale tourism operations have begun to pop up; however, the impact of thetourism industry on overall employment remains minimal.90 GHANA CLIMATE CHANGE VULNERABILITY AND ADAPTATION ASSESSMENT
6. VULNERABILITY TOCLIMATE CHANGEThe African continent is considered to be among the most likely to suffer adverse impacts of <strong>climate</strong> <strong>change</strong>because of vulnerable social <strong>and</strong> natural systems (Dixon, Smith et al. 2003), multiple interacting stresses, <strong>and</strong> lowadaptive capacity (Boko, Niang et al. 2007). Ghana spans a range of climatic <strong>and</strong> edaphic zones from coastalmangroves <strong>and</strong> rainforests along the coast to savanna in the north.The previous section described this variabilityin natural systems <strong>and</strong> livelihood strategies. The following discussion of <strong>vulnerability</strong> of natural <strong>and</strong> social systemsbuilds on this framework. In much of sub-Saharan Africa, precipitation is inherently variable from year to year.This is often expressed as recurrent drought <strong>and</strong> periodic flooding. Between 1991 <strong>and</strong> 2008 Ghana experiencedsix major floods with >2 million people affected by the floods in 1991 (GFDRR, undated). The northern savannazone is exposed to floods as well as drought. In 2007, floods followed a period of drought <strong>and</strong> affected >325,000people. In most of Africa, <strong>climate</strong> is a key driver of food security (Gregory, Ingram et al. 2005; Müller, Cramer etal. 2011). Because most agriculture is rain-fed <strong>and</strong> rural populations in many countries lack resources to moderateor adapt to drought (Dixon et al. 2003), the agricultural sector is particularly vulnerable (Haile 2005).The major findings for Africa of the Fourth Assessment Report of the IPCC confirm earlier reports, including awarming trend since the 1960s (Boko, Niang et al. 2007). In West Africa, rainfall has declined 20 percent to 40percent (average of 1968-1990 as compared to 1931-1960), although the decline in the tropical rainforest zone hasbeen only 4 percent (Malhi <strong>and</strong> Wright 2004). Despite advances in our underst<strong>and</strong>ing of the complex mechanismsdriving rainfall patterns, much uncertainty remains. Drought, a manifestation of extreme rainfall variability, haslong been a feature of the continental West African <strong>climate</strong> with severe <strong>and</strong> long-lasting impacts on natural <strong>and</strong>social systems. The decline in rainfall from the 1970s to the 1990s, for example, caused a 25-35 km southwardshift of the savanna zone (Sahelian, Sudanese, <strong>and</strong> Guinean savanna zones) with loss of grassl<strong>and</strong> <strong>and</strong> woodl<strong>and</strong><strong>and</strong> displacement of human populations (Gonzalez 2001). Besides long-term climatic trends <strong>and</strong> extreme events,ecosystems in West Africa have been degraded by human activity, which often interacts with <strong>climate</strong>. Majorstressors (drivers of degradation) are deforestation, wildfire, <strong>and</strong> soil erosion in upl<strong>and</strong> areas <strong>and</strong> overfishing incoastal areas. In this chapter, we examine resource <strong>and</strong> social <strong>vulnerability</strong>.NATURAL SYSTEMS VULNERABILITYMost natural resources are <strong>climate</strong>-sensitive; plant <strong>and</strong> animal species are sensitive to weather extremes <strong>and</strong>communities are broadly distributed along climatic gradients. Soil resources are less sensitive to <strong>climate</strong> extremesbut develop over time within a climatic regime characterized by mean values. Thus, <strong>climate</strong> variability <strong>and</strong> <strong>change</strong>potentially could affect these resources <strong>and</strong> the human communities that depend upon them. Here, we examineresource <strong>vulnerability</strong> at the national level in terms of <strong>climate</strong> hazards, stressors, resource systems, <strong>and</strong> outcome.We further categorize hazards as continuous or discrete; discrete hazards are further divided between those thatare recurrent or singular. Brooks (2003) provides the rationale for approaching hazards in this fashion, noting that<strong>climate</strong> hazards operate over different timescales that may require different <strong>adaptation</strong> responses. Continuoushazards relate to <strong>change</strong>s in mean <strong>climate</strong> over many years or decades, such as the decreased rainfall in thesavanna zones. Discrete recurrent hazards are transient, often extreme weather events such as storms, drought, orextreme rainfall events that lead to flooding. Discrete singular hazards are sudden shifts in climatic conditions thatprevail for centuries or millennia – for example, the onset of Ice Ages (Brooks, 2003). Contemporary exampleswould be the melting of the Greenl<strong>and</strong> or west Antarctic ice sheets (Schneider, Semenov et al. 2007). In ourtreatment, we regard sea-level rise as such a singular event because it is best regarded as exceeding a thresholdlevel.GHANA CLIMATE CHANGE VULNERABILITY AND ADAPTATION ASSESSMENT 91
For our purposes, we examine how <strong>climate</strong> hazards stress natural systems, realizing that there is often ananthropogenic component to the stress mechanism. We list both the current stressors that increase <strong>vulnerability</strong>or future stressors induced by <strong>climate</strong> <strong>change</strong>; many stressors do both. These stressors are water or heat stress,wildfire, desertification, deforestation, soil health (erosion, low fertility, salinization), flooding, coastal erosion,overfishing, <strong>and</strong> saltwater intrusion (Table 6.1). Many of these stressors manifest throughout the country (e.g.,heat stress) but some, such as coastal erosion, are limited to one region. Similarly, some resource systems areimpacted by most stressors but in different ways depending on the resource subsystem, such as agriculture (e.g.,small holder versus commercial operator). Following this overview, we detail how some current stressors increase<strong>vulnerability</strong> in specific resource sectors <strong>and</strong> ecological zones.Table 6.1 Natural Systems VulnerabilityHazardcategory 1Hazard Stressor Resource System Rationale(PotentialOutcome)ReferencesEcologicalZoneDiscreteRecurrentDrought Water stress AgricultureSmall holder rainfedExtremerainfallWildfireDesertificationFloodingAgricultureLivestock/mixedsystemsAgricultureSmall holder rainfedAgricultureLivestock/mixedsystemsAgricultureSmall holder rainfedAgricultureLivestock/mixedsystemsAgricultureSmall holderirrigatedExtreme heat Heat stress AgricultureSmall holder rainfedReduced yieldsor lossReduced yieldsor lossReduced yieldsor lossReduced yieldsor lossReduced yieldsor lossReduced yieldsor lossCrop lossReduced yieldsor lossContinuousDiscretesingularIntensestormsIncreasedtemperaturemeanIncreasedrainfall meanDecreasedrainfall meanIncreasedwindSea-level riseWater stressSoil erosionAgricultureSmall holder rainfedAgricultureSmall holder rainfedReduced yieldsor lossReduced yieldsor loss1 After Brooks (2003); discrete recurrent are transient phenomena; continuous occur over many years or decades; discrete singularare abrupt shifts or possibly continuous events that reach a threshold value (e.g., sea-level rise). According to Brooks, thesegeneral hazard types relate to the likelihood of <strong>adaptation</strong>.92 GHANA CLIMATE CHANGE VULNERABILITY AND ADAPTATION ASSESSMENT
DESERTIFICATION“Desertification” as defined by the United Nations Convention to Combat Desertification means l<strong>and</strong>degradation in arid, semi-arid, <strong>and</strong> dry sub-humid areas resulting from various factors, including climaticvariations <strong>and</strong> human activities (UNCCD, 1994; 2002). L<strong>and</strong> degradation, which in dryl<strong>and</strong>s can lead todesertification, is one of the consequences of mismanagement of l<strong>and</strong> <strong>and</strong> results frequently from a mismatchbetween l<strong>and</strong> quality <strong>and</strong> l<strong>and</strong> use (Beinroth et al., 1994). Activities that can degrade dryl<strong>and</strong>s include highpopulation densities, uncontrolled urbanization, l<strong>and</strong> over-exploitation (e.g., excessive use of marginal l<strong>and</strong>s, shortbush fallow periods), misplanning of large agricultural projects, mechanized farming, overgrazing, bad irrigationpractices, mismanagement of l<strong>and</strong> input <strong>and</strong> neglect of l<strong>and</strong> improvement, inappropriate l<strong>and</strong> use systems <strong>and</strong>policies, bush <strong>and</strong> forest fires, deforestation, <strong>and</strong> mining <strong>and</strong> prospecting. Along with these human-causedfactors, a range of natural factors appear to influence the process of l<strong>and</strong> degradation (e.g., soil types, year-roundaridity, high variability or energy in rainfall, recurrent drought) (Virmani et al., 1994; Reich et al., 2001; UNCCD,2002; EPA, 2003).When l<strong>and</strong> degradation causes desertification, soil productivity diminishes, food production decreases, <strong>and</strong>vegetative cover is lost. Desertification can even negatively impact areas not directly affected by its symptoms, forexample by causing floods, increasing soil salinization, decreasing water quality <strong>and</strong> quantity, <strong>and</strong> increasingsedimentation of natural waters <strong>and</strong> reservoirs (EPA, 2003; Andah <strong>and</strong> Gichuki, 2005).VULNERABILITY AND RISK OF DESERTIFICATION IN GHANAThree ecological zones in Ghana are classified as dryl<strong>and</strong>s based on the aridity index (ratio of mean annualprecipitation to mean annual potential evapotranspiration, UNEP, 1997). These are the Sudan, Guinea, <strong>and</strong>Coastal savanna zones with aridity indices of 0.60, 0.60, <strong>and</strong> 0.54, respectively (EPA, 2003), which place the zonesin the dry sub-humid category of dryl<strong>and</strong>s (UNEP, 1997). The administrative regions within these zones are theUpper East, Upper West, Northern, Greater Accra, Central, <strong>and</strong> Volta (EPA, 2003). Rainfall is unimodal in theGuinea <strong>and</strong> Sudan savanna zones <strong>and</strong> is concentrated into about four to six months of the year, with theremaining period being dry. During the long dry season, bush <strong>and</strong> forest fires are frequent because of the drynessof the atmosphere (i.e., low humidity, high evapotranspiration) <strong>and</strong> availability of combustible materials. The fires,overgrazing, <strong>and</strong> other poor l<strong>and</strong> use practices (Table 6.3) leave much of the l<strong>and</strong>scape essentially barren. Theperiod of excessive, highly erosive rainfall occurring just after the prolonged dry period predisposes these areas,which have erodible <strong>and</strong> low infiltration soils, to a high risk of l<strong>and</strong> degradation, particularly from erosion. In theCoastal Savanna <strong>and</strong> the Forest-Savanna Transition zones, rainfall is bimodal, but the minor wet season isunreliable. In these areas considerable variation exists between successive rainy seasons in time of onset, duration,spatial distribution, amount of rainfall, <strong>and</strong> number of rainy days. These conditions contribute to reductions invegetative cover, crop yield, <strong>and</strong> food security in the affected areas (EPA, 2003).GHANA CLIMATE CHANGE VULNERABILITY AND ADAPTATION ASSESSMENT 93
Table 6.2 Values of aridity index, rainfall, evapotranspiration, <strong>and</strong> water deficit for threemeteorological stations representative of four ecological zones in Ghana: Sudan, Guinea,Forest-Savanna Transition, <strong>and</strong> Coastal savanna zonesMeteorological Site(Ecological Zone)Navrongo(Sudan Savanna Zone)Tamale(Guinea Savanna Zone)Wenchi(Forest-SavannaTransition Zone)Accra(Coastal Savanna Zone)Source: EPA, 2003MeanaridityindexMean annualtotal rainfall(mm)Mean annualeffectiverainfall(mm)Total annualpotentialevapotranspiration(mm)Meanannualwaterdeficit0.54 885 782 1662 86%0.60 1250 964 1720 66.4%0.87 1250 964 1430 12.6%0.54 810 659 1504 46.1%Three independent sources categorized the risk or <strong>vulnerability</strong> of dryl<strong>and</strong>s in Ghana to l<strong>and</strong> degradation <strong>and</strong>desertification, <strong>and</strong> all three show general spatial agreement of where the highest <strong>vulnerability</strong> exists. A global soildegradation <strong>assessment</strong> using expert opinion <strong>and</strong> (semi-)qualitative criteria identified three areas with the mostsevere degradation (GLASOD, Global Assessment of Soil Degradation, survey, Oldeman et al., 1990; FAO,2005). That <strong>assessment</strong> placed the northeastern corner of Ghana (essentially the Sudan Savanna) <strong>and</strong> southeasterncorner (the Ho-Keta plains area) in the “very severe” soil degradation class (FAO, 2005). The degradation in thisarea is long st<strong>and</strong>ing <strong>and</strong> a result primarily of poor l<strong>and</strong> use, such as prolonged intense grazing, frequentwidespread burning, cultivation to the point of near exhaustion of soil fertility, <strong>and</strong> historically high populationdensities <strong>and</strong> associated pressures on the l<strong>and</strong>scape (Figure 6.2) (Dickson <strong>and</strong> Benneh, 1988). A strip along theTogo-Ghana border in the Volta Region was placed in the “severe” soil degradation class, <strong>and</strong> most of theGuinea Savanna <strong>and</strong> Forest-Savanna Transition zone were regarded as having “moderate” levels of soildegradation.A quantified, large-scale (1:30 x 10 6 ) spatially explicit <strong>assessment</strong> of <strong>vulnerability</strong> to desertification based on soiltypes <strong>and</strong> qualities <strong>and</strong> rainfall variability was conducted for all of Africa (Reich et al., 2001). Reich et al. (2001)classified about 36,000 km 2 (16 percent of total l<strong>and</strong> area) in Ghana as having a “high” or “very high”<strong>vulnerability</strong> to desertification. The largest area encompasses most of northern Ghana north of about 10°Nlatitude (all or parts of Upper East, Upper West, <strong>and</strong> northern Northern regions), including the Sudan SavannaZone <strong>and</strong> northern Guinea Savanna Zone, <strong>and</strong> another smaller area was identified in the southeastern corner ofGhana (Ho-Keta plains area) (Figure 6.1). Notably, another 112,000 km 2 (about 49 percent of total l<strong>and</strong> area ofGhana) was identified as “moderately” vulnerable to desertification (Reich et al., 2001). This includes theremaining Guinea Savanna Zone south of the 10°N latitude belt, the Forest-Savanna Transition Zone, <strong>and</strong> theCoastal Savanna Zone.Because accelerated l<strong>and</strong> degradation is associated with increased population density, Reich et al. (2001) spatiallyoverlaid the desertification <strong>vulnerability</strong> classification with population densities to produce a map of the risk ofhuman-induced desertification for Africa (Figure 6.2). In that analysis, most (about two-thirds by inspection) ofnorthern Ghana, inclusive of the Guinea Savanna <strong>and</strong> Forest-Savanna Transition zones, were in the “high” to“very high” risk categories for human-caused desertification. Close inspection of that map highlights the “veryhigh” risk for desertification of many of the urban centers <strong>and</strong> adjacent hinterl<strong>and</strong>s within these zones (e.g., Wa,Tamale). The remaining third of l<strong>and</strong> in these regions was classified at “moderate” risk of human-causeddesertification. Also in the “very high” risk category was a b<strong>and</strong> along the coast corresponding roughly to theCoastal Savanna Zone <strong>and</strong> the southeastern section of the Forest-Savanna Transition Zone (Accra-Ho plainsregion; Reich et al., 2001), areas with the lowest rainfall in Ghana (Minia, 2008).94 GHANA CLIMATE CHANGE VULNERABILITY AND ADAPTATION ASSESSMENT
In the National Action Plan to Combat Desertification, EPA (2003) indicated that about 35 percent (83,489 km 2 )of Ghana’s l<strong>and</strong> area is prone to desertification. Assessments were apparently based on in-country expertise, notquantitative analysis. The savanna zones were acknowledged as prone to desertification. Particular high risk areas(hazard areas) in the Sudan <strong>and</strong> Guinea savanna zones were delineated in the northwestern corner of the UpperWest Region, the entire Upper East Region, <strong>and</strong> eastern part of the Northern Region, enclosing an area borderedroughly by Damongo to the west, Kete Krachi in the south, Burkina Faso to the north, <strong>and</strong> Togo to the east(78,718 km 2 ). The Coastal Savanna Zone was also identified as a hazard zone.Notably, none of these <strong>vulnerability</strong>-risk <strong>assessment</strong>s were conducted in the context of global <strong>climate</strong> <strong>change</strong> butused current conditions as a basis for judgment (e.g., rainfall, soil types <strong>and</strong> qualities, l<strong>and</strong> use, population density,or other features). In addition, two of these methods (Reich et al., 2001; FAO, 2005) were large-scale <strong>assessment</strong>s(continental to global scale), <strong>and</strong> should be interpreted with caution when applied to a smaller area like Ghana.Further, two of the three are not based on empirical data (EPA, 2003; FAO, 2005), but relied on expert opinionor qualitative information to identify degraded areas or areas at risk of desertification. Clearly, a quantifiedevaluation of the temporal pace of vegetation <strong>change</strong> <strong>and</strong> soil degradation is urgently needed given the possibleconsequences to evaluate rates <strong>and</strong> extent of desertification in Ghana with or without <strong>climate</strong> <strong>change</strong>. Even so, alarge number of pressing key issues can be linked directly to desertification in areas of Ghana identified asdryl<strong>and</strong>s at risk or vulnerable to desertification (Table 6.3). Even given these considerations <strong>and</strong> caveats, onlytentative inferences can be put forward concerning the interaction of desertification <strong>and</strong> <strong>climate</strong> <strong>change</strong> in Ghana.Table 6.3 Key Biophysical <strong>and</strong> human-related issues affecting <strong>vulnerability</strong> to desertification ofthe dryl<strong>and</strong> zones (Sudan, Guinea, <strong>and</strong> Coastal savanna zones) of GhanaKey issueBiophysicalRainfall erosivitySalt intrusionSoil propertiesSoil fertilityWater loggingDroughtGroundwater resourcesHuman-relatedPopulationCultivationIssue/Cause-Effects/Vulnerable Zone(s)High energy rainfall increases erosion on sparsely vegetated or bare areas; Sudan <strong>and</strong> Guineasavanna especially vulnerable to sheet <strong>and</strong> gully erosion.Salt intrusion into soils causes crop failure; affecting much of the soil in the Coastal Savanna Zone(Asiamah, 1995; Asiamah et al., 2000)Predominantly s<strong>and</strong> textured surface horizons; rockiness common causing poor water retention,dryness, poor structure; underlain by hard pan, limits infiltration <strong>and</strong> enhances runoff; limited rootgrowth volume; Sudan <strong>and</strong> Guinea savanna zones.Inherently low N <strong>and</strong> P, low organic matter, low buffering capacity <strong>and</strong> cation ex<strong>change</strong>; lowfertility exacerbated by regular, intense bush fires <strong>and</strong> use of organic matter for fuel, animal feed,or building, <strong>and</strong> erosive rainfall; Sudan <strong>and</strong> Guinea savanna zones.Causes flooding <strong>and</strong> crop failures; exacerbated by soil compaction by livestock, raindropcompaction, shallow upl<strong>and</strong> soils; exacerbates silting of rivers causing greater flooding;experienced every rainy season in Sudan <strong>and</strong> Guinea savanna zones, periodic in Coastal SavannaZone.Droughts of 1968-73, 1982-85, 1990-92 adversely affected soil quality, water supplies; eachdrought cycle may exacerbate the <strong>vulnerability</strong> to desertification.Limited over much of region because of lack of geological porosity, low direct recharge viaprecipitation, variable but generally low borehole yields, <strong>and</strong> low hydraulic transmissivity(horizontal flow of aquifers). Characteristic of White <strong>and</strong> Black Volta River <strong>and</strong> Oti River basins,Sudan <strong>and</strong> Guinea savanna zone.Rapidly increasing population of people (<strong>and</strong> livestock) results in overexploitation of <strong>and</strong>intensified stress on natural resources; Sudan <strong>and</strong> Guinea savanna zones.Low input-output farming may result in: nutrient mining; decreased fallow periods; farming ofmarginal l<strong>and</strong>s, hill slopes, <strong>and</strong> fragile river margins; forest <strong>and</strong> woodl<strong>and</strong> removal or degradation;exposure of plinthite to permanently harden into ironpan over extensive areas of Sudan <strong>and</strong>Guinea savanna (Asiamah <strong>and</strong> Dedzoe, 1999). Because of soil textures <strong>and</strong> clay pans,inappropriate mechanized plowing has resulted in topsoil loss, subsoil compaction, <strong>and</strong> exposureof clay subsoil in Sudan <strong>and</strong> Guinea Savanna (e.g., 1970s rice farming in northern Ghana).GHANA CLIMATE CHANGE VULNERABILITY AND ADAPTATION ASSESSMENT 95
Key issueDeforestationBushfiresOvergrazingIndirect <strong>and</strong> off-siteeffectsIssue/Cause-Effects/Vulnerable Zone(s)Increasing dem<strong>and</strong> for fuelwood, charcoal production, <strong>and</strong> building materials as well as losses tobush fires <strong>and</strong> bush-fallow farming. Especially high dem<strong>and</strong> in Guinea <strong>and</strong> Sudan savanna zoneswhere over one third of the l<strong>and</strong>scape has been degraded from 55.6% savanna woodl<strong>and</strong> (>25trees/ha) <strong>and</strong> 44.0% cultivated savanna (6-25 trees/ac) to widely open, cultivated savanna(
significantly recovered by the late 1990s to fill the dam for optimal operating hydropower generation since thedroughts of the early 1980s (Kasei, 2009).Projections from <strong>climate</strong> modeling also predict increases in temperature <strong>and</strong> increased frequency of “Hot” days<strong>and</strong> nights, producing higher peak rainy season temperatures (McSweeney et al., no data a; Kunstmann <strong>and</strong> Jung,2005). Projected temperatures from modeling increased most rapidly in the interior of Ghana but were largestalong the coast (McSweeney et al., no data a; Dontwi et al., 2008). Results from projected rainfall <strong>change</strong>scountrywide or in the Volta Basin are mixed with various models <strong>and</strong> SRES scenarios trending upward,downward, or showing little to no future <strong>change</strong> (McSweeney et al., no data a; Andah et al., 2005; Lehner, 2005;Kunstmann <strong>and</strong> Jung, 2005; Jung, 2006; Minia, 2008). Increased temperatures might also increaseevapotranspiration rates in the Volta Basin although again <strong>climate</strong> projections are mixed (see model details inKunstmann <strong>and</strong> Jung, 2005; Jung, 2006; Kasei, 2009). In sum, <strong>climate</strong> trend data <strong>and</strong> to some extent GCMprojections indicate lower rainfall, higher temperature, <strong>and</strong> perhaps increased evapotranspiration rates, allconditions that exacerbate desertification in those areas already affected <strong>and</strong> increase risk to vulnerable but nowonly moderately affected areas.Regardless of <strong>climate</strong> <strong>change</strong> effects being negative or positive, the continuance along the current human-naturalresource trajectory of population growth, over-exploitation, <strong>and</strong> overall extensive l<strong>and</strong> degradation in thedesertification-prone zones of Ghana (e.g., Idinoba et al. 2010) is clearly unsustainable over the long term. Atbest, the resilience <strong>and</strong> productivity of much of the Sudan <strong>and</strong> Guinea savanna zones will be progressivelyweakened <strong>and</strong> at worst those same areas, particularly those in northern Ghana, will succumb to completedesertification.GHANA CLIMATE CHANGE VULNERABILITY AND ADAPTATION ASSESSMENT 97
Source: P.F. Reich, S.T. Numbem, R.A. Almaraz <strong>and</strong> H. Eswaran et al., 2001Figure 6.1 Vulnerability to Desertification based on soil qualities <strong>and</strong> rainfall variability98 GHANA CLIMATE CHANGE VULNERABILITY AND ADAPTATION ASSESSMENT
Source: Reich etal., 2001Figure 6.2 Riskof Human-Induced Desertification across AfricaDEFORESTATIONAND DEGRADATIONEstimates of forest cover in Ghana vary considerably <strong>and</strong> depend on how forest is definedd <strong>and</strong> the method of<strong>assessment</strong>. To date, nocomplete forest inventory of the country exists. Mostt estimates offorest in Ghana focuson the high forest zone, about the southern third of the countryy (the Rain Forest <strong>and</strong> Deciduous Forest zones,Figure 5.1). Until 1900, it was estimated that 33 percent of the country had forest cover (Wagner <strong>and</strong> Cobbinah1993). By the late 1980s, forest coverhad declined 78 percent (too 1.8 million ha) <strong>and</strong> forestareas are nowfragmented. Estimates of deforestation rates for Ghana vary from 1.3 percent-3 percent/yrr (Appiah, Blay et al.2009). TheForestry Commission estimates the amount of high forest in Ghana in 1900 was about 8.2-8. .8 millionha, consistent with estimates of the HFZ as 8.5 million ha (Hansen, Lund et al. 2009). Official statistics of forestcover, on which estimates of deforestation are based, seem to pertain only to the HFZ. Nevertheless,considerable forest cover exists outside of the HFZ(Wardell, Reenberg et al. 2003) <strong>and</strong> figures for l<strong>and</strong> in forestGHANA CLIMATE CHANGE VULNERABILITYAND ADAPTATION ASSESSMENT 99
eserves include areas in the Forest-Savanna transition <strong>and</strong> Guinea <strong>and</strong> Sudan savanna zones. Hansen et al. (2009)argue that definitions of forest have been applied inconsistently <strong>and</strong> that substantial areas outside forest reservesremain classified as forest but have been in agriculture for some time <strong>and</strong> should be classified as “other l<strong>and</strong> withtree cover.” The practical implication of these difficulties is that current deforestation in the HFZ may be overestimated,which has implications for estimating the baseline under REDD+ <strong>and</strong> the potential reductions incarbon emissions (Hansen et al., 2009). A further consideration is that degradation probably contributes more tocarbon depletion than deforestation (Hansen et al., 2009).Regardless of actual deforestation rates, forest habitat is clearly increasingly fragmented in all zones in Ghana(Figure 6.3). Nearly all of the forests of West Africa have sustained some form of logging or commercial timberutilization (Wagner <strong>and</strong> Cobbinah 1993), <strong>and</strong> it is important to distinguish between logging <strong>and</strong> deforestation. Weview deforestation as the removal of forest cover <strong>and</strong> the conversion into another l<strong>and</strong> use such as agriculture.Slash <strong>and</strong> burn agriculture, often cited as a primary cause of deforestation, lies somewhere in between degradation<strong>and</strong> deforestation. At low levels of intensity with a relatively long interval or fallow period between slashing, thiscommon form of smallholder agriculture could be called forest degradation where primary forest is convertedinto secondary forests with depletion of some species. As the fallow period becomes shortened <strong>and</strong> l<strong>and</strong> iscropped almost annually, true deforestation occurs. But even this definitional distinction is too simplistic a viewof deforestation in Ghana, which is a complex phenomenon with historical as well as contemporary threads(Wagner <strong>and</strong> Cobbinah 1993; Wardell, Reenberg et al. 2003; Asante 2005; Hansen, Lund et al. 2009).A l<strong>and</strong>-use l<strong>and</strong> cover analysis emphasizes the loss of l<strong>and</strong> cover types, especially classes of forest, <strong>and</strong> associatedextent of l<strong>and</strong> degradation in Ghana (Idinoba et al. 2010). In 1972 55.6 percent <strong>and</strong> 44.0 percent of the northernsavanna zones were covered by savanna woodl<strong>and</strong> (>25 trees/ha) <strong>and</strong> open, cultivated savanna (6-25 trees/ha),respectively. By 2000, 33.6 percent of the northern savanna zones had been degraded to widely open, cultivatedsavanna (
Source: US Geological Survey, (http://lca.usgs.gov/lca/africalulc/images/<strong>ghana</strong>_lulc_<strong>change</strong>_pair_factsheet_map_1280.jpgFigure 6. 3 IncreasingFragmentation of Forest Cover in Ghana 1975 -2000Deforestation drivers are proximate or underlying (Geist <strong>and</strong> Lambin 2002; Kanninen, Murdiyarso et al. 2007). Inthe HFZ, proximate factors are agricultural expansion <strong>and</strong> intensification, wood extraction, <strong>and</strong> infrastructureexpansionn (Hansen, Lund et al. 2009) ). Although these activities can be traced back centuries before Europeancontact in Ghana, inter-tribal timber exploitation <strong>and</strong> expansion of cocoa export in the late 1800s (Asante 2005). By the 1930s,slash <strong>and</strong> burn agriculture, bushfires, <strong>and</strong> grazing were seen as causes of forest degradationthroughout thewarfarelocalized their effects (Asante 2005). Large-scale deforestation began withcommercialcountry (Wardell, Reenberg et al. 2003). Customaryownership of l<strong>and</strong>, vestedwith the tribal chiefs (Stools in thesouth, Skins in the north), was seen as incompatible with rational forest management <strong>and</strong> areas were set aside asgazetted forest reserves by the colonial administrations, regulating use of these l<strong>and</strong>s, a process completed by the1950s in the whole country (Wardell, Reenberg et al. 2003; Asante 2005; Hansen, Lund et al. 2009). The system offorest reserves has beenmaintained by the post-colonial governments <strong>and</strong> currently residess with the ForestryCommission; Wardell et al. (2003) argue that pre-colonial l<strong>and</strong> use patterns <strong>and</strong> colonial forestry interventionscontinue to influence current l<strong>and</strong> use <strong>and</strong> natural resource management.In the HFZ, forest clearance for cocoa productionbegan in the east <strong>and</strong> has been spreading westward. Mostcanopy trees were removed although some were left to provide shade for the coca seedlings. Large areaswerecleared bylocal farmersbut also by migrants from the north who gained cultivation rights from the Stool chiefs(Hansen, Lund et al. 2009). The boundaries of the Forest Reserves were by <strong>and</strong> large respected <strong>and</strong> the clearanceGHANA CLIMATE CHANGE VULNERABILITY AND ADAPTATION ASSESSMENT 101
of the off-reserve l<strong>and</strong> was largely completed by the 1970s (Hansen, Lund et al. 2009). An inventory from 1996shows the area of off-reserve l<strong>and</strong>s in various l<strong>and</strong> use/l<strong>and</strong> cover classes (Table 6.4).Table 6.4 Off-reserve l<strong>and</strong> use/l<strong>and</strong> cover in the high forest zone,southern Ghana from a 1996 inventoryL<strong>and</strong> Use/L<strong>and</strong> Cover Class Area (ha) Percentage of total areaNatural forest 664,104 12Secondary forest 183,906 3Fallow 1,440,594 26Newly cleared farms 439,330 8Cocoa farms 1,001,264 18Food crops 1,236,255 22Grass l<strong>and</strong>s 439,330 8Other 102,170 2Total 5,506,953 100Source: Hansen et al., 2009According to Asante (2005), Ghana’s forests have always been regarded as a source of income regardless ofpolicies <strong>and</strong> legislation to protect <strong>and</strong> conserve the forest. During the early phases of l<strong>and</strong> clearing in the HFZ,wood had little commercial value; domestic timber dem<strong>and</strong> was limited <strong>and</strong> export dem<strong>and</strong> was minimal untilafter World War II (Hansen <strong>and</strong> Treue 2008) when it rose rapidly. By the 1960s, off-reserve resources wereinsufficient to meet dem<strong>and</strong> <strong>and</strong> the on-reserve share of exports rose. Harvest peaked at 2 million m 3 annually inthe 1960s, dropped during the economic crisis in the late 1970s-early 1980s, rebounded to pre-crisis levels butstabilized at around 0.9 million m 3 in 1995 (Hansen <strong>and</strong> Treue 2008). Generally, commercial dem<strong>and</strong> was for alimited number of species <strong>and</strong> many areas were selectively logged, effectively contributing to forest degradation.An estimated 32 percent of forest reserves (exclusive of timber production <strong>and</strong> protection areas) in the HFZ wereclassified as degraded (Donkor <strong>and</strong> Vlosky, 2003). Over-exploitation of a number of species led to an export banon 14 commercial species in 1979 that was exp<strong>and</strong>ed with an additional four species in 1987 (Abugre <strong>and</strong>Kazaare, 2010). These figures under-estimate actual removals; the current actual harvest is estimated to be >3times the official tally at about 3.3 million m 3 yr -1 (Hansen <strong>and</strong> Treue 2008) because of under-reporting <strong>and</strong> illegallogging.Illegal logging is widespread in Ghana <strong>and</strong> most (75 percent) is conducted by the informal sector who produce forthe domestic market, variously called chainsaw operators or pit-sawyers (Hansen <strong>and</strong> Treue 2008; Marfo, Halladayet al. 2010). Chainsaw milling for commercial purposes is illegal in Ghana but provides jobs for about 130,000people <strong>and</strong> livelihood support for 650,000 people (Marfo, Halladay et al. 2010). Additionally, chainsaw millingsupplies 84 percent of domestic lumber supply at prices 12-74 percent lower than conventional sawmill lumber(Marfo, Halladay et al. 2010). Hansen <strong>and</strong> Treue (2008) estimated that much of the illegal timber is taken fromforest reserves, ≤1.5 million m 3 yr -1 , which is clearly unsustainable. Commercial species are favored by the illegalloggers, who selectively harvest the higher-value species (Hansen <strong>and</strong> Treue 2008; Abugre <strong>and</strong> Kazaare 2010;Marfo, Halladay et al. 2010).Fuelwood accounts for two-thirds of the energy consumption of Ghana; 84 percent of households use firewood<strong>and</strong> 13 percent use charcoal (Hansen, Lund et al. 2009). Even though much of the firewood comes fromdeadwood from farm <strong>and</strong> fallow l<strong>and</strong>, fuelwood is estimated to consume 25-28 million m 3 yr -1 of raw wood(Hansen, Lund et al. 2009), which is about 7.5 to 8.5 times the estimated national volume of harvested timber.Charcoal is produced primarily in the transition <strong>and</strong> savanna zones but due to dwindling resources, more wood iscoming from the HFZ within reserves (Hansen, Lund et al. 2009). Our observations in the Northern Region werethat much of the locally produced charcoal was being transported to the south, <strong>and</strong> that younger farmers wereab<strong>and</strong>oning growing crops for the more lucrative charcoal production. Because of the low value of the on-reservetimber in the savanna zones, the reserves have been degraded by charcoal harvests (Wardell <strong>and</strong> Lund 2006).102 GHANA CLIMATE CHANGE VULNERABILITY AND ADAPTATION ASSESSMENT
Two other proximate causes of deforestation <strong>and</strong> degradation are mineral mining <strong>and</strong> wildfires (see subsequent).Artisanal gold mining has occurred for >500 years <strong>and</strong> indeed gave Ghana its colonial-era name of the GoldCoast. This pit mining, locally termed Galamsey mining, has contributed mostly to forest degradation. Industrialmining for gold <strong>and</strong> other minerals began in the late 1800s. Although mining within forest reserves is hotlydebated in Ghana <strong>and</strong> was briefly banned in 1997, anecdotal evidence is that some forest reserves have beenseverely degraded by Galamsey mining <strong>and</strong> would be open to industrial mining that has shifted from undergroundto surface mining (Hansen, Lund et al. 2009).Underlying causes of deforestation <strong>and</strong> degradation include macroeconomic, technological, demographic, <strong>and</strong>governance factors (Kanninen, Murdiyarso et al. 2007). Macroeconomic factors include the global dem<strong>and</strong> forprimary resources; for Ghana this has been cocoa, timber, <strong>and</strong> minerals (Asante 2005; Hansen, Lund et al. 2009).Various governmental policies, incentives, <strong>and</strong> tax exemptions have at one time or another favored theseindustries. Technological developments in these industries have also contributed to deforestation <strong>and</strong> degradation.New “sun-tolerant” cocoa varieties requiring less shade than the traditional varieties have prompted clearing oftrees on farms, especially in the cocoa-exp<strong>and</strong>ing western region of the HFZ (Hansen, Lund et al. 2009). As notedabove, the industrial mining industry has adopted new technologies for surface mining, thereby increasing theamount of forest removed in their operations.Ghana’s population has grown at a fast rate <strong>and</strong> is becoming increasingly urban through migration from rural tourban areas. The growing urban population has increased domestic dem<strong>and</strong> for construction wood, charcoal, <strong>and</strong>agricultural products; this dem<strong>and</strong> is met chiefly by increasing the area of productive l<strong>and</strong> rather than increasingthe productivity of already cleared l<strong>and</strong>. As noted above, most of the domestic dem<strong>and</strong> for construction materialcomes from illegal harvesting (Hansen <strong>and</strong> Treue 2008; Marfo, Halladay et al. 2010). Migration from the poorersavanna zones to the south has long been a reality in rural Ghana, dating from colonial days <strong>and</strong> before (Wardell,Reenberg et al. 2003). Over time, this seasonal <strong>and</strong> permanent labor migration has included the slave trade(international, regional, <strong>and</strong> national), regional trade in kola nuts <strong>and</strong> salt, export of mahogany, expansion ofcocoa, wild rubber, <strong>and</strong> public works construction. More recently there has been an exodus of young women tocities in the south to work in menial <strong>and</strong> domestic jobs. Another factor in the savanna zones has been vectors ofhuman <strong>and</strong> livestock diseases that have caused cycles of depopulation <strong>and</strong> repopulation that influencedeforestation <strong>and</strong> natural regeneration of savanna woodl<strong>and</strong>s <strong>and</strong> floodplain gallery forests (Wardell, Reenberg etal. 2003).Governance factors in Ghana are complex with customary or traditional rights overlain by often counteractingcolonial <strong>and</strong> post-independence impositions by the central government. Customary rights affect not only l<strong>and</strong>tenure but also tree tenure. Historically, much deforestation was driven by customary rules that granted usufructor use rights to l<strong>and</strong> by clearing virgin forest; this custom is common throughout West Africa. The customarychiefs (Stool, Skin, <strong>and</strong> lesser chiefs) managed the granting of these usufruct rights, including rights to certain treespecies such as mango <strong>and</strong> shea nut. As noted above, the colonial administration alienated the rights of about 20percent of the forest l<strong>and</strong> into gazetted reserves. The 1962 Concessions Act section 16 went further <strong>and</strong> vested allnatural forests <strong>and</strong> trees, on- <strong>and</strong> off-reserves, in the President in trust for the Stools <strong>and</strong> Skins. Management ofthis trust has devolved to the Forestry Commission (Wardell, Reenberg et al. 2003; Asante 2005; Hansen, Lund etal. 2009).Tree tenure <strong>and</strong> access to trees in Ghana is complex <strong>and</strong> the right that a person has for use or sale of a treedepends on whether it is planted or naturally regenerated; occurs on communal/family l<strong>and</strong> or rented l<strong>and</strong>; <strong>and</strong>how much of the tree is needed (branches or fruit versus whole tree) <strong>and</strong> whether it is meant for commercial ordomestic use (Marfo, Halladay et al. 2010). This means that a tree growing in a farmer’s field belongs to thefarmer if he/she planted it <strong>and</strong> can prove so with a certificate obtained from the Forestry Commission, butharvesting of that tree still requires a permit from the Commission. On the other h<strong>and</strong>, if that tree occurrednaturally <strong>and</strong> the l<strong>and</strong> is within a timber concession granted to a company by the Forestry Commission, thecompany can harvest that tree even if it means damaging the farmer’s crops, usually without any compensation tothe farmer because of low enforcement of rules by the Commission (Hansen, Lund et al. 2009; Hansen 2011).Community members can generally use parts of trees on communal l<strong>and</strong>s for domestic needs but cannot harvestGHANA CLIMATE CHANGE VULNERABILITY AND ADAPTATION ASSESSMENT 103
the products for commercial use (Marfo, Halladay et al. 2010). Inn practice, these rules <strong>and</strong> their selective or lowenforcement encouragee farmers to remove trees toavoid damage or by sale tochainsaw operators to gain somefinancial return (Hansenn <strong>and</strong> Treue 2008; Hansen, Lund et al. 2009). Discussion of other issues such as benefitsharing that provides perverse incentives to forest management by farmers <strong>and</strong> forest fringe communities aredeferred tothe section on REDD+.The foregoing discussion of deforestation <strong>and</strong> degradation of Ghana's forest estate begs the question ofwhy doesit continue<strong>and</strong> who benefits from the status quo? The answer from several authors who have studied thesematters in greater depthsuggests thatt we look at the political economy of timber in Ghana (Asante 2005; Hansen<strong>and</strong> Treuee 2008; Appiah, Blay et al. 2009; Hansen, Lund et al. 2009; Hansen 2011). The encapsulatationof theseanalyses (Hansen et al. 2009; Figure 6.4) suggested that it beginss with the failure of policies to protect <strong>and</strong>conserve the forests, the dominance of executive <strong>and</strong> bureaucratic actors whopursue revenue generationn fromthe forest estate, <strong>and</strong> external factors such as global dem<strong>and</strong> for r the products of resource extraction <strong>and</strong> service ofnational debt (Asante 2005). This constellation of underlying drivers providess the context for urban elites whofinance the illegal loggers <strong>and</strong> an industrial timber industry focused on exportt who maintainn pressure forsupportinga forest regime that effectively subsidizes log prices (Hansen, Lund et al. 2009). Because of a biasedbenefit-sharing arrangement, the small portion of forest fees that are channeled back to local government <strong>and</strong>customaryauthorities are used for recurring expenses or semi-private purposes (Hansen, Lund et al. 2009; Hansen2011).Figure 6.4 The political timberr economy of GhanaHorizontal straight arrows signify thesequence of governance effects that lead to deforestation <strong>and</strong> forestdegradation while curved arrows signify associated, unofficial cash flows. Source: (Hansen, Lund et al. 2009)WILDFIREThe complex role that wildfire plays in shaping ecosystems can be described in terms of four vegetationresponses: fire-dependent, fire-sensitive, fire-independent, <strong>and</strong> fire-influenced. Fire is largely absent fromfire-independent ecosystems such as the evergreen rainforest in Ghana where conditions are wet burn. At the other104 GHANA CLIMATE CHANGE VULNERABILITY AND ADAPTATION ASSESSMENT
extreme, fire is essential in fire-dependent ecosystems where species have evolved to withst<strong>and</strong> burning <strong>and</strong> tofacilitate fire spread. The northern Savanna Zone in is such an ecosystem. Fire-sensitive ecosystems have evolvedwithout fire as a significant process but humans have made them vulnerable to wildfire. Many of the deciduousforests would be fire-sensitive. Fire-influenced ecosystems generally are adjacent to fire-dependent vegetationwhere wildfires originate <strong>and</strong> spread; this type characterizes much of the forest-savanna transition. The responseto fire in fire-influenced ecosystems is variable <strong>and</strong> often subtle. Government policy since the colonial era hasbeen to reduce the occurrence of wildfire as much as possible by restricting its use <strong>and</strong> limited attempts tosuppress wildfires (Laris <strong>and</strong> Wardell 2006). Such policies ignore the ecological role of fire as well as thetraditional use of fire by agriculturalists, pastoralists, <strong>and</strong> hunters. There are few data on fire occurrence in Ghanabut anecdotal evidence suggests that fires are common in the Northern Savanna zone, almost annual events.Wildfires are not as widespread in the forests regions, yet there may be a wildfire every year in many districts(Appiah, Damnyag et al. 2010) where the most common ignitions were caused by slash <strong>and</strong> burn l<strong>and</strong> preparationfollowed by fires set by hunters.Wildfires <strong>and</strong> biomass burning are a significant component of Ghana’s GHG emissions. The draft NationalWildfire Policy (as of 2006) seeks to overcome past policy limitations (unclear authorities, lack of deterrents,disregard of traditional practices <strong>and</strong> no involvement of traditional authorities in policy formulation orimplementation). Nevertheless, the draft policy is overly focused on fire prevention <strong>and</strong> suppression, ignoring therole of fire as an ecological agent <strong>and</strong> a traditional management tool.FISHERY RESOURCES AND OVERFISHINGThe fishing industry in Ghana is based primarily on a large, marine fishery, <strong>and</strong> to a lesser but important extent,on inl<strong>and</strong> or freshwater fisheries <strong>and</strong> aquaculture. Fish make up about 40-60 percent of the protein in theGhanaian diet (Finegold et al., 2010). Much (about 42 percent) of the population lives
one of its natural characteristics. On evolutionary time-scales this instability within <strong>and</strong> between years is favorableto small plankton-eating fish with high fecundity <strong>and</strong> rapid generation times that can exploit unpredictable periodsof exceptional high productivity <strong>and</strong> persist through periods of exceptionally low productivity.The high biomass of these, mostly schooling, water-column dwelling species, collectively termed “small pelagics,”are the foundation <strong>and</strong> mainstay of the fishery of Ghana. Their life cycles, adapted to exploit times of highproductivity, can be resilient to even high fishing pressure <strong>and</strong> can sometimes recover rapidly fromoverexploitation (Bakun, 1998). Additionally, the small pelagics, because of their richness in oils <strong>and</strong>micronutrients, provide quality nutrition (e.g., Lokko et al., 2004). Small pelagic species dominate the catch, butin the sea, they are preyed upon by a high diversity of high-value, large pelagic species in Ghana’s fishery (e.g.,tunas, billfish, <strong>and</strong> marlin). The productivity supported by the upwelling system also increases productivity on thesea floor, supporting a rich fauna of demersal, or bottom-dwelling, fish on the continental shelf of Ghana. About90 lagoons along Ghana’s coast are also among the available habitats for marine resources, <strong>and</strong> provide vitalseasonal income <strong>and</strong> subsistence fish <strong>and</strong> crustacean catches for nearby communities (Finegold et al., 2010).The productive marine ecosystem of Ghana has supported a massive increase in fishing yield since the 1970s, butstrong signals indicate it is under increasing strain (Koranteng <strong>and</strong> Pauly, 2004; Finegold et al., 2010). Catch ofprominent species in the fishery have declined; most notably those high in the food web as is often the case inheavily exploited systems (Pauly et al., 1998; Koranteng <strong>and</strong> Pauly, 2004), but also more recently the small preyspecies (Bannerman <strong>and</strong> Cowx, 2002; Koranteng, 2004; Finegold et al., 2010). Striking, sudden system shifts(disappearance <strong>and</strong> appearance of fish species, e.g., round sardinella Sardinella aurita; sudden proliferation ofotherwise uncommon species) can at least in part be attributed to high fishing pressure (Koranteng <strong>and</strong> Pauly,2004). These observed <strong>change</strong>s indicate the future of the services provided by marine <strong>and</strong> coastal habitats are byno means assured (Finegold et al., 2010). The vulnerabilities of this system are multi-faceted with or withoutconsideration of <strong>climate</strong> <strong>change</strong>.MARINE FISHING FLEETOne of the most notable <strong>change</strong>s in recent decades is the tremendous growth in fleet size in nearly every category(Table 18), one, but only one indication of the increasing pressure being put on the marine fishery resource. Thefleet today can be divided into 5 primary categories; the canoe fleet, the inshore fleet, the industrial fleet, the tunafleet, <strong>and</strong> an extremely data poor segment, the coastal lagoon fisheries (Table 18, Ferraris <strong>and</strong> Korangeng, 2004;Dontwi et al., 2008; Finegold et al., 2010). A host of other biological symptoms of decline coupled with <strong>change</strong>sin fishing practices also emphasizes the increasing <strong>vulnerability</strong> of the marine fishery resource without anyconsideration of <strong>climate</strong> <strong>change</strong> (Table 19; see also State of the marine fishery).Canoe Fleet: The canoe fishery is the most numerous <strong>and</strong> diverse fleet segment in Ghana, harvesting fishes fromall resource sectors: large pelagic fish (tuna, billfish, sharks) by drift gillnets <strong>and</strong> hook <strong>and</strong> line gear; small pelagicfish via purse <strong>and</strong> beach seines; <strong>and</strong> demersal species with set nets <strong>and</strong> beach seines. Ghanaian canoe fishers areadaptable using >20 identifiable gear types (Doyi <strong>and</strong> Neequaye, 1990; Marquette et al., 2002) in the fishery toincrease catch efficiency. The canoe fleet can be further subdivided by size, which also reflects the types of gearemployed (Finegold et al., 2010).Small or “one man canoes,” typically 4-5m long <strong>and</strong> powered by paddle or sail, are used inshore for line fishing,small gill nets, <strong>and</strong> cast nets (especially in lagoons). During the last canoe census (2004), small canoes comprisedonly 5 percent of the surveyed canoe fleet. Subsistence fishing, particularly in lagoons, is not captured in l<strong>and</strong>ingstatistics (Finegold et al., 2010).Mid-sized canoes are 6-11 m long, typically crewed by 2-11 fishers, propelled by sail, paddle, or 8-40 hp motors(depending on length), <strong>and</strong> are used primarily for bottom-set, floating, or drifting gill nets <strong>and</strong> line fishing. Someare also used with smaller beach seine nets (Finegold et al., 2010).Large canoes are 11-17 m long, crewed by 10-25 fishers, <strong>and</strong> propelled primarily by 40 hp motors. The largecanoe category can be subdivided into the larger Ali/Poli/Watsa (APW) canoes <strong>and</strong> the large beach-seine canoes(Finegold et al., 2010). The former are named after the type of traditional fishing gear once used: “ali” nets were106 GHANA CLIMATE CHANGE VULNERABILITY AND ADAPTATION ASSESSMENT
gill nets constructed from traditional fibres; poli <strong>and</strong> watsa nets are types of purse seine. Gear types have evolvedconsiderably over the last century. Large canoes also employ large drift nets (e.g., the “nifa-nifa” net). Largebeach-seine canoes make up the second sub-category; these usually have high planking at the bow to prevent largewaves coming on board when operating in the surf (Finegold et al., 2010).Without registration requirements <strong>and</strong> no limits on access to the fishery, the number of active canoes in Ghanahas continually increased from 7,000 in 1980 to an estimated current fleet size of 13,500 (projected from lastcanoe survey in 2004, Finegold et al., 2010). From 1970 to 1980, about 85 percent of all canoes were reported tobe motorized; now the figure has fallen to a fairly consistent 55 percent. Substantial growth occurred in motorizedcanoes, canoes, <strong>and</strong> canoe fishers in all coastal administrative regions from 1995-2004, but growth was notablystrong in the Western Region which now represents about 36 percent of the canoe fleet of Ghana (Finegold et al.,2011).Semi-industrial or inshore fleet: The semi-industrial or inshore fleet consists of mostly locally-built, plankedwooden-hulled vessels (8-30 m long) with inboard diesel engines (90-400 hp) (Bannerman <strong>and</strong> Cowx, 2002; DoF,2003; Nunoo et al., 2009). These vessels use trawling gear to catch demersal fish <strong>and</strong> purse seines to capture smallpelagic fish during the major <strong>and</strong> minor upwelling periods. Smaller vessels in this class are generallyunderpowered for trawling <strong>and</strong> with the adoption of light fishing in the minor or low seasons, they have tended tospecialize in purse seining. Most purse seine nets are 400-800 m long <strong>and</strong> 40-70 m deep with a mesh size of 25-40mm; nets >2 km long are used by the large vessels. First deployed in Ghana in 1948, the numbers of these vesselsquickly peaked in the early 1970s. Following steep decline from the early 1990s to early 2000s, vessel numbersrose sharply again through early 2000s, an impending warning sign of significantly increasing effort <strong>and</strong> perhapsstock overexploitation. The rapid <strong>and</strong> continued increase in this fleet likely relates to the adoption of light fishing,<strong>and</strong> the associated year-round access to the small pelagic resource (Finegold et al., 2010).Industrial fleet: The industrial fleet consists of large, steel hulled foreign-built vessels that are further distinguishedfrom the inshore fleet by their ability to freeze fish at sea, <strong>and</strong> hence, their ability to stay at sea for long periods oftime (Finegold et al., 2010). Apart from the tuna fleet (see subsequent), the industrial fleet largely engages indemersal trawling. A sub-fleet targeting shrimp operated in the 1990s (22 operational vessels maximum); however,since 2002 only two operational shrimpers were reported. Another sub-fleet consists of ships practicing pairtrawling, in which two industrial vessels pull a trawl net between them. Pair trawling was introduced in 2000, <strong>and</strong>the fleet grew to 20 vessels before the practice was banned in 2008. Though pair trawlers were supposed to be refittedas single trawlers following the ban, some may still be operating in pairs, leaving port separately <strong>and</strong> meetingup at sea. Fishermen in the Western Region continue to report observing pair trawlers operating off the coast(Finegold et al., 2011).The industrial fleet has steadily exp<strong>and</strong>ed with a sharp increase over the last three decades when governmentpolicy targeted this fleet to promote fishery development <strong>and</strong> improved incomes from the sector. A problematicgap in the Ghanaian sampling system is that industrial vessels provide information on their own catches (selfreport), <strong>and</strong> no method is in place to verify the information provided. Extremely low catch <strong>and</strong> effort arereported by this fleet, so low it is inconceivable they could make a profit, providing strong indications that vesselssubstantially under-report catches (Finegold et al., 2010). Given the catch potential of these large vessels <strong>and</strong> theirability to stay at sea for long periods <strong>and</strong> transship catch to places other than Ghana, better data on this fleetsegment is urgently required. The industrial fleet also supports another emergent but illegal “fishery”; one whereso called “trash fish” (low value, small or damaged fish) are transferred at sea from trawlers to canoes speciallymodified to transport large volumes of fish (Nunoo et al., 2009). These fish then enter the normal beach-basedmarket chain as accessed by canoe fishers. If this trade continues, Ghana’s long-st<strong>and</strong>ing traditional fishingvocation, which is ranked among the best in West Africa (Atta-Mills et al., 2004) may be lost. Also, the increase indiscards on the market tends to encourage offshore vessels to fish much closer to shore <strong>and</strong> also to use small,illegal mesh sizes. The continuation of trash fish trade puts more pressure on Ghana’s depleting fish stocks, yetanother situation that may push the already overfished stocks towards collapse. In addition, a government subsidyon fuel for artisanal fisheries, which is supposed to be used for legal fishing activities, is channeled into transshipmentof catch at sea (Nunoo et al., 2009).GHANA CLIMATE CHANGE VULNERABILITY AND ADAPTATION ASSESSMENT 107
Tuna fleet: The tuna fleet is commonly considered to be part of the industrial fleet. The tuna should beconsidered as a separate entity because it is subject to a different governance system, regulated to some degree byinternational conventions (under the International Commission for the Conservation of Atlantic Tuna – ICCAT),targets a different resource with different gear types, <strong>and</strong> often fishes much further from shore than the otherfleets (Finegold et al., 2010). The fishery was initially exploited by foreign-flagged vessels, peaking at some 80active vessels in 1970. The first Ghanaian-flagged vessel went to sea in 1973; the last foreign vessels left in 1984.Since this time the number of active tuna vessels has numbered 35 to 40 (Finegold et al., 2010).Lagoon-based subsistence/commercial fisheries: As the smallest fishery segment in Ghana, lagoon fisheries arethe least known from scientific or national fishery authority perspectives (Finegold et al., 2010). Given the 90lagoon systems along the coast, they are significant in terms of subsistence <strong>and</strong> seasonal commercial fishing formany communities (Koranteng et al., 2000). Gear types used in lagoons is for the most part not recorded in gearsurveys, but along with nets operated from small canoes, cast nets, line fishing <strong>and</strong> various types of traps arecommonly employed. Catch data are practically non-existent outside of a few studies in the scientific literature. Inmany ways, lagoon fisheries st<strong>and</strong> apart from marine fisheries. Their degree of exposure to externalenvironmental drivers (up-stream effects, competition for water resources, erosion, <strong>and</strong> extreme pollution) ismore akin to inl<strong>and</strong> fisheries resources than their marine counterparts. The strong traditional belief systemsaround lagoons <strong>and</strong> the de-facto property right due to proximity of villages exploiting the resource present anentirely different set of incentives for governance to those seen in coastal <strong>and</strong> offshore fisheries (Finegold et al.,2010).Table 6.5 Characteristics of fishing fleets in GhanaFleet Crew Length (m) Power Gear types Estimated fleetgrowthCanoe fleet About 7,000(1980) to 13,000(2010)Small Canoe 1 4-5 Paddle or sail Lagoonal/near coast line fishing,small gill nets, drag nets, cast nets,traps (esp. in lagoons)Mid-sizeCanoe2-11 6-11 Sail, paddle, 8-40 hp gasolinemotorLarge Canoes 10-25 11-17 Primarily 40 hpgasoline motorsSemi-industrialor inshorefleetIndustrial fleetTuna fleet8-30 90-400 hp dieselmotorsLarge, steel hulledseagoing vessels, >35 m,stay at sea long periodLarge, steel hulledseagoing vessels >30 m,stay at seas long periodsLarge dieselmotorsLarge dieselmotorsInshore bottom set, floating,drifting gill nets or line fishing; alsosmall beach seinesInshore gill nets, purse seines, driftnets, large beach seines; also lightfishingInshore, trawls <strong>and</strong> purse seines,light fishingAbout 154 (1990)to 339 (2008)Demersal trawling; pair trawling About 32 (1970)to 73 (2008)Line fishing, Long lines, purse seine,fish aggregation devicesSource: Marquette et al., 2002; Koranteng <strong>and</strong> Pauly, 2004; Dontwi et al., 2008, Feingold et al., 2010)Stable at 35-40STATE OF THE MARINE FISHERYAlthough catch data from Ghana’s coastal fisheries go back to 1950 (Figure 6.5), methodological <strong>change</strong>s dictatecaution in comparing reported catches before <strong>and</strong> after 1972 (Finegold et al., 2010). Even so, a broad overviewindicates slow development up to the early 1970s is followed by a fairly consistent increase in catch until the late1990s. The variability between 1970 <strong>and</strong> 1990 likely reflects environmental drivers (e.g., sea temperature,108 GHANA CLIMATE CHANGE VULNERABILITY AND ADAPTATION ASSESSMENT
upwelling strength) involved in regulating pelagic productivity (Koranteng, 2004; Koranteng <strong>and</strong> McGlade, 2004;Perry <strong>and</strong> Sumaila, 2007). Notably the sizeable dip in pelagic catches from 1972 to the mid 1980s coincides with anear-complete crash <strong>and</strong>subsequent slow recoveryof the roundd sardinella (Sardinella aurita) ) (Koranteng, 2004), aprimary target <strong>and</strong> mainstay of the pelagic fishery. Since 2000, total catches showed a continuing declining trend,driven largely by a marked decrease inseveral species in the pelagic fish catch, which is offset somewhat by a risein catch ofdemersal species.Source: FAOFishStat Plus, compiled by Finegold et al., 2010Figure 6.5 Total reported catches by major group from Ghana’s marine fisheriesPelagic stocks: Because they are not associated withseafloor habitats, but relyy totally on oceanic productivity, thedynamics <strong>and</strong> therefore managementof pelagic fishresources iss complex. Pelagic species tend to be fastswimming, schooling species which migrate widely, often crossing national boundaries. Effective managementmust be applied at a broad spatial scale, encompassing neighboring regions, districts, <strong>and</strong> countries sharing theresource. This represents an added level of <strong>vulnerability</strong> to pelagic resource sustainability.All fleet segments exploit the pelagic fishery resource in Ghana although catches by industrial trawlers are largelyincidental.Small, schooling species (sardinellas, anchovies, mackerel) make upthe vast majority of this catch, butthe small pelagic catch is currently at its lowest level since the 1970s (Figure 6.5). Given theinherent,environmentally driven variability of the small pelagic resource (e.g., Wiafe et al. 2008), the current decline cannotwith certainty be assigned to a fishery-driven stockcollapse that will have lasting effect. However, the mostsustained period of decline is currently occurring inthis resourcee since heavy exploitation began. The declinecoincides directly with the uptake of light fishing (discussed below), which massively increased the pressure onthis resource.Decline incatch of small pelagic species since the mid-1980s (Figure 6.6) is not caused by the crash of onedominant species (as in the 1970s case with round sardinella), but rather of simultaneous decline of threee (of four)main small pelagic species. Interviewswith fishers in the Western Region (Finegold et al., 2010) <strong>and</strong> CentralRegion (pers. obs.) indicate this trendcontinued in2010-2011.GHANA CLIMATE CHANGE VULNERABILITY AND ADAPTATION ASSESSMENT 109
Sources: FISHSTAT, FAO, <strong>and</strong> Marine Fisheries Research Division, Tema, compiled by Finegold et al., 2010Figure 6.6 Dataa on <strong>change</strong>sin catch off the small pelagic resourceDemersal stocks: Demersal fish (bottom associated) are less mobile than pelagic species <strong>and</strong> as such depend tovarying degrees on the integrity of seafloor habitat. Even though the transboundary migration issues associatedwith pelagic stocks are less of a problem, the habitat association <strong>and</strong> the sedentary nature of this group makethem highly susceptible to overfishing <strong>and</strong> habitat damage. The resource in Ghana is exploited in inshore waters<strong>and</strong> on thecontinental shelf to a depth of about 75-m. Demersal fishes are targeted by all three prominent fishingfleets: linefishing in thecanoe fleet; bottom-set gill nets, beach seines, <strong>and</strong> low(“warm”) season trawlingby thesemi-industrial fleet; <strong>and</strong>trawling by the industrial fleet.Several lines of evidence suggest demersal stocks are overexploited in the Ghana fishery. By the early 1970s, theheavily exploited status of demersal stocks in this region was apparent (Gull<strong>and</strong> et al., 1973). Recent reviews ofdemersal stocks in Ghana (e.g., Koranteng <strong>and</strong> Pauly, 2004) report clear trends in the reduction of biomass oflonger lived <strong>and</strong> predatory fishes (e.g., snappers, groupers, seabreams, <strong>and</strong> Atlantic bigeye),suggestingoverexploitation of the fishery. Thesee results comefrom national catch statistics, but also from fishery-showed a markedindependent sources (research trawl surveys between 1963 <strong>and</strong> 2000). The independent surveysdecline in the abundance of demersalfishes in the 0-30 m depthh zone, clear indication of overfishing (Karenteng<strong>and</strong> Pauly,2004). The reason deeper water does not show a decline is twofold: methodological <strong>change</strong>s in thesurvey would mask recent declines <strong>and</strong> that much of the deeper waters are rocky <strong>and</strong> hard for trawlers toexploit(Karenteng <strong>and</strong> Pauly, 2004).Ghana’s demersal fishery is exhibitingsymptoms of an unstable ecosystem. Some notable examples indicative ofinstability are the repeated collapse <strong>and</strong> recovery of a shrimp fishery operatingaround the Volta estuary(Koranteng, 1998; Koranteng <strong>and</strong> Pauly, 2004) <strong>and</strong>the massive proliferation in trigger fish (Balistes carolinensis) in1973 followed by near-total collapse in the early 1980s, a near total recovery inthe late 1980s, <strong>and</strong> a sustained <strong>and</strong>perhaps permanent collapse in 1989 (Ansa-Emmimm, 1979; Koranteng, 1984; Caverivière, 1991; Aggery-Fynn,2007). Thelatter speciess had not previously been reported in thee area prior to1970s, yet it rapidly came to almost110 GHANA CLIMATE CHANGE VULNERABILITY AND ADAPTATION ASSESSMENT
completely dominate trawl catches before it collapsed. Its appearance is likely related to the availability of newlycreated “niche space” because of the wholesale removal of other demersal species by trawl fisheries. Otherexamples of symptoms of instability include the decline <strong>and</strong> subsequent recovery of round sardinella, Sardinellaaurita, populations (Pezennec 1995), <strong>and</strong> the increase in abundance of cuttlefish, Sepia officinalis <strong>and</strong> globefish,Lagocephalus laevigatus (Ramos et al., 1990; Koranteng, 1998).Multivariate analysis of demersal catch composition in Ghana from 1972 until 2008 is also informative (Finegoldet al., 2010). The most significant shift occurred between 1988 <strong>and</strong> 1989. This coincides with the crash of thetrigger fish fishery <strong>and</strong> an increase in burrito catch. The increase in burrito catch might reflect fishers targetingburrito as a replacement for trigger fish. The second shift in catch composition occurred between 1997 <strong>and</strong> 1998<strong>and</strong> is driven by a decline in burrito catch <strong>and</strong> an increase in cassava fish catch. The continuing <strong>change</strong> in catchcomposition to 2008 (last sample analyzed) is driven by the increasing dominance of cassava fish in the catch.Although these community shifts cannot with total certainty attributed directly to fishing pressure, demersalcommunities typically are more stable than pelagic communities. Shifts in community structure caused byenvironmental factors (e.g., upwelling strength) are unlikely to lead to the permanent <strong>change</strong>s seen here. Similaranalysis conducted on pelagic catches in Ghana showed no long-term consistent <strong>change</strong>s in composition(Finegold et al., 2010). The shifts apparently coincide with the removal of species dominant in catches, <strong>and</strong> assuch, suggest fishing pressure as a principal cause of compositional <strong>change</strong>s (Finegold et al., 2010).FISHING EFFORT AND TECHNOLOGY CHANGESOne of the significant shortfalls of fishery regulation <strong>and</strong> management in Ghana is a failure to document fishingeffort among fleets. However, at the coarsest level, fleet size provides a measure of fishing effort. Increasednumbers of active fishing vessels will likely lead to greater fishing pressure on resources. In Ghana, all fleets haveexp<strong>and</strong>ed, some substantially so, since the 1990s, but the expansion is not reflected in total l<strong>and</strong>ings. To thecontrary, as fleet size increased, catch has dropped. This coarse level of measurement is not the whole story, but itis a warning sign regarding the state of resources (Finegold et al., 2010).Another indicator of fishing effort is time spent fishing or catch per unit effort (CPUE). If vessel numbersincrease, but the time spent fishing by each vessel decreases, then vessel numbers viewed in isolation mayrepresent an overestimate of the <strong>change</strong> in fishing effort. Data suggest a severe decline in CPUE for the inshorefleet, but no particular trends for the canoe or industrial fleet (Finegold et al., 2010). Although an improvementbeyond simple measures of fleet size, measuring effort only as the number of fishing trips, which is howGhanaian fisheries authorities measure effort, can be misleading in comparing across decades. Changes intechnology <strong>and</strong> fishing practices can have a dramatic impact on effective fishing effort with no associated <strong>change</strong>in number of fishing trips (Finegold et al., 2010).Fishers in Ghana have adopted a number of <strong>change</strong>s to their fishing practices that could substantially increase theeffective fishing effort of a single trip. In the canoe <strong>and</strong> inshore fleets in particular, continued innovation <strong>and</strong><strong>change</strong> have massively increased fishing power, even in the last decade. Among these are the use of outboardmotors, <strong>change</strong>s in net type, net construction, or net size, <strong>and</strong> light fishing (Finegold et al., 2010).Outboard motors <strong>and</strong> increased travel: Outboard motors allow fishers to travel great distances <strong>and</strong> track <strong>and</strong>exploit schools of small pelagic fishes as they move seasonally (Finegold et al., 2010). Similarly, gill netters or linefishers using outboard motors can target the relatively sedentary demersal stocks <strong>and</strong> maintain catches despitedwindling fish stocks. In Ghana, as shallow water stocks declined, outboard motors allowed canoe fishers to gofarther along the coast <strong>and</strong> offshore to find new fishing grounds as others are depleted, a process termed serialdepletion of a fishery. Over the last 10 years in the Western Region, interviews with fishers revealed that today onaverage they travel 2.7 times longer to get to fishing grounds than they did only 10 years ago (Fig. 6.7, Finegold etal., 2010). Given the increase in engine power over the past three decades, the increase in distance which theymust travel to find fish would be even higher. Serial depletion masks fish stock declines until no fishers cannotlocate productive fishing grounds, at which point CPUE will decline abruptly <strong>and</strong> severely. The shift to higherpower, more efficient engines (i.e., 23-30 hp in 1981 to 40 hp engines, today) <strong>and</strong> improved propellers likelyGHANA CLIMATE CHANGE VULNERABILITY AND ADAPTATION ASSESSMENT 111
epresentss a doubling of effective engine power over the past three decades (Finegold et al. ., 2010). Similarly, smallcanoes arenow often equipped with small (generally 8 hp) engines, again increasing effective range.Figure 6.7 Relativee time takenfor fisherss to reach their fishing groundsChange innet systems: Effort measured in terms of fishing tripss does not account for <strong>change</strong>s in net type, netconstruction, or net size, all of whichh enormously impact fishingg power. Detailed data on gear <strong>change</strong>s over timein Ghana are unavailable; however, field observations, interviews with fishers, <strong>and</strong> a few reports point tosignificant<strong>change</strong>s (Finegold et al., 2010).To effectively double fishing effort, a fisher could double the length of net deployed. Dataa on <strong>change</strong>s in netlength are unavailable for Ghana, butare available for a Côte d’Ivoire canoe fishery for large pelagic species(targeting billfish, sharks, <strong>and</strong> tuna; Bard <strong>and</strong> Goran, 2001). Between 1984 <strong>and</strong> 2000, the average length of gillnets doubled <strong>and</strong> the fishery data system reported an increase inn fishing trips from low levels in 1984 (
have increased substantially due to using smaller mesh monofilament gill nets. Mesh sizes used in theconstruction of purse seine nets <strong>and</strong> drift nets may also have decreased in recent years (Finegold et al., 2010).Light fishing: The technique of light fishing, as the name implies, involves using lights at night to attract largeaggregations of small pelagic fish, increasing their catchability. Over the past two decades, light fishing rapidlybecame the technological innovation with the greatest impact on Ghanaian fishing (Finegold et al.. 2010). Thetechnique was initially introduced by the Marine Fisheries Research Division (MFRD) as a means of alleviatingpoverty <strong>and</strong> increasing food availability. Canoe fishers found it difficult to make a living fishing outside of themajor upwelling season (the “maura” season) because their main target species, the small pelagics (i.e., herrings,sardinella, <strong>and</strong> anchovies), were inaccessible. Early trials conducted initially in 1962 <strong>and</strong> showed promise(Bannerman <strong>and</strong> Quartey, undated cited in Finegold, et al. 2010), but the equipment was too expensive for mostfishers <strong>and</strong> the potential benefits were not fully understood. In the early 1990s, the incentives for light fishing<strong>change</strong>d when the inshore fleet adopted the technology, <strong>and</strong> canoe fishers soon followed. The inshore fleetbenefited considerably. The inshore vessels were originally designed to operate purse seines during the upwellingseason, <strong>and</strong> then convert to trawling in the low season, but most were underpowered for trawling. Light fishingprovided the option of continuing purse seine operations even in the low season. In interviews, fishers indicatedcatch in the low season was 3-8 times higher when using lights (Finegold et al., 2010). Many fishers suggested thatwith the current level of fish stocks, fish catch would be low to nonexistent in the low season without lights.Purse seiners (predominantly “watsa” gear) from the large canoes <strong>and</strong> the inshore fleet now use light fishing.Small generators power high wattage inc<strong>and</strong>escent lights that are lowered into the sea on long cables (Finegold etal., 2010). The technique has essentially extended the targeted small pelagic fishery from a three-month to a yearroundfishery. For many canoe fishers, prior to their use of light fishing, fishing activities in the low season werelargely for subsistence purposes, rarely were enough fish caught to sell for profit. With the use of lights, despite adecline in fish stocks, the chance of a profitable catch in the low season has substantially increased. Fishers whoonce <strong>change</strong>d to line or drift net fishing in the low season now purse seinet year-round. Since lights are noteffective near the period of the full moon, many fishers only fish for two weeks a month, one week on either sideof the new moon. In effect, this may act to decrease fishing effort as measured in number of trips. Yet once theuptake of light fishing is considered, the overall increase in fishing pressure is still considerable, once againconfounding CPUE estimates from the fisheries information system. Light fishing activities were addressed ininterviews of fishermen in the Western Region. Although the inshore fleet was first to use the technique, since2000 increasing numbers of canoe purse-seiners are light fishing (Figure 10). Coupled with the large increase inthe canoe <strong>and</strong> inshore fleets, this likely has produced in the last 10 years a massive increase in the fishing pressureon the small pelagic resource (Finegold et al., 2010).GHANA CLIMATE CHANGE VULNERABILITY AND ADAPTATION ASSESSMENT 113
Source: Finegold et al., 2010Figure 6.8 Percentage of interviewedpurse-seinee (wasta) fishersin Western Region Usingg light fishingTable 6.66 Symptoms of decline, sensitivities, <strong>and</strong> vulnerabilities of the marine fishery resources<strong>and</strong> associated <strong>change</strong>s in fishing effort <strong>and</strong> technology posing increasing risk to the resourceCategorySymptoms, sensitivities, <strong>and</strong> vulnerabilitiesPelagic FisheryInherently variable in productivity because of environmental drivers (e.g., sea-surface temperature,upwelling strength <strong>and</strong> duration), but species tend up to a point tobe resilient <strong>and</strong>adapted to boom-<strong>and</strong>-bust cycles.Currently, experiencing most sustained period of catch decline across multiple important fishes (i.e.,anchovies, sardinellas) (lowest levell since the 1970s, when all fleetss were much smaller) (Fig. 6.6).Decline coincides with initiation of light fishing which allows near year- round exploitation, primarily bycanoe <strong>and</strong> semi-industrial fleets.Nearly all fleet categories exploit pelagic fishes, so pressure is frommultiple zoneson the continentalshelf, depths, <strong>and</strong> gear types.Demersal FisheryInherently more stable <strong>and</strong> less susceptible to environmental variability than pelagic fishery, but lessresilient to over exploitation.Biomass of longer-lived, predatory fishes reduced.Decline in abundance of demersal fishes at 0-30 m depths.Other symptoms ofinherent instability include:shifts in catch composition coinciding with apparent sequential over exploitation of dominant species;repeated collapses <strong>and</strong> recovery ofstocks across multiple disparate species sudden appearance,dominance, <strong>and</strong> disappearance of species new to the fisheryrapid population growth of formerly uncommon orr moderately abundant speciesTargeted by the canoe, semi-industrial, <strong>and</strong> industrial fleets which have shown rapid growth in thelastseveral decades suggesting increasing fishing pressure in multiple continental shelf zones, depths, <strong>and</strong>geartypes.114 GHANA CLIMATE CHANGE VULNERABILITY AND ADAPTATION ASSESSMENT
CategoryFishing effort <strong>and</strong>technology <strong>change</strong>sSymptoms, sensitivities, <strong>and</strong> vulnerabilitiesKey catch statistics are lacking to quantify effort expended (e.g., effort among fleets, time spent fishing,net size <strong>and</strong> mesh differences <strong>and</strong> other gear differences, catch <strong>and</strong> effort often underreported,fabricated).Rapid sustained expansion in last few decades of canoe, semi-industrial (inshore), <strong>and</strong> industrial fleetscoincide with drops in catch (Fig. 6.5).Semi-industrial fleet experiencing declines in catch per unit effort.Fishing effort <strong>and</strong> fishing pressure exp<strong>and</strong>ed enormously due to: no registration or limits to access (canoe fleet) extremely low self-reporting of industrial fleet of catch <strong>and</strong> effort provides strong indication ofsubstantial under-reporting of catches outboard motors (continued increase in power <strong>and</strong> exp<strong>and</strong>ed adoption allow canoe fishers tomove farther along shore <strong>and</strong> offshore which combined with fisher reports of having to makelonger trips to catch fish, suggests serial depletion of fisheries) (Fig. 6.5).light fishing (opened up pelagic fish exploitation near year round) <strong>and</strong> rapidly adopted by semiindustrial<strong>and</strong> more recently canoe fleet (Fig. 6.8).low maintenance, longer lasting netting allows more time fishing, increasing pressure per fisherlonger nets, more nets, <strong>and</strong> smaller mesh size per fisher increase fishing effort <strong>and</strong> pressuretremendously, but the effects on <strong>and</strong> trends in catch remain unquantifiedpair trawling (illegal but apparently still commonly practiced)transshipment <strong>and</strong> trade of by-catch (so called ‘trash fish’, small, low valued or damaged fishes)from industrial trawlers to canoe fishers encouraging near shore trawling <strong>and</strong> use of small meshsize, both increasing pressure on already highly pressured fisheries.use of poisons <strong>and</strong> explosives as a non-selective fishing techniqueSources: compiled from Koranteng <strong>and</strong> McGlade, 2001; Koranteng <strong>and</strong> Pauly, 2004; Perry <strong>and</strong> Suamaila, 2007; Wiafe et al., 2008;Finegold et al., 2010 <strong>and</strong> references therein.LAKE VOLTA FISHERYThe Volta River is one of West Africa's largest rivers, draining an area of 390,000 km 2 (Petr 1986). It is fed by theBlack Volta, the White Volta, the Red Volta, <strong>and</strong> the Oti rivers. The Volta Basin covers parts of six countries:small portions are in Mali (4.8 percent), Cote d’Ivoire (3.2 percent), Togo (6.4 percent), <strong>and</strong> Benin (3.6 percent),<strong>and</strong> the majority of the basin lies in Burkina Faso (42 percent) <strong>and</strong> Ghana (40.2 percent) (Taylor et al., 2006).Lake Volta, an impoundment on the Volta River covering 8,700 km 2 at maximum pool, extends some 400 kminl<strong>and</strong> from Okosombo dam in the southern Eastern Region. The reservoir extends from the dam north into theVolta, Brong Ashafo, <strong>and</strong> Northern Regions. Not surprisingly, this large impoundment provides a largefreshwater fishery. This lake reportedly produces about 98 percent of the inl<strong>and</strong> freshwater fish in Ghana(Braimah, 2001; Andah <strong>and</strong> Gichuki, 2005; Lemoalle <strong>and</strong> Condappa, 2009), but apparently little to no accountingis made for fishes harvested from flowing rivers <strong>and</strong> streams in most of Ghana. In tonnage, Volta Lake reportedlyproduced about 87,500 tonnes of fish in 2000, but annual catch statistics are contradictory ranging from 40,000 to250,000 tonnes/year depending on the author (Lemoalle <strong>and</strong> Condappa, 2009). An estimated 1,232 fishingvillages <strong>and</strong> 79,900 fishers were estimated in 1998 to be scattered along the 4,300 km shoreline. Fishers used atleast 11 gear types to fish, ranging from widespread use of nets (especially gill nets, cast nets, <strong>and</strong> beach seines) totraps, hook <strong>and</strong> line, <strong>and</strong> to a small extent spears. Fishing vessels consisted of an estimated 24,035 plank canoesmost of which are open <strong>and</strong> non-motorized but a small percentage (
The potential impacts of increased temperatures or <strong>change</strong>s in rainfall as a result of <strong>climate</strong> <strong>change</strong> are at thispoint unpredictable for Lake Volta or any other inl<strong>and</strong> fisheries in Ghana. Little up-to-date, quantitative data isapparently available for this important fishery although as noted, some sources indicate the fishery is declining orat risk of decline under current fishing pressure. Continued warming as predicted by current trends <strong>and</strong> <strong>climate</strong>model projections could, for example, affect primary <strong>and</strong> secondary productivity in feeder rivers <strong>and</strong> the reservoir,changing the seasonality, quality, <strong>and</strong> quantity of the food source of fishes in unknown ways. Warming wouldlikely also affect rates of egg development, fish metabolism <strong>and</strong> growth, <strong>and</strong> ultimately recruitment, <strong>and</strong> perhapseven the timing of reproduction of Lake Volta fishes. Similarly, future <strong>climate</strong> scenarios resulting in dramaticallydecreased or increased river flows (Kasei, 2009, see Desertification section) would also likely affect the fishery butin less easily conceptualized ways. For example, in the case of reduced flow, lower water levels in Lake Volta <strong>and</strong>tributaries would reduce the area of shallow, shoreline habitat. In turn, loss of the vegetated shoreline-lakeinterface would affect fishes using such habitats for feeding, spawning, or nursery areas. Depending on timing <strong>and</strong>variability, higher flows could <strong>change</strong> seasonal turbidity (<strong>and</strong> perhaps primary <strong>and</strong> secondary productivity) <strong>and</strong>dilute food resources, resulting in largely unpredictable <strong>change</strong>s on larvae, juveniles, <strong>and</strong> adult fishes. Clearly, thecurrent state of the inl<strong>and</strong> fishery resource in Ghana deserves further scientific attention as does the potentialimpacts <strong>climate</strong> <strong>change</strong> might have on this resource.CLIMATE CHANGE AND THE MARINE FISHERYThe most prominent effect of <strong>climate</strong> <strong>change</strong> on marine productivity <strong>and</strong> ultimately the fishery could be increasedsea temperatures, even though the primary proximate driver of productivity, the upwelling system, is admittedlycomplex <strong>and</strong> certainly not totally understood (Wiafe et al., 2008). Changes in sea temperature could affect primary(phytoplankton) <strong>and</strong> secondary (zooplankton) production which in turn could dramatically increase or decreasethe abundance of pelagic fishes <strong>and</strong> their predators.Historical trend analyses of sea temperature in the Gulf of Guinea tend to show increasing trends in sea-surfacetemperatures for the period of record in the late 20 th century. Simple regression of annual mean data from about1960-2001 indicated generally low interannual variability <strong>and</strong> an increased trend, albeit non-significant, in seasurfacetemperature (Dontwi et al., 2008). Another more detailed analysis (covering through 1992) showed: anoverall increase in offshore sea-surface temperature from 1946-1990 with some evidence of short-lived, cyclical,decadal decreases; consistently increasing temperatures during the second warm (or low) season between 1975-1992, generally increasing sub-surface temperature (100 m depth) from 1969-1992, increasing sea-surface <strong>and</strong> subsurfacetemperatures during the second warm or low season, generally reduced temperatures during the minorupwelling period (i.e., the upwelling was intensified), <strong>and</strong> slight increases in temperatures during the main warm orlow season (i.e., intensification of warming).The period 1963-1992 could be divided into three distinct periods: an unsettled period from 1963-1974; a “cold”period from 1975-1980; <strong>and</strong> a “warm” period from 1981-1992. These periods apparently influenced the dynamicsof the pelagic fishery resources with significant <strong>change</strong>s in the distribution <strong>and</strong> abundance of species coincidingwith climatic periods (Koranteng <strong>and</strong> McGlade, 2001). Notably, another detailed analysis of seasonal trends overa 24-year period (1968-1992) showed the annual cyclical nature of temperature <strong>and</strong> zooplankton productivity butalso revealed gradual increases in sea-surface temperature for the major upwelling <strong>and</strong> second warm or low season(second thermocline) periods (Waife et al., 2008). Notably, these upward trends in sea-surface temperature wereassociated with significant decreasing trends in zooplankton biomass. Although other factors certainly influencedbiomass of zooplankton (e.g., biomass of <strong>and</strong> predation by sardinella larvae), increased sea-surface temperaturesaccounted for >50 percent of the variation in zooplankton biomass (Waife et al., 2008). Notably, futureprojections of sea-surface temperature from Global Climate Models estimate a 0.4, 1.4, <strong>and</strong> 2.7°C increase in seasurfacetemperature in coastal waters of Ghana by 2020, 2050, <strong>and</strong> 2080, respectively (Minia, 2008).The most abundant pelagic species in the upwelling region of the Gulf of Guinea all are zooplankton dependentat early life stages <strong>and</strong> some are zooplankton dependent as adults (i.e., round sardinella, Sardinella aurita; Madeiransardinella, S. maderensis; European anchovy’ (Engraulis encrasicolus; in some years, chub mackerel, Scomber japonicas;Mensah <strong>and</strong> Koranteng, 1988; Koranteng, 1995). Plankton abundance, providing forage for juvenile or adult fish,may be more important for sustaining stock biomass of some species than spawning success <strong>and</strong> larval survival116 GHANA CLIMATE CHANGE VULNERABILITY AND ADAPTATION ASSESSMENT
(Binet, 1995). Even if the declining zooplankton biomass is adequate for survival of the main fishery stocks(Mensah, 1995), a month’s lag exists between the peaks of sardinella larval abundance <strong>and</strong> total zooplanktonbiomass, suggesting, not surprisingly, a temporal matching between predators <strong>and</strong> peak larval food. As such, apotential exists for <strong>climate</strong> <strong>change</strong> to cause a mismatch between larval pelagic fish abundance <strong>and</strong> their food,which could compromise recruitment. Significant decline in zooplankton biomass occurred from the late 1960s tothe early 1990s, a decline attributed to the trend in global warming (Wiafe et al., 2008). Although biological (top–down) control was also important, no long-term trend in the abundance of the predatory fish larvae was detected.The zooplankton time-series analysis at the biomass level combined with the knowledge of the biology <strong>and</strong>distribution of the dominant species during the major upwelling (i.e., the copepod, Calanoides carinatus) indicatedthe current trend in warming of the ocean, especially during the major upwelling, could shift zooplanktoncommunity abundance <strong>and</strong> structure <strong>and</strong> impact fishery resources (Wiafe et al., 2008).GHANA CLIMATE CHANGE VULNERABILITY AND ADAPTATION ASSESSMENT 117
7. SOCIAL VULNERABILITY TOCLIMATE CHANGE IN GHANADEFINING AND ASSESSING SOCIAL VULNERABILITY TO CLIMATECHANGENew definitions of <strong>climate</strong> <strong>change</strong> <strong>vulnerability</strong> are constantly evolving (Kelly <strong>and</strong> Adger, 2000; O’Brien et al.,2004). In the context of <strong>climate</strong> <strong>change</strong>, definitions of <strong>vulnerability</strong> typically fall into two camps. The moretraditional definitions assess <strong>vulnerability</strong> from what Kelly <strong>and</strong> Adger (2000) deem “the end point of a sequence ofanalyses.” An end point analysis would determine the level of <strong>vulnerability</strong> by summarizing the net impact ofproblems associated with <strong>climate</strong> <strong>change</strong>. The second school considers <strong>vulnerability</strong> as “a starting point foranalyses… Here, <strong>vulnerability</strong> is considered a characteristic of social <strong>and</strong> ecological systems that is generated bymultiple factors <strong>and</strong> processes.” (O’Brien et al., 2004a). Kelly <strong>and</strong> Adger (2000) take this definition further,defining <strong>vulnerability</strong> “in terms of the ability or inability of individuals <strong>and</strong> social groupings to respond to, in thesense of cope with, recover from or adapt to, any external stress placed on their livelihoods <strong>and</strong> well being.”Critical to the starting-point definition of <strong>vulnerability</strong> is the underst<strong>and</strong>ing that it is dynamic <strong>and</strong> in a continuousstate of flux, as the biophysical <strong>and</strong> social processes that shape people’s ability to cope with external stress <strong>change</strong>over time <strong>and</strong> across space (O’Brien et al., 2004a).For purposes of this <strong>assessment</strong>, we adopt a “starting point” definition of social <strong>vulnerability</strong> to <strong>climate</strong> <strong>change</strong>,adhering to the Kelly <strong>and</strong> Adger (2000) definition of social <strong>vulnerability</strong>. We treat <strong>vulnerability</strong> as a measurablecharacteristic present within a population, <strong>and</strong> influenced by multiple socioeconomic <strong>and</strong> biophysical factors. Our<strong>assessment</strong> approach includes four main steps. First, we identified variables that contribute to social <strong>vulnerability</strong>to <strong>climate</strong> <strong>change</strong>, on the basis of the academic literature. Second, we selected socioeconomic indicators thatserved as proxies for evaluating these variables at the district level in Ghana. Third, we scaled the index values<strong>and</strong> combined them into an index to measure overall social <strong>vulnerability</strong> to <strong>climate</strong> <strong>change</strong> at the district level.Finally, using GIS we mapped the values generated by the index (high values correspond with high <strong>vulnerability</strong>)across districts. (Please see the methods section for a more detailed explanation of this process.) The scaled,mapped index values can be used to compare social <strong>vulnerability</strong> to <strong>climate</strong> <strong>change</strong> across districts in Ghana, <strong>and</strong>to facilitate analysis of social <strong>vulnerability</strong> in relation to ecological zone, <strong>climate</strong>, <strong>and</strong> natural resource <strong>vulnerability</strong>to <strong>climate</strong> <strong>change</strong>.Social <strong>vulnerability</strong> varies by spatial scale: among members of a household, between households in a community,from community to community, <strong>and</strong> between districts <strong>and</strong> administrative regions. Given the need to provide anationwide <strong>assessment</strong>, our objective was to characterize <strong>vulnerability</strong> at the smallest scale practicable usingexisting data sets. Thus, the purpose of this <strong>assessment</strong> is to help identify <strong>vulnerability</strong> “hot spots” within Ghanathat may deserve attention when making decisions about where <strong>and</strong> how to implement development interventions(such as improving food security) to help people <strong>and</strong> communities build their adaptive capacity <strong>and</strong> increase theirresilience to <strong>climate</strong> <strong>change</strong> <strong>and</strong> its impacts. These are places where more fine-scaled analysis is called for toreveal actual vulnerabilities <strong>and</strong> strategies to address them. It is important to note that <strong>vulnerability</strong> is a relativeterm. The districts ranking lower on our <strong>vulnerability</strong> scale are not necessarily invulnerable to <strong>climate</strong> <strong>change</strong>; <strong>and</strong>some individuals, households, <strong>and</strong> communities within these less vulnerable districts may be as vulnerable to<strong>climate</strong> <strong>change</strong> as those in the high <strong>vulnerability</strong> districts.118 GHANA CLIMATE CHANGE VULNERABILITY AND ADAPTATION ASSESSMENT
METHODSAs described above, to assess social <strong>vulnerability</strong> to <strong>climate</strong> <strong>change</strong> in Ghana, we developed a <strong>vulnerability</strong> indexbased on socioeconomic variables that were identified through a review of the <strong>climate</strong> <strong>change</strong> social <strong>vulnerability</strong>literature. We then selected indicators capable of serving as proxies for those variables for which we could obtaindistrict-level data from existing sources. Our decision to focus on the administrative district limited our choice ofindicators. The 11 indicators we used to construct the index are presented in Table 7.1, along with our rationalefor choosing them <strong>and</strong> the sources from which we obtained the data.To construct the social <strong>vulnerability</strong> index we first compiled data for the 11 indicators selected to serve as proxymeasurements of social <strong>vulnerability</strong> to <strong>climate</strong> <strong>change</strong>. We then analyzed the data for each individual indicatorusing a variety of methods in ArcGIS, <strong>and</strong> chose the “natural breaks” classification method. Natural breaks(Jenks method) is a classification method that uses a statistical approach to group values into a pre-determinednumber of classes in a manner that minimizes variance within each class, <strong>and</strong> maximizes variance between classes,resulting in “natural breaks” in the dataset that are based on the data’s distribution. We chose to create 10 classesfor our data in order to examine differences between districts at a more refined level than fewer classes wouldallow, but that would still be visually discernable when mapped. (Note, due to the natural breaks approach, eachclass does not have an equal number of districts, nor is the range of values within each class set at consistentintervals, as indicated in the map legends.) After sorting the data for an indicator into 10 classes, we assigned eachdistrict a score for that indicator (from 1 to 10), depending on which class it fell into. One signified the lowest<strong>vulnerability</strong> class, <strong>and</strong> 10, the highest. Because we used 11 indicators in our <strong>vulnerability</strong> index, each districtultimately received 11 different scores, one for each indicator.To combine the individual indicator values for purposes of creating one <strong>vulnerability</strong> index value for each district,we summed the 11 indicator scores for each district. Indicators were equally weighted because there is noevidence in the literature to suggest that any one indicator is more or less significant than another in influencingsocial <strong>vulnerability</strong> to <strong>climate</strong> <strong>change</strong>. Thus, the highest possible <strong>vulnerability</strong> score a district could receive was110, <strong>and</strong> the lowest, 11. Finally, the index values were mapped, using ArcGIS software, into five <strong>vulnerability</strong>categories <strong>and</strong> 10 <strong>vulnerability</strong> categories, for comparison, based on their total scores <strong>and</strong> using the natural breaksmethod. The actual overall district <strong>vulnerability</strong> scores ranged from 25 to 93.A number of factors limit our <strong>assessment</strong>. First, we used data from only one time period – the most recent forwhich data were available – rather than looking at temporal trends in the indicators. The lack of long-term,historical data at the district level for Ghana, combined with widespread <strong>change</strong>s in district boundaries over time,necessitated this approach. Second, the data we used are not recent; many of them come from Ghana’s 2000Population <strong>and</strong> Housing Census. Although Ghana conducted another population <strong>and</strong> housing census in 2010,initial results will not be released at the district level until 2012 (GoG, 2011). Because of this, our data pertain tothe 110 districts that existed prior to 2006. Today, Ghana has 170 districts; we have not attempted to overlaycurrent district boundaries on the 110 for which we have data because maps depicting newly created districts arenot readily available. Another limitation was our inability to capture some components of social <strong>vulnerability</strong> to<strong>climate</strong> <strong>change</strong> with a proxy measure that best suited that component, or with any measure at all. For example,the literature suggests that health as a <strong>vulnerability</strong> indicator is best measured through life expectancy. However,life expectancy data were not easily accessible at a district level in Ghana; instead, we used childhood malnutrition.Moreover, we were unable to obtain any proxy measures for variables such as political involvement, socialnetworks, <strong>and</strong> governance – all of which can play an important role in determining <strong>vulnerability</strong> to <strong>climate</strong><strong>change</strong>. Despite these limitations, we believe that our index is useful for drawing attention to districts of Ghanathat are likely to have high social <strong>vulnerability</strong> in the context of <strong>climate</strong> <strong>change</strong>.GHANA CLIMATE CHANGE VULNERABILITY AND ADAPTATION ASSESSMENT 119
Indicator DescriptionAbility to survivecrisisThe percentage of totalhouseholds within adistrict that felt either“somewhat” or “very”insecure about theirability to withst<strong>and</strong> anycrisisAgriculturalemploymentThe percentage of thedistrict’s total population> 15 years of age that isengaged in agriculturerelatedemployment(including hunting <strong>and</strong>forestry relatedactivities).DependentpopulationThe percentage of adistrict’s total populationthat is < 15 <strong>and</strong> > 65years of ageTable 7.1 Social Vulnerability Indicators Included in the IndexData source <strong>and</strong>yearGhana 2003 CoreWelfare IndicatorsQuestionnaire SurveyReport: StatisticalAbstract, GhanaStatistical Service(hereafter, CWIQ II)2000 Population <strong>and</strong>Housing Census,Analysis of DistrictData <strong>and</strong> Implicationsfor Planning, GhanaStatistical Service(hereafter 2000Census)Impact on<strong>vulnerability</strong>High percentageincreases<strong>vulnerability</strong>High percentageincreases<strong>vulnerability</strong>CWIQ II High percentageincreases<strong>vulnerability</strong>Relevance for <strong>climate</strong> <strong>change</strong> social<strong>vulnerability</strong>Households that already feel insecure about theirability to withst<strong>and</strong> even a short-term crisis arelikely to be equally unable to weather long-termthreats to their livelihoods, or have enough extracapital to invest in necessary <strong>adaptation</strong> measures.Agriculture is an especially <strong>climate</strong>-sensitiveeconomic activity. Agricultural employment is likelyto underestimate the extent to which a districtdepends on agriculture. However the higher theagricultural employment, the more a district will beimpacted by disruptions in production due tochanging environmental conditions. Reducedproduction will cause a similar reduction indisposable income. High agricultural employmentalso suggests a lack of other employment options,<strong>and</strong> therefore few opportunities for failing farmersto earn additional income through other economicpursuits (O’Brien et al., 2004b). People are morelikely to fail to secure their needs in a time of crisiswhen they are restricted to a single sector foremployment (Eriksen et al., 2007).Individuals 65 years of age depend onfamily members or social services for financialsupport. A district with a higher dependentpopulation is forced to stretch resources further;households must juggle work responsibilities withcare for dependents, threatening the household’sability to withst<strong>and</strong> disaster. Individuals who dependon social services for survival are often elderly,economically <strong>and</strong> socially marginalized, <strong>and</strong> requireadditional support in a post- disaster period (USC,2000).Other studies usingthis (or somethingsimilar) as anindicator of <strong>climate</strong><strong>change</strong> social<strong>vulnerability</strong>Brooks et al., 2005Eriksen et al., 2007Social Vulnerability forEnvironmentalHazards, 2000 (USC)Brooks et al., 2005O’Brien et al., 2004aEriksen et al., 2007Adger et al., 2004Social Vulnerability forEnvironmentalHazards, 2000 (USC)Brooks et al., 2005Eriksen et al., 2007GHANA CLIMATE CHANGE VULNERABILITY AND ADAPTATION ASSESSMENT 120
Indicator DescriptionDistance fromdrinking waterThe percentage of totalhouseholds within adistrict that travel ≥30minutes for drinkingwaterDistance fromfood marketThe percentage of totalhouseholds within adistrict that travel ≥30minutes to reach a foodmarketFemale-headedhouseholdsThe percentage of totalhouseholds within adistrict that are headedby a femaleIlliteracy The percentage of thedistrict’s total population> 15 years of age that isilliterate. Illiteracy isdefined as the inability toData source <strong>and</strong>yearImpact on<strong>vulnerability</strong>CWIQ II High percentageincreases<strong>vulnerability</strong>CWIQ II High percentageincreases<strong>vulnerability</strong>CWIQ II High percentageincreases<strong>vulnerability</strong>2000 Census High percentageincreases<strong>vulnerability</strong>Relevance for <strong>climate</strong> <strong>change</strong> social<strong>vulnerability</strong>The non-availability of clean water is indicative ofpoor overall physical infrastructure <strong>and</strong> poorsanitation (Adger et al., 2004). Additionally,households forced to travel ≥30 minutes to fetchwater are also severely constrained by the timecommitment <strong>and</strong> less likely to have extra time to puttowards <strong>adaptation</strong> activities that might strengthentheir well being in times of crisis. Climate-induced<strong>change</strong> in water availability may cause households totravel even farther for drinking water, increasinghousehold stress.Households that must travel ≥30 minutes to reach afood market are much more isolated <strong>and</strong> likely morevulnerable. Limited access to commercialinfrastructure limits opportunities to sell excessproduce or livestock or engage in otherentrepreneurial activities in times of crisis (Adger etal., 2004). Isolation also makes it difficult for aiddistribution programs to provide relief in responseto disasters like droughts, floods or famines. Lessconnection to outside villages indicates a smallerdomestic social support network for families to fallback on in times of need.Households headed by females often have a moredifficult time recovering from environmentaldisasters due to employment limitations, lowerwages, <strong>and</strong> family care responsibilities (USC, 2000;Eriksen et al., 2007). In Ghana, women depend moreon agricultural work <strong>and</strong> have limited access tocapital <strong>and</strong> property, making it increasingly difficultfor female headed households to diversify in the faceof needed <strong>adaptation</strong> or otherwise compete forresources.Education is associated with poverty <strong>and</strong>marginalization – the least educated <strong>and</strong> lowerskilled members of a society are likely to be themost vulnerable to <strong>climate</strong> hazards in terms oflivelihoods <strong>and</strong> geographical location, dependingOther studies usingthis (or somethingsimilar) as anindicator of <strong>climate</strong><strong>change</strong> social<strong>vulnerability</strong>Global EnvironmentalRisk, 2001Brooks et al., 2005Haan et al., 2001Adger et al., 2004Global EnvironmentalRisk, 2001Brooks et al., 2005Haan et al., 2001Eriksen et al., 2007Adger et al., 2004Social Vulnerability forEnvironmentalHazards, 2000 (USC)Global EnvironmentalRisk, 2001Brooks et al., 2005Haan et al., 2001Eriksen et al., 2007Social Vulnerability forEnvironmentalHazards, 2000 (USC)HISGHANA CLIMATE CHANGE VULNERABILITY AND ADAPTATION ASSESSMENT 121
Indicator DescriptionData source <strong>and</strong>yearImpact on<strong>vulnerability</strong>read or write in English,any Ghanaian language,or any foreign language.MalnourishedchildrenThe percentage of all 0-59 month old children,within a district, that areconsidered underweightfor their age. Childrenare consideredunderweight if theirweight is more than twost<strong>and</strong>ard deviationsbelow the United StatesNational Center forHealth Statistics’st<strong>and</strong>ard weight for age.CWIQ II High percentageincreases<strong>vulnerability</strong>PovertyPerceptionThe percentage of totalhouseholds within adistrict that self identifiedas either “poor” or “verypoor”CWIQ II High percentageincreases<strong>vulnerability</strong>Road Accessibility The percentage ofhouseholds within adistrict that can accesstheir homes by roadthroughout the yearCWIQ II High percentagedecreases<strong>vulnerability</strong>122 GHANA CLIMATE CHANGE VULNERABILITY AND ADAPTATION ASSESSMENTRelevance for <strong>climate</strong> <strong>change</strong> social<strong>vulnerability</strong>more on <strong>climate</strong>-sensitive forms of employment (likeagriculture <strong>and</strong> fishing). They are also less likely tohave a political voice <strong>and</strong> their welfare may be a lowpriority on a national level (Adger et al., 2004)Illiteracy serves as a barrier to facilitatingunderst<strong>and</strong>ing of the complex nature of hazards <strong>and</strong>appropriate responses to them (Brooks et al., 2005).People in poor health, <strong>and</strong> those who areundernourished, will be more vulnerable to theimmediate <strong>and</strong> secondary impacts of extremeevents, whether this takes the form of directphysical injury or a more complex impact such asfood shortage or famine. A population in poorgeneral health is less likely to be prepared for adisaster, <strong>and</strong> less likely to be able to cope with theimpacts of a disaster in the short term. Familiescaring for sick or malnourished members have lesstime, money, <strong>and</strong> energy to invest in activities thatmight mitigate the impacts of external hazards,recover from hazard events, or prepare for thefuture (Adger et al., 2004).Poor people often lack the education, skills, financialresources, <strong>and</strong> networks that are increasinglynecessary to procure income or diversify away froma failing livelihood (Eriksen et al., 2007). Poorcommunities often face greater levels of risk thanmore affluent populations (United Nations, 2001).Poor people are more likely to live in hazard-pronelocations, but will be less likely to invest in<strong>adaptation</strong> measures as they have more immediatepriorities (Adger et al., 2004).The existence of a reliable transportation network,year round, increases the ability of rural populationsto access markets to sell excess produce orlivestock or engage in other entrepreneurialactivities in times of crisis (Adger et al.,2004). Awell-developed transportation system also enables amore efficient system of aid delivery <strong>and</strong> increasesOther studies usingthis (or somethingsimilar) as anindicator of <strong>climate</strong><strong>change</strong> social<strong>vulnerability</strong>Brooks et al., 2005Haan et al., 2001O’Brien et al., 2005Eriksen et al., 2007Brooks et al., 2005Eriksen et al., 2007Haan et al., 2001Adger et al., 2004Global EnvironmentalRisk, 2001Brooks et al., 2005Eriksen et al., 2007Brooks 2003Adger et al., 2004Global EnvironmentalRisk, 2001Brooks et al. 2005Haan et al., 2001Eriksen et al. 2007Adger et al. 2004
Indicator DescriptionUnimproveddrinking watersourceThe percentage of totalhouseholds within adistrict that depend onunimproved sources fortheir drinking water.Unimproved sourcesinclude rainwater, rivers,lakes, ponds, <strong>and</strong>unprotected wells.Data source <strong>and</strong>yearImpact on<strong>vulnerability</strong>CWIQ II High percentageincreases<strong>vulnerability</strong>Relevance for <strong>climate</strong> <strong>change</strong> social<strong>vulnerability</strong>the ability of communities to participate in policy.Lack of access at any time during the year increases<strong>vulnerability</strong> by further isolating remote settlements<strong>and</strong> limiting the extent to which social networks <strong>and</strong>structures can make a meaningful difference in termsof contributing to <strong>adaptation</strong> <strong>and</strong> reducing<strong>vulnerability</strong>.Districts with better infrastructure are expected tohave a higher capacity to adapt to <strong>climate</strong>fluctuations <strong>and</strong> other economic shocks (O’Brien etal., 2004). Households that rely on rainfall or waterbodies for drinking water have fewer <strong>adaptation</strong>options if those sources are negatively impacted by<strong>climate</strong> <strong>change</strong>. Further, unimproved water sourcespresent greater health risks.Other studies usingthis (or somethingsimilar) as anindicator of <strong>climate</strong><strong>change</strong> social<strong>vulnerability</strong>Global EnvironmentalRisk, 2001Brooks et al. 2005Haan et al., 2001O’Brien et al. 2004GHANA CLIMATE CHANGE VULNERABILITY AND ADAPTATION ASSESSMENT 123
RESULTS AND DISCUSSIONThe final section of this social <strong>vulnerability</strong> analysis contains a reference map <strong>and</strong> tables that can be used toidentify individual Ghana districts. It also contains a map for each of the 11 indicators used in the social<strong>vulnerability</strong> index that shows data pertaining to that indicator for each district.Figure 7.1 Social Vulnerability to Climate Change in Ghana, by District(Based on the 110 district boundaries in place prior to 2006)The districts of Ghana that have the highest overall social <strong>vulnerability</strong> to <strong>climate</strong> <strong>change</strong> areconcentrated in the Upper West, Upper East, <strong>and</strong> Northern Regions (Figure 7.1). Within these threeregions, the districts having the lowest <strong>vulnerability</strong> scores are those containing the regional capitals,making them the more urban districts: Wa, Bolgatanga, <strong>and</strong> Tamale, respectively. Tamale District has the124 GHANA CLIMATE CHANGE VULNERABILITY AND ADAPTATION ASSESSMENT
lowest <strong>vulnerability</strong> of any district in the three northern regions, which is not surprising, considering thatTamale is the largest city in northern Ghana. Nevertheless, this district exhibits medium <strong>vulnerability</strong> relativeto the rest of the country. Other districts exhibiting high social <strong>vulnerability</strong> to <strong>climate</strong> <strong>change</strong> are located innorthern Volta Region <strong>and</strong> eastern Brong-Ahafo, most of them bordering the Northern Region. Thesouthern-most part of Volta Region also has high social <strong>vulnerability</strong> to <strong>climate</strong> <strong>change</strong>. As a whole, VoltaRegion had the fourth highest overall social <strong>vulnerability</strong> to <strong>climate</strong> <strong>change</strong>. The vast majority of Ghanadistricts having high social <strong>vulnerability</strong> to <strong>climate</strong> <strong>change</strong> lie in the Sudan <strong>and</strong> Guinea Savanna ecologicalzones, with the remainder clustered in the Forest-Savanna Transition zone.Figure 7.2 Social Vulnerability to Climate Change in Ghana, by Ecological ZoneGHANA CLIMATE CHANGE VULNERABILITY AND ADAPTATION ASSESSMENT 125
Examination of the average district scores for each indicator in the index sheds light on why the Northern,Upper East, <strong>and</strong> Upper West Regions scored highest in overall social <strong>vulnerability</strong> (Table 7.2). Infrastructurerelatedindicators (road access, distance from drinking water, <strong>and</strong> distance from a food market) st<strong>and</strong> out asinfluential. Extremely high rates of illiteracy are also found in these regions. And, they exhibit the highestdependency on agricultural employment. Finally, perceived poverty is substantially higher in the northernregions. Interestingly, these three regions exhibit the lowest percentages of female-headed households inGhana, making them less vulnerable to <strong>climate</strong> <strong>change</strong> from this st<strong>and</strong>point.Two other socioeconomic indicators that are important in considering social <strong>vulnerability</strong> to <strong>climate</strong> <strong>change</strong>are population growth <strong>and</strong> poverty. Population growth increases pressure on natural resources, exacerbatingthe negative effects of <strong>climate</strong> <strong>change</strong>. Poverty makes households more vulnerable to <strong>climate</strong> <strong>change</strong> becausepoor households generally have fewer options <strong>and</strong> less capacity for <strong>adaptation</strong>. We were unable to obtaindata for these variables at the district level for purposes of this analysis. However, regional-level data make itpossible to examine population growth <strong>and</strong> poverty in the regions most socially vulnerable to <strong>climate</strong> <strong>change</strong>.Population growth rates for each region were provided in Chapter 5, Section C (Population <strong>and</strong> Economy).Here we focus on <strong>change</strong>s in regional population density (Table 7.3). Population density in the Upper East<strong>and</strong> Upper West regions of Ghana more than doubled between 1960 <strong>and</strong> 2010, <strong>and</strong> more than quadrupled inthe Northern Region. Although the increase in population density in Upper East <strong>and</strong> Upper West was belowthe national average for this same time period, population density in the Upper East Region in 2010 (117persons/km 2 ) was above the national average (102 persons/km 2 ), <strong>and</strong> more than three times higher than inthe other two northern regions. This is surprising, considering the Upper East Region lies in the SudanSavanna, which is drier <strong>and</strong> more marginal for agriculture than the Guinea Savanna. High population densityin the Upper East Region may be a partial reflection of immigration by migrant herders from the northduring the 20 th century, but also reflects other more complex historical factors (e.g., military strength <strong>and</strong>stability, lack of slave raids, hosting refugees from neighboring tribes [Dickson <strong>and</strong> Benneh, 1988]). Annualpopulation growth in the Northern Region between 2000 <strong>and</strong> 2010 was 3.1 percent, well above the nationalaverage of 2.5 percent. Nevertheless, this region had the lowest population density of any in Ghana in 2010.Population growth rates in Upper East <strong>and</strong> Upper West were 1.1 percent <strong>and</strong> 1.6 percent, respectively,suggesting out-migration to regions farther south. These findings indicate that all three northern regions areexperiencing increases in population pressure – particularly the Northern Region – an additional challenge for<strong>climate</strong> <strong>change</strong> <strong>adaptation</strong> in these regions that have a high dependence on agricultural employment.Regarding poverty, over the past two decades, rural areas in the Guinea <strong>and</strong> Sudan savanna ecological zonesin northern Ghana have consistently exhibited the highest incidence of poverty in the country (Table 7.4).The most recent data (2005-06) show that poverty incidence in the rural savanna is more than double that ofany other ecological zone; 60.1 percent of all households were living below the poverty line. At the scale ofadministrative regions, the Upper West Region has the highest poverty, with 88 percent of households livingbelow the national poverty line in 2005-06 – three times the national average (Table 7.5). It was closelyfollowed by Upper East, at 70 percent. The Northern Region exhibits the next highest poverty incidence inGhana, at 52 percent. Although overall poverty in Ghana has steadily declined since the early 1990s, this wasnot the case in the Upper West or Upper East Regions.126 GHANA CLIMATE CHANGE VULNERABILITY AND ADAPTATION ASSESSMENT
Table 7.2 Social Vulnerability Index <strong>and</strong> Individual Indicator Scores, by Region, Based on District AveragesIndexValueDependentpopulationregional averagerange of district level scoresDistancefromdrinkingwaterDistancefromfoodmarketFemaleheadedhouseholdsUnimproved drinkingwatersourceMalnourished childrenPovertyPerceptionAbility tosurvivecrisisIlliteracyAgriculturalemploymentAshanti 55 6.7 2.2 4.1 6.8 4 6.9 5.2 4.4 4.2 5.9 4.633-75 2-10 1-4 1-10 4-10 1-8 1-10 1-9 1-9 1-7 1-10 2-9Brong Ahafo 61.0 5.8 4.8 5.1 6.8 5.5 4.3 5.7 5.3 4.8 6.7 6.236-87 2-10 2-9 1-10 2-10 1-9 1-9 1-9 1-9 2-8 3-9 2-10Central 48.1 5.8 2.8 2.8 7.4 3.0 5.1 4.4 4.4 4.7 4.4 3.329-62 2-10 1-6 1-7 4-10 1-5 1-8 1-7 1-8 1-7 1-7 1-7Eastern 56.5 5.6 4.1 4.6 6.5 5.2 5.5 5.3 7.1 3.3GreaterAccraRoadAccess4.5 4.825-75 2-9 1-8 1-10 3-9 2-9 1-10 1-9 4-10 1-7 1-8 1-941.8 1.8 3.6 5.0 6.4 2.2 6.8 3.8 4.2 3.0 1.6 3.429-61 1-3 1-7 1-10 5-8 1-4 3-10 2-7 2-6 1-6 1-3 2-6Northern 76.6 7.4 7.6 8.4 1.1 7.7 6.9 7.7 5.5 9.5 8.2 6.752-93 2-10 3-10 6-10 1-2 4-10 1-9 4-10 1-10 7-10 2-10 2-9Upper East 71.8 5.5 5.8 9.5 2.8 4.2 4.5 8.7 7.0 8.7 7.2 8.061-81 3-9 3-8 8-10 1-7 3-6 2-7 8-10 3-10 8-10 4-10 5-10Upper West 70.4 7.6 6.8 9.0 3.0 2.2 6.0 9.0 4.2 8.6 7.8 6.261-77 6-10 3-8 8-10 2-5 1-3 1-9 8-10 2-6 8-9 6-10 3-10Volta 65.6 5.6 6.0 6.3 6.8 7.5 5.3 6.0 6.8 4.5 4.8 5.939-83 2-10 3-8 3-9 2-10 4-10 2-9 2-10 1-10 1-8 2-9 1-9Western 51.1 3.6 2.9 4.6 4.7 5.8 5.1 3.7 3.7 4.9 6.0 5.931-71 2-6 1-6 1-9 3-7 2-9 1-9 2-7 1-7 2-7 1-10 1-10GHANA CLIMATE CHANGE VULNERABILITY AND ADAPTATION ASSESSMENT 127
Region Area (km 2 )Table 7.3 Population Density, 1960-2010, by RegionPopulation(2010)Population density (per km 2 )1960 1970 1984 2000 2010Western 23,921 2,325,597 26 32 48 81 97Central 9,826 2,107,209 76 91 116 162 214Greater Accra 3,245 2,909,764 167 278 441 896 1,205Volta 20,572 2,099,876 35 46 59 80 102Eastern 19,324 2,596,013 54 63 87 109 134Ashanti 24,390 4,725,046 45 61 86 148 194Brong-Ahafo 39,557 2,282,128 15 19 31 46 58Northern 70,383 2,468,557 8 10 17 26 35Upper East 8,842 1,031,478 53 61 87 104 117Upper West 18,477 677,763 16 17 24 31 37Ghana 238,537 24,223,431 28 36 52 79 102Source: Adeku <strong>and</strong> Kwafo 2005; Ghana 2010 Population <strong>and</strong> Housing Census Provisional ResultsTable 7.4 Incidence of Poverty (Percentage)by Ecological Zone aEcological Zone 1991/92 1998/99 2005/06Accra (GAMA b ) 23.1 4.4 10.6Urban Coastal 28.3 31.0 5.5Urban Forest 25.8 18.2 6.9Urban Savanna 37.8 43.0 27.6Rural Coastal 52.5 45.6 24.0Rural Forest 61.6 38.0 27.7Rural Savanna 73.0 70.0 60.1Urban 27.7 19.4 10.8Rural 63.6 49.5 39.2Source: Ghana Statistical Service, 2007a Incidence of poverty is given as a percentage of households within the given ecological zone living on
Table 7.5 Incidence of poverty (percentage)by Administrative Region, 1991/92 to 2005/06AdministrativeRegion 1991/92 1998/99 2005/06Western 60 27 18Central 44 48 20Greater Accra 26 5 12Volta 57 38 31Eastern 48 44 15Ashanti 41 28 20Brong-Ahafo 65 36 29Northern 63 69 52Upper East 67 88 70Upper West 88 84 88Ghana 52 40 29(See footnote to Table 6.C.4 for definition of poverty levels)Source: Ghana Statistical Service, 2007Ghana increases its social <strong>vulnerability</strong> to <strong>climate</strong> <strong>change</strong>, <strong>and</strong> will pose additional challenges for <strong>climate</strong> <strong>change</strong><strong>adaptation</strong>.CONCLUSIONSBased on the measures used in this analysis of social <strong>vulnerability</strong> to <strong>climate</strong> <strong>change</strong> in Ghana, we find thatthe Upper East, Upper West, <strong>and</strong> Northern administrative regions have the highest overall social <strong>vulnerability</strong>to <strong>climate</strong> <strong>change</strong>. The eastern portion of Brong Ahafo Region <strong>and</strong> the far northern <strong>and</strong> southern-mostdistricts of Volta Region, also exhibit high social <strong>vulnerability</strong> to <strong>climate</strong> <strong>change</strong>. Urban districts appear to beless vulnerable than rural districts, probably because of the relatively well-developed infrastructure <strong>and</strong>opportunities for economic diversification. The Upper East, Upper West, <strong>and</strong> Northern regions also have amuch higher incidence of poverty than other regions of Ghana; <strong>and</strong> more than doubled (Upper East, UpperWest) or quadrupled (Northern) in population density between 1960 <strong>and</strong> 2010. These three regions lie in theSudan <strong>and</strong> Guinea Savanna ecological zones. The Forest-Savanna Transition Zone has the next highest social<strong>vulnerability</strong> to <strong>climate</strong> <strong>change</strong> in Ghana, following the savanna zones. Notably, the social <strong>vulnerability</strong>index, which contains no direct meteorological information, describes a general north-to-south decreasing<strong>vulnerability</strong> gradient which is congruent with a north-to-south decreasing gradient in rainfall. The congruentpattern of the two data sets, social <strong>vulnerability</strong> to <strong>climate</strong> <strong>change</strong> <strong>and</strong> rainfall patterns, is not likely acoincidence. Should <strong>climate</strong> <strong>change</strong> bring decreased rainfall, higher temperatures, or both, concomittantincreased social <strong>vulnerability</strong> along this gradient is a logical expectation (see Chapter 3, Ghana’s Climate <strong>and</strong>Projected Changes). These data emphasize that Ghana’s three northern regions deserve attention forinvestments that support <strong>climate</strong> <strong>change</strong> <strong>adaptation</strong>. Nevertheless, other parts of the country that are highlyvulnerable, such as eastern Brong-Ahafo Region <strong>and</strong> northern Volta Region, also warrant assistance. Inaddition, this <strong>vulnerability</strong> <strong>assessment</strong> is relative; less vulnerable districts are nevertheless still vulnerable to<strong>climate</strong> <strong>change</strong>. Finally, this <strong>assessment</strong> focuses at a fairly broad geographic scale. As the following chapteron <strong>climate</strong> <strong>change</strong> <strong>adaptation</strong> indicates, it is also important to assess <strong>climate</strong> <strong>change</strong> <strong>vulnerability</strong> <strong>and</strong><strong>adaptation</strong> at the local level.GHANA CLIMATE CHANGE VULNERABILITY AND ADAPTATION ASSESSMENT 129
REFERENCE AND INDICATOR MAPS 5(see Tables 7.6 <strong>and</strong> 7.7 that follow)Figure 7.3 Reference Map for Identifying Ghana Districts.5 The legend values on the indicator maps represent actual percentages of the population or of households, based on survey data; they do notsignify the district <strong>vulnerability</strong> score (assigned on a scale of 1-10) for a given indicator.130 GHANA CLIMATE CHANGE VULNERABILITY AND ADAPTATION ASSESSMENT
Table 7.6 Ghana District Names, Referenced by Map NumberNos. District Nos. District Nos. District1 Jomoro 42 Birim South 83 Nkoranza2 Nzema East 43 West Akim 84 Kintampo3 Ahanta West 44 Kwaebibirem 85 Atebubu4 Shama Ahanta East Metropolis 45 Suhum-Kraboa-Coaltar 86 Sene5 Mpohor-Wassa East 46 East Akim 87 Bole6 Wassa West 47 Fanteakwa 88 West Gonja7 Wasa Amenfi 48 New Juaben Municipality 89 East Gonja8 Aowin-Suaman 49 Akuapim South 90 Nanumba9 Juabeso-Bia 50 Akuapim North 91 Zabzugu-Tatale10 Sefwi-Wiawso 51 Yilo Krobo 92 Saboba-Chereponi11 Bibiani-Anhwiaso-Bekwai 52 Manya Krobo 93 Yendi12 Komenda-Edina-Eguafo-Abirem 53 Asuogyaman 94 Gushiegu-Karaga13 Cape Coast Municipality 54 Afram Plains 95 Savelugu-Nanton14 Abura-Asebu-Kwamankese 55 Kwahu South 96 Tamale15 Mfantsiman 56 Atwima 97 Tolon16 Gomoa 57 Amansie West 98 West Mamprusi17 Awutu-Effutu-Senya 58 Amansie East 99 East Mamprusi18 Agona 59 Adansi West (North) 100 Builsa19 Asikuma-Odoben-Brakwa 60 Adansi East (South) 101 Kassena Nankana20 Ajumako-Enyan-Essiam 61 Asante Akim South 102 Bongo21 Assin 62 Asante Akim North 103 Bolgatanga22 Twifo-Heman-Lower Denkyira 63 Ejisu-Juaben 104 Bawku West23 Upper Denkyira 64 Botsomtwe-Atwima Kwanwoma 105 Bawku East24 Accra Metropolis 65 Kumasi Metropolis 106 Wa25 Ga 66 Afigya-Kwabre 107 Nadowli26 Tema Municipality 67 Afigya Sekyere 108 Sissala27 Dangme West 68 Sekyere East 109 Jirapa Lambussie28 Dangme East 69 Sekyere West 110 Lawra29 South Tongu 70 Ejura-Sekyedumasi30 Keta 71 Offinso31 Ketu 72 Ahafo Ano South32 Akatsi 73 Ahafo Ano North33 North Tongu 74 Asunafo34 Ho 75 Asutifi35 Hohoe 76 Tano36 Kp<strong>and</strong>o 77 Sunyani37 Jasikan 78 Dormaa38 Kadjebi 79 Jaman39 Nkwanta 80 Berekum40 Krachi 81 Wenchi41 Birim North 82 TechimanGHANA CLIMATE CHANGE VULNERABILITY AND ADAPTATION ASSESSMENT 131
Table 7.7 Ghana District Names, Alphabetical, <strong>and</strong> Associated Map NumberDistrict Nos. Nos. District Nos.Abura-Asebu-Kwamankese 14 Dangme East 28 North Tongu 33Accra Metropolis 24 Dangme West 27 Nzema East 2Adansi East (South) 60 Dormaa 78 Offinso 71Adansi West (North) 59 East Akim 46 Saboba-Chereponi 92Afigya Sekyere 67 East Gonja 89 Savelugu-Nanton 95Afigya-Kwabre 66 East Mamprusi 99 Sefwi-Wiawso 10Afram Plains 54 Ejisu-Juaben 63 Sekyere East 68Agona 18 Ejura-Sekyedumasi 70 Sekyere West 69Ahafo Ano North 73 Fanteakwa 47 Sene 86Ahafo Ano South 72 Ga 25 Shama Ahanta East Metropolis 4Ahanta West 3 Gomoa 16 Sissala 108Ajumako-Enyan-Essiam 20 Gushiegu-Karaga 94 South Tongu 29Akatsi 32 Ho 34 Suhum-Kraboa-Coaltar 45Akuapim North 50 Hohoe 35 Sunyani 77Akuapim South 49 Jaman 79 Tamale 96Amansie East 58 Jasikan 37 Tano 76Amansie West 57 Jirapa Lambussie 109 Techiman 82Aowin-Suaman 8 Jomoro 1 Tema Municipality 26Asante Akim North 62 Juabeso-Bia 9 Tolon 97Asante Akim South 61 Kadjebi 38 Twifo-Heman-Lower Denkyira 22Asikuma-Odoben-Brakwa 19 Kassena Nankana 101 Upper Denkyira 23Assin 21 Keta 30 Wa 106Asunafo 74 Ketu 31 Wasa Amenfi 7Asuogyaman 53 Kintampo 84 Wassa West 6Asutifi 75 Komenda-Edina-Eguafo-Abirem 12 Wenchi 81Atebubu 85 Kp<strong>and</strong>o 36 West Akim 43Atwima 56 Krachi 40 West Gonja 88Awutu-Effutu-Senya 17 Kumasi Metropolis 65 West Mamprusi 98Bawku East 105 Kwaebibirem 44 Yendi 93Bawku West 104 Kwahu South 55 Yilo Krobo 51Berekum 80 Lawra 110 Zabzugu-Tatale 91Bibiani-Anhwiaso-Bekwai 11 Manya Krobo 52Birim North 41 Mfantsiman 15Birim South 42 Mpohor-Wassa East 5Bole 87 Nadowli 107Bolgatanga 103 Nanumba 90Bongo 102 New Juaben Municipality 48Botsomtwe-AtwimaKwanwoma64 Nkoranza 83Builsa 100 Nkwanta 39Cape Coast Municipality 13132 GHANA CLIMATE CHANGE VULNERABILITY AND ADAPTATION ASSESSMENT
Figure 7.4 Percentage of district population >15 years old engaged in agriculture-relatedemployment (including hunting <strong>and</strong> forestry)GHANA CLIMATE CHANGE VULNERABILITY AND ADAPTATION ASSESSMENT 133
Figure 7.5 Percent of district population 65 (Dependent Population)134 GHANA CLIMATE CHANGE VULNERABILITY AND ADAPTATION ASSESSMENT
Figure 7.6 Percentage of female-headed District householdsGHANA CLIMATE CHANGE VULNERABILITY AND ADAPTATION ASSESSMENT 135
Figure 7.7 Percentage of children 0-59 months old who are underweight for their age136 GHANA CLIMATE CHANGE VULNERABILITY AND ADAPTATION ASSESSMENT
Figure 7.8 Percentage of the District population >15 years old that is IlliterateGHANA CLIMATE CHANGE VULNERABILITY AND ADAPTATION ASSESSMENT 137
Figure 7.9 Percentage of District households that can access their homesby road year-round138 GHANA CLIMATE CHANGE VULNERABILITY AND ADAPTATION ASSESSMENT
Figure 7.10 Percentage of District households that travel ≥30 minutesto reach a food marketGHANA CLIMATE CHANGE VULNERABILITY AND ADAPTATION ASSESSMENT 139
Figure 7.11 Percentage of District households that travel ≥30 minutesfor drinking water140 GHANA CLIMATE CHANGE VULNERABILITY AND ADAPTATION ASSESSMENT
Figure 7.12 Percentage of District households that depend on unimproved drinking watersources (rainwater, rivers, lakes, ponds, <strong>and</strong> unprotected wells)GHANA CLIMATE CHANGE VULNERABILITY AND ADAPTATION ASSESSMENT 141
Figure 7.13 Percentage of District Households that self-identifyas being “Poor” or “Very Poor”142 GHANA CLIMATE CHANGE VULNERABILITY AND ADAPTATION ASSESSMENT
Figure 7.14 Percentage of total District households that feel “Somewhat” or “Very”insecure about their ability to withst<strong>and</strong> a crisisGHANA CLIMATE CHANGE VULNERABILITY AND ADAPTATION ASSESSMENT 143
8. ADAPTING TO CLIMATECHANGE IN GHANA: CASESTUDIES FROM THECOASTAL AND NORTHERNSAVANNA REGIONSINTRODUCTIONAdaptation to <strong>climate</strong> <strong>change</strong> in Ghana calls for measures that reduce the <strong>vulnerability</strong> of natural resources<strong>and</strong> people to its impacts, increase people’s ability to adapt to the long-term challenges posed by <strong>climate</strong><strong>change</strong> (their adaptive capacity), <strong>and</strong> strengthen people’s ability to absorb, cope with, <strong>and</strong> recover fromunexpected <strong>change</strong>s that result (resilience) (following Ensor <strong>and</strong> Berger, 2009). To promote <strong>climate</strong> <strong>change</strong><strong>adaptation</strong>, it is necessary to: 1) underst<strong>and</strong> what the biophysical effects of <strong>climate</strong> <strong>change</strong> have been <strong>and</strong> areexpected to be in specific places (e.g., increased drought, unreliable rainfall, rising sea levels, flooding); <strong>and</strong>2) underst<strong>and</strong> the nature of social <strong>and</strong> environmental <strong>vulnerability</strong> in a given place, including how <strong>and</strong> whypeople may be susceptible to the adverse effects of <strong>climate</strong> <strong>change</strong>. Thus, <strong>adaptation</strong> strategies are most likelyto be effective if they are developed using a community-based approach that takes into account the localcircumstances of specific communities.Two case studies of <strong>climate</strong> <strong>change</strong> <strong>adaptation</strong> are presented in this chapter: one from coastal Ghana, <strong>and</strong> onefrom the northern Guinea <strong>and</strong> Sudan savanna ecological zones, which include the Upper East, Upper West,<strong>and</strong> Northern administrative regions. The <strong>adaptation</strong> strategies described in these case studies are not meantto be prescriptive; instead, they provide examples of how <strong>climate</strong> <strong>change</strong> is being experienced in parts ofGhana that USAID has expressed a particular interest in, <strong>and</strong> of approaches to <strong>adaptation</strong> that are currentlyunderway in some communities or that could potentially be pursued.Figures 8.1 <strong>and</strong> 8.2 indicate the percentage of Ghana’s population employed mainly in agriculture, hunting<strong>and</strong> forestry, <strong>and</strong> fishing by district across Ghana. It is evident that the Upper East, Upper West, <strong>and</strong>Northern administrative regions – generally corresponding to the Sudan <strong>and</strong> Guinea savanna ecological zones– have among the highest percentages of the population employed in agriculture, hunting, <strong>and</strong> forestry inGhana. Similarly, the Coastal Savanna Zone has a high percentage of the population employed in fishing.Thus, our focus in this chapter is on rural livelihoods in the context of <strong>climate</strong> <strong>change</strong> with an emphasis onfood security, in line with USAID’s planned investments in food security in Ghana through the Feed theFuture program. We assume that a main goal of <strong>climate</strong> <strong>change</strong> <strong>adaptation</strong> in these zones is to ensuresustainable livelihoods – defined as the capabilities, assets, <strong>and</strong> activities required to make a living in a mannerthat is resilient to stresses <strong>and</strong> shocks, <strong>and</strong> that maintains or enhances these capabilities, assets, <strong>and</strong> activitieswithout undermining the natural resource base (Scoones, 1998). The areas discussed in these case studiesdeserve special attention for potential investments in <strong>climate</strong> <strong>change</strong> <strong>adaptation</strong> because <strong>climate</strong> <strong>change</strong> inGhana is predicted to have significant impacts on coastal areas <strong>and</strong> on the dryl<strong>and</strong>, northern savanna regions;144 GHANA CLIMATE CHANGE VULNERABILITY AND ADAPTATION ASSESSMENT
people residing in thesee regions are highly dependent on fishing g <strong>and</strong> agriculture, respectively; <strong>and</strong> social<strong>vulnerability</strong> to <strong>climate</strong> <strong>change</strong> is particularly high in northern Ghana.Source: 2000 Population <strong>and</strong> Housing Census (GSS, 2005)Figure 8.1 Percentage of Ghana’s population aged 15 <strong>and</strong> over employed mainly inagriculture, hunting, <strong>and</strong> forestry, by district.GHANA CLIMATE CHANGE VULNERABILITY ANDADAPTATIONASSESSMENT145
Source: 2000 Population <strong>and</strong> Housing Census (GSS 2005)Figure 8.2 Percentage of Ghana’s population aged15 <strong>and</strong> overemployed mainly in fishing, by district.146 GHANA CLIMATE CHANGE VULNERABILITY AND ADAPTATION ASSESSMENT
CASE STUDY: CLIMATE CHANGE ADAPTATION IN GHANA’SCOASTAL ZONEOVERVIEWGhana’s coastal zone, commonly defined as the l<strong>and</strong> area belowthe 30 meter r contour, has a shoreline of528km in length, <strong>and</strong> encompasses an area of 5,800 – 16,000 km 2 (EPA, 2008), roughly 2-7 percent of thecountry’s l<strong>and</strong> mass, depending on exact boundaryplacement (see Chapter 5. C, Physiography, Ecology, <strong>and</strong>Livelihoods). The shoreline transitions from s<strong>and</strong>y, relatively flat beaches of the western coast (roughly 95km), to rocky beaches of the central coast (321 km), to the s<strong>and</strong>yy east coast (149 km). Mostof the country’smajor rivers drain into the sea, forming estuaries <strong>and</strong> lagoons along the shore.Despite itsrelatively small l<strong>and</strong>mass, the coastal zone is Ghana’ss most denselyy populated area, holding 25percent ofthe total population (EPA, 2008). Of the 10 most populous cities in Ghana, six are located alongthe coast: the capital city of Accra (population 1,695,136); the twin cities of Sekondi-Takoradi in the WesternRegion (combined population 289,595); Ashiaman(150,312), Tema (141,479), <strong>and</strong> Teshie (92,359), all intheGreater Accra Region; <strong>and</strong> the former colonial capital of Cape Coast (population 118,105) in the CentralRegion (GSS, 2002). Asa result of these urban centers, districts within the coastal area tendto have highhpopulationgrowth rates, ranging from1.0 – 4.4 percent/year (median =2.9 percent) (Ghana Districts, 2006).The most rapidly growing urban areas are increasing at a rate nearly twice the national average, <strong>and</strong> willdouble in size over 16 years. However, even with this burgeoning population, , social <strong>vulnerability</strong> to <strong>climate</strong><strong>change</strong> along the coast is not as severe as in the northern regions of the country. This is due, in part, tosuperior transportation<strong>and</strong> communication networks, higher quality educational opportunities, betterdevelopedd commercial markets, <strong>and</strong> the corresponding increase in potential for livelihood diversificationthatexists in urban areas. However, extraordinarily highh growth ratess still outpace the rate of development,exerting continually increasing pressure on resources that are already in decline (CRC 2010) ). And, it isimportant to note, although social <strong>vulnerability</strong> at a district levell is less severe along the coast, households <strong>and</strong>settlements located farther from urban centers canbe just as socially vulnerable as households in the northernreaches ofthe country (Apombwe, 2011).LIVELIHOOD STRATEGIES AND CLIMATE CHANGE IMPACTSInhabitants of the coastal zone depend primarily on marine fisheries for their livelihoods (EPA, 2008; CRC,2010; Chapter 6, Fishery Resources <strong>and</strong> Overfishing). There are five distinct fleets operating within Ghana’smarine fisheries: artisanal canoe, semi-industrial, industrial, tuna, , <strong>and</strong> lagoon. Men are responsible forharvestingthe fish, <strong>and</strong> women dominate the onshore post-harvest activities of processing,storing,marketing, <strong>and</strong> trading the catch (EPA, 2008). In addition to fishing, most households practice some form ofsubsistence agriculture (CRC, 2010; GSS, 2005, 2008). Aside from fishing, urban areas benefit from tourism.Visitors come to the area to enjoy thebeaches, to visit the colonial slave castles, or to venture inl<strong>and</strong> <strong>and</strong>experiencee the biodiversity of the evergreen forests. At the present moment, little infrastructure exists tosupport a lucrative tourism industry outside of urban areas <strong>and</strong> many beachess are routinelyused as toilets byGHANA CLIMATE CHANGE VULNERABILITY ANDADAPTATIONASSESSMENT147
local residents <strong>and</strong> as depositories for untreated liquid <strong>and</strong> solid waste <strong>and</strong> refuse (Briggs, 2010). The newlyestablishedoil <strong>and</strong> gas industry, off the coast of the Western Region, promises a surge in development <strong>and</strong>has the potential to create jobs for the local population. In part because of the rather limited estimatedproduction life of the confirmed oil finds <strong>and</strong> field development to date, the true impact of the industryremains to be seen (one field so far, producing for about 20 years, Tullow Ghana Limited, 2009; CRC, 2010).Since occupations of coastal residents depend primarily on the marine fishery resource, livelihoodvulnerabilities are tied to threats confronting this resource. Vulnerabilities of the marine fishery resource aremulti-faceted with or without considerations of <strong>climate</strong> <strong>change</strong>. Climate <strong>change</strong>-related threats often increasepre-existing human induced threats to the system. Potential <strong>climate</strong> <strong>change</strong>-related threats confronting themarine fisheries include a potential rise in sea level, increased ocean temperatures, <strong>and</strong> perhaps mostthreatening, <strong>change</strong>s to the seasonal upwelling patterns. Persistent human-induced threats include: increasedpressure on the fisheries as a result of a drastic increase in fleet size; <strong>change</strong>s in water quality from pollutioncaused by ineffective waste water treatment plants, agricultural runoff, <strong>and</strong> aerial mosquito spraying;destruction of mangrove, lagoon, <strong>and</strong> wetl<strong>and</strong> systems that previously played important nursery roles forjuvenile fish; a shift towards more destructive fishing practices <strong>and</strong> a lengthening of the harvest season, bothactions that reduce the potential for stock recovery; s<strong>and</strong> harvesting practices, coupled with the constructionof sea walls or harbors that disrupt nearshore currents <strong>and</strong> interfere with natural sedimentation cycles; <strong>and</strong> ageneral lack of management, regulation, or monitoring of any sort within the industry (EPA, 2008; CRC,2010; Nelson & Agbey, 2005). The general outcome of these combined threats is an overall decline in themarine fishery (EPA, 2008; CRC, 2010; Atta-Mills, et al. 2004, Chapter 6, Fishery Resources <strong>and</strong>Overfishing).When asked how this decline in the fisheries impacts individuals participating in the industry, commonresponses were that, on an individual level, the resulting loss of income makes feeding the family difficult,school fees unaffordable, protein too expensive, <strong>and</strong> unemployment increasingly prominent (EPA, 2008).When asked to characterize <strong>climate</strong> <strong>change</strong>-related concerns within the community, respondents observedthat without a reliable source of income from the fishery, households face financial hardships that worsenliving conditions <strong>and</strong> reduce st<strong>and</strong>ards of living (EPA, 2008).CLIMATE CHANGE ADAPTATION STRATEGIESLivelihood <strong>adaptation</strong> strategies can be broken down into three distinct categories. The first category,insurance strategies, can be defined as activities undertaken to avoid or prevent stress in the future (van derGeest, 2004). The second strategy, coping, has been defined as “a short-term response to an immediate <strong>and</strong>unhabitual decline” (Davies & Hossain, 1993: 60). Insurance <strong>and</strong> coping strategies can be erosive or nonerosive.Erosive strategies are activities that harm future resilience; non-erosive strategies, the preferredapproach, do not jeopardize future security (van der Geest, 2004). Both insurance <strong>and</strong> coping are short-termsolutions <strong>and</strong> are unsustainable in the face of permanent, long-term <strong>change</strong>. The third <strong>and</strong> final strategy,livelihood <strong>adaptation</strong>, is defined as “the dynamic process of constant <strong>change</strong>s to livelihoods which eitherenhance existing security <strong>and</strong> wealth or try to reduce <strong>vulnerability</strong> <strong>and</strong> poverty” (Davies & Hossain, 1997: 5).Livelihood <strong>adaptation</strong>s address long-term <strong>change</strong>s <strong>and</strong> typically occur when coping strategies are exhausted<strong>and</strong> individuals are forced to “alter fundamentally the ways in which they subsist” (Davies & Hossain, 1997:5). Adaptation can be positive or negative. Positive <strong>adaptation</strong> occurs by choice <strong>and</strong> is reversible if fortunesimprove; negative <strong>adaptation</strong> tends to occur out of necessity, is usually irreversible, <strong>and</strong> often does not makecontributions to lasting reductions in <strong>vulnerability</strong> (Davies & Hossain, 1997). On Ghana’s coast there areexamples of all three forms of the more generally defined <strong>adaptation</strong>.Insurance strategies involve, first, developing an early warning system that enables individuals to better anticipatehazardous events or declines in production. With some level of awareness of future events, individuals canthen act in ways that temporarily insure them against lost income. Minimal efforts have been made in thisarea; however, some fishermen have started anticipating financial hardship <strong>and</strong> putting more fish into coldstorage to sell in the off season, or simply foregoing income from sales in order to put away extra reserves ofsmoked fish for personal consumption (EPA, 2008). Other insurance strategies include borrowing money148 GHANA CLIMATE CHANGE VULNERABILITY AND ADAPTATION ASSESSMENT
from friends <strong>and</strong> family to get by during an economic slump or redirecting money from other areas of thehousehold finances to temporarily cover the loss of fishing income (van der Geest, 2004). These strategiestend to be erosive because they threaten future resilience by depleting overall household resources to a pointfrom which they might not recover if income reduction persists for more than one season.Many of the coping strategies employed on the coast could be considered borderline <strong>adaptation</strong>s because theyhave been practiced over a long period of time. That said, to combat declining catch sizes, artisanal fishermenhave transitioned to semi-industrial outfits or simply increased the time they spend at sea, added engines totheir canoes to travel greater distances, switched to nets with much smaller weaves to capture smaller fish,<strong>and</strong> incorporated the use of lights, dynamite, or poison into their practices (CRC, 2010; Impraim, 2010).Semi-industrial, industrial, <strong>and</strong> canoe fishers have coped with declining fisheries by adopting light fishing,extending their range, illegally moving into the inward exclusion zone, or fishing off the shore of neighboringcountries (CRC, 2010, Personal Interview). All three fleets are believed to under-report their catch, whichenables them to pay less of a remittance to the lead fisherman 6 (CRC, 2010; Impraim, 2010). Nearly all ofthese coping strategies can be considered erosive because they harm the health of the resource in the future.The Government of Ghana has invested in a more coordinated short-term coping strategy, known as the Pre-Mix Program. The Pre-Mix Program is a fuels subsidy program by which artisanal fishermen are providedwith fuel for use in their two-stroke engines. The program has been controversial <strong>and</strong> riddled with corruption<strong>and</strong> mis-management, but many artisanal fishermen rely on the low-cost fuel provided through the program(CRC 2010). Although not completely clear, this practice may also be erosive by subsidizing an already overcapitalizedor at least over-sized fleet relative to the sustainable fishery resource.In addition to these short-sighted coping mechanisms, individuals on the coast have also started adoptinglonger term livelihood <strong>adaptation</strong>s. Most livelihood <strong>adaptation</strong>s revolve around livelihood diversification,expansion, or improved practices. Communities <strong>and</strong> households have invested in under-developed industries,like tourism, as an alternative to fishing-dependent livelihoods. An unseen benefit of this particular <strong>adaptation</strong>is that many of the new tourism-based businesses have the potential to become partners in conservationefforts that benefit the fisheries. A few examples of this are occurring already. The Green Turtle Lodge, abeach front eco-tourism lodge in the Western Region, has partnered with local <strong>and</strong> international conservationorganizations to protect nesting sea turtles that their visitors come to see (CRC, 2010). Local lead fishermenhave worked to instill a l<strong>and</strong> ethic within their villages by discouraging destructive practices <strong>and</strong> making betterattempts to monitor catches. The success of chief fishermen depends largely on their status <strong>and</strong> respectwithin the community, <strong>and</strong> while effective over a small area, chief fishermen do not have the authority orreach to influence <strong>change</strong> across the fisheries as a whole unless they work with collaborating partners (CRC,2010). The Ghanaian government with funding from the World Bank experimented with Community-BasedFisheries Management Committees, hoping to strengthen the influence of local community leaders bytransferring management responsibilities to local committees. The program suffered from a lack of funding<strong>and</strong> has been discontinued (Braihmah, 2009). However, the Coastal Resource Center (CRC), based inSekondi-Takoradi in the Western Region, has resumed this movement of community involvement in fisheriesmanagement. The CRC is working today to develop a unified civil society platform with the ability toinfluence <strong>change</strong> in the overall governance of the artisinal fishery (CRC, 2010). Their efforts include chieffishermen, konkohene (leader of the fish sellers), traditional chiefs, <strong>and</strong> other community leaders with thepotential to influence local behaviors.Other adaptive measures are less overarching. Working to improve or diversify their existing livelihoods,fishermen have added crew members <strong>and</strong> shifted towards larger canoes, thereby increasing the capacity oftheir operations. Fish sellers have delved into better smoking techniques to eliminate inefficiencies byreducing waste. Communities have invested in cold storage facilities, enabling better storage <strong>and</strong> marketing6 At the community level, fishing is managed through lead fishermen. A lead fisherman was traditionally a particularly skilled fishermansanctioned by the chief to regulate the activities of fishermen throughout the village, generally by assigning individuals days of the week onwhich they were permitted to fish. Today these positions are inherited father to son, although their function remains the same (Impraim,2011).GHANA CLIMATE CHANGE VULNERABILITY AND ADAPTATION ASSESSMENT 149
(CRC, 2010). Despite these efforts to improve community resilience, many households depend upon outsideremittances to subsidize their annual budgets, <strong>and</strong> many young adults or children migrate to urban centers towork in manufacturing or trade.CLIMATE CHANGE ADAPTATION: OPPORTUNITIES AND CHALLENGESA rapidly growing population is exerting continuous pressure on marine resources. Finding ways to reducethat pressure before it causes a collapse is the most important way to avoid disaster. Many preventative stepsthat are currently under-utilized can be taken to reduce this pressure. One key way to address the dem<strong>and</strong> <strong>and</strong>use of resources is through democracy <strong>and</strong> governance. The Coastal Resource Center, as touched onpreviously, is working to evaluate the effectiveness of existing government systems <strong>and</strong> reform governmentpolicy that pertains to fisheries governance (CRC, 2010). They hope to strengthen fisheries governance bycontributing to long-term planning exercises, supported by an educated <strong>and</strong> aware public.Aside from political engagement, many other activities <strong>and</strong> strategies could help reduce <strong>vulnerability</strong>.Investments in forestry, agriculture or tourism have the potential to lessen dependence on fisheries byproviding viable employment alternatives in the area. Implementing efforts to restock marine resources, <strong>and</strong>supporting the growth of alternative fishery-based industries such as cage culture or aquaculture could helprelease some of the pressures on the marine resource (CRC, 2010; EPA, 2008). Education <strong>and</strong> capacitybuilding with local populations will help encourage best practices in the industry as well as open doors toother forms of employment (such as the emerging oil <strong>and</strong> gas industry). Many internationally-basedconservation organizations <strong>and</strong> local businesses have partnered to restore coastal lagoons, estuaries, <strong>and</strong>mangroves, which would create better rearing habitats for juvenile fish populations. Such partnerships couldcreate potential employment opportunities <strong>and</strong> also lessen the costs of conservation for the government bysharing the responsibility for conservation. Furthermore, by partaking in environmental stewardship, localbusinesses can help restore an influential l<strong>and</strong> ethic in local communities to better encourage individuals tocare for the remaining natural resources (CRC 2010).Currently the marine fisheries are considered an open-access resource, which has led to an industry thatgrows exponentially <strong>and</strong> unchecked. Some efforts have been made to initiate a permitting or registrationsystem; however, these attempts have been grossly unpopular with local populations. A huge potential existsfor the fisheries to improve if access is better regulated or managed. Alternatives to an open access systemmight be introducing closed seasons to allow the fisheries time <strong>and</strong> space to regenerate, or better enforcementof catch limits <strong>and</strong> size (CRC, 2010). Another related need is for dramatically up-scaled monitoring of <strong>and</strong>enforcement across all fleets <strong>and</strong> sectors (Finegold et al., 2010). This includes trained personnel to gatheraccurate <strong>and</strong> timely fishery-dependent statistics <strong>and</strong> independent marine research surveys for comparative <strong>and</strong>predictive purposes to develop catch limits, season closings, gear restrictions, <strong>and</strong> other actions needed for asustainable fishery. Currently in Ghana, monitoring, enforcement <strong>and</strong> marine fishery research are allinadequate, often woefully so, for sustainably managing an already strained fishery (see Chapter 6.B, FisheryResources <strong>and</strong> Overfishing). Growing civil society platforms, together with community-based management<strong>and</strong> conservation initiatives, have the potential to better regulate the fisheries at a local level. Local leaders areunable to influence <strong>change</strong> across an industry as extensive as the marine fisheries; however, a coordinatedapproach that incorporates them into resource management could build on their positions of authority inlocal communities to help bring about <strong>change</strong>.150 GHANA CLIMATE CHANGE VULNERABILITY AND ADAPTATION ASSESSMENT
CASE STUDY: CLIMATE CHANGE ADAPTATION IN GHANA’SNORTHERN SAVANNAA REGIONSOVERVIEWGhana’s three northern administrative regions – Upper East, Upper West, <strong>and</strong> Northern – lie in the Sudan<strong>and</strong> Guinea savanna ecological zones. Roughly 23 percent of Ghana’s population resides inthese threeregions (GSS, 2005), <strong>and</strong> the vast majority resides in rural areas (84.3 percent percent in Upper East, 82.5percent inUpper West, 83.9 percent in Northern) (Ghana Districts, 2006). A high percentage of each region’spopulationdepends on agriculture for their main source of employment (67.2percent in Upper East, 73.4percent inUpper West, 70.9 percent in Northern) (GSS, 2005a, 2005b, 2005c). Agricultural-dependentpercentages rise in eachadministrative region if their most urbann districts are not factored in (i.e., BolgatangaMunicipal, Wa Municipal, <strong>and</strong> Tamale Metropolitan). The most important crops are millet, sorghum, maize,yams, rice, soy beans, cotton, groundnuts, beans, onions, <strong>and</strong> tomatoes. Mostt agricultural production israinfed, though some rice is under irrigation. Manyhouseholds also raise livestock. Agricultural productiontakes placelargely by smallholders. Mole National Park, Ghana’ss largest national park, is located in theGuinea Savanna in the Northern Region, covering 4,840 km 2 (OWGT, 2011) .As detailedd earlier in this report, thesee are Ghana’s most vulnerable regions to<strong>climate</strong> <strong>change</strong> from bothanatural resource <strong>and</strong> a social st<strong>and</strong>point. The SudanSavanna (roughly corresponding to theUpper EastRegion) suffers long-st<strong>and</strong>ing <strong>and</strong> very severe soil degradation; soil degradation in the Upper West <strong>and</strong>Northern Regions (the Guinea Savanna) is moderate (See Chapter 6, Resource Vulnerability--Desertification).However, all three regions exhibit either high or very high <strong>vulnerability</strong> to desertification (with the exceptionof the southern portionof the Northern Region, south of 10°N latitude). It iss unclear how<strong>climate</strong> <strong>change</strong>will affect the process of desertification <strong>and</strong> the rate at which it occurs. The Sudan <strong>and</strong> Guinea Savannaecological zones also have the hottestt temperatures, <strong>and</strong> the second <strong>and</strong> thirdlowest rainfall levels (aftertheCoastal Savanna), in thecountry (see Chapter 3, Ghana’s Climate <strong>and</strong> Projected Changes). Rainfall is variable,as is characteristic of dry, subhumid dryl<strong>and</strong>s.Temperatures have beenincreasing more rapidly innorthern Ghana than elsewhere in the country, <strong>and</strong> areprojected to keep getting hotter. At the same time,annual decreases in total precipitation have beendocumented for the Guinea Savanna,<strong>and</strong> rainfall is projected too decrease in the future in both the Sudan<strong>and</strong>Guinea Savanna zones (Chapter 3). The Upper East, Upper West, <strong>and</strong> Northern Regions have high social<strong>vulnerability</strong> to <strong>climate</strong> <strong>change</strong> (Chapter 6) <strong>and</strong> thehighest poverty rates in Ghana (Nelson<strong>and</strong> Agbey, 2008;Chapter 6) ).GHANA CLIMATE CHANGE VULNERABILITY ANDADAPTATIONASSESSMENT151
PERCEPTIONS OFCLIMATE CHANGE AND ITS EFFECTS INTHE NORTHERNSAVANNAResearch has documented <strong>change</strong>s in<strong>climate</strong> taking place in Ghana’s northern savannas based on theperceptions of local residents. These perceptions are described here, though it is importantt to note that theycome fromcommunity-level residents have reported a shorter <strong>and</strong>more unpredictable rainy season from the st<strong>and</strong>pointt ofstudies <strong>and</strong> should not be overly generalized. In some communities in the UpperEast Region,both amount <strong>and</strong> timingof rain (Dietz et al., 2004) ). Changes to biophysical resources observed by residentsthat are attributed to <strong>climate</strong> <strong>change</strong> include shifts in natural vegetation from trees to grasses <strong>and</strong> a gradualdisappearance of economically-important trees; thedrying up off riverbeds that once supported dry-seasoncultivationafter the rainy season ends; early dryingof flowing streams in the dry season, leaving stagnanttpools of mosquito-infessted water of low quality; salinization of water sources; fewer swimming holes alongrivers; <strong>and</strong>unreliability of traditional signs that signal the start off the rainy season (e.g., bird<strong>and</strong> insectbehavior, <strong>change</strong>s in winds, onset of new leaves, water table levels in wells) (Dietz et al., 2004). In the UpperWest Region, increasingly erratic rainfall is also reported with the amount, timing, <strong>and</strong> geographic distributionof rain becoming more unpredictablee <strong>and</strong> the totalamount of rain declining over time (V<strong>and</strong>er Geest, 2004).Shorter rainy seasons are also reported. Through interviews in Ghana’s Northern Region, we learned of morefrequent occurrences offloods, windstorms, <strong>and</strong> heavy rains late in the rainy y season.In Ghana’ ’s northern savanna zones (Idinoba et al.,2009), savanna woodl<strong>and</strong>ss (>25 trees/ha) <strong>and</strong> opencultivated savanna (6-25trees/ha) have decreased significantly between 1972 <strong>and</strong> 2000 (Figure 8.3). In 1972“widely open cultivatedsavanna” (
At Mole National Park, managers expressed concern that <strong>climate</strong> <strong>change</strong> would affect the distribution ofwildlife that currently resides in the Park causing them to move outside of park boundaries in search ofresources, especially during the dry season. The movement of wildlife near to neighboring villages can lead toconflict.LIVELIHOOD STRATEGIES AND CLIMATE CHANGE IMPACTSAGRICULTURAL PRODUCTIONMillet <strong>and</strong> sorghum are the most important grain staples grown in the Upper East <strong>and</strong> Upper West regions,<strong>and</strong> maize, millet, <strong>and</strong> sorghum are important staples in the Northern Region (Dietz et al., 2004; Gyasi et al.,2008). Yams are also an important food crop in the Northern <strong>and</strong> Upper West regions (EPA, 2008). Of thesecrops, millet is the least risky with regard to <strong>climate</strong>-induced fluctuations in yield followed closely by sorghum<strong>and</strong> maize, making all of them important for food security. Rice <strong>and</strong> cotton lie at the other extreme exhibitingmuch wider variation in productivity year to year. Some farmers also grow vegetables in gardens <strong>and</strong> irrigatedplots during the dry season.Northern Ghana is also the most important part of the country for livestock production, giving it anadvantage over the south in this regard. Cattle, goats, sheep, chicken, guinea fowl, <strong>and</strong> pigs are the mainanimals raised (Dietz et al. 2004, Hesselburg <strong>and</strong> Yarro 2006). For some agriculturally-dependentcommunities in the Upper East <strong>and</strong> Upper West regions, household food security relies more on livestockthan on farming (Dietz et al., 2004; Hesselburg <strong>and</strong> Yarro, 2006; Van der Geest, 2004). Weather <strong>and</strong> the highcost of farm inputs can make farming unreliable unless households have access to irrigated fields. Livestockrepresent a form of savings that people can invest in in good times <strong>and</strong> that provide a critical buffer in badtimes because they can be sold for cash that can then be used to purchase food when needed. Goats, sheep<strong>and</strong> pigs have high value <strong>and</strong> play an especially important role in food security (Hesselburg <strong>and</strong> Yarro, 2006).Climate <strong>change</strong> may affect agricultural production in a number of ways. Declines in total rainfall <strong>and</strong>increasingly unpredictable rainfall patterns make farming more risky, increasing the likelihood of crop failures<strong>and</strong> reducing agricultural productivity. Too much rain (total or at the wrong time) is bad for drought-adaptedcrops like millet <strong>and</strong> sorghum. Too little rain is bad for maize, yams, <strong>and</strong> rice. The timing of rain is alsoimportant; mid-season dry spells can cause crops to fail even if total rainfall for the season as a whole isnormal. Flooding wipes out dry season crops grown in river valleys <strong>and</strong> stream beds, as shown by recentexperience in northern Ghana. Wind storms can destroy millet tassels once they form late in the season. Andbushfires, a common phenomenon, sometimes burn crops before they are harvested, burn crop residuesfollowing harvest that could otherwise be used for feeding livestock or fertilizing fields, <strong>and</strong> can alter soilstructure to make it less productive for farming.Farmers we interviewed near Mole National Park stated that they were cultivating larger areas, but overallproductivity was declining. Climate <strong>change</strong> is likely one of several factors contributing to this problem. Wherel<strong>and</strong> is available, extensification to increase productivity is an option. But unless a household owns a tractor,oxen, <strong>and</strong> a plough, or can hire one of these, extensification requires higher labor <strong>and</strong> capital inputs. In areasof high population density, most farmers must pursue intensification strategies to maintain or improve cropyields. These strategies are often labor intensive, a barrier for some households.Regarding livestock, we heard several reports that water <strong>and</strong> forage are becoming more difficult to obtain inthe dry season. Declines in dry season grazing <strong>and</strong> water have led to reductions in livestock holdings for somehouseholds in the Upper East Region, <strong>and</strong> shifts in herd structure for others, for example, rearing more goatswhich are easier to feed than cattle <strong>and</strong> sheep (Gyasi et al., 2008). A growing incidence of bushfires –exacerbated by a hotter, drier <strong>climate</strong> – is reportedly burning animal fodder, also making it more difficult toobtain dry season forage.NON-FARM ACTIVITIESNon-farm activities play a critical role in household livelihood security in the northern savanna zones (e.g.,Whitehead, 2002), as they help households widen <strong>and</strong> diversify their income-earning portfolios. MostGHANA CLIMATE CHANGE VULNERABILITY AND ADAPTATION ASSESSMENT 153
households depend on a combination of farm <strong>and</strong> nonfarm activities (Hesselberg <strong>and</strong> Yaro, 2006). Non-farmactivities help people cope with temporary adversity in the agricultural sector <strong>and</strong> also represent a longer-term<strong>adaptation</strong> strategy when other options fail (Scoones, 2008). In northern Ghana, these activities includehunting, fishing, non-timber forest product harvesting, local manufacturing, charcoal production, petty trade,<strong>and</strong> wage labor (Dietz et al., 2004; Hesselburg <strong>and</strong> Yarro, 2006; Whitehead, 2002). Non-farm income earningactivities are especially important during the dry season.Climate <strong>change</strong> may pose problems for non-farm activities that are natural resource-based. For example,declines in tree cover will make it more difficult to engage in charcoal production, the sale of firewood, <strong>and</strong>the gathering <strong>and</strong> manufacture of products from some non-timber forest species such as dawadawa <strong>and</strong> sheanuts, despite the protected status of these trees in many communities. Nevertheless, non-farm activities arelikely to play an increasingly important role in household livelihoods in the future because they offeropportunities for diversification when agriculture becomes more risky.MIGRATIONA third common livelihood strategy in the northern savanna zones is migration, often by select householdmembers who send remittances back home. Migration includes seasonal, temporary <strong>and</strong> permanentmovement between places, whether short or long distance. Migration from Ghana’s three northern regions toits southern regions has been ongoing since the turn of the 20 th century, when British colonial rule wasintroduced (Van der Geest, 2008). Between 1984 <strong>and</strong> 2000, 18.4 percent of the people who were born innorthern Ghana migrated south with the Upper West Region exhibiting the highest rates of outmigration(26.9 percent) followed by Upper East (22.2 percent). The main destinations of migrants from the north arethe cities of Kumasi <strong>and</strong> Accra, the cocoa belt frontier in the northern part of the Western Region, <strong>and</strong> theproductive farming areas to the south (Van der Geest, 2008). Those who have skills, such as mechanics,carpenters <strong>and</strong> teachers typically migrate to urban areas; unskilled farmers typically migrate south to placeswhere farming is more favorable. In the Upper East Region, migration is more common from areas wherepopulation density is high, there are l<strong>and</strong> shortages, <strong>and</strong> opportunities for irrigated agriculture are lacking(Hesselburg <strong>and</strong> Yaro, 2006). Key factors causing migrant farmers living in the Upper West Region to moveto the Brong-Ahafo Region were l<strong>and</strong> scarcity, reduced soil fertility resulting in low agricultural productivity,<strong>and</strong> the abundance <strong>and</strong> fertility of l<strong>and</strong> in the Forest-Savanna Transition Zone, where rainfall <strong>and</strong> farmingconditions are better than in the north <strong>and</strong> there are more opportunities to earn income (Van der Geest,2008). Climate was also a factor that led to outmigration from Upper West.Notably, Ghana’s northern savanna regions, particularly the Upper East, are also receiving areas for migrants.Fulani herders from Burkina Faso, Mali, Niger <strong>and</strong> Nigeria began moving into northern Ghana early in the20 th century (Tonah, 2006). At first, their movements were seasonal, took place mainly during the dry season,<strong>and</strong> were confined to the Upper East Region. They were drawn by relatively low populations of humans <strong>and</strong>animals <strong>and</strong> lush vegetation. Drought <strong>and</strong> growing difficulty obtaining pasture <strong>and</strong> water at home, particularlyduring the dry season, caused the number of migrants to rise <strong>and</strong> to settle more permanently in northeasternGhana. By the 1960s, the Fulani population in northern Ghana had grown considerably. Competition overresources became severe leading to conflicts between herders <strong>and</strong> farmers. This caused many Fulani migrantsto move farther south, especially to Ghana’s Lake Volta Basin. Some worked as hired herders for farmers <strong>and</strong>traders, <strong>and</strong> others simply moved wholesale with their own cattle herds to pursue pastoral livelihoods.Although economic relations between Fulani herders <strong>and</strong> farmers can be symbiotic <strong>and</strong> mutuallyadvantageous, they can also be contentious. The main cause of herder-farmer conflict is crop destruction bycattle (Tonah, 2006). The reasons for this conflict are many <strong>and</strong> complex (see Moritz, 2010; Tonah 2006) withthe result that conflict between herders <strong>and</strong> farmers in recent years has become more violent. If <strong>climate</strong><strong>change</strong> results in greater aridity in the region, it is likely to intensify this conflict as more herders are displacedfrom the even drier Sahelian region, migrate south into Ghana, <strong>and</strong> settle permanently <strong>and</strong> as resident farmersexp<strong>and</strong> dry season farming in river valleys, river bottoms, <strong>and</strong> wetl<strong>and</strong> areas where cattle concentrate duringthe dry season. Given current conditions of the savanna zones in Burkina Faso <strong>and</strong> northernmost Ghana, thismay occur regardless of <strong>climate</strong> <strong>change</strong> effects, short of increase in rainfall.154 GHANA CLIMATE CHANGE VULNERABILITY AND ADAPTATION ASSESSMENT
ADAPTING TO CLIMATE CHANGE IN THE NORTHERN REGIONBecause Ghana’s northern savanna zones have historically experienced unpredictable rainfall <strong>and</strong> periodicdrought, as is characteristic of dryl<strong>and</strong> regions, people have developed coping mechanisms to deal with<strong>climate</strong> variability over time. Thus, they can draw on past experience to help them adapt to <strong>climate</strong> <strong>change</strong>.Traditional ecological knowledge plays an important role in this regard. Nevertheless, people’s abilities toadapt will depend on the range of options they have available to them, which are a product of several factors.These include social networks, access to capital, household assets <strong>and</strong> capacities, knowledge, skills,information resources, local institutions that influence resource access <strong>and</strong> use, enabling policies, <strong>and</strong> accessto infrastructure.A number of shifts in livelihood strategies that support <strong>climate</strong> <strong>change</strong> <strong>adaptation</strong> are documented forGhana’s Upper East, Upper West, <strong>and</strong> Northern regions (Table 8.1). These can be organized into the threemain categories of livelihood strategies that prevail in northern Ghana described in the preceding section.Most strategies focus on the agricultural sector. It is important to note that the drivers of these strategies mayor may not be <strong>climate</strong> <strong>change</strong> per se; <strong>climate</strong> <strong>change</strong> is generally one of many social <strong>and</strong> environmentalvariables that interact to affect rural communities. Nevertheless, they are activities that support <strong>climate</strong><strong>change</strong> <strong>adaptation</strong> in the northern savanna zones. Our summary is not meant to be exhaustive (Table 8.1) butrather to provide examples of <strong>adaptation</strong> strategies in the northern savannas.Table 8.1 Climate Change Adaptation Strategies in the Northern Savannas 7Changes in agricultural practicesLivelihooddiversificationMigrationSourceSudan Savanna Early-maturing millet varieties on the rise Late-maturing millet varieties declining More drought-tolerant varieties of red sorghum increasing inimportance Sheep, goats, pigs <strong>and</strong> poultry becoming more prevalent,cattle diminishing due to forage <strong>and</strong> water stress Increased production of cash crops, like cotton, tomatoes,soy beans <strong>and</strong> onions Multi-location farming, whereby a household cultivates plotsin multiple places such as around the home compound, in thebush, in marshy areas <strong>and</strong> in irrigated areas Expansion of l<strong>and</strong> holdings, where possible Shift towards cultivation in low lying areas, marshy areas <strong>and</strong>river valleys where soils retain more moisture Increased irrigation development through construction ofsmall water dams <strong>and</strong> water harvesting to grow rice <strong>and</strong>vegetables Adoption of dry season irrigation of vegetable crops likelettuce, onion <strong>and</strong> cabbage Greater reliance on livestock Purchasing more food Women arediversifying theirincome streams byengaging in pettytrade <strong>and</strong> sellingcash crops Gathering wild foods Becoming a galamsey(local artisanal goldminer) Migrationincreasingover timeDietz et al.,2004Whitehead,2002Hesselberg<strong>and</strong> Yaro,2006Gyasi et al.,2008Guinea Savanna Increasing emphasis on sorghum <strong>and</strong> millet, which are droughtresistant Cultivating a greater variety of crops to spread risk, includingsorghum, millet, maize, rice, yams, groundnuts <strong>and</strong> beans Adopting animalhusb<strong>and</strong>ry Foraging for wildfoods Remittancesfromrelativeswho haveSagoe, 2008Interviewsduring7 Strategies listed may not be confined to either the Guinea or Sudan Savanna ecological zone; they merely reflect strategiesdocumented in the literature from these regions, <strong>and</strong> described in interviews.GHANA CLIMATE CHANGE VULNERABILITY AND ADAPTATION ASSESSMENT 155
Changes in agricultural practicesLivelihooddiversificationMigrationSource Planting crops in diverse locations having different soils types<strong>and</strong> drainages Staggering the planting of seeds over time, <strong>and</strong> plantingseveral seeds per hole to enable transplanting Shift planting dates Intercropping to reduce weeds, retain soil moisture <strong>and</strong>intensify production Mulching yam mounds to prevent dessication Planting legumes as cover crops between grains to reduce soil<strong>and</strong> water runoff Planting early-maturing <strong>and</strong> higher yielding crop varieties Increasing crop density in fields Weeding more often Enhancing soil fertility by adding organic amendments such asagricultural waste, animal droppings or compost; retainingcrop residues in fields; banning burning Adopting mechanical measures to enhance soil fertility <strong>and</strong>retain soil moisture (e.g., contour tillage, grass strips, earthbunds, stone lines across slopes) Using minimal tillage Engage in dry-season gardening Increasing use of lowl<strong>and</strong> <strong>and</strong> valley bottom fields forcultivation to reduce <strong>vulnerability</strong> to drought Accumulation of livestock as insurance against crop failure Improving crop storage methods Plant several varieties of yams that have different maturityperiods <strong>and</strong> introduce drought-resistant <strong>and</strong> early maturingvarieties Introduce soil amendments Intercrop fast-growing trees with yams to prevent soildegradation <strong>and</strong> increase wood products Improve crop storage post-harvest Increasing reliance on livestock <strong>and</strong> tree crops Digging wells to access water for dry season vegetablegrowing (market is good for vegetables); dry season vegetablegrowing can occur as a backup to rice production if rice fails Brewing beer Sheanut processing Selling firewood Petty trade Fishing Wage labor Rent property toearn income Charcoal production Bee-keeping <strong>and</strong>poultry production Ecotourismdevelopment aroundMole NP Manufacture of sheabuttermigratedpermanently seasonallabormigration byyouth inparticular to thesouthernregions,Kumasi, <strong>and</strong>Accra toearn moneymissionVan derGeest, 2004CLIMATE CHANGE ADAPTATION: OPPORTUNITIES AND CHALLENGESThe preceding summary of <strong>climate</strong> <strong>change</strong> <strong>adaptation</strong> strategies in Ghana’s northern savanna zones indicatesthat there are many opportunities for <strong>adaptation</strong> that could be supported to increase livelihood security in theface of a changing <strong>climate</strong>. Nevertheless, challenges are also associated with many of these strategies.Households may have limited capacity to diversify; development assistance could help people widen theiroptions by reducing barriers. Some of the opportunities <strong>and</strong> associated challenges are outlined in this section.IMPROVING ACCESS TO CREDITAccess to credit is important for helping people diversify their livelihood strategies inside <strong>and</strong> outside theagricultural sector. Northern Ghana suffers from high poverty, meaning many households cannot afford toinvest in new businesses or agricultural production techniques because the cost of credit is extremely high inGhana with interest rates hovering around 30 percent. Moreover, many banks require borrowers to repayloans quickly because of high default rates, often before an investment has begun to generate profits156 GHANA CLIMATE CHANGE VULNERABILITY AND ADAPTATION ASSESSMENT
(interview). An opportunity exists to assist farmers in gaining access to credit on terms that are feasible forthem. This could take place for example through micro-financing projects.LOW-COST DIVERSIFICATION STRATEGIESDiversification strategies that are lucrative <strong>and</strong> have low startup costs are attractive, especially for poorerhouseholds lacking access to credit. Examples are beekeeping, raising poultry, <strong>and</strong> charcoal production.Sustainable supplies of wood for charcoal production are difficult to find, <strong>and</strong> loss of tree cover may makecharcoal production less viable in the future. Low-cost diversification strategies that are ecologicallysustainable should be pursued.TREE PLANTINGPlanting trees to promote intercropping, increase the number of economically-valuable trees (e.g., mango,shea, dawadawa), reduce soil erosion, increase fuelwood supplies, <strong>and</strong> promote a host of other benefits thatenhance livelihood security can be beneficial from an environmental <strong>and</strong> an economic st<strong>and</strong>point. A barrierto tree planting is the tree tenure system in northern Ghana. In interviews, we were told when a personplants an economically-valuable tree they do not own it; it is the property of the chief. The chief has the rightto its products, though he usually shares them with the person who planted the tree. L<strong>and</strong> <strong>and</strong> tree-tenuresystems can be a strong disincentive to tree planting <strong>and</strong> need to be considered <strong>and</strong> perhaps addressed if treeplanting programs are pursued.LIVESTOCK PRODUCTIONLivestock play a critical role in supporting the livelihood security of many households in northern Ghana.Food security increases with the number <strong>and</strong> diversity of livestock owned. Although of low value, poultry arerelatively low cost <strong>and</strong> maintenance <strong>and</strong> easily sold to help households respond to minor stresses. Goats,sheep, <strong>and</strong> pigs are more desirable but are more expensive to obtain <strong>and</strong> the first two require labor forherding. Livestock loan programs modeled on traditional practices in which relatives loan animals to kin whohave lost their herds or who wish to start new ones have been successful in some parts of Africa. Highpotential exists for developing livestock husb<strong>and</strong>ry as a <strong>climate</strong> <strong>change</strong> <strong>adaptation</strong> strategy in northernGhana.IMPROVING WATER INFRASTRUCTUREWater infrastructure in the Northern Region is relatively under-developed compared to the rest of thecountry. Access to adequate water supplies for drinking, household use, livestock, <strong>and</strong> farming is likely todecrease under <strong>climate</strong> <strong>change</strong> scenarios of increased temperature <strong>and</strong> current levels or decreases in rainfall.Improving water infrastructure could help improve household drinking water quality <strong>and</strong> health; reduce traveltime to water, freeing up labor; increase water supplies for livestock, an important factor limiting theirproduction; <strong>and</strong> increase water availability to support dry season household gardens <strong>and</strong> cash cropproduction. Before developing new water infrastructure, careful <strong>assessment</strong> should be made to avoid some ofthe pitfalls that have been encountered elsewhere in Africa <strong>and</strong> Ghana in association with water development(e.g., boreholes, poorly planned irrigation projects <strong>and</strong> water diversions, poorly planned large-scale agricultureprojects).IRRIGATION DEVELOPMENTAccess to wetter areas or irrigated plots for at least some crop production increases the livelihood security ofhouseholds in the northern savannas. Thus, irrigation development to support agricultural diversification bysmallholders may be desirable if done appropriately. Large-scale irrigation schemes are uncommon in thethree northern regions, though some irrigation schemes exist in Upper East. Irrigation development isexpensive <strong>and</strong> on a large-scale relies on high input farming; poor households may not be able to afford it. Italso has several risks: water management becomes more challenging, siltation can be a problem, soil quality<strong>and</strong> productivity can be decreased, existing l<strong>and</strong> uses are often displaced, herder-farmer conflict can beexacerbated, <strong>and</strong> disease-carrying insects may proliferate. A community-based approach to evaluate howGHANA CLIMATE CHANGE VULNERABILITY AND ADAPTATION ASSESSMENT 157
irrigation development can be implemented in a manner appropriate to the local context is desirable tominimize the associated risks.IMPROVING FOOD STORAGETraditionally, farmers in northern Ghana stored excess grains produced in good years to serve as a reserve inbad years (Dietz et al., 2004). Grains were stored for ≤3 years in some places (Van der Geest, 2004). Today,surplus grains produced in good years are more commonly sold to obtain cash or used to brew beer to selllocally. Grain storage can provide an important buffer against crop failures resulting from <strong>climate</strong> variability.Efforts to improve food storage facilities could help promote this practice but alone may be insufficient. Itmay also be necessary to exp<strong>and</strong> food production in order to create surpluses <strong>and</strong> to find alternative means ofgenerating cash to meet household monetary needs.ECOTOURISMEcotourism development in northern Ghana as a source of non-farm income generation has perhaps thegreatest potential around Mole National Park. About 33 communities border the park. A large, unrealizedpotential exists to develop ecotourism around Mole <strong>and</strong> to generate associated jobs in the park <strong>and</strong> insurrounding communities. The A Rocha Ghana project has helped two local communities developecotourism infrastructure. Our interviews with residents of one of these villages revealed that ecotourismgenerates some money, but if the money must be shared with all households in the community, it gets spreadtoo thin. The greatest benefits go to the people directly employed in tourism-related activities. Finding waysto best share the benefits of ecotourism development is one challenge that must be faced.COMMUNITY RESOURCE MANAGEMENT AREAS (CREMAS)Wildlife movements outside of Mole National Park boundaries are expected to occur under <strong>climate</strong> <strong>change</strong>scenarios which increase aridity. If local communities suffer more crop-raiding as a result, they may wish tokill wildlife. Animals are also more susceptible to poaching outside of park boundaries. In some parts ofGhana, CREMAs are established to give local communities a vested interest in wildlife <strong>and</strong> to help thembenefit economically from their conservation. CREMAs are places where the government devolves authorityto manage wildlife outside of national park boundaries to local communities. Communities develop wildlifemanagement plans, control hunting, <strong>and</strong> benefit from revenue generated by hunting <strong>and</strong> tourism within theirareas. Wildlife benefit because CREMAs create a buffer zone around parks that is otherwise lacking. The ARocha Ghana project has been active in helping communities around Mole develop CREMAs <strong>and</strong> integratenatural resource management activities into local production systems. CREMAs represent a positive <strong>climate</strong><strong>change</strong> <strong>adaptation</strong> strategy.IMPROVING MARKET CONDITIONSAs this chapter indicates, cash crop production is an important <strong>climate</strong> <strong>change</strong> <strong>adaptation</strong> strategy for farminghouseholds in northern Ghana. But road infrastructure <strong>and</strong> access to markets is relatively poor in the north.Investments in improving access to markets <strong>and</strong> roads would improve market conditions. A need also existsfor policies promoting stable <strong>and</strong> favorable crop prices. Better access to credit will also help farmers invest incash crop production. Projects in northern Ghana that focus on improving the entire value chain that linksfarmers to agricultural services <strong>and</strong> markets, for example the Ghana Agricultural Development <strong>and</strong> ValueChain Enhancement Program (ADVANCE), also hold promise.LOCAL PROCESSING FACILITIESLocal processing facilities are lacking or essentially so for agricultural <strong>and</strong> wild-harvested products.Establishing local processing facilities – for example, for producing shea butter or soybean oil – would makeit possible to manufacture value-added products that bring higher prices than the sale of raw products. Itwould also help create non-farm jobs.EDUCATIONNorthern Ghana has the highest rates of illiteracy in the country. In the Northern Region, 72.3 percent of thepopulation never attends school; in the Upper East Region, 69.4 percent never attends school; <strong>and</strong> in the158 GHANA CLIMATE CHANGE VULNERABILITY AND ADAPTATION ASSESSMENT
Upper West Region, 69.8 percent of the population never attends school (GSS, 2005a, 2005b, 2005c). Ofthose that do go to school, less than a quarter progress to secondary school. Investments in education enablepeople to develop skills <strong>and</strong> knowledge that can help them pursue off-farm livelihoods <strong>and</strong> work outside ofthe natural resource sectors, making them less vulnerable to <strong>climate</strong> <strong>change</strong> impacts. Education can also helpmigrants get better jobs in urban areas, earn more <strong>and</strong> increase remittances back home.CONCLUSIONGrowing population pressure in Ghana’s coastal <strong>and</strong> northern savanna regions, high social <strong>vulnerability</strong> to<strong>climate</strong> <strong>change</strong> in the north, <strong>and</strong> <strong>climate</strong> <strong>change</strong> impacts such as unpredictable rainfall <strong>and</strong> sea-level rise, havenecessitated that households, communities, <strong>and</strong> government respond to resulting livelihood vulnerabilitieswith insurance <strong>and</strong> coping strategies <strong>and</strong> livelihood <strong>adaptation</strong>s. The best of these <strong>adaptation</strong>s reducevulnerabilities <strong>and</strong> contribute to long-term sustainable livelihoods. Others serve to provide for the short termbut threaten the system’s long-term health. Development organizations have the opportunity to help bettercoordinate approaches to <strong>adaptation</strong> <strong>and</strong> ensure that best practices emerge as solutions.USAID’s Feed the Future program is well positioned to support <strong>climate</strong> <strong>change</strong> <strong>adaptation</strong> strategies thatincrease the livelihood security of households in Ghana’s coastal <strong>and</strong> northern savanna zones because of itsfocus on enhancing food security. Many of the activities proposed under Feed the Future directly address theopportunities for <strong>adaptation</strong> described here. It will be important to take a community-based approach indeveloping <strong>and</strong> implementing specific interventions to support both food security <strong>and</strong> <strong>climate</strong> <strong>change</strong><strong>adaptation</strong> to ensure that they are appropriate to the local context <strong>and</strong> will be beneficial.GHANA CLIMATE CHANGE VULNERABILITY AND ADAPTATION ASSESSMENT 159
9. CLIMATE CHANGEMITIGATION IN GHANA –OPPORTUNITIES ANDCHALLENGESClimate <strong>change</strong> mitigation – actions that either reduce or limit greenhouse gas emissions or increase carbonstorage in vegetation <strong>and</strong> soils – is critical in order to stabilize global <strong>climate</strong> <strong>change</strong>. A central focus of the2010 United Nations <strong>climate</strong> <strong>change</strong> conference in Cancun, Mexico, was to address the need for nationallyappropriatemitigation plans for developed <strong>and</strong> developing countries. This section provides an overview ofthe current status of <strong>climate</strong> <strong>change</strong> mitigation activities in Ghana, <strong>and</strong> associated opportunities <strong>and</strong>challenges. To date, most attention has been given to REDD+ (reduced emissions from deforestation <strong>and</strong>forest degradation, plus conservation co-benefits that enhance other ecosystem services); therefore, REDD+is the focus of this overview. Nevertheless, a number of other opportunities for <strong>climate</strong> <strong>change</strong> mitigationexist in Ghana, including the development of forest-based carbon offset projects under the Kyoto Protocol’sClean Development Mechanism; low carbon development projects, including low carbon agriculture;improved fire management; the capture <strong>and</strong> use of natural gas associated with offshore oil development (analternative to flaring); <strong>and</strong> the production of biofuels to replace fossil fuels. We address all of these activitiesbelow.CLEAN DEVELOPMENT MECHANISM PROJECTSThe Clean Development Mechanism (CDM) is one of two carbon offset mechanisms included in theinternational cap-<strong>and</strong>-trade system established by the Kyoto Protocol. The CDM enables developingcountries that are signatories to the Kyoto Protocol to develop carbon offset projects from which they earncertified emission reduction credits (each equivalent to 1 ton of carbon dioxide). These credits can be traded,sold, <strong>and</strong> used by industrialized countries to meet part of their emissions reduction targets under the KyotoProtocol. At the same time, the CDM aims to promote sustainable development in developing countries. TheCDM accepts certified emission reduction credits from several sectors: energy, industrial processes, solvent<strong>and</strong> other product use, waste <strong>and</strong> l<strong>and</strong> use, l<strong>and</strong>-use <strong>change</strong> <strong>and</strong> forestry. Regarding l<strong>and</strong> use, l<strong>and</strong>-use <strong>change</strong><strong>and</strong> forestry, afforestation, reforestation, <strong>and</strong> improved forest management projects qualify for CDM credits,but REDD+ projects do not.Ghana’s Designated National Authority (DNA) for CDM projects is the Environmental Protection Agency.The DNA has a governing council responsible for evaluating <strong>and</strong> approving CDM projects. According to thehead of the Climate Change Unit at Ghana’s Forestry Commission, Ghana’s CDM strategy focuses onintegrating CDM into its plantation development program. Although the government target for plantationdevelopment was 60,000 acres/year, Ghana has been unable to attract investment funding for plantationprojects, so the target has been reduced to 30,000 acres/year. The national plantation development programwould become part of a programmatic offset project using a bundling approach to reduce transaction costs<strong>and</strong> could include small projects. To date, only one CDM project has been advanced <strong>and</strong> passed through theCDM Project Design Document phase – a rubber plantation managed by Ghana Rubber Estates Limited inthe Western Region. Another plantation project is under development in a government forest reserve in160 GHANA CLIMATE CHANGE VULNERABILITY AND ADAPTATION ASSESSMENT
Brong-Ahafo Region that entails reforesting an area that is currently mostly grassl<strong>and</strong>. A Project DesignDocument is not yet completed for this project. No plan is developed as yet that identifies how the moneyearned by selling certified emission reduction credits will be distributed. However, the Ministry ofEnvironment recently established a carbon credit policy committee to help facilitate development of CDMprojects in Ghana <strong>and</strong> a policy for how the money generated by selling credits should be distributed.Ghana was a participant in the Capacity Development for the Clean Development Mechanism (CD4CDM)Project, established to help developing countries gain awareness of, obtain information about, <strong>and</strong> buildinstitutional capacity to implement CDM projects. Nevertheless, progress in developing forest carbon offsetprojects under the CDM in Ghana is hampered by a number of obstacles: (1) the rigorous nature <strong>and</strong> highcost of verification <strong>and</strong> compliance; (2) lack of financing to invest in plantation development <strong>and</strong> help meettransaction costs; (3) weak carbon markets; <strong>and</strong> (4) uncertainty over the future of the CDM once the KyotoProtocol expires in 2012. Some CDM-related concerns raised by people we interviewed in Ghana includedthe biodiversity impacts of plantation development, the cost <strong>and</strong> effort needed to maintain plantations onceestablished, the fact that CDM projects do not encourage real emissions reductions, <strong>and</strong> a belief that most ofthe money generated by the projects will be made by “middle men” who speculate in trading carbon creditson the carbon market, rather than to the country that develops the projects. For tracking up-to-dateinformation about the status of CDM projects in Ghana, please visit Ghana’s newly-established CDMwebsite: http://www.epa.gov.gh/cdm/index.htm.NATURAL GAS AND OFFSHORE OIL DEVELOPMENTIn Ghana, the issue of gas flaring from the Jubilee Oil field has created concern <strong>and</strong> controversy in civilsociety (e.g., Adam, 2011) <strong>and</strong> donor countries (van Tilburg <strong>and</strong> Würtenberger, 2010). Gas flaring is the directburning of natural gas at the oil production site. This is an extremely wasteful practice – acutely so, givenGhana’s ever increasing energy needs <strong>and</strong> dem<strong>and</strong>s. With increased international emphasis on curtailing thepractice, gas flaring globally has remained largely stable over the past 12 years, but still 134-162 billion m 3(BCM) are flared each year (data 2006-2010, World Bank, 2011). Nigeria, a nearby West African country, isthe second largest contributor to the flared gas totals in the world (behind Russia). The global gas flaringestimate of 168 BCM for 2006 represented 27 percent of the natural gas consumption of the United Stateswith a potential market value of US$40 billion. From a <strong>climate</strong> <strong>change</strong> perspective, flaring adds about 400million tons of carbon dioxide into the atmosphere each year. In terms of reducing greenhouse gas emissions,curtailment of gas flaring <strong>and</strong> use of the gas for fuel is seen as a practical <strong>and</strong> relatively low-hanging fruit(World Bank, 2011).Currently, the Jubilee Oil Field is the only developing offshore field in Ghana, <strong>and</strong> statements in the media byoil industry officials indicate it is in or nearing the initial stages of production (Adam, 2011). Other fields withoil producing potential will likely take 4-6 years to begin production. The target production level of theJubilee field is 120,000 barrels of oil/day <strong>and</strong> 120 units/day (MMscfd, million st<strong>and</strong>ard cubic feet) of naturalgas (Figure 9.1, Tullow Ghana Limited, 2009). Total projected production through the 2030 life expectancyof the field is about 760-1,140 billion cubic feet of natural gas at gas recovery levels of 40-60 percent,respectively. Of the daily gas production, about 20 units are planned to furnish power to the FloatingProduction, Storage, <strong>and</strong> Offloading (FPSO) vessel, which separates the oil <strong>and</strong> gas from the wells, <strong>and</strong> storesthe oil for shipping. Another 30 units of gas are planned to be re-injected into the wells to maintain reservoirpressure <strong>and</strong> enhance oil recovery. The remaining 70 units of natural gas are available for other uses such astransfer to an onshore processing plant (Tullow Ghana Limited, 2009). If the processing plant removes about20 percent of liquefied petroleum gas (LPG) <strong>and</strong> condensates, enough gas would remain to continuouslypower a 380 megawatt electric (MWe) modern gas power plant (3 terrawatt hours, TWh, annually), which isequivalent to about 35 percent of Ghana’s national electric grid production (van Tilburg <strong>and</strong> Würtenberger,2010).Given the substantial production, the gas from the Jubilee Oil Field will need to be stored, transported, orflared. The Environmental Impact Statement (EIS) for the Jubilee Oil Field development repeatedly statesGHANA CLIMATE CHANGE VULNERABILITY AND ADAPTATION ASSESSMENT 161
that flaringwill be short-term, minimal, <strong>and</strong> primarily related to safety <strong>and</strong> maintenance operations (TullowGhana Limited, 2009), <strong>and</strong> the government policy is zero gas flaring (van Tilburg <strong>and</strong> Würtenberger, 2010).The EIS also indicated a longer period of flaring will occur during the initial commissioningperiod of 3-6months asthe gas compression is brought to steady state (Fig. 9.1, Tullow Ghana Limited, 2009). Apparentlythis process is now ongoing according to oil industry statementss in the media a (Adam, 2011, quoting Mr.Thomas Manu, Director of Exploration <strong>and</strong> Production at the Ghana National Petroleum Corporation,GNPC).The EIS also indicated that during full oil production, ≤100 MMscfd could be re-injected into the oil fieldreservoir if necessary. As noted the 100 MMscfd figure is the full daily gas production less power needs forthe FPSO. However, the re-injection storage capacity has been questioned because of uncertainties of geology<strong>and</strong> reservoir operations. Further, theinfrastructure to pipe gas ashore will not be ready as oil productionisinitiated <strong>and</strong> ramped up(van Tilburg <strong>and</strong> Würtenberger, 2010). Oil industry officials indicated in the mediare-injection of gas after an 18-month period will not be possiblee at the Jubileee Field (Adam, 2011), but noexplanation was forthcoming. Hence, long-term gas flaring at the Jubilee Fieldmay be inevitable withouttaccelerateddevelopment of infrastructure for storage, shipping, <strong>and</strong> processing of the gas.Figure 9.1 Estimated peak, average, <strong>and</strong> flaringg weekly volumes of natural gas(From Jubilee Oil Field, Ghana (Tullow Ghana Limited 2009) Note projected decrease in gas flaring about 18 weeks after oilproduction ramp up based on re-injection <strong>and</strong> off-site processing of gas of about 30 <strong>and</strong> 700 MMscd. Respectively)It is critical to re-emphasize that no infrastructure is in place to transport the gas from the FPSO althoughtime to first oil is apparently close (Adam, 2011). Minimally, a pipeline to the shore, a processing plant, <strong>and</strong> apower plant are needed to use the gas. The lead time for this infrastructure todevelop is ≥3-4 years afterthedecision togo forward has been made (Tullow Ghana Limited, 2009; van Tilburg <strong>and</strong> Würtenberger, 2010).Ghana didd recently announce a gas development joint venture partnership (Reuters, 2011); if this means rapidprogress an operational natural gas transport <strong>and</strong> processing infrastructure could not be expected until 2014(or even later). Existinginfrastructureplans vary from the basic combination of pipeline, processing plant <strong>and</strong>power plant to more extensive plans of connectingto the West African Gas Pipeline in Takoradi (Tullow162 GHANA CLIMATE CHANGE VULNERABILITY AND ADAPTATION ASSESSMENT
Ghana Limited, 2009). Given the confirmed gas finds to date, the gas could only supply an initial basicconfiguration. An alternative to pipeline transport is the construction of an offshore LNG processing plantwith shipping of the LNG gas. However, the high cost of LNG plants has limited their use globally. The leadtime for an LNG plant is significant, <strong>and</strong> the amount of gas currently expected in Ghana is not sufficient toeconomically justify an LNG plant (Tullow Ghana Limited, 2009; van Tilburg <strong>and</strong> Würtenberger, 2010).Prolonged gas flaring, the risk of which appears high at this point, of the Jubilee natural gas would produceabout 1.5 million tons of CO 2 annually or about 7 percent of Ghana’s total national emissions. If the gas isnot flared but is used in a power plant, >13,000 barrels of oil/day are saved <strong>and</strong> 0.9 million tons of CO 2emissions are avoided. The total emissions reduction potential from using the gas for power productioninstead of flaring is 2.4 million tons CO 2 equivalent or 10 percent of national emissions. Further emissionreductions could be realized by domestic use of liquefied petroleum gas if it replaces diesel generation (vanTilburg <strong>and</strong> Würtenberger, 2010). Unfortunately, if the gas infrastructure development takes four years tobecome reality <strong>and</strong> high re-injection capacities are not feasible, the life of this valuable gas field will bereduced by about 20 percent (16 versus 20 years, Tullow Ghana Limited 2009), an estimated 152-228 billionst<strong>and</strong>ard cubic feet of gas will be lost for energy production, <strong>and</strong> some 6 million tons of CO 2 will be released.GHANA CLIMATE CHANGE VULNERABILITY AND ADAPTATION ASSESSMENT 163
10. ENERGY SECTORSOCIAL IMPACTS OF OIL AND GAS DEVELOPMENTThe coast makes up 2-7 percent of Ghana’s l<strong>and</strong> mass <strong>and</strong> holds roughly 25 percent of the country’spopulation (Dontwi et al., 2008a). District growth rates along the coast range from 1.0 percent to 4.4 percentannually, indicating that the most rapidly growing areas are on track to double their populations in the next 16years. Coastal inhabitants depend primarily on marine fisheries for their livelihoods (Dontwi et al., 2008a;CRC, 2010). However, the tourism industry has been rapidly growing over the last decade <strong>and</strong> currentlysupports about 319,000 jobs (5.9 percent of the country’s total employment) <strong>and</strong> constitutes an estimated 6.7percent of Ghana’s national GDP (WTTC, 2011). Many residents anticipate that oil <strong>and</strong> gas developmentwill play a large role in both local revenue <strong>and</strong> employment in the future; however, the full complement ofimpacts of the oil <strong>and</strong> gas industry have yet to be realized (Quagraire, 2011). Local governments (in the formof both district <strong>and</strong> regional assemblies) <strong>and</strong> chiefs located in coastal areas anticipate that they may receive ashare of the revenues generated by the oil <strong>and</strong> gas industry. Thus far the government has not agreed to anyform of benefit sharing with local communities, <strong>and</strong> the issue remains contentious.According to Publish What You Pay, a civil society coalition based in Accra, the Ghanaian governmentcommitted to having 80 percent of managerial positions in the oil <strong>and</strong> gas sector filled by Ghanaian citizensfive years after beginning production from the Jubilee Oil Field. Due to a lack of technical expertise <strong>and</strong>capacity to develop the expertise, this quota is far from being met. The few local employment opportunitiesavailable so far have been labor intensive jobs such as janitorial work (Adam, 2011; Quagraire, 2011). Coastalresidents are beginning to express concern not just over the lack of local hiring, but also over the lack ofavailable technical training opportunities. No local institutions are capable of teaching necessary skills <strong>and</strong> notraining opportunities are provided by either the government or Kosmos Energy (Adam, 2011; Quagraire,2011).Meanwhile, in the absence of employment opportunities associated with the oil <strong>and</strong> gas industry, coastalresidents have expressed concern over the long-term viability of their present livelihoods. Fishers complainthat their catch is reduced, <strong>and</strong> while not attributable exclusively to oil <strong>and</strong> gas development, it is noteworthythat increasing numbers of fishers report an oil sheen on the sea surface or dead wildlife (e.g., dead whale) offthe coast of the Western Region. More troublesome, fishers complain that their nets are seized when theyunknowingly cross into waters zoned for the oil field, making it impossible for them to continue fishing <strong>and</strong>make any necessary payments to the bank (Adam, 2011; Quagraire, 2011). On shore, fledgling resortoperators worry that pollution from gas flaring, potential oil spills or general industrial development willdetract from tourism, <strong>and</strong> residents complain that l<strong>and</strong>lords are increasing rents as they anticipate that oil <strong>and</strong>gas workers can afford to pay more (Adam, 2011; Quagraire, 2011).In response to these potential disruptions, <strong>and</strong> the potential costs of long-term environmental damage thatcould arise from a spill, chiefs <strong>and</strong> local governments in the Western Region have asserted that they deserve ashare of the revenue generated by the oil <strong>and</strong> gas industry. In early 2010 local chiefs b<strong>and</strong>ed together <strong>and</strong> puta unified request before Parliament that the state grant 10 percent of all revenue to the region, to bedistributed between the district assembly <strong>and</strong> the stool l<strong>and</strong>s (Adam, 2011; Quagraire, 2011). This follows theprecedent set forth by the mining industry, whereby local chiefs <strong>and</strong> district assemblies surrounding stateownedmines are granted a share of the profits, to be distributed throughout the district. The centralgovernment has not been happy with this system, feeling it leaves too much room for corruption at the locallevel. Parliament rejected the request put forward by the chiefs, <strong>and</strong> has stipulated that revenue should godirectly into a central government account to be spent on high priority development areas, including thecoast. It remains to be seen how this money will be distributed in actuality, <strong>and</strong> what social impacts it willhave at the national or local level. Thus far the lack of transparency in the process threatens to undermine any164 GHANA CLIMATE CHANGE VULNERABILITY AND ADAPTATION ASSESSMENT
positive impacts, <strong>and</strong> has upset communities along the coast who argue that they bear the higher costs of oil<strong>and</strong> gas development without receiving any of the benefits (Adam, 2011; Quagraire, 2011). Still, communitiesremain hopeful that they might eventually see some benefit from these revenues. There is, however, growingresentment towards the industry over the impact it has had on the local way of life, <strong>and</strong> frustration over lackof employment opportunities to date. There is also a growing fear that Ghana will replicate the errors ofcountries such as Libya <strong>and</strong> Nigeria when it comes to managing oil <strong>and</strong> gas revenues.CLIMATE CHANGE IMPACTS ON THE ENERGY SECTORCOASTAL EROSION AND SEA-LEVEL RISE EFFECTS ON OIL AND GASThe combined effects on the oil <strong>and</strong> gas sector of Ghana of ongoing coastal erosion <strong>and</strong> <strong>climate</strong> <strong>change</strong>inducedsea-level rise are for the most part uncertain. Even so, obviously the highest risk will be forinfrastructure <strong>and</strong> associated facilities located close to the coast or low-lying coastal lagoons or river estuaries.Historic shoreline rates of <strong>change</strong> in complex <strong>and</strong> dynamic large-scale coastal systems, such as the currentlyeroding coastline of Ghana, cannot be assumed to continue into the future (Lakhan, 2005). Recentacceleration in sea-level rise due to global warming is evident <strong>and</strong> at the upper boundary (worst-case) of initialprojections (Rahmstorf et al., 2007). With the expectation that sea-level rise will continue for centuries (IPCC,2007), future coastal recession can generally be expected to accelerate relative to the recent past (Addo et al.,2008).Coastal erosion is a long recognized, widespread problem <strong>and</strong> concern along most of the Ghanaian coastline(e.g., Ly, 1980; Tsidzi <strong>and</strong> Kumapley, 2001; Addo et al., 2008; Addo, 2009; CRC-URI, 2010). Crude estimatesderived from aerial photographs in the mid-20 th century indicated coastal recession was most severe along theeastern coast of Ghana (Keta, Ada on the Volta Delta), moderately severe along the central coast (i.e., Accra),<strong>and</strong> least severe in the west (Sekondi, Cape Coast) (Ly, 1980; Tsidzi <strong>and</strong> Kumapley, 2001). However, theseunderlying rates, if accurate, are likely primarily related to natural conditions (e.g., geology, longshore currents,wave action), but recent human interventions (e.g., vegetation destruction, dams, poorly placed breakwaters,groynes, or gabions, uncontrolled s<strong>and</strong> mining or s<strong>and</strong> winning activities) also have accelerated or directlycaused coastal erosion in all these areas (Ly, 1980; Mensah, 1997; Tsidzi <strong>and</strong> Kumapley, 2001; Campbell,2006; CRC-URI, 2010).A recent carefully quantified estimate of coastal erosion was made for three sections of the coast at Accrausing bathymetry maps <strong>and</strong> aerial photographs from 1904-2002 (Addo et al., 2008, 2009), which can illustratepotential <strong>change</strong>s elsewhere in Ghana. Although highly variable along the included coastal sections, theaverage rate of historical coastal erosion was 1.13 m/yr (range, 0.05-1.86 m/yr) with 82 percent of thecoastline eroding. When projected increases in sea-level were modeled (2-6 mm/yr) with erosion <strong>and</strong>projected into the future, coastal recession increased in all study sections. For example, one section withhistorical erosion rates of 1.15 m/yr is projected to increase to 1.47-1.63 m/yr with rising sea level. Simplyput, in 50 years that coastline is projected to recede by 74-82 m. Global <strong>climate</strong> models estimate sea-levelsalong Ghana will increase 8.6 cm (range, 3.8-14.4) by 2030, 12.0 cm (5.5-20.2 cm) by 2040, <strong>and</strong> 34.5 cm (161-58.4 cm) by 2080 (Minia 2008; see Chapter 3). Exactly how these two phenomena, coastal erosion <strong>and</strong> sealevelrise, might interact is not fully understood, but even taken singly, future effects will obviously be felt first<strong>and</strong> be most severe in the lowest lying coastal areas (IPCC, 2007; Addo et al., 2008; Addo, 2009).The analyses made for Accra provide a basis for what to expect in other areas of Ghana, like the port ofTakoradi, the l<strong>and</strong>-based center of the Jubilee Oil Field development. Clearly, placement of infrastructure(port facilities, pipelines, storage, processing, <strong>and</strong> other physical structures) in Takoradi should be made withthe risk of coastal erosion <strong>and</strong> inundation fully <strong>and</strong> seriously considered. Likewise, establishment of actualrates of erosion along the coast of Ghana is clearly needed to reduce uncertainty about future <strong>change</strong>s as thecoast line advances through developed areas (e.g., housing, commercial <strong>and</strong> industrial centers, roads) inTakoradi <strong>and</strong> other coastal communities. Such information is also needed to help prioritize areas that areGHANA CLIMATE CHANGE VULNERABILITY AND ADAPTATION ASSESSMENT 165
projected to be the firstor most affected <strong>and</strong> select technically appropriate <strong>and</strong> feasible mitigation actions(Addo et al., 2008; Addo, 2009).CLIMATE CHANGE AND HYDROPOWERGhana is highly dependent on hydropower for its electrical supply, <strong>and</strong> the vast majority ofthat energy isderived from Akosombo dam <strong>and</strong> the smaller downstream Kpong dam on the Volta River. These dams lieabout 100 km from the Volta River estuary in southeastern Ghana. Lake Volta, the large impoundmentbehind Akosombo dam, covers 8,5000 km 2 at full supply level or about 4 percent of the l<strong>and</strong>area of Ghana(Andreini et al., 2000; van de Giesen et al., 2001; Lemoalle <strong>and</strong> Condappa, 2009). These two hydropowerrfacilities atfull generating capacity provide 1,180 megawatts (total annual capacity of 6,100 GWh <strong>and</strong> actualproductionof 4,800 GWh dependingon water levels, Lemoalle <strong>and</strong> Condappa, 2009), which represents >95percent ofGhana’s power supply. Electricity from the dams is also sold to neighboring countries (Andah<strong>and</strong>Gichuki, 2005). The Bui dam, on the Black Volta, now under construction, will impound 440 km 2 <strong>and</strong> isdesigned to provide 980GWh/yr under optimal operating conditions (Lemoalle <strong>and</strong> Condappa, 2009).Water levels (<strong>and</strong> volumes) on the lake are critical to hydropower production. . If water levels of Lake Voltaare 40 km3 /yr. Low, irregular flowsofrecent decades (36.5 km3 /yr, 1985-2000) lowered generating capacity. Past droughts have lowered water levelsenough inLake Volta tocause national power disruptions for industry <strong>and</strong> urban consumers (rollingblackouts,12 h withoutt power every other day). Media accountss indicate 2007low lake levels shutdownmining operations <strong>and</strong> major aluminum smelters (Valco), increased use of diesel or gasolinegenerators bybusinessess <strong>and</strong> consumers, <strong>and</strong> even motivated plans to build private coal-fired power plants (Harvey, 2007).Sources: Lemoalle <strong>and</strong> Condappa, 2009Figure 10.1 Water levels (m) in Lake Volta since dam in 1965(Note the minimum operating level forpower production at Akosombo dam is 71.8 m.The distribution of the basin in riparian countries, dam construction, <strong>and</strong> the overall water balance of theVolta River Basin informthe complexity <strong>and</strong> potential precariousness of the situation fromthe st<strong>and</strong>point ofwater supply to the hydropower dams in Ghana (van de Giesen, , 2001). About 43 percent of the Volta River166 GHANA CLIMATE CHANGE VULNERABILITY AND ADAPTATION ASSESSMENT
Basin (total area 416,382km 2 ) lies north of Ghana in Burkina Faso within thee Sudan Savanna Zone (Sudano-Sahelian zone), a naturally more arid region (about500-990 mm/yr) than the Guinea Savanna Zone of GhanaNicholsonet al., 2000; Lemoalle <strong>and</strong> Condappa, 2009). The Basin covers 63 percent of Burkina Faso.Another 40 percent of the Basin is inGhana, covering about 63 percent of that country, mostly in the GuineaSavanna <strong>and</strong> Forest-Savanna Transition zones. Other riparian countries in thee basin include Togo (6 percent),Benin (4 percent), Côte d’Ivoire (3 percent) <strong>and</strong> Mali (4 percent) ).Three main tributaries comprise the Volta River basin. The Black <strong>and</strong> White (including theRed) Volta Riversflow fromBurkina Fasointo Ghana <strong>and</strong> supply 19percent <strong>and</strong> 24 percent of f the water behind Akosombodam, respectively. Eventhough smalll relative to the Black <strong>and</strong> White Volta river sub-basins, the Oti River,flowing from Benin through BurkinaFaso <strong>and</strong> Togo into Ghana, supplies about 28-44 percent of the lake’swaters (Andreini et al., 2000; Andah <strong>and</strong> Gichuki, 2005). The lower Volta River sub-basin (tributaries inGhana) supplies the remaining 24 percent to the impoundment.Increasingpopulation size <strong>and</strong> a prolonged period of decreased rainfall <strong>and</strong> recurring drought (Figure 10.2) inthe late 20th century (Nicholson et al. , 2000; Andah<strong>and</strong> Gichuki, 2005; Andahet al., 2005; Kasei, 2009), led toa proliferation of dams in the Volta River Basin adding further complexity to managing water for hydropowergenerationn in Ghana. Benin has a 15-megawatt hydroelectric power station onthe Oti River (storage capacity,350 million m 3 ) <strong>and</strong> another is planned (Andah <strong>and</strong>Gichuki, 2005). In recent t decades, Burkina Faso hastremendously increasedthe number of dams in theVolta River Basin to an estimated 600 dams with a storagecapacity of 4.7 billion m 3 . Two hydropower dams exist (Bagre, 65 GWh/yr, Kompienga, 19GWh/yr) <strong>and</strong>two more are planned (Nooumbiel, 203 GWh/yr; Sam<strong>and</strong>eni, 17 GWh/yr, upper Black Volta basin).Notably, 1,000s of dugouts <strong>and</strong> smalll reservoirs exist in Burkinaa Faso <strong>and</strong> northeastern Ghana (Lemoallee <strong>and</strong>Condappa, 2009). Côte d’Ivoire has 43 minor dams with a storage capacity off 2.97 million m 3 , Togo has fivedams in the Basin (volume, 33.6 million m 3 ), <strong>and</strong> Mali has one significant dam, Pont-barrage of Baye.Notably, even though the Volta River Basin is critical for meeting water <strong>and</strong> power dem<strong>and</strong>s in Ghana <strong>and</strong>several riparian countries (especially already arid Burkina Faso), no inter-country agreementis in placeconcerning water allocation in the Basin (Andah <strong>and</strong> Gichuki, 2005).Source: Lemoalle <strong>and</strong> Condappa, 2009Figure 10.2 Variation of rainfall since 1900, 4 locations in the Volta River Basin(The deviation from each decadal mean is expressed as a percentage of the long-term 100-yr average. After a wet periodfrom1950-70, rainfall consistently remained below the long-termaverage. Akosombo dam hydropower facilities were designedd basedon much wetter conditions than experienced since 1970)GHANA CLIMATE CHANGE VULNERABILITY ANDADAPTATIONASSESSMENT167
Water balance models indicate for the Basin as a whole that small <strong>change</strong>s in rainfall totals (negative orpositive) can produce large <strong>change</strong>s inrunoff totals (negative or positive) (Andreini et al., 2000; Lemoallee <strong>and</strong>Condappa, 2009). For example, meanrunoff between 1936-19611 (pre-Akosombo dam closure) <strong>and</strong> 1965-1998 decreased between8-14 percentin response to a small, 5 percent decrease in Basin rainfall. The modelsalso indicate that only about 9 percent of the rain falling in the basin appears in Lake Voltaas runoff. Otherevaluations indicate a 10percent <strong>change</strong> in annual rainfall produces a 39 percent <strong>change</strong> in river inflow intothe Lake Volta (Figure 10.3; Lemoallee <strong>and</strong> Condappa, 2009). Hence, shifts in l<strong>and</strong> use, water storage or use,or <strong>climate</strong> vagaries that have relativelysmall impacts on water flux through the upl<strong>and</strong> areas (e.g., a <strong>change</strong> inevapotranspiration of a few percent) can result in large <strong>change</strong>s in percentage of runoff reaching the lake.Again, thisalso emphasizes the potential risk to hydropower production with increases in temperatures (<strong>and</strong>evaporation) <strong>and</strong> decreased or highlyvariable rainfall induced byy <strong>climate</strong> <strong>change</strong>.Source: Lemoalle <strong>and</strong> Condappa, 2009Figure 10.3 Observed inflows to Lake Volta as a function of rainfall, 1985-1999Water flowing through the Akosombo Dam increased from 28 km³/yr to 35 km³/yr in the1990s, an increaseof 25 percent (Andreinii et al., 2000). As dem<strong>and</strong> for electricity increases, the temptation to generate power athigher rates may trump concerns over drought or storage deficits. Because off drought deficits in the 1980s<strong>and</strong> continued power generation, Lake Volta levelsnever recovered to optimal operating conditions in the1990s (van de Geisen et al., 2001; Kasei, 2009, Figure 10.4). Thee mean volume stored in the reservoir inthe1970s was132 km³ but in the 1980s <strong>and</strong> 1990s themean volumee was 102 km³, a reduction of 20 percent(Andreini et al., 2000).The response of Lake Volta to relatively small <strong>change</strong>s in runofff is also demonstrated in hydrologicalmodeling. Hydrologicall model runs (WEAP software) were aimed at assessingeffects of <strong>climate</strong> <strong>change</strong> <strong>and</strong>upstream reservoir storage on water levels <strong>and</strong> power generatingg capabilities in Lake Volta (de Condappaa etal., 2008, 2009; Lemoalle <strong>and</strong> Condappa, 2009). Twenty-year scenarios (with 2000 as the initial condition)were simulated under wetter (meteorological CRU grids shifted 1° north) <strong>and</strong>warmer (2° C increase)conditions, drier (grids shifted 1° south) <strong>and</strong> warmer conditions, warmer conditions, <strong>and</strong> reference condition(no <strong>change</strong> from 1980-2000 conditions) (Figure 10.4). The scenario of increased temperature affected LakeVolta by slightly reducing the water level, but the scenarios withh <strong>change</strong>d rainfall had a much more dramatic168 GHANA CLIMATE CHANGE VULNERABILITY AND ADAPTATION ASSESSMENT
effect. In the drier scenario, the waterlevel of lake is low <strong>and</strong> most often below the level atwhichhydropower productionis impossible. The wetter scenarios pushh lake levels tonear maximal operatingcapacities. In the reference (or no <strong>change</strong>) scenariotarget releases were met but storage was close toinadequate. Similar sensitivity to <strong>climate</strong> variability was indicatedd in another hydrological simulation(Leemhuiset al., 2009) <strong>and</strong> <strong>assessment</strong>s focused onthe Black Volta basin (i.e., Bui dam project, Laube et al.,2008) predict reduced water availability from reduced seasonal rainfall <strong>and</strong> river flows which will beexacerbated by higher temperatures <strong>and</strong> evapotranspiration. These factors, apparently not accounted forindam planning <strong>and</strong> design, could negatively affect the hydropower operations at Bui dam (Biney, 2010).Interestingly, in another20-year modeling scenario, small upstream reservoirss with a steadystate annualincrease of 10 percent were projectedto reduce Lake Volta inflows by about 3 percent at the end of 20 years.This is a small impact on power production relative to present variability in storage volumeor to possible<strong>change</strong>s caused by <strong>climate</strong> <strong>change</strong> (Lemoalle <strong>and</strong> Condappa, 2009) but is nevertheless a reduction in powergeneratingg capacity. A question remains of whether the 10 percent annual increase in upstream reservoirrcapacity isan under-or over-estimateof water development in northern Ghana <strong>and</strong> ripariancountries in thenext 20 years.Source: Condappa et al. 2009, Lemoalle <strong>and</strong>Condappa 2009Figure 10.4 Simulation of water storage in Lake Volta undera reference conditionn(No <strong>change</strong>from 1980-2000) <strong>and</strong> three scenarios of <strong>climate</strong> <strong>change</strong>. The black line labeled “Top of inactive (70 km 3 )” indicatesthe storage level at which hydropower generation is impossible at Akosombo dam <strong>and</strong> thee one labeled “Storage capacity (148km 3 )” is thecapacity of Lake Volta at full pool)Clearly theissue of future hydropower production from Akosombo (<strong>and</strong> Kpong) dams is complex, notsimplistically related to potential <strong>climate</strong> <strong>change</strong>, <strong>and</strong> is replete with transboundary implications. First, thewater development focus between the two major countries in the Volta Riverr Basin is fundamentallydifferent. Burkina Faso has <strong>and</strong> is concentrating effort in the Basin on improved use <strong>and</strong> increased retentionof water for agriculture with dem<strong>and</strong>s in that country (as well ass northern Ghana) expectedto increaseGHANA CLIMATE CHANGE VULNERABILITY ANDADAPTATIONASSESSMENT169
apidly. In contrast, Ghana’s primary objective is to keep Lake Volta at optimal levels for power production.Clearly potential exists for major conflict. Second, past meteorological data <strong>and</strong> hydrological modelingindicate water levels in Lake Volta are highly sensitive to even small <strong>change</strong>s in rainfall. Rainfall projections ofglobal <strong>climate</strong> models are mixed adding to the uncertainty; however, trends from historical data indicate fairlydramatic decreases from long-term averages. Third, the design of Akosombo dam was premised on one ofthe wettest periods on record affecting optimal power production even during relatively short or modest dryperiods in an inherently variable precipitation regime. Fourth, water allocation agreements are lacking amongGhana <strong>and</strong> the other riparian countries in the Volta River Basin. Finally, the future power production atAkosombo dam clearly will affect Ghanaian choices of alternate energy sources (i.e., fossil based oralternative) in an attempt to meet shortfalls <strong>and</strong> ever increasing dem<strong>and</strong>.SOCIAL IMPACTS OF PRESENT AND FUTURE HYDROELECTRIC DEVELOPMENTIn Ghana, dams have been a major feature of post-colonial development. The construction of the Akosombodam was part of Ghana’s “Ten Great Years,” a national development plan intended to “rapidly modernize<strong>and</strong> transform an agrarian economy to an industrial-based economy […] within a generation.” (Alhassan2009, 151). Today, most Ghanaians recognize the Akosombo dam as the core of Ghana’s socio-economic<strong>and</strong> industrial development. The widely perceived success of the Akosombo dam has led to the establishmentof the smaller Kpong dam, <strong>and</strong> the Bui dam, now under construction. Climate <strong>change</strong>, <strong>and</strong> the increasingcost of crude oil, has led to a re-emphasis on hydroelectric power as a way to reduce global carbon emissions(Alhassan 2009). There are indeed benefits to hydro power, but there are also serious social costs that shouldbe considered.The chief social benefit of the Akosombo Dam was the provision of power to more than half of Ghana,making the nation one of the most industrialized countries in West Africa (Energy Commission 2005).However the construction of the dam also created Lake Volta, the world’s largest artificial lake (8,520 squarekilometers), <strong>and</strong> caused the forced resettlement of 80,000 people (Chambers 1970, Raschid et al.). Villages onthe lake’s periphery suffered a loss of fertile farming l<strong>and</strong>s <strong>and</strong> forests, as well as a host of other ecological<strong>and</strong> health-related problems created by the flooding. Water borne diseases (such as bilharzias, river blindness,malaria, <strong>and</strong> schistosomiasis) became common around the lake: for example, prior to the dams constructionschistosomiasis affected 1-5 percent of the population, but by 1979 the disease affected 75 percent of lakesideresidents (Gorman & Werhane 2008). Downstream, lucrative livelihood activities, such as creek fishing <strong>and</strong>clam digging, were entirely eliminated (Tsikata 2006). Farming along the river was previously structuredaround seasonal cycles of floods which deposited nutrient-rich silts along the floodplains. After theconstruction of the dam downstream floods were interrupted <strong>and</strong> agricultural production, livestock rearing,<strong>and</strong> fishing virtually collapsed (Rahaman et al. 2004, Rubin et al. 1998, Gorman & Werhane 2008). Theselosses were largely ignored in the years following the dam’s construction. Resettled communities did notreceive much governmental support (Chambers 1970), <strong>and</strong> did not even receive power from the dam until2001. Programs intended to offer assistance to individuals residing downstream <strong>and</strong> on the lake’s peripherywere often the first to experience budgetary reductions (Tskikita 2006). This lack of attention can perhapshelp explain the low economic activity <strong>and</strong> high poverty rates found in resettled areas (Alhassan 2009).Given the social impacts of the Akosombo dam on local communities, one would expect residents in thevicinity of the Bui Dam (currently under construction) to feel extremely apprehensive. Some stakeholders,largely conservation groups <strong>and</strong> non-governmental organizations, have expressed concerns centered on theloss of biodiversity <strong>and</strong> l<strong>and</strong> to flooding in Bui National Park (estimates anticipate that 21 percent of the parkwill be flooded). Groups also express concern over the social implications that will arise from resettling the2,500 people currently living in the area, perceived negative impacts on fishing <strong>and</strong> agriculture (resulting fromerosion, sedimentation, <strong>and</strong> altered flow of the river), increased health risks from water borne diseases, <strong>and</strong> aninflux of guest workers during construction to compete with for employment (Alhassan 2009, Raschid et al.20XX). However, interestingly, despite these concerns, field interviews conducted in communities likely to beimpacted by the flooding suggest that the Bui Dam is perceived as, “a socio-economic instrument fortransforming their society <strong>and</strong> the country.” (Alhassan 2009, 154).170 GHANA CLIMATE CHANGE VULNERABILITY AND ADAPTATION ASSESSMENT
Communities are, rightly or wrongly, anticipating benefits ranging from investments in schools, healthfacilities, <strong>and</strong> roads (which would make the area more accessible to the rest of the country <strong>and</strong> enableresidents to access broader commercial markets), increased employment opportunities as the dam isconstructed, anticipated improvements in fisheries <strong>and</strong> agriculture, <strong>and</strong> superior accommodation optionsavailable in resettlement villages (Alhassan 2009). This response is undoubtedly linked to the proximity ofthese local communities to Bui National Park (BNP). Communities in the area were “unanimous that theBNP was not beneficial to them because they did not have access to its resources, as it is a strict conservationarea which limits their economic activities. [The Bui Dam] will ‘serve the nation <strong>and</strong> the communities betterthan the park’” (Alhassan 2009, 155). Despite the many identified environmental <strong>and</strong> socio-economic issuespresented by the establishment of large dams, the generally positive response of Ghanaians to new <strong>and</strong>existing projects suggests that the public still sees a place for hydroelectric power in Ghana’s future, whileemphasizing the need for better education regarding the costs <strong>and</strong> benefits of hydro projects.GHANA CLIMATE CHANGE VULNERABILITY AND ADAPTATION ASSESSMENT 171
11. OPTIONS FOR USAIDPROGRAMMINGMAINSTREAMING CLIMATE CHANGEIncorporating or “mainstreaming” <strong>climate</strong> <strong>change</strong>, <strong>climate</strong> variability, <strong>vulnerability</strong>, <strong>and</strong> <strong>adaptation</strong> intoUSAID programming offers many opportunities for USAID to help the GoG prepare for the future. Thesuggestions summarized below (Table 11.1) are based on the analyses conducted by the Assessment Team.Many of the options are multi-level, in that the <strong>vulnerability</strong> addressed will have to be attacked at severallevels within Ghanaian society. Underlying all the options is a need to address the disconnect betweencustomary <strong>and</strong> statutory rights in l<strong>and</strong> that precludes improvements in many aspects of food security <strong>and</strong>environmental management. Without secure rights to l<strong>and</strong>, smallholders lack incentives to adopt newtechnologies, invest in agricultural improvements <strong>and</strong> are unable to access the resources needed to increasecrop productivity because they cannot obtain operating capital at less than usurious interest rates.We categorize intervention options into five types of barriers to <strong>climate</strong> <strong>change</strong> <strong>adaptation</strong> <strong>and</strong> mitigation:Policy Environment, Governance <strong>and</strong> Tenure, Capacity <strong>and</strong> Infrastructure, Information <strong>and</strong> Analysis, <strong>and</strong>Awareness <strong>and</strong> Implementation. Under each barrier, we briefly indicate intervention options <strong>and</strong>parenthetically identify USAID programs as we underst<strong>and</strong> them that could address that intervention(FtF=Feed the Future, Edu=Education, H&S=Health <strong>and</strong> Sanitation, Dem/Gov=Democracy <strong>and</strong>Governance, Gen=Gender). Options could have certainly been categorized differently, but the purpose is tocommunicate important information the Assessment Team gleaned regarding potential interventions.Additional ideas for intervention in the agricultural sector are contained in Table 5.6.The policy environment barrier exposes vulnerabilities in areas directly <strong>and</strong> indirectly relevant to <strong>climate</strong><strong>change</strong>. Decided vulnerabilities arise from uncoordinated responses to <strong>climate</strong> <strong>change</strong>. Options forintervention include supporting the completion <strong>and</strong> implementation of the Ghana National Climate ChangeStrategy, focus in that strategy on <strong>adaptation</strong> responses <strong>and</strong> incorporation of <strong>climate</strong> <strong>change</strong> in urbanplanning efforts (FtF, Edu, H&S, Dem/Gov, Gen). A national energy policy is needed that includes <strong>climate</strong><strong>change</strong> mitigation <strong>and</strong> low emission strategies (i.e., advanced biofuels development, capturing not flaringnatural gas) (Dem/Gov, FtF). Integrated national <strong>and</strong> regional level coastal development <strong>adaptation</strong> planningis needed to address sea-level rise <strong>and</strong> coastal erosion (Dem/Gov, Edu, FtF). The FtF program focuses withjustification on the northern regions, but other areas exhibit high social <strong>vulnerability</strong> to <strong>climate</strong> <strong>change</strong>indicating need for a more targeted, district-based approach (i.e., expansion to Brong-Ahafo <strong>and</strong> Voltaregions). Indirectly but most certainly related to <strong>climate</strong> <strong>change</strong> are uncoordinated policy responses to waterallocation among riparian countries in the Volta Basin (FtF, Dem/Gov) <strong>and</strong> lack of integrated firemanagement <strong>and</strong> regionally adapted policies (including traditional practices) focused on managingenvironmentally destructive fires (FtF, Dem/Gov). Because farmers need stable <strong>and</strong> favorable crop prices tomake commercial crop production profitable, a favorable policy environment is needed for cash cropproduction (FtF).The governance/tenure barriers <strong>and</strong> the associated vulnerabilities to <strong>climate</strong> <strong>change</strong> <strong>adaptation</strong> <strong>and</strong> mitigationin Ghana were viewed by the Team as overarching, keystone issues not only in the <strong>climate</strong> <strong>change</strong> arena butin development generally <strong>and</strong> FtF specifically. Key interventions include advocating for examination of l<strong>and</strong>tenure <strong>and</strong> property rights issues at the community level, capacity building with traditional l<strong>and</strong> managementauthorities (e.g., chiefs, Tendanas) for transparency <strong>and</strong> equality in l<strong>and</strong> use practices, <strong>and</strong> a nationalexamination <strong>and</strong> correction of tree tenure issues that result in perverse, counterproductive incentives against172 GHANA CLIMATE CHANGE VULNERABILITY AND ADAPTATION ASSESSMENT
carbon sequestration <strong>and</strong> maintenance <strong>and</strong> creation of forests (all FtF, Dem/Gov, Gen). Retention of carbonbenefits at the national level without local benefits sharing creates yet another perverse incentive systemaffecting carbon sequestration. Advocacy is needed for legislation defining carbon rights to provide equity tosmallholders (FtF, Dem/Gov, Gen).The l<strong>and</strong> tenure system also imposes insecurity on tenants <strong>and</strong> increasestheir <strong>vulnerability</strong> to <strong>climate</strong> <strong>change</strong> by restricting access to credit <strong>and</strong> discouraging if not precluding longtermplanning <strong>and</strong> investment by tenants <strong>and</strong> l<strong>and</strong>owners. Local strategies are needed to provide affordablecredit to l<strong>and</strong>owners <strong>and</strong> tenant farmers (FtF). The extreme reliance on wood-based fuels in Ghana is asignificant <strong>vulnerability</strong> that seems largely unaddressed by any sector at any level. The Team viewed thewood-based fuel situation as a critical issue from the perspectives of dramatically increasing social<strong>vulnerability</strong> to <strong>climate</strong> <strong>change</strong>, its clear unsustainability <strong>and</strong> environmental ramifications thereof, <strong>and</strong> forUSAID, the ability of FtF to succeed. Addressing forest management <strong>and</strong> tenure challenges to sustainablefirewood <strong>and</strong> charcoal production are sorely needed as are community based approaches to managing woodbasedfuels sustainably (Dem/Gov, FtF). The FtF program emphasizes agricultural development which couldaffect l<strong>and</strong> access <strong>and</strong> allocation of water resources. Social impact <strong>assessment</strong>s of agricultural developmentprojects are needed to identify mitigation measures, to ensure people are not displaced or lose l<strong>and</strong> access,<strong>and</strong> to ensure conditions for marginalized groups (i.e., women <strong>and</strong> migrants) are improved not worsened(FtF). Irrigation development will redistribute water resources <strong>and</strong> perhaps increase competition for wateraccess. An equitable system of water allocation <strong>and</strong> management should be developed as an integral part ofany irrigation development project (FtF).Many vulnerabilities under the capacity <strong>and</strong> infrastructure barrier cascade directly from the policy <strong>and</strong>governance/tenure vulnerabilities. Several relate directly to carbon sequestration <strong>and</strong> forestry issues. FtFactivities need to be melded with reforestation <strong>and</strong> afforestation projects to meet community <strong>and</strong> familyneeds for fuel <strong>and</strong> construction wood, to produce NTFPs, to protect riparian areas, <strong>and</strong> to sequester carbon(FtF). Further, partners need to be identified that can link FtF activity to carbon financing or payments forecosystem services markets as part of carbon offset payments (FtF). Technical capacity is needed to developmore efficient wood-based stoves to reduce deforestation, carbon emissions, <strong>and</strong> smoke (FtF, H&S, Gen).Community fuelwood programs need to be developed with technical assistance in species selection,plantation establishment <strong>and</strong> management <strong>and</strong> governance structures (FtF, Gen, H&S, Dem/Gov). Scarcefuelwood most impacts women, the traditional gatherers of wood for cooking. A national integrated firemanagement program, including traditional practices, is needed to manage destructive bush fires to protectsoil quality, increase forage quantity <strong>and</strong> quality, increase rates of reforestation <strong>and</strong> afforestation, <strong>and</strong> mitigatetrends toward desertification in vulnerable areas (e.g., northern Ghana).Several interventions related to the agriculture sector (<strong>and</strong> thus FtF) fall under the capacity <strong>and</strong> infrastructurebarrier. Transportation infrastructure limits access to markets with most households in most districts ofnorthern Ghana traveling >30 minutes to reach a food market <strong>and</strong> in many districts
Given a declining fishery <strong>and</strong> the threat <strong>climate</strong> <strong>change</strong> poses for that resource, the GoG should be stronglyencouraged to develop the capacity <strong>and</strong> infrastructure to scientifically monitor, regulate, <strong>and</strong> manage allsectors of the marine <strong>and</strong> freshwater fisheries for long-term sustainability (FtF, H&S, Gen). Local monitoringauthorities should be strengthened <strong>and</strong> connected with local, regional, <strong>and</strong> national partners <strong>and</strong> counterparts(FtF, H&S, Gen). Most coastal residents are fisheries dependent, are vulnerable to disruptions in the resource,<strong>and</strong> have few employment alternatives. Tourism, while promising, lacks the infrastructure to providesubstantial income. Investments in tourism infrastructure could provide coastal residents viable alternativelivelihoods. Investments in education could broaden skill sets <strong>and</strong> widen employment opportunities for youth<strong>and</strong> young adults (Edu).The energy sector is also hampered by significant capacity <strong>and</strong> infrastructure barriers. The GoG should beencouraged to develop as soon as possible natural gas processing capabilities to avoid prolonged (months toyears) gas flaring <strong>and</strong> increased GHG emissions from the Jubilee Field <strong>and</strong> use that gas to supplement analready inadequate national power grid. The lack of electricity in rural areas impedes entrepreneurial activity,calling for exploration of alternative energy systems (e.g. solar, biofuels) to meet local community needs.Because of education, training, <strong>and</strong> skill deficits, local populations are disadvantaged for competing for jobs inthe nascent oil <strong>and</strong> gas industry. The GoG should be encouraged to provide training to afford localsemployment opportunities in that industry (Edu).Several other interventions were identified under the capacity <strong>and</strong> infrastructure barrier. Mainstreaming<strong>climate</strong> <strong>change</strong> in GoG activities could be advanced by improving data-sharing policies among agencies,especially for meteorology data (Dem/Gov) as well as partnering with institutions to supply <strong>climate</strong><strong>adaptation</strong> information (FtF, H&S, Gen). Lack of technical capacity <strong>and</strong> infrastructure limits the ability toshare large data files between agencies <strong>and</strong> could benefit from improved internet capabilities. Efforts todecentralize government are impeded in rural areas by lack of infrastructure. Cell phone texting featuresshould be explored for use in online registrations, permit applications, etc. to avoid long distance travel togovernment offices <strong>and</strong> to increase participation. Likewise, development of a practical system of farmercredit banks in rural areas is needed to establish farmer accounts that can be used remotely to conductfinancial transactions (FtF). As noted, this latter intervention needs to be superseded by addressing l<strong>and</strong>tenure issues that constrain credit <strong>and</strong> by making credit affordable to smallholders.Information <strong>and</strong> analysis represents a significant barrier to <strong>climate</strong> <strong>change</strong> <strong>adaptation</strong> <strong>and</strong> mitigation inGhana. Data is lacking for critical decision making, planning, <strong>and</strong> forecasting. Climate <strong>change</strong> should beinvestigated at a sub-national level using appropriately scaled GCM models <strong>and</strong> within the context ofdesertification, sea-level rise, <strong>and</strong> coastal erosion, marine <strong>and</strong> inl<strong>and</strong> fishery sustainability, water supply in theVolta Basin, <strong>and</strong> hydropower production (FtF, Gen). Rates of coastal erosion should be investigatednationally with an emphasis on identifying causes <strong>and</strong> on impacts to coastal infrastructure <strong>and</strong> naturalresources (e.g., towns, ports, biodiversity hotspots, lagoonal <strong>and</strong> inshore fisheries) (FtF). Regionalorganizations (e.g., CILSS, AGRHYMET, CORAF, INSAH, FEWSNET) should be engaged in partnershipsto ensure availability of <strong>and</strong> access to data (e.g., weather data, hydrological data, ground cover <strong>change</strong>,agricultural expansion, improved l<strong>and</strong> productivity, fish populations) <strong>and</strong> projections (FtF).Several items identified under the information <strong>and</strong> analysis barrier relate directly to agriculture <strong>and</strong> foodsecurity. Research <strong>and</strong> technology development programs are needed in <strong>climate</strong> prediction, to improve cropmodels, <strong>and</strong> to link process-based crop models to high resolution regional <strong>climate</strong> models (FtF). To helpadapt to <strong>climate</strong> <strong>change</strong>, soil suitability analysis should be incorporated into agricultural development planning<strong>and</strong> updated with soil suitability analysis data on new crop varieties (FtF). The uncertainties of FtFcommercial <strong>and</strong> large-scale agriculture sustainability needs to be investigated in light of increasing future costsof petroleum-based fuels <strong>and</strong> agricultural chemicals <strong>and</strong> a changing <strong>climate</strong> (FtF, Gen). Likewise, FtFirrigation projects should be analyzed in regard to impacts on surface <strong>and</strong> ground water quantity <strong>and</strong> quality<strong>and</strong> downstream effects (FtF). An evaluation of the temporal pace of vegetation <strong>change</strong> <strong>and</strong> soil degradationis needed to assess desertification in northern Ghana, especially in the context of projected populationincreases, food security, water dem<strong>and</strong>s, ecological services, <strong>and</strong> <strong>climate</strong> <strong>change</strong>.174 GHANA CLIMATE CHANGE VULNERABILITY AND ADAPTATION ASSESSMENT
Information <strong>and</strong> analysis needs for forestry-related items are also apparent. L<strong>and</strong> cover/l<strong>and</strong> use inventories<strong>and</strong> forest inventories are needed to set baselines for deforestation, carbon pools under REDD+, <strong>and</strong> tomeet MRV requirements. Investigation is needed in areas where carbon sequestration can complement FtFefforts, e.g., increasing mangroves, rangel<strong>and</strong> management, agro-forestry, farmer-managed naturalregeneration (FMNR), <strong>and</strong> riparian forest management (FtF). Optimized shade-grown cocoa managementschemes are needed that provide high levels of return to farmers, reduce deforestation <strong>and</strong> degradation <strong>and</strong>also offer greater biodiversity benefits than sun-grown cocoa (FtF).Many in Ghana have a lack of awareness of <strong>and</strong> skills to use <strong>climate</strong> <strong>change</strong>, agricultural, natural resourcemanagement, or other information that would reduce their <strong>vulnerability</strong>. Partnerships with localimplementers would build the <strong>climate</strong> <strong>change</strong> awareness of end users (e.g., farmers, fishermen, media,government) <strong>and</strong> enhance their ability to use information (FtF, Edu). Workshops should be organized onvarious topics (e.g., <strong>climate</strong> <strong>change</strong>, <strong>adaptation</strong>, carbon sequestration) for agriculture sector partners <strong>and</strong> FtFimplementers. Cocoa producers lack the skills <strong>and</strong> knowledge to implement the whole technology package forsun-grown cocoa; cocoa productivity could be increased by intensification <strong>and</strong> access to inputs (FtF). Topdownapproaches to fire management are unsuccessful in part because of a lack of awareness of traditionalmethods. GoG agencies <strong>and</strong> personnel should be educated on modern integrated fire managementapproaches <strong>and</strong> traditional approaches <strong>and</strong> the two integrated on the ground. Not all <strong>adaptation</strong> measurescurrently used are sustainable <strong>and</strong> many are erosive to future economic health <strong>and</strong> well-being at thehousehold, community, <strong>and</strong> regional levels. Adaptations should be considered carefully so that unsustainableapproaches are avoided (e.g., marine fuel pre-mix program). Short-term temporary <strong>and</strong> long-term copingmechanisms should be distinguished <strong>and</strong> the difference communicated to the public (FtF, Edu). Livestockproduction in the north offers a potential to diversify livelihoods in the north <strong>and</strong> hence decrease<strong>vulnerability</strong> to <strong>climate</strong> <strong>change</strong>. This potentiality should be communicated <strong>and</strong> promoted; <strong>and</strong> support shouldbe given to schemes that help farmers adopt livestock keeping (FtF). Most crop yields in Ghana are belowpotential, requiring intensification to meet MIC goals. Agricultural productivity could be increased byimproving distribution channels <strong>and</strong> access to technology <strong>and</strong> inputs (e.g., fertilizer) <strong>and</strong> by providing farmersaccess to operating capital <strong>and</strong> crop insurance to mitigate effects of <strong>climate</strong> variability. (FtF). Farmers lackinformation on consumer quality expectations <strong>and</strong> fail to meet market dem<strong>and</strong>. Awareness of consumerexpectations should be raised <strong>and</strong> quality assurance programs instituted for improved marketability (FtF).NEW INTERVENTIONS FOR USAID PROGRAMMINGTo mainstream <strong>climate</strong> <strong>change</strong> into USAID programming in Ghana, <strong>and</strong> indeed for the GoG <strong>and</strong> otherdonor partners to integrate <strong>climate</strong> <strong>change</strong> into their development efforts, the availability of meteorologicaldata <strong>and</strong> interpretive information must be increased. To effectively utilize available <strong>climate</strong> information, thecapacity within Ghana to use the information must also be enhanced. This need presents an opportunity forUSAID Ghana to develop programs or partner with others to build capacity. The two sides of the issue areincreasing available data <strong>and</strong> enhancing capacity to use the data <strong>and</strong> <strong>climate</strong> projections. Increasing dataavailability can be achieved by partnering with regional institutions <strong>and</strong> non-governmental partners toincrease meteorological monitoring capacity by increasing the number of weather stations, especially in ruralareas in the northern regions where the current monitoring network is sparse. Other initiatives could focus onbuilding relationships among regional institutions such as FAMNET, AGRHYMET, <strong>and</strong> others to deliverdata interpretation. Climate modeling at the scale of the Global Climate Models is already available over theinternet, but the expertise necessary to interpret these data, state their uncertainties, <strong>and</strong> effectively use themto downscale to regional <strong>climate</strong> models is generally lacking in Ghana <strong>and</strong> elsewhere in sub-Saharan Africa,except possibly in South Africa. Thus, another opportunity for USAID is to develop interpretation <strong>and</strong>communication capacity within Ghana, either at a university, within the GoG, or in a jointly funded <strong>and</strong>maintained center.Other options are more sectoral in nature. One need seems to be an integrated <strong>and</strong> realistic energy strategyfor Ghana that depends on internal resources. There are few opportunities to exp<strong>and</strong> hydropower; in fact, thecurrent capacity will likely diminish over time as precipitation within the Volta basin declines, <strong>and</strong>GHANA CLIMATE CHANGE VULNERABILITY AND ADAPTATION ASSESSMENT 175
neighboring countries exp<strong>and</strong> their extractions for drinking water <strong>and</strong> irrigation. Ghana is developing oil <strong>and</strong>gas that will provide new energy sources, but they will have to be developed, for example by capturing thenatural gas from the Jubilee Field <strong>and</strong> using it to power an energy plant. Perhaps the greatest opportunity forGhana is to develop advanced biofuels or at least to utilize advanced conversion technology along withcomparative advantages in growing woody feedstocks. Such a policy should, however be integrated withagricultural <strong>and</strong> other uses of l<strong>and</strong> <strong>and</strong> is predicated upon raising the productivity of food crops to their fullpotential under intensification.Woody biomass for bioenergy already provides a large share of the energy needs of the average Ghanaian,specifically fuelwood for cooking. Currently this use is inefficient (open fires, inefficient charcoal productionmethods) <strong>and</strong> often damaging to the environment. In addition to programs to increase fuelwood availability,improve cookstove efficiency, <strong>and</strong> improve charcoal production, the entire forestry sector of Ghana needs tobe transformed. One starting point would be the transformation of the Forestry Commission into a l<strong>and</strong>management <strong>and</strong> stewardship agency. Thus a transformed FC would no longer be focused simply ongenerating income from timber concessions <strong>and</strong> permitting fees. Rather, the FC would be responsible forconserving the remaining high forests, restoring degraded forest reserves <strong>and</strong> wetl<strong>and</strong> forests, <strong>and</strong> providingtechnical assistance to communities in developing community forests <strong>and</strong> fuelwood plantations. In addition,the wood industry in Ghana needs to be rationalized to remove subsidies that maintain an inefficient exportmarket, <strong>and</strong> to improve provision to meet domestic lumber needs. Improved forest management will alsomaximize opportunities to capture payments for carbon <strong>and</strong> other ecosystem services.Ghana’s mid-term development strategy <strong>and</strong> goal of obtaining MIC status by 2015 depends heavily uponimprovements in the agricultural sector. Although we have suggested some interventions in the agriculturalsector in Table 10.1, one <strong>change</strong> that requires multiple <strong>and</strong> continuing interventions is the need to overhaulagricultural research <strong>and</strong> extension in Ghana. The GoG does not provide adequate support for appliedagricultural research internally, which causes research scientists to seek funding from outside sources. Thisusually means that agricultural research focuses more on basic research than is needed in Ghana, leading tothe charge that it is irrelevant. Extension is also underfunded <strong>and</strong> is removed from the needs of thesmallholder. Without a strong applied research focus on issues that matter to the smallholder, delivered byextension agents in affordable technology packages, the existing agricultural research <strong>and</strong> extensioninfrastructure will not contribute to meeting the needs of the Ghanaian farmer.Finally, there is a need to conduct <strong>climate</strong> <strong>change</strong> <strong>vulnerability</strong> <strong>and</strong> <strong>adaptation</strong> analyses at the community <strong>and</strong>household levels in the different regions. Because variability <strong>and</strong> <strong>change</strong>s in <strong>climate</strong> will be felt locally, <strong>and</strong>there are a myriad of possible <strong>adaptation</strong> responses, <strong>vulnerability</strong> analysis needs to be situated in a local spatialcontext. USAID Ghana, working with donor partners, GoG agencies, NGOs, <strong>and</strong> CSOs should develop<strong>vulnerability</strong> <strong>and</strong> <strong>adaptation</strong> analyses as part of the project planning <strong>and</strong> design phase, <strong>and</strong> require that theresults be used to modify projects before embarking on them.176 GHANA CLIMATE CHANGE VULNERABILITY AND ADAPTATION ASSESSMENT
Table 11.1 Options for interventions in order to overcome barriers to <strong>climate</strong> <strong>change</strong> adaption <strong>and</strong> mitigation <strong>and</strong> reduce <strong>vulnerability</strong>(Abbreviations for USAID Programs: FtF=Feed the Future, Edu=Education, H&S=Health <strong>and</strong> Sanitation, Dem/Gov=Democracy <strong>and</strong> Governance, Gen=Gender)Barriers toAdaptation <strong>and</strong>MitigationPolicy Environment Uncoordinated response to<strong>climate</strong> <strong>change</strong>Vulnerability Interventions USAID ProgramsUncoordinated response to<strong>climate</strong> <strong>change</strong>Uncoordinated response todestructive elements of frequent,hot bush fires <strong>and</strong> theirinteraction with <strong>climate</strong> <strong>change</strong><strong>and</strong> <strong>climate</strong> <strong>change</strong> <strong>adaptation</strong>Uncoordinated response topotential <strong>climate</strong> <strong>change</strong> effects onwater quantity among ripariancountriesUncoordinated response tointeractions among <strong>climate</strong><strong>change</strong>-induced sea-level rise <strong>and</strong>coastal erosion, <strong>and</strong> high rates ofpopulation growth <strong>and</strong> coastaldevelopmentUSAID’s FtF program focuses onthe northern regions wheredonor activity is high; westernBrong-Ahafo <strong>and</strong> northern Voltaregions also exhibit high social<strong>vulnerability</strong> to <strong>climate</strong> <strong>change</strong>Farmers need stable <strong>and</strong> favorablecrop prices to make investmentsin commercial crop productionprofitable; otherwise they canbecome poorerSupport the completion <strong>and</strong> implementation of the Ghana NationalClimate Change StrategyIncrease focus in national <strong>climate</strong> <strong>change</strong> strategy on <strong>adaptation</strong>responsesIncorporate <strong>climate</strong> <strong>change</strong> into town planning efforts (decreasing<strong>vulnerability</strong>, adopting low emissions development criteria)Support development of a national energy policy that includes <strong>climate</strong><strong>change</strong> mitigation <strong>and</strong> low emission strategies including advancedbiofuels development <strong>and</strong> capturing flared gasEncourage GoG to develop a national policy for integrated firemanagement <strong>and</strong> regionally-adapted policies that include traditionalpractices for managing wildl<strong>and</strong> fires to protect soil quality, increaseforage quantity <strong>and</strong> quality, increase rates of reforestation <strong>and</strong>afforestation, <strong>and</strong> mitigate trends toward desertification in vulnerableareas (e.g., northern Ghana)Support development of a water allocation agreement among allriparian countries in the Volta River BasinSupport implementation of national <strong>and</strong> regional level coastaldevelopment plans that include <strong>adaptation</strong> strategies for sea-level rise(e.g., relocation of transportation, housing, <strong>and</strong> business zones) <strong>and</strong>natural mitigation measures to slow coastal erosion (e.g., mangrovezones, s<strong>and</strong> mining restrictions)Consider a more targeted, district-based approach to implementingthe FtF program in places where it is most needed, <strong>and</strong> exploreexpansion to high <strong>vulnerability</strong> areas of neighboring Brong-Ahafo <strong>and</strong>Volta regionsEnsure a favorable policy environment for cash crop production FtFFtF, Edu, H&S, Dem/Gov,GenDem/Gov FtFFtF, Dem/Gov, GenFtF, Dem/GovDem/Gov, Edu, FtFFtFGHANA CLIMATE CHANGE VULNERABILITY AND ADAPTATION ASSESSMENT 177
Barriers toAdaptation <strong>and</strong>MitigationVulnerability Interventions USAID ProgramsGovernance/Tenure There is a pervasive sense ofinsecurity, <strong>and</strong> a lack oftransparency within the currentcustomary l<strong>and</strong> tenure systempracticed throughout most ofGhana. This makes it difficult forsmall- scale farmers to maintainaccess to l<strong>and</strong> for farming.Tree tenure, national <strong>and</strong>traditional, offer perversecounterproductive incentivesagainst carbon sequestration <strong>and</strong>other legitimate reasons tomaintain or create forestsAmbiguity of carbon rights;retention of carbon rights at thenational level without sharingbenefits with local communitiescreates another perverseincentiveHeavy reliance on wood-basedfuels for cookingWomen <strong>and</strong> migrants areespecially marginalized when itcomes to accessing l<strong>and</strong>The current l<strong>and</strong> tenure system ischaracterized by insecurity whichmakes it difficult for tenants tomake long term plans or invest inbest practices or newtechnologies. Additionally, withinsecure tenancy, access to credit<strong>and</strong> investors is restricted.Irrigation development oftenimplies a redistribution of waterresources between users, <strong>and</strong>increases competition for accessAdvocate for an examination of l<strong>and</strong> tenure <strong>and</strong> property rights issuesat the community levelCapacity building with traditional l<strong>and</strong> management authorities, such aschiefs <strong>and</strong> the Tendanas, to include more transparency in their dealingswould help restore the customary tenure regime <strong>and</strong> provide forequality in l<strong>and</strong> use practicesAdvocate for national examination <strong>and</strong> correction of tree tenureissues that result in incentives for deforestationAdvocate for legislation defining carbon rights that provides equity tosmallholdersAddress forest management <strong>and</strong> tenure challenges that are obstaclesto sustainable firewood <strong>and</strong> charcoal production; investigate potentialfor effective community-based approaches to managing wood-basedfuels use sustainablyConsider the difficulty marginalized groups face in accessing l<strong>and</strong> <strong>and</strong>resources when designing <strong>and</strong> implementing the Feed the Futureprogram to help improve conditions for these groups <strong>and</strong> ensure thatthey are not further marginalizedExplore local strategies for providing affordable credit to l<strong>and</strong>owners<strong>and</strong> tenant farmers.An equitable system of water allocation <strong>and</strong> management should bedeveloped as an integral part of any irrigation development schemeFtF, Dem/Gov, GenFtF, Dem/Gov, GenFtF, Dem/Gov, GenDem/Gov, FtFGender, FtFFtFFtF178 GHANA CLIMATE CHANGE VULNERABILITY AND ADAPTATION ASSESSMENT
Barriers toAdaptation <strong>and</strong>MitigationCapacity <strong>and</strong>InfrastructureVulnerability Interventions USAID Programsto waterAgricultural development maycause people to be displaced <strong>and</strong>usurp l<strong>and</strong> already being used forfarming, grazing, <strong>and</strong> other usesMissed opportunities to link FtFto carbon offset paymentsMissed opportunities tomainstream <strong>climate</strong> <strong>change</strong> intoGoG activityLinks between FtF <strong>and</strong> forestsneed to be strengthenedA social <strong>assessment</strong> of the impacts of implementing agriculturaldevelopment projects should be undertaken to ensure that people donot lose access to l<strong>and</strong> <strong>and</strong> resources, <strong>and</strong> to identify mitigationmeasuresPartner with organizations that can link FtF activity to carbon financingmarkets or payments for ecosystem services marketsData sharing policies among agencies need to be improved, especiallyfor meteorology data (revenue recovery focus reduces ability foragencies to share <strong>and</strong> coordinate efforts)Meld FtF activities with reforestation <strong>and</strong> afforestation projects tomeet family <strong>and</strong> community needs for fuel <strong>and</strong> construction wood, toproduce NTFPs, to protect riparian zones, <strong>and</strong> to sequester carbonLack of technical capacity Partner with local implementers to build capacity at institutions thatsupply <strong>climate</strong> <strong>adaptation</strong> informationLack of technical capacity <strong>and</strong>infrastructure intelecommunications limits abilityto move large datafiles (such asGIS data) between agenciesLack of technical capacity <strong>and</strong>infrastructure for fisheriesmanagement; fisheries are indecline <strong>and</strong> <strong>climate</strong> <strong>change</strong>threatens to further disrupt theresourceLack of technical capacity toreduce reliance on wood-basedcooking fuelsLack of technical capacity <strong>and</strong>infrastructure <strong>and</strong> heavy relianceon wood-based fuels for cookingFtFFtFDem/GovFtF, GenFtF, H&S GenImprove data access, internet No USAID programEncourage GoG to scientifically monitor (e.g., fishery independentsurveys, fisheries observers), regulate (e.g., limited access), <strong>and</strong> manage(e.g., seasonal <strong>and</strong> net restrictions) all sectors of the marine <strong>and</strong>freshwater fisheries for long-term sustainability in a changing <strong>climate</strong>Strengthen local monitoring authorities, <strong>and</strong> connect them with local,regional, <strong>and</strong> national partners. (EXP Coastal Resource Center).Support adoption of highly efficient charcoal <strong>and</strong> wood burning stovesthat are culturally compatible with Ghanaian cooking modalities tosubstantially reduce wood-based fuel use, carbon emissions, <strong>and</strong>deforestation. More efficient wood based stoves will also produce lesssmoke, <strong>and</strong> lessen the burden on women who are traditionallyresponsible for gathering firewood.Develop community fuelwood program with technical assistance inspecies selection, plantation establishment <strong>and</strong> management, <strong>and</strong>governance structures (scarce fuelwood means extra time spent bywomen to walk farther to gather or household cash must be used topurchase; either way this detracts from ability to grow <strong>and</strong> buy food)FtF, H&S, GenHealth, Gen, FtFFtF, Gen, H&S Dem/GovLack of technical capacity <strong>and</strong> Encourage GoG to advocate development of a national policy of FtF, Gen, Dem/GovGHANA CLIMATE CHANGE VULNERABILITY AND ADAPTATION ASSESSMENT 179
Barriers toAdaptation <strong>and</strong>MitigationVulnerability Interventions USAID Programsinfrastructure in mitigating thedestructive effects of frequent,hot bush firesLack of infrastructure to fullyrealize the energy benefits <strong>and</strong>GHG emissions reductions fromnatural gasintegrated fire management <strong>and</strong> develop regionally adapted policiesthat include traditional practices to manage wildl<strong>and</strong> fires to protectsoil quality, increase forage quantity <strong>and</strong> quality, increase rates ofreforestation <strong>and</strong> afforestation, <strong>and</strong> mitigate trends towarddesertification in vulnerable areas (e.g., northern Ghana)Encourage GoG to develop as soon as possible natural gas processingcapabilities to avoid prolonged gas flaring (months to years) <strong>and</strong>increased GHG emissions at Jubilee Oil Field, <strong>and</strong> to supplement analready inadequate national power gridDem/Gov, H&SLack of infrastructure impedesefforts to decentralizegovernance, especially in ruralareas distant from district capitalsExplore utilization of cell phone texting features to send onlineregistrations, permit applications, etc.Dem/GovLack of infrastructure impedesefforts to decentralize governanceespecially in rural areas distantfrom district capitalsExplore development of farmer credit banks in rural areas to establishfarmer accounts that can be used to pay for permits, etc. remotelyDem/Gov, FtFOccupations of coastal residentsdepend primarily on the marinefisheries, <strong>and</strong> are thereforeespecially vulnerable todisruptions in the resource. Fewemployment alternatives existoutside of the marine fisheries.Tourism, while promising, lacksthe necessary infrastructure toprovide substantial incomeLocal populations are at adisadvantage in regards toemployment opportunitiesthrough the growing oil <strong>and</strong> gasindustry, as they do not possessthe necessary skill set to seekgainful employmentRural areas are often withoutelectricity, which limitsentrepreneurial activityInvestments made in tourism infrastructure could lessen the reliance ofcoastal residents on marine fisheries by providing viable alternativelivelihoodsInvestments in education could help provide a better defined skill set<strong>and</strong> widen employment opportunities for youth <strong>and</strong> young adultsEncourage the government to either provide training itself, or througha third party, that offers the technical skills necessary to seekemployment in the oil <strong>and</strong> gas industryExplore alternative energy systems (e.g. solar, biofuels?) that might suitthe needs of local communitiesNo USAID program,EducationEducationGender?180 GHANA CLIMATE CHANGE VULNERABILITY AND ADAPTATION ASSESSMENT
Barriers toAdaptation <strong>and</strong>MitigationVulnerability Interventions USAID ProgramsLimited infrastructure foraccessing markets: over half thehouseholds in most districts ofnorthern Ghanatravel more than30 minutes to reach a foodmarket; <strong>and</strong> fewer than half of thehouseholds have road access totheir homes year-round in manydistricts.Limited water infrastructure:There is high householddependency on unimproved watersources in the north <strong>and</strong> in mostdistricts of Upper West <strong>and</strong>Northern regions, <strong>and</strong> 15-50% ofhouseholds travel 30+ minutes toget drinking waterClimate <strong>change</strong> creates a need forpeople to diversify economicallybut options are limitedIlliteracy in Ghana’s 3 northernregions ranges from 61.3% to87.5% of the population 15 <strong>and</strong>older in every district exceptTamale, where it is over 50%.This limits people’s capacity toraise their awareness <strong>and</strong> benefitfrom information that will helpthem adapt to <strong>climate</strong> <strong>change</strong> <strong>and</strong>improve agricultural practices.Climate variability creates foodshortagesMany small farmers can’t affordaccess to creditEfforts to promote agricultural development <strong>and</strong> crop marketing innorthern Ghana should evaluate how market access <strong>and</strong>transportation infrastructure can be improved, <strong>and</strong> invest in makingsuch improvementsImproving water infrastructure will help improve human health, free uplabor (especially for women), <strong>and</strong> increase household livelihoodsecurity; however, water development should occur in a manner thatdoes not have negative environmentalconsequencesInvest in construction of local processing facilities that add value toagricultural <strong>and</strong> wild-harvested products to increase income <strong>and</strong> createnonfarm jobsDevelop <strong>and</strong> implement programs to increase literacy EduDevelop improved grain storage facilities so excess grains produced ingood years can be stored to buffer against crop failuresAddress l<strong>and</strong> tenure constraints to obtaining credit; develop creditschemes that are feasible for smallholdersInformation <strong>and</strong> Analysis Lack of data for decision making Partner with regional organizations (e.g., CILSS, AGRHYMET, CORAF,INSAH, FEWSNET) to ensure availability of <strong>and</strong> access to data(weather patterns, hydrological data, ground cover <strong>change</strong>, agriculturalexpansion, improved l<strong>and</strong> productivity, fish populations) <strong>and</strong>forecast/projectionsFtFFtF. Gen, H&SLack of data for decision making L<strong>and</strong> cover/l<strong>and</strong> use inventories <strong>and</strong> forest inventories are needed to Sustainable L<strong>and</strong>scapes,FtFFtfFtFFtFGHANA CLIMATE CHANGE VULNERABILITY AND ADAPTATION ASSESSMENT 181
Barriers toAdaptation <strong>and</strong>MitigationVulnerability Interventions USAID Programs<strong>and</strong> inability to secure REDD+fundingLack of data <strong>and</strong> analysis fordecision making for adaptingagriculture to <strong>climate</strong> <strong>change</strong>Lack of analysis of thesustainability of commercial <strong>and</strong>mechanized agricultureLack of data <strong>and</strong> analysis fordecision making for adaptingagriculture to <strong>climate</strong> <strong>change</strong>Lack of analysis of <strong>climate</strong> <strong>change</strong>effects using state-of-the-artmodels at sub-national scaleslimits ability to planLack of analysis for enhancingcarbon sequestrationopportunitiesLack of analysis at district <strong>and</strong>project levels of the sustainability<strong>and</strong> impact of irrigation projectsset baselines for deforestation, carbon pools under REDD+, <strong>and</strong> tomeet MRV requirementsEstablish program of research <strong>and</strong> technology development in <strong>climate</strong>prediction, improve crop models, <strong>and</strong> link process-based crop modelsto high resolution regional <strong>climate</strong> modelsInvestigate uncertainties of commercial <strong>and</strong> large-scale agriculturesustainability in light of increasing (or minimally uncertain) future costsof petroleum-based fuels <strong>and</strong> agricultural chemicals, <strong>and</strong> a changing<strong>climate</strong>Incorporate soil suitability analysis into agricultural developmentplanning <strong>and</strong> update soil suitability analyses with data on new cropvarietiesInvestigate <strong>climate</strong> <strong>change</strong> at a sub-national level using appropriatelyscaled GCM models <strong>and</strong> within the context of desertification in thenorth, sea-level rise <strong>and</strong> coastal erosion, marine <strong>and</strong> inl<strong>and</strong> fisherysustainability, water supply in the Volta Basin, <strong>and</strong> power productionfrom Okosombo, Kpong, <strong>and</strong> Bui dam generatorsInvestigate areas where carbon sequestration can complement FtFefforts, e.g., reducing coastal erosion by increasing mangroves,rangel<strong>and</strong> management, agro-forestry, farmer managed naturalregeneration (FMNR), riparian forest managementEvaluate in all FtF irrigation projects the impacts on the quantity <strong>and</strong>quality of local ground <strong>and</strong> surface water supplies as well asdownstream user impactsLack of analysis of coastal erosion Evaluate rates of coastal erosion nationally with an emphasis onidentifying proximate <strong>and</strong> ultimate causes, <strong>and</strong> on near- <strong>and</strong> long-termeffects on coastal infrastructure <strong>and</strong> natural resources (e.g., cities,villages, highways, ports, marine facilities, biodiversity hotspots,lagoonal <strong>and</strong> inshore fisheries)Lack of analysis of rates ofdesertification in northern GhanaLack of data for decision makingabout how to improve cocoaproductivity <strong>and</strong> reducedeforestation <strong>and</strong> forestdegradation associated with cocoaConduct a quantified evaluation of the temporal pace of vegetation<strong>change</strong> <strong>and</strong> soil degradation to evaluate rates <strong>and</strong> extent ofdesertification in northern Ghana, especially in the context ofprojected population increases, food security, water dem<strong>and</strong>s,ecological services, <strong>and</strong> <strong>climate</strong> <strong>change</strong>Develop optimized shade-grown cocoa management schemes thatprovide high levels of return to farmers <strong>and</strong> also greater biodiversitybenefits than sun grownBiodiversityFtFFtF, GenFtFFtF, GenFtFFtF, GenFtFFtF, GenFtF182 GHANA CLIMATE CHANGE VULNERABILITY AND ADAPTATION ASSESSMENT
Barriers toAdaptation <strong>and</strong>MitigationAwareness <strong>and</strong>ImplementationVulnerability Interventions USAID ProgramsproductionLack of awareness of <strong>and</strong> skill touse <strong>climate</strong> <strong>change</strong> informationPartner with local implementers to build the <strong>climate</strong> <strong>change</strong> awarenessof end users (e.g., farmers, fishermen, media, government) <strong>and</strong>enhance their ability to use information Organize workshop on topicssuch as <strong>climate</strong> <strong>change</strong>, <strong>adaptation</strong>, <strong>and</strong> carbon sequestration foragriculture sector partners <strong>and</strong> FtF implementersFtF, EduLack of awareness <strong>and</strong> skillsamong cocoa producers regardingthe whole technology package forsun-grown cocoaLack of awareness of traditionalmethods of fire management leadsto unsuccessful top-downregulatory approaches to firemanagementNot all <strong>adaptation</strong> measurescurrently utilized are sustainable;many are erosive to futureeconomic health <strong>and</strong> well being atthe household, community, <strong>and</strong>regional levels.People need to diversify theirlivelihoods to decrease their<strong>vulnerability</strong> to <strong>climate</strong> <strong>change</strong>Yields of most crops grown inGhana are below potential <strong>and</strong>will not support efforts to achieveMIC statusFarmers lack information onconsumer requirements <strong>and</strong> fail tomeet market dem<strong>and</strong>Harvesting <strong>and</strong> h<strong>and</strong>ling losses ofagricultural crops reduce foodavailable <strong>and</strong> financial return tofarmersIncrease cocoa productivity by intensification <strong>and</strong> access to inputs FtF, Sustainable L<strong>and</strong>scapesSupport efforts to increase awareness of GoG agencies <strong>and</strong> personnelon modern integrated fire management approaches; educate staff ontraditional approaches to fire management <strong>and</strong> integrate the twoThink through proposed <strong>adaptation</strong>s, <strong>and</strong> ensure that unsustainable<strong>adaptation</strong>s are not implemented as permanent solutions. (Example,the pre-mix program.) Better distinguish between short-termtemporary coping mechanisms <strong>and</strong> long-term sustainable <strong>adaptation</strong>s.Communicate the difference to the public.Livestock production is a diversification strategy that holds potential inthe north. Raise awareness of this potential <strong>and</strong> supportimplementation of schemes that help people adopt livestock keeping.Associated governance/resource access issues will need to beaddressed.Increase agricultural productivity by increasing access to technology<strong>and</strong> inputs by improving distribution channels (e.g., fertilizer), farmeraccess to operating capital, <strong>and</strong> crop insurance schemes to mitigateeffects of <strong>climate</strong> variabilityRaise awareness of consumer quality expectations for crops like rice<strong>and</strong> yams, <strong>and</strong> institute quality assurance schemes for improved marketaccessLower harvesting <strong>and</strong> h<strong>and</strong>ling losses by developing community orcooperative drying <strong>and</strong> storage facilitiesFtF, EduFtF, EduFtFFtFFtFGHANA CLIMATE CHANGE VULNERABILITY AND ADAPTATION ASSESSMENT 183
12. LITERATURE CITEDAbugre, S. <strong>and</strong> Kazaare, F.P., 2010. Trends <strong>and</strong> status of illegal timber logging in three forest districts of theBrong-Ahafo region of Ghana. Ghana Journal of Forestry, 26: 89-100.Adam, B. 2011. Ghana: company flares gas. allAfrica.com, Public Agenda, Accra, Ghana. Available from:http:// http://allafrica.com/stories/201104080904.html; accessed 2 May 2011.Adam, J. C. <strong>and</strong> Lettenmaier, D. P. 2003. Adjustment of global gridded precipitation for systematic bias,Journal of Geophysical Research, 108: 1-4.Adam, M.A. 2011. Personal communication. National Oil Coordinator, Publish What You Pay Ghana. Accra,Ghana.Adams, M., <strong>and</strong> Sib<strong>and</strong>a, S. 1999. L<strong>and</strong> tenure reform <strong>and</strong> rural livelihoods in Southern Africa. Naturalresource Perspectives, Overseas Development Institute.Addo, K. A., M. Walkden, <strong>and</strong> J. P. Mills. 2008. Detection, measurement <strong>and</strong> prediction of shorelinerecession in Accra, Ghana. ISPRS Journal of Photogrammetry <strong>and</strong> Remote Sensing 63:543-548.Addo, K. A. 2009. Detection of coastal erosion hotspots in Accra, Ghana. Journal of SustainableDevelopment in Africa 11(4):253-265.Adeku, J.; Kwafo, S.K. 2005. Eastern Region: Analyses of district data <strong>and</strong> implications for planning. In:Twum-Baah, K.A.; Kumekpor, T.K.B.; Addae-Mensah, I.; eds. 2000 Population <strong>and</strong> Housing Census.Accra: Ghana Statistical Services. Vol. 3 [of 10].Adeoti, A., B. Barry, et al. (2007). Treadle pump irrigation <strong>and</strong> poverty in Ghana. Colombo, Sri Lanka,International Water Management Institute (IWMI). IWMI Research Report 117.Adger, N., 1999. Social <strong>vulnerability</strong> to <strong>climate</strong> <strong>change</strong> <strong>and</strong> extremes in coastal Vietnam. World Development,27(2): 249-269.Adger, W. N., T. P. Hughes, et al. (2005). "Social-ecological resilience to coastal disasters." Science 309(5737):1036.Ahmad, O.B.; Nkansah, M.Y. 2005. Northern Region: Analysis of district data <strong>and</strong> implications for planning.In: Twum-Baah, K.A.; Kumekpor, T.K.B.; Addae-Mensah, I.; eds. 2000 Population <strong>and</strong> HousingCensus. Accra: Ghana Statistical Services. Vol. 6 [of 10].Agyeman, V.K.; Marfo, K.A.; Kasanga, K.R.; Danso, E.; Asare, A.B.; Yeboah, O.M.; Agyeman, F. 2003.Revising the taungya plantation system: new revenue-sharing proposals from Ghana. Unasylva 212.54(1): 40-43. ftp://ftp.fao.org/docrep/fao/005/y4744e/y4744e10.pdfAggery-Fynn, J. 2007. The fishery of Balistes capriscus (Balistidae) in Ghana <strong>and</strong> possible reasons for itscollapse. Ph.D. Thesis. Center for Tropical Marine Ecology, University of Bremen.Akoto, I.O.; Ampabeng, I.; Fenny, A.P. 2006. Customarily L<strong>and</strong> Tenure Practices, Investment <strong>and</strong>Agricultural Production in Ghana. Draft Report. On file with: Institute of Statistical, Social <strong>and</strong>Economic Research (ISSER). University of Ghana. November, 2006.Alhassan, H.S. 2009. Butterflies vs. hydropower: reflections on large dams in contemporary Africa. WaterAlternatives. 2(1): 148-160.184 GHANA CLIMATE CHANGE VULNERABILITY AND ADAPTATION ASSESSMENT
Amanor, K.S. 2001. Share contracts in the oil palm <strong>and</strong> citrus belt of Ghana. IIED, London. 30 pp.http://www.iied.org/pubs/pdf/full/9008IIED.pdfAndah, W.E.I. <strong>and</strong> Gichuki F., editors. 2005. VoltaRiver Basin: Enhancing Agricultural Water Productivity Through Strategic Research. Baseline ReportReport No. 8, CGIAR Challenge Program on Water <strong>and</strong> Food, P.O. Box 2075, Colombo, Sri Lanka.Andah, W.E. I., N. van de Giesen, <strong>and</strong> C. A. Biney. 2005. Water, <strong>climate</strong>, food, <strong>and</strong> environment in the VoltaBasin. Contribution to the project ADAPT, Adapation strategies to changing environments.Andreini, M., N. van de Giesen, A. van Edig, M. Fosu, <strong>and</strong> W. Andah. 2000. Volta basin water balance.,ZEF-Discussion Papers on Development Policy Number 21, Center for Development <strong>and</strong> Research,Bonn Universitat.Angelsen, A. <strong>and</strong> Institute, M., 2009. Reducing emissions from deforestation <strong>and</strong> forest degradation (REDD):an options <strong>assessment</strong> report. Meridian Institute.Anim-Kwapong, G. J. <strong>and</strong> E. B. Frimpong Vulnerability of agriculture to <strong>climate</strong> <strong>change</strong>- impact of <strong>climate</strong><strong>change</strong> on cocoa production. Vulnerability <strong>and</strong> <strong>adaptation</strong> <strong>assessment</strong> under the netherl<strong>and</strong>s <strong>climate</strong><strong>change</strong> studies assistance programme phase 2 (NCCSAP2). New Tafo Akim, Ghana, Cocoa ResearchInstitute of Ghana.Ansa-Emmim, M. 1979. Occurrence of the triggerfish, Balistes capriscus (Gmel), on the continental shelf ofGhana. Pages 20-27. In: Report of the special working group on the evaluation of demersal stocks ofthe Ivory Coast - Zaire sector, CECAF/ECAF SERIES/79/14(En), FAO, Rome.Apombwe, M. 2011. Personal communication. Head of Ghana’s national <strong>climate</strong> <strong>change</strong> unit, EnvironmentalProtection Agency, Accra, Ghana.Appiah, M. et al., 2009. Dependence on forest resources <strong>and</strong> tropical deforestation in Ghana. Environment,Development <strong>and</strong> Sustainability, 11(3): 471-487.Appiah, M., L. Damnyag, et al. (2010). Forest <strong>and</strong> agroecosystem fire management in Ghana. Mitigation <strong>and</strong>Adaptation Strategies for Global Change: 1-20.Asante, M.S., 2005. Deforestation in Ghana: explaining the chronic failure of forest preservation policies in adeveloping country. Univ Press of America.Asiamah, R. D. <strong>and</strong> C. D. Dedzoe. 1999. Plinthization: a threat to agricultural production. Ghana Journal ofAgriculturual Science 32.Asiamah , R. D. 1995. Soils of the Ho-Keta plains, Volta Region. Ghana Technical Report No. 10, SRI,Kwadaso-Kumasi.Asiamah, R. D., C. Quansah, <strong>and</strong> C. D. Dedzoe. 2000. Soil degradation: management <strong>and</strong> rehabilitation inGhana- an overview report. Proceedings of the FAO/ISCW Expert Consultation On: Managementof Degraded Soils in Southern <strong>and</strong> East Africa (MADS-SEA), 2 nd Network Meeting, 18-22September, 2000, Pretoria South Africa, Pp 89-101.Atta-Mills, J; Alder, J.; Sumaila, U.R. 2004. The decline of a regional fishing nation: the case of Ghana <strong>and</strong>West Africa. National Resources Forum. 28: 13-21.Bannerman, P.O., <strong>and</strong> I.G. Cowx. 2002. Stock <strong>assessment</strong> of the big-eye grunt (Brachydeuterus auritus, Val.)fishery in Ghanaian coastal waters. Fisheries Research 59:197-207.Bakun, A. 1998. Ocean triads <strong>and</strong> radical interdecadal stock variability: bane <strong>and</strong> boon for fisherymanagement science. Pages 331–358 in: Reinventing Fisheries Management, T. J. Pitcher, P.J.B. Hart,<strong>and</strong> D. Pauly, editors. Chapman <strong>and</strong> Hall, London.GHANA CLIMATE CHANGE VULNERABILITY AND ADAPTATION ASSESSMENT 185
Bard, F.X. <strong>and</strong> N.Y.N. Goran. 2001. Evolution of fishing effort of gill netting canoes targeting large pelagicfish in the Gulf of Guinea. Collective Volume of Scientific Papers, ICCAT 52, 483-487Bationo, A. <strong>and</strong> B. Ntare (2000). "Rotation <strong>and</strong> nitrogen fertilizer effects on pearl millet, cowpea <strong>and</strong>groundnut yield <strong>and</strong> soil chemical properties in a s<strong>and</strong>y soil in the semi-arid tropics, West Africa."The Journal of Agricultural Science 134(03): 277-284.Batse, Z.K.M. 2005. Upper East Region: Analysis of district data <strong>and</strong> implications for planning. In: Twum-Baah, K.A.; Kumekpor, T.K.B.; Addae-Mensah, I.; eds. 2000 Population <strong>and</strong> Housing Census. Accra:Ghana Statistical Services. Vol. 7 [of 10].Batse, Z.K.M. 2005. Upper West Region: Analysis of district data <strong>and</strong> implications for planning. In: Twum-Baah, K.A.; Kumekpor, T.K.B.; Addae-Mensah, I.; eds. 2000 Population <strong>and</strong> Housing Census. Accra:Ghana Statistical Services. Vol. 8 [of 10].Becker, M. <strong>and</strong> D. Johnson (2001). "Cropping intensity effects on upl<strong>and</strong> rice yield <strong>and</strong> sustainability in WestAfrica." Nutrient Cycling in Agroecosystems 59(2): 107-117.Belsky, J. M. <strong>and</strong> S. F. Siebert (2003). "Cultivating cacao Implications of sun-grown cacao on local foodsecurity <strong>and</strong> environmental sustainability." Agriculture <strong>and</strong> Human Values 20(3): 277-285.Benneh , G. 1970. The impact of cocoa cultivation on the traditional L<strong>and</strong> tenure system of the Akan ofGhana. Ghana Journal of Sociology. 6: 43-61.Benneh, G., <strong>and</strong> G. T. Agyepong. 1990. L<strong>and</strong> degradation in Ghana. Food Production <strong>and</strong> RuralDevelopment Secretariat, Marlborough House, Pall Mall, London, <strong>and</strong> Department of Geography<strong>and</strong> Resource Development, University of Ghana, Legon, Ghana.Beinroth, F.H., Eswaran, H., Reich, P.F. <strong>and</strong> Van den Berg, E. 1994. L<strong>and</strong> related stresses in agroecosystems.In: Stressed Ecosystems <strong>and</strong> Sustainable Agriculture, eds. S.M. Virmani, J.C. Katyal, H. Eswaran <strong>and</strong> I.P.Abrol. New Delhi, India: Oxford <strong>and</strong> IBH.Binet, D. 1995. Hypothesis accounting for the variability of Sardinella abundance in the northern Gulf ofGuinea. Pages 98–133 in Dynamics <strong>and</strong> Uses of Sardinella Resources from Upwelling off Ghana <strong>and</strong>Côite d’Ivoire. F.X. Bard, <strong>and</strong> K.A. Koranteng, editors. ORSTOM Edition, Paris.Biney, C. A. 2010. Connectivities <strong>and</strong> linkages within the Volta Basin. Pages 81-105 in Proceedings of theGlobal Dimensions of Change in River Basins, Threats, Linkages, <strong>and</strong> Adaptations, University Club,Bonn, Germany. Global Water System Project, International Project Office, Bonn, Germany.Birkmann, J. <strong>and</strong> K. von Teichman (2010). "Integrating disaster risk reduction <strong>and</strong> <strong>climate</strong> <strong>change</strong> <strong>adaptation</strong>:key challenges—scales, knowledge, <strong>and</strong> norms." Sustainability Science: 1-14.Blay, D., Appiah, M., Damnyag, L., Dwomoh, F.K., Luukkanen, O., Pappinen, A. (2008). Involving localfarmers in rehabilitation of degraded tropical forests: some lessons from Ghana. EnvironmentDevelopment <strong>and</strong> Sustainability 10: 503-518.Blench, R. <strong>and</strong> M. Dendo (2007) Working paper: agricultural production <strong>and</strong> the potential for commoditychain expansion in the three northern regions of Ghana in 2006.Boateng, E. (2005). "Geographic Information Systems (GIS) as a decision support tool for l<strong>and</strong> suitability<strong>assessment</strong> for rice production in Ghana." West African Journal of Applied Ecology 7(1): 69-81.Boko, M. et al., 2007. Chapter 9: Africa. Fourth Assessment Report of the IPCC: 441.Braimoh, A. <strong>and</strong> P. Vlek (2004). "The impact of l<strong>and</strong> cover <strong>change</strong> on soil properties in northern Ghana."L<strong>and</strong> Degradation & Development 15(1): 65-74.186 GHANA CLIMATE CHANGE VULNERABILITY AND ADAPTATION ASSESSMENT
Braimoh, A. <strong>and</strong> P. Vlek (2006). "Soil quality <strong>and</strong> other factors influencing maize yield in northern Ghana."Soil use <strong>and</strong> management 22(2): 165-171.Braimah, L.I. 2001. Lake Volta Fisheries Management Plan. Fisheries Sub-sector Capacity Building Project.Ministry of Food <strong>and</strong> Agriculture.Braihmah, P. 2009. Lessons from previous experience of co-management initiatives in fisheries in Ghana.Report. Ghana, Accra. World Bank. XX p.Breisinger, C., X. Diao, et al. (2008). The Role of Cocoa in Ghana’s Future Development. Ghana StrategySupport Program Background Paper No. GSSP 0011. IFPRI.Breisinger, C., X. Diao, et al. (2008). Agriculture for development in Ghana: New opportunities <strong>and</strong>challenges. IFPRI Disucssion Paper. Washington, DC, Intl Food Policy Res Inst.Brooks, N. (2003). "Vulnerability, risk <strong>and</strong> <strong>adaptation</strong>: A conceptual framework." Tyndall Centre for ClimateChange Research Working Paper 38: 1–16.Brooks, N.; Adger, W.N.; Bentham, G.; Gnew, M.; Eriksen, Siri. 2004. New indicators of <strong>vulnerability</strong> <strong>and</strong>adaptive capacity. Tyndall Centre for Climate Change Research. Technical Report 7. January 2004.102p.Brown, O. <strong>and</strong> A. Crawford (2008). "Climate <strong>change</strong>: A new threat to stability in West Africa? Evidence fromGhana <strong>and</strong> Burkina Faso." African Security Review 17(3): 39-57.Campbell, M.O. 2006. The sustainability of coconut palm Cocos nucifera Linnaeus 1753 groves in coastalGhana. Journal of Coastal Research 22 (5), 1118–1124.Carter, T., R. Jones, et al. (2007). "New Assessment methods <strong>and</strong> the characterization of future conditions.Climate Change 2007: Impacts, Adaptation <strong>and</strong> Vulnerability." Contribution of Working Group II tothe Fourth Assessment Report of the Intergovernmental Panel on Climate Change: 133-171.Caverivière, A. 1991. L’explosion démographique du baliste (Balistes carolinensis) en Afrique de l’ouest et sonévolution en relation avec les tendances climatiques. Pages 354–367 in P. Cury <strong>and</strong> C. Roy, editors.Variabilité, instabilité et <strong>change</strong>ment dans les pêcheries ouest africaines. Editions ORSTOM, Paris.Challinor, A., T. Wheeler, et al. (2007). "Assessing the <strong>vulnerability</strong> of food crop systems in Africa to <strong>climate</strong><strong>change</strong>." Climatic Change 83(3): 381-399.Challinor, A. J., F. Ewert, et al. (2009). "Crops <strong>and</strong> <strong>climate</strong> <strong>change</strong>: progress, trends, <strong>and</strong> challenges insimulating impacts <strong>and</strong> informing <strong>adaptation</strong>." Journal of Experimental Botany 60(10): 2775-2789.Chamberlin, J. (2007). Defining smallholder agriculture in Ghana: Who are smallholders, what do they do <strong>and</strong>how are they linked with markets? GSSP Background Paper 6. Accra.Chambers, R. 1970. The Volta resettlement experience. London, UK: Pall Mall Press.Clark, N. 1994. The Economy. In A Country Study: Ghana. L. V. Berry, editor. Library of Congress, CountryStudies. Federal Research Division, Library of Congress. Available:http://memory.loc.gov/frd/cs/cshome.html, accessed April 2011Coastal Resource Center. 2010. [CRC 2010]. Our coast our future: building capacity for adapting to a rapidlychanging coastal zone. October 2010 Report. Nansurgent, RI <strong>and</strong> Sekondi, Ghana: Coastal ResourceCenter, University of Rhode Isl<strong>and</strong>. 64 p.Cury, P. 2004. Comparison of the Ivoiro-Ghanaian Fishery with other exploited upwelling systems of theworld. Pages 169-193 in Dynamics <strong>and</strong> Use of Sardinella Resources from Upwelling off Ghana <strong>and</strong>Ivory Coast. F.X. Bard <strong>and</strong> K.A. Koranteng, editors. Paris, OSTROM Editions.GHANA CLIMATE CHANGE VULNERABILITY AND ADAPTATION ASSESSMENT 187
Daniel, S. (2011). L<strong>and</strong> Grabbing <strong>and</strong> Potential Implications for World Food Security. SustainableAgricultural Development. M. Behnassi, S. A. Shahid <strong>and</strong> J. D'Silva (eds.), Springer Netherl<strong>and</strong>s: 25-42.Dasgupta, A. <strong>and</strong> A. Baschieri (2010). "Vulnerability to <strong>climate</strong> <strong>change</strong> in rural Ghana: Mainstreaming <strong>climate</strong><strong>change</strong> in poverty reduction strategies." Journal of International Development 22(6): 803-820.Davies S.; Hossain, N. 1993. Are coping strategies a cop out? Sussex: Institute for Development Studies.Bulletin 24(4): 60-72.Davies, S.; Hossain, N. 1997. Livelihood <strong>adaptation</strong>, public action <strong>and</strong> civil society: a review of the literature.IDS Working Paper No. 57. Sussex: Institute of Development Studies.de Condappa, D., A. Chaponnière, <strong>and</strong> J. Lemoalle. 2008. Decision-support tool for water allocation in theVolta basin. Volta Basin Focal Project Report No 10. IRD, Montpellier, France, <strong>and</strong> CPWF,Colombo, Sri Lanka, 28 p.de Condappa, D., A. Chaponnière, <strong>and</strong> J. Lemoalle. 2009. A decision-support tool for water allocation in theVolta Basin. Water International 34:71-87.Dickson, K. B., <strong>and</strong> G. Benneh. 1988. A New Geography of Ghana. Longman.Dixon, R.K., Smith, J. <strong>and</strong> Guill, S., 2003. Life on the edge: <strong>vulnerability</strong> <strong>and</strong> <strong>adaptation</strong> of Africanecosystems to global <strong>climate</strong> <strong>change</strong>. Mitigation <strong>and</strong> Adaptation Strategies for Global Change, 8(2):93-113.Dietz, T.; Millar, D.; Dittoh, S.; Obeng, F.; Ofori-Sarpong, E. 2004. Climate <strong>and</strong> livelihood <strong>change</strong> in NorthEast Ghana. In: Dietz, A.J.; Ruben, R.; Verhagen, A.; eds. Environment <strong>and</strong> Policy Series Volume 39:The impact of <strong>climate</strong> <strong>change</strong> on dryl<strong>and</strong>s, with a focus on West Africa.Dordrecht/Boston/Londong: Kluwer Academic Publishers: 149-172.DOF 2003. Directorate of Fisheries 2003. Ghana: Post-Harvest fisheries overview. Directorate of Fisheries,Ministry of Food <strong>and</strong> Agriculture, GhanaFAO (2006) FAO yearbook. Fishery <strong>and</strong> AquacultureStatistics 2006. FAO Fisheries <strong>and</strong> Aquaculture Information <strong>and</strong> Statistics Service. Rome, FAO.2008. 57p.Dontwi, J.; Dontwi, I.K.; Buabeng, S.N. 2008a. Climate <strong>change</strong> impacts on fisheries production. In: Allotey,J.; Mensah, L.; eds. Ghana <strong>climate</strong> <strong>change</strong> impacts, <strong>vulnerability</strong> <strong>and</strong> <strong>adaptation</strong> <strong>assessment</strong>s, underthe Netherl<strong>and</strong>s <strong>climate</strong> assistance programme. Accra, Ghana: Environmental Protection Agency: 14-73. Chapter 2.Dontwi, J., I. K. Dontwi, <strong>and</strong> S. N Buabeng. 2008b. Climate <strong>change</strong> impacts on fisheries production. Pages14-71 in W. K. Agyemang-Bonsu, editor. Ghana Climate Change Impacts, Vulnerability <strong>and</strong>Adaptation Assessments. Environmental Protection Agency, Accra, Ghana.Doyi, B.A. <strong>and</strong> G. Neequaye. 1990. Report on pilot artisanal fishing gear survey in Ghana, Inf. Report No.24, Fishery Research <strong>and</strong> Utilisation Branch, Tema, Ghana.Dreze, J.; Sen, A.K. 1989. Hunger <strong>and</strong> public action. Oxford, U.K., Clarendon Press.Duguma, B., J. Gockowski, et al. (2001). "Smallholder Cacao (Theobroma cacao Linn.) cultivation inagroforestry systems of West <strong>and</strong> Central Africa: challenges <strong>and</strong> opportunities." Agroforestry Systems51(3): 177-188.Edwin, J. <strong>and</strong> W. A. Masters (2005). "Genetic improvement <strong>and</strong> cocoa yields in Ghana." ExperimentalAgriculture 41(04): 491-503.188 GHANA CLIMATE CHANGE VULNERABILITY AND ADAPTATION ASSESSMENT
Energy Commission. 2005. Strategic national energy plan 2005-2025: Part 1 electricity. Accra, Ghana: EnergyCommission.Ensor, J.; Berger, R. 2009. Introduction: underst<strong>and</strong>ing community based <strong>adaptation</strong>. In: Ensor, J.; Berger, R.;eds. Underst<strong>and</strong>ing <strong>climate</strong> <strong>change</strong> <strong>adaptation</strong>: lessons from community based approaches.Warwickshire, UK: Practical Action Publishing. 13-14.EPA (Environmental Protection Agency). 2003. National action programme to combat droughtdesertification, April 2002. Environmental Protection Agency, Ministry of Environment <strong>and</strong> Science,Accra, Ghana.Eriksen, S.E.H.; Klein, R.J.T.; Ulsrud, K.; Naess, L.O.; O’Brien, K. 2007. Climate <strong>change</strong> <strong>adaptation</strong> <strong>and</strong>poverty reduction: key interactions <strong>and</strong> critical measures. Global Environmental Change <strong>and</strong> HumanSecurity, University of Oslo. GECHS Report 2007:1. 42 p.Evenson, R. E. <strong>and</strong> D. Gollin (2003). "Assessing the impact of the Green Revolution, 1960 to 2000." Science300: 758.FAO (Food <strong>and</strong> Agriculture Organization). 2005. Fertilizer use by crop in Ghana. Rome, Food <strong>and</strong>Agricultural Organization of the United Nations.FAO (Food <strong>and</strong> Agriculture Organization). 2005. National soil degradation maps. L<strong>and</strong> <strong>and</strong> WaterDevelopment Division. Food <strong>and</strong> Agricultural Organizaton, United Nations, Rome. Available from:http://www.fao.org/l<strong>and</strong><strong>and</strong>water/agll/glasod/glasodmaps.jsp; accessed 18 April 2011.FAO (Food <strong>and</strong> Agriculture Organization of the United Nations), Fisheries <strong>and</strong> Aquaculture Department.2011. (UN FAO 2011). Fisheries <strong>and</strong> Aquaculture Country Profiles: Ghana.http://www.fao.org/fishery/countrysector/FI-CP_GH/en. (April 14, 2011).Ferraris, J. <strong>and</strong> K.A. Koranteng. 2004. Statistical analysis of canoe fishery data in Ghana with particularreference to sardinellas. Pages 205-221 in F.X. Bard <strong>and</strong> K.A. Koranteng, editors. Dynamics <strong>and</strong> Useof Sardinella Resources from Upwelling off Ghana <strong>and</strong> Ivory Coast. Paris, OSTROM Editions.Finegold, A. Gordon, D. Mills, L. Curtis, <strong>and</strong> A. Pulis. 2010. Western Region Fisheries Sector Review.WorldFish Center. USAID Integrated Coastal <strong>and</strong> Fisheries Governance Initiative for the WesternRegion, Ghana. 84 p.Fischer, G., M. Shah, et al. (2005). "Socio-economic <strong>and</strong> <strong>climate</strong> <strong>change</strong> impacts on agriculture: an integrated<strong>assessment</strong>, 1990–2080." Philosophical Transactions of the Royal Society B: Biological Sciences360(1463): 2067-2083.Franzen, M. <strong>and</strong> M. Borgerhoff Mulder (2007). "Ecological, economic <strong>and</strong> social perspectives on cocoaproduction worldwide." Biodiversity <strong>and</strong> Conservation 16(13): 3835-3849.Füssel, H.M., 2007. Vulnerability: A generally applicable conceptual framework for <strong>climate</strong> <strong>change</strong> research.Global Environmental Change, 17(2): 155-167.Gedzi, V. 2009. Women <strong>and</strong> Property Inheritance after Intestate Succession, Law 111 in Ghana. Presented atIAFFE Conference. Boston, 25-28 June 2009. https://editorialexpress.com/cgibin/conference/download.cgi?db_name=IAFFE2009&paper_id=325Geist, H.J. <strong>and</strong> Lambin, E.F., 2002. Proximate causes <strong>and</strong> underlying driving forces of tropical deforestation.BioScience, 52(2): 143-150.Geist, H., E. Lambin, et al. (2006). "Agricultural transitions at dryl<strong>and</strong> <strong>and</strong> tropical forest margins: actors,scales <strong>and</strong> trade-offs." Agriculture <strong>and</strong> <strong>climate</strong> beyond 2015: 53-73.Ghana Districts. 2006. District Profiles. http://www.<strong>ghana</strong>districts.com. (April 29, 2011).GHANA CLIMATE CHANGE VULNERABILITY AND ADAPTATION ASSESSMENT 189
Ghana Forestry Commission. 2011. Personal Interview. Executive Director, Head of Planning. Accra, Ghana.March 3, 2011.Gildea, R.Y. 1964. Culture <strong>and</strong> l<strong>and</strong> tenure in Ghana. L<strong>and</strong> Economics. 40(1): 102-104.Gockowski, J. <strong>and</strong> D. Sonwa "Cocoa Intensification Scenarios <strong>and</strong> Their Predicted Impact on CO 2Emissions, Biodiversity Conservation, <strong>and</strong> Rural Livelihoods in the Guinea Rain Forest of WestAfrica." Environmental Management: 1-15.Gonzalez, P., 2001. Desertification <strong>and</strong> a shift of forest species in the West African Sahel. Climate Research,17(2): 217-228.Gorman, M.E.; Werhane, P.H. 2008. The Volta River Project. Case <strong>and</strong> Teaching Paper Series UVA-E-0161.Charlottesville, VA: Graduate School of Business Administration, University of Virginia. 27 p.Government of Ghana (GoG). 2010. Republic of Ghana Forest Investment Program (FIP) Scoping MissionSeptember 29 to October 1, 2010 Aide Memoire. Available on-line athttp://www.<strong>climate</strong>investmentfunds.org/cif/sites/<strong>climate</strong>investmentfunds.org/files/Ghana%20FIP%20Aide%20Memoire_Final_010311.pdfGriscom, B., Shoch, D., Stanley, B., Cortez, R. <strong>and</strong> Virgilio, N., 2009. Sensitivity of amounts <strong>and</strong> distributionof tropical forest carbon credits depending on baseline rules. Environmental Science & Policy, 12(7):897-911.Gregory, P., Ingram, J. <strong>and</strong> Brklacich, M., 2005. Climate <strong>change</strong> <strong>and</strong> food security. Philosophical Transactionsof the Royal Society B: Biological Sciences, 360(1463): 2139.GSS 2002. Ghana Statistical Service. 2002. 2000 Population <strong>and</strong> housing census: special report on 20 largestlocalities. Accra, Ghana. 79 p.GSS 2005. Ghana Statistical Service 2005. 2000 Population <strong>and</strong> Housing Census of Ghana: Demographic,Economic <strong>and</strong> Housing Characteristics, Total Country. Ghana Statistical Service, Accra, Ghana. 275p.GSS 2007. Ghana Statistical Service. 2007. Pattern <strong>and</strong> trends of poverty in Ghana, 1991-2006. Accra, Ghana:Central Office, Ghana Statistical Service. 74 p.GSS 2008a. Ghana Statistical Service 2008. Ghana in figures. 32 p. Accra, Ghana.GSS 2008b. Ghana Statistical Service 2008. Ghana living st<strong>and</strong>ards survey: report of the fifth round.September 2008. 131 p. Accra, Ghana.GSS 2010. Ghana Statistical Service 2010. 2009 Ghana's Economic Performance: in figures. December 2010.12 p. Accra, Ghana.GGOP 2011. Government of Ghana Official Portal. 2010 Provisional Census Results Out.http://www.<strong>ghana</strong>.gov.gh/index.php?option=com_content&view=article&id=4712:2010-provisional-census-results-out&catid=88:daily-news-summary&Itemid=236. (April 18, 2010).Gyasi, E.A. 1996. L<strong>and</strong> holding <strong>and</strong> its relationship with biophysical status: case study of tenancy <strong>and</strong> nontenancyfarming in Ghana. PLEC News <strong>and</strong> Views. 7: 21-25.Gyasi, E.A.; Karikari, O.; Dugan, E. 2008. Climate <strong>change</strong> impacts on l<strong>and</strong> management. In: Allotey, J.;Mensah, L.; eds. Ghana <strong>climate</strong> <strong>change</strong> impacts, <strong>vulnerability</strong> <strong>and</strong> <strong>adaptation</strong> <strong>assessment</strong>s, under theNetherl<strong>and</strong>s <strong>climate</strong> assistance programme. Accra, Ghana: Environmental Protection Agency: 110-168. Chapter 4.190 GHANA CLIMATE CHANGE VULNERABILITY AND ADAPTATION ASSESSMENT
Gyau-Boakye P., <strong>and</strong> Tumbulto J.W. 2000. The Volta lake <strong>and</strong> declining rainfall <strong>and</strong> streamflows in the Voltariver basin. Environment, Development <strong>and</strong> Sustainability 2: 1–10.Haan, N.; Farmer, G.; Wheeler, R. 2001. Chronic <strong>vulnerability</strong> to food insecurity in Kenya. A World FoodProgram Study for improving <strong>vulnerability</strong> analysis.http://one.wfp.org/operations/vam/documents/ken_vip_2001.pdfHaile, M., 2005. Weather patterns, food security <strong>and</strong> humanitarian response in sub-Saharan Africa.Philosophical Transactions of the Royal Society B: Biological Sciences, 360(1463): 2169.Haines, A., R. S. Kovats, et al. (2006). "Climate <strong>change</strong> <strong>and</strong> human health: impacts, <strong>vulnerability</strong>, <strong>and</strong>mitigation." The Lancet 367: 2101-2109.Hall, J. B., <strong>and</strong> M. D. Swaine. 1976. Classification <strong>and</strong> ecology of closed-canopy forest in Ghana. Journal ofEcology 64:913-951.Hansen, C.P., 2011. Forest law compliance <strong>and</strong> enforcement: The case of on-farm timber extraction inGhana. Journal of Environmental Management, 92(3): 575-586.Hansen, C.P., Lund, J.F. <strong>and</strong> Treue, T., 2009. Neither fast, nor easy: the prospect of Reduced Emissions fromDeforestation <strong>and</strong> Degradation (REDD) in Ghana. International Forestry Review, 11(4): 439-455.Hansen, C.P. <strong>and</strong> Treue, T., 2008. Assessing illegal logging in Ghana. International Forestry Review, 10(4):573-590.Harvey, D. 2007. Climate <strong>change</strong> turning the lights out on Ghana. Five Minutes to Midnight, June 2007issue. Available from: http://www.11-55.org/issues3/issue.php?iss=48&art=48.3 ; accessed 4 May2011.Hayes, J.; Roth, M.; Zepeda, L. 1997. Tenure Security, Investment <strong>and</strong> Productivity. Gambian AgriculturalEconomics. 79(2): 369-382.Herold, M. <strong>and</strong> Johns, T., 2007. Linking requirements with capabilities for deforestation monitoring in thecontext of the UNFCCC-REDD process. Environmental Research Letters, 2: 045025.Herold, M. <strong>and</strong> Skutsch, M., 2009. Measurement, reporting <strong>and</strong> verification for REDD+: objectives,capacities <strong>and</strong> institutions. National REDD Architecture <strong>and</strong> Policies.Hesselberg, J.; Yaro, J.A. 2006. An <strong>assessment</strong> of the extent <strong>and</strong> causes of food insecurity in northern Ghanausing a livelihood <strong>vulnerability</strong> framework. GeoJournal. 67: 41-55.Hijmans, R.J., Cameron, S.E., Parra, J.L., Jones, P.G., Jarvis, A. 2005. Very high resolution interpolated<strong>climate</strong> surfaces for global l<strong>and</strong> areas. International Journal of Climatology 25: 1965-1978.Human Security Index. www.humansecurityindex.org. March 9, 2011. (April 26, 2011).Hunter, H.M. 1963. Coca migration <strong>and</strong> patterns of l<strong>and</strong> ownership in the Densu valley near Suhum, Ghana.Transactions <strong>and</strong> Papers of the Institute of British Geographers. 33.Idinoba, M.; Nkem, J.; Kalame, F.B.; Tachie-Obeng, E.; Gyampoh, B. 2009. Dealing with limitation of forestecosystem services through a <strong>vulnerability</strong> <strong>assessment</strong> <strong>and</strong> planed <strong>adaptation</strong> actions. In: April 26-30International Human Dimensions Programme Open Meeting. Bonn, Germany: International HumanDimensions Programme on Global Environmental Change. 20 p.International Cocoa Organization (ICCO). 2009. Annual Report. London, UK. 36 p.Impraim, C. 2011. Personal communication. Lead fisherman. Winneba, Ghana.GHANA CLIMATE CHANGE VULNERABILITY AND ADAPTATION ASSESSMENT 191
IPCC. 2007. Climate Change 2007: The Physical Science Basis. Contribution of Working Group I to theFourth Assessment Report of the Intergovernmental Panel on Climate Change [Solomon, S., D. Qin,M. Manning, Z. Chen, M. Marquis, K.B. Averyt, M. Tignor <strong>and</strong> H.L. Miller (eds.)]. CambridgeUniversity Press, Cambridge, United Kingdom <strong>and</strong> New York, NY, USA, 996 pp.http://www.ipcc.ch/ipccreports/ar4-wg1.htmIPCC. 2007. Summary for Policymakers. In: Climate Change 2007: The Physical Science Basis. Contributionof Working Group I to the Fourth Assessment Report of the Intergovernmental Panel on ClimateChange [Solomon, S., D. Qin, M. Manning, Z. Chen, M. Marquis, K.B. Averyt, M.Tignor <strong>and</strong> H.L.Miller (eds.)]. Cambridge University Press, Cambridge, United Kingdom <strong>and</strong> New York, NY, USA.http://www.ipcc.ch/pdf/<strong>assessment</strong>-report/ar4/wg1/ar4-wg1-spm.pdfIPCC. 2007. Climate Change 2007: Synthesis Report. Contribution of Working Groups I, II <strong>and</strong> III to theFourth Assessment Report of the Intergovernmental Panel on Climate Change [Core Writing Team,Pachauri, R.K <strong>and</strong> Reisinger, A. (eds.)]. IPCC, Geneva, Switzerl<strong>and</strong>, 104 pp.http://www.ipcc.ch/pdf/<strong>assessment</strong>-report/ar4/syr/ar4_syr.pdfISSER. No Date. L<strong>and</strong> Tenure, L<strong>and</strong> Use <strong>and</strong> Environment in Ghana.Jenik, J. <strong>and</strong> J. B. Hall. 1976. Plant communities of the Accra Plains, Ghana. Folia Geobot. Phytotax.,Praha, 11:163-212.Jones, P. G. <strong>and</strong> P. K. Thornton (2003). "The potential impacts of <strong>climate</strong> <strong>change</strong> on maize production inAfrica <strong>and</strong> Latin America in 2055." Global Environmental Change 13(1): 51-59.Jung G. 2006. Regional Climate Change <strong>and</strong> the Impact on Hydrology in the Volta Basin of West Africa.Dissertation, Garmisch-Partenkirchen, Germany. Available from:http://www.glowa.org/de/literaturliste/dateien/doc_thesis_jung.pdf; accessed April 2011.Kalame, F.B., 2009. The modified taungya system in Ghana’s transitional zone.Kanninen, M. et al., 2007. Do trees grow on money? the implications of deforestation research for policies topromote REDD. Serie Centroamericana de Bosques y Cambio Climático (FAO). 23(4).Karsenty, A., Guéneau, S., Capistrano, D., Singer, B. <strong>and</strong> Peyron, J., 2008. Summary of the Proceedings of theInternational Workshop “The International Regime, Avoided Deforestation <strong>and</strong> the Evolution ofPublic <strong>and</strong> Private Policies Towards Forests in Developing Countries” held in Paris, 21-23rdNovember 2007. International Forestry Review, 10(3): 424-428.Kasanga, K. 1994. L<strong>and</strong> Tenure Systems <strong>and</strong> Ecological Degradation in Northern Ghana; What Role forLocal Authorities? The Royal Institution of Chartered Surveyors, London.Kasanga, K.; Kotey, N.A. 2001. L<strong>and</strong> management in Ghana: Building on tradition <strong>and</strong> modernity. Preparedfor Department for International Development, London.Kasei, R. A. 2009. Modelling impacts of <strong>climate</strong> <strong>change</strong> on water resources in the Volta Basin, West Africa.Dissertation, Rheinischen Friedrich-Wilhelms-Universität Bonn, Germany.Kasperson, J.X.; Kasperson, R.E., eds. 2001. Global Environmental Risk. UN University Press <strong>and</strong> EarthscanPublications. Tokyo <strong>and</strong> London.Kelly, P.M. <strong>and</strong> Adger, W.N., 2000. Theory <strong>and</strong> practice in assessing <strong>vulnerability</strong> to <strong>climate</strong> <strong>change</strong><strong>and</strong>Facilitating <strong>adaptation</strong>. Climatic Change, 47(4): 325-352.Koranteng, K.A. 1984. A trawling Survey off Ghana, CECAF/TECH/84/63. Dakar, Senegal: CECAFProject (FAO). 72 p.192 GHANA CLIMATE CHANGE VULNERABILITY AND ADAPTATION ASSESSMENT
Koranteng, K.A. 1995. The Ghanaian fishery for sardinellas. Pages 290–299 in Dynamics <strong>and</strong> Use ofSardinella Resources from Upwelling off Ghana <strong>and</strong> Ivory Coast. F.X. Bard, <strong>and</strong> K. Koranteng,editors. ORSTOM Edition, Paris.Koranteng, K.A. 1998. The impacts of environmental forcing on the dynamics of demersal fishery resourcesof Ghana. PhD Thesis, University of Warwick, UK. 376 p.Koranteng, K. 2004. The Ghanaian Fishery for Sardinellas. Pages 243-257 in F.X. Bard <strong>and</strong> K.A. Koranteng,editors. Dynamics <strong>and</strong> Use of Sardinella Resources from Upwelling off Ghana <strong>and</strong> Ivory Coast. Paris,OSTROM Editions.Koranteng, K.A., <strong>and</strong> J.M. McGlade. 2001. Climatic trends in continental shelf waters off Ghana <strong>and</strong> in theGulf of Guinea, 1963-1992. Oceanologica Acta 24(2):187-198.Koranteng , K.A., Ofori-Danson, P.K., <strong>and</strong> Entsua-Mensah, M. 2000. Fish <strong>and</strong> fisheries of the Muni lagoonin Ghana, West Africa. Biodiversity <strong>and</strong> Conservation 9:487-499.Koranteng, K. <strong>and</strong> D. Pauly. 2004. Long-term trends in demersal fishery resources of Ghana in response tofishing pressure. In: M.L.D. Palomares, <strong>and</strong> D. Pauly, editors. West African marine ecosystems:models <strong>and</strong> fisheries impacts. Fisheries Centre Research Reports 12(7). Fisheries Centre, UBC,Vancouver.Kunstmann H <strong>and</strong> Jung G (2005) Impact of regional <strong>climate</strong> <strong>change</strong> on water availability in the Volta basin ofWest Africa. In: Regional Hydrological Impacts of Climatic Variability <strong>and</strong> Change. IAHS Publ. 295.Available from: http://www.glowavolta.de/fileadmin/template/Glowa/Downloads/Kunstmann_jung_2005.pdf;accessed April 2011Kurukulasuriya, P., R. Mendelsohn, et al. (2006). "Will African agriculture survive <strong>climate</strong> <strong>change</strong>?" TheWorld Bank Economic Review 20(3): 367.Kurukulasuriya, P. <strong>and</strong> S. Rosenthal (2003). Climate <strong>change</strong> <strong>and</strong> agriculture: A review of impacts <strong>and</strong><strong>adaptation</strong>s. Climate Change Series, Environment Department, the World Bank.Lakhan, V.C., 2005. Coastal modelling <strong>and</strong> simulation. In: Schwartz, M.L. (Ed.), In Encyclopedia of CoastalScience. Springer, The Netherl<strong>and</strong>s, pp. 266–269.Langyintuo, A. S., E. K. Yiridoe, et al. 2005. Yield <strong>and</strong> income risk efficiency analysis of alternative systemsfor rice production in the Guinea Savannah of Northern Ghana. Agricultural Economics 32(2): 141-150.Laris, P. <strong>and</strong> D. A. Wardell (2006). Good, bad or'necessary evil'? Reinterpreting the colonial burningexperiments in the savanna l<strong>and</strong>scapes of West Africa. Geographical Journal 172(4): 271-290.Laube, W., C. Leemhius, <strong>and</strong> B. Amisigo. 2008. Impact of <strong>climate</strong> <strong>change</strong> on the Black Volta Basin <strong>and</strong> theBui dam. GLOWA Volta Policy Brief, Bonn. 3 p.Leemhuis, C., G. Jung, R. Kasei, <strong>and</strong> J. Liebe. 2009. The Volta Basin Water Allocation System: assessing theimpact of small-scale reservoir development on the water resources of the Volta basin, West Africa.Advances in Geoscience 21:57–62Lehner, Bernhard. 2005. Climate <strong>change</strong>, human water use, <strong>and</strong> freshwater ecosystems in Africa: Lookingtoward the future. Pages 86-89 in Michele L. Thieme, Robin Abell, Melanie L. J. Stiassny, PaulSkelton, Bernhard Lehner, Guy G. Teugels, Eric Dinerstein, Andre Kamdem, Toham, Neil Burgess,<strong>and</strong> David Olson. Freshwater Ecoregions of Africa <strong>and</strong> Madagascar, A Conservation Assessment.Isl<strong>and</strong> Press, Washington, D.C.GHANA CLIMATE CHANGE VULNERABILITY AND ADAPTATION ASSESSMENT 193
Lemoalle, J., <strong>and</strong> D. de Condappa. 2009. Water atlas of the Volta Basin. Volta Basin Focal Project (BFPVolta), PN55, Challenge Program on Water <strong>and</strong> Food, Consultative Group on InternationalAgricultural Research. Colombo, Marseille, France.Lokko , P., E. Asibey-Berko, <strong>and</strong> G. Nerquaye-Tetteh, G. 2001. Iodine content of marine fish in Ghana.Ghana Journal of Science 41:43-48Ly, C. K. 1980. The role of Akosombo dam on the Volta River in causing coastal erosion in central <strong>and</strong>eastern Ghana (West Africa). Marine Geology 37:323-332.Malhi, Y. <strong>and</strong> Wright, J., 2004. Spatial patterns <strong>and</strong> recent trends in the <strong>climate</strong> of tropical rainforest regions.Philosophical Transactions of the Royal Society of London. Series B: Biological Sciences, 359(1443):311.Marfo, E., Halladay, P., Zagt, R. <strong>and</strong> Wit, M., 2010. Chainsaw Milling in Ghana: Context, drivers <strong>and</strong> impacts.Tropenbos International, Wageningen, the Netherl<strong>and</strong>s, 12: 64.Marquette, C.M., K.A. Koranteng, R. Overa, <strong>and</strong> E.B.D. Eryeetey E.B.D. 2002. Small-scale fisheries,population dynamics <strong>and</strong> resource use in Africa: The case of Moree, Ghana. Ambio 31(4):324-336.Maurer, E.P., Adam, J.C., Wood, A.W. 2009. Climate model based consensus on the hydrologic impacts of<strong>climate</strong> <strong>change</strong> to the Rio Lempa basin of Central America, Hydrology <strong>and</strong> Earth System Sciences,13: 183-194.McSweeney, C., M. New, <strong>and</strong> G. Lizcano. not dated. UNDP Climate Change Country Profiles: Ghana.UNDP Climate Change Country Profiles, School of Geography <strong>and</strong> Environment, University ofOxford, Oxford, United Kingdom. Available from: http://country-profiles.geog.ox.ac.uk; accessedApril 2011.Meehl, G. A., Covey, C., Delworth, T., Latif, M., McAvaney, B., Mitchell, J.F.B., Stouffer, R.J., Taylor, K.E.2007. The WCRP CMIP3 multi-model dataset: A new era in <strong>climate</strong> <strong>change</strong> research. Bulletin of theAmerican Meteorological Society, 88: 1383-1394.Menczer, K. <strong>and</strong> E. Quaye. 2006. USAID/Ghana Environmental Threats <strong>and</strong> Opportunities Assessment(FAA 118/9 Assessment). USAID, Accra, Ghana.Mensah-Bonsu, A.<strong>and</strong> D B. Sarpong. (Unknown Date). L<strong>and</strong> Tenure System <strong>and</strong> L<strong>and</strong> for Farming in Ghana: AnEmpirical Analysis of Factors Affecting Access <strong>and</strong> Security. Theme: Customary <strong>and</strong> Statutory L<strong>and</strong> Tenure <strong>and</strong>L<strong>and</strong> Policy in Ghana. University of Ghana, Institute of Statistical, Social <strong>and</strong> Economic Research.Mensah, J. V. 1997. Causes <strong>and</strong> effects of coastal s<strong>and</strong> mining in Ghana. Singapore Journal of TropicalGeography 18:69-88.Mensah, M.A. 1995. The occurrence of zooplankton off Tema during the period 1969–1992. Pages 279–289in Dynamics <strong>and</strong> Use of Sardinella Resources from Upwelling off Ghana <strong>and</strong> Ivory Coast. F. X. Bard,<strong>and</strong> K. A. Koranteng, editors. ORSTOM Editions, Paris.Mensah, M.A., <strong>and</strong> K.A. Koranteng. 1988. A review of the oceanography <strong>and</strong> fisheries resources in thecoastal waters of Ghana, 1981–1986. Marine Fisheries Research Report 8. 35 pp.Minia, Z. 2008. Climate <strong>change</strong> scenario development. Pages 2-13 in W. K. Agyemang-Bonsu, editor. GhanaClimate Change Impacts, Vulnerability <strong>and</strong> Adaptation Assessments. Environmental ProtectionAgency, Accra, Ghana.Moritz, Mark. 2010. Underst<strong>and</strong>ing Herder-Farmer Conflicts in West Africa: Outlines of a ProcessualApproach. Human Organization 69(2):138-148.194 GHANA CLIMATE CHANGE VULNERABILITY AND ADAPTATION ASSESSMENT
MSE (Ministry of Science <strong>and</strong> Agriculture). 2002. National biodiversity strategy for Ghana. Ministry ofScience <strong>and</strong> Agriculture. Accra, Ghana.Müller, C., Cramer, W., Hare, W.L. <strong>and</strong> Lotze-Campen, H., 2011. Climate <strong>change</strong> risks for Africanagriculture. Proceedings of the National Academy of Sciences, 108(11): 4313-4315.Nelson, W., Agbey, S.N.D. 2005. Linkages between poverty <strong>and</strong> <strong>climate</strong> <strong>change</strong>: <strong>adaptation</strong> for livelihood ofthe poor in Ghana. Report. Accra, Ghana: Climate <strong>and</strong> Development Knowledge Network. 71 p.Nelson, W., Agbey, S.N.D. Climate <strong>change</strong> <strong>and</strong> poverty linkages. In: Allotey, J.; Mensah, L.; eds. Ghana<strong>climate</strong> <strong>change</strong> impacts, <strong>vulnerability</strong> <strong>and</strong> <strong>adaptation</strong> <strong>assessment</strong>s, under the Netherl<strong>and</strong>s <strong>climate</strong>assistance programme. Accra, Ghana: Environmental Protection Agency: 169-206. Chapter 5.Nicholson, S. E., B. Scom, <strong>and</strong> K. Kone. 2000. An analysis of recent rainfall conditions in west Africa,including the rainy seasons of the 1997 El Niño <strong>and</strong> the 1998 La Niña years. Journal of Climate13:2628-2640.Nunoo F.K.E., Boaten J.O., Ahulu A.M., Agyekum K.A., Sumaila U.R. (2009) When trash fish is treasure: thecase of Ghana in West Africa, Fisheries Research 96:167-172>O’Brien, K., Eriksen, S., Schjolden, A. <strong>and</strong> Nygaard, L., 2004a. What’s in a word. Conflicting interpretationsof <strong>vulnerability</strong> in <strong>climate</strong> <strong>change</strong> research. Oslo, Senter for klimaforskning: Working paper: 16.O’Brien, K.; Leichenko, R.; Kelkar, U.; Venema, H.; A<strong>and</strong>ahl, G.; Tompkins, H.; Javed, A.; Bhadwal, S.; Barg,S.; Nygaard, L.; West, J. 2004b. Mapping <strong>vulnerability</strong> to multiple stressors: <strong>climate</strong> <strong>change</strong> <strong>and</strong>globalization in India. Global Environmental Change. 14: 303-313.Oldeman, L. R., R. T. A. Hakkeling, <strong>and</strong> W. G. Sombroek. 1991. World Map of the Status of Human-inducedSoil Degradation (GLASOD): An Explanatory Note, International Soil Reference <strong>and</strong> InformationCentre, Wageningen. Available from: http://www.fao.org/l<strong>and</strong><strong>and</strong>water/agll/glasod/glasodmaps.jsp;accessed 20 April 2011.Oppong-Anane, K. 2001. Ghana: Country Pasture/Forage Resource Profiles. Grassl<strong>and</strong> <strong>and</strong> Pasture CropsGroup, Food <strong>and</strong> Agriculture Organization. Available fromhttp://www.fao.org/ag/AGP/agpc/doc/pasture/forage.htm, (updated 2006) accessed April 2011.Osafo, Y.B. 2010. A review of tree tenure <strong>and</strong> l<strong>and</strong> rights in Ghana <strong>and</strong> their implication for carbon rights ina REDD+ scheme. Redd-net.org. http://redd-net.org/files/Ghana%20Case%20Study.pdfOsei-Owusu, Y. 2011. Personal interview. Country Director, Conesrvation Alliance. Accra, Ghana. February22 nd , 2011.Otsuka, K.; Aidoo, J.B.; Tachibana, T.; Quisumbing, A.R. Date unknown. Causes <strong>and</strong> consequences ofchanging l<strong>and</strong> tenure institutions in western Ghana. Policy Brief. Gender <strong>and</strong> forest resourcemanagement: a comparative study in selected areas of Asia <strong>and</strong> Africa. International Food PolicyResearch Institute, Washington DC. 2 pgs.Place, F.; Hazell, P. 1993. Productivity effects onindigenous l<strong>and</strong> tenure systems in Sub-Saharan Africa. American Journal of Agricultural Economics.75(1): 10-19.OWGT 2911. Official Website of Ghana Tourism. http://www.touring<strong>ghana</strong>.com/ecotourism/mole.asp(May 2, 2011)Owusu-Ansah, D. 1994. The Society <strong>and</strong> Its Environment. In A Country Study: Ghana. L. V. Berry, editor.Library of Congress, Country Studies. Federal Research Division, Library of Congress. Available:http://memory.loc.gov/frd/cs/cshome.html, accessed April 2011GHANA CLIMATE CHANGE VULNERABILITY AND ADAPTATION ASSESSMENT 195
Pauly, D., V. Christensen, J. Dalsgaard, R. Froese <strong>and</strong> F.C. Torres Jr. 1998. Fishing down marine food webs.Science 279:860-863.Pezennec O. 1995. Ecological importance of the Ivorian <strong>and</strong> Ghanaian minor upwelling season. Pages 324-345 in F.X. Bard <strong>and</strong> K.A. Koranteng, editors. Dynamics <strong>and</strong> Use of Sardinella Resources fromUpwelling off Ghana <strong>and</strong> Ivory Coast. Editions ORSTOM, Paris.Perry R.I, <strong>and</strong> U.R Sumaila. 2007. Marine ecosystem variability <strong>and</strong> human community responses: Theexample of Ghana, West Africa. Marine Policy 31:125-134.Place, F.; Migot-Adholla, S.E. 1998. The economic effect of l<strong>and</strong> registration on smallholder farms in Kenya:Evidence from Nyeri <strong>and</strong> Kakamega Districts. L<strong>and</strong> Economics. 74(1): 360-373.Prosterman, R.L.; Hanstad, T. 2003. L<strong>and</strong> reform in the 21 st century: New challenges, New responses. RDIreports on foreign aid <strong>and</strong> development, Rural Development Institute. 117.Quagraire, F. 2011. Personal Communication. Program Manager, Oil <strong>and</strong> Gas Platform, Publish What YouPay Ghana. Accra, Ghana.Quan, J. 1997. The importance of l<strong>and</strong> tenure to poverty reduction <strong>and</strong> sustainable development in Africa:summary of findings. Chatham, Natural Resource Institute.Rahaman, A.S.; Lawrence, S.; Roper, J. 2004. Social <strong>and</strong> environmental reporting at the VRA: institutionalizedlegitimacy or legitimation crises? Critical Perspectives on Accounting. 15(2004): 35-56.Rahmstorf, S., Cazenave, A., Church, J.A., Hansen, J.E., Keeling, R.F., Parker, D.E., Somerville, R.C.J., 2007.Recent <strong>climate</strong> observations compared to projections. Science 316 (5825), 709.Ramos A.R., Yraola I.S., Peralta L.F, Jimenez J.F.G. (1990) Informe de la Campana Guinea 90. InstitutoEspañol de Oceanografia, Malaga.Raschid, L.S.; Koranteng, R.T.; Akoto, E.K. [no date]. Research, development, <strong>and</strong> capacity building for thesustainability of dam development with special reference to the Bui Dam project. Accra, Ghana: TheInternational Water Management Institute. Submitted to: National Coordinating Committee ofGhana Dams Forum, Accra, Ghana.http://<strong>ghana</strong>damsdialogue.iwmi.org/Data/Sites/2/media/projectdocuments/issuepaper-r&d.pdf.(May 5, 2011).Reich, P. F., S.T. Numbem, R.A. Almaraz <strong>and</strong> H. Eswaran. 2001. L<strong>and</strong> resource stresses <strong>and</strong> desertification inAfrica. Pages (not paginated) in E. M. Bridges, I.D. Hannam, L.R. Oldeman, F.W.T. Pening de Vries,S.J. Scherr, <strong>and</strong> S. Sompatpanit, editors. Responses to L<strong>and</strong> Degradation. Proceedings 2ndInternational Conference on L<strong>and</strong> Degradation <strong>and</strong> Desertification, Khon Kaen, Thail<strong>and</strong>. OxfordPress, New Delhi, India. Available from:http://soils.usda.gov/use/worldsoils/papers/desertification-africa.html; accessed 20 April 2011.Renaud, F. <strong>and</strong> Perez, R., 2010. Climate <strong>change</strong> <strong>vulnerability</strong> <strong>and</strong> <strong>adaptation</strong> <strong>assessment</strong>s. SustainabilityScience: 1-3.Reuters. 2011. Ghana taps Trinidad for natural gas joint venture. March 17, 2011. Available from:http://<strong>ghana</strong>oilonline.org/2011/03/<strong>ghana</strong>-taps-trinidad-for-natural-gas-joint-venture/; accessed 2May 2011.Robertson, B. <strong>and</strong> P. Pinstrup-Andersen (2010). "Global l<strong>and</strong> acquisition: neo-colonialism or developmentopportunity?" Food Security 2(3): 271-283.196 GHANA CLIMATE CHANGE VULNERABILITY AND ADAPTATION ASSESSMENT
Rubin, J.A.; Gordon, C.; Amatekpor, J.K. 1998. Causes <strong>and</strong> consequences of mangrove deforestation in theVolta estuary, Ghana: some recommendations for ecosystem rehabilitation. Marine Pollution Bulletin.37(8-12):441-449.Rünger, M. (8-11 March, 2006). 'Governance, L<strong>and</strong> Rights <strong>and</strong> Access to L<strong>and</strong> in Ghana - A DevelopmentPerspective on Gender Equity.’ Quoted in Gedzi, V. 2009. Women <strong>and</strong> Property Inheritance afterIntestate Succession, Law 111 in Ghana. Presented at IAFFE Conference. Boston, 25-28 June 2009.Sagoe, R. (2006). Climate <strong>change</strong> <strong>and</strong> root crop production in Ghana. A report prepared for EnvironmentalProtection Agency (EPA), Accra-Ghana February.Sagoe, R. 2008. Climate <strong>change</strong> impacts on root <strong>and</strong> tuber crop production. In: Allotey, J.; Mensah, L.; eds.Ghana <strong>climate</strong> <strong>change</strong> impacts, <strong>vulnerability</strong> <strong>and</strong> <strong>adaptation</strong> <strong>assessment</strong>s, under the Netherl<strong>and</strong>s<strong>climate</strong> assistance programme. Accra, Ghana: Environmental Protection Agency: 207-233. Chapter 6.S<strong>and</strong>ker, M., S. K. Nyame, et al. (2010). "REDD payments as incentive for reducing forest loss."Conservation Letters 3(2): 114-121.Sarewitz, D., Pielke Jr, R. <strong>and</strong> Keykhah, M., 2003. Vulnerability <strong>and</strong> risk: some thoughts from a political <strong>and</strong>policy perspective. Risk Analysis, 23(4): 805-810.Schlecht, E., A. Buerkert, et al. (2006). "A critical analysis of challenges <strong>and</strong> opportunities for soil fertilityrestoration in Sudano-Sahelian West Africa." Nutrient Cycling in Agroecosystems 76(2): 109-136.Schneider, S.H. et al., 2007. Assessing key vulnerabilities <strong>and</strong> the risk from <strong>climate</strong> <strong>change</strong>. Climate <strong>change</strong>:779-810.Schröter, D., Polsky, C. <strong>and</strong> Patt, A.G., 2005. Assessing vulnerabilities to the effects of global <strong>change</strong>: an eightstep approach. Mitigation <strong>and</strong> Adaptation Strategies for Global Change, 10(4): 573-595.Scoones, I. 1998. Sustainable rural livelihoods: a framework for analysis. Working Paper 72. [place ofpublication unkown]. Institute of Development Studies. 22 p.Smit, B. <strong>and</strong> W<strong>and</strong>el, J., 2006. Adaptation, adaptive capacity <strong>and</strong> <strong>vulnerability</strong>. Global Environmental Change,16(3): 282-292.Soussana, J.-F., A.-I. Graux, et al. (2010). "Improving the use of modelling for projections of <strong>climate</strong> <strong>change</strong>impacts on crops <strong>and</strong> pastures." Journal of Experimental Botany 61(8): 2217-2228.SRID (Statistics, Research <strong>and</strong> Information Directorate). 2010. Agriculture in Ghana (2009). Facts <strong>and</strong>figures. Ministry of Food <strong>and</strong> Agriculture. Accra, Ghana. Available fromhttp://www.mofa.gov.gh/AGRICULTURE%20IN%20GHANA%20%202009.pdf, accessed April2011.Tanser, F. C., B. Sharp, et al. (2003). "Potential effect of <strong>climate</strong> <strong>change</strong> on malaria transmission in Africa."The Lancet 362(9398): 1792-1798.Taylor, J.C., N. van de Giesen, T.S. Steenhuis. West Africa: Volta discharge data <strong>and</strong> quality <strong>assessment</strong> <strong>and</strong>use. Journal of the American Water Resources Association 2006 (August):1113-1126.Teal, F.; Zeitlin, A.; Maamah, H. 2006. Ghana Cocoa Farmers Survey 2004: Report to Ghana Cocoa Board.Centre for the Study of African Economies, University of Oxford. 26p. online athttp://www.gprg.org/pubs/reports/pdfs/2006-04-teal-zeitlin-maamah.pdfTonah, S. 2006. Migration <strong>and</strong> Farmer-Herder Conflicts in Ghana's Volta Basin. Canadian Journal of AfricanStudies 40(1): 152-178.GHANA CLIMATE CHANGE VULNERABILITY AND ADAPTATION ASSESSMENT 197
Tsidzi, K. E. N., <strong>and</strong> N. K. Kumapley. 2001. Coastal erosion in Ghana: causes <strong>and</strong> mitigation strategies.Pages 3941-3945 in Engineering Geology <strong>and</strong> the Environment, Proceedings InternationalSymposium on Engineering, Geology <strong>and</strong> the Environment, Athens, Greece, 23-27 June 1997. P. G.Marinos <strong>and</strong> Greek National Group of IAEG, editors. Swets & Zeitlinger, Lisse.Tsikata, D. 2006. Living in the shadow of the large dams: long term responses of downstream <strong>and</strong> lakesidecommunities of Ghana’s Volta project. Leiden, Netherl<strong>and</strong>s: Brill.Tubiello, F. N., J.-F. Soussana, et al. (2007). "Crop <strong>and</strong> pasture response to <strong>climate</strong> <strong>change</strong>." Proceedings ofthe National Academy of Sciences 104(50): 19686-19690.Tullow Ghana Limited. 2009. Ghana Jubilee Field Phase 1 Development, DRAFT Non Technical ExecutiveSummary of the Environmental Impact Statement. Tullow Ghana Limited, Accra, Ghana.Turner, B. L., R. E. Kasperson, et al. (2003). "A framework for <strong>vulnerability</strong> analysis in sustainability science."Proceedings of the National Academy of Sciences of the United States of America 100(14): 8074.UNCCD (United Nations Convention to Combat Desertification). 1994. Elaboration of an internationalconvention to combat desertification in countries experiencing serious drought <strong>and</strong>/or desertificationparticularly in Africa. United Nations General Assembly. Available from:http://www.unccd.int/convention/text/pdf/conv-eng.pdf; accessed 18 April 2011.UNCCD (United Nations Convention to Combat Desertification). 2002. An introduction to the UnitedNations Convention to Combat Desertification. Fact Sheet 1-13. Availablefrom: http://www.unccd.int; accessed April 2011.UNEP (United Nations Environmental Program). 1997. World atlas of desertification ( 2nd edition). UnitedNations Environmental Programme, Nairobi, Kenya.University of South Carolina, Hazards <strong>and</strong> Vulnerability Research Institute. Social Vulnerability Index for theUnited States. http://webra.cas.sc.edu/hvri/products/sovi.aspx. February 7, 2011. (April 26, 2011).US Agency for International Development Ghana. 2011. (USAID 2011). Feed the future: Initialenvironmental examination <strong>and</strong> request for categorical exclusion. 58 p. Unpublished report. On filewith: USAID Ghana, Economic Growth Program, No. 24 Fourth Circular, Cantonments, Accra,Ghana.Valentin, C., J. L. Rajot, et al. (2004). "Responses of soil crusting, runoff <strong>and</strong> erosion to fallowing in the subhumid<strong>and</strong> semi-arid regions of West Africa." Agriculture, ecosystems & environment 104(2): 287-302.van de Giesen, M., Andreini, A. van Edig, <strong>and</strong> P. Vlek. 2001. Competition for water resources of the VoltaBasin. Regional Management of Water Resources. IAHS Publication Number 268.Van der Geest, K. 2004. We’re managing! Climate <strong>change</strong> <strong>and</strong> livelihood <strong>vulnerability</strong> in Northwest Ghana.Research Report 74/2004. Leiden, Netherl<strong>and</strong>s: African Studies Centre. 289 p.Van der Geest, K. 2008. North-South migration in Ghana: what role for the environment? In: 2008International conference: Environment, Forced Migration & Social Vulnerability. Bonn, Germany.[place of publication unkown].van Tilburg, X., <strong>and</strong> L. Würtenberger. 2010. Emissions from flaring Jubilee field gas. Policy Brief, TechnicalAssistance to the Ghanaian National Climate Change Policy Framework, Energy Research Center forthe Netherl<strong>and</strong>s, Amsterdam.Virmani, S.M., Katyal, J.C., Eswaran, H. <strong>and</strong> Abrol, I., eds. 1994. Stressed Agroecosystems <strong>and</strong> SustainableAgriculture. New Delhi: Oxford & IBH.198 GHANA CLIMATE CHANGE VULNERABILITY AND ADAPTATION ASSESSMENT
Wagner, M.R. <strong>and</strong> Cobbinah, J.R., 1993. Deforestation <strong>and</strong> sustainability in Ghana. Journal ofForestry;(United States), 91(6).Wardell, D.A. <strong>and</strong> Lund, C., 2006. Governing access to forests in northern Ghana: micro-politics <strong>and</strong> therents of non-enforcement. World development, 34(11): 1887-1906.Wardell, D.A., Reenberg, A. <strong>and</strong> Tøttrup, C., 2003. Historical footprints in contemporary l<strong>and</strong> use systems:forest cover <strong>change</strong>s in savannasavanna woodl<strong>and</strong>s in the Sudano-Sahelian zone. GlobalEnvironmental Change, 13(4): 235-254.Whitehead, A. 2002. Tracking Livelihood Change: Theoretical, Methodological <strong>and</strong> Empirical Perspectivesfrom North-East Ghana. Journal of Southern African Studies 28(3): 575-598.Wiafe, G., Yaqub, H.B., Mensah, M.A., <strong>and</strong> Frid, C.L.J. 2008. Impact of <strong>climate</strong> <strong>change</strong> on long-termzooplankton biomass in the upwelling region of the Gulf of Guinea. – ICES Journal of MarineScience, 65: 318–324.Wood, A.W., Leung, L.R., Sridhar, V., Lettenmaier, D.P. 2004. Hydrologic implications of dynamical <strong>and</strong>statistical approaches to downscaling <strong>climate</strong> model outputs. Climatic Change, 62: 189–216.World Bank. 2011. Fact sheet: first global satellite survey on gas flaring. Global Gas Flaring ReductionProject, World Bank. Available from:http://web.worldbank.org/WBSITE/EXTERNAL/TOPICS/EXTOGMC/EXTGGFR; accessed 2May 2011.WTTC 2011. World Travel <strong>and</strong> Tourism Council. 2011. Travel <strong>and</strong> tourism economic impact, 2011: Ghana.16 p. On file with: World Travel & Tourism Council, 1-2 Queen Victoria Terrace, Soverign Court,London, UK. http://www.wttc.org/bin/file/original_file/<strong>ghana</strong>_report_2011-pdf.pdf (May 3, 2011).Yaro, J.A.; Zackaria, A.I. 2006. Evolving L<strong>and</strong> Tenure Systems <strong>and</strong> Sustainable livelihoods in NorthernGhana. Draft Report. On file with the L<strong>and</strong> Tenure <strong>and</strong> Policy Research Project. University ofGhana.Yiridoe, E. K., A. S. Langyintuo, et al. (2006). "Economics of the impact of alternative rice cropping systemson subsistence farming: Whole-farm analysis in northern Ghana." Agricultural Systems 91(1-2): 102-121.Zhang, X. <strong>and</strong> X. Cai (2011). "Climate <strong>change</strong> impacts on global agricultural l<strong>and</strong> availability." EnvironmentalResearch Letters 6: 014014.GHANA CLIMATE CHANGE VULNERABILITY AND ADAPTATION ASSESSMENT 199
APPENDIX 1. TEAM ITINERARY AND CONTACTSDate Organization Interviewee Position Contact Tel. Contact Email Web Address21-Feb-11 Publish What youPay - Ghana21-Feb-11 Publish What youPayMohammedAmin Adam21-Feb-11 Public Agenda FrederickAsiamah22-Feb-11 ConservationAlliance22-Feb-11 ConservationAllianceNational OilCoordinatorFreida Quagraire Program Manager, Oil<strong>and</strong> Gas PlatformYaw Osei -OwusuErnestina Doku-Marfo22-Feb-11 USAID Nino Nadiradze Office of EconomicGrowth, SeniorEnvironmental Officer22-Feb-11 USAID Allen Fleming Economic GrowthOffice, Office Director22-Feb-11 USAID John Mullenax Economic GrowthOffice, Advisor,Presidential Initiative toEnd Hunger in Africa22-Feb-11 Ghana EPA Mr. Apombwe Head of NationalClimate Change Unit+233-20-8382222 tabat15@yahoo.com www.pwyp-<strong>ghana</strong>.orgwww.pwyp-<strong>ghana</strong>.orgCoordinator www.publicagenda<strong>ghana</strong>.orgCountry Director +233-21-780-906,+233-244-277-795Conservation Biologist +233-21-780-906,+233-244-844-459 (M)yosei-owusu@conservealliance.orgedokumarfo@conservealliance.org,tinammarfo@yahoo.comwww.conservealliance.orgwww.conservealliance.org+233-24-431-3526 nnadiradze@usaid.gov www.usaid.gov/gh+233-030-274-1132 ,+233-244-313-530(M)+233 030 274 1403,+233 024 431 3543 (M)allen@usaid.gov http://www.usaid.gov/ghjmullenax@usaid.gov http://www.usaid.gov/ghBegin Field Trip to Northern Region, Mole NP, Tamale February 23-25, 2011 Trip Included the following meetings <strong>and</strong> interviews:23-Feb-11 Mole National Park Enoch Ashie Manager of NaturalResources23-Feb-11 Mognori 17 individuals, 1interpreter24-Feb-11 University forDevelopmentStudiesWilliam JasperAsanteChief, Male CommunityMemberswww.epa.gov.ghvalueseaa@yahoo.com www.touring<strong>ghana</strong>.com/ecotourism/mole.aspwww.savannatourism.com/mognori.htmlProfessor +233-24-420-6175 wjasante@yahoo.com www.uds.edu.gh24-Feb-11 University forDevelopmentEsther EkuaAmoakoProfessor +233-24-420-6175 ekubee@yahoo.com www.uds.edu.gh200 GHANA CLIMATE CHANGE VULNERABILITY AND ADAPTATION ASSESSMENT
Date Organization Interviewee Position Contact Tel. Contact Email Web AddressStudies24-Feb-11 University forDevelopmentStudiesBernardBatuuwie24-Feb-11 CARE International David Sumbo Program Coordinator,TamaleProfessor www.uds.edu.gh+233-071-25700,+233-24-489-4018david.sumbo@co.care.org, www.care.org24-Feb-11 CARE International Romanus Gyang Project Manager (ALP) +233-24-353-3686 www.care.org24-Feb-11 Catholic ReliefServices24-Feb-11 Zasilari EcologicalFarms Project(Walewale)24-Feb-11 Zasilari EcologicalFarms Project(Walewale)Kris H. Ozar Program QualityManager, GhanaIssifu JobilaSulemann25-Feb-11 SARI Matthew Fosu Scientific Officer,Northern RegionFarming SystemsResearch Group25-Feb-11 SARI MohammedAbdul Razak25-Feb-11 UDS Dr. FrancisObeng25-Feb-11 UDS Mr. Conrad A.Weobong25-Feb-11 USAID ADVANCE(AgriculturalDevelopment <strong>and</strong>Value ChainEnhancementProgram)26-Feb-11 SAAI - SustainableAfrican AgriculturalInitiative (Pty) Ltd+233-24-431-7869 kris.ozar@crs.org www.crs.org/<strong>ghana</strong>+233-20-828-3225 zasilari@yahoo.com www.zefp.org/David Agongo Coordinator +233-20-828-3225 zasilari@yahoo.com www.zefp.org/Lecturer, GhanaEcological NetworkLecturer, GhanaEcological Network+233-071-22411+233-071-23257Catherine Phiri Agri Business Advisor +233-03720, +233-27569,+233-37-202-7570Jan Hepburn Chief Executive Officer +27(0)836606569 (M),+27(0)126431225matthewfosu@yahoo.co.uk www.csir.org.gh/index1.php?linkid=117&sublinkid=73N/A aweetauk@yahoo.co.uk www.csir.org.gh/index1.php?linkid=117&sublinkid=73N/A N/A www.uds.edu.ghN/A N/A www.uds.edu.ghcphiri@acdivoca<strong>ghana</strong>.org www.acdivoca.org/site/ID/<strong>ghana</strong>ADVANCEshepagricnig@yahoo.com N/AGHANA CLIMATE CHANGE VULNERABILITY AND ADAPTATION ASSESSMENT 201
Date Organization Interviewee Position Contact Tel. Contact Email Web AddressEnd field trip to Northern Region27-Feb-11 Winneba Fisherman Collins Impraim Lead Fisherman N/A N/A N/A28-Feb-11 USAID CherylAndersonMission Director N/A N/A www.usaid.gov/gh28-Feb-11 USAID Peter Argo Deputy Director N/A N/A www.usaid.gov/gh28-Feb-11 USAID Nino Nadiradze Office of EconomicGrowth, Senior Env.Officer28-Feb-11 USAID Allen Fleming Economic GrowthOffice, Office Director+233-24-431-3526 nnadiradze@usaid.gov www.usaid.gov/gh+233 030-274-1132,+233-24-431-3530(M)allen@usaid.gov www.usaid.gov/gh28-Feb-11 USAID Justice Odoi Environmental Specialist N/A jodoi@usaid.gov www.usaid.gov/gh28-Feb-11 USAID Emil R. Stalis Democracy & SpecialProject Coordinator28-Feb-11 USAID Susan Wright RH & CSID Advisor(Health)+233-030-274-1756,+233-24-431 1936(M)estalis@usaid.gov www.usaid.gov/ghN/A N/A www.usaid.gov/gh28-Feb-11 USAID Luis Tolley Education Advisor N/A N/A www.usaid.gov/gh28-Feb-11 USAID Alfred Osei Food Security Specialist N/A N/A www.usaid.gov/gh28-Feb-11 USAID John Mullenax Economic GrowthOffice, Advisor,Presidential Initiative toEnd Hunger in Africa28-Feb-11 USAID Fenton S<strong>and</strong> Agriculture Advisor,Feed the Future Advisor28-Feb-11 State Department Aaron Fishman Regional Environment,Science, <strong>and</strong> TechnologyOfficer for West &Central Africa, U.SEmbassy Ghana28-Feb-11 Ghana StatisticalServiceN/A+233-030-274-1403,+233-24-431 3543 (M)jmullenax@usaid.gov www.usaid.gov/ghN/A N/A www.usaid.gov/gh+233-21-741-417 FishmanAD@state.gov http://<strong>ghana</strong>.usembassy.govStatistician +233-24-388-8570 N/A www.stats<strong>ghana</strong>.gov.gh1-Mar-11 UNDP- UnitedNationsDevelopmentStephen DuahYentumiHead, Env. & EnergyUnit (ProgrammeSpecialist)+233-21-773890 stephen.duahyentumi@undp.orgwww.undp-gha.org202 GHANA CLIMATE CHANGE VULNERABILITY AND ADAPTATION ASSESSMENT
Date Organization Interviewee Position Contact Tel. Contact Email Web AddressProgram1-Mar-11 CICOL (CivilSociety Coalition onl<strong>and</strong>)1-Mar-11 IUCN (InternationalUnion for theConservation ofNature)Lillian Bruce CICOL Coordinator +233-030-224-0891,+233-24 -461-4303 (M),+233-20-589-1920Samuel KofiNyameProject Coordinator (forNTFP)1-Mar-11 World Bank Flavio Chaves Natural ResourcesManagement Specialist,Africa Environment <strong>and</strong>Natural ResourcesManagement Unit1-Mar-11 Ghana MEST -Ministry ofEnvironment,Science, <strong>and</strong>TechnologyDr. Nicholas K.IddiNaitonal ProjectCoordinator, GhanaEnvironmentalConventionsCoordinating Authority+233-20-821-2486, +233-24-699-6552, +233-27-175-2502+233-30-221-4166, +233-54-675-1033 (M)+233-21-662-626, +233-21-662-626 (M)mail@cicol<strong>ghana</strong>.org,cicol<strong>ghana</strong>@gmail.comsamuel.kofi.nyame@iucn.org,samknyame02@yahoo.comN/Awww.iucn.orgfchaves@worldbank.org http://web.worldbank.orgnicholasiddi@yahoo.com www.<strong>ghana</strong>.gov.gh/index.php?option=com_content&view=article&id=329:ministry-ofenvironment-science-atechnology&catid=74:ministries&Itemid=2241-Mar-11 Ghana MEST -Ministry ofEnvironment,Science, <strong>and</strong>TechnologyDr. RaymondBabanawoProject TechnicalAssistant, GhanaEnvironmentalConventionsCoordinating Authority+233-21-662-626, +233-24-059-5584 (M)babsraymond@yahoo.ca www.<strong>ghana</strong>.gov.gh/index.php?option=com_content&view=article&id=329:ministry-ofenvironment-science-atechnology&catid=74:ministries&Itemid=2242-Mar-11 Civic Response-Forest WatchAbdul-RazakSaeed2-Mar-11 Rainforest Alliance EmmanuelOwusuProgrammes Officer(Climate Governance)Sustainable ForestryDivision, ProjectAdministrator,FCAA/TREES Program,Ghana+233 21 521905, +233244 686 548+233 302 502210, +233244 238252 (M)saeed@civicresponse.orgrazymac@yahoo.comN/Aeowusu@ra.org www.rainforest-alliance.org2-Mar-11 Rainforest Alliance Elvis Kuudaar Community Forestry &Enterprise DevelopmentSpecialist, TREES233 30 250 2210 ekuudaar@ra.org www.rainforest-alliance.orgGHANA CLIMATE CHANGE VULNERABILITY AND ADAPTATION ASSESSMENT 203
Date Organization Interviewee Position Contact Tel. Contact Email Web AddressProgram2-Mar-11 Rainforest Alliance EmmanuelOwusu2-Mar-11 Ministry of L<strong>and</strong>s &Natural Resources3-Mar-11 Ministry of L<strong>and</strong>s &Natural Resources4-Mar-11 Ministry of L<strong>and</strong>s &Natural Resources3-Mar-11 Embassy of theKingdom of theNetherl<strong>and</strong>s3-Mar-11 ForestryCommission,Climate ChangeUnit3-Mar-11 ForestryCommission,Climate ChangeUnit3-Mar-11 ForestryCommission,Wildlife Division3-Mar-11 ForestryCommission,Wildlife Division3-Mar-11 ForestryCommission,Wildlife DivisionJosephOsiakwan(Josky)Project Administrator 233 30 250 2210 eowusu@ra.org www.rainforest-alliance.orgPolicyCoordinator/SeniorPlanning Officer+233 21 687346, +0208182556 (M), +024 9227796 (M)josephosiakwan@yahoo.com www.<strong>ghana</strong>mining.org/ghweb/en/ma/mlnr.htmlMathew Ababio Policy Planning Director N/A abab64math@yahoo.com www.<strong>ghana</strong>mining.org/ghweb/en/ma/mlnr.htmlTabi Agyariw National Coordinator N/A tabimlfl66@yahoo.com www.<strong>ghana</strong>mining.org/ghweb/en/ma/mlnr.htmlDr Ton van derZonFirst Secretary,Environment <strong>and</strong> WaterResources+233 302 214362, +233248894652 (M)Robert K. Bamfo Head, Climate Change +233 302 401210, +233302 7010033, +233 289516504, +233 208237777(M)Roselyn FosuahAdjeiAssistant ProgrammeManagerCletus K. Nateg Operations Manager(Protected Area)021-401210/028 9115496,024 453 5772 (M)028 9115489,0244 722152(M)ton-v<strong>and</strong>er.zon@minbuza.nl www.ambaccra.nl/bamforobert@yahoo.com www.fc<strong>ghana</strong>.comyafossy@yahoo.com www.fc<strong>ghana</strong>.comkcnateg@ymail.com www.fc<strong>ghana</strong>.comCornelia Danso Assistant Wildlife Officer 021 401249 ilacorne@yahoo.co.uk www.fc<strong>ghana</strong>.comS<strong>and</strong>ra Olsen CommercialDevelopment+233 21 401210, 401227,401216, 401231 / 3 / 9info@wd.fc<strong>ghana</strong>.com www.fc<strong>ghana</strong>.com3-Mar-11 ForestryCommission,Wildlife DivisionMohammed Issa Manager +233 21 401210, 401227,401216, 401231 / 3 / 9info@wd.fc<strong>ghana</strong>.com www.fc<strong>ghana</strong>.com204 GHANA CLIMATE CHANGE VULNERABILITY AND ADAPTATION ASSESSMENT
Date Organization Interviewee Position Contact Tel. Contact Email Web Address3-Mar-11 ForestryCommission,Wildlife Division3-Mar-11 ForestryCommission3-Mar-11 ForestryCommission3-Mar-11 ForestryCommission3-Mar-11 Canadian HighCommission, CIDA3-Mar-11 Canadian HighCommission, CIDA3-Mar-11 Canadian HighCommission, CIDA3-Mar-11 Canadian HighCommission, CIDACharlesAmankwahGeneral servicesmanager, wetl<strong>and</strong>sconservation+233 21 401210, 401227,401216, 401231 / 3 / 9camankwah@hq.fc<strong>ghana</strong>.com www.fc<strong>ghana</strong>.comHugh Brown N/A hugh.brown@aya.yale.edu www.fc<strong>ghana</strong>.comKwakyeAmeyewFrancis S.AmoahRomeoAdonmah-DartehSenior EnvironmentalAnalyst/Advisor,Program Support UnitJanine Cocker First Secretary, SeniorDevelopment Officer,Food Security ProgramLoree Semeluk Second Secretary,Development OfficerEunice Annan-AggreyInternationalDevelopment AssistantN/A N/A www.fc<strong>ghana</strong>.comN/A kwegyir2004@yahoo.com www.fc<strong>ghana</strong>.com+233 302 772861/773598ext 1128, +233 263004820 (M), +233 244715772+233-30-221-1521 Ext.3455+233-30-221-1521 Ext.3460romeo.darteh@psu<strong>ghana</strong>.orgjanine.cocker@international.gc.caloree.semeluk@international.gc.ca+233-30-221-1521 eunice.annanaggrey@international.gc.cawww.psu-<strong>ghana</strong>.orgwww.acdi-cida.gc.cawww.acdi-cida.gc.cawww.acdi-cida.gc.ca3-Mar-11 Water ResourcesCommission3-Mar-11 Department ofCommerceEnoch Asare Head, GroundwaterDivisionHeather Byrnes Commercial Attache toU.S. Embassy in Ghana027 288 8499 enochasare@gmail.com www.wrc-gh.orgN/A heatherbyrnesh@state.gov http://<strong>ghana</strong>.usembassy.gov4-Mar-11 Stalwart Mining Tom Powell CEO 054 313 4679 N/A www.stalwartmining.comBegin Field Trip to Central/Western Regions, Cape Coast, Kakum NP, Takoradi March 5-9 Trip included the following meetings <strong>and</strong> interviews:5-Mar-11 Kakum NationalParkDaniel Ewur Park Manager www.touring<strong>ghana</strong>.com/ecotourism/kakum.asp5-Mar-11 Abrafo Area Chiefs 5 Chiefs Chiefs N/A N/A N/A5-Mar-11 Mbaaniaye Village5-Mar-11 University of CapeCoast50+ CommunityMembersDenis WorlanyoAhetoN/A N/A N/A N/AProfessor, IntegratedCoastal ZoneManagement Programworlaheden@yahoo.com www.ucc.edu.ghGHANA CLIMATE CHANGE VULNERABILITY AND ADAPTATION ASSESSMENT 205
Date Organization Interviewee Position Contact Tel. Contact Email Web Address6-Mar-11 Center forEnvironmentalImpact Analysis(CEIA)Samuel Obiri Executive Director +233-24-470-8322 obirisamue@gmail.comsobiri@ceiagh.comwww.ceiagh.com7-Mar-11 CEIA Priscilla Achiaa Program Officer +233-24-470-8322 www.ceiagh.com8-Mar-11 CEIA Faustina Essuon Administrative Secretary +233-24-470-8322 www.ceiagh.com7-Mar-11 Kakum NationalPark8-Mar-11 Ghana PrimewoodProducts8-Mar-11 Coastal ResourceCenter8-Mar-11 Coastal ResourceCenterEnd Field Trip to Central/ Western Regions10-Mar-11 USAID Power PointPresentation11-Mar-11 NatureConservationResearch Center(NCRC)11-Mar-11 NatureConservationResearch Center11-Mar-11 The KatoombaGroupDaniel Ewur Park Manager www.touring<strong>ghana</strong>.com/ecotourism/kakum.aspBenjamin Adgei Forest CertificationManager+233-31-22593 N/AKofi Agbohah Program Coordinator +233 24 467 8007 kofi.agbogah@gmail.com www.crc.uri.edu/index.php?projectid=110Sally Deffor Communications Officer +233-31-2047163, +23320 8177991, +233 261197569John Mason Founder CEO 233-21-231765233 30 223 1765Martin Yelibora Capacity-buildingCoordinatorRebecca AshleyAshareCoordinator WestAfrica Katoomba Grp.12- Mar-11 Team Departs from Ghana (last date, various team members depart various dates)sallydeffor@yahoo.com www.crc.uri.edu/index.php?projectid=110info@ncrc-<strong>ghana</strong>.orgjjmason999@yahoo.comwww.ncrc-<strong>ghana</strong>.org/233-21-231765 info@ncrc-<strong>ghana</strong>.org www.ncrc-<strong>ghana</strong>.org/+233 24 370 9369 rebashley@yahoo.com www.katoombagroup.org206 GHANA CLIMATE CHANGE VULNERABILITY AND ADAPTATION ASSESSMENT
APPENDIX 2. TEAM MEMBERSName Role BackgroundFrederick ArmahIn-Country Coordination,Resource SpecialistBS (Hons)Chemistry, University of Cape Coast, Ghana 2000MS Environmental Studies <strong>and</strong> Sustainability Science, Lund University,Sweden, 2008Steve Brady Team Leader BS Forestry, University of Idaho 1973BA Physics, University of Idaho 1973US Forest Service 1970-2010: Forester, District Ranger, ForestResource Staff OfficerDr. Susan Charnley Climate Change, Social Scientist PhD Anthropology, Stanford University, 1994MA Anthropology, Stanford University, 1989BA Biology, University of California, Santa Cruz, 1981BA Environmental Studies, UC Santa Cruz, 1981US Forest Service, 1999-present: Research Social Scientist, NationalProgram Leader for Human DimensionsJoe Krueger ETOA Specialist B.S. Forestry, Cal Poly, 1990US Forest Service, Environmental Planning Specialist, 1988-presentYaw NyakoIn-Country CoordinationResource SpecialistB.Sc. Natural Resources Management, Kwame Nkrumah Universityof Science <strong>and</strong> Technology, 1997M.Sc. Forest Science, Kochi University, 2007Sophia Polasky Climate Change, Social Scientist B.A. Environmental Studies, College of St. Benedict 2006Peace Corps Ghana, 2006-2008: Agro-forestryUS Forest Service, 2009-present: Research Technician, PacificNorthwest Research Station,Dr. John Stanturf Climate Change, Group Leader B.S., Plant <strong>and</strong> Soil Science, Montana State University, 1974M.S., Soil Science, Cornell University, 1979Ph. D., Forest Soils, Cornell University, 1983Lady Davis Post-Doctoral Fellow, Technion, Haifa, Israel 1982-1983Honorary Doctorate, Estonian University of Life Sciences, Tartu 2011US Forest Service 1992-present, Research EcologistDr. Melvin WarrenClimate Change, ResearchBiologist/Fisheries/AquaticEcologyB.S. Zoology, University of Tennessee 1974M.S. Wildlife <strong>and</strong> Fisheries Science, University of Tennessee 1977Ichthyologist <strong>and</strong> Project Coordinator, Kentucky Nature PreservesCommission, 1978-83Ph.D., Zoology, Southern Illinois University, 1989Post-doctoral Research Associate, Department of Fisheries <strong>and</strong>Wildlife Sciences, Virginia Tech, 1991-1992US Forest Service 1992-2011: Research Biologist <strong>and</strong> TeamLeader, Aquatic <strong>and</strong> Terrestrial Fauna TeamGHANA CLIMATE CHANGE VULNERABILITY AND ADAPTATION ASSESSMENT 207
APPENDIX 3. MATRIX OF CLIMATE CHANGE ACTIVITIES IN GHANADP ENR Sector Activity Matrix, December 2010DP - contact person Activity Objective Budget Timeline Sector -GoGorganisationcounterpartsEvy von PfeilAtse YapiPilot project todevelop anapproach onimplementing theForest InstrumentAtse Yapi Strengthening theparticipation offarmers <strong>and</strong> localcommunities in thecommunity forestplantationsdevelopment underthe ModifiedTaungya System(MTS)Stephen Duah-YentumiStephen.duah-yentumi@undp.orgCLIMATECHANGE ANDDISASTER RISKREDUCTION:Institutionalsupport tointegrate <strong>climate</strong><strong>change</strong> <strong>and</strong> disasterrisk reduction intonationaldevelopment plansImplementation of the Non LegallyBinding Instrument on all types of forestsEnhancing coordination of forest relatedactivitiesThe socio-economic <strong>and</strong> capacity buildingaspects of community forest plantationsdevelopment under the Modified TaungyaSystem (MTS) are strengthened;The project will provide support towardsadvocacy, strategic policy advice <strong>and</strong>capacity development to targetedinstitutions for Climate Change <strong>and</strong>Disaster Risk Reduction (DRR).In the area of Climate Change, thesupport will focus on: scaling up theCC/DRR mainstreaming processespecially in newly but vulnerabledistricts <strong>and</strong> in relevant MDAs; enhancingkey elements of the <strong>climate</strong> <strong>change</strong>mitigation <strong>and</strong> low carbon developmentby building institutional <strong>and</strong> humancapacities among major sectorstakeholders; providing continuedsupport to upstream capacityenhancement <strong>and</strong> leadershipstrengthening actions at the highestpossible level in <strong>climate</strong> decision-making,in order to improve coordination, overalldirections <strong>and</strong> enhance Ghana’s300.000 € 2009 -2011ForestryCommission$170,000 2010-2011 ForestryCommission$ 525,000 2011 EPANADMONDPC208 GHANA CLIMATE CHANGE VULNERABILITY AND ADAPTATION ASSESSMENTAdditionalinformationGerman funds viaFAONFP Facility fundswithin the NFPfacilitypartnership withGhana
DP - contact person Activity Objective Budget Timeline Sector -GoGorganisationcounterpartsStephen Duah-YentumiStephen.duah-yentumi@undp.orgStephen Duah-YentumiStephen.duah-yentumi@undp.orgCLIMATECHANGEMITIGATION:Promoting ofAppliance EnergyEfficiency <strong>and</strong>Transformation ofthe RefrigeratingAppliances Marketin GhanaCLIMATECHANGEMITIGATION /OZONEDEPLETIONHCFC Phase OutManagement Plan(HPMP)competitiveness to participate effectivelyin global <strong>climate</strong> negotiationsIn the case of Disaster Risk Reduction,the support will focus on strengtheningGhana’s resilience to natural disasters, byincorporating DRR into school curricula<strong>and</strong> building guides, <strong>and</strong> by promoting agender responsive culture in DRR at thedistrict <strong>and</strong> community levelThe project objective is to improve theenergy efficiency of appliancesmanufactured, marketed <strong>and</strong> used inGhana through the introduction of acombination of regulatory tool such asMinimum Energy Performance St<strong>and</strong>ards<strong>and</strong> Information Labels (S&L), <strong>and</strong>innovative economic tools. Domesticrefrigeration appliances will be the firstend-use to be tackled, with a specificfocus to address ozone depletingsubstances contained in the current stockof equipment.The XIXth Meeting of the Parties to theMontreal Protocol in September 2007,through its Decision XIX/6, adopted anaccelerated phase-out schedule forHCFCs. The first control is the freeze onproduction <strong>and</strong> consumption of HCFCsthrough the first 10% reduction step tothe 35% on 1 January 2020. The earlystages of the HPMP will focus on theestablishment of safe hydrocarbon <strong>and</strong>natural refrigerant use culture to enabletheir safe general long term use.Activities will be undertaken to convertHCFC use into environmentally soundalternatives <strong>and</strong> to draw on theexperienced gained <strong>and</strong> lessons learnedfrom the previous programmes to phaseout CFCs in the servicing sector.$1,722,727 2011 -2014$1,356,311 2011 -2019EnergyCommissionMinistry ofEnergyEPANationalOzone UnitAdditionalinformationGHANA CLIMATE CHANGE VULNERABILITY AND ADAPTATION ASSESSMENT 209
DP - contact person Activity Objective Budget Timeline Sector -GoGorganisationcounterpartsStephen Duah-YentumiStephen.duah-yentumi@undp.orgStephen Duah-YentumiStephen.duah-yentumi@undp.orgLoree Semeluk (Environment Lead,CIDA)POLLUTIONPCB management inGhana, fromCapacity Building toEliminationUNITEDNATIONSENVIRONMENTALCONVENTIONSEstablishing anEffective <strong>and</strong>SustainableStructure forImplementingMultilateralEnvironmentAgreementsGhana EnvironmentManagementProject (GEMP)This project is aimed at strengthening thecapacities <strong>and</strong> capabilities of governmentofficials <strong>and</strong> stakeholders outside ofgovernment to address PCBidentification, manage existing sources ofPCBs as well as theirelimination/destruction, as identified as apriority in the National ImplementationPlan for Persistent Organic Pollutants forthe Republic of Ghana.The project is to improve coordinationstructures <strong>and</strong> mechanisms, so thatstakeholders in Ghana are addressing theconservation of the environment in aneffective manner. The proposed projectwill first help the Government to mergeall existing management structures atnational level into one structureconsisting of the Ghana EnvironmentalConventions Coordinating Authority(GECCA) <strong>and</strong> its Secretariat. The projectwill then help these mechanisms becomeoperational by building their capacity <strong>and</strong>supporting them to perform specifictasks. Finally, the project will help thesemechanisms provide support to five pilotdistricts, in order to build national levelcapacity to support districts. The resultwill be a far more coherent, streamlined<strong>and</strong> effective allocation of resources tomeeting the Rio obligations. In turn, it isexpected that this increased efficiencywill attract additional investors tosupport Ghana as it meets its RioConvention obligations.To strengthen Ghanaian institutions <strong>and</strong>rural communities to enable them toreverse l<strong>and</strong> degradation <strong>and</strong>desertification trends in Ghana’s threenorthern regions (as part of the$2,945,700 2009 -2013EPAMEST$745,00 2009-2012 MESTGECCAAdditionalinformation$7.25 M CAD 2007- 2012 MEST <strong>and</strong> EPA To guide theimplementationof the NAP, theGovernment ofGhana invited the210 GHANA CLIMATE CHANGE VULNERABILITY AND ADAPTATION ASSESSMENT
DP - contact person Activity Objective Budget Timeline Sector -GoGorganisationcounterpartsLoree Semeluk (EnvironmentLead,CIDA)Loree Semeluk (Environment Lead,CIDA)Food Security <strong>and</strong>EnvironmentFacility (FSEF)Northern RegionSmall Towns Water<strong>and</strong> SanitationProject (NORST)implementation of Ghana’s NationalAction Programme (NAP) to CombatDrought <strong>and</strong> Desertification)To deliver <strong>and</strong> disseminate innovativefood security <strong>and</strong> sustainable agriculturalprogramming in the three northernregions of Ghana.To provide increased access to potablewater <strong>and</strong> sanitation services in up to 30selected small towns through the design,installation , <strong>and</strong> capacity building supportfor the operation of water supplysystems <strong>and</strong> appropriate sanitationfacilities$14.3 M CAD 2008-2016 MLGRD(with MoFA’stechnicalinput)AdditionalinformationGovernment ofCanada CIDA toact in the role ofchef-de-file fordesertificationissues under theUnited NationsConvention toCombatDesertification(UNCCD).An RFP has beenissued forinterestedorganizations,institutions,communities <strong>and</strong>individuals tosubmit proposalsfor funding ofsub-projects.An RFP has beenissued forinterestedorganizations,institutions,communities <strong>and</strong>individuals tosubmit proposalsfor funding ofsub-projects.$30 M CAD 2009-2016 MWRWH Environmentalissues wereintegrated intothe project withthe conduct of anSEA. Therecommendations of the SEA arebeingGHANA CLIMATE CHANGE VULNERABILITY AND ADAPTATION ASSESSMENT 211
DP - contact person Activity Objective Budget Timeline Sector -GoGorganisationcounterpartsLoree Semeluk (Environment Lead,CIDA)Loree Semeluk (Environment Lead,CIDA)Florent Clair (Agriculture &Environment Project Officer; AFD)clairf@afd.frFlorent Clair (Agriclture &Environment Project Officer; AFD)clairf@afd.frDistrict WideAssistance Project(DWAP)Support to Food<strong>and</strong> AgricultureDevelopment Policy(SFASDEP)Natural Resources<strong>and</strong> EnvironmentalGovernance BudgetSupportAmansuriEstuary/MangroveSwamp ForestConservationTo reduce poverty in 34 districts in thethree northern regions by improvingaccess to basic infrastructure facilitiessuch as health, school, security, places ofconvenience <strong>and</strong> potable water amongothersTo support the achievement of FASDEPII as outlined by the Government ofGhanaTo preserve the growth potential of theGhanaian economy by preventing thedegradation of its natural capital throughthe strengthening of the governance ofsectors contributing most to this declineConserving <strong>and</strong> managing the Amansuriestuary <strong>and</strong> mangrove <strong>and</strong> swamp forestecosystem including the coastal areas inpartnership with chiefs <strong>and</strong> people in theAdditionalinformationimplemented inaddition to anenvironmentalaction plan.$15 M CAD 2003-2012 MLGRD Environmentalissues wereintegrated intothe project withthe conduct of anSEA. Sub-projectplanning <strong>and</strong>implementationare informed bythe guidelinesoutlined in theSEA$100 M CAD 2009-2014 MoFA MoFA hasdeveloped aSustainable L<strong>and</strong>Management(SLM) Strategy<strong>and</strong> Action Planfor addressingenvironmental<strong>and</strong> l<strong>and</strong>managementissues inagriculturalproduction.5 M € 2008-2012 MLFM, MEST An externalevaluation ofenvironmentaldegradation costis currently beinglaunched44.000 € 2010-2012 FFEM (FrenchFund for globalenvironment)grant to Ghana212 GHANA CLIMATE CHANGE VULNERABILITY AND ADAPTATION ASSESSMENT
DP - contact person Activity Objective Budget Timeline Sector -GoGorganisationcounterpartsAdditionalinformation5 communities Wildlife Society(NGO)Emmanuel B. Ansong(emmanuel.ansong@eeas.europa.eu)Emmanuel B. Ansong(emmanuel.ansong@eeas.europa.eu)Emmanuel B. Ansong(emmanuel.ansong@eeas.europa.eu)Emmanuel B. Ansong(emmanuel.ansong@eeas.europa.euEmmanuel B. Ansong(emmanuel.ansong@eeas.europa.euEmmanuel B. Ansong(emmanuel.ansong@eeas.europa.euProgramme onEnvironment <strong>and</strong>Tropical Forests inDevelopingCountriesThematicProgramme forEnvironment <strong>and</strong>sustainablemanagement ofnatural resources,including energyThematicProgramme forenvironment <strong>and</strong>sustainablemanagement ofnatural resources,including energyNatural Resource<strong>and</strong> EnvironmentalGovernance(NREG) SPSPForest LawEnforcement,Governance <strong>and</strong>Trade SupportProject for ACPCountries FLEGT-ACPForest LawEnforcement,Governance <strong>and</strong>Trade SupportDeveloping alternatives for illegalchainsaw lumbering through multistakeholderdialogue in Ghana <strong>and</strong>GuyanaSupporting the integration of legal <strong>and</strong>legitimate domestic timber markets intoVoluntary Partnership AgreementsGovernance Initiative for Rights &Accountability in Forest Management(GIRAF)The programme seeks to contribute tothe implementation of the sector strategy<strong>and</strong> address issues in the inter-relatedsub-sectors of forestry <strong>and</strong> wildlife,mining <strong>and</strong> environmental protection.Strengthening the capabilities of forestfringe communities in Southern Ghana tohalt illegal loggingPreparation of a training centre tosupport FLEGT implementation <strong>and</strong> theadoption of Sustainable ForestManagement practices in Ghana <strong>and</strong> the2,186,010.00 € 2007 -20121,999,265.00 € 2011 -2015999,973.00 € 2009 -20138,000,000.00 € 2009 -2013$ 134,500.00 2008 -2012$ 132,897.00 2008 -2012FCFCFCFC, MC, EPAMEST MLNRFC / ForestResearchInstituteFC + FormInternational +Kumasi WoodClusterFAO-ACP FLEGTSupportProgrammeFAO-ACP FLEGTSupportProgrammeGHANA CLIMATE CHANGE VULNERABILITY AND ADAPTATION ASSESSMENT 213
DP - contact person Activity Objective Budget Timeline Sector -GoGorganisationcounterpartsEmmanuel B. Ansong(emmanuel.ansong@eeas.europa.euEmmanuel B. Ansong(emmanuel.ansong@eeas.europa.euEmmanuel B. Ansong(emmanuel.ansong@eeas.europa.euProject for ACPCountries FLEGT-ACPForest LawEnforcement,Governance <strong>and</strong>Trade SupportProject for ACPCountries FLEGT-ACPForest LawEnforcement,Governance <strong>and</strong>Trade SupportProject for ACPCountries FLEGT-ACPForest LawEnforcement,Governance <strong>and</strong>Trade SupportProject for ACPCountries FLEGT-ACPWillem.ROODHART@ec.europa.eu Use of Jatrophaplant to improvesustainablerenewable energydevelopment <strong>and</strong>create incomegeneratingactivities:an integratedapproach to ensuresustainablelivelihoodconditions <strong>and</strong>mitigate l<strong>and</strong>degradation effectsin rural areas ofWest African RegionFacilitating compliance with FLEGT <strong>and</strong>Due Diligence Regulation in Coted'Ivoire, Ghana <strong>and</strong> LiberiaEmpowering Forest Stakeholder tomonitor the implementation <strong>and</strong>compliance of VPA in GhanaIntegrating Civil Society in timber harvestvalidation processes for improvedgovernance <strong>and</strong> reduced illegal loggingunder the European Union <strong>and</strong> GhanaVoluntary partnership AgreementThe project aims by promoting <strong>and</strong>introducing perennial drought-resistantenergy crop (Jatropha species) to providethe rural communities with adequateaccess <strong>and</strong> security of sustainable energy;to reduce poverty <strong>and</strong> ensure livelihoodsecurity by developing alternative <strong>and</strong>sustainable income generating activities.Furthermore the project aims tointroduce desertification mitigationactions as well as to promote genderequality <strong>and</strong> strengthen managementcapacities of local stakeholders.$ 134,810.00 2008 -2012$ 132,000.00 2008 -2012$ 96,000.00 2008 –20121,916,863.14 € 2009 -2014FC + WWFWest AfricaForestProgrammeFC / WorkingGroup onForestCertificationFC / ResourceManagementSupportCentre214 GHANA CLIMATE CHANGE VULNERABILITY AND ADAPTATION ASSESSMENTAdditionalinformationFAO-ACP FLEGTSupportProgrammeFAO-ACP FLEGTSupportProgrammeFAO-ACP FLEGTSupportProgramme
DP - contact person Activity Objective Budget Timeline Sector -GoGorganisationcounterpartsGhanaAdditionalinformationGeorgios.Tsitsopoulos@ec.europa.euSocial justice inforestryTo improve forest governance in tencountries in Africa <strong>and</strong> Asia - securinglocal rights, developing forest productlegitimacy <strong>and</strong> combating <strong>climate</strong> <strong>change</strong>2,000,000.00 € 2009 -2014Action is beingmanaged fromBrusselsGHANA CLIMATE CHANGE VULNERABILITY AND ADAPTATION ASSESSMENT 215
APPENDIX 4. TABLE OF POTENTIAL COLLABORATORS AND THEIR FOCUS AREASKeyType: N=NON GOVERNMENTAL ORGANISATION G= GOVERNMENTALRelationship to USAID: I=IMPLEMENTER D=DEVELOPMENT PARTNER N= NoneOrganizationNameInstitutional objective/missionContactCURRENT FOCUS AREASTypeRelationshipto USAIDREDDCDMAgricultureFisheriesForestryBiodiversityWaterCoastalBio-energyOil & GasMiningL<strong>and</strong> TenureResearchGov/ HealthGovernment InstitutionsEnvironmentalProtectionAgency (ClimateChange focalpoint)ForestryCommissionWaterResourcesCommissionEnsure environmentally sound<strong>and</strong> efficient use of bothrenewable <strong>and</strong> non-renewableresources in the process ofnational development; Createawareness to mainstreamenvironment into thedevelopment process at thenational, regional, district <strong>and</strong>community levels; To apply thelegal processes in a fair, equitablemanner to ensure responsibleenvironmental behaviour in thecountryRegulation of utilization of forest<strong>and</strong> wildlife resources, theconservation <strong>and</strong> management ofthose resources <strong>and</strong> thecoordination of policies relatedto themProcessing of water rights <strong>and</strong>permits; Planning for waterresources development <strong>and</strong>management with river basins(catchments) as the natural unitsof planning; Collating, storing <strong>and</strong>disseminating data <strong>and</strong>information on water resourcesin Ghana; Monitoring <strong>and</strong>assessing activities <strong>and</strong>G I Daniel Amlalowww.epa<strong>ghana</strong>.gov.ghG I Robert Bamfowww.fc<strong>ghana</strong>.com√ √ √ √ √ √ √√ √ √ √G I www.wrc-gh.com √ √216 GHANA CLIMATE CHANGE VULNERABILITY AND ADAPTATION ASSESSMENT
OrganizationNameInstitutional objective/missionContactCURRENT FOCUS AREASTypeRelationshipto USAIDREDDCDMAgricultureFisheriesForestryBiodiversityWaterCoastalBio-energyOil & GasMiningL<strong>and</strong> TenureResearchGov/ HealthEnergyCommissionprogrammes for the utilisation<strong>and</strong> conservation of waterresourcesRecommend national policies forthe development <strong>and</strong> utilizationof indigenous energy resources;advice the Minister responsiblefor Energy on national policiesfor the efficient <strong>and</strong> safe supplyof electricity, natural gas, <strong>and</strong>petroleum products havingregard to the economy; providethe legal, regulatory <strong>and</strong>supervisory framework forproviders of energy in Ghana(i.e.licensing, prescription of uniformrules of practice by legislativeinstrument, inspection,monitoring <strong>and</strong> compliance ofrules); secure a comprehensivedatabase for national decisionmaking as regards thedevelopment <strong>and</strong> utilization ofenergy resources available to thenation; promote competition inthe energy market <strong>and</strong> enforcest<strong>and</strong>ards of performance.G I http://new.energycom.gov.gh/ √ √GHANA CLIMATE CHANGE VULNERABILITY AND ADAPTATION ASSESSMENT 217
OrganizationNameInstitutional objective/missionContactCURRENT FOCUS AREASTypeRelationshipto USAIDREDDCDMAgricultureFisheriesForestryBiodiversityWaterCoastalBio-energyOil & GasMiningL<strong>and</strong> TenureResearchGov/ HealthFisheriesCommissionMineralsCommissionRebuild <strong>and</strong> maintain robustfisheries resources throughpolicy reforms, cooperativeregulatory planning; Develop <strong>and</strong>implement appropriatemanagement frameworks thatensure fisheries resources areharvested sustainably, improvedintra-regional <strong>and</strong> internationaltrade of fish <strong>and</strong> fishery products<strong>and</strong> maximum economic <strong>and</strong>social benefits are obtained fromthe fisheries. Develop thecapacity of Small-scale fishers <strong>and</strong>other operators to createsustainable livelihoods for theirpeople from the sustainableharvest, processing <strong>and</strong>marketing of their fisheriesresourcesFormulate recommendations ofnational policy for exploration<strong>and</strong> exploitation of mineralresources. Emphasis on settingnational priorities cognizant ofthe national economy. Advise theMinister on matters relating tominerals; Monitor theimplementation of GovernmentPolicies on minerals <strong>and</strong> reportto the Minister; Monitoroperations of all bodies orestablishments with responsibilityfor minerals <strong>and</strong> report to theMinister; Receive <strong>and</strong> accesspublic agreements relating tominerals <strong>and</strong> report toParliament; Securecomprehensive data on nationalmineral resources <strong>and</strong>technologies of exploration <strong>and</strong>G I √ √ √ √ √G I http://www.<strong>ghana</strong>mining.org/ghweb/en/ma/mincom.html√ √218 GHANA CLIMATE CHANGE VULNERABILITY AND ADAPTATION ASSESSMENT
OrganizationNameInstitutional objective/missionContactCURRENT FOCUS AREASTypeRelationshipto USAIDREDDCDMAgricultureFisheriesForestryBiodiversityWaterCoastalBio-energyOil & GasMiningL<strong>and</strong> TenureResearchGov/ HealthResourceManagementSupport Centre(RMSC)NGOsexploitation for national decisionmakingProvide technical mappingservices to the ForestryCommissionG I Edward Obiawinfo@rmsc.fc<strong>ghana</strong>.comCivic Response N N Kyeretwie Opoku√ √√ √ √ √ √ √NatureConservationResearchCentreAssist communities/ privatesector manage l<strong>and</strong>s tomaximize carbon sequestration<strong>and</strong> biodiversity conservation;Facilitate introduction of moresustainable methods fordomestic charcoal trade in ruralGhana; Provide expertise onprotecting endangered plant <strong>and</strong>animal species to communities,private sector <strong>and</strong> govt.;Promote carbon trading <strong>and</strong>payments for ecosystem servicesin the sub-region, as well as solarenergy solutions linked toconservation initiatives for ruralcommunities ; Build expertisewithin the West African subregionregarding <strong>climate</strong> <strong>change</strong><strong>and</strong> carbon issuesArocha Ghana Environmental action throughcommunity-based conservationinterventions; promotecommunity, conservation, crossculturalcooperation <strong>and</strong> viaunderlying Christian principles tosensitize people to care for theworld’s natural resourceswww.civicresponse.orgN I John Masonhttp://www.ncrc-<strong>ghana</strong>.org/√ √ √ √ √N N Baba Abubakari √ √ √ √GHANA CLIMATE CHANGE VULNERABILITY AND ADAPTATION ASSESSMENT 219
OrganizationNameInstitutional objective/missionContact220 GHANA CLIMATE CHANGE VULNERABILITY AND ADAPTATION ASSESSMENTCURRENT FOCUS AREASTypeRelationshipto USAIDREDDCDMAgricultureFisheriesForestryBiodiversityWaterCoastalBio-energyOil & GasMiningL<strong>and</strong> TenureResearchGov/ HealthCoalition ofCivil Society onL<strong>and</strong>(CICOLThe CICOL is a network of CivilSociety Organizations working<strong>and</strong> advocating equitable l<strong>and</strong>tenure practices, policies <strong>and</strong>management in Ghana.N N Lillian Brucecicol<strong>ghana</strong>@gmail.comKASA-CareInternationalNew EnergyGhanaSENDFoundationA natural resource <strong>and</strong>environment sector specific civilsociety support mechanism inGhana; Builds on <strong>and</strong> strengthensexisting non state actors’coalitions <strong>and</strong> experiences <strong>and</strong>seeks to promote directengagement between Ghanaiancivil society organizations, themedia <strong>and</strong> government at alllevelsWorking in partnership withlocal communities <strong>and</strong> otherstakeholders to improve accessto social services, infrastructure<strong>and</strong> other developmentopportunities to the underservedin Ghana. Supports thedevelopment, testing <strong>and</strong>dissemination of a wide range ofappropriate technologies forwater <strong>and</strong> sanitation, energyservices, <strong>and</strong> small-holderagriculture.Advocacy on development thatprovides men <strong>and</strong> women withequal opportunities to activelyparticipate in <strong>and</strong> contribute topolitical, economic <strong>and</strong>social transformation ofcommunities; promotecommunitydrivendevelopment initiatives,economic literacy <strong>and</strong> policyN I Zakaria Yakubuwww.kasa.co.care.orgN N Thomas Imoroinfo@newenergygh.orgN N Country Directorwww.sendwestafrica.org√√ √ √ √ √ √√ √ √√ √
OrganizationNameInstitutional objective/missionContactCURRENT FOCUS AREASTypeRelationshipto USAIDREDDCDMAgricultureFisheriesForestryBiodiversityWaterCoastalBio-energyOil & GasMiningL<strong>and</strong> TenureResearchGov/ HealthKumasi Inst ofTech <strong>and</strong>Environment(KITE)CoastalResourcesCenterCatholic ReliefServicesadvocacy; Forgestrong partnerships with state<strong>and</strong> non-state actorscharacterized by mutualaccountability,openness <strong>and</strong> effective communication. Provide anenabling environment forinnovative development.Conducting evidence-based <strong>and</strong>comparative research togenerate relevant knowledge thatinforms <strong>and</strong> influences policyformulation <strong>and</strong> implementationfor poverty reduction <strong>and</strong>economic growth; promoteenterprise-centered approaches<strong>and</strong> models through technicalsupport <strong>and</strong> financing as asustainable option for thedelivery of energy services.Mobilizes governments, business<strong>and</strong> communities around theworld to work together asstewards of coastal ecosystems.With our partners we strive todefine <strong>and</strong> achieve the health,equitable allocation of wealth,<strong>and</strong> sustainable intensities ofhuman activity at the transitionbetween the l<strong>and</strong> <strong>and</strong> the seaSupport water <strong>and</strong>sanitation, agribusiness,<strong>and</strong> peace-building reach some ofGhana's most vulnerablecommunities, in addition tobuilding a solid network ofcommitted <strong>and</strong> experiencedpartners.N N Ishmael Edjekumhenewww.kiteonline.net√ √ √N I Mark Fennwww.crc.edu√ √ √ √ √ √ √N N Kris Ozarwww.crs.org√ √GHANA CLIMATE CHANGE VULNERABILITY AND ADAPTATION ASSESSMENT 221
OrganizationNameInstitutional objective/missionContactCURRENT FOCUS AREASTypeRelationshipto USAIDREDDCDMAgricultureFisheriesForestryBiodiversityWaterCoastalBio-energyOil & GasMiningL<strong>and</strong> TenureResearchGov/ HealthRain ForestAllianceCentre forEnvironmentalImpact AnalysisZasilariEcological FarmsFriends of theNationConserve biodiversity <strong>and</strong>ensure sustainable livelihoods bytransforming l<strong>and</strong>-use practices,business practices <strong>and</strong> consumerbehaviourUndertake informationdissemination <strong>and</strong> advisoryservices through an international,national <strong>and</strong> local environmentalinformation network;Independently monitor <strong>and</strong>assess the levels of pollutants inthe environment; Advocate forsound environmental practices inall aspects of Ghana’s economySupport Ghana’s efforts atdeveloping the agricultural basewhich is the backbone of localeconomy through the use ofOrganic Agriculture ( for foodsecurity) <strong>and</strong>, promoting sound<strong>and</strong> sustainable use of naturalresources in the districts ofNorthern Region.Serves as a catalyst for increasedaction for sustainable naturalresource management <strong>and</strong> healthenvironment; Service to wetl<strong>and</strong><strong>and</strong> forest dependentcommunities as well as poorurban communities througheducation, training, networking<strong>and</strong> advocacyWACAM Network for the protection ofthe environment, naturalresources <strong>and</strong> the rights ofmarginalized mining communitiesthrough advocacy, campaign <strong>and</strong>representation within a legalN I Elvis Kudaarwww.rainforest-alliance.orgN N Samuel Obirihttp://www.ceiagh.comN N David Agongowww.zefp.org√ √ √ √ √√ √ √√ √ √ √ √ √ √ √N N Donkris Mevuta √ √ √ √ √ √N N Daniel Owusu-Korantengwww.wacam<strong>ghana</strong>.com√ √ √ √ √ √ √222 GHANA CLIMATE CHANGE VULNERABILITY AND ADAPTATION ASSESSMENT
OrganizationNameInstitutional objective/missionContactCURRENT FOCUS AREASTypeRelationshipto USAIDREDDCDMAgricultureFisheriesForestryBiodiversityWaterCoastalBio-energyOil & GasMiningL<strong>and</strong> TenureResearchGov/ HealthWorking Groupon ForestCertification(WGFC)Association ofJasikan CivilSocietyOrganizationsAJADSCODevelopmentInstituteframework that is sensitive tothe concerns of miningcommunities.Guaranteeing the functioning offorest <strong>and</strong> chain of custodycertification in Ghana throughsetting <strong>and</strong> promotinginternationally acceptablest<strong>and</strong>ards, facilitation ofcertification processes <strong>and</strong>monitoring the implementationof the st<strong>and</strong>ards with recognizedarbitration procedures forforest, industry <strong>and</strong>community sectors operators.Address the issues of illegallogging, bushfire menace.Strengthening CSOs onenvironmental issues in theProject area. Addressing specificNREG issues such as effectivelaw enforcement under theforestry sub sector <strong>and</strong>strengthening functionalpartnerships <strong>and</strong> participation inenvironmental managementunder the environmentalprotection sub sector.Enable African communitiesconfront their developmentchallenges with passion <strong>and</strong>commitment towards socialstability <strong>and</strong> care for nature.Policy research, dialogue,advocacy <strong>and</strong> capacity buildingfor sustainable communitydevelopmentN N Ernest Abeneywww.workinggroupgh.org√ √N N Kofi Asare Baffour √ √N N Ken Kinneywww.thedevin.org√ √ √ √GHANA CLIMATE CHANGE VULNERABILITY AND ADAPTATION ASSESSMENT 223
OrganizationNameInstitutional objective/missionContact224 GHANA CLIMATE CHANGE VULNERABILITY AND ADAPTATION ASSESSMENTCURRENT FOCUS AREASTypeRelationshipto USAIDREDDCDMAgricultureFisheriesForestryBiodiversityWaterCoastalBio-energyOil & GasMiningL<strong>and</strong> TenureResearchGov/ HealthForest WatchGhanaFriends of theEarthDeepen the political economicanalysis of grassroots groupings<strong>and</strong> to facilitate their networkingtowards the emergence ofarticulate social movements thatcould lead in the democratization<strong>and</strong> development of Africansocieties <strong>and</strong> in internationaldevelopment strugglesConservation <strong>and</strong> sustainable useof the world’s natural resourcesto improve the economic <strong>and</strong>social well-being of present <strong>and</strong>future generations. Emphasizeson the need to integrateenvironmental sustainability withgender equityN N Kingsley Bekoewww.forestwatchgh.orgN N Noble Wadzahwww.foe<strong>ghana</strong>.orgISODEC works in solidarity with thosestriving for social justice towardsa life of dignity by promotingrights <strong>and</strong> accountability;defending <strong>and</strong> promoting publicgoods (water, education <strong>and</strong>health) <strong>and</strong> basic human rightsTWN-Africa Research <strong>and</strong> Advocacy on issuesof social <strong>and</strong> economic policythat advances the needs <strong>and</strong>interests of peoples of African<strong>and</strong> other third world countries(especially marginalized socialgroups), a fair distribution ofworld’s resources, <strong>and</strong> forms ofdevelopment which aresustainable <strong>and</strong> fulfill humanneedsN N Bishop Akologowww.isodec.org.ghN N Yao Grahamwww.twnafrica.org√ √ √ √ √√ √ √ √√ √ √ √ √√ √ √ √ √
OrganizationNameInstitutional objective/missionContactCURRENT FOCUS AREASTypeRelationshipto USAIDREDDCDMAgricultureFisheriesForestryBiodiversityWaterCoastalBio-energyOil & GasMiningL<strong>and</strong> TenureResearchGov/ HealthInternationalUnion forConservation ofNature (IUCN)Friends ofRivers <strong>and</strong>Water BodiesGhana WildlifeSocietyCivil SocietyPlatform on Oil<strong>and</strong> GasInternational Union forConservation of Nature, helpsthe world find pragmaticsolutions to our most pressingenvironment <strong>and</strong> developmentchallenges. IUCN supportsgovernments, NGOs,international conventions, UNorganizations, companies <strong>and</strong>communities to develop laws,policy <strong>and</strong> best-practice.an advocacy group for IntegratedWater Resource Management(IWRM) by using a combinationof traditional <strong>and</strong> contemporarytechnologies to provide asustainable solution to thedepletion of this precious naturalresource – WATERhe Society is a nongovernmental,non-political, nonprofitmaking environmentalorganization which seeks toconserve wildlife in all its formsto ensure a better environment<strong>and</strong> improved quality of life forall people.Is a forum for civil society toshare knowledge about oil <strong>and</strong>gas exploration <strong>and</strong> governance,strengthen civil society voice <strong>and</strong>forge a common strategy forengaging with other stakeholderssuch as the Government ofGhana, Petroleum Companies<strong>and</strong> frontline oil communities.N N Samuel Nyamewww.iucn.org√ √ √ √ √ √ √N N waterfriendsgh.orgN N www.<strong>ghana</strong>wildlifesociety.org √ √N N Mohammed Amin√ √Tabat15@yahoo.coGHANA CLIMATE CHANGE VULNERABILITY AND ADAPTATION ASSESSMENT 225
OrganizationNameInstitutional objective/missionContact226 GHANA CLIMATE CHANGE VULNERABILITY AND ADAPTATION ASSESSMENTCURRENT FOCUS AREASTypeRelationshipto USAIDREDDCDMAgricultureFisheriesForestryBiodiversityWaterCoastalBio-energyOil & GasMiningL<strong>and</strong> TenureResearchGov/ HealthClimate Focus Independent expert ininternational <strong>and</strong> national <strong>climate</strong>law, policies, project design <strong>and</strong>finance; pioneering carbonmarkets since their inception;services range from thedevelopment of policies toprotect the rainforest tostructuring greenhouse gasmitigation projects in energyTropenbosInternationalConservationAllianceConservationInternationalKatoombaGroupsector.A platform supporting the forest<strong>and</strong> development agenda indeveloping countries forimproving knowledge, personalcapacity <strong>and</strong> institutional capacityfor better governance <strong>and</strong>management of tropical forestresources. We operatepartnership programs betweenresearch institutions in theNorth <strong>and</strong> the South to buildcapacity that meets the needs offorest stakeholders.Assisting fringe communities inAfrica in creating economicopportunities that result inimproved wildlife <strong>and</strong> habitatmanagement, <strong>and</strong> wealthierhealthier communities.Empowerment of societies toresponsibly <strong>and</strong> sustainably carefor nature, global biodiversity, forthe well-being of humanity.An international network ofindividuals working to promote,<strong>and</strong> improve capacity related to,markets <strong>and</strong> payments forecosystem services (PES); aN N Charlotte Streckwww.<strong>climate</strong>focus.comN N Samuel Nketsiawww.tropenbos.orgN N Yaw Osei-Owusuwww.conservealliance.orgN N Nicholas Jengrehttp://www.conservation.org/Pages/default.aspxN N Rebecca Ashley Asarewww.katoombagroup.org√ √ √ √√ √ √ √√ √ √ √ √√ √ √ √√ √ √ √
OrganizationNameInstitutional objective/missionContactCURRENT FOCUS AREASTypeRelationshipto USAIDREDDCDMAgricultureFisheriesForestryBiodiversityWaterCoastalBio-energyOil & GasMiningL<strong>and</strong> TenureResearchGov/ HealthDevelopment PartnersSNVNetherl<strong>and</strong>sDevelopmentOrganisationCanadianInternationalDevelopmentAgencyUK Departmentfor InternationalDevelopmentNorwegianAgency forDevelopmentCooperationNetherl<strong>and</strong>sEmbassyforum for the ex<strong>change</strong> of ideas<strong>and</strong> strategic information aboutecosystem service transactions<strong>and</strong> markets, as well as site forcollaboration betweenpractitioners on PES projects <strong>and</strong>programs.The development goal of SNVGhana is to contribute to thenational development agenda asespoused in the MilleniumDevelopement Goals (MDGs).CIDA's mission is to leadCanada's international effort tohelp people living in poverty.- Ensuring that the governmentof Ghana’s resources are wellmanaged for the benefit of allcitizens- Encouraging enterprise <strong>and</strong>wealth creation- Ensuring quality educationservices- Reducing maternal mortality<strong>and</strong> child deathThe Norwegian Agency forDevelopment Cooperation(Norad) is a directorate underthe Norwegian Ministry ofForeign AffairsRepresent the Government ofthe Netherl<strong>and</strong>s in developing<strong>and</strong> maintaining productiverelations with the GoG <strong>and</strong> itspeopleD D Southern Portfolio Team<strong>ghana</strong>@snvworld.org√ √ √ √ √ √D D Romeo Adomah-Dartehwww.psu-<strong>ghana</strong>.org√ √ √ √ √ √D D Sean Doolanwww.dfid.gov.uk√ √ √D D Arne Olsenwww.emb-norway.com.ng√ √D D Ton van der Zonhttp://<strong>ghana</strong>.nlembassy.org√ √ √ √ √ √GHANA CLIMATE CHANGE VULNERABILITY AND ADAPTATION ASSESSMENT 227
OrganizationNameInstitutional objective/missionContact228 GHANA CLIMATE CHANGE VULNERABILITY AND ADAPTATION ASSESSMENTCURRENT FOCUS AREASTypeRelationshipto USAIDREDDCDMAgricultureFisheriesForestryBiodiversityWaterCoastalBio-energyOil & GasMiningL<strong>and</strong> TenureResearchGov/ HealthUnited NationsDevelopmentProgram, UNDPThe UN's global developmentnetwork, an organizationadvocating for <strong>change</strong> <strong>and</strong>connecting countries toknowledge, experience <strong>and</strong>resources to help people build abetter lifeWaterAid WaterAid has been working inGhana since 1985 helping themost vulnerable in society gainaccess to safe water supplies,sanitation <strong>and</strong> hygiene educationOxfam America Oxfam America is aninternational relief <strong>and</strong>development organization thatcreates lasting solutions topoverty, hunger, <strong>and</strong> injusticeGTZ/GIZ GTZ (now GIZ) implementsprogrammes <strong>and</strong> projects thereon behalf of the German FederalMinistry for EconomicCooperation <strong>and</strong> DevelopmentDED is nowalso GIZThe DED Ghana promotescomplex reforms <strong>and</strong> <strong>change</strong>processes. Its corporateobjective is to improve people’sliving conditions on a sustainablebasis <strong>and</strong> to transfer knowledgeto our partner countries. Itprovides viable, forward-lookingsolutions for political, economic,ecological <strong>and</strong> socialdevelopmentWorld Bank The World Bank is a source offinancial <strong>and</strong> technical assistanceto developing countries aroundthe worldD D Stephen Yentumiwww.undp-gha.orgD D Abdul-Nashiru Mohammedwww.wateraid.orgD D Wendy Shermanwww.oxfamamerica.orgD D Fred Br<strong>and</strong>lwww.gtz.deD D Kay Andraschkawww.<strong>ghana</strong>.ded.deD D Flavio Chaveswww.worldbank.org√ √√ √√ √ √ √ √ √ √ √√ √√ √√ √ √ √ √ √
APPENDIX 5. SCENARIOS OF TEMPERATURE CHANGES (MID-RANGE VALUES) FOR THE VARIOUS ECO-CLIMATIC ZONES INGHANAa. SUDAN SAVANNABaseline Mean Temp. Mean Temp. Change Climate ScenariosMonth T-Max. T-Min. T-Mean 2020 2050 2080 2020 2050 2080Jan 35.2 19.5 27.3 0.6 2.5 4.0 27.9 29.8 31.3Feb 37.6 22.0 29.8 0.7 2.1 4.1 30.5 31.9 33.9Mar 38.9 25.0 32.0 0.7 2.1 4.2 32.7 34.1 36.2Apr 38.2 26.1 32.1 0.8 2.6 5.0 32.9 34.7 37.1May 36.0 25.1 30.5 0.8 2.2 5.2 31.3 32.7 35.7Jun 33.0 23.3 28.2 0.6 1.9 4.0 28.8 30.1 32.2Jul 31.2 22.6 26.9 0.5 1.8 3.4 27.4 28.7 30.3Aug 30.4 22.3 26.3 0.5 1.7 3.4 26.8 28.0 29.7Sep 31.2 22.1 26.6 0.5 1.6 3.6 27.1 28.2 30.2Oct 34.2 22.2 28.2 0.5 1.6 3.3 28.7 29.8 31.5Nov 36.2 20.1 28.1 0.6 2.0 4.2 28.7 30.1 32.3Dec 35.1 19.0 27.0 0.6 2.0 4.0 27.6 29.0 31.0Ann. 34.8 22.4 28.6 0.6 2.0 4.0 29.2 30.6 32.6b. GUINEA SAVANNABaseline Mean Temp. Mean Temp. Change Climate ScenariosMonth T-Max. T-Min. T-Mean 2020 2050 2080 2020 2050 2080Jan 35.0 18.9 26.9 0.6 2.0 4.1 27.5 28.9 31.0Feb 36.9 22.0 29.4 0.7 2.2 4.2 30.1 31.6 33.6Mar 37.0 24.1 30.6 0.7 2.1 4.2 31.3 32.7 34.8Apr 35.3 24.4 29.9 0.6 2.3 4.5 30.5 32.2 34.4May 33.5 23.5 28.5 0.6 2.2 4.4 29.1 30.7 32.9Jun 31.1 22.3 26.7 0.5 1.9 3.8 27.2 28.6 30.5Jul 29.7 21.8 25.7 0.5 1.7 3.5 26.2 27.4 29.2Aug 29.4 21.7 25.5 0.5 1.8 3.4 26.0 27.3 28.9Sep 30.2 21.5 25.8 0.5 1.6 3.2 26.3 27.4 29.0Oct 32.5 21.7 27.1 0.5 1.6 3.4 27.6 28.7 30.5Nov 34.5 20.2 27.3 0.6 2.0 3.9 27.9 29.3 31.2Dec 34.4 18.4 26.4 0.6 2.0 4.0 27.0 28.4 30.4Ann. 33.3 21.7 27.5 0.6 2.0 3.9 28.1 29.4 31.4GHANA CLIMATE CHANGE VULNERABILITY AND ADAPTATION ASSESSMENT 229
c. TRANSITIONAL ZONEBaseline Mean Temp. Mean Temp. Change Climate ScenariosMonth T-Max. T-Min. T-Mean 2020 2050 2080 2020 2050 2080Jan 33.4 20.4 26.9 0.6 2.0 4.1 27.5 28.9 31.0Feb 35.2 22.8 29.0 0.7 2.2 4.2 29.7 31.2 33.2Mar 34.9 23.8 29.3 0.7 2.1 4.2 30.0 31.4 33.5Apr 33.5 23.8 28.6 0.6 2.3 4.5 29.2 30.9 33.1May 32.2 23.2 27.7 0.6 2.2 4.4 28.3 29.9 32.1Jun 30.3 22.4 26.3 0.5 1.9 3.8 26.8 28.2 30.1Jul 28.8 21.9 25.4 0.5 1.7 3.5 25.9 27.1 28.9Aug 28.8 21.8 25.3 0.5 1.8 3.4 25.8 27.1 28.7Sep 29.5 21.8 25.7 0.5 1.6 3.2 26.2 27.3 28.9Oct 30.6 21.9 26.3 0.5 1.6 3.4 26.8 27.9 29.7Nov 32.0 21.8 26.9 0.6 2.0 3.9 27.5 28.9 30.8Dec 32.0 20.4 26.2 0.6 2.0 4.0 26.8 28.2 30.2Ann. 31.8 22.2 27.0 0.6 2.0 3.9 27.5 28.9 30.8d. DECIDUOUS FOREST ZONEBaseline Mean Temp. Mean Temp. Change Climate ScenariosMonth T-Max. T-Min. T-Mean 2020 2050 2080 2020 2050 2080Jan 32.2 20.7 26.5 0.6 2.0 4.1 27.1 28.5 30.6Feb 33.6 22.3 27.9 0.7 2.2 4.2 28.6 30.1 32.1Mar 33.1 22.7 27.9 0.7 2.1 4.2 28.6 30.0 32.1Apr 32.4 22.8 27.6 0.6 2.3 4.5 28.2 29.9 32.1May 31.5 22.4 27.0 0.6 2.2 4.4 27.6 29.2 31.4Jun 29.7 21.9 25.8 0.5 1.9 3.8 26.3 27.7 29.6Jul 28.4 21.5 24.9 0.5 1.7 3.5 25.4 26.6 28.4Aug 28.2 21.3 24.8 0.5 1.8 3.4 25.3 26.6 28.2Sep 29.1 21.5 25.3 0.5 1.6 3.2 25.8 26.9 28.5Oct 30.3 21.6 26.0 0.5 1.6 3.4 26.5 27.6 29.4Nov 31.3 21.8 26.6 0.6 2.0 3.9 27.2 28.6 30.5Dec 31.0 21.2 26.1 0.6 2.0 4.0 26.7 28.1 30.1Ann. 30.9 21.8 26.4 0.6 2.0 3.9 26.9 28.3 30.2230 GHANA CLIMATE CHANGE VULNERABILITY AND ADAPTATION ASSESSMENT
e. RAIN FOREST ZONEBaseline Mean Temp. Mean Temp. Change Climate ScenariosMonth T-Max. T-Min. T-Mean 2020 2050 2080 2020 2050 2080Jan 30.0 23.4 26.7 0.6 2.0 4.1 27.3 28.7 30.8Feb 30.6 24.4 27.5 0.7 2.2 4.2 28.2 29.7 31.7Mar 30.9 24.3 27.6 0.7 2.1 4.2 28.3 29.7 31.8Apr 30.9 24.2 27.6 0.6 2.3 4.5 28.2 29.9 32.1May 30.0 23.6 26.8 0.6 2.2 4.4 27.4 29.0 31.2Jun 28.4 23.3 25.8 0.5 1.9 3.8 26.3 27.7 29.6Jul 27.4 23.2 25.3 0.5 1.7 3.5 25.8 27.0 28.8Aug 26.9 22.8 24.8 0.5 1.8 3.4 25.3 26.6 28.2Sep 27.4 22.9 25.1 0.5 1.6 3.2 25.6 26.7 28.3Oct 28.5 23.4 25.9 0.5 1.6 3.4 26.4 27.5 29.3Nov 29.9 23.1 26.5 0.6 2.0 3.9 27.1 28.5 30.4Dec 30.0 23.2 26.6 0.6 2.0 4.0 27.2 28.6 30.6Ann. 29.3 23.5 26.4 0.6 2.0 3.9 26.9 28.3 30.2f. COASTAL SAVANNAH ZONEBaseline Mean Temp. Mean Temp. Change Climate ScenariosMonth T-Max. T-Min. T-Mean 2020 2050 2080 2020 2050 2080Jan 31.2 23.7 27.5 0.6 2.0 4.1 28.1 29.5 31.6Feb 31.9 24.7 28.3 0.7 2.2 4.2 29.0 30.5 32.5Mar 31.9 24.8 28.3 0.7 2.1 4.2 29.0 30.4 32.5Apr 31.7 24.8 28.3 0.6 2.3 4.5 28.9 30.6 32.8May 31.0 24.4 27.7 0.6 2.2 4.4 28.3 29.9 32.1Jun 29.2 23.7 26.4 0.5 1.9 3.8 26.9 28.3 30.2Jul 27.6 22.9 25.3 0.5 1.7 3.5 25.8 27.0 28.8Aug 27.5 22.4 24.9 0.5 1.8 3.4 25.4 26.7 28.3Sep 28.3 22.8 25.6 0.5 1.6 3.2 26.1 27.2 28.8Oct 29.7 23.2 26.4 0.5 1.6 3.4 26.9 28.0 29.8Nov 31.2 24.0 27.6 0.6 2.0 3.9 28.2 29.6 31.5Dec 30.9 23.5 27.2 0.6 2.0 4.0 27.8 29.2 31.2Ann. 30.2 23.7 26.9 0.6 2.0 3.9 27.5 28.9 30.8GHANA CLIMATE CHANGE VULNERABILITY AND ADAPTATION ASSESSMENT 231
APPENDIX 6. SCENARIOS OF CHANGES IN PRECIPITATION AMOUNT (MID-RANGEVALUES) FOR THE VARIOUS ECO-CLIMATIC ZONES IN GHANAa. SUDAN SAVANNABaseline Means Mean <strong>change</strong> in rainfall. Scenarios: Mean Rainfall Amount. Scenarios (Mean DailyRainfall)Mean No. of Raindays Daily mean (per cent) (mm) (mm per day)Month (mm) (days) (mm/day) 2020 2050 2080 20202050 2080 2020 2050 2080Jan 1.01 1.4 -4.8 -12.8 -31.0 1.0 0.9 0.7 1.0 0.9 0.7Feb 3.71 4.6 -9.0 -29.7 -58.4 3.3 2.6 1.5 3.3 2.6 1.5Mar 18.32 10.0 -7.3 -23.8 -47.2 17.0 14.0 9.7 8.5 7.0 4.8Apr 57.45 12.2 -7.2 -23.8 -36.8 53.3 43.8 36.3 10.7 8.8 7.3May 95.78 12.5 -4.6 -14.8 -18.0 91.3 81.5 78.5 11.4 10.2 9.8Jun 125.2 10 12.5 -1.6 -12.8 -17.4 123.2109.2 103.4 12.3 10.9 10.3Jul 193.9 14 14.2 0.2 -4.6 -4.9 194.3185.0 184.4 13.9 13.2 13.2Aug 266.7 18 15.0 0.6 -0.5 -8.4 268.3265.3 244.3 14.9 14.7 13.6Sep 173.4 14 12.4 -0.6 -3.8 -10.8 172.4166.8 154.7 12.3 11.9 11.0Oct 48.4 7 7.2 0.0 -0.1 -9.9 48.448.3 43.6 6.9 6.9 6.2Nov 4.81 7.2 -1.4 -4.8 -12.7 4.7 4.6 4.2 4.7 4.6 4.2Dec 3.41 4.4 -0.6 -1.6 -3.6 3.4 3.3 3.3 3.4 3.3 3.3Ann. 992.0 82 12.1 -1.1 -6.7 -12.8 980.6925.3 864.5 12.0 11.3 10.5b. GUINEA SAVANNABaseline Means Mean <strong>change</strong> in rainfall. Scenarios: Mean Rainfall Amount. Scenarios (Mean DailyRainfall)Mean No. of Raindays Daily mean (per cent) (mm) (mm per day)Month (mm) (days) (mm/day) 2020 2050 2080 20202050 2080 2020 2050 2080Jan 2.01 2.0 -3.9 -12.8 -25.3 1.9 1.7 1.5 1.9 1.7 1.5Feb 7.81 7.8 -9.1 -29.7 -58.9 7.1 5.5 3.2 7.1 5.5 3.2Mar 51.35 10.3 -6.0 -19.9 -39.4 48.2 41.1 31.1 9.6 8.2 6.2Apr 81.98 10.2 -4.4 -14.5 -28.7 78.3 70.0 58.4 9.8 8.8 7.3May 124.8 11 11.3 -4.4 -25.8 -28.4 119.392.6 89.3 10.8 8.4 8.1Jun 152.1 12 12.7 -3.8 -12.6 -24.8 146.4133.0 114.4 12.2 11.1 9.5Jul 174.5 14 12.5 -0.8 -2.8 -5.4 173.1169.6 165.1 12.4 12.1 11.8232 GHANA CLIMATE CHANGE VULNERABILITY AND ADAPTATION ASSESSMENT
Aug 191.5 16 12.0 -0.1 -0.5 -1.0 191.3190.5 189.6 12.0 11.9 11.8Sep 219.3 18 12.2 -0.5 -1.8 -3.5 218.2215.3 211.6 12.1 12.0 11.8Oct 90.7 10 9.1 0.0 -0.3 -0.7 90.790.4 90.0 9.1 9.0 9.0Nov 12.2 2 6.1 -1.4 -4.8 -9.4 12.011.6 11.1 6.0 5.8 5.5Dec 7.21 7.2 0.5 -1.6 -3.6 7.2 7.0 6.9 7.2 7.0 6.9Ann. 1115.3 99 11.3 -1.9 -7.8 -12.8 1093.71028.5 972.2 11.0 10.4 9.8c. TRANSITIONAL ZONEBaseline Means Mean <strong>change</strong> in rainfall. Scenarios: Mean Rainfall Amount. Scenarios (Mean DailyRainfall)Mean No. of Raindays Daily mean (per cent) (mm) (mm per day)Month (mm) (days) (mm/day) 2020 2050 2080 20202050 2080 2020 2050 2080Jan 5.7 1 5.7 -3.9 -12.8 -25.3 5.55.0 4.3 5.5 5.0 4.3Feb 19.0 2 9.5 -9.1 -29.7 -58.9 17.313.4 7.8 8.6 6.7 3.9Mar 76.6 5 15.3 -6.0 -19.9 -39.4 72.061.4 46.4 14.4 12.3 9.3Apr 117.2 7 16.7 -4.4 -14.5 -28.7 112.0100.2 83.5 16.0 14.3 11.9May 156.1 10 15.7 -4.4 -25.8 -28.4 149.2115.8 111.8 14.9 11.6 11.2Jun 185.9 15 12.4 -3.8 -12.6 -24.8 178.8162.5 139.8 11.9 10.8 9.3Jul 168.2 16 10.5 -0.8 -2.8 -5.4 166.9163.5 159.2 10.4 10.2 9.9Aug 151.5 15 10.1 -0.1 -0.5 -1.0 151.4150.8 150.0 10.1 10.1 10.0Sep 211.8 13 16.3 -0.5 -1.8 -3.5 210.8208.0 204.4 16.2 16.0 15.7Oct 163.3 12 13.6 0.0 -0.3 -0.7 163.3162.8 162.1 13.6 13.6 13.5Nov 33.8 3 11.4 -1.4 -4.8 -9.4 33.332.2 30.6 11.1 10.7 10.2Dec 12.1 2 6.1 0.5 -1.6 -3.6 12.212.0 11.7 6.1 6.0 5.9Ann. 1301.3 101 12.9 -2.2 -8.8 -14.6 1272.71187.4 1111.7 12.6 11.8 11.0d.. DECIDUOUS FOREST ZONEBaseline Means Mean <strong>change</strong> in rainfall. Scenarios: Mean Rainfall Amount. Scenarios (Mean DailyRainfall)Mean No. of Raindays Daily mean (per cent) (mm) (mm per day)Month (mm) (days) (mm/day) 2020 2050 2080 20202050 2080 2020 2050 2080Jan 17.1 2 10.1 -3.9 -12.8 -25.3 16.414.9 12.7 8.2 7.4 6.4Feb 54.8 5 11.5 -9.1 -29.7 -58.9 49.838.5 22.5 10.0 7.7 4.5Mar 114.9 9 12.8 -6.0 -19.9 -39.4 108.092.0 69.6 12.0 10.2 7.7Apr 134.4 11 12.5 -4.4 -14.5 -28.7 128.5114.9 95.9 11.7 10.4 8.7GHANA CLIMATE CHANGE VULNERABILITY AND ADAPTATION ASSESSMENT 233
May 169.4 13 13.2 -4.4 -25.8 -28.4 161.9125.7 121.3 12.5 9.7 9.3Jun 215.2 16 13.5 -3.8 -12.6 -24.8 207.0188.1 161.8 12.9 11.8 10.1Jul 121.9 13 9.5 -0.8 -2.8 -5.4 120.9118.5 115.3 9.3 9.1 8.9Aug 80.9 11 7.4 -0.1 -0.5 -1.0 80.980.5 80.1 7.4 7.3 7.3Sep 142.0 14 10.2 -0.5 -1.8 -3.5 141.3139.5 137.1 10.1 10.0 9.8Oct 153.8 15 10.4 0.0 -0.3 -0.7 153.8153.4 152.8 10.3 10.2 10.2Nov 67.0 8 8.6 -1.4 -4.8 -9.4 66.063.7 60.7 8.3 8.0 7.6Dec 31.9 3 11.1 0.5 -1.6 -3.6 32.131.4 30.8 10.7 10.5 10.3Ann. 1303.4 120 10.9 -2.8 -10.9 -18.6 1266.81161.2 1060.6 10.6 9.7 8.8e. RAIN FOREST ZONEBaseline Means Mean <strong>change</strong> in rainfall. Scenarios: Mean Rainfall Amount. Scenarios (Mean DailyRainfall)Mean No. of Raindays Daily mean (per cent) (mm) (mm per day)Month (mm) (days) (mm/day) 2020 2050 2080 20202050 2080 2020 2050 2080Jan 34.0 4 9.3 -3.9 -12.8 -25.3 32.629.6 25.4 8.2 7.4 6.3Feb 66.2 5 13.1 -9.1 -29.7 -58.9 60.146.5 27.2 12.0 9.3 5.4Mar 130.1 9 14.8 -6.0 -19.9 -39.4 122.3104.2 78.8 13.6 11.6 8.8Apr 175.3 12 15.1 -4.4 -14.5 -28.7 167.6149.9 125.0 14.0 12.5 10.4May 345.1 23 15.0 -4.4 -25.8 -28.4 330.0256.1 247.1 14.3 11.1 10.7Jun 579.7 22 26.4 -3.8 -12.6 -24.8 557.7506.6 435.9 25.3 23.0 19.8Jul 211.7 1.5 14.4 -0.8 -2.8 -5.4 210.0205.7 200.2 140.0 137.2 133.5Aug 79.7 13 6.3 -0.1 -0.5 -1.0 79.679.3 78.9 6.1 6.1 6.1Sep 95.3 15 6.5 -0.5 -1.8 -3.5 94.993.6 92.0 6.3 6.2 6.1Oct 168.7 17 10.1 0.0 -0.3 -0.7 168.7168.2 167.5 9.9 9.9 9.9Nov 136.8 14 10.0 -1.4 -4.8 -9.4 134.9130.2 123.9 9.6 9.3 8.9Dec 70.1 8 9.1 0.5 -1.6 -3.6 70.469.0 67.6 8.8 8.6 8.4Ann. 2092.7 143.5 14.6 -3.1 -12.1 -20.2 2028.81839.0 1669.6 14.1 12.8 11.6f. COASTAL SAVANNABaseline Means Mean <strong>change</strong> in rainfall. Scenarios: Mean Rainfall Amount. Scenarios (Mean DailyRainfall)Mean No. of Raindays Daily mean (per cent) (mm) (mm per day)Month (mm) (days) (mm/day) 2020 2050 2080 20202050 2080 2020 2050 2080Jan 10.8 2 6.3 -3.9 -12.8 -25.3 10.49.4 8.1 5.2 4.7 4.0234 GHANA CLIMATE CHANGE VULNERABILITY AND ADAPTATION ASSESSMENT
Feb 25.6 3 9.4 -9.1 -29.7 -58.9 23.318.0 10.5 7.8 6.0 3.5Mar 63.2 5 13.7 -6.0 -19.9 -39.4 59.450.6 38.3 11.9 10.1 7.7Apr 103.1 8 13.3 -4.4 -14.5 -28.7 98.588.1 73.5 12.3 11.0 9.2May 151.2 12 13.0 -4.4 -25.8 -28.4 144.5112.2 108.3 12.0 9.3 9.0Jun 226.2 17 13.5 -3.8 -12.6 -24.8 217.6197.7 170.1 12.8 11.6 10.0Jul 73.0 8 9.3 -0.8 -2.8 -5.4 72.470.9 69.0 9.0 8.9 8.6Aug 32.6 7 4.9 -0.1 -0.5 -1.0 32.632.4 32.3 4.7 4.6 4.6Sep 64.4 8 8.4 -0.5 -1.8 -3.5 64.163.2 62.1 8.0 7.9 7.8Oct 81.5 8 10.6 0.0 -0.3 -0.7 81.581.3 80.9 10.2 10.2 10.1Nov 39.0 5 8.3 -1.4 -4.8 -9.4 38.437.1 35.3 7.7 7.4 7.1Dec 19.7 2 9.8 0.5 -1.6 -3.6 19.819.3 19.0 9.9 9.7 9.5Ann. 890.2 85 10.5 -3.1 -12.3 -20.5 862.5780.4 707.4 10.1 9.2 8.3GHANA CLIMATE CHANGE VULNERABILITY AND ADAPTATION ASSESSMENT 235
APPENDIX 7. SCENARIOS OF TEMPERATURE CHANGES (UPPERBOUND VALUES) FOR THE VARIOUS ECO-CLIMATIC ZONES OFTHE COUNTRYa. SUDAN SAVANNAHBaseline Mean Temp. Mean Temp. Change Mean Temp. ScenariosMonth T-Max. T-Min. T-Mean 2020 2050 2080 2020 2050 2080Jan 35.2 19.5 27.3 0.8 2.6 5.4 28.1 29.9 32.7Feb 37.6 22.0 29.8 0.8 2.9 5.7 30.6 32.7 35.5Mar 38.9 25.0 32.0 0.9 3.0 5.9 32.9 35.0 37.9Apr 38.2 26.1 32.1 1.0 3.7 7.8 33.1 35.8 39.9May 36.0 25.1 30.5 1.0 2.9 7.2 31.5 33.4 37.7Jun 33.0 23.3 28.2 0.8 2.2 5.6 29.0 30.4 33.8Jul 31.2 22.6 26.9 0.7 2.1 4.8 27.6 29.0 31.7Aug 30.4 22.3 26.3 0.7 2.1 4.7 27.0 28.4 31.0Sep 31.2 22.1 26.6 0.7 2.2 5.0 27.3 28.8 31.6Oct 34.2 22.2 28.2 0.8 2.2 5.6 29.0 30.4 33.8Nov 36.2 20.1 28.1 0.9 2.6 5.8 29.0 30.7 33.9Dec 35.1 19.0 27.0 0.8 2.5 5.6 27.8 29.5 32.6Ann. 34.8 22.4 28.6 0.8 2.6 5.8 29.4 31.2 34.4b. GUINEA SAVANNAHBaseline Mean Temp. Mean Temp. Change Mean Temp. ScenariosMonth T-Max. T-Min. T-Mean 2020 2050 2080 2020 2050 2080Jan 35.0 18.9 26.9 0.8 2.5 5.6 27.7 29.4 32.5Feb 36.9 22.0 29.4 0.9 2.9 5.9 30.3 32.3 35.3Mar 37.0 24.1 30.6 0.9 2.8 5.9 31.5 33.4 36.5Apr 35.3 24.4 29.9 1.0 3.1 6.4 30.9 33.0 36.3May 33.5 23.5 28.5 1.0 2.9 6.0 29.5 31.4 34.5Jun 31.1 22.3 26.7 0.8 2.4 5.1 27.5 29.1 31.8Jul 29.7 21.8 25.7 0.7 2.2 4.8 26.4 27.9 30.5Aug 29.4 21.7 25.5 0.7 2.1 4.7 26.2 27.6 30.2Sep 30.2 21.5 25.8 0.7 2.0 4.4 26.5 27.8 30.2Oct 32.5 21.7 27.1 0.7 1.9 4.6 27.8 29.0 31.7Nov 34.5 20.2 27.3 0.8 2.4 5.5 28.1 29.7 32.8Dec 34.4 18.4 26.4 0.9 2.4 5.6 27.3 28.8 32.0Ann. 33.3 21.7 27.5 0.8 2.5 5.4 28.3 30.0 32.9236 GHANA CLIMATE CHANGE VULNERABILITY AND ADAPTATION ASSESSMENT
c. TRANSITIONAL ZONEBaseline Mean Temp. Mean Temp. Change Mean Temp. ScenariosMonth T-Max. T-Min. T-Mean 2020 2050 2080 2020 2050 2080Jan 33.4 20.4 26.9 0.8 2.5 5.6 27.7 29.4 32.5Feb 35.2 22.8 29.0 0.9 2.9 5.9 29.9 31.9 34.9Mar 34.9 23.8 29.3 0.9 2.8 5.9 30.2 32.1 35.2Apr 33.5 23.8 28.6 1.0 3.1 6.4 29.6 31.7 35.0May 32.2 23.2 27.7 1.0 2.9 6.0 28.7 30.6 33.7Jun 30.3 22.4 26.3 0.8 2.4 5.1 27.1 28.7 31.4Jul 28.8 21.9 25.4 0.7 2.2 4.8 26.1 27.6 30.2Aug 28.8 21.8 25.3 0.7 2.1 4.7 26.0 27.4 30.0Sep 29.5 21.8 25.7 0.7 2.0 4.4 26.4 27.7 30.1Oct 30.6 21.9 26.3 0.7 1.9 4.6 27.0 28.2 30.9Nov 32.0 21.8 26.9 0.8 2.4 5.5 27.7 29.3 32.4Dec 32.0 20.4 26.2 0.9 2.4 5.6 27.1 28.6 31.8Ann. 31.8 22.2 27.0 0.8 2.5 5.4 27.8 29.4 32.3d. DECIDUOUS FOREST ZONEBaseline Mean Temp. Mean Temp. Change Mean Temp. ScenariosMonth T-Max. T-Min. T-Mean 2020 2050 2080 2020 2050 2080Jan 32.2 20.7 26.5 0.8 2.5 5.6 27.3 29.0 32.1Feb 33.6 22.3 27.9 0.9 2.9 5.9 28.8 30.8 33.8Mar 33.1 22.7 27.9 0.9 2.8 5.9 28.8 30.7 33.8Apr 32.4 22.8 27.6 1.0 3.1 6.4 28.6 30.7 34.0May 31.5 22.4 27.0 1.0 2.9 6.0 28.0 29.9 33.0Jun 29.7 21.9 25.8 0.8 2.4 5.1 26.6 28.2 30.9Jul 28.4 21.5 24.9 0.7 2.2 4.8 25.6 27.1 29.7Aug 28.2 21.3 24.8 0.7 2.1 4.7 25.5 26.9 29.5Sep 29.1 21.5 25.3 0.7 2.0 4.4 26.0 27.3 29.7Oct 30.3 21.6 26.0 0.7 1.9 4.6 26.7 27.9 30.6Nov 31.3 21.8 26.6 0.8 2.4 5.5 27.4 29.0 32.1Dec 31.0 21.2 26.1 0.9 2.4 5.6 27.0 28.5 31.7Ann. 30.9 21.8 26.4 0.8 2.5 5.4 27.2 28.8 31.7e. RAIN FOREST ZONEBaseline Mean Temp. Mean Temp. Change Mean Temp. ScenariosMonth T-Max. T-Min. T-Mean 2020 2050 2080 2020 2050 2080Jan 30.0 23.4 26.7 0.8 2.5 5.6 27.5 29.2 32.3Feb 30.6 24.4 27.5 0.9 2.9 5.9 28.4 30.4 33.4Mar 30.9 24.3 27.6 0.9 2.8 5.9 28.5 30.4 33.5GHANA CLIMATE CHANGE VULNERABILITY AND ADAPTATION ASSESSMENT 237
Apr 30.9 24.2 27.6 1.0 3.1 6.4 28.6 30.7 34.0May 30.0 23.6 26.8 1.0 2.9 6.0 27.8 29.7 32.8Jun 28.4 23.3 25.8 0.8 2.4 5.1 26.6 28.2 30.9Jul 27.4 23.2 25.3 0.7 2.2 4.8 26.0 27.5 30.1Aug 26.9 22.8 24.8 0.7 2.1 4.7 25.5 26.9 29.5Sep 27.4 22.9 25.1 0.7 2.0 4.4 25.8 27.1 29.5Oct 28.5 23.4 25.9 0.7 1.9 4.6 26.6 27.8 30.5Nov 29.9 23.1 26.5 0.8 2.4 5.5 27.3 28.9 32.0Dec 30.0 23.2 26.6 0.9 2.4 5.6 27.5 29.0 32.2Ann. 29.3 23.5 26.4 0.8 2.5 5.4 27.2 28.8 31.7f. COASTAL SAVANNAH ZONEBaseline Mean Temp. Mean Temp. Change Mean Temp. ScenariosMonth T-Max. T-Min. T-Mean 2020 2050 2080 2020 2050 2080Jan 31.2 23.7 27.5 0.8 2.5 5.6 28.3 30.0 33.1Feb 31.9 24.7 28.3 0.9 2.9 5.9 29.2 31.2 34.2Mar 31.9 24.8 28.3 0.9 2.8 5.9 29.2 31.1 34.2Apr 31.7 24.8 28.3 1.0 3.1 6.4 29.3 31.4 34.7May 31.0 24.4 27.7 1.0 2.9 6.0 28.7 30.6 33.7Jun 29.2 23.7 26.4 0.8 2.4 5.1 27.2 28.8 31.5Jul 27.6 22.9 25.3 0.7 2.2 4.8 26.0 27.5 30.1Aug 27.5 22.4 24.9 0.7 2.1 4.7 25.6 27.0 29.6Sep 28.3 22.8 25.6 0.7 2.0 4.4 26.3 27.6 30.0Oct 29.7 23.2 26.4 0.7 1.9 4.6 27.1 28.3 31.0Nov 31.2 24.0 27.6 0.8 2.4 5.5 28.4 30.0 33.1Dec 30.9 23.5 27.2 0.9 2.4 5.6 28.1 29.6 32.8Ann. 30.2 23.7 26.9 0.8 2.5 5.4 27.8 29.4 32.3238 GHANA CLIMATE CHANGE VULNERABILITY AND ADAPTATION ASSESSMENT
APPENDIX 8. SCENARIOS OF CHANGES IN PRECIPITATION AMOUNTS (UPPER BOUNDVALUES) FOR THE VARIOUS ECO-CLIMATIC ZONE IN GHANAa. SUDAN SAVANNAHBaseline Means Mean <strong>change</strong> in rainfall. Scenarios: Mean Rainfall Amount. Scenarios (Mean DailyRainfall)Mean No. of Raindays Daily mean (per cent) (mm) (mm per day)Month (mm) (days) (mm/day) 2020 2050 2080 20202050 2080 2020 2050 2080Jan 1.0 1 1.4 -13.8 -45.2 -60.5 0.90.6 0.4 0.9 0.6 0.4Feb 3.7 1 4.6 -11.5 -37.6 -47.0 3.22.3 1.9 3.2 2.3 1.9Mar 18.3 2 10.0 -10.0 -32.5 -65.9 16.512.4 6.3 8.3 6.2 3.1Apr 57.4 5 12.2 -9.9 -32.6 -65.7 51.738.7 19.7 10.3 7.7 3.9May 95.7 8 12.5 -4.9 -16.0 -25.1 91.080.4 71.7 11.4 10.0 9.0Jun 125.2 10 12.5 -2.2 -14.1 -20.7 122.5107.6 99.3 12.2 10.8 9.9Jul 193.9 14 14.2 2.5 -6.2 -7.6 198.8181.9 179.2 14.2 13.0 12.8Aug 266.7 18 15.0 1.8 -1.4 -11.6 271.5262.9 235.7 15.1 14.6 13.1Sep 173.4 14 12.4 -0.8 -4.8 -22.2 172.0165.1 134.9 12.3 11.8 9.6Oct 48.4 7 7.2 0.0 -0.2 -13.8 48.448.3 41.7 6.9 6.9 6.0Nov 4.8 1 7.2 -3.8 -6.0 -45.6 4.64.5 2.6 4.6 4.5 2.6Dec 3.4 1 4.4 -10.4 -2.5 -5.0 3.03.3 3.2 3.0 3.3 3.2Ann. 992.0 82 12.1 -5.3 -16.6 -32.6 939.9827.4 669.0 11.5 10.1 8.2b. GUINEA SAVANNAHBaseline Means Mean <strong>change</strong> in rainfall. Scenarios: Mean Rainfall Amount. Scenarios (Mean DailyRainfall)Mean No. of Raindays Daily mean (per cent) (mm) (mm per day)Month (mm) (days) (mm/day) 2020 2050 2080 20202050 2080 2020 2050 2080Jan 2.0 1 2.0 -5.3 -17.4 -35.2 1.91.7 1.3 1.9 1.7 1.3Feb 7.8 1 7.8 -12.4 -40.5 -82.2 6.94.7 1.4 6.9 4.7 1.4Mar 51.3 5 10.3 -8.3 -27.2 -55.0 47.037.3 23.1 9.4 7.5 4.6GHANA CLIMATE CHANGE VULNERABILITY AND ADAPTATION ASSESSMENT 239
Apr 81.9 8 10.2 -6.0 -19.8 -40.0 77.065.7 49.2 9.6 8.2 6.1May 124.8 11 11.3 -6.0 -25.8 -39.6 117.392.6 75.4 10.7 8.4 6.9Jun 152.1 12 12.7 -5.2 -17.0 -34.6 144.2126.3 99.5 12.0 10.5 8.3Jul 174.5 14 12.5 -1.2 -3.8 -7.6 172.4167.9 161.2 12.3 12.0 11.5Aug 191.5 16 12.0 -0.2 -0.6 -2.8 191.1190.3 186.1 11.9 11.9 11.6Sep 219.3 18 12.2 -0.8 -2.4 -4.8 217.5214.0 208.8 12.1 11.9 11.6Oct 90.7 10 9.1 0.0 -0.5 -1.0 90.790.2 89.7 9.1 9.0 9.0Nov 12.2 2 6.1 -2.0 -6.5 -13.2 12.011.4 10.6 6.0 5.7 5.3Dec 7.2 1 7.2 0.8 -2.3 -5.0 7.27.0 6.8 7.2 7.0 6.8Ann. 1115.3 99 11.3 -3.9 -13.7 -26.8 1072.0963.0 816.9 10.8 9.7 8.3c. TRANSITIONAL ZONEBaseline Means Mean <strong>change</strong> in rainfall. Scenarios: Mean Rainfall Amount. Scenarios (Mean DailyRainfall)Mean No. of Raindays Daily mean (per cent) (mm) (mm per day)Month (mm) (days) (mm/day) 2020 2050 2080 20202050 2080 2020 2050 2080Jan 5.7 1 5.7 -5.3 -17.4 -35.2 5.44.7 3.7 5.4 4.7 3.7Feb 19.0 2 9.5 -12.4 -40.5 -82.2 16.611.3 3.4 8.3 5.7 1.7Mar 76.6 5 15.3 -8.3 -27.2 -55.0 70.355.8 34.5 14.1 11.2 6.9Apr 117.2 7 16.7 -6.0 -19.8 -40.0 110.194.0 70.3 15.7 13.4 10.0May 156.1 10 15.7 -6.0 -25.8 -39.6 146.7115.8 94.3 14.7 11.6 9.4Jun 185.9 15 12.4 -5.2 -17.0 -34.6 176.2154.3 121.6 11.7 10.3 8.1Jul 168.2 16 10.5 -1.2 -3.8 -7.6 166.2161.8 155.5 10.4 10.1 9.7Aug 151.5 15 10.1 -0.2 -0.6 -2.8 151.2150.6 147.3 10.1 10.0 9.8Sep 211.8 13 16.3 -0.8 -2.4 -4.8 210.1206.7 201.7 16.2 15.9 15.5Oct 163.3 12 13.6 0.0 -0.5 -1.0 163.3162.5 161.6 13.6 13.5 13.5Nov 33.8 3 11.4 -2.0 -6.5 -13.2 33.131.6 29.3 11.0 10.5 9.8Dec 12.1 2 6.1 0.8 -2.3 -5.0 12.211.9 11.5 6.1 5.9 5.8Ann. 1301.3 101 12.9 -3.9 -13.7 -26.8 1250.81123.7 953.2 12.4 11.1 9.4240 GHANA CLIMATE CHANGE VULNERABILITY AND ADAPTATION ASSESSMENT
d. DECIDUOUS FOREST ZONEBaseline Means Mean <strong>change</strong> in rainfall. Scenarios: Mean Rainfall Amount. Scenarios (Mean DailyRainfall)Mean No. of Raindays Daily mean (per cent) (mm) (mm per day)Month (mm) (days) (mm/day) 2020 2050 2080 20202050 2080 2020 2050 2080Jan 17.1 2 10.1 -5.3 -17.4 -35.2 16.214.1 11.1 8.1 7.0 5.5Feb 54.8 5 11.5 -12.4 -40.5 -82.2 48.032.6 9.8 9.6 6.5 2.0Mar 114.9 9 12.8 -8.3 -27.2 -55.0 105.483.6 51.7 11.7 9.3 5.7Apr 134.4 11 12.5 -6.0 -19.8 -40.0 126.4107.8 80.7 11.5 9.8 7.3May 169.4 13 13.2 -6.0 -25.8 -39.6 159.2125.7 102.3 12.2 9.7 7.9Jun 215.2 16 13.5 -5.2 -17.0 -34.6 204.0178.6 140.7 12.8 11.2 8.8Jul 121.9 13 9.5 -1.2 -3.8 -7.6 120.4117.2 112.6 9.3 9.0 8.7Aug 80.9 11 7.4 -0.2 -0.6 -2.8 80.880.4 78.7 7.3 7.3 7.2Sep 142.0 14 10.2 -0.8 -2.4 -4.8 140.9138.6 135.2 10.1 9.9 9.7Oct 153.8 15 10.4 0.0 -0.5 -1.0 153.8153.1 152.3 10.3 10.2 10.2Nov 67.0 8 8.6 -2.0 -6.5 -13.2 65.662.6 58.1 8.2 7.8 7.3Dec 31.9 3 11.1 0.8 -2.3 -5.0 32.231.2 30.3 10.7 10.4 10.1Ann. 1303.4 120 10.9 -3.9 -13.7 -26.8 1252.81125.5 954.7 10.4 9.4 8.0e. RAIN FOREST ZONEBaseline Means Mean <strong>change</strong> in rainfall. Scenarios: Mean Rainfall Amount. Scenarios (Mean DailyRainfall)Mean No. of Raindays Daily mean (per cent) (mm) (mm per day)Month (mm) (days) (mm/day) 2020 2050 2080 20202050 2080 2020 2050 2080Jan 34.0 4 9.3 -5.3 -17.4 -35.2 32.228.0 22.0 8.0 7.0 5.5Feb 66.2 5 13.1 -12.4 -40.5 -82.2 58.039.4 11.8 11.6 7.9 2.4Mar 130.1 9 14.8 -8.3 -27.2 -55.0 119.394.7 58.5 13.3 10.5 6.5Apr 175.3 12 15.1 -6.0 -19.8 -40.0 164.8140.6 105.2 13.7 11.7 8.8May 345.1 23 15.0 -6.0 -25.8 -39.6 324.4256.1 208.5 14.1 11.1 9.1Jun 579.7 22 26.4 -5.2 -17.0 -34.6 549.5481.1 379.1 25.0 21.9 17.2GHANA CLIMATE CHANGE VULNERABILITY AND ADAPTATION ASSESSMENT 241
Jul 211.7 1.5 14.4 -1.2 -3.8 -7.6 209.1203.6 195.6 139.4 135.8 130.4Aug 79.7 13 6.3 -0.2 -0.6 -2.8 79.679.2 77.5 6.1 6.1 6.0Sep 95.3 15 6.5 -0.8 -2.4 -4.8 94.693.0 90.8 6.3 6.2 6.1Oct 168.7 17 10.1 0.0 -0.5 -1.0 168.7167.8 167.0 9.9 9.9 9.8Nov 136.8 14 10.0 -2.0 -6.5 -13.2 134.1127.9 118.7 9.6 9.1 8.5Dec 70.1 8 9.1 0.8 -2.3 -5.0 70.768.5 66.6 8.8 8.6 8.3Ann. 2092.7 143.5 14.6 -3.9 -13.7 -26.8 2011.41807.0 1532.9 14.0 12.6 10.7f. COASTAL SAVANNAHBaseline Means Mean <strong>change</strong> in rainfall. Scenarios: Mean Rainfall Amount. Scenarios (Mean DailyRainfall)Mean No. of Raindays Daily mean (per cent) (mm) (mm per day)Month (mm) (days) (mm/day) 2020 2050 2080 20202050 2080 2020 2050 2080Jan 10.8 2 6.3 -5.3 -17.4 -35.2 10.28.9 7.0 5.1 4.5 3.5Feb 25.6 3 9.4 -12.4 -40.5 -82.2 22.415.2 4.6 7.5 5.1 1.5Mar 63.2 5 13.7 -8.3 -27.2 -55.0 57.946.0 28.4 11.6 9.2 5.7Apr 103.1 8 13.3 -6.0 -19.8 -40.0 96.982.7 61.8 12.1 10.3 7.7May 151.2 12 13.0 -6.0 -25.8 -39.6 142.1112.2 91.3 11.8 9.3 7.6Jun 226.2 17 13.5 -5.2 -17.0 -34.6 214.5187.8 148.0 12.6 11.0 8.7Jul 73.0 8 9.3 -1.2 -3.8 -7.6 72.170.2 67.4 9.0 8.8 8.4Aug 32.6 7 4.9 -0.2 -0.6 -2.8 32.532.4 31.7 4.6 4.6 4.5Sep 64.4 8 8.4 -0.8 -2.4 -4.8 63.962.8 61.3 8.0 7.9 7.7Oct 81.5 8 10.6 0.0 -0.5 -1.0 81.581.1 80.7 10.2 10.1 10.1Nov 39.0 5 8.3 -2.0 -6.5 -13.2 38.236.5 33.8 7.6 7.3 6.8Dec 19.7 2 9.8 0.8 -2.3 -5.0 19.819.2 18.7 9.9 9.6 9.3Ann. 890.2 85 10.5 -3.9 -13.7 -26.8 855.6768.7 652.1 10.1 9.0 7.7242 GHANA CLIMATE CHANGE VULNERABILITY AND ADAPTATION ASSESSMENT
APPENDIX 9. SCENARIOS OF MEAN SEA SURFACE AIRTEMPERATURES IN THE OFF-SHORE WATERS OF GHANAa. OFF-SHORE COASTAL AREA (Median values)B-Line Mean Temp. Change( o C ) Mean Temp.( o C )T-Mean. 2020 2050 2080 2020 2050 2080Jan 27.1 0.4 1.3 2.6 27.5 28.4 29.7Feb 27.5 0.4 1.4 2.6 27.9 28.9 30.1Mar 27.6 0.4 1.3 2.6 28.0 28.9 30.2Apr 27.8 0.4 1.4 2.8 28.2 29.2 30.6May 27.5 0.5 1.4 2.8 28.0 28.9 30.3Jun 25.7 0.5 1.5 3.0 26.2 27.2 28.7Jul 24.5 0.5 1.6 3.0 25.0 26.1 27.5Aug 23.5 0.5 1.4 3.0 24.0 24.9 26.5Sep 24.5 0.4 1.4 2.7 24.9 25.9 27.2Oct 25.3 0.4 1.3 2.6 25.7 26.6 27.9Nov 26.3 0.4 1.2 2.5 26.7 27.5 28.8Dec 26.8 0.4 1.3 2.5 27.2 28.1 29.3Ann. 26.2 0.4 1.4 2.7 26.6 27.6 28.9b. OFF-SHORE COASTAL AREA (Upper bound values)B-Line Mean Temp. Change( o C ) Mean Temp.( o C )T-Mean. 2020 2050 2080 2020 2050 2080Jan 27.1 0.6 1.8 3.6 27.7 28.9 30.7Feb 27.5 0.6 1.8 3.6 28.1 29.3 31.1Mar 27.6 0.6 1.8 3.5 28.2 29.4 31.1Apr 27.8 0.6 1.9 3.8 28.4 29.7 31.6May 27.5 0.6 2.0 4.0 28.1 29.5 31.5Jun 25.7 0.6 2.0 4.2 26.3 27.7 29.9Jul 24.5 0.6 2.1 4.3 25.1 26.6 28.8Aug 23.5 0.6 2.0 4.1 24.1 25.5 27.6Sep 24.5 0.6 1.9 3.8 25.1 26.4 28.3Oct 25.3 0.5 1.8 3.6 25.8 27.1 28.9Nov 26.3 0.5 1.7 3.4 26.8 28.0 29.7Dec 26.8 0.6 1.8 3.6 27.4 28.6 30.4Ann. 26.2 0.6 1.9 3.8 26.8 28.1 30.0GHANA CLIMATE CHANGE VULNERABILITY AND ADAPTATION ASSESSMENT 243
APPENDIX 10. SCENARIOS OF SEA LEVEL CHANGEWITH RESPECT TO 1990 MEAN (CM)Year Change (Central Value) (cm) Change ( Range) (cm)201020202030204020502060207020803.65.88.612.016.521.928.034.51.6 to 6.02.6 to 9.83.8 to 14.45.5 to 20.27.6 to 27.610.3 to 36.713.1 to 47.116.1 to 58.4244 GHANA CLIMATE CHANGE VULNERABILITY AND ADAPTATION ASSESSMENT
U.S. Agency for International Development1300 Pennsylvania Avenue, NWWashington, DC 20523Tel: (202) 712-0000Fax: (202) 216-3524www.usaid.gov2 GHANA CLIMATE CHANGE VULNERABILITY AND ADAPTATION ASSESSMENT