Phillip Securities Research - Phillip CFD
Phillip Securities Research - Phillip CFD
Phillip Securities Research - Phillip CFD
- No tags were found...

Create successful ePaper yourself
Turn your PDF publications into a flip-book with our unique Google optimized e-Paper software.
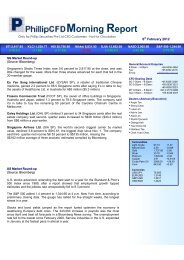
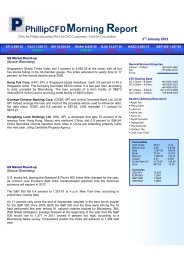
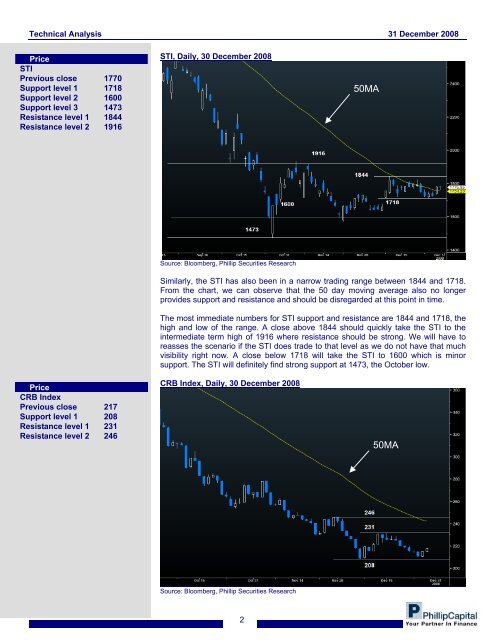
Technical Analysis 31 December 2008PriceSTIPrevious close 1770Support level 1 1718Support level 2 1600Support level 3 1473Resistance level 1 1844Resistance level 2 1916STI, Daily, 30 December 200850MASource: Bloomberg, <strong>Phillip</strong> <strong>Securities</strong> <strong>Research</strong>Similarly, the STI has also been in a narrow trading range between 1844 and 1718.From the chart, we can observe that the 50 day moving average also no longerprovides support and resistance and should be disregarded at this point in time.The most immediate numbers for STI support and resistance are 1844 and 1718, thehigh and low of the range. A close above 1844 should quickly take the STI to theintermediate term high of 1916 where resistance should be strong. We will have toreasses the scenario if the STI does trade to that level as we do not have that muchvisibility right now. A close below 1718 will take the STI to 1600 which is minorsupport. The STI will definitely find strong support at 1473, the October low.PriceCRB IndexPrevious close 217Support level 1 208Resistance level 1 231Resistance level 2 246CRB Index, Daily, 30 December 200850MASource: Bloomberg, <strong>Phillip</strong> <strong>Securities</strong> <strong>Research</strong>2