HW desnis Introduction_to_Population_Biology.pdf
HW desnis Introduction_to_Population_Biology.pdf
HW desnis Introduction_to_Population_Biology.pdf
- No tags were found...

You also want an ePaper? Increase the reach of your titles
YUMPU automatically turns print PDFs into web optimized ePapers that Google loves.
Chapter 6Gene frequencies andthe Hardy–Weinberg principle<strong>Population</strong> genetics considers how the frequencies of alternativestates of genes in populations are maintained or changed from generation<strong>to</strong> generation. First, however, it is important that we understandthe terms that are used; otherwise, it is easy for beginners <strong>to</strong> becomeconfused. It is also important <strong>to</strong> know how the terms will be used inthis book, because many of the terms are not used consistently in thewider literature.6.1 TerminologyThe following should clarify how the various terms introduced in thischapter are used throughout the book.phenotype The morphological, physiological, behavioural or biochemicalcharacteristic of an individual, or a group of individuals in apopulation. Typically, the term refers <strong>to</strong> a single characteristic, suchas body colour or blood group type, but can also refer <strong>to</strong> more thanone characteristic. Almost invariably, there is more than one phenotypefor a given characteristic. For example, there may be bothshort and tall plants in a population.genotype This is the genetic constitution of an individual, or a groupof individuals in a population, which is related by simple Mendelianrules <strong>to</strong> the phenotype. The theory in this book mainly considersgenes with just two different alleles in the population, e.g. A andB, so that there will be just three different genotypes, AA, AB andBB. These will result in three different phenotypes if there is nodominance, but only two if there is dominance. If genotypes AA andAB give rise <strong>to</strong> the same phenotype, A is considered <strong>to</strong> be dominant<strong>to</strong> B, and if AB and BB give the same phenotype, B is considereddominant <strong>to</strong> A. Theory relating <strong>to</strong> multiple genes and alleles isconsidered in Chapter 12.locus This is a site on a chromosome and we will consider a gene <strong>to</strong>occupy a particular locus.
88 GENE FREQUENCIES: THE HARDY–WEINBERG PRINCIPLETable 6.1The frequencies of M--N blood groups in a New York City black populationPhenotype (blood group) M MN N TotalGenotype MM MN NNNumber in sample 119 242 139 500Genotypic frequency 0.238 = P 0.484 = H 0.278 = Q 1.0 = } P + H + QNumber of alleles M 238 242 0 480= 1000N 0 242 278 520Allelic frequency M 0.48 = pN0.52 = qSource: Data from Mourant et al. (1976).gene The definition of this term is complicated because it is used indifferent contexts. A gene can be considered <strong>to</strong> occupy a particularlocus on a chromosome and code for a particular characteristic ofthe organism, such as body colour. There may be alternative states,or alleles (see next definition), of the gene. For example, there maybe two alleles for flower colour, one coding for red flowers and theother for white flowers. However, the term gene is often used as asynonym for allele, although I have tried <strong>to</strong> avoid this in this book.For example, we may talk of the gene for cystic fibrosis, or someother genetic disease, but only one form of the gene (i.e. one allele)gives rise <strong>to</strong> that particular phenotype.allele One of the alternative states of a gene. An individual may haveonly one type of allele, in which case it is said <strong>to</strong> be homozygousfor that particular gene or trait, or an individual may have twodifferent alleles (assuming we are dealing with diploid organisms)and is said <strong>to</strong> be heterozygous for that gene.6.2 Frequencies of alleles, genotypes andphenotypesWe can understand the relationship between the frequencies of alleles,genotypes and phenotypes in populations by considering a simpleexample (Table 6.1).It may be seen that each of the three genotypes gives rise <strong>to</strong> adifferent blood group because there is no dominance (the two alleles,M and N, are said <strong>to</strong> be codominant). The blood groups were screenedin a sample of 500 individuals from the population, and it is a simplematter <strong>to</strong> calculate the genotypic frequencies in the population fromthe results. The frequency (P) ofMMis119/500 = 0.238; the frequency(H)ofMNis242/500 = 0.484; and the frequency (Q)ofNNis139/500 =0.278. Note that P + H + Q = 1. Similarly, it is easy <strong>to</strong> calculate theallelic frequencies. The frequency (p) of M is (238 + 242)/1000 = 0.48(or (2P + H)/2); and the frequency (q) of N is (278 + 242)/1000 = 0.52(or (2Q + H)/2), because each individual has two alleles. Note thatp + q = 1.
THE HARDY–WEINBERG PRINCIPLE 89We can summarize these relationships for a system of two allelesand three genotype as follows:Genotypic frequency P = n P /NH = n H /NQ = n Q /Nand P + Q + H = 1 (Exp. 6.1)where N is the number of individuals in the sample, and the numberof individuals of each genotype are n P , n H and n Q . Similarly:Allelic frequencies p = P + 1 H (Exp. 6.2)2q = Q + 1 H2(Exp. 6.3)and p + q = 1 (Exp. 6.4)In this example each genotype corresponds <strong>to</strong> a different phenotypeand so the genotypic and phenotypic frequencies are the same.If one allele is dominant over the other, there will only be two phenotypes.If one cannot distinguish the heterozygous individuals fromthe homozygous dominant individuals, the estimation of the allelicfrequencies becomes less accurate (see section 6.4.1). The estimationof allelic frequencies where there are three or more alleles can alsobe troublesome (see Hartl and Clark 1989).6.3 The Hardy–Weinberg principleShortly after the rediscovery of Mendel’s work, people began <strong>to</strong> speculateabout its implications for the genetic structure of populations. Itwas suggested that as dominant characteristics assumed a 3 : 1 ratioin classic Mendelian crosses, this meant that any dominant characteror phenotype should eventually appear in 75% of the population. Thisapparent consequence of Mendelian genetics was clearly not true forcertain dominant traits, like bradydactyly (stubby fingers) in humans,which remained extremely rare, and so some scientists questioned thevery foundation of Mendelian genetics. These misconceptions werebrought <strong>to</strong> the attention of a Cambridge University mathematician,G. H. Hardy, and a German clinical physician, W. Weinberg (pronouncedVineberg), who showed independently that dominance per sehad no effect on allelic frequencies, and furthermore that allelic frequencieswould not change as a result of sexual reproduction. Theirelegant proofs for populations breeding at random, published in 1908,formed the basis of the new field of population genetics.The Hardy--Weinberg principle can be stated as follows: In a largepopulation where there is no genetic drift, 1 and in the absence of selection,migration and mutation, the allelic frequencies remain constant from generation<strong>to</strong> generation. If mating is random, the genotypic frequencies are related1 Genetic drift is the chance change in allelic frequencies as a result of sampling error(see Chapter 8).
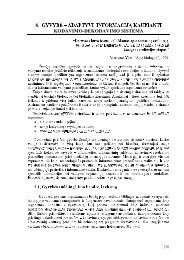
90 GENE FREQUENCIES: THE HARDY–WEINBERG PRINCIPLEFig. 6.1 Punnett square showingthe Hardy–Weinberg genotypicfrequencies generated by randommating when the frequency of theA 1 allele (p) is 0.6 and thefrequency of the A 2 allele (q) is 0.4.Male gametesA 1 A 2p = 0.6 q = 0.4A 1p = 0.6A 1 A 1p 2 = 0.36A 1 A 2pq = 0.24Female gametesA 2q = 0.4A 1 A 2pq = 0.24A 2 A 2q 2 = 0.16<strong>to</strong> the allelic frequencies by the square expansion of allelic frequencies. Thus,for au<strong>to</strong>somal genes in diploid organisms in which there are two alleleswith frequencies p and q, the frequencies of the three genotypesare predicted by the formula (p + q) 2 = p 2 + 2pq + q 2 . Furthermore,for au<strong>to</strong>somal genes the equilibrium genotypic frequencies at any given locusare attained in a single generation providing there is no overlapping ofgenerations.The principle can be demonstrated most simply by a Punnettsquare diagram (Fig. 6.1), which represents the union of gametes byrandom mating of an entire breeding population. A single gene locusis shown, with two alleles (A 1 and A 2 )withfrequenciesofp and q. Therandom combination of these alleles in sexual reproduction resultsin the genotypic frequencies of p 2 for A 1 A 1 ,2pq for A 1 A 2 and q 2 forA 2 A 2 . Thus, the genotypic frequencies for a two-allele system are asfollows:p 2 + 2pq + q 2 = 1 (Eqn 6.1)The allelic frequencies do not change as a result of this reproduction.We can see from Fig. 6.1, or from Exp. 6.2, that the frequency(p 1 )ofA 1 after one generation of random breeding is given by:p 1 = p 2 + 1 2 (2pq)= p 2 + pq= p(p + q)But p + q is equal <strong>to</strong> 1. Therefore, p 1 is equal <strong>to</strong> p, which is theoriginal frequency of the A 1 allele. In a similar fashion we can show
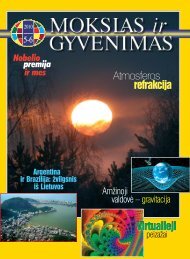
AUTOSOMAL GENES WITH TWO ALLELES 91Genotypic frequency1.00.80.60.40.2p 2 (A 1 A 1 ) q 2 (A 2 A 2 )2pq (A 1 A 2 )Fig. 6.2 The Hardy–Weinberggenotypic frequencies at a genelocus with two alleles as a functionof the frequency (q) of the A 2allele. Note that the heterozygotesare most common at intermediateallelic frequencies (between 0.33and 0.67).0.00.2 0.4 0.6 0.8 1.0Allelic frequency (q)that the frequency of the A 2 allele in the offspring equals q. Thus,when there is random breeding, the allelic frequencies stay constantfrom generation <strong>to</strong> generation.It is a simple matter <strong>to</strong> relate the genotypic frequencies <strong>to</strong> the allelicfrequencies using Eqn 6.1 (Fig. 6.2). For example, if the frequencyof the A 2 allele (q) is 0.3 then genotype A 2 A 2 has a frequency of q 2(0.3 2 = 0.09), genotype A 1 A 2 has a frequency of 2pq (2 × 0.7 × 0.3 =0.42), and genotype A 1 A 1 has a frequency of p 2 (0.7 2 = 0.49). It maybe seen from Fig. 6.2 that heterozygotes are most common at intermediateallelic frequencies.6.3.1 Neutral equilibriumThe Hardy--Weinberg equilibrium is a neutral equilibrium. This meansthat the allelic and genotypic frequencies do not change because ofrandom mating, but if some other force, such as selection or migration,changes the frequencies of the alleles <strong>to</strong> new values, the genotypicfrequencies au<strong>to</strong>matically shift according <strong>to</strong> the formula p 2 +2pq + q 2 . Thus, the genotypic frequencies do not return <strong>to</strong> their previousvalues but are defined by the new allelic frequencies. If no otherforce is applied, the population will remain at this new equilibrium.This neutral equilibrium differs from a stable equilibrium, like thecarrying capacity K in logistic growth, because the latter returns <strong>to</strong> afixed equilibrium value (K) if disturbed.6.4 Applying the Hardy–Weinberg principle <strong>to</strong>au<strong>to</strong>somal genes with two allelesThe Hardy--Weinberg principle is elegant, but how useful is it? It allseems so idealistic: random breeding, no evolutionary forces such asselection or mutation operating, no overlapping of generations, andso on. Let us consider some of these apparently idealistic conditionswhen we apply the principle, and see how useful it can be.
92 GENE FREQUENCIES: THE HARDY–WEINBERG PRINCIPLETable 6.2 The frequencies of M--N blood groups using the data from Table 6.1, assuming that M is dominant<strong>to</strong> N for the purposes of illustrationPhenotype (blood group) M N TotalGenotype MM + MN NNNumber in sample 361 139 500Frequency in sample 0.722 0.278 1.0Theoretical frequency p 2 + 2pq q 2 p 2 + 2pq + q 2 = 1Estimated allelic frequency of N = √ (q 2 ) = √ (0.278) = 0.5273Estimated allelic frequency of M = 1 − q = 1 − 0.5273 = 0.47276.4.1 Estimating allelic frequencies when one allele isdominant <strong>to</strong> anotherIn section 6.2, we learned how <strong>to</strong> estimate allelic frequencies fromthe genotypic frequencies (see Exps. 6.2 and 6.3). However, if one alleleis dominant <strong>to</strong> the other, and we cannot distinguish betweenthe homozygous dominant and heterozygous individuals, we have <strong>to</strong>estimate the allelic frequencies in another, less accurate, way. To illustratethis, we will use the M--N blood group data from Table 6.1,but imagine that the M allele is dominant <strong>to</strong> the N allele.If there were dominance, we would observe two phenotypes, Mand N. The M phenotype would include both the MM and MN genotypes,and so there would be 119 + 242 = 361 of this phenotype (seeTable 6.1). The frequencies of the two phenotypes are 361/500 = 0.722and 139/500 = 0.278. We cannot estimate the frequency of M allelesdirectly because some individuals of phenotype M have both M andN alleles. However, phenotype N consists of a single genotype, andif we assume random breeding this has a theoretical frequency ofq 2 in the population, according <strong>to</strong> the Hardy--Weinberg equilibrium(Eqn 6.1). Consequently, we can estimate the allelic frequency (q) ofNas √ (q 2 ) and this gives us an estimate of 0.5273. The allelic frequency(p) of M is 0.4727 from the relationship p = 1--q (a transformationof Exp. 6.4).These estimates are very similar <strong>to</strong> those based on the entiresample (Table 6.2), and the two sets of estimates only differby approximately 1.5%. However, the error increases as the frequencyof the homozygous recessive individuals becomes lower inthe population.6.4.2 Random matingIt is important <strong>to</strong> understand that when we talk of random mating,we do not mean promiscuous mating, we only mean that mates arechosen without regard <strong>to</strong> the genotype at the gene locus being considered.It is possible for mating <strong>to</strong> be random with respect <strong>to</strong> sometraits and, simultaneously, <strong>to</strong> be non-random with respect <strong>to</strong> othertraits. In humans, for example, mating appears <strong>to</strong> be random with respect<strong>to</strong> blood groups and many enzyme systems, but is non-randomwith respect <strong>to</strong> skin colour, height and IQ.
AUTOSOMAL GENES WITH TWO ALLELES 93Table 6.3 Comparison of observed and expected numbers of M--N phenotypes, assuming randombreeding, in a sample of 500 individuals (data from Table 6.1)Blood group MM MN NN TotalObserved number 119 242 139 500Expected number 115.2 249.6 135.2 500χ 2 (119−115.2)value+ (242−249.6)2 + (139−135.2)2 = 0.4635115.2 249.6 135.2df = 3 − 2 = 1 P = 0.5We can see how well the genotypic frequencies in a populationcorrespond <strong>to</strong> the expected Hardy--Weinberg frequencies by lookingat the data from our first example (Table 6.3). The expected numberfor each genotype was calculated by multiplying the expected frequenciesof p 2 + 2pq + q 2 by the <strong>to</strong>tal number of the sample. Thusthe expected number of the MM genotype is 0.48 2 × 500 = 115.2, andso on. It may be seen that the observed and expected numbers arein close agreement. This is not <strong>to</strong>o surprising when we consider thatmost people live, choose a mate, reproduce, and so on without everknowing their MN blood type. Thus, mates are chosen without regard<strong>to</strong> blood type and so breeding is random with respect <strong>to</strong> blood type.How different would the observed and expected numbers have <strong>to</strong>be before we considered them <strong>to</strong> be significantly different? We canmake a statistical comparison of the two sets of numbers using thechi-squared test (χ 2 -test), a standard procedure that is explained invirtually any textbook on statistics. In our example, the χ 2 value is0.4635, with one degree of freedom (we lose two degrees of freedombecause the <strong>to</strong>tal numbers and the allelic frequencies are the same inthe observed and expected series). The probability is about 0.5, whichis not significant (see below). We can conclude, therefore, that matingis random with respect <strong>to</strong> the M--N blood groups in this population.The χ 2 test gives an objective way of assessing the agreement betweenthe observed and expected results. As the difference betweenthe observed and expected results gets larger, the χ 2 value also getslarger. When it reaches 3.84 or higher (df = 1), and the probability(P) becomes 0.05 or lower, we can conclude that the observed andexpected results are significantly different from one another. At thispoint we consider that the population is not in Hardy--Weinberg equilibrium,i.e. is not breeding at random with respect <strong>to</strong> the characterin question.6.4.3 Violation of strict assumptionsThe Hardy--Weinberg principle is not very sensitive <strong>to</strong> certain violationsof the assumptions. For this reason, we cannot say that there isno selection, mutation, etc. if we find that the genotypic frequenciesconform <strong>to</strong> the expected values. Let us consider two examples <strong>to</strong> showthis.Sickle-cell anaemia is prevalent in tropical Africa where there is ahigh incidence of malaria. Humans from this area have two forms of
94 GENE FREQUENCIES: THE HARDY–WEINBERG PRINCIPLETable 6.4Frequencies of haemoglobin types in samples of 287 infants and 654 adults in TanzaniaFrequencyGenotype AA AS SS Total of S alleleObserved number of189 89 9 287 0.1864infantsExpected H–W numbers 190 87 10 287χ 2 value = 0.15; df = 1; P > 0.5Observed number of400 249 5 654 0.1980adultsExpected H–W numbers 420.7 207.7 25.6 654χ 2 value = 25.8; df = 1; P < 0.001Source: Data from Allison (1956).haemoglobin: a normal form, A, and a sickle form, S. The three genotypeshave the following characteristics: AA has ‘normal’ haemoglobinand red blood cells; SS individuals have abnormal haemoglobin andtheir red blood cells have a characteristic sickle shape; and heterozygousAS individuals have red blood cells that assume a sickle shapeonly when the blood is deoxygenated. Homozygous SS individualsmainly die an early death from a wide variety of disorders (seeChapter 7), but heterozygous (AS) individuals have a resistance <strong>to</strong>malaria and survive better than ‘normal’ individuals in areas wheremalaria is prevalent. Thus, there are strong selection pressures operatingon this gene system.Samples of a Tanzanian population show that the infant genotypesare in Hardy--Weinberg equilibrium but the adults are not (Table 6.4).There are fewer homozygotes than expected in adults because AAindividuals have a higher death rate from malaria than other genotypesand SS individuals have a high death rate from the effects ofsickle-cell anaemia, and consequently there are more heterozygotesthan expected because they are at a selective advantage. The survivingadults mate at random with respect <strong>to</strong> this gene and the fertilityof the different genotypes is equal. Consequently, the genotypes ofthe next generation of children occur at Hardy--Weinberg frequenciesbecause this equilibrium is attained in a single generation (seesection 6.3). Selection is operating, but the genotypic frequencies ofthe young are in Hardy--Weinberg equilibrium.The second example concerns the rare Tay--Sachs disease, a disorderinvolving lipid metabolism which results in the accumulation ofa specialized type of lipid known as ganglioside in the nerve cells.Tay--Sachs is a recessive disorder that is lethal in early childhood.There is no known cure. The disease occurs at an incidence of about1 in 550 000 births in the non-Jewish Canadian population (it hasa higher incidence in Jews who originally came from Europe). Thehomozygous ‘normal’ individuals (AA) and heterozygous individuals(Aa) are generally indistinguishable, although heterozygous individualscan be detected by screening a certain enzyme in the blood.
COMPLICATIONS 95According <strong>to</strong> the Hardy--Weinberg principle, the frequency of the homozygousrecessive (aa) in the population is q 2 . Assuming randombreeding, we can estimate the frequency of the Tay--Sachs allele as follows:q 2 = 1/550 000 = 0.000 001 82, therefore q = √ (0.000 001 82) =0.001 348. Are we justified in making this assumption of randombreeding? The answer is probably yes. It is unlikely that AA and Aa individualsare aware of their condition relative <strong>to</strong> this gene locus, andso mating within this segment of the population is probably randomwith respect <strong>to</strong> Tay--Sachs. It is true that the homozygous recessiveindividuals cannot breed, but this is such a trivial proportion of thepopulation that it can safely be ignored.We can estimate the frequency of heterozygous individuals, whoare carriers of Tay--Sachs, using the formula 2pq. This gives us a frequencyof 0.002 693 or approximately 1 in 371 individuals in the population.It may surprise you that the number of carriers is so high consideringthat the incidence of the disease is so low (1 in 550 000). Thisreveals another interesting implication of the Hardy--Weinberg principle,which is that rare alleles exist mainly in heterozygous ratherthan homozygous individuals in the population. The ratio of recessivealleles in heterozygotes <strong>to</strong> those in homozygous recessives = pq/q 2 =p/q; butp is approximately 1 when q is very small, therefore p/q ≈1/q. In our example of Tay--Sachs, this approximation gives us a ratioof approximately 742 which is very similar <strong>to</strong> the more precisecalculation of 741 (calculated from pq/q 2 ).6.5 ComplicationsWe will briefly consider how the Hardy--Weinberg principle applies <strong>to</strong>situations other than au<strong>to</strong>somal genes with two alleles.6.5.1 Multiple allelesThe Hardy--Weinberg principle can easily be extended <strong>to</strong> include threeor more alleles at a gene locus. The number of possible genotypesincreases as the number of alleles increases. This is illustrated foran au<strong>to</strong>somal gene with three alleles, with frequencies of p, q and r(Fig. 6.3).It may be seen that there are six possible genotypes with the followingset of frequencies: A 1 A 1 = p 2 ,A 1 A 2 = 2pq, A 1 A 3 = 2pr, A 2 A 2 =q 2 ,A 2 A 3 = 2qr, andA 3 A 3 = r 2 . If the alleles are all codominant, thecalculation of the allelic and genotypic frequencies is straightforward,but if certain alleles are dominant <strong>to</strong> others it becomes more complicated<strong>to</strong> solve. For example, in the ABO blood group system, A and Bare codominant, but are dominant <strong>to</strong> O. Thus, if we set A = A 1 ,B=A 2 ,andO= A 3 , we can see from Fig. 6.3 that blood type A has a phenotypicfrequency of p 2 + 2pr, blood type Bafrequencyofq 2 + 2qr,blood type AB a frequency of 2pq, and blood type O a frequency of r 2 .Although we can estimate the frequency of the O allele as √ (r 2 ), wecannot estimate the frequencies of the A and B alleles directly, and
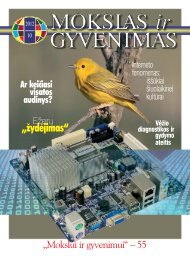
96 GENE FREQUENCIES: THE HARDY–WEINBERG PRINCIPLEFig. 6.3 The relationshipbetween the allelic frequencies (p,q and r) and the resulting genotypicfrequencies (A 1 A 1 ,A 1 A 2 ,A 1 A 3 ,etc.) when there is random matingbetween individuals carrying a genewith three alleles.A 1A 2pqA 1 A 1= p 2A 1 A 2= pqA A A 1 A 2= q 2 = qr= pq1 3= prA 2 A 2 A 2 A 3A 3rA 1 A 3= prA 2 A 3= qrA 3 A 3= r 2have <strong>to</strong> use a maximum likelihood procedure (see Hartl and Clark1989 for more details).6.5.2 Sex-linked genesIn the case of sex-linked genes, individuals of the heterogametic sexhave a single allele, whereas individuals of the homogametic sex havetwo alleles, the same as au<strong>to</strong>somal genes. Let us consider the situationwhere the heterogametic sex (XY) is male and the homogameticsex (XX) is female. If the allelic frequencies are the same in bothmales and females, the equilibrium genotypic frequencies are establishedin a single generation, like the au<strong>to</strong>somal genes. However, ifthe allelic frequencies are different between males and females, theallelic frequencies in the two sexes will undergo a series of dampedoscillations about the overall allelic frequency (i.e. of the two sexescombined), and the genotypic frequencies will also oscillate. To assessthe effects of this instability, let us consider an extreme examplewhere a population starts with an allelic frequency of q f = 1in the females and q m = 0 in the males. The allelic frequency inthe males in any subsequent generation will be the allelic frequencyof the females in the preceding generation, because all of their allelesare derived from those females. The allelic frequency in thefemales, however, will be the arithmetic average of q f and q m ofthe preceding generation, because half of their alleles are derivedfrom the males and half from the females from the previous generation.The result is a series of oscillations which rapidly dampenuntil the equilibrium frequency q = 0.67 is attained by both sexes(see Fig. 6.4). In most cases, however, the difference between the allelicfrequencies of the males and females would be much smallerthan this and would probably attain equilibrium within two or threegenerations.
COMPLICATIONS 97Allelic frequency (q)1.00.8Females0.60.4Males0.2Fig. 6.4 Random mating for asex-linked gene, showing theapproach <strong>to</strong> equilibrium of theallelic frequencies for each sex,when the starting allelic frequencyis1(= q f ) for females and0(= q m ) for males.0.01 2 3 4 5 6 7 8 9 10Generation6.5.3 Multiple lociThe Hardy--Weinberg principle can also be extended <strong>to</strong> deal simultaneouslywith more than one locus of genes. Similar <strong>to</strong> the situation withsex-linked genes, however, an equilibrium will not be reached in a singlegeneration if the genotypes are not in equilibrium. A simple examplewill make this clear. Imagine that we start a population with twogenotypes: A 1 A 1 B 1 B 1 and A 2 A 2 B 2 B 2 . In the next generation there willbe only three possible genotypes: A 1 A 1 B 1 B 1 ,A 1 A 2 B 1 B 2 and A 2 A 2 B 2 B 2in a 1 : 2 : 1 ratio. Thus, the genotypes A 1 A 1 B 2 B 2 ,A 2 A 2 B 1 B 1 ,etc.arenotproduced immediately, but they occur in subsequent generations ofrandom mating and the genotype frequencies converge <strong>to</strong> a stableequilibrium after about seven generations. However, if the loci arelinked, this reduces the amount of recombination between the twogenes and slows the approach <strong>to</strong> equilibrium. The tighter the linkagebetween two gene loci, the longer it takes <strong>to</strong> reach equilibrium.6.5.4 Non-random matingIf mating is non-random and the mating system is unrelated <strong>to</strong> theallelic frequencies being considered (i.e. one allele or another is notfavoured in the mating process), the allelic frequencies and genotyperatios will remain stable from generation <strong>to</strong> generation. However, theequilibrium genotypic frequencies will differ from those predicted bythe Hardy--Weinberg principle. In the case where like tend <strong>to</strong> breedwith like, called assortative mating, homozygotes have a higher frequency,and heterozygotes a lower frequency, than what would be predictedby the Hardy--Weinberg equilibrium. This type of mating doesnot lead <strong>to</strong> a change in allelic frequencies. If there is a preference fordifferent phenotypes <strong>to</strong> mate with each other, called disassortativemating, heterozygotes increase in the frequency at the expense of homozygotes.These facts are intuitively obvious. What is not obvious,
98 GENE FREQUENCIES: THE HARDY–WEINBERG PRINCIPLEhowever, is that disassortative mating leads <strong>to</strong> a change in allelic frequencies.Rarer alleles are favoured because the rarer phenotype hasa better chance of mating than the commoner phenotype; it is easierfor them <strong>to</strong> find a dissimilar mate. As a result, the frequency of therarer allele increases so that the allelic frequencies become similar.This has been observed in some plants with self-sterility mechanismsbased on multiple alleles, which coexist at approximately equal frequenciesin the population (see Falconer and Mackay 1996).6.6 Summary and conclusionsThe frequencies of the alleles, genotypes and phenotypes relating <strong>to</strong> aparticular trait, such as blood type or flower colour, are determined bycalculating their proportions in the <strong>to</strong>tal breeding population. Sexualreproduction does not usually lead <strong>to</strong> a change in these frequencies,provided the type of mating remains constant. When mating is random, thegenotypic frequencies have a characteristic relationship <strong>to</strong> the allelicfrequencies for au<strong>to</strong>somal genes, called the Hardy--Weinberg ratio, whichremains constant from generation <strong>to</strong> generation provided there are no otherforces operating on the system. Departures from the characteristicHardy--Weinberg ratio may indicate that mating is not random, or thatthere is some other fac<strong>to</strong>r such as selection that is changing the allelicfrequencies. The Hardy--Weinberg ratio or equilibrium is attained in a singlegeneration for a single au<strong>to</strong>somal gene, but may take several generations <strong>to</strong>attain if a trait is determined by more than one gene, or by a sex-linkedgene. There are two types of non-random mating. When like tend <strong>to</strong> breedwith like (assortative mating), the proportion of homozygotes is higher, andthe heterozygotes are lower, than that predicted by the Hardy--Weinbergequilibrium. When different phenotypes prefer <strong>to</strong> mate with each other(disassortative mating), the proportion of heterozygotes is higher than thatpredicted by the Hardy--Weinberg equilibrium, and this type of matingchanges the allelic frequencies until they are all similar <strong>to</strong> one another.6.7 Problems1. The rhesus (Rh) blood fac<strong>to</strong>r in humans is controlled by three tightlylinked genes with two basic categories of alleles: R, which produces anantigen on the surface of red blood cells, and r, which does not. The Rallele is dominant, and the RR and Rr genotypes are said <strong>to</strong> be rhesuspositive (Rh + ). The frequency of the R allele is 0.9 in a Caucasianpopulation. Assuming that mating is random with respect <strong>to</strong> this fac<strong>to</strong>r,(a) what is the frequency of heterozygous individuals in the population,and (b) what fraction of rhesus positive people are heterozygous?2. The following frequencies of M--N blood groups were collected on asample of 203 Guatemalan Indians (data from Mourant et al. 1976): MM112, MN 74, and NN 17. Calculate the expected Hardy--Weinbergequilibrium frequencies of these genotypes. Do they conform <strong>to</strong> what isobserved?
3. Spooner et al. (1973) studied the amylase locus in Friesian milk cows. Thegenotypic distribution of the milk herd was BB 86, BC 402 and CC 74. Isthe distribution of genotypes in Hardy--Weinberg equilibrium? How canyou account for these results given that the genotypic frequencies ofyoung calves conform <strong>to</strong> the Hardy--Weinberg equilibrium?4. The frequency of cystic fibrosis, an au<strong>to</strong>somal recessive condition causingsevere respira<strong>to</strong>ry problems, is approximately 1 in 2000 live births. Whatis the frequency of heterozygous carriers, assuming random mating?5. In the peppered moth (Bis<strong>to</strong>n betularia) there is a carbonaria allele(C) which codes for a dark body colour and which is dominant <strong>to</strong> thetypica allele (c) which codes for a light, speckled body colour. In onepopulation that was surveyed, 96% of the moths were dark coloured.Assuming random mating, what is the frequency of the carbonaria allelein the population?PROBLEMS 99