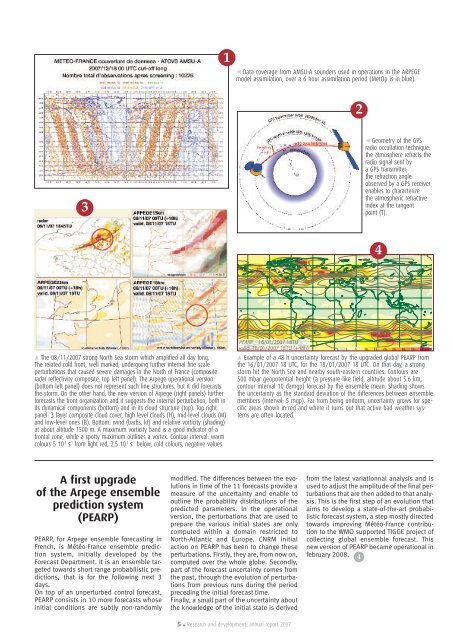
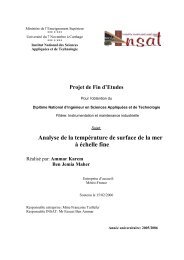
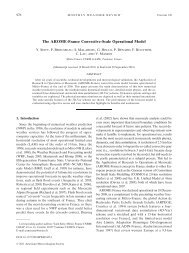
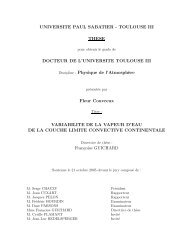
1 Data coverage from AMSU-A soun<strong>de</strong>rs used in operations in the ARPEGEmo<strong>de</strong>l assimilation, over a 6 hour assimilation period (MetOp is in blue).23 Geometry of the GPSradio occultation technique:the atmosphere refracts theradio signal sent bya GPS transmitter;the refraction angleobserved by a GPS receiverenables to characterizethe atmospheric refractivein<strong>de</strong>x at the tangentpoint (T).4 The 08/11/2007 strong North Sea storm which amplified all day long.The related cold front, well marked, un<strong>de</strong>rgoing further internal fine scaleperturbations that caused severe damages in the North of <strong>France</strong> (compositeradar reflectivity composite, top left panel). The Arpege operational version(bottom left panel) does not represent such fine structures, but it did forecaststhe storm. On the other hand, the new version of Arpege (right panels) furtherforecasts the front organization and it suggests the internal perturbation, both inits dynamical components (bottom) and in its cloud structure (top). Top rightpanel: 3 layer composite cloud cover, high level clouds (H), mid-level clouds (M)and low-level ones (B). Bottom: wind (barbs, kt) and relative vorticity (shading)at about altitu<strong>de</strong> 1500 m. A maximum vorticity band is a good indicator of afrontal zone, while a spotty maximum outlines a vortex. Contour interval: warmcolours 5 10 -5 s -1 from light red, 2,5 10 -5 s -1 below, cold colours, negative values.PEARP 16/01/2007 18TUvalid. 18/01/2007 18TU (+48h)1. 3. 5. 10. 15. 20. 25. 30. 35. 40.mgp Example of a 48 h uncertainty forecast by the upgra<strong>de</strong>d global PEARP fromthe 16/01/2007 18 UTC, for the 18/01/2007 18 UTC. On that day, a strongstorm hit the North Sea and nearby south-eastern countries. Contours are500 mbar geopotential height (a pressure-like field, altitu<strong>de</strong> about 5.6 km,contour interval 10 damgp) forecast by the ensemble mean. Shading showsthe uncertainty as the standard <strong>de</strong>viation of the differences between ensemblemembers (interval: 5 mgp). Far from being uniform, uncertainty grows for specificareas shown in red and where it turns out that active bad weather systemsare often located.A first upgra<strong>de</strong>of the Arpege ensembleprediction system(PEARP)PEARP, for Arpege ensemble forecasting inFrench, is Météo-<strong>France</strong> ensemble predictionsystem, initially <strong>de</strong>veloped by theForecast Department. It is an ensemble targetedtowards short range probabilistic predictions,that is for the following next 3days.On top of an unperturbed control forecast,PEARP consists in 10 more forecasts whoseinitial conditions are subtly non-randomlymodified. The differences between the evolutionsin time of the 11 forecasts provi<strong>de</strong> ameasure of the uncertainty and enable tooutline the probability distributions of thepredicted parameters. In the operationalversion, the perturbations that are used toprepare the various initial states are onlycomputed within a domain restricted toNorth-Atlantic and Europe. CNRM initialaction on PEARP has been to change theseperturbations. Firstly, they are, from now on,computed over the whole globe. Secondly,part of the forecast uncertainty comes fromthe past, through the evolution of perturbationsfrom previous runs during the periodpreceding the initial forecast time.Finally, a small part of the uncertainty aboutthe knowledge of the initial state is <strong>de</strong>rived5 . Research and <strong>de</strong>velopment: annual report 2007from the latest variationnal analysis and isused to adjust the amplitu<strong>de</strong> of the final perturbationsthat are then ad<strong>de</strong>d to that analysis.This is the first step of an evolution thataims to <strong>de</strong>velop a state-of-the-art probabilisticforecast system, a step mostly directedtowards improving Météo-<strong>France</strong> contributionto the WMO supported TIGGE project ofcollecting global ensemble forecast. Thisnew version of PEARP became operational infebruary 2008. 4
Estimation of forecasterrors with a smallensemble of forecastsand an optimized spatialfilteringAssimilation systems such as the Arpège,Aladin and Arome mo<strong>de</strong>ls enable to correctforecasts with observations. This is done byaccounting for forecast error statistics. To estimateforecast errors, an appealing approachis to simulate the time evolution of errors byusing an ensemble of perturbed assimilations.The i<strong>de</strong>a is to add perturbations whichsimulate uncertainties at play, and to makethem evolve through the analysis and forecaststeps.The ensemble size is a crucial factor toobtain an estimate which is both robust andnot too costly. However, using optimizedspatial filtering techniques allows the require<strong>de</strong>nsemble size to be reduced in or<strong>de</strong>r toreach a given accuracy (or vice versa toincrease the accuracy for a given ensemblesize). The i<strong>de</strong>a is to calculate a local spatialaverage of statistics, which allows the statisticalsample size to be strongly increased.These notions are illustrated in the figurewith four estimates of the error variance mapof vorticity near 500 hPa. Panel (a) correspondsto a reference, which indicates thatthe errors are larger over the Atlantic andPacific Oceans, and also in the SouthernHemisphere. Panel (b) is an estimate froman ensemble of 6 random realizations afteran optimized spatial filtering. The resultingestimate is more accurate than the raw estimationsfrom 6 or even 220 realisations(panels (c) and (d) respectively).An operational implementation of thesetechniques is consi<strong>de</strong>red for 2008, in or<strong>de</strong>rto <strong>de</strong>scribe the <strong>de</strong>pen<strong>de</strong>nce of errors on theongoing weather situation. 5Study of alternativeformulation forIFS/ARPEGE/ALADIN/AROMEdynamic kernelThe non-hydrostatic (NH) dynamical kernel ofour Numerical Weather Prediction tool is oneof the key elements of the new AROME system,currently un<strong>de</strong>r tests for a future operationaluse (the other elements being thephysics and the data assimilation). In parallelto this use at fine scales in small limited areadomains, other types of applications areconsi<strong>de</strong>red for the future. Work is un<strong>de</strong>rwaywith the ECMWF to see if the kernel is relevantto the global IFS mo<strong>de</strong>l in NH mo<strong>de</strong>. A cooperationwith the HIRLAM group is also in progressfor large limited-area domains.Such configurations <strong>de</strong>part significantly fromthe AROME one in many respects (geometry,inclusion of physics and algorithmic choices,...).Robust and accurate algorithms arerequired for a possible use of the NH dynamicalkernel for this wi<strong>de</strong> range of applications.For this, research mainly involved theincrease of the robustness for large timestepsthrough a revision of the discretisationof some non-linear terms, and the improvementof the intrinsic accuracy through theimplementation of a preliminary version withthe discretisation of vertical finite elements. Alonger-term work about the possible replacementof the prognostic NH variable set isun<strong>de</strong>rtaken with the aim of a more naturalinclusion of finite elements. 610 m winddata assimilationinsi<strong>de</strong> ALADIN10 m wind observations assimilation is arather tricky/difficult task. As a matter of fact,wind near the ground <strong>de</strong>pends a lot on smallscale orography that can be quite differentfrom large scale mo<strong>de</strong>l orography. Besi<strong>de</strong>s,data are also influenced by small scaleground parameters such as vegetation type,height. At last, a wind measurement in mountainousareas can represent a phenomenumthat has a time limitation is limited in timeand is of little importance for large scales.However, for limited area mo<strong>de</strong>ls whose surfacecharacteristics are closer to reality,these observations can bring useful informationto a data assimilation system. Becauseof the high temporal and spatial cover(cf figure a); we tried to test their impactinsi<strong>de</strong> the limited area mo<strong>de</strong>l ALADIN. Forthat, first we selected stations, which presented,over the test period (4 month), astrong correlation with values forecasted bythe ALADIN mo<strong>de</strong>l.The main impact of these observations islocated insi<strong>de</strong> the atmospheric boundarylayer as shown in figure b, the vertical crosssection shows that the impact is importantbelow mo<strong>de</strong>l level 35, that is to say at 1.5 km.The only relevant improvement of 10 m windobservations is the reduction of the groundpressure bias insi<strong>de</strong> ALADIN, which is a knownflaw of that mo<strong>de</strong>l. That effect is possiblethanks to the correlation of the mo<strong>de</strong>l errorsbetween surface pressure and wind. 76 . Research and <strong>de</strong>velopment: annual report 2007