Cartographic design and the quality of climate change maps
Cartographic design and the quality of climate change maps
Cartographic design and the quality of climate change maps

You also want an ePaper? Increase the reach of your titles
YUMPU automatically turns print PDFs into web optimized ePapers that Google loves.
Climatic Change (2009) 95:219–230<br />
DOI 10.1007/s10584-008-9519-5<br />
<strong>Cartographic</strong> <strong>design</strong> <strong>and</strong> <strong>the</strong> <strong>quality</strong><br />
<strong>of</strong> <strong>climate</strong> <strong>change</strong> <strong>maps</strong><br />
Jean E. McKendry · Gary E. Machlis<br />
Received: 13 February 2008 / Accepted: 22 September 2008 / Published online: 21 November 2008<br />
© Springer Science + Business Media B.V. 2008<br />
Abstract Maps are essential in <strong>climate</strong> <strong>change</strong> research <strong>and</strong> policymaking, <strong>and</strong> are<br />
primary tools for communicating <strong>climate</strong> <strong>change</strong> information to <strong>the</strong> public. The<br />
consequences <strong>of</strong> cartographic <strong>design</strong> are potentially significant to underst<strong>and</strong>ing<br />
<strong>climate</strong> <strong>change</strong> <strong>and</strong> effectively informing policymakers. Yet, <strong>the</strong> cartographic<br />
<strong>design</strong> <strong>and</strong> <strong>quality</strong> <strong>of</strong> <strong>climate</strong> <strong>change</strong> <strong>maps</strong> have not been critically assessed nor<br />
systematically evaluated. We suggest that evaluating <strong>the</strong> <strong>quality</strong> <strong>of</strong> <strong>climate</strong> <strong>change</strong><br />
<strong>maps</strong> is both timely <strong>and</strong> essential, <strong>and</strong> <strong>of</strong>fer one approach as a demonstration. We use<br />
cartographic <strong>design</strong> principles to evaluate a ‘high visibility’ <strong>climate</strong> <strong>change</strong> map from<br />
<strong>the</strong> 2007 report <strong>of</strong> <strong>the</strong> Intergovernmental Panel on Climate Change. Our specific<br />
goals are to demonstrate <strong>the</strong> need <strong>and</strong> value <strong>of</strong> cartographic critique, describe how<br />
such evaluation can be accomplished, <strong>and</strong> make a case for cartographers’ engagement<br />
with <strong>climate</strong> <strong>change</strong> scientists in mapping activities. We suggest a research <strong>and</strong><br />
policy agenda for <strong>the</strong> cartographic evaluation <strong>and</strong> <strong>design</strong> <strong>of</strong> <strong>climate</strong> <strong>change</strong> <strong>maps</strong>.<br />
1 Introduction<br />
Maps are essential to <strong>climate</strong> <strong>change</strong> research <strong>and</strong> policymaking, <strong>and</strong> <strong>the</strong>ir use is<br />
substantial: Working Group I <strong>of</strong> <strong>the</strong> Intergovernmental Panel on Climate Change<br />
(IPCC) included over 130 <strong>maps</strong> in its 2007 report (IPCC 2007a). Climate <strong>change</strong><br />
<strong>maps</strong> are used by <strong>the</strong> scientific community to display results <strong>of</strong> general circulation<br />
models (GCMs), projected sea level rise, temperature <strong>change</strong>, migration <strong>of</strong> flora <strong>and</strong><br />
fauna habitat ranges, <strong>and</strong> more. Policymakers use <strong>climate</strong> <strong>change</strong> <strong>maps</strong> to compare<br />
J. E. McKendry · G. E. Machlis<br />
College <strong>of</strong> Natural Resources, University <strong>of</strong> Idaho,<br />
Moscow, ID 83844-1133, USA<br />
J. E. McKendry (B)<br />
c/o AAAS, 1200 New York Avenue, NW (Room 637),<br />
Washington, DC 20005, USA<br />
e-mail: jeanm@uidaho.edu
220 Climatic Change (2009) 95:219–230<br />
costs/benefits <strong>of</strong> adaptive responses, analyze policy options, <strong>and</strong> develop mitigation<br />
plans. Maps are also primary tools for communicating <strong>climate</strong> <strong>change</strong> information to<br />
<strong>the</strong> public.<br />
Hence, an important question arises for <strong>the</strong> producers <strong>and</strong> users <strong>of</strong> <strong>climate</strong> <strong>change</strong><br />
<strong>maps</strong>: what is <strong>the</strong> <strong>quality</strong> <strong>of</strong> cartographic <strong>design</strong> used in <strong>climate</strong> <strong>change</strong> <strong>maps</strong>? Here<br />
‘<strong>quality</strong>’ refers not to <strong>the</strong> accuracy or reliability <strong>of</strong> <strong>the</strong> underlying data but to how<br />
data are cartographically displayed. The question is relevant because: (1) <strong>maps</strong>, including<br />
<strong>climate</strong> <strong>change</strong> <strong>maps</strong>, are increasingly made by individuals not trained in map<br />
<strong>design</strong>, (2) poor map <strong>design</strong> can hinder effective data analysis, underst<strong>and</strong>ing, <strong>and</strong><br />
decision-making, <strong>and</strong> (3) poorly <strong>design</strong>ed <strong>maps</strong> can distort information <strong>and</strong> mislead<br />
users (see Lilley 2007; Cassettari 2007; Carter2004; McKendry 2000; Monmonier<br />
1996).<br />
Mapmaking <strong>and</strong> cartography have been transformed by technology (see Arikawa<br />
et al. 2007; Gartner et al. 2007; Monmonier 2007; Butler2006; Taylor <strong>and</strong> Caquard<br />
2006). These technological developments have made it easier to produce <strong>maps</strong>.<br />
Geographic Information Systems (GIS), remote sensing, Global Positioning Systems<br />
(GPS), interactive web mapping (including ‘mashups’), inexpensive computing<br />
platforms, <strong>and</strong> plentiful data <strong>and</strong> data delivery options have made mapmaking<br />
a commonplace activity beyond <strong>the</strong> realm <strong>of</strong> <strong>the</strong> trained cartographer. Today’s<br />
mapmakers <strong>of</strong>ten do not have specialized education or training in <strong>the</strong> principles <strong>of</strong><br />
cartographic <strong>design</strong>. As a result, <strong>maps</strong> made by non-cartographers vary in <strong>quality</strong><br />
(as do <strong>maps</strong> by cartographers, <strong>of</strong> course), <strong>and</strong> are <strong>of</strong>ten poorly <strong>design</strong>ed (Cassettari<br />
2007;Plewe2007; Monmonier 2006; Field 2005;Wood<strong>and</strong>Keller1996).<br />
The consequences <strong>of</strong> poor <strong>quality</strong> map <strong>design</strong> can be significant. Maps have <strong>the</strong><br />
power to inform or misinform, lead or mislead, clarifyorconfuse through <strong>the</strong> use<br />
or misuse <strong>of</strong> <strong>design</strong> principles (Lilley 2007;Carter2004; McKendry 2000; Buttenfield<br />
1996; Monmonier 1995; Buttenfield <strong>and</strong> Beard 1991; Petchenik 1983). For example,<br />
Tufte (1990, 1983) analyzes a broad range <strong>of</strong> information graphics (including charts,<br />
diagrams, graphs, tables, <strong>and</strong> <strong>maps</strong>) <strong>and</strong> documents <strong>the</strong> prevalence <strong>of</strong> ‘graphic<br />
mediocrity’ (due to lack <strong>of</strong> skill). Importantly, he describes how <strong>the</strong> <strong>quality</strong> <strong>of</strong> graphic<br />
<strong>design</strong> can directly impact decision-making by revealing or obscuring information<br />
(Tufte 1997).<br />
Given <strong>the</strong> urgent challenges created by <strong>climate</strong> <strong>change</strong> <strong>and</strong> <strong>the</strong> importance <strong>of</strong><br />
<strong>maps</strong> in <strong>climate</strong> <strong>change</strong> research <strong>and</strong> policymaking, <strong>the</strong> role <strong>of</strong> map <strong>design</strong> deserves<br />
attention. Surprisingly, <strong>the</strong> cartographic <strong>design</strong> <strong>and</strong> <strong>quality</strong> <strong>of</strong> <strong>climate</strong> <strong>change</strong> <strong>maps</strong><br />
have not been critically assessed nor systematically evaluated.<br />
We suggest that evaluating <strong>the</strong> <strong>quality</strong> <strong>of</strong> <strong>climate</strong> <strong>change</strong> <strong>maps</strong> is both timely<br />
<strong>and</strong> essential. We <strong>of</strong>fer one approach as a demonstration. First, we select a ‘high<br />
visibility’ <strong>climate</strong> <strong>change</strong> map to evaluate, in this case a map used in <strong>the</strong> “Summary<br />
for Policymakers” report issued by Working Group II <strong>of</strong> <strong>the</strong> IPCC (IPCC 2007b).<br />
We <strong>the</strong>n present a brief overview <strong>of</strong> selected cartographic <strong>design</strong> principles that<br />
can be used to evaluate this <strong>and</strong> o<strong>the</strong>r <strong>climate</strong> <strong>change</strong> <strong>maps</strong>. This overview is not<br />
a comprehensive ‘primer’ on cartographic <strong>design</strong>; <strong>the</strong>re are many resources available<br />
to introduce cartographic <strong>design</strong> (see Section 3 below). The purpose <strong>of</strong> this overview<br />
is to provide specific examples <strong>of</strong> agreed-upon <strong>design</strong> principles established through<br />
cartographic research. Next, we systematically apply <strong>the</strong>se cartographic principles<br />
to <strong>the</strong> selected <strong>climate</strong> <strong>change</strong> map <strong>and</strong> report <strong>the</strong> results. We conclude with a<br />
proposed research <strong>and</strong> policy agenda for <strong>the</strong> systematic cartographic evaluation <strong>of</strong>
Climatic Change (2009) 95:219–230 221<br />
<strong>climate</strong> <strong>change</strong> <strong>maps</strong>. We acknowledge that this small case study approach is limited.<br />
However, our specific goals are to demonstrate <strong>the</strong> need <strong>and</strong> value <strong>of</strong> cartographic<br />
critique, describe how such evaluation can be accomplished, <strong>and</strong> make a case for<br />
cartographers’ engagement with <strong>climate</strong> <strong>change</strong> scientists in mapping activities.<br />
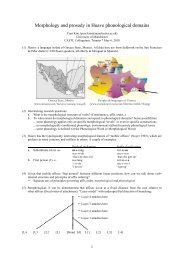
Figure SPM.1. Locations <strong>of</strong> significant <strong>change</strong>s in data series <strong>of</strong> physical systems (snow, ice <strong>and</strong> frozen ground; hydrology; <strong>and</strong> coastal processes) <strong>and</strong><br />
biological systems (terrestrial, marine, <strong>and</strong> freshwater biological systems), are shown toge<strong>the</strong>r with surface air temperature <strong>change</strong>s over <strong>the</strong> period 1970-2004.<br />
A subset <strong>of</strong> about 29,000 data series was selected from about 80,000 data series from 577 studies. These met <strong>the</strong> following criteria: (1) ending in 1990 or later;<br />
(2) spanning a period <strong>of</strong> at least 20 years; <strong>and</strong> (3) showing a significant <strong>change</strong> in ei<strong>the</strong>r direction, as assessed in individual studies. These data series are from<br />
about 75 studies (<strong>of</strong> which about 70 are new since <strong>the</strong> Third Assessment) <strong>and</strong> contain about 29,000 data series, <strong>of</strong> which about 28,000 are from European<br />
studies.White areas do not contain sufficient observational <strong>climate</strong> data to estimate a temperature trend. The 2 x 2 boxes show <strong>the</strong> total number <strong>of</strong> data series<br />
with significant <strong>change</strong>s (top row) <strong>and</strong> <strong>the</strong> percentage <strong>of</strong> those consistent with warming (bottom row) for (i) continental regions: North America (NAM), Latin<br />
America (LA), Europe (EUR), Africa (AFR), Asia (AS), Australia <strong>and</strong> New Zeal<strong>and</strong> (ANZ), <strong>and</strong> Polar Regions (PR) <strong>and</strong> (ii) global-scale: Terrestrial (TER), Marine<br />
<strong>and</strong> Freshwater (MFW), <strong>and</strong> Global (GLO). The numbers <strong>of</strong> studies from <strong>the</strong> seven regional boxes (NAM, …, PR) do not add up to <strong>the</strong> global (GLO) totals<br />
because numbers from regions except Polar do not include <strong>the</strong> numbers related to Marine <strong>and</strong> Freshwater (MFW) systems. Locations <strong>of</strong> large-area marine<br />
<strong>change</strong>s are not shown on <strong>the</strong> map. [Working Group II Fourth Assessment F1.8, F1.9; Working Group I Fourth Assessment F3.9b].<br />
Fig. 1 Map, legend, <strong>and</strong> caption <strong>of</strong> Figure SPM.1., reprinted from IPCC Working Group II<br />
“Summary for Policymakers” (2007b, p. 10), used with permission
222 Climatic Change (2009) 95:219–230<br />
2 Selecting a <strong>climate</strong> <strong>change</strong> map to evaluate<br />
A <strong>climate</strong> <strong>change</strong> map from a recent report <strong>of</strong> <strong>the</strong> IPCC was selected to demonstrate<br />
how <strong>climate</strong> <strong>change</strong> <strong>maps</strong> can be cartographically evaluated. Selecting an IPCC<br />
map is appropriate for several reasons. Since 1988, <strong>the</strong> IPCC has released four<br />
comprehensive scientific assessments <strong>of</strong> <strong>climate</strong> <strong>change</strong>. IPCC reports are considered<br />
by policymakers <strong>and</strong> <strong>the</strong> scientific community to be a definitive source <strong>of</strong> information<br />
on <strong>climate</strong> <strong>change</strong> <strong>and</strong> its impacts (Kintisch <strong>and</strong> Kerr 2007).<br />
The map shown in Fig. 1 was published in <strong>the</strong> “Summary for Policymakers”<br />
completed by Working Group II for Climate Change 2007: Impacts, Adaptation <strong>and</strong><br />
Vulnerability. Contribution <strong>of</strong> Working Group II to <strong>the</strong> Fourth Assessment Report <strong>of</strong><br />
<strong>the</strong> Intergovernmental Panel on Climate Change (IPCC 2007b, p.10).Thetitle<strong>of</strong><strong>the</strong><br />
map is “Changes in physical <strong>and</strong> biological systems <strong>and</strong> surface temperature 1970–<br />
2004.” Figure 1 is <strong>the</strong> only map included in this summary report for policymakers.<br />
We consider this map appropriate for a case example given that: (1) <strong>the</strong> IPCC is a<br />
legitimated source <strong>of</strong> <strong>climate</strong> <strong>change</strong> information, (2) <strong>the</strong> IPCC’s fourth assessment<br />
report (AR4) is a major consensus technical effort to summarize current <strong>climate</strong><br />
<strong>change</strong> knowledge, (3) <strong>the</strong> policy summary is an important st<strong>and</strong>-alone document,<br />
<strong>and</strong> (4) Fig. 1 is <strong>the</strong> sole map in <strong>the</strong> policy summary approved by Working Group II.<br />
The map published in <strong>the</strong> report is 184 mm wide by 194 mm tall, accompanied by<br />
a caption 184 mm wide by 41 mm tall, <strong>and</strong> printed in color on a page 215 mm wide<br />
by 279 mm tall. The map was also made available as a separate color graphic (though<br />
without its title or caption) on <strong>the</strong> IPCC website (IPCC 2007b). Since its original<br />
publication, <strong>the</strong> map has been distributed through o<strong>the</strong>r reports <strong>of</strong> <strong>the</strong> IPCC <strong>and</strong> in<br />
<strong>the</strong> public media in both its original <strong>and</strong> modified form.<br />
The map appears in <strong>the</strong> draft copy <strong>of</strong> <strong>the</strong> “Summary for Policymakers <strong>of</strong> <strong>the</strong><br />
Syn<strong>the</strong>sis Report <strong>of</strong> <strong>the</strong> IPCC Fourth Assessment Report”—<strong>the</strong> overall summary <strong>of</strong><br />
<strong>the</strong> IPCC’s work (IPCC 2007c). It was published in modified form in <strong>the</strong> Washington<br />
Post (print <strong>and</strong> online) on 18 November 2007, page A10 with <strong>the</strong> caption excluded,<br />
title <strong>change</strong>d, <strong>and</strong> legend edited <strong>and</strong> rearranged (Struck 2007). The map was adapted<br />
<strong>and</strong> split into two separate <strong>maps</strong> by <strong>the</strong> Organization <strong>of</strong> Ibero-American States<br />
(Organización de Estados Iberoamericanos 2007). The resulting two <strong>maps</strong> were<br />
posted on <strong>the</strong> organization’s website with substantial <strong>change</strong>s made to <strong>the</strong> legend<br />
(see http://www.oei.es/decada/presentacioneurop.htm).<br />
The color version <strong>of</strong> <strong>the</strong> map published in <strong>the</strong> final summary report <strong>of</strong> Working<br />
Group II <strong>and</strong> shown in Fig. 1 is evaluated in this demonstration, downloaded from<br />
<strong>the</strong> IPCC website 21 November 2007 (IPCC 2007b, p. 10).<br />
3 Selected principles <strong>of</strong> cartography to use in evaluating <strong>climate</strong> <strong>change</strong> <strong>maps</strong><br />
Research <strong>and</strong> practice in <strong>the</strong> field <strong>of</strong> cartography have produced a set <strong>of</strong> fundamental<br />
principles that are essential to good cartographic <strong>design</strong>—principles that deal with<br />
map layout <strong>and</strong> symbolizing data <strong>and</strong> features. <strong>Cartographic</strong> <strong>design</strong> principles guide<br />
decisions about how to represent locations on a map <strong>and</strong> attributes <strong>of</strong> those locations,<br />
using graphic symbols such as color, size, shape, typography, <strong>and</strong> o<strong>the</strong>r symbols.<br />
Principles describe how points, lines, <strong>and</strong> areas should be symbolized based on<br />
<strong>the</strong> underlying data (i.e., attributes <strong>of</strong> features). For example, <strong>the</strong> selection <strong>of</strong>
Climatic Change (2009) 95:219–230 223<br />
Table 1 Selected principles for cartographic <strong>design</strong> <strong>and</strong> layout with descriptions (adapted from Brewer 2005 <strong>and</strong> Krygier <strong>and</strong> Wood 2005)<br />
<strong>Cartographic</strong> principle Description <strong>of</strong> cartographic principle<br />
Map projection All map projections have distortions (distance, area, direction, <strong>and</strong>/or shape). An equal-area map projection is a good selection for most<br />
small-scale <strong>maps</strong> (e.g., many world <strong>maps</strong>) <strong>and</strong> should be used for <strong>maps</strong> showing data distributions.<br />
Generalization Small-scale <strong>maps</strong> should show more area, less detail, <strong>and</strong> more generalization <strong>of</strong> features. Large-scale <strong>maps</strong> should show less area, more<br />
detail, <strong>and</strong> less generalization <strong>of</strong> features. The coastline <strong>of</strong> a country on a large-scale map is symbolized by a line with more detailed<br />
curves than <strong>the</strong> same coastline on a small-scale map.<br />
Data classification Qualitative data show differences in kind (e.g., forest versus urban l<strong>and</strong> cover). Qualitative data should be grouped so that features in<br />
<strong>the</strong> same group are more similar than dissimilar <strong>and</strong> features in different groups are more dissimilar than similar.<br />
Quantitative data show differences in amount (e.g., population density). Quantitative data should be grouped by specific external<br />
criteria (e.g., quantiles) or by <strong>the</strong> characteristics <strong>of</strong> <strong>the</strong> data (e.g., natural breaks).<br />
Map layouta Focus Map layout should guide readers through <strong>the</strong> map elements <strong>and</strong> help <strong>the</strong>m focus on <strong>the</strong> most important parts <strong>of</strong> <strong>the</strong> map.<br />
Visual variablesb Color hue Color hue (such as red, green, blue) should be used to categorize features that are qualitatively different, such as a river <strong>and</strong> a road.<br />
Color value Color value (or lightness <strong>of</strong> hue) should be used to represent quantitatively different data (ei<strong>the</strong>r rank-ordered data or numerical<br />
amounts), such as population density. Value is typically light for low numbers (e.g., light green) <strong>and</strong> dark for high numbers (e.g., dark<br />
green) in sequential datasets, such as a dataset <strong>of</strong> population <strong>change</strong> from 0% to 100%. For diverging data sets with an important<br />
midpoint (between negative <strong>and</strong> positive values), such as population <strong>change</strong> from −50% to +50%, hue <strong>and</strong> value can vary to show <strong>the</strong><br />
two directions in <strong>the</strong> data set. The midpoint from 0% to −50% can be symbolized using a light to dark color hue. The midpoint from<br />
0% to +50% can be symbolized using a different, complementary light to dark color hue.<br />
Color saturation Color saturation (or intensity <strong>of</strong> hue, such as bright red compared with a dull, gray red) can be used for qualitative or quantitative data.<br />
It is difficult to use on its own to symbolize data. Saturation is typically used to reinforce <strong>change</strong>s in value for quantitative data or to<br />
reinforce <strong>change</strong>s in hue for small areas on a map that are qualitatively different.<br />
Size Size should be used to represent quantitatively different data (ei<strong>the</strong>r rank-ordered data or numerical amounts). A larger square<br />
signifies a greater quantity than a smaller square.<br />
Shape Shape should be used to categorize features that are qualitatively different. A square is not more or less than a circle,<br />
but is different in kind.<br />
Visual hierarchy Visual hierarchy should emphasize <strong>the</strong> most important map elements. Less important elements should be less noticeable. Visual hierarchy<br />
should clearly communicate <strong>the</strong> intellectual hierarchy <strong>and</strong> purpose(s) <strong>of</strong> <strong>the</strong> map.<br />
aFor Krygier <strong>and</strong> Wood (2005) ‘focus’ is one element <strong>of</strong> map layout that also includes map pieces (title, legend, border, etc.), balance (stability), <strong>and</strong> <strong>the</strong> grid<br />
(underlying grid <strong>of</strong> vertical <strong>and</strong> horizontal lines that helps with balance).<br />
bBertin (1981) initially described seven visual variables. Cartographers have adapted <strong>and</strong> modified this list. Five visual variables are presented here.
224 Climatic Change (2009) 95:219–230<br />
appropriate color schemes is determined by whe<strong>the</strong>r <strong>the</strong> attributes are qualitative<br />
(use different colors to symbolize different ecotypes) or quantitative (use <strong>the</strong> same<br />
color with variation from light to dark to symbolize <strong>change</strong>s in temperature over<br />
time). <strong>Cartographic</strong> principles guide decisions about how to group (‘classify’) data<br />
for representation. For example, a map showing temperature ranges may have<br />
temperature data assigned to groups using equal intervals (same data range for<br />
each class) or quantiles (same number <strong>of</strong> data points in each class). <strong>Cartographic</strong><br />
principles guide decisions about how to arrange all <strong>the</strong> graphic symbols included on<br />
a map so that <strong>the</strong>re is clarity in <strong>the</strong> overall <strong>design</strong> <strong>and</strong> layout. Numerous texts review<br />
<strong>and</strong> explain cartographic principles (see, for example, Slocum et al. 2005; Kimerling<br />
et al. 2001; Dent1999; Robinson et al. 1995; MacEachren1994; Monmonier 1993).<br />
There is strong consensus within <strong>the</strong> cartographic community about basic principles.<br />
Contemporary map <strong>design</strong> also dem<strong>and</strong>s underst<strong>and</strong>ing <strong>the</strong> constraints <strong>and</strong> opportunities<br />
determined by <strong>the</strong> media on which a map will be reproduced. For<br />
example, <strong>maps</strong> <strong>design</strong>ed for digital display are limited by screen resolution compared<br />
with <strong>maps</strong> <strong>design</strong>ed for printing on paper, <strong>and</strong> ‘endless zoom’ options carry with <strong>the</strong>m<br />
unique problems <strong>of</strong> data accuracy <strong>and</strong> cartographic <strong>design</strong> (see Lobben <strong>and</strong> Patton<br />
2003, for a comparison <strong>of</strong> <strong>design</strong> issues for digital <strong>and</strong> printed <strong>maps</strong>).<br />
Table 2 Selected introductory resources on cartographic <strong>design</strong><br />
Books (full citations are listed under references)<br />
Cynthia Brewer, Designing Better Maps: A Guide for GIS Users<br />
Borden Dent, Cartography: Thematic Map Design, 5th edition<br />
Jon Kimerling, Philip Muehrcke, <strong>and</strong> Juliana Muehrcke, Map Use: Reading, Analysis, <strong>and</strong><br />
Interpretation, 5th edition<br />
John Krygier <strong>and</strong> Denis Wood, Making Maps: A Visual Guide to Map Design for GIS<br />
Alan MacEachren, Some Truth with Maps: A Primer on Symbolization <strong>and</strong> Design<br />
Mark Monmonier, How to Lie with Maps, 2nd edition<br />
Terry Slocum, Robert McMaster, Fritz Kessler, <strong>and</strong> Hugh Howard, Thematic Cartography<br />
<strong>and</strong> Geographic Visualization, 2nd edition<br />
Journals<br />
<strong>Cartographic</strong> Perspectives (Journal <strong>of</strong> <strong>the</strong> North American <strong>Cartographic</strong> Information Society;<br />
http://www.nacis.org)<br />
Cartography <strong>and</strong> Geographic Information Science (Journal <strong>of</strong> <strong>the</strong> Cartography <strong>and</strong> Geographic<br />
Information Society; http://www.cartogis.org)<br />
<strong>Cartographic</strong>a (Journal <strong>of</strong> <strong>the</strong> Canadian <strong>Cartographic</strong> Association; http://www.cca-acc.org/)<br />
The <strong>Cartographic</strong> Journal (Journal <strong>of</strong> <strong>the</strong> British <strong>Cartographic</strong> Society;<br />
http://www.cartography.org.uk/)<br />
Websites<br />
http://www.colorbrewer.org<br />
(an interactive online tool <strong>design</strong>ed to assist in selecting good color schemes for <strong>maps</strong> <strong>and</strong><br />
o<strong>the</strong>r graphics)<br />
http://www.typebrewer.org/<br />
(an online tool <strong>design</strong>ed for people who want to learn more about map typography)<br />
http://www.progonos.com/furuti/MapProj/Normal/CartProp/cartProp.html<br />
(an introduction to map projections, with examples <strong>of</strong> distortions, <strong>and</strong> a discussion <strong>of</strong> matching<br />
projection to a map’s purpose)<br />
http://mappingcenter.esri.com/<br />
(a website that focuses on cartographic resources, examples, <strong>and</strong> assistance for users <strong>of</strong> ArcGIS)
Climatic Change (2009) 95:219–230 225<br />
Table 1 includes selected cartographic principles adapted from two recent books<br />
that focus on map <strong>design</strong> (Brewer 2005; Krygier <strong>and</strong> Wood 2005). Specifically,<br />
Table 1 describes principles concerning map projections, generalization, data classification,<br />
map layout, visual variables (such as color), visual hierarchy (important<br />
information is visually prominent in <strong>the</strong> map’s <strong>design</strong>), <strong>and</strong> more. The sources were<br />
selected because <strong>the</strong>ir focus is on teaching GIS users how to make better <strong>maps</strong>, <strong>and</strong><br />
can introduce non-cartographers to <strong>the</strong> basics <strong>of</strong> good map <strong>design</strong>.<br />
The list <strong>of</strong> principles, though not exhaustive, deals with common <strong>design</strong> issues<br />
encountered in mapping. For example, all <strong>maps</strong> displayed in two dimensions require<br />
ma<strong>the</strong>matical transformation <strong>of</strong> spherical coordinates to plane coordinates through<br />
<strong>the</strong> use <strong>of</strong> a map projection. All map projections have distortions <strong>of</strong> distance, area,<br />
direction, <strong>and</strong>/or shape. Such distortions are particularly noticeable on small-scale<br />
<strong>maps</strong>, such as <strong>maps</strong> <strong>of</strong> <strong>the</strong> world. A map projection that preserves relative areas<br />
should be used for <strong>maps</strong> showing data distributions. While <strong>the</strong>se principles are basic<br />
<strong>and</strong> straightforward, <strong>the</strong>ir application in <strong>the</strong> overall <strong>design</strong> <strong>and</strong> layout <strong>of</strong> a map is<br />
<strong>of</strong>ten complex <strong>and</strong> challenging, can involve <strong>design</strong> trade<strong>of</strong>fs, <strong>and</strong> is a requirement<br />
for high <strong>quality</strong> map <strong>design</strong>.<br />
For <strong>climate</strong> <strong>change</strong> scientists interested in learning more about cartographic<br />
<strong>design</strong>, Table 2 provides a list <strong>of</strong> selected resources that include numerous examples<br />
<strong>of</strong> good <strong>and</strong> poor map <strong>design</strong>.<br />
4 Evaluating <strong>the</strong> IPCC <strong>climate</strong> <strong>change</strong> map: an example approach<br />
Figure 1 from <strong>the</strong> IPCC Working Group II summary report for policymakers<br />
can be evaluated using <strong>the</strong> selected principles in Table 1. Each principle can be<br />
systematically applied to <strong>the</strong> map with <strong>the</strong> result rated as good, satisfactory, orpoor<br />
followed by a brief explanation. We applied this method to <strong>the</strong> IPCC map shown in<br />
Fig. 1.<br />
Table 3 includes <strong>the</strong> rating <strong>of</strong> <strong>the</strong> map for each selected principle with its<br />
explanation. Our preliminary <strong>and</strong> limited evaluation indicates that <strong>the</strong> map published<br />
in <strong>the</strong> summary report <strong>of</strong> Working Group II for policymakers ranges from poor to<br />
satisfactory in its use <strong>of</strong> selected cartographic principles. For example, we rated map<br />
layout <strong>and</strong> focus as poor. The map legend is complex <strong>and</strong> includes data not even<br />
displayed on <strong>the</strong> map, i.e., <strong>the</strong> number <strong>and</strong> percentage <strong>of</strong> significant <strong>change</strong>s in <strong>the</strong><br />
series <strong>of</strong> four-celled tables with arrows. The legend is also <strong>the</strong> same size as <strong>the</strong> map,<br />
<strong>and</strong> <strong>the</strong>y visually compete with each o<strong>the</strong>r for importance on <strong>the</strong> page. Information<br />
about <strong>the</strong> white areas on <strong>the</strong> map is included in <strong>the</strong> caption but not in <strong>the</strong> map legend.<br />
Meaningful relationships between <strong>change</strong>s in physical <strong>and</strong> biological systems <strong>and</strong><br />
<strong>change</strong>s in surface temperature are difficult to see.<br />
We rated <strong>the</strong> generalization <strong>of</strong> features on <strong>the</strong> map as satisfactory. The map shows<br />
coastlines <strong>and</strong> boundaries between nations. The black linework to symbolize coastlines<br />
<strong>and</strong> boundaries is more detailed than needed for <strong>the</strong> scale <strong>of</strong> this map. The high<br />
level <strong>of</strong> detail for <strong>the</strong> sou<strong>the</strong>rn tip <strong>of</strong> Chile means that <strong>the</strong> black boundaries blend in<br />
with <strong>the</strong> point locations (blue circles with black outlines). Table 3 summarizes results<br />
for each <strong>of</strong> <strong>the</strong> selected cartographic principles.<br />
Overall, our evaluation is that <strong>the</strong> map does not clearly <strong>and</strong> effectively display<br />
information about its intended topic, “<strong>change</strong>s in physical <strong>and</strong> biological systems <strong>and</strong>
226 Climatic Change (2009) 95:219–230<br />
Table 3 Results <strong>of</strong> evaluating map from IPCC working group II summary report using selected principles for cartographic <strong>design</strong> <strong>and</strong> layout<br />
<strong>Cartographic</strong> principle Rating Explanation<br />
Map projection Poor The map shows temperature <strong>and</strong> o<strong>the</strong>r statistical information. The projection should be equal-area. Instead, it is a<br />
cylindrical equidistant projection. Area is distorted as well as shape. The colored squares on <strong>the</strong> map are equal in size,<br />
but <strong>the</strong>y do not represent <strong>the</strong> same area on <strong>the</strong> earth.<br />
Generalization Satisfactory The map shows coastlines <strong>and</strong> boundaries <strong>of</strong> nations. The generalization <strong>of</strong> areas (nothing smaller than a country) is<br />
appropriate. Linework to symbolize <strong>the</strong> coastlines <strong>and</strong> boundaries is too detailed for <strong>the</strong> scale <strong>and</strong> purpose <strong>of</strong> <strong>the</strong> map.<br />
Argentina, Chile, Antarctica, <strong>and</strong> Sou<strong>the</strong>ast Asia are examples where too much detail interferes with <strong>the</strong> areas<br />
<strong>and</strong> data being shown.<br />
Data classification Satisfactory The map displays quantitative <strong>and</strong> qualitative data that are classified. The observation locations for physical systems are<br />
combined into a single group. Observation locations for biological systems are combined into a single group. They are<br />
symbolized as qualitatively different groups using different color hues.<br />
The data on temperature range are classified into five groups, low to high. It is unknown how <strong>the</strong> class breaks were<br />
established. The reader can only determine that <strong>the</strong> data ranges for <strong>the</strong> classes are not equal in size. It is unclear in <strong>the</strong><br />
legend where class breaks begin <strong>and</strong> end as a single value is assigned to a break.<br />
Map layout<br />
Focus Poor The map lacks focus. The legend is complex (including data not even displayed on <strong>the</strong> map, i.e., <strong>the</strong> number <strong>and</strong><br />
percentage <strong>of</strong> significant <strong>change</strong>s in <strong>the</strong> series <strong>of</strong> four-celled tables with arrows). The legend is <strong>the</strong> same size as <strong>the</strong><br />
map, <strong>and</strong> <strong>the</strong>y visually compete with each o<strong>the</strong>r for importance on <strong>the</strong> page. The map is accompanied by a detailed<br />
caption. The reader must carefully read <strong>the</strong> caption first to underst<strong>and</strong> <strong>the</strong> legend <strong>and</strong> <strong>the</strong>n carefully read <strong>the</strong> legend in<br />
order to underst<strong>and</strong> <strong>the</strong> map. For example, information about <strong>the</strong> white areas on <strong>the</strong> map is included in <strong>the</strong> caption but<br />
not in <strong>the</strong> map legend.
Climatic Change (2009) 95:219–230 227<br />
Visual variables<br />
Color hue Satisfactory Point observations for physical <strong>and</strong> biological systems are distinguished by different color hues. This is appropriate for<br />
grouping qualitative features. It is unclear why <strong>the</strong> green circles have white borders on <strong>the</strong> map (white <strong>and</strong> black<br />
borders in <strong>the</strong> legend), while blue circles have black borders.<br />
Color value Poor The temperature data are quantitative <strong>and</strong> displayed using a color sequence that varies by color hue. It appears that a<br />
detailed spectral or ‘rainbow’ sequence, <strong>of</strong>ten used to symbolize many classes in a temperature range, has been<br />
simplified to five classes. The visual effects produced on <strong>the</strong> map are <strong>change</strong>s in color hue. It is challenging to view <strong>the</strong><br />
sequence in this quantitative dataset symbolized by colors that are qualitatively different, e.g., green, blue, yellow. The<br />
five classes <strong>of</strong> data should be displayed by varying color value (light to dark) or by using a diverging scheme around <strong>the</strong><br />
zero data point with color hue/color value <strong>change</strong>s for <strong>the</strong> two directions (negative <strong>and</strong> positive) in <strong>the</strong> data set.<br />
Color saturation NA Color saturation is not used to symbolize data on <strong>the</strong> map.<br />
Size Satisfactory Circle symbols <strong>of</strong> different sizes are appropriately used (small to big) to represent quantitative data. However, it is<br />
unclear why <strong>the</strong> size varies in Europe only.<br />
Shape NA Shape is not used to symbolize data on <strong>the</strong> map.<br />
Visual hierarchy Poor The visual hierarchy <strong>of</strong> <strong>the</strong> map is poor. The relationship between observation locations <strong>and</strong> temperature is difficult to<br />
underst<strong>and</strong>. Blue circles (physical systems) completely cover green circles (biological systems) in most locations, while<br />
green circles cover blue ones in a few locations. Circles that only <strong>change</strong> size in Europe are confusing. Actual <strong>change</strong>s<br />
in physical <strong>and</strong> biological systems (emphasized in <strong>the</strong> map title <strong>and</strong> in <strong>the</strong> legend) are not displayed on <strong>the</strong> map. Also,<br />
<strong>the</strong> color hues <strong>of</strong> <strong>the</strong> circles (blue <strong>and</strong> green) are very close to <strong>the</strong> blue <strong>and</strong> green color hues used to show<br />
temperature range.
228 Climatic Change (2009) 95:219–230<br />
surface temperatures 1970–2004.” For <strong>the</strong> only map published in an IPCC summary<br />
report for policymakers, <strong>the</strong> evaluation reveals specific issues <strong>of</strong> cartographic <strong>quality</strong><br />
with this ‘high-visibility’ map. Our evaluation is <strong>of</strong> course subjective, <strong>and</strong> reflects: (1)<br />
our choice <strong>of</strong> selected <strong>design</strong> principles, (2) <strong>the</strong> evaluation categories, (3) <strong>the</strong> lack <strong>of</strong><br />
multiple reviewers, <strong>and</strong> (4) <strong>the</strong> reviewers’ expertise in applying <strong>the</strong> <strong>design</strong> principles<br />
to <strong>the</strong> evaluated map. Never<strong>the</strong>less, this kind <strong>of</strong> cartographic evaluation can provide<br />
useful insights into <strong>the</strong> <strong>quality</strong> <strong>of</strong> <strong>climate</strong> <strong>change</strong> <strong>maps</strong>.<br />
5 Toward a research <strong>and</strong> policy agenda for evaluating <strong>climate</strong> <strong>change</strong> <strong>maps</strong><br />
We have demonstrated how a <strong>climate</strong> <strong>change</strong> map can be evaluated. O<strong>the</strong>r <strong>climate</strong><br />
<strong>change</strong> <strong>maps</strong> are likely to vary in <strong>quality</strong> <strong>and</strong> could benefit from such evaluation.<br />
Poor <strong>quality</strong> <strong>climate</strong> <strong>change</strong> <strong>maps</strong> have implications for <strong>climate</strong> <strong>change</strong> research<br />
<strong>and</strong> policymaking. We suggest a modest but important agenda to improve <strong>the</strong><br />
cartographic <strong>quality</strong> <strong>of</strong> <strong>climate</strong> <strong>change</strong> <strong>maps</strong>.<br />
(a) Systematic evaluation <strong>of</strong> <strong>the</strong> cartographic <strong>design</strong> <strong>and</strong> <strong>quality</strong> <strong>of</strong> <strong>climate</strong> <strong>change</strong><br />
<strong>maps</strong> should be undertaken to assess <strong>and</strong> improve <strong>climate</strong> <strong>change</strong> <strong>maps</strong>.<br />
Our evaluation was a preliminary demonstration. Evaluation methods should be<br />
refined to include: (a) carefully <strong>design</strong>ed sampling plans to select a population <strong>of</strong><br />
<strong>climate</strong> <strong>change</strong> <strong>maps</strong> to evaluate, (b) exp<strong>and</strong>ing <strong>the</strong> criteria (cartographic principles)<br />
to apply in <strong>the</strong> evaluations, including possible weighting <strong>of</strong> criteria, (c) assembling<br />
a panel <strong>of</strong> expert cartographers to assess map <strong>design</strong> using established evaluation<br />
techniques, <strong>and</strong> (d) developing more elaborate <strong>and</strong> varied evaluation rankings. Such<br />
evaluations could provide an important inventory <strong>of</strong> <strong>the</strong> state <strong>of</strong> <strong>climate</strong> <strong>change</strong><br />
map <strong>design</strong>, identify key examples <strong>of</strong> good <strong>design</strong>, educate <strong>climate</strong> scientists about<br />
cartographic principles, <strong>and</strong> help target efforts to improve <strong>climate</strong> <strong>change</strong> <strong>maps</strong>.<br />
(b) The impact <strong>of</strong> <strong>climate</strong> <strong>change</strong> <strong>maps</strong> on <strong>climate</strong> <strong>change</strong> research <strong>and</strong> policymaking<br />
should be researched to better underst<strong>and</strong> <strong>the</strong>ir specific role <strong>and</strong> influence.<br />
Such research on <strong>the</strong> impact <strong>of</strong> <strong>climate</strong> <strong>change</strong> <strong>maps</strong> includes cartography <strong>of</strong> course,<br />
but could usefully extend to psychology, sociology, <strong>and</strong> political science. There are<br />
several key questions. How do <strong>maps</strong> influence or direct scientific efforts <strong>and</strong> research<br />
priorities? What assumptions do scientists make about <strong>the</strong> audiences for whom <strong>the</strong>y<br />
produce <strong>the</strong> <strong>maps</strong>, do <strong>the</strong>se assumptions need to <strong>change</strong>, <strong>and</strong> if so, how? How<br />
effective are <strong>climate</strong> <strong>change</strong> <strong>maps</strong> for syn<strong>the</strong>sizing <strong>and</strong> interpreting <strong>climate</strong> <strong>change</strong><br />
data for policymakers? How are specific <strong>maps</strong> being used to guide decision-making?<br />
What are <strong>the</strong> implications <strong>of</strong> inserting inaccurate or misleading <strong>maps</strong> (purposefully<br />
or not) into <strong>the</strong> policymaking process? What are <strong>the</strong> cumulative effects <strong>of</strong> <strong>maps</strong><br />
produced by scientific organizations when reprinted <strong>and</strong> propagated through <strong>the</strong><br />
popular media (un<strong>change</strong>d or modified)? How can <strong>the</strong> cartographic <strong>design</strong> <strong>and</strong><br />
persuasiveness <strong>of</strong> <strong>climate</strong> <strong>change</strong> <strong>maps</strong> be improved? Research to address <strong>the</strong>se<br />
questions can illuminate <strong>the</strong> role <strong>of</strong> <strong>climate</strong> <strong>change</strong> <strong>maps</strong>, help identify key traits<br />
<strong>of</strong> effective <strong>maps</strong>, <strong>and</strong> improve research, policy analysis, <strong>and</strong> public communication<br />
related to <strong>climate</strong> <strong>change</strong>.
Climatic Change (2009) 95:219–230 229<br />
(c) Climate <strong>change</strong> scientists should encourage cartographers to become more directly<br />
engaged with <strong>climate</strong> <strong>change</strong> research <strong>and</strong> cartographers should be responsive<br />
to such engagement.<br />
Cartographers can <strong>and</strong> should be more effectively engaged in <strong>climate</strong> science activities.<br />
Climate <strong>change</strong> research teams should include cartographers or personnel<br />
well-trained in cartography. Climate <strong>change</strong> scientists <strong>and</strong> cartographers should work<br />
collaboratively to actively advocate <strong>and</strong> implement good <strong>quality</strong> map layout <strong>and</strong><br />
<strong>design</strong>. Potential collaborations include (but are not limited to) training <strong>of</strong> <strong>climate</strong><br />
research teams, regular map critiques, <strong>and</strong> experimentation with new cartographic<br />
methods, technologies, <strong>and</strong> map <strong>design</strong>s.<br />
6 Conclusion<br />
Climate <strong>change</strong> is <strong>the</strong> most pervasive environmental challenge facing contemporary<br />
societies. Its local, regional, <strong>and</strong> global impacts are (<strong>and</strong> will increasingly be) extraordinary<br />
in scope, complexity, <strong>and</strong> consequence. The scientific community has a wideranging<br />
<strong>and</strong> intense research effort underway, focused on <strong>climate</strong> <strong>change</strong> dynamics,<br />
impacts, adaptation, <strong>and</strong> mitigation alternatives. The results increasingly depend<br />
on <strong>maps</strong> as tools <strong>of</strong> visualization <strong>and</strong> analysis, instruments <strong>of</strong> policy <strong>and</strong> decisionmaking,<br />
<strong>and</strong> ways <strong>of</strong> communicating <strong>climate</strong> <strong>change</strong> science to <strong>the</strong> public. As we have<br />
suggested, <strong>maps</strong> have <strong>the</strong> power to inform or misinform, lead or mislead, clarify or<br />
confuse through <strong>the</strong> use or misuse <strong>of</strong> <strong>design</strong> principles. Successful application <strong>of</strong> good<br />
map <strong>design</strong> is a necessary step in <strong>the</strong> development <strong>of</strong> <strong>the</strong> <strong>climate</strong> <strong>change</strong> sciences.<br />
Acknowledgements The authors thank <strong>the</strong> anonymous reviewers for <strong>the</strong>ir review <strong>and</strong> comment on<br />
earlier drafts <strong>of</strong> this manuscript. Wayde Morse <strong>and</strong> Jim Snyder provided valued assistance. An earlier<br />
version <strong>of</strong> this paper was presented at <strong>the</strong> 23rd International <strong>Cartographic</strong> Conference, Moscow,<br />
Russian Federation, August 2007.<br />
References<br />
Arikawa M, Tsuruoka K, Fujita H, Ome A (2007) Place-tagged podcasts with synchronized <strong>maps</strong> on<br />
mobile media players. Cartogr Geogr Inf Sci 34(4):293–303<br />
Bertin J (1981) Graphics <strong>and</strong> graphic information processing. Walter de Gruyter, Berlin (Translated<br />
by W. Bert <strong>and</strong> P. Scott)<br />
Brewer CA (2005) Designing better <strong>maps</strong>: a guide for GIS users. ESRI, Redl<strong>and</strong>s, CA<br />
Butler D (2006) Mashups mix data into global service. Nature 439:6–7<br />
Buttenfield BP (1996) Scientific visualization for environmental modeling: interactive <strong>and</strong> proactive<br />
graphics. In: Goodchild MF, Steyaert LT, Parks BO, Johnston C, Maidment D, Crane M,<br />
Glendinning S (eds) GIS <strong>and</strong> environmental modeling: progress <strong>and</strong> research issues. GIS World<br />
Books, Fort Collins, CO, pp 463–467<br />
Buttenfield BP, Beard MK (1991) Visualizing <strong>the</strong> <strong>quality</strong> <strong>of</strong> spatial information. In: Technical<br />
papers 1991. Auto-Carto 10: proceedings <strong>of</strong> <strong>the</strong> 10th annual symposium on computer-assisted<br />
cartography. ACSM/ASPRS, Be<strong>the</strong>sda, MD, pp 423–427<br />
Carter JR (2004) Cartography is alive (thank God!). Cartogr Perspect 49:4–9<br />
Cassettari S (2007) More mapping, less cartography: tackling <strong>the</strong> challenge. Cartogr J 44(1):6–12<br />
Dent B (1999) Cartography: <strong>the</strong>matic map <strong>design</strong>, 5th edn. WCB/McGraw-Hill, Boston, MA<br />
Field K (2005) Editorial ‘<strong>maps</strong> still matter—don’t <strong>the</strong>y?’. Cartogr J 42(2):81–82<br />
Gartner G, Bennett DA, Morita K (2007) Towards ubiquitous cartography. Cartogr Geogr Inf Sci<br />
34(4):247–257
230 Climatic Change (2009) 95:219–230<br />
IPCC (2007a) Climate <strong>change</strong> 2007: <strong>the</strong> physical science basis. In: Solomon S, Qin D, Manning M,<br />
Chen Z, Marquis M, Averyt KB, Tignor M, Miller HL (eds) Contribution <strong>of</strong> working group I<br />
to <strong>the</strong> fourth assessment report <strong>of</strong> <strong>the</strong> Intergovernmental Panel on Climate Change. Cambridge<br />
University Press, Cambridge, UK. Available at http://www.ipcc.ch/. Accessed 21 Nov 2007<br />
IPCC (2007b) Summary for policymakers. In: Parry ML, Canziani OF, Palutik<strong>of</strong> JP, van der Linden<br />
PJ, Hanson CE (eds) Climate <strong>change</strong> 2007: impacts, adaptation <strong>and</strong> vulnerability. Contribution<br />
<strong>of</strong> working group II to <strong>the</strong> fourth assessment report <strong>of</strong> <strong>the</strong> Intergovernmental Panel on Climate<br />
Change. Cambridge University Press, Cambridge, UK, p 10. Available at http://www.ipcc.ch/.<br />
Figure 1 graphic available at http://www.ipcc.ch/graphics/gr-ar4-wg2.htm. Accessed 21 Nov 2007<br />
IPCC (2007c) Climate <strong>change</strong> 2007: syn<strong>the</strong>sis report. Summary for policymakers [unedited copy].<br />
Available at http://www.ipcc.ch/. Accessed 21 Nov 2007<br />
Kimerling AJ, Muehrcke PC, Muehrcke JO (2001) Map use: reading, analysis, <strong>and</strong> interpretation,<br />
5th edn. JP, Madison, WI<br />
Kintisch E, Kerr RA (2007) Breakthrough <strong>of</strong> <strong>the</strong> year: global warming, hotter than ever. Science<br />
318(5858):1846–1847<br />
Krygier J, Wood D (2005) Making <strong>maps</strong>: a visual guide to map <strong>design</strong> for GIS. Guilford, New York<br />
Lilley RJ (2007) Who needs cartographers? Cartogr J 44(3):202–208<br />
Lobben AK, Patton DK (2003) Design guidelines for digital atlases. Cartogr Perspect 44:51–62<br />
MacEachren AM (1994) Some truth with <strong>maps</strong>: a primer on symbolization <strong>and</strong> <strong>design</strong>. Association<br />
<strong>of</strong> American Geographers, Washington, DC<br />
McKendry JE (2000) The influence <strong>of</strong> map <strong>design</strong> on resource management decision making.<br />
<strong>Cartographic</strong>a 37(2):13–25<br />
Monmonier M (1993) Mapping it out: expository cartography for <strong>the</strong> humanities <strong>and</strong> social sciences.<br />
The University <strong>of</strong> Chicago Press, Chicago, IL<br />
Monmonier M (1995) Drawing <strong>the</strong> line: tales <strong>of</strong> <strong>maps</strong> <strong>and</strong> cartocontroversy. Henry Holt <strong>and</strong><br />
Company, New York<br />
Monmonier M (1996) How to lie with <strong>maps</strong>, 2nd edn. The University <strong>of</strong> Chicago Press, Chicago, IL<br />
Monmonier M (2006) Cartography: uncertainty, interventions, <strong>and</strong> dynamic display. Prog Hum<br />
Geogr 30(3):373–381<br />
Monmonier M (2007) Cartography: <strong>the</strong> multidisciplinary pluralism <strong>of</strong> cartographic art, geospatial<br />
technology, <strong>and</strong> empirical scholarship. Prog Hum Geogr 31(3):371–379<br />
Organización de Estados Iberoamericanos (2007) Cambio climático 2007: impactos, adaptación y<br />
vulnerabilidad. Available at http://www.oei.es/decada/presentacioneurop.htm. Accessed 4 Sept<br />
2008<br />
Petchenik BB (1983) A map maker’s perspective on map <strong>design</strong> research 1950–1980. In: Taylor<br />
DRF (ed) Graphic communication <strong>and</strong> <strong>design</strong> in contemporary cartography. Wiley, New York,<br />
pp 37–68<br />
Plewe B (2007) Web cartography in <strong>the</strong> United States. Cartogr Geogr Inf Sci 34(2):133–136<br />
Robinson AH, Morrison JL, Muehrcke PC, Kimerling AJ, Guptill SC (1995) Elements <strong>of</strong> cartography,<br />
6th edn. Wiley, New York<br />
Slocum T, McMaster RB, Kessler FC, Howard HH (2005) Thematic cartography <strong>and</strong> geographic<br />
visualization, 2nd edn. Pearson Education, Upper Saddle River, NJ<br />
Struck D (2007) Emissions growth must end in 7 years, U.N. warns. Washington Post, 18 November,<br />
A10<br />
Taylor DRF, Caquard S (2006) Cybercartography: <strong>maps</strong> <strong>and</strong> mapping in <strong>the</strong> information era.<br />
<strong>Cartographic</strong>a 41(1):1–5<br />
Tufte ER (1983) The visual display <strong>of</strong> quantitative information. Graphics, Cheshire, CT<br />
Tufte ER (1990) Envisioning information. Graphics, Cheshire, CT<br />
Tufte ER (1997) Visual explanations. Graphics, Cheshire, CT<br />
Wood CH, Keller CP (1996) Design: its place in cartography. In: Wood CH, Keller CP (eds)<br />
<strong>Cartographic</strong> <strong>design</strong>: <strong>the</strong>oretical <strong>and</strong> practical perspectives. Wiley, Chichester, UK, pp 1–9