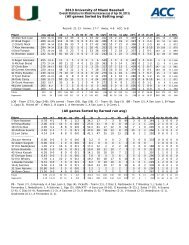
2008 <strong>University</strong> <strong>of</strong> <strong>Miami</strong> Hurricanes<strong>Miami</strong> (Fla.) Opponent Game-by-Game (as <strong>of</strong> Nov 24, 2008)All <strong>game</strong>sOPPONENT STATISTICSRushing Receiving Passing Kick Returns Punt Returns totDate Opponent no. yds td lg no. yds td lg cmp-att-int yds td lg no. yds td lg no. yds td lg <strong>of</strong>fAug 28 CHARLESTON SOUTHERN 30 49 0 11 11 77 1 39 11-22-0 77 1 39 9 140 0 37 1 -1 0 0 <strong>12</strong>6Sep 06 at Florida 27 89 1 20 21 256 2 38 21-35-0 256 2 38 3 82 0 34 4 59 0 31 345Sep 20 at Texas A&M 35 87 0 17 19 275 3 62 19-32-1 275 3 62 6 101 0 31 2 22 0 14 362Sep 27 NORTH CAROLINA 33 35 2 8 13 264 2 74 13-24-0 264 2 74 3 67 0 29 0 0 0 0 299Oct 04 FLORIDA STATE 53 310 4 45 14 159 1 27 14-31-2 159 1 27 7 <strong>12</strong>5 0 43 1 0 0 0 469Oct 11 UCF 27 4 0 26 11 74 0 15 11-37-0 74 0 15 2 110 1 91 6 52 0 32 78Oct 18 at Duke 44 142 2 23 16 191 2 39 16-34-0 191 2 39 3 56 0 31 0 0 0 0 333Oct 25 WAKE FOREST 52 195 1 25 3 57 0 45 3-8-0 57 0 45 4 80 0 25 0 0 0 0 252Nov 1 at Virginia 24 78 1 18 27 240 1 33 27-41-0 240 1 33 4 53 0 19 1 15 0 15 318Nov 13 VIRGINIA TECH 38 77 2 19 <strong>12</strong> 173 0 38 <strong>12</strong>-20-0 173 0 38 5 54 0 15 1 -1 0 0 250Nov 20 at Georgia Tech 56 472 4 58 4 46 0 22 4-7-0 46 0 22 4 56 0 26 1 10 0 10 518Opponents 419 1538 17 58 151 18<strong>12</strong> <strong>12</strong> 74 151-291-3 18<strong>12</strong> <strong>12</strong> 74 50 924 1 91 17 156 0 32 3350<strong>Miami</strong> (Fla.) 362 1439 15 51 191 2095 18 51 191-338-15 2095 18 51 45 851 0 57 26 302 1 66 3534Games played: 11Avg per rush: 3.7Avg per catch: <strong>12</strong>.0Pass efficiency: 115.74Kick ret avg: 18.5Punt ret avg: 9.2All purpose avg/<strong>game</strong>: 417.3Total <strong>of</strong>fense avg/gm: 304.5Tackles Sacks Fumble Pass Defense Blkd PAT AttemptsDate Opponent ua a total tfl-yds no-yds ff fr-yds int-yds qbh brup kick kick rush rcv saf ptsAug 28 CHARLESTON SOUTHE 36 28 64 3.0-13 1.0-8 0 1-0 0-0 0 3 0 1-1 0 0 0 7Sep 06 at Florida 39 18 57 7.0-27 3.0-20 0 0-0 0-0 1 1 1 3-3 0 0 1 26Sep 20 at Texas A&M 30 26 56 7.0-29 2.0-11 0 0-0 1-2 0 2 0 2-2 0 0 0 23Sep 27 NORTH CAROLINA 50 6 56 9.0-34 2.0-17 0 0-0 2-35 0 1 1 4-4 0 0 0 28Oct 04 FLORIDA STATE 34 <strong>12</strong> 46 6.0-28 2.0-18 0 0-0 3-4 0 13 0 5-5 0 0 0 41Oct 11 UCF 50 14 64 11.0-51 3.0-23 1 0-0 3-68 0 6 0 2-2 0 0 0 14Oct 18 at Duke 26 44 70 4.0-15 2.0-13 0 0-0 3-16 3 4 0 4-4 0 0 0 31Oct 25 WAKE FOREST 43 10 53 4.0-15 1.0-10 0 0-0 0-0 0 6 0 1-1 0 0 0 10Nov 1 at Virginia 48 20 68 5.0-20 2.0-13 2 2-0 1-2 0 4 0 2-2 0 0 0 17Nov 13 VIRGINIA TECH 41 16 57 7.0-27 3.0-18 3 1-0 0-0 1 2 0 2-2 0 0 0 14Nov 20 at Georgia Tech 44 <strong>12</strong> 56 4.0-16 2.0-11 0 0-0 2-33 0 6 1 5-5 0 0 0 41Opponents 441 206 647 67.0-275 23.0-162 6 4-0 15-160 5 48 3 31-31 0 0 1 252<strong>Miami</strong> (Fla.) 433 262 695 73.0-304 25.0-192 8 10-2 3-11 9 29 1 34-34 1 0 2 307Punting Field Goals Kick<strong>of</strong>fsDate Opponent no. yds avg long blkd tb fc 50+ i20 md-att long blkd no. yds avg tb obAug 28 CHARLESTON SOUTHE 8 287 35.9 43 0 0 0 0 1 0-0 0 0 3 83 27.7 0 1Sep 06 at Florida 7 319 45.6 59 0 1 0 3 3 1-1 29 0 5 320 64.0 1 1Sep 20 at Texas A&M 4 186 46.5 60 0 0 0 2 2 1-2 38 0 4 280 70.0 2 0Sep 27 NORTH CAROLINA 4 146 36.5 41 0 0 0 0 0 0-1 0 0 5 249 49.8 0 1Oct 04 FLORIDA STATE 1 -29 -29.0 0 0 0 0 0 0 2-2 53 0 9 487 54.1 0 1Oct 11 UCF <strong>12</strong> 418 34.8 55 1 3 1 2 3 0-0 0 0 4 231 57.8 0 0Oct 18 at Duke 7 284 40.6 49 0 1 2 0 2 1-1 40 0 6 356 59.3 0 1Oct 25 WAKE FOREST 6 229 38.2 45 0 1 2 0 2 1-2 24 0 3 176 58.7 0 0Nov 1 at Virginia 7 299 42.7 58 0 0 0 1 5 1-3 23 0 4 251 62.8 0 0Nov 13 VIRGINIA TECH 6 224 37.3 46 0 0 0 0 2 0-1 0 0 3 178 59.3 0 0Nov 20 at Georgia Tech 3 108 36.0 42 0 1 0 0 0 2-2 30 0 7 449 64.1 0 0Opponents 65 2471 38.0 60 1 7 5 8 20 9-15 53 0 53 3060 57.7 3 5<strong>Miami</strong> (Fla.) 59 2327 39.4 76 3 2 19 8 18 17-19 52 0 61 3563 58.4 6 2
<strong>Miami</strong> (Fla.) (7 - 4 - 0)Thru: 11/22/2008 - Week 13TEAM RANKINGS119 teams ranked in Football Bowl Subdivision<strong>12</strong> teams ranked in the Atlantic Coast ConferenceSCHEDULE AND RESULTS 7-4-0 L-1Atlantic Coast Conference Record: 4-3-008/28/2008 *+ Charleston So. 52 7 W09/06/2008 * Florida 3 26 L09/20/2008 * Texas A&M 41 23 W09/27/2008 + North Carolina 24 28 L10/04/2008 + Florida St. 39 41 L10/11/2008 + UCF 20 14 W10/18/2008 Duke 49 31 W10/25/2008 + Wake Forest 16 10 W11/01/2008 Virginia 24 17 W OT11/13/2008 *+ Virginia Tech 16 14 W11/20/2008 * Georgia Tech 23 41 L11/29/2008 North Carolina St.+ Home Game ^ Neutral Site * Night GameOT Overtime GameNationalNationalCategoryActualActual Conf Atlantic Coast ConferenceActualRankLeaderRankLeaderRushing Offense 77 130.82 Nevada 308.55 6 Georgia Tech 270.82Passing Offense 81 190.45 Texas Tech 427.09 6 Clemson 220.64Total Offense 90 321.27 Tulsa 584.64 5 Florida St. 380.18Scoring Offense 48 27.91 Oklahoma 52.64 2 Florida St. 34.27Rushing Defense 57 139.82 TCU 48.67 7 Boston College 95.82Pass Efficiency Defense 39 115.75 Southern California 84.34 7 Boston College 96.62Total Defense 20 304.55 TCU 215.08 6 Boston College 269.64Scoring Defense 49 22.91 Southern California 8.30 10 Georgia Tech 16.73Net Punting 43 36.<strong>12</strong> Cincinnati 41.34 4 Maryland 38.09Punt Returns 29 11.62 Central Mich. 18.69 2 Boston College 13.64Kick<strong>of</strong>f Returns 107 18.91 Southern California 30.<strong>12</strong> <strong>12</strong> North Carolina St. 24.80Turnover Margin T-96 -.55 Oklahoma 1.64 10 Wake Forest 1.36Pass Defense 8 164.73 Southern California 132.30 3 Florida St. 163.09Passing Efficiency 84 117.26 Tulsa 189.54 8 North Carolina 130.29Sacks 42 2.27 Oklahoma 3.45 6 Florida St. 3.18Tackles For Loss 27 6.64 Florida St. 8.64 4 Florida St. 8.64Sacks Allowed T-71 2.09 Air Force .25 7 Virginia 1.27T=tied at this rankingPLAYER RANKINGSPlayer must have played in 75% <strong>of</strong> team's <strong>game</strong>sSummary <strong>of</strong> the top 100 national leaders and top 25 conference leaders15 categories rankedCategoryPlayerNationalRankActualNationalLeaderActualConf Atlantic Coast ConferenceRank LeaderActualRushing Graig Cooper 69 66.36 Brown II, UConn 153.70 6 Dwyer, GaTech 107.64Passing Efficiency (Min. 15 Att./Game) Robert Marve 97 103.98 Johnson, Tulsa 195.69 11 Wilson, N.C.St 132.02Jacory Harris 131.72 2Total Offense Robert Marve <strong>12</strong>8.60 Keenum, Hou 407.27 11 Wilson, N.C.St 203.67Jacory Harris 87.45 14Graig Cooper 71.00 16Receptions Per Game Aldarius Johnson 2.73 Fitzgeral, NTex 9.27 T-17 Boldin, WF 6.27Receiving Yards Per Game Aldarius Johnson 29.18 Britt, Rut 119.10 23 Nicks, <strong>NC</strong> 87.91Kayne Farquharson 28.00 24Interceptions Berry, Tenn .64 Harris, VaTech .60Punting (Min. 3.6 Punts/Game) Matt Bosher 58 40.28 Conley, Idaho 47.43 3 Baltz, Md 42.30Punt Returns (Min. 1.2 Ret./Game) Travis Benjamin 21 11.53 Clark, NMex 19.67 1 Benjamin, MiaFla 11.53Kick<strong>of</strong>f Returns (Min. 1.2 Ret./Game) Travis Benjamin 70 22.71 Garvin, FlaSt 32.23 9 Garvin, FlaSt 32.23Field Goals Matt Bosher T-15 1.55 Gano, FlaSt 2.33 3 Gano, FlaSt 2.33Scoring Matt Bosher T-43 7.73 McCoy, Pitt 10.80 3 Gano, FlaSt 10.00Graig Cooper 3.27 T-25All-Purpose Runners Travis Benjamin 88.00 Maclin, Mo 202.27 11 Spiller, Clem 138.90T=tied at this rankingGraig Cooper 82.18 14Sacks Marcus Robinson .40 Hughes, TCU 1.17 T-14 Brown, FlaSt 1.14Allen Bailey .40 T-14Spencer Adkins .33 T-19Adewale Ojomo .33 T-19Tackles Glenn Cook 6.27 Richardso, NMxSt <strong>12</strong>.70 T-21 Brown, Duke 10.91Tackles For Loss Marcus Robinson .70 Brown, FlaSt 1.86 T-25 Brown, FlaSt 1.86Allen Bailey .70 T-25
- Page 1 and 2: GAME 12 - NOV. 29, 2008MIAMI VS. NC
- Page 3 and 4: GAME 12 - NOV. 29, 2008MIAMI VS. NC
- Page 5 and 6: GAME 12 - NOV. 29, 20082008 GAME NO
- Page 7 and 8: GAME 12 - NOV. 29, 2008MIAMI VS. NC
- Page 9 and 10: GAME 12 - NOV. 29, 2008MIAMI VS. NC
- Page 11 and 12: GAME 12 - NOV. 29, 20082008 GAME NO
- Page 13 and 14: GAME 12 - NOV. 29, 20082008 GAME NO
- Page 15 and 16: GAME 12 - NOV. 29, 2008MIAMI VS. NC
- Page 17 and 18: GAME 12 - NOV. 29, 2008MIAMI VS. NC
- Page 19 and 20: GAME 12 - NOV. 29, 20082008 GAME NO
- Page 21 and 22: GAME 12 - NOV. 29, 2008MIAMI VS. NC
- Page 23 and 24: GAME 12 - NOV. 29, 2008MIAMI VS. NC
- Page 25 and 26: GAME 12 - NOV. 29, 2008MIAMI VS. NC
- Page 27 and 28: GAME 12 - NOV. 29, 2008MIAMI VS. NC
- Page 29 and 30: GAME 12 - NOV. 29, 2008MIAMI VS. NC
- Page 31 and 32: GAME 12 - NOV. 29, 2008MIAMI VS. NC
- Page 33 and 34: GAME 12 - NOV. 29, 2008MIAMI VS. NC
- Page 35 and 36: GAME 12 - NOV. 29, 2008MIAMI VS. NC
- Page 37 and 38: GAME 12 - NOV. 29, 2008MIAMI VS. NC
- Page 39 and 40: GAME 12 - NOV. 29, 2008MIAMI VS. NC
- Page 41 and 42: GAME 12 - NOV. 29, 2008MIAMI VS. NC
- Page 43 and 44: GAME 12 - NOV. 29, 2008MIAMI VS. NC
- Page 45 and 46: GAME 12 - NOV. 29, 2008MIAMI VS. NC
- Page 47 and 48: 2008 University of Miami Hurricanes
- Page 49 and 50: 2008 University of Miami Hurricanes
- Page 51: 2008 University of Miami Hurricanes