Business and Private Banking - CommSec
Business and Private Banking - CommSec
Business and Private Banking - CommSec
- No tags were found...

You also want an ePaper? Increase the reach of your titles
YUMPU automatically turns print PDFs into web optimized ePapers that Google loves.
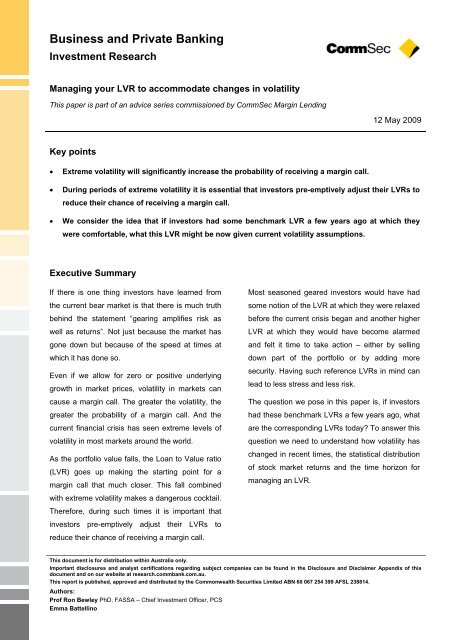
<strong>Business</strong> <strong>and</strong> <strong>Private</strong> <strong>Banking</strong>Investment ResearchManaging your LVR to accommodate changes in volatilityThis paper is part of an advice series commissioned by <strong>CommSec</strong> Margin Lending12 May 2009Key points• Extreme volatility will significantly increase the probability of receiving a margin call.• During periods of extreme volatility it is essential that investors pre-emptively adjust their LVRs toreduce their chance of receiving a margin call.• We consider the idea that if investors had some benchmark LVR a few years ago at which theywere comfortable, what this LVR might be now given current volatility assumptions.Executive SummaryIf there is one thing investors have learned fromthe current bear market is that there is much truthbehind the statement “gearing amplifies risk aswell as returns”. Not just because the market hasgone down but because of the speed at times atwhich it has done so.Even if we allow for zero or positive underlyinggrowth in market prices, volatility in markets cancause a margin call. The greater the volatility, thegreater the probability of a margin call. And thecurrent financial crisis has seen extreme levels ofvolatility in most markets around the world.As the portfolio value falls, the Loan to Value ratio(LVR) goes up making the starting point for amargin call that much closer. This fall combinedwith extreme volatility makes a dangerous cocktail.Therefore, during such times it is important thatinvestors pre-emptively adjust their LVRs toreduce their chance of receiving a margin call.Most seasoned geared investors would have hadsome notion of the LVR at which they were relaxedbefore the current crisis began <strong>and</strong> another higherLVR at which they would have become alarmed<strong>and</strong> felt it time to take action – either by sellingdown part of the portfolio or by adding moresecurity. Having such reference LVRs in mind canlead to less stress <strong>and</strong> less risk.The question we pose in this paper is, if investorshad these benchmark LVRs a few years ago, whatare the corresponding LVRs today? To answer thisquestion we need to underst<strong>and</strong> how volatility haschanged in recent times, the statistical distributionof stock market returns <strong>and</strong> the time horizon formanaging an LVR.This document is for distribution within Australia only.Important disclosures <strong>and</strong> analyst certifications regarding subject companies can be found in the Disclosure <strong>and</strong> Disclaimer Appendix of thisdocument <strong>and</strong> on our website at research.commbank.com.au.This report is published, approved <strong>and</strong> distributed by the Commonwealth Securities Limited ABN 60 067 254 399 AFSL 238814.Authors:Prof Ron Bewley PhD, FASSA – Chief Investment Officer, PCSEmma Battellino
Managing your LVR to accommodate changes in volatility12 May 2009Section 1: How volatility has changedWhen geared, the level of volatility in the market <strong>and</strong> more importantly an investor’s portfolio will have a significantimpact on the probability of receiving a margin call. Therefore, it is important to underst<strong>and</strong> how market volatilityhas changed in recent times <strong>and</strong> what this may mean for portfolio volatility. Depending on the degree ofdiversification, the volatility of an investor’s portfolio may not be the same as the market. For example, portfolios ofonly a few stocks or those which are highly concentrated in just a few sectors will typically have much highervolatility than the market or that of a well-diversified portfolio of blue chip stocks or index-tracking managed funds. Itis essential that this fact is taken into account when setting <strong>and</strong> thinking about LVRs.Since all investors are likely to have a slightly different portfolio, each with a different volatility, we look at thevolatility of the S&P/ASX 200 index in order to provide a benchmark from which to work. Investors can then deducewhat this market volatility means for their portfolio.The tricky thing with volatility is that unlike calculating a return of which there is only one way to do so – what is theprice now versus what was the price before – they are many ways to estimate volatility. These different ways, suchas rolling st<strong>and</strong>ard deviations or volatility models (such as GARCH) combined with the various options in terms offrequency of data used (eg daily, weekly), will all give rise to different estimates of volatility. Therefore, whensomeone quotes a volatility number it is important to know how it has been calculated. But what’s more important isthat if comparing the current level of volatility to some level in the past then the volatilities have been consistentlycalculated. Therefore, for the purpose of this analysis we use a GARCH model applied to daily data to estimatevolatility which we show in Figures 1 <strong>and</strong> 2.With the onset of the Global Financial Crisis mid way through 2007 extreme volatility hit markets around the world<strong>and</strong> Australia was not immune. Volatility spiked to levels previously unseen since the days just after the 1987 stockmarket crash. The typical long-run level of 12% – 18% vanished as levels of 20% – 40% became the norm withshort-run extremes of 60% <strong>and</strong> 70%. In recent months volatility has been subsiding but continues to remainelevated at levels between 20% – 30%.Figure 1: S&P/ASX 200 volatility since 1985 Figure 2: S&P/ASX 200 volatility since July 2007Annualised volatility100%90%80%70%60%50%40%30%20%10%0%1985 1987 1989 1991 1993 1995 1997 1999 2001 2003 2005 2007Volatility Historical median Historical averageAnnualised volatility80%70%60%50%40%30%20%10%0%Jul-07 Jan-08 Jul-08 Jan-09Volatility Historical average Average since crisis (Jul 07)Source: Investment Research, IRESSNote: Scale has been truncated at 100% (volatility in 1987 reached 215%)Source: Investment Research, IRESSInvestment Research 2
Managing your LVR to accommodate changes in volatility12 May 2009Of course, this is only one example with one set of assumptions. The relationship between this example <strong>and</strong> howinvestors might adjust their LVRs under different assumptions is not straight forward. For this reason, almost allsituations are unique. However, it is our intention that this case study provides some intuition behind the thinking.A final factor to consider is the effect of including cash as part of your portfolio. Doing so has the effect ofincreasing the fall which can be taken by a portfolio before a margin call is made – effectively slowing down theprobability that a margin call is made. This effect occurs as the cash portion of the portfolio is not re-valued daily inthe same way as are stocks <strong>and</strong> managed funds. While this can be a great benefit in times of extreme volatility,including cash does increase the complexity of the analysis when thinking about how comfort <strong>and</strong> alarm LVRsmight need to be adjusted. When cash is involved <strong>and</strong> the value of the portfolio falls, the maximum portfolio LVRactually increases as cash is generally assigned a higher LVR than stocks or managed funds <strong>and</strong> the proportion ofcash in the portfolio higher. Therefore, this effect <strong>and</strong> its impact on the probability of a margin call also need to beconsidered.Investment Research 5
Managing your LVR to accommodate changes in volatility12 May 2009Section 3: Ten of the top questions for geared investorsThe case study above illustrates that a geared investment strategy requires much thought <strong>and</strong> carefulmanagement. Here are ten of then top questions we think that geared investors not only need to ask themselvesbut also be able to answer! If you hesitate in answering any of these questions or others that are similar, perhapsnow is the time to sit down, make a plan <strong>and</strong> do something about it.1. What if your portfolio value fell by, say, 10%, would you get a margin call?2. Could you recover from a margin call?3. Could you pre-empt a margin call (either by selling stock or adding more cash) if the market starts movingagainst you?4. Which stocks or funds would you sell first?5. What impact would such sales have on the volatility of the remaining portfolio?6. What if you lose your job – will you be forced to sell stock at possibly a bad time?7. What if interest rates suddenly went up – could you still afford your loan?8. What if a company pays a lower than expected dividend?9. What if your lender reduces the maximum LVR on one or more stocks?10. In higher volatility regimes, what is your ‘comfort’ LVR?Investment Research 6
Managing your LVR to accommodate changes in volatility12 May 2009DISCLOSURE AND DISCLAIMER APPENDIXImportant Information: <strong>CommSec</strong> Margin Lending is a unit of the Commonwealth Bank Group of Companies. The Commonwealth Bank ofAustralia ABN 48 123 123 124 AFSL 234945 ("the Bank") is incorporated in Australia with limited liability. Commonwealth Securities LimitedABN 60 067 254 399 AFSL 238814 ("<strong>CommSec</strong>"), is a wholly owned, but non-guaranteed, subsidiary of the Bank <strong>and</strong> a participant of the ASXGroup Please view our website at research.commbank.com.au for further important disclosure information.Important Information Appendix - All Investors: The Bank <strong>and</strong> its subsidiaries, including <strong>CommSec</strong>, Commonwealth Australia Securities LLC,CBA Europe Ltd, Commonwealth <strong>Private</strong> Ltd, Commonwealth Research <strong>and</strong> Investment Research, are domestic or foreign entities or businessareas of the Commonwealth Bank Group of Companies (CBGOC). CBGOC <strong>and</strong> their directors, employees <strong>and</strong> representatives are referred toin this Appendix as “the Group”. This report is published solely for informational purposes <strong>and</strong> is not to be construed as a solicitation or an offerto buy any securities or financial instruments. This report has been prepared without taking account of the objectives, financial situation <strong>and</strong>capacity to bear loss, knowledge, experience or needs of any specific person who may receive this report. No member of the Group does, or isrequired to, assess the appropriateness or suitability of the report for recipients who therefore do not benefit from any regulatory protections inthis regard. All recipients should, before acting on the information in this report, consider the appropriateness <strong>and</strong> suitability of the information,having regard to their own objectives, financial situation <strong>and</strong> needs, <strong>and</strong>, if necessary seek the appropriate professional, foreign exchange orfinancial advice regarding the content of this report.We believe that the information in this report is correct <strong>and</strong> any opinions, conclusions or recommendations are reasonably held or made, basedon the information available at the time of its compilation, but no representation or warranty, either expressed or implied, is made or provided asto accuracy, reliability or completeness of any statement made in this report. Any opinions, conclusions or recommendations set forth in thisreport are subject to change without notice <strong>and</strong> may differ or be contrary to the opinions, conclusions or recommendations expressed elsewhereby the Group. We are under no obligation to, <strong>and</strong> do not, update or keep current the information contained in this report. The Group does notaccept any liability for any loss or damage arising out of the use of all or any part of this report. Any valuations, projections <strong>and</strong> forecastscontained in this report are based on a number of assumptions <strong>and</strong> estimates <strong>and</strong> are subject to contingencies <strong>and</strong> uncertainties. Differentassumptions <strong>and</strong> estimates could result in materially different results. The Group does not represent or warrant that any of these valuations,projections or forecasts, or any of the underlying assumptions or estimates, will be met. Past performance is not a reliable indicator of futureperformance. The Group has provided, provides, or seeks to provide, investment banking, capital markets <strong>and</strong>/or other services, includingfinancial services, to the companies described in the report <strong>and</strong> their associates. This report is not directed to, or intended for distribution to oruse by, any person or entity who is a citizen or resident of or located in any locality, state, country or other jurisdiction where such distribution,publication, availability or use would be contrary to law or regulation or which would subject any entity within the Group to any registration orlicensing requirement within such jurisdiction. All material presented in this report, unless specifically indicated otherwise, is under copyright tothe Group. None of the material, nor its content, nor any copy of it, may be altered in any way, transmitted to, copied or distributed to any otherparty, without the prior written permission of the appropriate entity within the Group. In the case of certain products, the Bank or one of itsrelated bodies corporate is or may be the only market maker. The Group, its agents, associates <strong>and</strong> clients have or have had long or shortpositions in the securities or other financial instruments referred to herein, <strong>and</strong> may at any time make purchases <strong>and</strong>/or sales in such interestsor securities as principal or agent, including selling to or buying from clients on a principal basis <strong>and</strong> may engage in transactions in a mannerinconsistent with this report.All investors - Analyst Certification <strong>and</strong> Disclaimer: Each research analyst, primarily responsible for the content of this research report, in wholeor in part, certifies that with respect to each security or issuer that the analyst covered in this report: (1) all of the views expressed accuratelyreflect his or her personal views about those securities or issuers; <strong>and</strong> (2) no part of his or her compensation was, is, or will be, directly orindirectly, related to the specific recommendations or views expressed by that research analyst in the report. The analyst(s) responsible for thepreparation of this report may interact with trading desk personnel, sales personnel <strong>and</strong> other constituencies for the purpose of gathering,synthesizing, <strong>and</strong> interpreting market information. Directors or employees of the Group may serve or may have served as officers or directors ofthe subject company of this report. The compensation of analysts who prepared this report is determined exclusively by research management<strong>and</strong> senior management (not including investment banking). No inducement has been or will be received by the Group from the subject of thisreport or its associates to undertake the research or make the recommendations. The research staff responsible for this report receive a salary<strong>and</strong> a bonus that is dependent on a number of factors including their performance <strong>and</strong> the overall financial performance of the Group, includingits profits derived from investment banking, sales <strong>and</strong> trading revenue.Investment Research 7