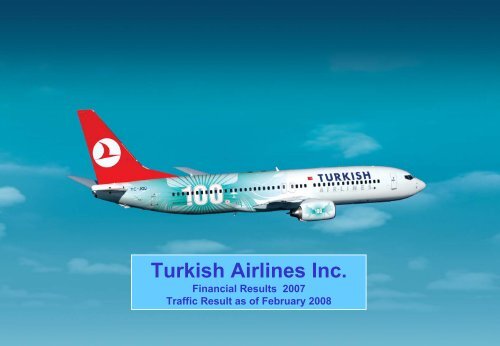
February 2008 - Turkish Airlines
February 2008 - Turkish Airlines
February 2008 - Turkish Airlines
- No tags were found...
You also want an ePaper? Increase the reach of your titles
YUMPU automatically turns print PDFs into web optimized ePapers that Google loves.
DisclaimerThis presentation is confidential and does not constitute or form part of, and should not be construed as, an offer or invitationto subscribe for, underwrite or otherwise acquire, any securities of <strong>Turkish</strong> <strong>Airlines</strong> A.O (the “Company”) or any member of itsgroup nor should it or any part of it form the basis of, or be relied on in connection with, any contract to purchase or subscribefor any securities of the Company or any member of its group nor shall it or any part of it form the basis of or be relied on inconnection with any contract, investment decision or commitment whatsoever. This presentation has been made to you solelyfor your information and background and is subject to amendment. This presentation (or any part of it) may not be reproducedor redistributed, passed on, or the contents otherwise divulged, directly or indirectly, to any other person (excluding therelevant person’s professional advisers) or published in whole or in part for any purpose without the prior written consent of theCompany.This presentation includes forward-looking statements. These forward-looking statements include all matters that are nothistorical facts, statements regarding the Company’s intentions, beliefs or current expectations concerning, among otherthings, the Company’s results of operations, financial condition, liquidity, prospects, growth, strategies and the industry inwhich the Company operates. By their nature, forward-looking statements involve risks and uncertainties, including, withoutlimitation, the risks and uncertainties set forth in the Company’s Offering Memorandum, because they relate to events anddepend on circumstances that may or may not occur in the future. The Company cautions you that forward-lookingstatements are not guarantees of future performance and that its actual results of operations, financial condition and liquidityand the development of the industry in which the Company operates may differ materially from those made in or suggested bythe forward-looking statements contained in this presentation. In addition, even if the Company’s results of operations,financial condition and liquidity and the development of the industry in which the Company operates are consistent with theforward-looking statements contained in this presentation, those results or developments may not be indicative of results ordevelopments in future periods. The Company does not undertake any obligation to review or confirm analyst expectations orestimates or to release publicly any revisions to any forward-looking statements to reflect events that occur or circumstancesthat arise after the date of this presentation.2
Dr. Temel KOTİL, CEO, <strong>Turkish</strong> <strong>Airlines</strong> Started his <strong>Turkish</strong> <strong>Airlines</strong> career in March 2003 asExecutive Vice President (Technical) and was appointed asCEO in April 2005 Ph.D. in Mechanical Engineering, Michigan University , USA M.Sc. in Aerospace, Michigan University, USA B.Sc. in Aeronautical Engineering, Istanbul TechnicalUniversity, Istanbul Board Member of Sun ExpressSpeakersCoşkun KILIÇ, CFO, <strong>Turkish</strong> <strong>Airlines</strong> CFO as of March 2006 M.Sc. in Finance, Urbana Champaign Illinois University,USA M.A. Economics, Ankara University Certified Public Accountant Board Member of Sun Express3
Contents <strong>Turkish</strong> Economy Airline Sector in Turkey Company Overview Financial Highlights Appendices4
Industry vs EconomyGNP growth vs RPK growth70,000World GNP (US$ bn, lef t axis)60,000World RPK Growth %50,00040,00030,00020,00010,0000'00 '01 '02 '03 '04 '05 '06 '07 '08ESource: WATS and ICAO25%20%15%10%5%0%-5%-10%-15%500450400350300250200150100500GNP growthGNP (US$ bn, lef t axis)THY RPK Growth'00 '01 '02 '03 '04 '05 '06 '07 '08ESource: Realization and official targets by Central Bank of Turkey, GeneralDirectorate of Budget and Fiscal Control, State Institute of Statistics25%20%15%10%5%0%-5%-10%-15%World GNP expected to grow by 4,8% , RPK growthis expected to be 5.8% for <strong>2008</strong>While World RPK decreased after 2004 THY wasable to sustain and increase RPK for the same years2.52.01.5Falling inflationUS$ / try (Period end, lef t axis)Change in CPI index (right axis)Change in WPI index (right axis)100%80%60%Middle East, Far East and Africa routes areexpected to grow higher then average during theyears <strong>2008</strong>-20101.00.540%20%0.0'00 '01 '02 '03 '04 '05 '06 '07 '08E0%Source: Central Bank of Turkey; inflation and exchange rate realizations,inflation targets5Reforms and growth on track
Company OverviewCompany Snapshot During the year 2007 Carried 19,6 mn passengers Flies to 69 countries, 138 cities and 140 points Fleet of 102 aircraft Seat capacity of 17,594 Generates 90% of revenues from passenger traffic and 10% from scheduledcargo traffic Strong growth since 2001 - operating revenues increased on average by 13%per annum, higher than average growth in the EU Become a full pledge member to Star Alliance in the first Quarter of <strong>2008</strong>.7
107 Int’l LinesS. AFRICA (2)CAPETOWN/3- S.Af ricaJOHANNESBURG/3- S.Af ricaJEDDAH/6-Suudi Arabia*EUROPE (62)AMSTERDAM/14 - Netherland DONETSK/2-Ukraina MANCHESTER/7-England SARAJEVO/4-Bosna HerzegovinaATHENS/13-Greece DUBLIN/5-Irland MILAN/14-Italy SIMFEROPOL/4 - UkrainaBAKU/10-Azerbeijan DUSSELDORF/16-Germany MINSK/3- Belarus SKOPJE/4-Republic of MacedoniaBARCELONA/7-Spain FRANKFURT/21-Germany MOSCOW/14-Russia SOFIA/5-BulgariaBASEL/4- Sw itzerland GENEVA/7- Sw itzerland MUNICH/11-Germany ST PETERSBURG/3-RussiaBATUM/7-Georgia HAMBURG/11-Germany NICE/3-France STOCKHOLM/7-Sw edenBELGRAD/3-Serbia HANNOVER/8-Germany NURNBERG/5-Germany STRASBOURG/2-FranceBERLIN/13-Germany HELSINKI/3-Finland ODESSA/7 - Ukraina STUTTGART/11-GermanyBRUSSELS/14-Belgium KAZAN/2-Russia OSLO/3 - Norvey TBILISI/7 - GeorgiaBUCHAREST/10- Romania KIEV/7-Latvia PARIS/18-France TIRANA/5-AlbaniaBUDAPEST/6- Hungary LEFKOSA/16-KKTC PRAG/5-Czech Republic VENICE/4-İtalyCHISINAOU/7-Moldovia LISBON/2-Portugal PRISTINA/6-Serbia VIENNA/14-AustriaCOLOGNE/7-Germany LJUBLIANA/5-Solovenia RIGA/2-Latvia WARSAW/4-PolandCOPENHAGEN/7-Denmark LONDON/21,7-England ROME/10-İtaly YEKATERINBURG/2-RussiaDNEPREPETROVSK/2-Ukraina LYON/5-France ROSTOV/3-Russia ZAGREB/5-CroatiaTEL AVIV/18-IsrailCompany OverviewDestinationsAMERICA (2)CHICAGO/3-USANEW YORK/7- USAN.AFRICA (5)ALGERIA/6-AlgeriaCAIRO/8-EgyptCASABLANCA/3-MoroccoTRIPOLI/3-LibiaTUNUS/3-TunisiaMADRID/7-SpainZURICH/11 - Sw itzerlandFAR EAST (17)E. AFRICA (2)MIDDLE EAST (16) ALMATY/7-Kazakhstan MUMBAI/BOMBAY/3-IndiaADISABABA/3-EtiyopyaASKHABAT/5-Turkmenistan NEW DELHI/3- New DelhiABU DHABI/4 - United Arab Emirates KUWAIT/3-Kuw aitKHARTOUM/3-SudanASTANA/2-KazakhstanOSAKA/2-JapanAMMAN/6-JordanMEDİNAH/2-Suudi ArabiaBANGKOK/7-ThailandSEOUL/3- S.KoreaBAHREYN4-BahrainMUSCAT/4-UmmanW. AFRICA (1)BEIJING/7-ChinaSHANGHAI/7-ChineBEIRUT/3- BeirutRIYAD/2-Suudi ArabiaLAGOS/2-B.AfrikaBISKEK/7-Kyrgyzstan SINGAPORE/4-SingaporeDAMASCUS/5-SyriaSANAA/3-YemenDUSANBE/2-Tajikistan TASHKENT/4-UzbekistanDOHA/4-KatarTEBRIZ/2- İranHONG KONG/2-ChineTOKYO/4-JapanDUBAI14-United Arab Emirates TEHRAN/7-IranKARACHI/4-Pakistan31 Domestic LinesİstanbulİzmirBursaİstanbulEskişehirAnkaraNevşehirSamsunSivasKayseriBatumTrabzonKarsErzurumErzincanAğrıMalatyaElazığMuşVan8* New destinations launched after 2006DenizliBodrumAntalyaKonyaAdıyamanDiyarbakırK.MaraşBatmanAdanaMardinGaziantepŞanlıurfaHatay
Company OverviewServicesHABOM ProjectJV agreement on engine maintenance issigned on January 7th <strong>2008</strong>, with Pratt &Whitney.By the first half of 2009 revenue stream isexpected from engine maintenance JVCompany.MoU is signed on November 8, 2007 withGoodrich Aerostructures (Rohr Inc.) onNacelle and Thrust Reverser maintenance.Under HABOM, the plan is to increase theairframe maintenance capacity toapproximately 400 aircraft per annum.Expect over 500 mn$ revenue by 2012 fromHABOM Project and First JV (<strong>Turkish</strong> EngineCenter) will be established by THY TechnicInc. and Pratt & Whitney in <strong>2008</strong> THY has 4 full flight simulators RJ-100, B737-400, B737-800 and A320 for cockpit crewtraining.THY hasTraining• A340 ”First class”, B737 “EconomyClass” Cabin Service Trainer(CST)• B737/A310/A340 Cabin EmergencyEvacuation Trainer(CEET)For cabin crew training. THY provided training to 42 other airline’scabin and cockpit training in 2007,excluding movie companies. Out of 42, 23domestic and 19 international. Besides third party training, THY hasprovided in-house training for its 8,673cabin crew and 6,380 cockpit crew in 2007.9THY will be developing its technical service and maintenance business through the HABOM Project
Company OverviewPassenger Traffic In Feb. <strong>2008</strong>, capacity on domestic routesincreased by 11,3%, traffic increased by 7,3%,load factor decreased by 3.0 pt to 70,5%On international routes; capacity increased by7,7%, traffic increased by 13,3%, while load factorincreased by 2.6pt to 68,2%Total capacity increased by 8,4% while trafficincreased by 12%. Load factor was 68,1%(+2.2 pt)THY Passenger Traffic(Billion)60504030201002468.917Capacity-Traffic Development Load Factor %2467.0162570.2173071.5213769.4254272.73065.9642002 2003 2004 2005 2006 2007 FebASK RPK L/F %200768.164Feb<strong>2008</strong><strong>2008</strong>E807570656055504540(%)THY Passenger Traffic Domestic 2005 2006 2007 Feb'07 Feb'08 07 vs '08Landings 65,140 78,910 86,825 12,081 13,333 10.4%ASK (million) 5,431 7,123 8,087 1,138 1,266 11.3%RPK (million) 3,992 5,213 5,899 836 898 7.3%Passenger # (million) 7,151 8,906 9,935 1,369 1,507 10.0%L/F % 73.5 73.2 72.9 73.5 70.5 -3.0 ptTHY Passenger Traffic Int'l 2005 2006 2007 Feb'07 Feb'08 07 vs '08Landings 56,864 73,626 80,739 11,312 12,678 12.1%ASK (million) 22,741 29,811 33,532 4,824 5,197 7.7%RPK (million) 16,355 20,170 24,370 3,094 3,506 13.3%Passenger # ( '000) 6,483 8,040 9,711 1,196 1,382 15.6%L/F % 71.9 67.7 73.3 65.6 68.2 2.6 ptTHY Passenger Traffic Total 2005 2006 2007 Feb'07 Feb'08 07 vs '08Landings 122,004 152,536 167,564 23,393 26,011 11.2%ASK (million) 28,172 36,934 41,618 5,962 6,463 8.4%RPK (million) 20,347 25,383 30,269 3,931 4,403 12.0%Passenger # (million) 13,634 16,946 19,646 2,565 2,889 12.6%L/F % 71.6 68.7 72.7 65.9 68.1 2.2 ptTotal Passenger Traffic(2007 vs <strong>2008</strong>)Landing : up by 11%ASK : up by 8%RPK : up by 12%Passenger : up by 12.6%L/F: 2 pointsSource: Company10Significant growth in operational highlights
Financial HighlightsRevenues4,0003,5003,0002,5002,0001,5001,000500- Revenue breakdown has been relativelyconstant over the years, passengersaccounting for around 80%1.575307978290Total Revenues (2007)Source: Financial statements released under <strong>Turkish</strong> CMB standards, converted to US$ using exchange rates1.634.501, 1.3958, 1.3421 ,1.3418,1.4296, 1.3003 for the years 2002,2003, 2004 ,2005,2006 and 2007 respectively.THY benefits from the large <strong>Turkish</strong> populationliving in Europe, creating a steady revenuestreamSource: Company1.7913911,0443562.0814411,2344062.3163131,5034992.8321,8485972,4337992002 2003 2004 2005 2006 2007387Domestic International Others%303.6704384,0003,5003,0002,5002,0001,5001,000500-N. Africa, 2.26%Total Revenue Breakdown by service (2007)1841761,445OthersCargo&MailPassenger2271641,4002521891,640115199Passenger Revenue Breakdown by Geography (%)2,0021652222,4451932453,2322002 2003 2004 2005 2006 2007S.Africa, 0.27%N. America,4.48%Middle East,10.21%Domestic,24.73%East Africa,0.33%Europe, 40.22%Far East, 17.10%Middle Africa0.40%11Revenue has positive correlation with growth in GNP in Turkey
Company OverviewPassenger BreakdownInt’l. Traffic Breakdown by Geography ( 2007)Passenger Breakdown 2002 - 2007N. America, 4.48%Middle East,10.21%Far East, 17.10%S.Africa, 0.27%Middle Africa,0.40%East Africa, 0.33%Market Shares (2007)N. Africa, 2.26%Europe, 40.22%25,50024,00022,50021,00019,50018,00016,50015,00013,50012,00010,5009,0007,5006,0004,5003,0001,500052%48%200210,38352%48%200310.42048%52%200411,99149%51%200514,13748%52%200616,94649%51%200719,64650%50%<strong>2008</strong>E100%80%60%40%20%0%ForeignCarriers,46.5Source: SAAInternationalOther<strong>Turkish</strong>Carriers,8.7THY, 44.8Other<strong>Turkish</strong>Carriers,37.2DomesticTHY, 62.9Domestic International Total THY carried 19,6 million passengers in 2007,with an increase of 16% compared to 2006 In <strong>2008</strong> around 20% increase is expected onpax growth Domestic and International passengerbreakdown consistent over the years Haj and charter passengers each accountedfor 2% of the passenger traffic12Stable market share in int’l traffic & Balanced breakdown between domestic and int’l traffic
Company OverviewFleet DevelopmentFleet ( As of March 11th <strong>2008</strong>)FinancialTYPE # Owned LeaseOperationalLeaseB737-800 41 - 31 10B737-400 9 - - 9A320-200 16 - 6 10A321-200 15 - 10 5A319-100 2 - 2A330-200 5 - 5 -A340 7 7 - -A310 5 4 - 1A310 Cargo 2 1 - 1Total 102 12 52 38AdditionsTYPE <strong>2008</strong> 2009 TOTALB737-800 8 - 8A320-200 6 - 6A321-200 2 - 2A340 2 2A330-200 - 2 2Total 18 2 20Seat capacity 21588 22150 22150Fleet ExitsTYPE <strong>2008</strong> 2009 TOTALA 321 - 200 0 1 1A310 1 0 1Total 1 1 2Out of 59 aircraft, 43 of them joined the fleetas of <strong>2008</strong>.As of <strong>2008</strong> average age of the fleet will bearound 6 yrs.Total of 2.7 billion dollars financing werecompleted for the aircraft delivered in2005,2006, 2007 as well as 19 aircraft in<strong>2008</strong>, at Libor and Euribor without T.C.Treasury’s Guarantee.At the end of <strong>2008</strong>, annual lease expenseswill be approximately around $545 million;of which 77% Financial leases and 23%Operational Leases.CAPEX 1.043 Mn$Items %Aircraft & Engine & Upgrade 93%Others (IT,Flight training) 7%13Seat capacity to be increased by 12% by <strong>2008</strong>, fleet age to drop around 6 years
Company OverviewFleet EfficiencySeat CapacityAverage Daily Flight Utilization (hrs)25,00023,00011.01221,00019,0003%10.09.017,00015,00013,00011,0009,0007,0005,00010.67210.85810.67210.59818,23917,59418,18917,66421,58822,150(Hours)8.07.06.05.04.09.4710.0710.1210.1710.3111.139.3810.5111.373,0002002 2003 2004 2005 2006 2007 Feb'07 Feb'08 <strong>2008</strong>E 2009E3.02002 2003 2004 2005 2006 2007 Feb'07 Feb'08 <strong>2008</strong>E Since 2004, seat capacity has increased by 46% as of <strong>February</strong> <strong>2008</strong>Aircraft utilization has been rising due to a good mix of fleet composition and dynamic schedulingprocess14Source: CompanyStrong capacity growth
Company OverviewEmployees14,00012,000No. of Personnel0.40%Due to fleet expansion the total number ofpersonnel increased by 0.40% from Feb’07 toFeb’08 due to fleet expansion.10,0008,000THY Technic AŞ. personnel 2,519is included6,0004,0002,00010,98410,23910,95611,12112,80712,95112,91012,962The number of employees per aircraft decreasedby 23% since 2002-2002 2003 2004 2005 2006 2007 Feb'07 Feb'08Passengers per EmployeeEmployees per Aircraft1,5001,2501,000750500250-9451,0181,0941,2711.3231,51712%1992232002 2003 2004 2005 2006 2007 Feb'07 Feb'081801601401201008060402001.421661581501341241271291312002 2003 2004 2005 2006 2007 Feb'07 Feb'0815Personnel Efficiency is The key Driven While Increasing Fleet
Company OverviewOperating EfficiencyPersonnel Cost per ASK (US¢, 2007)THY enjoys high personnel efficiency compared toits competitors64205.044.333.99 3.52 3.372.752.281.870.94Lufthansa British Air- Austrian Iberia Ry anair Alitalia THY Easy JetFranceKLMPersonnel cost of THY per ASK was only 1.87 UScents for 2007127 employees per aircraft and 1,517 passengersper employee renders THY as one of the mostefficient airline.Source: Company annual reports & websitesPassenger per Employee (2007)Employee per Aircraft (2007)100009,6253002947500500025006,5564,1381,6831,5171,3801,349770598425200100205172143127826042412400RyanairEasyJetSASAlitaliaTHYIberiaAustrianAir-France KLMLufthansaBritishAir-France KLMLufthansaBritishIberiaTHYAustrianAlitaliaRyanairEasyJetSASSource: Company annual reports & websites16Source: Company annual reports & websitesOne of the most efficient airlines in Europe
Financial HighlightsOperating ExpensesOperating Expenses Distribution (9M 2007)Operating Expenses (US$ mn)($ Mn) 2006 % in Total 2007 % in TotalStaff 570 21% 779 24%PassengerService , 5%Other, 11%Staff, 24%Fuel 775 28% 903 28%Sales & Mktng 303 11% 325 10%Depreciation 236 9% 280 9%GroundHandling, 5%Landing 233 8% 255 8%Ground Handling 136 5% 172 5%Passenger Service 125 5% 162 5%Landing, 8%Depreciation,9%Sales & Mktng,10%Fuel , 28%Other 395 14% 373 11%TOTAL 2,773 3,250Op.Cost per ASK 7.50 7.81Source: Financial statements released under <strong>Turkish</strong> CMB standards, converted to US$ using 1.42 and1.30 exhange rates for 2006 and 2007 respectively17Fuel and staff expenses constitute 52% ofoperating expensesStaff expenses increased with the expansion infleet and operationsTHY has enhanced quality in catering during theyear of 2007 with new subsidiary <strong>Turkish</strong> Do&CoInc.Operating Costs per ASK (US¢, 2007)Operating expenses increased in 2007 mainly due to Personel Expenses252015105020.616.9 15.9 14.913.0 13.0 12.2Lufthansa Austrian British SAS Alitalia Air-FranceKLM7.8 6.9Iberia THY Easy JetSource: Company annual reports & websites
Financial HighlightsEBITDAR(US$ mn) 2003 2004 2005 2006 2007 ’07/’06Revenue 1,791 2,081 2,316 2,832 3,670 30%EBIT 233 106 70 63 420 567%EBIT Margin 13% 5% 3% 2% 11% 4.14 ptEBITDA 431 330 293 299 700 134%EBITDA Margin 24% 16% 13% 11% 19% 0.81 ptEBITDAR 480 415 399 460 874 90%EBITDAR Margin 27% 20% 17% 16% 24% 0.47 ptDecrease in Fuel price and cost cuttingpolicies had a positive effect on operatingexpenses.Net Income 153 80 103 125 224 80%-Depreciation 198 224 223 236 326 38%Operating Lease 49 85 106 161 174 8%EBITDAR Margin Comparison (2007)<strong>2008</strong> Year-end targeted EBITDAR Marginis 19% Expected average EBITDAR Marginamong European <strong>Airlines</strong> for <strong>2008</strong> is17,6%*18353025201510-5 0537Ry anairSource: Company annual reports & websites24THY21British18Air-FranceKLM17Iberia17Easy Jet15Austrian13Lufthansa10AlitaliaFalling Fuel Price had a positive effect on EBITDAR Margin*Source Morgan Stanley
Historical HighlightsOperating Expenses% in Total Operating Expenses 2001 - 2007 Per ASK 2001-200730%25%20%15%10%28%28%24%21%23%23%24%21%20%24%20%18%15%16%2001 2002 2003 2004 2005 2006 2007Personnel Expenses Fuel oil ExpensesUScent10.008.006.004.002.00-7.54 7.50 7.817.466.485.56 5.732.170.83 1.03 1.46 1.83 2.101.001.74 1.801.871.171.15 1.471.572001 2002 2003 2004 2005 2006 2007Operating Exp. Personnel Exp Fuel Exp.Operating Expenses (%) 2001 2002 2003 2004 2005 2006 2007Rents 3.8 3.0 3.1 4.3 4.7 5.8 5.8Maintenance Expenses 5.4 4.8 4.5 5.5 4.7 5.9 3.6Insurance 1.3 1.2 1.2 2.5 1.7 1.1 0.9Depreciation 10.7 11.7 12.7 11.3 10.2 8.5 8.6Landing and navigation expenses 9.5 9.1 9.6 9.1 8.1 8.4 7.9Ground handling expenses 7.8 7.5 7.1 4.6 3.9 3.4 4.2Passenger service and catering expenses 5.7 6.2 6.5 4.9 4.9 4.5 4.8Sales and Marketing 12.6 14.0 12.9 11.7 10.8 10.2 9.6General Administration 3.6 3.7 3.7 0.8 0.7 0.8 0.9Others 0.7 4.1 0.0 2.5 2.4 2.5 2.419Operating expenses increased in 2007 mainly due to Personnel Expenses
THYCurrency BreakdownIncome by Currency ( 2007)YEN3%Other21%Euro45%THY’s income is diversified among the majorcurrenciesDue to its currency basket THY is very flexible onfx positionGBP3%GBP; 1%YTL19%Expenses by Currency (2007)YEN; 1%USD9%Other; 5%Euro; 13%Although USD income is lower then USD expensesTHY is able to cover its USD expenses from Euroincome due to strong Euro against USDSame concept on USD/Euro is applicable to cover<strong>Turkish</strong> Lira expensesYTL; 44%USD; 36%20Source: CompanyDiversified revenue & expense base and agility in pricing currency
THANK YOU<strong>Turkish</strong> <strong>Airlines</strong> Inc.Investor Relations DepartmentMr.Coşkun KILIÇ / CFOMs.Suna ÇELEBİ / IR ManagerTel: +90 212-463-6363 x-3630E-mail: ir@thy.com21
Contents <strong>Turkish</strong> Economy Airline Sector in Turkey Company Overview Financial HighlightsAppendices22
THYCargo TransportationTHY - CargoCargo Revenue(Ton)200,000180,000160,000140,000120,000100,00080,00060,00040,00020,0000İç Hat Dış Hat %1398,40097,122105,764115,210126,502141,28528,438 27,967 30,561 30,786 33,293 39,0932002 2003 2004 2005 2006 2007Million $3002502001501005005%1581671882092342452002 2003 2004 2005 2006 2007500,000400,000300,000200,000100,0000<strong>Turkish</strong> Cargo Market vs THY<strong>Turkish</strong> Market(Ton)THY (TON)THY Share42%45%47%50%44% 46%251,987126,838276,283125,089324,588136,325331,116145,996348,722160,209382,572180,3782002 2003 2004 2005 2006 200780%60%40%20%0% Domestic and International breakdown isconsistent over the yearsAs of January – December 2007 THY hascarried total of 180,378 Tons cargo, increasedby 13% compared to same period of 2006. Cargo revenue has increased by 5% in 2007compared to 2006Source: Company23Plan to enlarge freighter fleet to increase cargo capacity as well as revenue
FuelFleet Expansion will Reduce Fuel Cost as well as Fleet AgeCrude Oil Prices (Brent US$/bbl)Average Specific Fuel Consumption120100806040200Jan Jan Feb Mar Apr May Jun Jul Jul Aug Sep Oct Nov Nov Dec(Litre per 100 rpk)6.56.36.226.15.9 6.065.75.645.55.575.35.38 5.385.365.14.94.964.74.51999 2001 2003 2005 20072002 2003 2004 2005 2006 2007 <strong>2008</strong> Daily average crude oil prices increased by 11%in 2007 compared to 2006Fuel Expense per ASK (US Cent) 2007Although THY does not hedge, its fuel expenseper ASK is lower in average compared to its peergroups.Due to fleet expansion, the fleet average age willbe lower which inreturn will increase THY’s fuelefficiency.54321-14.13.53.0 2.92.7 2.7 2.6British Lufthansa Austrian SAS Alitalia Iberia Air-FranceKLM2.2 2.0THYEasyJet24Source: BloombergSource: Company annual reports & websites
THYAssets & LiabilitiesAssets (in USD m ) 2002 2003 2004 2005 2006 2007 07/'06Cash and Equivalents 247 473 272 360 260 663 155%Net Trade Receivables 85 85 118 143 177 211 19%Other Current Assets 83 71 114 113 318 404 27%Total Current Assets 416 628 505 616 755 1,277 69%Due from Related Parties (Long Term) 26 38 0 0 11 3 -71%Net Fixed Assets 1,690 1,413 1,355 1,965 2,201 2,786 27%Other Long Term Assets 41 33 337 261 189 160 -15%Total Long Term Assets 1,757 1,483 1,692 2,226 2,400 2,949 23%Total Assets 2,173 2,111 2,197 2,842 3,155 4,226 34%Liabilities (in USD m ) 2002 2003 2004 2005 2006 2007 07/'06Short Term Lease Obligations 209 175 151 133 156 193 24%Accounts Payable 108 130 148 191 226 312 38%Passenger Flight Liabilities 58 80 138 154 199 257 29%Other Current Liabilities 120 140 106 415 179 218 21%Total Current Liabilities 496 525 542 894 760 979 29%Long Term Lease Obligations 1,171 861 714 638 1,027 1,347 31%Retirement Pay Provision 53 56 74 85 83 113 36%Other Long Term Liabilities 44 38 39 295 139 151 9%Total Long Term Liabilities 1,269 955 827 1,018 1,250 1,612 29%Capital 1,029 1,205 1,426 130 125 150 21%Share Premium 0 1 1 1,396 1,330 1,608 21%Reserves 76 89 105 6 6 7 21%Accumulated Loss (697) (664) (705) (602) (316) (130) -59%Total Shareholders Equity 408 631 827 930 1145 1635 43%Total Liabilities & Shareholders Equity 2,173 2,111 2,197 2,842 3,155 4,226 34%25Source: In converting the TRY reported results to USD, year-end USD exchange rates were used
THYStatement of IncomeIncom e Statem ent (in USD m ) 2002 2003 2004 2005 2006 2007 07/06 %Operating Revenues 1,584 1,791 2,081 2,316 2,834 3,670 30%Operating Expenses (1,379) (1,558) (1,975) (2,246) (2,773) (3,250) 17%Operating Profit 206 233 106 70 60 420 594%Income From Other Operations 23 64 44 317 193 87 -55%Loss From Other Operations (4) (8) (12) (205) (42) (322) 659%Income Before Financial Income/(Expens 225 290 139 181 211 184 -13%Financial Income/(Loss) (236) 186 28 (46) (79) 126 61%Monetary Gain/(Loss) 257 (270) (84) - -Incom e Before Taxation 246 206 82 135 132 311 135%Taxation (60) (53) (2) (32) (7) (86) 1070%Net Incom e 187 153 80 103 125 224 80%Source:In converting the TRY reported results to USD, the period average USD exchange rates were used26
THY TECHNIC A.S.(Consolidated)Owned 100% by THYSubsidiariesTHYSUBSIDIARY AND AFFILIATESEstablished on May 23rd, 2006 with the capital-in-kind valued at 271,325,800 New <strong>Turkish</strong> Lira (appx $169 mn)which is mainly aircraft components and aircraft spare parts. Current capital is approximately around 198 mn$For the year end 2007 posted revenues and loss of US$506 (mn) and US$ 5(mn) respectivelyProvides maintenance services to more than 10 international airlines including Lufthansa, KLM, BA and Alitalia aswell as domestic airlines.Main goal is to become one of the biggest MRO Center in the regionSUN EXPRESS A.S. (Equity pick-up) Owned 50% - 50% by THY and Lufthansa, respectively.Operating mainly charter flights between Germany and Antalya (Turkey) airports. Scheduled operation havestarted from İzmir on November 3, 2005 . Also Domestic Operations has started from İzmir as of March 26, 2006Flies to/from 20 airports in Germany, 12 in Turkey and 42 in other countries with total of 832 personnel. Fleet consisted of 14 aircraft ; 10 B737 & 4 B757 aircraft with total seat capacity of 2,796 as of December 31,2007. Carried 3.001.529 passengers as of December 31,2007 by achieving load factor of 76,5%27For the first 9 months of 2007 posted revenues and profit of 304.8 €mn and 13.9 €mn respectively.THY DO & CO Catering A.S. (Equity pick-up)Owned 50% - %50 by THY and Do & Co Restaurants & Catering A.GFor the year-end 2007 posted revenues and net income of US$127 (mn) and US$8 (mn) respectivelyHABOM Project will be launched by THY Technic A.Ş.
THYCorporate StructureBOARD OF DIRECTORSPRESIDENT and CEOGENERALSECRETARYDIR.INSPECTION BOARDLEGAL COUNSELLORDIR.FLIGHT SAFETY&QUALITY ASSURANCEDIR.I.T.DIR.PUBLIC RELATIONSSECRETARY OFDEFENCEDIR.INVESTMENT MANAGEMENTPRESS COUNSELLORDIR.FLIGHT TRAININGDIR.TECHNICALEXECUTIVE VICE PRESIDENT(HUMAN RESOURCES)EXECUTIVE VICE PRESIDENT(FINANCIAL)EXECUTIVE VICE PRESIDENT(COMMERCIAL)EXECUTIVE VICE PRESIDENT(GROUND OPERATIONS)EXECUTIVE VICE PRESIDENT(FLIGHT OPERATIONS)DIR.PERSONNELDIR.FINANCEDIR.PRODUCTION PLANNINGDIR.GROUND OPERATIONS(ISTANBUL STATION)DIR.FLIGHT OPERATIONS(CHIEF PILOT)DIR.TRAININGDIR.ACCOUNTINGDIR.REVENUE MANAGEMENTDIR.GROUND OPERATIONS(DOMESTIC STATIONS)DIR.CABIN CREW MANAGINGDIR. SOCIAL&ADMINISTRATIVE AFFAIRSDIR.GENERAL PURCHASINGDIR.MARKETING & SALESDIR.CATERINGDIR.CARGODIR.BUSINESS DEVELOPMENT28DIR. INTERNATIONALRELATIONS & ALLIANCE
THYSafetyBrief Description of THY’s Operation Safety ConditionAs it is very well known and appreciated “Safety” is the key concept to be adopted for existence. THY isdetermined to operate with the highest operational standards. Accepting and implementing thestandards dictated by the aviation authorities and manufacturers as the baseline, THY strives to attainsafer operation conditions in respect to continuous development process and appreciates it as a must.Within the frame of this efforts, adoption of Safety Management System approach, implementation ofFlight Data Monitoring (FDM) System, promotion of Voluntary Reporting System, introduction of JustCulture approach, trainings provided in risk assessed flight subjects and publications to flourish awidespread safety culture can be mentioned.In this context, it must be emphasized that THY is qualified as an IOSA operator after the IATAOperational Safety Audit as of April 07, 2006. In addition to the IOSA audit, due to its vast operationnetwork, THY is in active contact with numerous Civil Aviation Authorities and subject to their audits aswell as the audits of codeshared airlines. These audits, as well as providing the opportunity to theauditors to evaluate the current situation, input the required feedback for THY’s safer operation fromthereupon.29
STOCK INFORMATION2002 2003 2004 2005 2006 2007Sales (USD mn) $1,584 $1,791 $2,081 $2,316 $2,832 $3,670Number of Shares ('000) 175,000 175,000 175,000 175,000 175,000 175,000EPS 1.21 0.87 0.46 0.59 0.74 1.28P/E 3.11 5.31 13.32 11.01 6.25 5.78Last Day Closed Price (USD) 3.61 5.55 5.92 6.48 4.60 7.40Last Day Closed Price (NTL) 5.90 7.75 7.95 8.70 6.10 8.602002 2003 2004 2005 2006 2007Avg. High (NTL) 6.38 6.60 8.29 7.65 6.70 8.53Avg. Low (NTL) 6.02 6.33 7.98 7.75 6.49 8.24Average Closed (NTL) 6.20 6.47 8.14 7.70 6.60 8.39Avg. High (USD) $3.90 $4.73 $6.18 $5.70 $4.75 $6.60Avg. Low (USD) $3.68 $4.53 $5.95 $5.78 $4.60 $6.37Average Closed (USD) $3.79 $4.64 $6.07 $5.74 $4.68 $6.49Avg.Daiy Volume (USD mn) $1.00 $1.02 $0.568 $5.88 $9.92 $10.30MCAP (USD mn) - April 3rd, <strong>2008</strong> $ 85330


