INAG 39 P - IPS - Radio and Space Services
INAG 39 P - IPS - Radio and Space Services
INAG 39 P - IPS - Radio and Space Services
- No tags were found...

You also want an ePaper? Increase the reach of your titles
YUMPU automatically turns print PDFs into web optimized ePapers that Google loves.
<strong>INAG</strong> <strong>39</strong> May 1983IONOSPHERIC NETWORK ADVISORY GROUP (<strong>INAG</strong>)*IONOSPHERIC STATION INFORMATION BULLETIN NO. <strong>39</strong>**page1. Introduction 22. Some Comments on Previous <strong>INAG</strong> articles 23. Semi-automatic scaling systems 34. Project ISAAC 45. Station Notes 56. New Zeal<strong>and</strong> Ionosonde Network 57. Format of Australian Ionograms 68. A Three Ionosonde Experiment 69. Slant type sporadic E observed in Australia 810. An example of blanketing, 911. Some comments on Scaling in the presence of lowtype Es 1112. Vertical Incidence Ionospheric Observationsduring I.M.S. 1313. Australian Ionosonde Sites 14* Under the auspices of Commission G, Working Group of the International Union of <strong>Radio</strong> Science (URSI).** Prepared by A S Rodger, British Antarctic Survey, Madingley Road, Cambridge, CB3 OET, U.K. Issuedon behalf of <strong>INAG</strong> by World Data Centre A for Solar Terrestrial Physics, National Oceanic <strong>and</strong>Atmospheric Administration, Boulder, Colorado 80303, USA, This Bulletin is distributed to stationsby the same channels (but in the reverse direction) as their data ultimately flow to WDC-A. Otherswishing to be on the distribution list should notify WDC-A.1
The ship is due to leave Cape Town on 23 June 1983 <strong>and</strong> sail to Gough Isl<strong>and</strong>. From there she will cruise towards the Brazilian coast, turningsouthwards at about 30° S 50° W <strong>and</strong> returning to Cape Town along the 40° S parallel, arriving back about 2 August.Enquiries for space aboard the vessel are welcome, as are all offers of collaboration. The address is:Prof. J.A. GledhillOrganizer, Project I S A A C,Department of Physics <strong>and</strong> Electronics,Rhodes University,GRAHAMSTOWN,6140,South AfricaChairman's Note:This is a good opportunity to promote interest in low latitude particle phenomena at stations all round the world as well as in the South Atlanticzone. Practically nothing is known about the ionospheric effects of such precipitation. The Chairman has seen such effects in a wide range oflongitudes at magnetic latitudes near 22° N <strong>and</strong> S. We badly need to know the morphology of both the world-wide low latitude precipitation zone<strong>and</strong> that associated with the South Atlantic Anomaly. Phenomena to look for include:(i)(ii)(iii)(iv)(v)sudden changes in F-layer structure or Spread-F at night, often associated with increased absorption.large changes in the behaviour of foF2 <strong>and</strong> M(3000)F2 on some storm dayspresence of storm types of Es, typically Es-a.abnormal behaviour of Es on stormy days, e.g. sequences of normal Es becoming scattered (resembling Es-q) <strong>and</strong> sometimes associatedwith Es-s.Abnormally low Es-l especially at night.5. STATION NOTESIlorin, NigeriaA new ionospheric observatory began operating with an <strong>IPS</strong>-42 ionosmeter on 1 October approximately 250 km north of Lagos. Orthogonal wiredelta aerials are used for transmitting <strong>and</strong> receiving with the ionograms recorded on 16 mm. black <strong>and</strong> white film. The data will be analysed using aKEL-46 Data Analyser (<strong>INAG</strong> 38 p. 13). For further information or discussions of possible collaborative work, write to:KochelProfessor John Oyinloye,Dean of Science,University of Ilorin,Ilorin,Nigeria<strong>INAG</strong> has been informed that this station was operational between July 1938 <strong>and</strong> May 1946 with monthly median data produced from July 1940.At present, efforts are being made to procure tabulations or at least monthly medians for inclusion in the World Data Centre system.Turin (Torino), ItalyTurin was not operational between 28 April <strong>and</strong> 15 September, 1982 due to equipment difficulties.Argentine Isl<strong>and</strong>s, AntarcticaAn <strong>IPS</strong>-42 ionosonde has been successfully deployed at Argentine Isl<strong>and</strong>s, <strong>and</strong> became the observatory instrument from 11 January, 1983.6. THE NEW ZEALAND IONOSONDE NETWORKby C.A. Roper, Geophysical Observatory, Christchurch,New Zeal<strong>and</strong>Ionospheric soundings have been made by New Zeal<strong>and</strong> workers since the early 1940's. In the time since then various types of sounder have beenemployed, from home-made h<strong>and</strong>-tuned units through J28's <strong>and</strong> C4's to the New Zeal<strong>and</strong> designed <strong>and</strong> built P's which are now being replaced byKEL-made <strong>IPS</strong>-42 ionosondes.There are three stations in the continuous recording chain. The station at Christchurch is currently located at Godley Head at the entrance toLyttelton Harbour. The technical maintenance is carried out by staff from the Geophysical Observatory in Christchurch. The P2 ionosonde isoperating concurrently with an <strong>IPS</strong>-42 at the new station at Eyrewell. Godley Head is to be replaced by Eyrewell, 40 km away. Operationsat Godley Head are likely to cease in December, 1982 (See <strong>INAG</strong> 38 p. 4).5
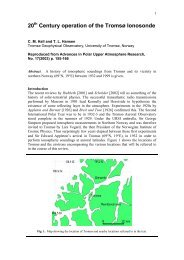
<strong>INAG</strong> <strong>39</strong> May 1983Campbell Isl<strong>and</strong> station has been operating since 1942. It is operated <strong>and</strong> maintained by technicians who are part of the Meteorological <strong>Services</strong>party stationed on the Isl<strong>and</strong> for a year. An <strong>IPS</strong>-42 was installed during August 1982 <strong>and</strong> operated alongside the C2/3 for some time. The latterequipment was returned to New Zeal<strong>and</strong> in November 1982.The ionosonde at Scott Base has been operating since 1957. Staff of the Antarctic Division of DSIR are employed on a yearly basis to operate <strong>and</strong>maintain the scientific equipment at the base. The present P2 equipment will be replaced by an <strong>IPS</strong>-42 in January 1983. The P2 will be returned toNew Zeal<strong>and</strong> later that year.Records from all the ionosondes are returned to the Christchurch offices of the Observatory for detailed interpretation. Six-hourly values of foF2 areread at the stations <strong>and</strong> passed to Christchurch for transmission to the Ionospheric Prediction Service in Australia each week. Scaling of ionogramsis in accordance with URSI st<strong>and</strong>ards. The use of a digitising table <strong>and</strong> a computer program which automatically creates data files <strong>and</strong> checks thedata for consistence with <strong>and</strong> observance of the scaling rules has speeded up the publication of results, reduced the workload <strong>and</strong> improved theaccuracy of the readings.The future of the three stations is assured <strong>and</strong> expansion in research useage of the equipment is currently being discussed.7. FORMAT OF THE AUSTRALIAN IONOGRAMSA number of examples of ionograms recorded on the Australian ionosonde appear in this copy of <strong>INAG</strong>. All the ionograms have the same format asshown in the accompanying diagram.The level displayed on the ionogram between approximately 0 km <strong>and</strong> 80 km gives an indication of receiver gain. When the level is high thereceiver is operating on low gain <strong>and</strong> the echo returned from the ionosphere will probably be too low in intensity to be recorded. A gap will thenappear in the ionogram. trace. Normally, the receiver gain is reduced in response to interfering signals so the level can be used as an indication ofinterference effects on the ionogram.8. A THREE IONOSONDE EXPERIMENTby J. Cooper, Geophysical Observatory, ChristchurchTwo <strong>IPS</strong>-42 ionosondes were available for scientific use near Christchurch, New Zeal<strong>and</strong> during their testing <strong>and</strong> shakedown period beforedeployment at Campbell Isl<strong>and</strong> <strong>and</strong> Scott Base (<strong>INAG</strong> 38, page 4). A triangular array was set up with ionosondes at Godley Head, EyrewellMagnetic Station <strong>and</strong> the University of Canterbury Physics Field station at Birdlings Flat. These sites are separated by about 40 km <strong>and</strong> theirpositions show in the figure
The sequence of ionograms for the three stations recorded at five-minute intervals on 8 June, 1982 is shown on the next page. Station identificationis as follows:4226 - Godley Head4227 - Eyrewell4228 - Birdlings Flat6<strong>INAG</strong> <strong>39</strong> May 1983
<strong>INAG</strong> <strong>39</strong> May 1983The ionosonde data for the 8th June have been analysed in several different ways.The data for day 159 has been analysed in several different ways:(1) The speed <strong>and</strong> direction of disturbances have been found from timelags obtained from direct visual comparison.(2) The F1-transition analysis of King (1969) <strong>and</strong> Lawden (1969) has been used to determine ledge shape height profiles of electronconcentration <strong>and</strong> the production rate of ionisation in the F1 region.(3) The results of a correlation analysis of the virtual height changes between stations have been compared with those of (1).(4) True-height reductions are to be performed in the near future.Theoretical work in support of the experimental analysis includes ray-tracing studies of radio-waves propagation in a distorted ionosphere, whichhas largely successfully reproduced the ionogram traces observed in the F2 region, <strong>and</strong> a calculation of the wind <strong>and</strong> changes in production ofionisation near the Fl peak arising from this passage; consequently, the shape of the Fl layer internal gravity waves.A paper on this work is in preparation.ReferencesKing, C.A.M., J. Atmos. Terr. Phys., 31, 515, (1969).Lawden, M.D., J. Atmos. Terrestrial Phys., 31, 47(1969).Some Comments by Alan RodgerThe sequence of ionograms presented by Dr. Cooper are an excellent illustration of some of the similarities <strong>and</strong> differences which can be observedin the ionosphere over a comparatively short distance. At a first glance the ionograms from Godley Head <strong>and</strong> Eyrewell show very similar first orderF region traces through most of the sequence shown. The ionograms from Birdlings Flat show some differences to the ionograms from the otherstations at the same time. However, closer comparison of the ionograms shows that the F region traces at Birdlings Flat are almost identicallyreproduced 5 minutes later at the other two stations, for example, compare 1250 at Birdlings Flat with 1255 at the other observatories.This strongly suggests that the disturbance is travelling in a geographically north-east direction, i.e. in the magnetic meridian <strong>and</strong> assuming it has aplane wave front, then the speed is approximately 360 km/hour which is a typical speed for a medium scale travelling ionospheric disturbance.The number <strong>and</strong> frequency extent of the multiple order traces (see UAG-23A, pages 15 - 17) on the Godley Head ionograms is consistently greaterthan on the Eyrewell ionogram suggesting that the overall sensitivity of the equipment at Godley Head is higher than at Eyrewell. Also, fmin isconsistently lower at Godley Head than at Eyrewell providing confirmation of the observation.The receiver sensitivity at the two stations appears to be similar as indicated by the line in the 0-50 km height range. Thus, the difference insensitivity of equipments at the two sites probably results from a difference in the antennae used. Overall system sensitivity may be responsible forthe differences in foEs observed between Eyrewell <strong>and</strong> Godley Head, though additional information would be required to test this hypothesis.9. SLANT TYPE SPORADIC E OBSERVED IN AUSTRALIAby P.J. Wilkinson, <strong>IPS</strong>, AustraliaSlant type sporadic E has been seen at Townsville (19° S Geographic (GG), 28° S Geomagnetic (GM) <strong>and</strong> 48° S dip(D)), Canberra (35° S GG, 44° SGM, 66° S D), Sydney (34° S GG) <strong>and</strong> Hobart (43° S GG, 52° S GM <strong>and</strong> 73° S D). An example is enclosed here for Hobart. On this particular dayslant types Es was observed between 1745 <strong>and</strong> 1900. During this period examples similar to those presented in <strong>INAG</strong> 35, P8 were observed <strong>and</strong> inaddition splitting of the slant into two traces was observed as shown in the 1840 ionogram.
During the summer of 1981-82 slant Es when present was most frequently seen in the late afternoon <strong>and</strong> legs often in the morning around07-08LT. This is typical for the Hobart station.On the occasions when slant Es was observed at Sydney, a similar event was not seen at Canberra (about 180 miles away) suggesting this could bequite a localised phenomenon although, the transitory nature of the event reduces the significance of this result. To date, no obvious lacuna eventhas been observed in association with slant Es.A more careful study will be made of the occurrence of slant Es at Australian stations in the future.Some Comments on Es-s by Alan RodgerThe work of Oleson <strong>and</strong> colleagues in the northern hemisphere <strong>and</strong> Sylvain <strong>and</strong> others in the south (see <strong>INAG</strong> 35, page 5 for references) haveprovided us with a good description of the conditions under which Es-s is observed in the auroral ozone <strong>and</strong> polar cap. However, since thepublication of the Es-s example from Wuhang in <strong>INAG</strong> 35 page 8, a considerable interest in the phenomena at lower latitudes has been aroused.Dr. Wilkinson's example above further illustrates that Es-s is not uniquely a polar feature. There is a very real need for further observations of Es-s<strong>and</strong> this provides an ideal opportunity for ionogram scalers at all latitudes to make a major contribution to our underst<strong>and</strong>ing of the ionosphere bynoting with particular care occasions when Es-s is observed. Present theory for the formation of Es-s at high latitude requires a very large electricfield (15 mVm -1 ) to be present. Fields of this magnitude are thought to be very rare outside polar regions.I have not seen many examples from stations equator ward of the auroral zone, but the nature of the Es-s observed at these lower latitudes doesappear to be different in a number of respects. For example, Es-s at lower latitudes does not appear to be such a weak <strong>and</strong> intermittent trace as isnormally observed at higher latitudes. The occurrence of Es-s at lower latitudes does not appear to be associated with increased absorption in thefrequency range of the Es-s or with increases in fmin as is frequently seen at higher latitudes. Lacuna with lower latitude events is rare or absent.To date I have not seen an example of an Es-s layer from lower latitudes which extends significantly above fxE in frequency; this contrasts stronglywith high latitudes, e.g. UAG-23A, page 57. Many more observations of Es-s are necessary especially from magnetic mid <strong>and</strong> low latitudes beforethese impressions can be confirmed.8<strong>INAG</strong> <strong>39</strong> May 1983The types of question which an ionogram scaler could answer are:-a) When does Es-s occur? i) time of dayii) seasoniii) solar cycleb) What phenomena seem to be related to the occurrence of Es-s? At high latitudes lacuna is very strongly associated, but at otherlatitudes large changes in foF2 or virtual height of the layer might be seen or even local thunderstorms might be present (as these can be asource of electric fields in the ionosphere).c) Is there any relationship between the occurrence of Es-s <strong>and</strong> magnetic storms?d) Is the appearance of the Es-s traces always strong, always weak or variable? Under what conditions does the appearance of the layerchange?e) Is the rise in virtual height of the Es-s layer with increasing frequency always the same? If not, how does it vary?f) If ionogram scalers can combine data from more than one observatory, what is the spatial extent of individual cases? Dr. Wilkinson notesan occasion when Es-s is not observed at a station 180 km away. Is this normal?I would encourage ionogram scalers to send further examples to <strong>INAG</strong> <strong>and</strong> the results of any analysis which they can carry out.Date 1 February, 1982Place Townsville (19° S - 147° E)Question How should foF2 <strong>and</strong> fbEs be scaled at 1800?10. AN EXAMPLE OF BLANKETING?by P.J. Wilkinson, Ionospheric Prediction Service, AustraliaSummary A sporadic E layer appears to be blanketing the F region. However, from the sequence, foF2 > ftEs suggesting blanketing is notthe entire explanation. Two other possible contributing factors are interference <strong>and</strong> tilts in the F region. (The ionograms are otherwise quite normalfor this time of the day).
9<strong>INAG</strong> <strong>39</strong> May 19831 . TiltsArguments for a tilted F2 region.- 2F, although weak <strong>and</strong> possibly defocused, is present.- the lower F1 region shows significant changes on each 15 minute ionogram.
Arguments against tilted F2 region.- foF2 <strong>and</strong> most of the trace above 6MHz is unchanged between 1730 <strong>and</strong> 1830.Conclusion: The stability of the F2 region is strong evidence against the presence of tilts. A tilt large enough to cause F2 lacuna would normallyshow some precursor. The tilts in the F1 region are not unusual for this time of day <strong>and</strong> at most would only affect returns below 5.6MHz. A tilt ispossible only as a subsidiary effect.2. InterferenceArguments for interference- There is some evidence for a change in interference between 1745 <strong>and</strong> 1800.On a 4B ionosonde, interference results in a reduction of receiver gain, the change in gain being displayed between 0 <strong>and</strong> 50 km onthe ionogram. There is a slight AGC gain change apparent between ftEs <strong>and</strong> 8MHz.Arguments against interference- Similar AGC gain changes are evident at 1815 which have little effect on the ionogram.Conclusion: There is some evidence for interference effects <strong>and</strong> if foF2 were already a weak trace, the drop in gain might be sufficient to eliminateit. However, this would not eliminate fxF2 also. Interference could contribute, but it is probably a subsidiary effect.3. BlanketingArguments for blanketing- the sporadic E layer is blanketing at 1745, <strong>and</strong> foEs is significantly higher at 1815.- fbEs is dropping between 1815 <strong>and</strong> 1830 suggesting blanketing could have been higher still at 1800.- 2ftEs >1ftEs (just) at 1815 suggesting the Es layer contains blobs of more intense ionization. The satellite first-order Es tracesuggests similar structure.Arguments against blanketing- 2ftEs >1ftEs by over 2MHz so probably fbEs is less than foF2 by 2MHz.- 2F, although weak, appears to be present.- ftEs will be the x-component <strong>and</strong> there is some evidence for foEs being less than ftEs. Even if the Es layer is blanketing to ftEs, then F layerO-Mode trace should be present.Conclusion: Although there is strong evidence for blanketing there does not appear to be evidence for the sporadic E layer to be totally blanketingup to ftEs.Summary- Although some blanketing is certainly present, there does not appear to be good evidence for total blanketing above 2ftEs.- Interference could possibly prevent the F2 region being seen above ftEs.- Tilts in the lower F1 region may result in blanketing of this layer while still allowing 2F, N <strong>and</strong> M echoes to be observed below 5.6 MHz.However, there appears to be no good evidence for tilts in the F2 region.- Allowing this, there is still a gap between 2ftEs <strong>and</strong> 1ftEs where some F2 return would be expected.Suggested scaling:fbEs = 2ftEs = 056foF2= 076IASome additional comments on this blanketing exampleby Alan RodgerDr. Wilkinson has provided a very good summary of the arguments which can be used for interpreting this interesting sequence. However, it shouldbe noted that there is a strong indication of a small tilt in the F2 region on the 1745LT ionogram: The height of this second-order trace at 4.0 MHzis slightly less than twice that of the first order. See section 2.72 of UAG-23A for a discussion of small tilts. This combined with the observationsmade by Dr. Wilkinson that foEs <strong>and</strong> fbEs are both changing relatively quickly with time, <strong>and</strong> that 2ftEs >1ftEs at 1815 strongly suggests thatblanketing is responsible for the missing F layer at 1800. The sketch shows a possible configuration of the iso-ionic contour for 1800 <strong>and</strong> illustrateshow the F-layer can be blanketed, yet the ionogram shows a lower value of foEs than necessary to cause the loss of the F region traces.10<strong>INAG</strong> <strong>39</strong> May 1983
The small numbers in the Es layer indicate contours of equal plasma frequency (MHz).The tilt of the F-region is exaggerated for clarity but could be just a few degrees.The often under-used qualifying letter I, indicating an interpolated value for foF2,is correctly used.It should also be possible to determine an interpolated value for M(3000)F2.Chairman's note.- When N-,(E + F), M-,(2F + E) or higher multiple reflections are present (UAG-23A, pp 15 - 17), these can give additionalinformation on both the variation of fbEs with position <strong>and</strong> the tilt. In general, consistency between the top frequencies at Es, 2Es, 3Es...., M's <strong>and</strong>N's or both, implies that the critical frequency of the Es cloud is either not changing with position or that all echoes are coming from the samedirection; usually the latter. When this is not true, M <strong>and</strong> N reflections are usually further from the station than the Es multiples. A large differencebetween fbEs, as shown by the F-trace (fminF) <strong>and</strong> as shown by the multiples of Es or M <strong>and</strong> N traces means that one or both reflecting structuresmust be tilted. In cases I have been able to check, the Es has been most often the tilted layer. However, it is easy to cause tilts in the lower part ofthe F-layer. When this occurs the F-layer trace is usually weak, becoming stronger at the true overhead fbEs. We badly need echo location studies(skymap) to confirm my interpretation. Unfortunately most height measurements are only accurate to 5 km, thus quite significant tilts in the Eslayers cannot be distinguished.1. Scaling h'E11. SOME COMMENTS ON SCALING IN THE PRESENCE OF LOW TYPE ESby G.T. Goldstone <strong>and</strong> P.J. Wilkinson.Ionospheric Prediction Service, Australia.The <strong>INAG</strong> recommendation "that low type sporadic E traces with foEs <strong>and</strong> fbEs less than foE should be ignored" has been adopted by <strong>IPS</strong>.The adoption of this rule removes an anomaly that had previously occurred when scaling WE in the presence of a low sporadic layer. A localconvention which arose in <strong>IPS</strong> has now been eliminated. The convention is demonstrated by the three scalings for the Hobart ionogram1530.Type of Es foEs fbEs h'E Comment1. 1 020-G Y 110UY Incorrect use of Y2. 1 020-G G 110UB Acceptable3. 1 020-G 110UB NormalScaling 1 demonstrates the convention once adopted by <strong>IPS</strong> but disputed for some time by Mr. Goldstone. A descriptor Y was used to denote a gapin the trace. Scaling 2 would be an acceptable scaling if foEs <strong>and</strong> fbEs are to be scaled for the low type Es layer. However, case 3 is the normalconvention adopted by <strong>IPS</strong> now. (Note: there is in fact a second layer with foEs > foE present so foEs <strong>and</strong> fbEs would be scaled for this layer butfor the purposes of this discussion the cusp Es is ignored).The descriptive letter B is used to indicate why WE cannot be accurately measured. This makes the very reasonable assumption that the absorptionis occurring to the normal E region trace between the visible normal E trace <strong>and</strong> the low sporadic E layer.2. Is low type Es due to partial reflections?
If the low type Es layer (see 1530 ionogram) is a partial reflection, then it is also probably only a weak return made to look strong by the echoprocessing <strong>and</strong> display characteristics of the Australian Ionospheric Prediction Service 4B ionosonde, (the 4B ionosonde is virtually identical tothe commercially produced <strong>IPS</strong>-42 ionosonde). If the 4B is accentuating a weak return so that it can be mistaken for a strong return then thiswould obviously cause concern. However, this does not appear to be the case for low type Es reflections observed at Australian stations above thegyro-frequency. Such a belief is supported by the multiple of the low Es layer seen on the 1745 Hobart ionogram. Also, low Es layer seen on theSydney ionosonde, which is co-sited with an A1 vertical absorption experiment, appear quite dramatically on the Al as total reflections,the normal E region being blanketed. Not all low type Es can be dismissed as partial (<strong>and</strong> therefore weak) echoes.Consistent with comments made in the Australian Operator's Conference report (<strong>INAG</strong> 36, P10), <strong>IPS</strong> would scale fmin from the low type Es layer<strong>and</strong> always include low type as the second Es type. If no other sporadic E layer is present the type only is recorded. No value is givenfor foEs or fbEs unless foEs is greater than foE.11<strong>INAG</strong> <strong>39</strong> May 19833. Inconsistency in figures showing the z-mode.There is an inconsistency between figures 1.4a, 1.5 <strong>and</strong> 1.6 in describing the z-mode in UAG-23A.Figures 1.4a to c correctly portray the relative positions of the x- o- <strong>and</strong> z- modes for a single reflecting layer. However, in figure1.5 <strong>and</strong> 1.6 there is a distinct turnup in the o-component near fzE. This is accentuated in UAG 23 for the same diagrams. In figure 1.6the end of the o- component clearly stops at fzE. Both these diagrams are in conflict with figure 1.4a where the o- component passescontinuously through fzEas expected.While these diagram are probably good generalisations of real ionogram, it seems unreasonable to show any turnup or to terminate the o-component in the special position it occupies in figure 1.6; at fzE.These diagrams were used by Rodger (<strong>INAG</strong> 34, P14) as partial justification for identifying traces on ionogram below the gyro-frequency asz-mode echoes. Unfortunately, the inconsistency between the figures has resulted in some doubts at <strong>IPS</strong> about Rodger's identifications.In the absence of absorption, both o- <strong>and</strong> z- modes could be present in all the examples discussed by Rodger. However, all theseexamples show only one obvious mode. Either the o-mode is not present, absorption being greater for the o-mode than the z-mode, or thecoupling process for the z-mode is not effective. It is not obvious that the two modes can be simply resolved on the basis of a singleionogram.In fact, all the examples quoted look like low type Es. In particular, the example from UAG 50, P79 carried the additional comment that theh'E would normally be expected to be 130 km whereas the trace at 0.5 MHz, identified as a z-trace, appears closer to 90 km.4. Scaling fmin.At <strong>IPS</strong> we always scale fmin as the lowest frequency at which echoes are observed on an ionogram thereby treating fmin primarily as anequipment parameter.As the 4B ionosonde has a low frequency limit of l.0MHz, <strong>and</strong> echoes would not normally be seen below l.6MHz due to broadcastinterference, the question of which magnetoionic mode is being scaled for fmin rarely arises. However, if the z-mode echo is obviously lowestfrequency observed, fmin would be scaled from it <strong>and</strong> described by z.When fmin is scaled from a low Es layer, the presence of a low type Es is always recorded. This means fmin can later be used for absorptionstudies, all values measured from low type sporadic E being treated separately.By regarding fmin first as an equipment parameter <strong>and</strong> second as an absorption parameter the problem of dealing with weak traces <strong>and</strong>different magneto-ionic components is eased. Any echo presence indicates the ionosonde is operating <strong>and</strong> should be used for scaling fmin.By appropriate use of Es types <strong>and</strong> use of descriptors for fmin (i.e. z) some of the integrity of fmin as an absorption index can also beretained for statistical studies.If fmin is to be used first as an absorption parameter then the points raised by Rodger in <strong>INAG</strong> 34 are most important. It would possiblybe preferable, in this case, for <strong>INAG</strong> to consider introducing a further parameter as an optional alternative to fmin.
Chairman's comment on section 3, z-, o-, x- traces below the gyro-frequency:- This problem has been described more fully in the I.Q.S.Y. Guide toV.I. sounding. Actually the inconsistency is apparent rather than real. It is due to the different behaviour for thick <strong>and</strong> thin layers, <strong>and</strong> to the heightat which critical coupling occurs. Unfortunately, magneto-ionic theory as applied below the gyro-frequency has not had attention in recent years<strong>and</strong> the main points are now forgotten. Perhaps the easiest way of seeing what is happening is to remember that below the critical collisionfrequency both modes behave as if they were z-mode. Near this level a full wave analysis is essential <strong>and</strong> shows that the o-mode retardation isimposed on the z-mode. Coupling occurs over a range of frequencies giving rise to partial reflection phenomena. This was first noticedexperimentally on F-layer reflections in the presence of a thick E-layer (foE at night is usually near 0.5 - 0.6 MHz). For a thin layer there is noretardation, so no anomaly in o-mode at fzEs. For a simple layer the retardation is not seen as the o mode on the frequencies near fzEs is reflectedbelow the levels where group retardation is found.Ray-tracing (preferably full wave) studies show that the coupling depends upon the electron density <strong>and</strong> its gradient near the level of criticalcoupling. The deviative absorption is always greater for the o-mode than for the z-mode; non-deviative absorption shows the same type ofdifference at levels above the critical coupling level. The clean z-mode trace often seen when weak Spread-F is present, is due to an entirelydifferent mechanism - the energy of the o-mode signal is scattered so that some travels along the field line <strong>and</strong> is reflected at fzF2.12<strong>INAG</strong> <strong>39</strong> May 1983Chairman's comment on section 4, fmin:- I concur. <strong>INAG</strong> has already introduced fm2 as an optional parameter to measure absorption when fmin isnot usable. It has had some limited use by the Chairman <strong>and</strong> his colleagues, particularly for eclipse studies where fmin <strong>and</strong> fm2 variations are outof phase. Otherwise there has been no interest from most of the community. This is regrettable. One area of possible use would be in studies ofthe absorption peaks near 25 0 magnetic latitude; these can show regular anomalies in the decimal variation of absorption.12. VERTICAL INCIDENCE IONOSPHERIC OBSERVATIONS DURING THE INTERNATIONAL MAGNETOSPHERIC STUDY, 1976 - 1979The map reproduced below shows the locations of the vertical incidence ionospheric observations which were operating during the InternationalMagnetospheric Study 1976 - 1979 <strong>and</strong> have submitted data to the World Data Center A in Boulder. The map has been prepared by RaymondConkright <strong>and</strong> colleagues. Not all the operating observatories identified by a large closed circle have had tMI-s-name reproduced but for thoseinterested, it should be possible to determine the station from its geographic co-ordinates in conjunction with the master tests (<strong>INAG</strong> 37, p.7,UAG - 38 or UAG-54).
<strong>INAG</strong> <strong>39</strong> May 19831313. AUSTRALIAN IONOSONDE SITESThe map produced by Mr. David Varvel of KEL Aerospace, Australia shows the locations of <strong>IPS</strong>-42, 4A <strong>and</strong> 4B ionosondes as of November, 1982.The commercially built <strong>IPS</strong>-42 ionosondes carry a four figure station identifier number, the first two numbers of which are always 42. Forconvenience, only the last two numbers are displayed on the map. The earlier 4A <strong>and</strong> 4B ionosondes, built at the Ionospheric Prediction Servicecarry only a two figure station identification number (running currently from 1 to 16). Where this causes duplication on the map, the full <strong>IPS</strong>-42number has been used. Geographic co-ordinates of stations not included in the list of stations (<strong>INAG</strong> 37, pp. 7-13) are given in brackets.00 SYDNEY 08 TOWNSVILLE01 09 HOBART02 SYDNEY 10 VANIMO03 MAWSON04 SALISBURY 11 NORFOLK ISLAND05 PORT MORESBY 12 IBADAN06 CANBERRA 13 SASKATOON07 CAMBRIDGE 14 BRISBANE42/14 BOULDER 33 BUENOS AIRES15 MUNDARING 34 BANDOENG16 WUHAN 35 BANDOENG17 PEIPING 36 CARACAS18 LEICESTER (10.3N 293.0E)19 SLOUGH 37 CARACAS20 TANGERANG 38 CHUNGE-LI<strong>39</strong> BEOGRAD40 HERMANUS21 PAMEUNGPEUK(7.40S107.4E)22 PAMEUNGPEUK 41 BUENOS AIRES23 MENLO PARK 42 LANNION(Alternative 43 DAKARnow STANFORD) 44 ILORIN24 BEKESCSABA (8.3N 4.4E)25 DE BILT 45 BAGHDAD26 CAMPBELL ISLAND (33.2N 44.2E)27 SCOTT BASE 46 BAGHDAD28 CHITA29 SOUTH POLE30 SYDNEY31 ARGENTINE ISLANDS32 JOHANNESBURG