SAB Year 6 Answers p121 - Cambridge University Press
SAB Year 6 Answers p121 - Cambridge University Press
SAB Year 6 Answers p121 - Cambridge University Press

You also want an ePaper? Increase the reach of your titles
YUMPU automatically turns print PDFs into web optimized ePapers that Google loves.
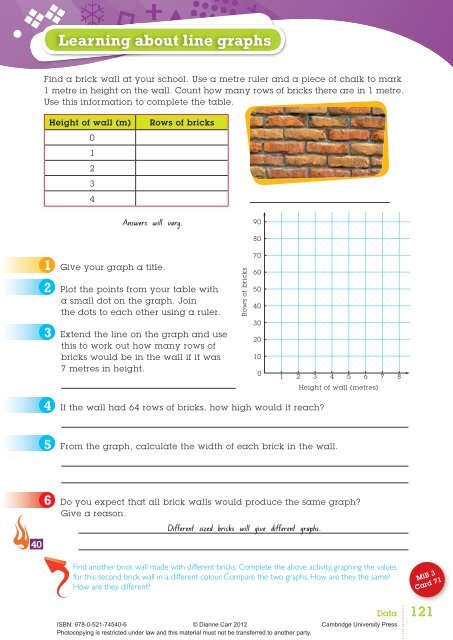
Constructing line graphsLength of baby/HQJKWRIEDE\1 The length of a baby was recorded over thefirst 6 months of its life. The results are shownin the table. Graph this data on the set ofaxes provided. Give the graph a title.Age of babyLength of baby1 month 57 cm3 months 63 cm4 months 65 cm6 months 70 cmLength (cm)9080706050a Explain why this graph should not have a dot where the two axes meet.The axes meet at (0,0) implying that at age 0, the baby wouldbe at length 0cm.1 2 3 4 5 6Age (months)b Extend the line of your graph and use it to find the approximate length ofthe baby at birth.At birth, the baby would have been approximately 55cm long.2 The amount the Wilson family paid forelectricity in 2008 is shown in the table.DateElectricity billMarch 2008 $225.00June 2008 $240.50September 2008 $241.00December 2008 $265.50$500$450$400$350$300$2500RQWKO\HOHFWULFLW\ELOOMonthly electricity bills122a Give the graph a title.b Label the axes and complete the scales.cGraph the data from the table andconnect each point by a line.2008d Does it make sense for the point where theaxes meet to be included in the data? If so, add it to the graph.Data$240$235$230$225ISBN: 978-0-521-74540-6© Dianne Carr 2012Photocopying is restricted under law and this material must not be transferred to another party.Jan08March2008JuneSep2008Dec2008Mar2009<strong>Cambridge</strong> <strong>University</strong> <strong>Press</strong>
Misleading graphs42Look at each of the graphs below. In each graph, identify one feature that makesthe graph misleading, and explain why it is misleading.1Pets ownedKey=2=2=2=225040302010Total days absent from schoolFish Cats Birds DogsMaryJohnJamesSarahUnderstanding the keyBars are of various widthscould be difficult3$485000$480000House prices – Smith St4Fancy-dress theme preferencesOther 3%Groovy4%$475000$470000$465000$460000Rock ‘n’Roll40%Underthe Sea53%2007200820092010Inaccurate key (x–axis)‘Under the Sea‘, with 53%, is takingup a too great proportion of the circle.ISBN: 978-0-521-74540-6© Dianne Carr 2012Photocopying is restricted under law and this material must not be transferred to another party.Data<strong>Cambridge</strong> <strong>University</strong> <strong>Press</strong>125
Constructing stem and leaf plotsUse the data provided to complete the stem and leaf plots.1 The numbers in bold have been placed on the stem and leaf plot for you.Place the other numbers into the correct positions.6 0 2 3Data:106 84 6075 62 105112 117 6378 88 117117 88 11381 117 1177 5 88 1 4 8 8910 5 611 2 3 7 7 7 7 72 Place the data below into the stem and leaf plot19 0 2Data:231 226 207190 209 220232 219 203218 220 208205 220 228192 203 23420 3 3 5 7 821 822 0 0 0 6 823 1 8 4243 Use the data below to construct a stem and leaf plot.25 7Data:300 293 281289 294 302283 288 314257 307 299301 312 297281 292 28628 1 1 3 6 8 929 2 3 4 7 930 0 1 2 4 731 2126DataISBN: 978-0-521-74540-6© Dianne Carr 2012Photocopying is restricted under law and this material must not be transferred to another party.<strong>Cambridge</strong> <strong>University</strong> <strong>Press</strong>
Samples and populations1 Identify the population and an example of a sample that could be collectedto answer each of these questionsa How many mature fish are in a large lake?Population:Fish in the lakeSample:Fish caught by a fishing boat in one dayb What insects live in your backyard?Population:Insects found in your backyardSample:Insects caught in a box left out overnightcShould a new skate park be built in your suburb?Population:People who live in your suburbSample:Survey sent to every house in the suburbd Which dog breed is the most popular in Australia?Population:Dog breeds found in AustraliaSample:Survey of people attending a dog show2 For each situation listed below decide if a census or a sample is the mostappropriate way to collect the data required.a The average number of apples on a tree:Sampleb The number of grains of rice in a 100 g packet:SamplecA change to Australia’s constitution:Censusd The number 1 song this week in Australia:CensuseThe most watched show on TV at 7:30 p.m. Friday:Census3 Are the samples that have been taken in each situation below appropriate?Why? Why not?a How should <strong>Year</strong> 6 celebrate their graduation?Sample: Parents present at a ‘Parents and Friends’ meeting.No – should ask the students, not their parents.b What is the best children’s book of the year?Sample: Librarians from public libraries.No – should ask people who actually read children’s books.ISBN: 978-0-521-74540-6© Dianne Carr 2012Photocopying is restricted under law and this material must not be transferred to another party.Data<strong>Cambridge</strong> <strong>University</strong> <strong>Press</strong>127