2010 Barley Quality - Montana Wheat & Barley Committee
2010 Barley Quality - Montana Wheat & Barley Committee
2010 Barley Quality - Montana Wheat & Barley Committee

Create successful ePaper yourself
Turn your PDF publications into a flip-book with our unique Google optimized e-Paper software.
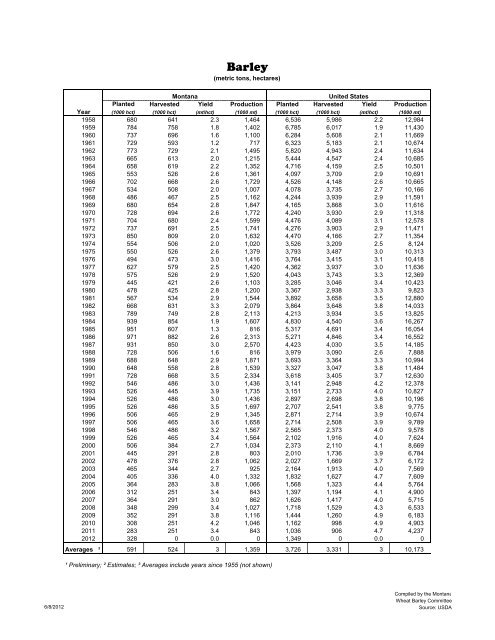
<strong>Barley</strong>(metric tons, hectares)<strong>Montana</strong>United StatesPlanted Harvested Yield Production Planted Harvested Yield ProductionYear (1000 hct) (1000 hct) (mt/hct) (1000 mt) (1000 hct) (1000 hct) (mt/hct) (1000 mt)1958 680 641 2.3 1,464 6,536 5,986 2.2 12,9841959 784 758 1.8 1,402 6,785 6,017 1.9 11,4301960 737 696 1.6 1,100 6,284 5,608 2.1 11,6691961 729 593 1.2 717 6,323 5,183 2.1 10,6741962 773 729 2.1 1,495 5,820 4,943 2.4 11,6341963 665 613 2.0 1,215 5,444 4,547 2.4 10,6851964 658 619 2.2 1,352 4,716 4,159 2.5 10,5011965 553 526 2.6 1,361 4,097 3,709 2.9 10,6911966 702 668 2.6 1,729 4,526 4,148 2.6 10,6651967 534 508 2.0 1,007 4,078 3,735 2.7 10,1661968 486 467 2.5 1,162 4,244 3,939 2.9 11,5911969 680 654 2.8 1,847 4,165 3,868 3.0 11,6161970 728 694 2.6 1,772 4,240 3,930 2.9 11,3181971 704 680 2.4 1,599 4,476 4,089 3.1 12,5781972 737 691 2.5 1,741 4,276 3,903 2.9 11,4711973 850 809 2.0 1,632 4,470 4,166 2.7 11,3541974 554 506 2.0 1,020 3,526 3,209 2.5 8,1241975 550 526 2.6 1,379 3,793 3,487 3.0 10,3131976 494 473 3.0 1,416 3,764 3,415 3.1 10,4181977 627 579 2.5 1,420 4,362 3,937 3.0 11,6361978 575 526 2.9 1,520 4,043 3,743 3.3 12,3691979 445 421 2.6 1,103 3,285 3,046 3.4 10,4231980 478 425 2.8 1,200 3,367 2,938 3.3 9,8231981 567 534 2.9 1,544 3,892 3,658 3.5 12,8801982 668 631 3.3 2,079 3,864 3,648 3.8 14,0331983 789 749 2.8 2,113 4,213 3,934 3.5 13,8251984 939 854 1.9 1,607 4,830 4,540 3.6 16,2671985 951 607 1.3 816 5,317 4,691 3.4 16,0541986 971 882 2.6 2,313 5,271 4,846 3.4 16,5521987 931 850 3.0 2,570 4,423 4,030 3.5 14,1851988 728 506 1.6 816 3,979 3,090 2.6 7,8881989 688 648 2.9 1,871 3,693 3,364 3.3 10,9941990 648 558 2.8 1,539 3,327 3,047 3.8 11,4841991 728 668 3.5 2,334 3,618 3,405 3.7 12,6301992 546 486 3.0 1,436 3,141 2,948 4.2 12,3781993 526 445 3.9 1,735 3,151 2,733 4.0 10,8271994 526 486 3.0 1,436 2,897 2,698 3.8 10,1961995 526 486 3.5 1,697 2,707 2,541 3.8 9,7751996 506 465 2.9 1,345 2,871 2,714 3.9 10,6741997 506 465 3.6 1,658 2,714 2,508 3.9 9,7891998 546 486 3.2 1,567 2,565 2,373 4.0 9,5781999 526 465 3.4 1,564 2,102 1,916 4.0 7,6242000 506 384 2.7 1,034 2,373 2,110 4.1 8,6692001 445 291 2.8 803 2,010 1,736 3.9 6,7842002 478 376 2.8 1,062 2,027 1,669 3.7 6,1722003 465 344 2.7 925 2,164 1,913 4.0 7,5692004 405 336 4.0 1,332 1,832 1,627 4.7 7,6092005 364 283 3.8 1,066 1,568 1,323 4.4 5,7642006 312 251 3.4 843 1,397 1,194 4.1 4,9002007 364 291 3.0 862 1,626 1,417 4.0 5,7152008 348 299 3.4 1,027 1,718 1,529 4.3 6,5332009 352 291 3.8 1,116 1,444 1,260 4.9 6,183<strong>2010</strong> 308 251 4.2 1,046 1,162 998 4.9 4,9032011 283 251 3.4 843 1,036 906 4.7 4,2372012 328 0 0.0 0 1,349 0 0.0 0Averages ³ 591 524 3 1,359 3,726 3,331 3 10,173¹ Preliminary; ² Estimates; ³ Averages include years since 1955 (not shown)6/8/2012Compiled by the <strong>Montana</strong><strong>Wheat</strong> <strong>Barley</strong> <strong>Committee</strong>Source: USDA