INTERIM REPORT - The Link REIT
INTERIM REPORT - The Link REIT
INTERIM REPORT - The Link REIT
- No tags were found...

Create successful ePaper yourself
Turn your PDF publications into a flip-book with our unique Google optimized e-Paper software.
<strong>The</strong> <strong>Link</strong> Real Estate Investment TrustStock Code:823<strong>INTERIM</strong> <strong>REPORT</strong>2011/2012
VISIONTo be a world class real estate investor and managerserving and improving the lives of those around usMISSIONBuilding relationships with our stakeholders through• Providing value and quality service• Partnering with local communities• Delivering sustainable growthVALUESManaging and operating our business with• Respect• Excellence• Integrity• Teamwork2<strong>The</strong> <strong>Link</strong> Real Estate Investment Trust
CONTENTSCorporate Profile 2Highlights for the six months ended 30 September 2011 4Chairman’s Statement 6Report of the Chief Executive Officer 8Our GovernanceCorporate Governance 28Long-term Incentive Plan 30Interests of Substantial Unitholders, Directors and Connected Persons 33Connected Party Transactions 35Investor Relations 38Auditor’s Review Report 39Condensed Consolidated Interim Financial InformationCondensed Consolidated Income Statement 40Condensed Consolidated Statement of Comprehensive Income 41Consolidated Statement of Distributions 42Condensed Consolidated Statement of Financial Position 43Condensed Consolidated Statement of Changes in Equity and44Net Assets Attributable to UnitholdersCondensed Consolidated Statement of Cash Flows 45Notes to the Condensed Consolidated Interim Financial Information 46Five Year Performance Summary 68Financial Calendar 71Corporate Informationinside backInterim Report 2011/20123
CORPORATE PROFILE<strong>The</strong> <strong>Link</strong> <strong>REIT</strong><strong>The</strong> <strong>Link</strong> Real Estate Investment Trust (“<strong>The</strong> <strong>Link</strong> <strong>REIT</strong>”) is the first real estate investment trustin Hong Kong and currently the largest in Asia in terms of market capitalisation. Wholly owned byprivate and institutional investors, <strong>The</strong> <strong>Link</strong> <strong>REIT</strong> has been listed on <strong>The</strong> Stock Exchange of HongKong Limited (the “Hong Kong Stock Exchange”) since 25 November 2005.As at 30 September 2011, the portfolio consists of properties with an internal floor area (“IFA”) ofapproximately 11 million square feet (“sq ft”) of retail space and approximately 80,000 car parkspaces.<strong>The</strong> portfolio’s retail facilities, located on the doorstep of over 40% of Hong Kong’s households,primarily serve the daily needs of people in Hong Kong. <strong>The</strong> car parks mainly serve tenants andcustomers of the retail facilities and residents of the surrounding neighbourhoods.<strong>The</strong> current investment strategy of <strong>The</strong> <strong>Link</strong> <strong>REIT</strong>’s manager, <strong>The</strong> <strong>Link</strong> Management Limited(the “Manager”), is to invest in sustainable income producing properties in Hong Kong that aremainly for retail and car park use and to maximise their value through asset enhancement worksencompassing physical structure, trade-mix, customer service and promotional activities. Asthese enhancement projects progress, the portfolio offers customers a better shopping experiencewith more choices at reasonable prices, whilst improving returns for unitholders of <strong>The</strong> <strong>Link</strong> <strong>REIT</strong>(“Unitholders”).<strong>The</strong> Manager is licensed by the Securities and Futures Commission (the “SFC”) to conduct theregulated activity of asset management and is responsible for managing <strong>The</strong> <strong>Link</strong> <strong>REIT</strong>’s portfolio ofproperties.2<strong>The</strong> <strong>Link</strong> Real Estate Investment Trust
THE LINK <strong>REIT</strong>'S PROPERTIES PORTFOLIOSheung ShuiFanlingTin Shui WaiYuen LongNew TerritoriesTai PoShatinMa On ShanTuen MunTsuen WanTsing YiSham Shui PoWong Tai SinKowloonTseungKwan OHung HomTung ChungLantau IslandAberdeenHong KongChai WanAp Lei ChauStanleyDisneyland Resort LineTung Chung LineTseung Kwan O LineCross Harbour TunnelEast Rail LineWest Rail LineAirport ExpressEastern Harbour CrossingIsland LineKwun Tong LineLight RailWestern Harbour CrossingTsuen Wan LineMa On Shan LineInterim Report 2011/20123
HIGHLIGHTS FOR THE SIX MONTHS ENDED 30 SEPTEMBER 2011Continuous GrowthRevenue HK$2,887 million 10.1%Net property income HK$2,041 million 15.6%Distribution to Unitholders HK$1,420 million 21.2%Distribution per unit HK63.11 cents 19.4%Distribution payout ratio 100%Growing Demand from TenantsAverage monthly unit rent (1) HK$34.2 psf 4.3%Occupancy rate to 92.1%Net property income margin to 70.7%Retention rate to 79.3%Strong Financial PositionNet asset value per unit (1) HK$26.14 6.1%ValuationHK$72,096 millionGearing ratio 16.7%Average outstanding life of debt facilitiesCredit ratingsAvailable liquidity – No refinancing in the next 18 months3.8 yearsA (S&P)/A2 (Moody’s)HK$4.45 billionNote:(1)<strong>The</strong>se comparisons are based on 31 March 2011 figures while others are based on period ended 30 September 2010 figures.4<strong>The</strong> <strong>Link</strong> Real Estate Investment Trust
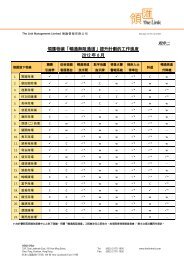
FIRSTACQUISITIONSINCE IPOFIRST VENTUREINTO PRIVATE-SECTOR RETAILFACILITYCommercial Portion of Nan Fung PlazaHau TakShopping CentreHau TakShoppingCentreWo MingCourt MultistoreyCar ParkHang HauStationNan Fung Plaza
CHAIRMAN’S STATEMENTOn behalf of the Board of Directors (the “Board”) of <strong>The</strong> <strong>Link</strong> Management Limited, I am pleased topresent <strong>The</strong> <strong>Link</strong> <strong>REIT</strong>’s interim report for the six months ended 30 September 2011.CONTINUOUS EFFORTS TO IMPROVESince the listing of <strong>The</strong> <strong>Link</strong> <strong>REIT</strong> almost six years ago, the Manager has been actively managingthe diversified portfolio of properties to enhance the shopping environment for our tenants and toconsolidate our core strength in providing daily necessities for the communities we serve.We have also carried out major refurbishments through asset enhancement initiatives to repositionand invigorate the shopping experience in our properties. In our drive to provide an enhancedenvironment for our tenants and the community, we continually update the fabric of our centres,and improve their layout and circulation. We also work to upgrade our property services and ourshopping centres’ trade mix in response to changing shopper demands. <strong>The</strong>se improvements of thehardware and the software of our assets create higher economic value for our Unitholders.Our efforts have resulted in higher occupancy, improved rental return, enhanced trade mix andbetter service quality. <strong>The</strong> Manager will continue to upgrade and improve the portfolio to optimise itspotential. I am confident that through active asset management and continuing asset enhancements,we can further enhance value in the future.NEW GROWTH INITIATIVESOur current strategies to improve the standard of our properties primarily focus on maintainingour market position through improving our core strength in providing daily shopping needs.New initiatives to grow beyond our existing portfolio will enable us to explore synergies withnearby shopping centres. This should position us to turn inevitable competitive challenges intoopportunities.<strong>The</strong> acquisition of the commercial portion of Nan Fung Plaza (“Nan Fung Plaza”) was the firstacquisition since <strong>The</strong> <strong>Link</strong> <strong>REIT</strong>’s listing and marked our debut in retail properties within privateresidential developments. With all our other properties situated close to public housing estates,the acquisition opens up additional expansion opportunities for future growth. We will pursue thisexpansion strategy prudently when we can find value enhancement opportunities in the local retailproperty sector.6<strong>The</strong> <strong>Link</strong> Real Estate Investment Trust
CHAIRMAN’S STATEMENT (CONTINUED)OUTLOOK AND APPRECIATION<strong>The</strong> global economy has continued to be affected by the European sovereign debt crisis. <strong>The</strong>renewed threat of further economic slowdown in the United States has created more uncertainties.Meanwhile, China’s economic growth may moderate, amid tightening fiscal policy by the centralgovernment. Although the low interest rate environment is likely to remain in the near term, weremain cautious as the local market may be affected by increasing inflation.<strong>The</strong> operating environment in the period under review was satisfactory, as retail sales growth inHong Kong has been reasonably strong, despite financial turbulence. Looking ahead, the resilientnature of our portfolio should be able to generate relatively stable returns, and we remain positiveon our performance in the second half of the financial year.<strong>The</strong> Board would like to express its sincere thanks to our management and staff, whoseprofessionalism and dedication are central to our continued success. I have full confidence that,with the devotion of our team, <strong>The</strong> <strong>Link</strong> <strong>REIT</strong> will continue to develop its capabilities in the industryand achieve solid growth in the future.<strong>The</strong> Board also wishes to extend its appreciation to Dr Allan ZEMAN, who served as an independentnon-executive director of the Manager from September 2004 to July 2011, for his contribution to theBoard and <strong>The</strong> <strong>Link</strong> <strong>REIT</strong> during his tenure. <strong>The</strong> Board and its Nomination Committee will review thecomposition and performance of the Board on an ongoing basis.Nicholas Robert SALLNOW-SMITHChairman<strong>The</strong> <strong>Link</strong> Management LimitedAs Manager of <strong>The</strong> <strong>Link</strong> Real Estate Investment Trust9 November 2011Interim Report 2011/20127
<strong>REPORT</strong> OF THE CHIEF EXECUTIVE OFFICERI am pleased to report the unaudited interim results of <strong>The</strong> <strong>Link</strong> <strong>REIT</strong> and its subsidiaries (the “Group”)for the six months ended 30 September 2011.FINANCIAL REVIEWFinancial Performance<strong>The</strong> six months under review was a period of continued growth for <strong>The</strong> <strong>Link</strong> <strong>REIT</strong>. Driven by thestrong performance of the portfolio and continuous efforts in cost management, total revenue forthe six months ended 30 September 2011 amounted to HK$2,887 million (six months ended 30September 2010: HK$2,621 million), an increase of 10.1% while total property operating expenseswere held stable at HK$846 million (six months ended 30 September 2010: HK$856 million). <strong>The</strong>interim distribution per unit for the six months ended 30 September 2011 was HK63.11 cents (sixmonths ended 30 September 2010: HK52.86 cents), which represents an increase of 19.4% year-onyear.<strong>The</strong> value of our portfolio as at 30 September 2011 grew 7.1% to HK$72,096 million, compared to31 March 2011. Net asset value per unit also grew 6.1% to HK$26.14 as at 30 September 2011 (31March 2011: HK$24.63) due primarily to the value appreciation of investment properties.8<strong>The</strong> <strong>Link</strong> Real Estate Investment Trust
<strong>REPORT</strong> OF THE CHIEF EXECUTIVE OFFICER (CONTINUED)Total Unit Return of <strong>The</strong> <strong>Link</strong> <strong>REIT</strong>From our initial public offering in November 2005 to the end of September 2011, <strong>The</strong> <strong>Link</strong> <strong>REIT</strong> hasdelivered to Unitholders a compound average annualised total return of 20%, being a combination ofunit price appreciation and distributions.<strong>The</strong> <strong>Link</strong> <strong>REIT</strong>’s DistributionYield Comparables<strong>The</strong> <strong>Link</strong> <strong>REIT</strong>’sGrowing DistributionsYIELDFromDistributionsPaid Out%6.05.04.03.02.01.05.11%3.70%0.76% 0.63%HKCents1201008060402074.4083.9997.37110.4563.110.0<strong>The</strong> <strong>Link</strong> Average<strong>REIT</strong> dividend(annualised) yield ofHang SengIndexStocksHong Kong5 yearGovernmentbondyieldAs at 30 Sep 2011Hong Kong1 yearfixeddepositrate0Year /PeriodendedYearon-YeargrowthMar 08+10.3%Mar 09+12.9%Mar 10+15.9%Mar 11+13.4%Sep 11Net Asset Value Per UnitUnit Price Performanceof <strong>The</strong> <strong>Link</strong> <strong>REIT</strong>HK$302526.1424.63HK$30139.8% increase from IPOto 30 September 2011GROWTHFromUnit PriceAppreciation20151012.98 14.94 13.9718.682520151055031 Mar 31 Mar 31 Mar 31 Mar 31 Mar 30 Sep2007 2008 2009 2010 2011 20110Nov 05 Sep 06 Sep 07 Sep 08 Sep 09 Sep 10 Sep 11Interim Report 2011/20129
<strong>REPORT</strong> OF THE CHIEF EXECUTIVE OFFICER (CONTINUED)Income Statement SummarySix months ended30 September2011HK$’MSix months ended30 September2010HK$’M(Restated) (1)YoY%Revenue 2,887 2,621 10.1Property operating expenses (846) (856) (1.2)Net property income 2,041 1,765 15.6General and administrative expenses (147) (80) 83.8Interest income 11 1 1,000.0Finance costs on interest bearing liabilities (197) (271) (27.3)Profit before taxation, change in fair valuesof investment properties and transactionswith Unitholders 1,708 1,415 20.7Change in fair values of investment properties 3,272 3,259 0.4Taxation (288) (236) 22.0Profit for the period, before transactionswith Unitholders 4,692 4,438 5.7Note:(1)Comparative figures have been restated as a result of the early adoption of the amendments to the Hong Kong Accounting Standard (“HKAS”) 12“Deferred Tax: Recovery of Underlying Assets”.Distribution Statement SummarySix months ended30 September2011HK$’MSix months ended30 September2010HK$’M(Restated) (1)YoY%Profit for the period, before transactionswith Unitholders 4,692 4,438 5.7Change in fair values of investment properties (3,272) (3,259) 0.4Other non-cash income – (7) N/ATotal distributable income 1,420 1,172 21.2Distribution per unit (HK cents) 63.11 52.86 19.4Note:(1)Comparative figures have been restated as a result of the early adoption of the amendments to the HKAS 12 “Deferred Tax: Recovery of UnderlyingAssets”.10<strong>The</strong> <strong>Link</strong> Real Estate Investment Trust
<strong>REPORT</strong> OF THE CHIEF EXECUTIVE OFFICER (CONTINUED)Revenue AnalysisFor the six months under review, total revenue rose 10.1% to HK$2,887 million (six months ended30 September 2010: HK$2,621 million), comprising rental income from retail properties of HK$2,162million (six months ended 30 September 2010: HK$1,967 million), rental income from car parkproperties of HK$569 million (six months ended 30 September 2010: HK$510 million) and incomefrom other sources of HK$156 million (six months ended 30 September 2010: HK$144 million).Six months ended30 September2011HK$’MSix months ended30 September2010HK$’MYoY%Percentagecontributionsix months ended30 September2011%Rental income:Retail:Shops (1) 1,730 1,554 11.3 59.9Markets/Cooked Food Stalls 309 297 4.0 10.7Others (2) 123 116 6.0 4.3Car parks:Monthly 424 382 11.0 14.7Hourly 145 128 13.3 5.0Expenses recovery and othermiscellaneous income:Property related income 156 144 8.3 5.42,887 2,621 10.1 100.0Notes:(1)Rental income from shops includes base and turnover rents.(2)<strong>The</strong>se include income from Education/Welfare, Housing Department (“HD”) Office, Ancillary and Mall Merchandising.Interim Report 2011/201211
<strong>REPORT</strong> OF THE CHIEF EXECUTIVE OFFICER (CONTINUED)Expenses AnalysisTotal property expenses during the period under review fell 1.2% to HK$846 million (six monthsended 30 September 2010: HK$856 million) due primarily to the reversal of an over provision ofcar park waiver fees (grouped under “Other property operating expenses” below) accrued in priorperiods. <strong>The</strong> coming into effect of the Minimum Wage Ordinance on 1 May 2011 and the Manager’soffer to reimburse the existing service contractors for the costs they incurred (including those onpaid rest-days and meal-breaks) resulted in the increase in property managers’ fees, security andcleaning expenses. Staff costs also increased as the Manager added front line headcount so as tocontinue to strengthen the work force and pursue better quality service to customers.<strong>The</strong> increase in utilities tariff rates was offset by the continuous efforts by management to deploysavings initiatives to reduce energy consumption. Repair and maintenance costs were slightly downyear-on-year due to the Manager’s efforts to better plan and control repair and maintenance worksacross the portfolio.Six months ended30 September2011HK$’MSix months ended30 September2010HK$’MYoY%Property managers’ fees, security and cleaning 251 212 18.4Staff costs 129 123 4.9Utilities 182 182 0.0Repair and maintenance 103 116 (11.2)Government rent and rates 87 78 11.5Promotion and marketing expenses 39 39 0.0Estate common area costs 51 49 4.1Other property operating expenses 4 57 (93.0)Total property expenses 846 856 (1.2)Financial Position<strong>The</strong> financial position of <strong>The</strong> <strong>Link</strong> <strong>REIT</strong> remains strong with total value of investment propertiesincreased to HK$72,096 million as at 30 September 2011 (31 March 2011: HK$67,318 million), anincrease of 7.1%. <strong>The</strong> increase was partly due to the inclusion of the value of the commercial portionof the Nan Fung Plaza acquired in July 2011. Net asset value per unit rose from HK$24.63 as at 31March 2011 to HK$26.14 as at 30 September 2011. <strong>The</strong> increase in net asset value per unit was dueprimarily to the increase in fair values of investment properties driven by improvement in rentalincome.12<strong>The</strong> <strong>Link</strong> Real Estate Investment Trust
<strong>REPORT</strong> OF THE CHIEF EXECUTIVE OFFICER (CONTINUED)Financial Position SummaryAs at30 September 2011HK$’MAs at31 March 2011HK$’MCurrent Assets 2,330 1,045Non Current Assets 72,638 67,709Total Assets 74,968 68,754Current Liabilities 3,871 4,577Non Current Liabilities 12,290 9,202Total Liabilities 16,161 13,779Net Assets Attributable to Unitholders 58,807 54,975Units in Issue (’000) 2,249,541 2,232,285Net Asset Value Per Unit HK$26.14 HK$24.63Liquidity ratio (%) 60.2 22.8Gearing ratio (%) 16.7 15.1Valuation ReviewBased on the valuation of Jones Lang LaSalle Limited, the principal valuer of <strong>The</strong> <strong>Link</strong> <strong>REIT</strong> (the“Principal Valuer”), the value of the retail properties grew 7.1% from HK$57,510 million as at 31March 2011 to HK$61,573 million as at 30 September 2011 while the value of the car parks grewfrom HK$9,808 million as at 31 March 2011 to HK$10,523 million as at 30 September 2011. <strong>The</strong>Principal Valuer used a combination of the discounted cash flow (“DCF”) and income capitalisationapproaches to value <strong>The</strong> <strong>Link</strong> <strong>REIT</strong>’s property portfolio. <strong>The</strong> valuation uplift for the retail propertieswas largely due to the increase in property income of the portfolio, improved quality of specificproperties which had undergone asset enhancement initiatives (“AEIs”) and rental growth prospectsin general.Movements in Investment PropertiesRetail propertiesHK$’MCar parksHK$’MTotalHK$’MAt 1 April 2011 57,510 9,808 67,318Additions 1,486 20 1,506Change in fair values 2,577 695 3,272At 30 September 2011 61,573 10,523 72,096Interim Report 2011/201213
<strong>REPORT</strong> OF THE CHIEF EXECUTIVE OFFICER (CONTINUED)Valuation ApproachAs at30 September2011As at31 March2011Income Capitalisation Approach – Capitalisation RateRetail properties 5.00 – 7.00% 5.00 – 7.00%Retail properties: weighted average 5.88% 5.92%Car parks 5.50 – 9.25% 5.50 – 9.25%Car parks: weighted average 7.62% 7.63%Overall weighted average 6.11% 6.16%DCF ApproachDiscount rate 8.00% 8.00%CAPITAL MANAGEMENTDuring the period under review, the financial markets experienced a significant amount of volatility.<strong>The</strong> commercial banks in Hong Kong encountered a liquidity squeeze and increased credit margin.<strong>The</strong> <strong>Link</strong> <strong>REIT</strong> continued to focus on extending and spreading out debt maturity and loweringaverage interest cost. As a result, there will be no refinancing necessary in the next 18 months.Key financing transactions in the period are summarised below:• A new HK$2.5 billion 5-year club loan was put in place with various banks at an all-in cost ofHIBOR + 0.85% per annum of which HK$1.25 billion of the club loan is revolving in nature.• A total of HK$1.5 billion unsecured notes were issued under the Guaranteed Euro Medium TermNote Programme.• A further HK$500 million of the 2006 syndicated loan was prepaid.<strong>The</strong> overall average interest rate of the debt portfolio, after taking into account interest rate hedging,reduced from 3.72% as at 31 March 2011 to 3.45% as at 30 September 2011. Average outstanding lifeof the Group’s committed debt facilities was extended to 3.8 years as at 30 September 2011 from 3.4years as at 31 March 2011.14<strong>The</strong> <strong>Link</strong> Real Estate Investment Trust
<strong>REPORT</strong> OF THE CHIEF EXECUTIVE OFFICER (CONTINUED)Debt HighlightsAs at30 September2011As at31 March2011Debt (face value) HK$12.47 billion HK$10.37 billionGearing (debt : total assets) 16.7% 15.1%Average outstanding life of debt facilities 3.8 years 3.4 yearsProportion of liabilities at fixed rates (after swaps) 58% 60%Average outstanding life of fixed rate debt/swaps 3.8 years 3.7 yearsEffective interest rate 3.45% 3.72%Committed Debt Facilities (1)As at 30 September 2011(HK$ Billion)Fixed RateDebt (2)Floating RateDebt (2)UtilisedFacilitiesUndrawnFacilitiesTotal FacilitiesHKMC Loan (3) 3.75 0.25 4.00 – 4.002006 Syndicated Loan 1.35 0.50 1.85 – 1.852011 Club Loan – 1.75 1.75 0.75 2.50Bilateral Loans 0.20 1.07 1.27 1.56 2.83Medium Term Notes 1.88 1.72 3.60 – 3.60Total 7.18 5.29 12.47 2.31 14.78Percentage 58% 42% 84% 16% 100%Notes:(1)All amounts are at face value.(2)After interest rate swaps.(3)Loan from <strong>The</strong> Hong Kong Mortgage Corporation Limited (“HKMC”).Interim Report 2011/201215
<strong>REPORT</strong> OF THE CHIEF EXECUTIVE OFFICER (CONTINUED)Maturity Profile of Committed Facilities3.5Undrawn Facilities (As at 31 Mar 11)3.02.50.40 0.91 1.312.600.752.46Utilised Facilities (As at 31 Mar 11)Undrawn Facilities (As at 30 Sep 11)Utilised Facilities (As at 30 Sep 11)HK$ Billion2.01.50.25 0.25 2.002.00 2.021.85 (1) 1.65 1.65 1.62Utilised Facilities (As at 30 Sep 11) andsubsequently repaid (1)1.01.091.301.30Note:0.50.00.500.300.302012 2013 2014 2015 2016 2017 2018 2019 2020 2021 2022Year ending 31 March0.20(1)<strong>The</strong> HK$1.85 billion 2006 Syndicated Loan was fully repaid in October 2011.Fixed Rate Debt/Swap Maturity Profile3.02.52.50 2.50Fixed Rate Debt/Swap (As at 31 Mar 11)Fixed Rate Debt/Swap (As at 30 Sep 11)2.0HK$ Billion1.51.55 1.551.00.50.65 0.650.20 0.200.500.700.30 0.300.580.50 0.500.200.02012 2013 2014 2015 2016 2017 2018 2019 2020 2021 2022Year ending 31 MarchAvailable Liquidity<strong>The</strong> <strong>Link</strong> <strong>REIT</strong> has increased liquidity available for both risk management and potential growthpurposes. As at 30 September 2011, available liquidity stood at HK$4.45 billion (31 March 2011:HK$2.41 billion), comprising HK$2.14 billion cash and deposits and HK$2.31 billion committedundrawn facilities.Credit Ratings<strong>The</strong> <strong>Link</strong> <strong>REIT</strong> commands strong credit ratings by rating agencies. <strong>The</strong> <strong>Link</strong> <strong>REIT</strong>’s credit ratingswere affirmed by Standard and Poor’s at A/Stable on 15 July 2011 and by Moody’s Investors Serviceat A2/Stable on 28 September 2011.16<strong>The</strong> <strong>Link</strong> Real Estate Investment Trust
<strong>REPORT</strong> OF THE CHIEF EXECUTIVE OFFICER (CONTINUED)BUSINESS REVIEWRetail Portfolio<strong>The</strong> Manager is delighted with the strong performance of the retail properties in the period underreview. Rental income from the retail properties, which contributed 74.9% of revenue in the periodunder review, grew 9.9% year-on-year to HK$2,162 million (six months ended 30 September 2010:HK$1,967 million). <strong>The</strong> solid revenue growth was driven by higher rental rates, improving occupancyrates, increasing contributions from properties with completed AEIs and better trade mix.Average Unit RentWithin <strong>The</strong> <strong>Link</strong> <strong>REIT</strong>’s portfolio, the top 10 and top 50 properties by retail properties’ valuationaccounted for 27% and 71% respectively of retail revenue for the period under review, reflecting theimproved quality and better trade mix of these assets which included most of the properties thathad undergone AEIs. Among the properties with a retail component, the top 10 properties and the11th to 50th properties achieved average monthly unit rent per square foot of HK$47.8 and HK$36.6respectively, as at 30 September 2011 (31 March 2011: HK$46.5 and HK$34.4, respectively).Retail Portfolio BreakdownProperties (1)RetailpropertiesvaluationHK$’MRetailrevenueHK$’MAverage monthlyunit rent perleased IFAHK$ psfOccupancy rate%1-10 17,576 577 47.8 97.211-50 28,135 958 36.6 91.551-100 13,138 515 26.8 91.4Remaining properties 2,724 112 19.3 86.9Total 61,573 2,162 34.2 92.1Note:(1)Properties ranked by retail properties’ valuation as at 30 September 2011, including Nan Fung Plaza.Interim Report 2011/201217
<strong>REPORT</strong> OF THE CHIEF EXECUTIVE OFFICER (CONTINUED)Composite Reversion Rate<strong>The</strong> composite reversion rate is an indicator of rental growth comparing the newly achieved rentalrates of a like for like space with those leases expired during the period. <strong>The</strong> composite reversionrate for the retail properties showed a slight decline to 21.5% (six months ended 30 September 2010:22.7%). <strong>The</strong> composite reversion rate for shops, which accounted for the major share of revenue,was 22.7% (six months ended 30 September 2010: 22.2%).Composite Reversion Rate by Trade CategorySix months ended30 September2011%Six months ended30 September2010%% of total IFA(exclude Self useoffice) as at30 September2011%Shops 22.7 22.2 81.3Markets/Cooked Food Stalls 14.3 24.8 9.1Others (1) 15.2 3.5 9.6Overall Retail Properties 21.5 22.7 100.0Note:(1)Others include Education/Welfare, HD Office, and Ancillary.Portfolio Lease Expiry ProfileIn the financial year ending 31 March 2012, leases accounting for 20.3% by IFA and 21.2% by monthlybase rent of the retail properties will expire.By Total IFABy Monthly Base Rent(as at 30 September 2011) (as at 30 September 2011)Six months ending31 March 2012Six months ending20.3% 21.2%31 March 2012Year 2012/1329.6% Year 2012/1327.4%Year 2013/14 19.9% Year 2013/1425.0%Year 2014/15 and beyond16.6% Year 2014/15 and beyond20.1%Short-term leaseand vacancy13.6% Short-term lease 6.3%18<strong>The</strong> <strong>Link</strong> Real Estate Investment Trust
<strong>REPORT</strong> OF THE CHIEF EXECUTIVE OFFICER (CONTINUED)Portfolio Occupancy Analysis<strong>The</strong> portfolio’s overall occupancy rate improved to 92.1% as at 30 September 2011 (31 March 2011:91.5%), demonstrating our team’s efforts in filling the vacant space and the strong demand for spacein our portfolio. <strong>The</strong> occupancy rate for shops in our portfolio improved steadily, and achieved 94.6%as at 30 September 2011 (31 March 2011: 93.8%).Occupancy of Different Categories of Space for the PortfolioAs at 30 September 2011 As at 31 March 2011CategoryTotal IFA’000 sq ftAverage monthlyunit rent perleased IFAHK$ psfOccupancyrate%Total IFA’000 sq ftAverage monthlyunit rent perleased IFAHK$ psfOccupancyrate%Shops 8,885 34.2 94.6 8,883 32.6 93.8Markets/Cooked Food Stalls 994 64.6 80.6 986 63.0 81.8Others (1) 1,055 6.0 82.0 1,055 5.9 81.1Total excluding Self use office 10,934 34.2 92.1 10,924 32.8 91.5Self use office 138 N/A N/A 143 N/A N/ATotal including Self use office 11,072 11,067Total excluding Self use office, Education/Welfare, HD Office and Ancillary 9,879 36.9 93.1 9,869 35.3 92.6Note:(1)Others include Education/Welfare, HD Office, and Ancillary.Retail Trade Mix AnalysisAs at 30 September 2011Leased IFA’000 sq ft % of leased IFA % of monthly rentFood and Beverage 3,071 30.5 24.9Supermarket and Foodstuff 1,927 19.1 23.4Services 963 9.6 10.9Market Stall 351 3.5 7.6Single Letting Market 331 3.3 6.0Personal Care, Medicine, Valuable Goods, Optical, Booksand Stationery 604 6.0 8.4Interim Report 2011/201219
<strong>REPORT</strong> OF THE CHIEF EXECUTIVE OFFICER (CONTINUED)<strong>The</strong> core strength of <strong>The</strong> <strong>Link</strong> <strong>REIT</strong>’s properties is to provide the local community with their basicnecessities and focuses on general food stuff, restaurants, markets and daily services. To createa better business environment for our tenants and drive higher footfall, the Manager has beenevaluating the potential demand for higher quality services and expanding the product offerings andvariety of trades in selected AEI properties to create an enhanced shopping experience to serve theneeds of shoppers in the district.Expanding Trade Mix for More DiversityLocal community centresRegional centresDepartment StoreDepartment StoreBook & StationeryBook & StationeryJewelriesOpticalJewelriesOpticalFlagshipStoreFashionMedicine• Supermarket• Fresh Market• Chinese Restaurant• Dry Marketi.e. daily servicesFurniture & AppliancesServicesPersonalCareFoodCourtFlagshipStore• SupermarketFashion • Fresh Market• Chinese Restaurant• Dry Marketi.e. daily servicesMedicineServicesPersonalCareFoodCourtFurniture & AppliancesEntertainmentEntertainmentCore Trade Mix is Our StrengthExpanding to the Outer Layers20<strong>The</strong> <strong>Link</strong> Real Estate Investment Trust
<strong>REPORT</strong> OF THE CHIEF EXECUTIVE OFFICER (CONTINUED)Review of Asset Enhancement InitiativesAEI is a key component of <strong>The</strong> <strong>Link</strong> <strong>REIT</strong>’s growth strategy which the Manager has beenimplementing actively. <strong>The</strong> HK$168 million asset enhancement work at Choi Yuen Plaza wascompleted in September 2011 and the Manager is pleased with its good return on investment. <strong>The</strong>Manager had completed 22 AEI projects since <strong>The</strong> <strong>Link</strong> <strong>REIT</strong> was listed in 2005, and properties withcompleted AEI projects accounted for 39.6% of the Group’s revenue (excluding car parks) for theperiod under review and a total IFA of approximately 3 million square feet.Seven AEI projects with a total investment of approximately HK$753 million are currently underconstruction which are expected to be completed within the next two financial years. <strong>The</strong> grandopening of one of our flagship centres, Stanley Plaza, will take place on 25 November 2011. Sevenadditional AEI projects with an aggregate investment of over HK$600 million are in various stages ofobtaining statutory approvals.Status of AEIsNumber ofprojectsCapitalexpenditureHK$’MCompleted since initial public offering 22 1,771Underway 7 753Pending statutory approval 7 602Others under planning (1) >18 >1,400Total (1) >54 >4,526Note:(1)Latest estimated figures.Approved AEI Projects Underway (1)Total estimatedproject CapexHK$’MTargetcompletion dateStanley Plaza 227 late 2011Tai Yuen Commercial Centre 120 late 2011Leung King Shopping Centre 200 early 2012Tin Shui Shopping Centre 66 early 2012Sun Chui Shopping Centre 33 mid 2012Oi Man Shopping Centre 64 late 2012Sheung Tak Shopping Centre 43 early 2013Total 753Note:(1)Projects which have secured all internal and necessary statutory approvals.Interim Report 2011/201221
<strong>REPORT</strong> OF THE CHIEF EXECUTIVE OFFICER (CONTINUED)First Acquisition – Nan Fung PlazaOn 9 June 2011, the Manager announced the acquisition by <strong>The</strong> <strong>Link</strong> <strong>REIT</strong> of the commercial portionof Nan Fung Plaza from the Nan Fung group of companies for HK$1,170 million. <strong>The</strong> acquisition isthe first one for <strong>The</strong> <strong>Link</strong> <strong>REIT</strong> since its initial public offering in 2005, and the first venture into retailproperties in a private residential development. <strong>The</strong> acquisition is expected to enhance distributionyield of <strong>The</strong> <strong>Link</strong> <strong>REIT</strong> and capitalise on the synergy value when the operations of Hau Tak ShoppingCentre are combined with those of Nan Fung Plaza. This marks a new milestone in <strong>The</strong> <strong>Link</strong> <strong>REIT</strong>’sbusiness development and paved the way for further growth opportunities.Nan Fung Plaza is located adjacent to the Hang Hau mass transit railway station in the TseungKwan O district in the New Territories. It is connected by footbridges to <strong>The</strong> <strong>Link</strong> <strong>REIT</strong>’s Hau TakShopping Centre in Hang Hau. <strong>The</strong> Manager believes that the addition of Nan Fung Plaza allows usto better leverage on the Manager’s expertise in retail property management to bring more businessopportunities for the tenants and provide a better shopping environment for the shoppers in thearea.Nan Fung Plaza has been successfully integrated into <strong>The</strong> <strong>Link</strong> <strong>REIT</strong>’s portfolio of assets followingcompletion of the acquisition on 11 July 2011. <strong>The</strong> Manager is focusing on strategies to improvetrade mix and has integrated this newly acquired property into the portfolio’s marketing plans.New tenants and services will be introduced to Nan Fung Plaza including a bakery shop andthe installation of an automatic teller machine. Rental reversion rate and occupancy have beenencouraging since completion, which demonstrates our capability in asset management.Performance of Nan Fung PlazaAs at 30 September 2011Occupancy rate 98.4%ValuationHK$1,183 millionAverage monthly unit rent an increase of 3.7% since acquisition completed (1)Note:(1)Based on end July 2011 and end September 2011 figures.Car Park PortfolioRevenue from car parks accounted for 19.7% of total revenue for the six months ended 30September 2011 (six months ended 30 September 2010: 19.5%). In the six months under review,rental income from car parks grew 11.6% year-on-year to HK$569 million (six months ended 30September 2010: HK$510 million). <strong>The</strong> implementation of various incentive parking schemes andthe closure of some neighbourhood car parks have further stimulated parking demand among ourportfolio. <strong>The</strong> car park operating margin was 59.8% for the six months under review (six monthsended 30 September 2010: 57.5%) which excluded the write-back of the waiver fees provision as thefinal waiver fees assessed by the government were lower than our original estimation.22<strong>The</strong> <strong>Link</strong> Real Estate Investment Trust
<strong>REPORT</strong> OF THE CHIEF EXECUTIVE OFFICER (CONTINUED)Key Car Park Property Performance IndicatorsSix months ended30 September2011Six months ended30 September2010Car park space allocation – monthly (%) 87.0 87.0Car park space allocation – hourly (%) 13.0 13.0Gross receipts by monthly users (%) 74.5 74.9Gross receipts by hourly users (%) 25.5 25.1Utilisation of car park space (%) 78.3 72.6Car park income per space per month (HK$) 1,193 1,067Net property income margin (%) 59.8 (1) 57.5Note:(1)Excluding the write-back of the car park waiver fees provision.Human Resources<strong>The</strong> Manager’s remuneration policy is to provide an equitable, motivating and competitive remunerationpackage in order to attract, motivate and retain high performing staff. As an ongoing practice of adheringto these principles, the Manager regularly reviews the remuneration policies and practices with theassistance of independent consultants. All full-time and permanent staff are eligible for a discretionarybonus, the payment of which is based on both the individual staff’s performance and the performanceof <strong>The</strong> <strong>Link</strong> <strong>REIT</strong>. Staff benefits include contribution to mandatory provident fund, annual leave, sickleave, maternity leave, newly introduced paternity leave, medical insurance, life and personal accidentinsurance.During the six months ended 30 September 2011, there was a 2% growth in headcount with additionalfrontline staff in property management. <strong>The</strong> Manager has appointed new members of seniormanagement including Head of Property Management and Operations, Head of Marketing and GeneralManager of Quantity Surveying in the period. As at 30 September 2011, the Manager had 814 (31 March2011: 798) staff.To continuously improve service quality and recognise the contribution of staff from cleaning andsecurity contractors alongside the front line staff in property management and operations, the Managerhas organised the first “<strong>The</strong> <strong>Link</strong> Award Ceremony” in June 2011. Based on the scores rated by mysteryshoppers of an independent consultant, awards were given to the best performers and teams underdifferent categories.As one of the key initiatives in caring for its staff, the Manager has introduced an Employee AssistanceProgramme to all staff members and their families. An independent service provider has been appointedto provide one-stop professional services in preventing, identifying and resolving concerns, difficultiesor problems from personal, family and work lives. Qualified and experienced professionals would offertailor-made information or solutions to those in need.Interim Report 2011/201223
<strong>REPORT</strong> OF THE CHIEF EXECUTIVE OFFICER (CONTINUED)AwardsIn May 2011, the Manager was awarded the Caring Company Certificate by the Hong Kong Councilof Social Service. <strong>The</strong> Caring Company Scheme recognises businesses that make outstandingcontribution in Caring for the Community, Caring for Employees and Caring for the Environment.<strong>The</strong> Manager has been awarded the Caring Company Certificate from 2007 through 2011.In the same month, the Manager received the Corporate Social Responsibility Awards 2011organised by Capital Magazine and Capital Weekly. This award acknowledges the Manager’scontributions to society and natural development while providing excellent services to customersthrough its territory-wide portfolio of properties.In July 2011, Executive Director and CEO of the Manager, Mr George HONGCHOY, won theOutstanding Entrepreneurship Award of Asia Pacific Entrepreneurship Awards organised byEnterprise Asia. This award programme honours leading entrepreneurs who show outstandingperformance and achievements in their respective industries in the Asia Pacific region.Ten of <strong>The</strong> <strong>Link</strong> <strong>REIT</strong>’s shopping centres were granted the Certificate of Commendation Scheme forCommercial and Industrial Waste in August 2011. This scheme, run by the Environmental ProtectionDepartment, appreciates the Manager’s continued commitment to facilitate waste separation andrecycling in the workplace and shopping centres with a view to reducing waste.In October 2011, the Revitalisation of Tai Yuen Fresh Market Project emerged as the winner in theEnvironmental Excellence category of the Asian CSR Awards 2011, organised by the Asian Instituteof Management, for its marked impact upon human health, safety, environment and considerableenrichment of the local economy.In November 2011, our green community engagement project Eco Terrace held at Lok Fu Plaza haswon the Gold Award of the International Council of Shopping Centers Asia Pacific Shopping CenterAwards 2011 in the Cause Related Marketing category out of a record 122 marketing and 19 designentries from all over the Asia Pacific region.Sustainability Framework<strong>The</strong> Manager continues to build on our sustainability initiatives within the seven key areas, namelyasset/brand, community, corporate governance, economic, environmental, staff and tenant. Ourinvestment in the portfolio has maintained momentum, with one AEI – Choi Yuen Plaza – completedin the period under review, and another seven AEIs underway. Such efforts to reposition andrevitalise our shopping centres create better operating environments for our tenants and enhancedshopping ambience for customers. We also embed environmental-friendly designs and technologiesin the retrofitting works. Most notably, Stanley Plaza will complete its asset enhancementby November 2011 and is the first asset within <strong>The</strong> <strong>Link</strong> <strong>REIT</strong>’s portfolio to achieve BuildingEnvironmental Assessment Method (“BEAM”) Platinum standard in recognition of its environmentalfriendlyconstruction.24<strong>The</strong> <strong>Link</strong> Real Estate Investment Trust
<strong>REPORT</strong> OF THE CHIEF EXECUTIVE OFFICER (CONTINUED)In addition to investing in AEIs, the Manager has also continued with its investment in energyefficient hardware. During the period under review, the Manager replaced 21 chiller units across 14shopping centres, bringing the total number of energy-efficient chillers replaced to 87. We have alsoinstalled four new chiller units in Leung King Shopping Centre, resulting in a total of 22 new chillerunits installed in our markets and shopping centres. We also carried out lighting improvementprogramme, other energy efficiency and work process improvements to achieve savings in electricityusage which compensate for the electricity tariff rates increase in January 2011.<strong>The</strong> <strong>Link</strong> <strong>REIT</strong>’s commitment to the community is highlighted by our support for the statutoryminimum wage which came into effect on 1 May 2011 and our offer to reimburse the costs of ourcontractors to pay for rest-days and meal-breaks for workers of our existing contracted serviceproviders. <strong>The</strong> Manager believes this commitment is important to strengthen worker morale andlabour relations.<strong>The</strong> Manager is pleased with the progress on the upgrading works for barrier free access (“BFA”)which are planned to be completed in phases by 2016. <strong>The</strong> upgraded BFA facilities include theprovision of accessible lifts, vertical platforms, tactile guide paths, accessible customer servicecounters, ramps, braille and tactile floor plans and accessible toilets, which will benefit personswith disabilities, the elderly, people with other physical limitations, pregnant women and familieswith young children.Strategy and Outlook<strong>The</strong> Manager believes there is further room to improve the existing portfolio and will continueto execute its asset management strategy to enhance trade mix, achieve higher rental return,improve occupancy and deliver better service quality. <strong>The</strong> successful execution of its AEI strategyhas demonstrated that AEI not only generates satisfactory investment return immediately aftercompletion, but also continues to deliver sustainable growth in the long-term as the upgradedproperties provide an enhanced shopping environment to attract new tenants. <strong>The</strong>se new tenantswiden the appeal to shoppers, generate higher footfall and create a better business environment forother tenants. <strong>The</strong> Manager is reviewing the feasibility studies on a number of properties and willroll out more AEI projects of various scales in the near future.<strong>The</strong> Manager announced its first acquisition for <strong>The</strong> <strong>Link</strong> <strong>REIT</strong> in June 2011 and Nan Fung Plazahas been integrated smoothly into <strong>The</strong> <strong>Link</strong> <strong>REIT</strong>’s portfolio upon completion of the acquisition inJuly 2011. <strong>The</strong> Manager believes that it can create value on third party assets with its proven assetmanagement capability and will continue to seek suitable acquisition opportunities in the localretail sector to leverage on its strength. Such acquisitions will complement the existing portfolioand enhance its competitiveness going forward. <strong>The</strong> <strong>Link</strong> <strong>REIT</strong> has a strong financial position andsufficient fund raising capacity to finance future acquisitions.Interim Report 2011/201225
<strong>REPORT</strong> OF THE CHIEF EXECUTIVE OFFICER (CONTINUED)Expansion of <strong>The</strong> <strong>Link</strong> <strong>REIT</strong>’s Business ModelASSETMANAGEMENT• Leasing strategy✔ Maintain strong reversion✔ Improve occupancy✔ Enhance trade mix• Property management strategy✔ Improve service quality✔ Cost control✔ Energy savings✔ Improve operating marginsASSETENHANCEMENTASSETACQUISITION• Rejuvenate shopping centres✔ Enhance environment✔ Improve traffic/circulation• Reposition shopping centres✔ Introduce variety/choices✔ Tailor trade mix tolocal shopper demand• Target community retail malls• Leverage on synergy andeconomies of scale• Expand geographic coverage• Improve competitiveness<strong>The</strong> buoyant local retail market was evidenced by strong retail sales in the first half of thisfinancial year. Although recent retail sales growth was partly driven by strong tourist influx, privateconsumption also recorded healthy growth indicated by continuous increase in local consumerspending. <strong>The</strong> <strong>Link</strong> <strong>REIT</strong>’s portfolio should benefit from this trend as an above average number ofleases are due for renewal in the remainder of the current financial year.Supported by the strong retail market, positive rental reversion and increasing contributions fromcompleted AEIs, the Manager expects to continue with the rental growth in the second half of thefinancial year. Cost management will be challenging as inflationary pressure builds up and affectsmost of our cost items. <strong>The</strong> Manager remains confident that <strong>The</strong> <strong>Link</strong> <strong>REIT</strong> will sustain stablegrowth for the full year.George Kwok Lung HONGCHOYChief Executive Officer<strong>The</strong> <strong>Link</strong> Management LimitedAs Manager of <strong>The</strong> <strong>Link</strong> Real Estate Investment Trust269 November 2011<strong>The</strong> <strong>Link</strong> Real Estate Investment Trust
RENEWINGFRESH MARKETSHOPPINGEXPERIENCETai Yuen Fresh Market Enhancement Project
OUR GOVERNANCECORPORATE GOVERNANCE<strong>The</strong> <strong>Link</strong> <strong>REIT</strong> is committed to high standards of corporate governance. <strong>The</strong> Manager practisedeffective internal controls and stringent disclosures for high transparency to stakeholders. <strong>The</strong>board of directors of the Manager (the “Board”) comprises a high majority of independent nonexecutivedirectors with expertise on real estate, finance and other areas relevant to the business of<strong>The</strong> <strong>Link</strong> <strong>REIT</strong>.<strong>The</strong>re has been no change to the authorisation structure of <strong>The</strong> <strong>Link</strong> <strong>REIT</strong> since its last corporategovernance report for the financial year ended 31 March 2011 (the “latest CG Report”). HSBCInstitutional Trust Services (Asia) Limited (the “Trustee”) is the trustee of <strong>The</strong> <strong>Link</strong> <strong>REIT</strong>.ComplianceThroughout the six months ended 30 September 2011:• the Manager and <strong>The</strong> <strong>Link</strong> <strong>REIT</strong> complied with applicable laws, <strong>The</strong> <strong>Link</strong> <strong>REIT</strong>’s trust deed andthe Manager’s compliance manual;• the Manager and <strong>The</strong> <strong>Link</strong> <strong>REIT</strong> met the code provisions, wherever applicable, set out in theCode on Corporate Governance Practices in Appendix 14 to the Rules Governing the Listing ofSecurities on <strong>The</strong> Stock Exchange of Hong Kong Limited (the “Listing Rules”);• all the directors of the Manager (the “Directors”), upon specific enquiry on each of them,confirmed that they complied with the required standard set out in the Code GoverningDealings in Securities of <strong>The</strong> <strong>Link</strong> <strong>REIT</strong> by Directors and Senior Executives (which forms part ofthe Manager’s compliance manual and contains provisions no less exacting than those set outin the Model Code for Securities Transactions by Directors of Listed Issuers in Appendix 10 tothe Listing Rules);• the Manager continued to implement stringent internal procedures to monitor and deal withconflict of interest issues which were described in detail in the latest CG Report; and• the corporate governance policies and practices adopted for <strong>The</strong> <strong>Link</strong> <strong>REIT</strong> were in line withthose disclosed in the latest CG Report.Changes in the Period under Review• Mr Simon HO Kam Por ceased to be, and Mr Eric YAU Siu Kei became, a responsible officerof the Manager. As at the date of this report, the Manager has 5 responsible officers whosenames appear in the “Corporation Information” section.• Dr Allan ZEMAN retired as an Independent Non-Executive Director and ceased to be amember of the audit committee of the Manager (the “Audit Committee”) on 13 July 2011. As atthe date of this report, the Manager has 11 Directors whose names appear in the “CorporateInformation” section.28<strong>The</strong> <strong>Link</strong> Real Estate Investment Trust
OUR GOVERNANCE (CONTINUED)• Updates on Directors’ biographical information:(i)Mr Nicholas Robert SALLNOW-SMITH has been appointed as independent non-executivedirector of Unitech Corporate Parks PLC (listed on AIM of the London Stock Exchange),Dah Sing Life Assurance Company Limited, Dah Sing Insurance Company Limited andDah Sing Insurance Company (1976) Limited. He ceased to be the chairman of the boardof LionRock Master Fund Limited in Singapore.(ii)Mr Anthony CHOW Wing Kin had retired as an independent non-executive director of PingAn Insurance (Group) Company of China, Ltd (listed on the Main Board of the Hong KongStock Exchange).Review by Audit Committee and Auditor<strong>The</strong> condensed consolidated interim financial information of <strong>The</strong> <strong>Link</strong> <strong>REIT</strong> for the six months ended30 September 2011 had been reviewed by the Audit Committee and <strong>The</strong> <strong>Link</strong> <strong>REIT</strong>’s auditor.Acquisition of Real EstateOn 8 June 2011, <strong>The</strong> <strong>Link</strong> Properties Limited (which is wholly owned by <strong>The</strong> <strong>Link</strong> <strong>REIT</strong>) entered intoa sale and purchase agreement to acquire the commercial portion of the Nan Fung Plaza and theacquisition was completed on 11 July 2011. Further details of such acquisition were set out in theannouncement of <strong>The</strong> <strong>Link</strong> <strong>REIT</strong> dated 9 June 2011 and are on page 22 and Note 22 to the condensedconsolidated interim financial information of this interim report.Save as disclosed herein, <strong>The</strong> <strong>Link</strong> <strong>REIT</strong> and/or its subsidiaries made no other acquisition nordisposal of any real estate in the period.Issue of New Units17,256,268 new units of <strong>The</strong> <strong>Link</strong> <strong>REIT</strong> were issued in the period, comprising (i) 15,827,490 new unitsissued pursuant to the distribution reinvestment scheme in respect of the final distribution for thefinancial year ended 31 March 2011; and (ii) 1,428,778 new units issued on vesting of restricted unitawards under the long-term incentive plan of <strong>The</strong> <strong>Link</strong> <strong>REIT</strong>.Purchase, Sale or Redemption of <strong>The</strong> <strong>Link</strong> <strong>REIT</strong>’s Listed UnitsNeither the Manager nor any of <strong>The</strong> <strong>Link</strong> <strong>REIT</strong>’s subsidiaries purchased, sold or redeemed any of<strong>The</strong> <strong>Link</strong> <strong>REIT</strong>’s listed units during the six months ended 30 September 2011.Public FloatBased on information publicly available to the Manager, <strong>The</strong> <strong>Link</strong> <strong>REIT</strong> continued to maintainthe required public float with not less than 25% of its issued units held in public hands as at 30September 2011.Interim Report 2011/201229
OUR GOVERNANCE (CONTINUED)LONG-TERM INCENTIVE PLANNo unit options have been granted under the long-term incentive plan of <strong>The</strong> <strong>Link</strong> <strong>REIT</strong> (the “LTIPlan”) since its adoption on 23 July 2007. Set out below are movements in the outstanding restrictedunit awards (the “RUAs”), which were granted in conjunction with conditional cash awards (the“CCAs”) (note 5) , under the LTI Plan during the six months ended 30 September 2011 and the balancesas at the beginning and end of the period:Name (Position) Date of grant Vesting periodGranted VestedOutstanding1 Apr 2011 (1) (1), (2)the periodRUAs at duringCancelledduring(3), (5)the periodduringthe periodLapsedduringthe period (4)OutstandingRUAs at30 Sep 2011 (1)Current DirectorsNicholas Robert SALLNOW-SMITH 13 Feb 2009 13 Feb 2009 to 30 Jun 2011 93,000 – (93,000) – – –(Independent Non-Executive Director)24 Sep 2009 24 Sep 2009 to 30 Jun 2011 73,000 – (73,000) – – –24 Sep 2009 24 Sep 2009 to 30 Jun 2012 73,000 – – – – 73,00012 Nov 2010 12 Nov 2010 to 30 Jun 2012 70,500 – – – – 70,50012 Nov 2010 12 Nov 2010 to 30 Jun 2013 70,500 – – – – 70,50023 Sep 2011 23 Sep 2011 to 30 Jun 2013 – 52,500 – – – 52,50023 Sep 2011 23 Sep 2011 to 30 Jun 2014 – 52,500 – – – 52,500George Kwok Lung HONGCHOY(Executive Director)16 Jan 2009 16 Jan 2009 to 15 Jan 2012 140,515 – – – – 140,51524 Sep 2009 24 Sep 2009 to 30 Jun 2011 121,500 – (121,500) – – –24 Sep 2009 24 Sep 2009 to 30 Jun 2012 121,500 – – – – 121,50012 Nov 2010 12 Nov 2010 to 30 Jun 2012 177,500 – – – – 177,50012 Nov 2010 12 Nov 2010 to 30 Jun 2013 177,500 – – – – 177,50023 Sep 2011 23 Sep 2011 to 30 Jun 2013 – 154,000 – – – 154,00023 Sep 2011 23 Sep 2011 to 30 Jun 2014 – 154,000 – – – 154,000Andy CHEUNG Lee Ming(Executive Director)12 Nov 2010 12 Nov 2010 to 30 Jun 2012 84,000 – – – – 84,00012 Nov 2010 12 Nov 2010 to 30 Jun 2013 84,000 – – – – 84,00023 Sep 2011 23 Sep 2011 to 30 Jun 2013 – 64,500 – – – 64,50023 Sep 2011 23 Sep 2011 to 30 Jun 2014 – 64,500 – – – 64,500Ian Keith GRIFFITHS(Non-Executive Director)13 Feb 2009 13 Feb 2009 to 30 Jun 2011 25,000 – (25,000) – – –24 Sep 2009 24 Sep 2009 to 30 Jun 2011 19,500 – (19,500) – – –24 Sep 2009 24 Sep 2009 to 30 Jun 2012 19,500 – – – – 19,50012 Nov 2010 12 Nov 2010 to 30 Jun 2012 19,500 – – – – 19,50012 Nov 2010 12 Nov 2010 to 30 Jun 2013 19,500 – – – – 19,50023 Sep 2011 23 Sep 2011 to 30 Jun 2013 – 14,500 – – – 14,50023 Sep 2011 23 Sep 2011 to 30 Jun 2014 – 14,500 – – – 14,50030<strong>The</strong> <strong>Link</strong> Real Estate Investment Trust
OUR GOVERNANCE (CONTINUED)Name (Position) Date of grant Vesting periodGranted VestedOutstanding1 Apr 2011 (1) (1), (2)the periodRUAs at duringCancelledduring(3), (5)the periodduringthe periodLapsedduringthe period (4)OutstandingRUAs at30 Sep 2011 (1)Michael Ian ARNOLD13 Feb 2009 13 Feb 2009 to 30 Jun 2011 33,000 – (33,000) – – –(Independent Non-Executive Director)24 Sep 2009 24 Sep 2009 to 30 Jun 2011 26,000 – (26,000) – – –24 Sep 2009 24 Sep 2009 to 30 Jun 2012 26,000 – – – – 26,00012 Nov 2010 12 Nov 2010 to 30 Jun 2012 25,000 – – – – 25,00012 Nov 2010 12 Nov 2010 to 30 Jun 2013 25,000 – – – – 25,00023 Sep 2011 23 Sep 2011 to 30 Jun 2013 – 18,500 – – – 18,50023 Sep 2011 23 Sep 2011 to 30 Jun 2014 – 18,500 – – – 18,500William CHAN Chak Cheung 12 Nov 2010 12 Nov 2010 to 30 Jun 2012 26,000 – – – – 26,000(Independent Non-Executive Director)12 Nov 2010 12 Nov 2010 to 30 Jun 2013 26,000 – – – – 26,00023 Sep 2011 23 Sep 2011 to 30 Jun 2013 – 19,500 – – – 19,50023 Sep 2011 23 Sep 2011 to 30 Jun 2014 – 19,500 – – – 19,500Anthony CHOW Wing Kin13 Feb 2009 13 Feb 2009 to 30 Jun 2011 30,500 – (30,500) – – –(Independent Non-Executive Director)24 Sep 2009 24 Sep 2009 to 30 Jun 2011 24,000 – (24,000) – – –24 Sep 2009 24 Sep 2009 to 30 Jun 2012 24,000 – – – – 24,00012 Nov 2010 12 Nov 2010 to 30 Jun 2012 26,000 – – – – 26,00012 Nov 2010 12 Nov 2010 to 30 Jun 2013 26,000 – – – – 26,00023 Sep 2011 23 Sep 2011 to 30 Jun 2013 – 19,500 – – – 19,50023 Sep 2011 23 Sep 2011 to 30 Jun 2014 – 19,500 – – – 19,500Patrick FUNG Yuk Bun13 Feb 2009 13 Feb 2009 to 30 Jun 2011 33,000 – (33,000) – – –(Independent Non-Executive Director)24 Sep 2009 24 Sep 2009 to 30 Jun 2011 26,000 – (26,000) – – –24 Sep 2009 24 Sep 2009 to 30 Jun 2012 26,000 – – – – 26,00012 Nov 2010 12 Nov 2010 to 30 Jun 2012 20,500 – – – – 20,50012 Nov 2010 12 Nov 2010 to 30 Jun 2013 20,500 – – – – 20,50023 Sep 2011 23 Sep 2011 to 30 Jun 2013 – 15,000 – – – 15,00023 Sep 2011 23 Sep 2011 to 30 Jun 2014 – 15,000 – – – 15,000Stanley KO Kam Chuen13 Feb 2009 13 Feb 2009 to 30 Jun 2011 30,500 – (30,500) – – –(Independent Non-Executive Director)24 Sep 2009 24 Sep 2009 to 30 Jun 2011 24,000 – (24,000) – – –24 Sep 2009 24 Sep 2009 to 30 Jun 2012 24,000 – – – – 24,00012 Nov 2010 12 Nov 2010 to 30 Jun 2012 24,000 – – – – 24,00012 Nov 2010 12 Nov 2010 to 30 Jun 2013 24,000 – – – – 24,00023 Sep 2011 23 Sep 2011 to 30 Jun 2013 – 18,000 – – – 18,00023 Sep 2011 23 Sep 2011 to 30 Jun 2014 – 18,000 – – – 18,000Interim Report 2011/201231
OUR GOVERNANCE (CONTINUED)Name (Position) Date of grant Vesting periodGranted VestedOutstanding1 Apr 2011 (1) (1), (2)the periodRUAs at duringCancelledduring(3), (5)the periodduringthe periodLapsedduringthe period (4)OutstandingRUAs at30 Sep 2011 (1)David Charles WATT12 Nov 2010 12 Nov 2010 to 30 Jun 2012 21,500 – – – – 21,500(Independent Non-Executive Director)12 Nov 2010 12 Nov 2010 to 30 Jun 2013 21,500 – – – – 21,50023 Sep 2011 23 Sep 2011 to 30 Jun 2013 – 16,000 – – – 16,00023 Sep 2011 23 Sep 2011 to 30 Jun 2014 – 16,000 – – – 16,000Richard WONG Yue Chim13 Feb 2009 13 Feb 2009 to 30 Jun 2011 30,500 – (30,500) – – –(Independent Non-Executive Director)24 Sep 2009 24 Sep 2009 to 30 Jun 2011 24,000 – (24,000) – – –Former Director24 Sep 2009 24 Sep 2009 to 30 Jun 2012 24,000 – – – – 24,00012 Nov 2010 12 Nov 2010 to 30 Jun 2012 24,000 – – – – 24,00012 Nov 2010 12 Nov 2010 to 30 Jun 2013 24,000 – – – – 24,00023 Sep 2011 23 Sep 2011 to 30 Jun 2013 – 18,000 – – – 18,00023 Sep 2011 23 Sep 2011 to 30 Jun 2014 – 18,000 – – – 18,000Allan ZEMAN13 Feb 2009 13 Feb 2009 to 30 Jun 2011 27,500 – (27,500) – – –(Former Independent Non-Executive24 Sep 2009Director)24 Sep 2009 to 30 Jun 2011 21,500 – (21,500) – – –24 Sep 2009 24 Sep 2009 to 30 Jun 2012 21,500 – – – (7,506) (6) 13,99412 Nov 2010 12 Nov 2010 to 30 Jun 2012 22,000 – – – (13,008) (6) 8,99212 Nov 2010 12 Nov 2010 to 30 Jun 2013 22,000 – – – (16,420) (6) 5,580Other participants(in aggregate)5 May 2008 5 May 2008 to 4 May 2011 273,240 – (114,778) – (158,462) –5 May 2008 5 May 2008 to 4 May 2012 273,240 – – – – 273,24013 Feb 2009 13 Feb 2009 to 30 Jun 2011 342,000 – (340,000) – (2,000) –24 Sep 2009 24 Sep 2009 to 30 Jun 2011 311,500 – (311,500) – – –24 Sep 2009 24 Sep 2009 to 30 Jun 2012 311,500 – – – (71,500) 240,00012 Nov 2010 12 Nov 2010 to 30 Jun 2012 725,500 – – – (48,000) 677,50012 Nov 2010 12 Nov 2010 to 30 Jun 2013 725,500 – – – (48,000) 677,50023 Sep 2011 23 Sep 2011 to 30 Jun 2013 – 827,500 – – – 827,50023 Sep 2011 23 Sep 2011 to 30 Jun 2014 – 827,500 – – – 827,500Total 5,205,995 2,475,000 (1,428,778) – (364,896) 5,887,32132<strong>The</strong> <strong>Link</strong> Real Estate Investment Trust
OUR GOVERNANCE (CONTINUED)Notes:(1)<strong>The</strong>se figures represent the maximum number of units that may be issued on vesting of the RUAs. <strong>The</strong> actual number of units that will finally vestand be issued to each participant may range from zero to such maximum number depending on whether, and the extent to which, the relevant vestingconditions are met.(2)<strong>The</strong> closing price of the units as quoted on the Hong Kong Stock Exchange was HK$26.75 per unit on 22 September 2011, being the business dayimmediately preceding the date on which the RUAs were granted. On the assumption that the RUAs granted during the period finally vested for themaximum number of units, the estimated fair value of such RUAs would amount to approximately HK$53.5 million as at 30 September 2011 based onthe valuation of an independent valuer.(3)<strong>The</strong> weighted average closing price of the units on the business days immediately preceding the dates on which the RUAs vested in the period isHK$26.39 per unit.(4)<strong>The</strong>se figures represent the maximum number of units relating to the RUAs lapsed in the period. <strong>The</strong> CCAs granted in conjunction with such RUAs alsolapsed simultaneously.(5)<strong>The</strong> RUAs in the above table were all granted in conjunction with CCAs pursuant to which, on vesting of the RUAs, each relevant grantee will be entitledto receive a cash amount equal to the aggregate distributions per unit paid during the relevant vesting period, multiplied by the actual number of unitsthat finally vest and be issued. An aggregate amount of HK$3,320,862.23 was paid in the period for the CCAs vested. Based on the maximum number ofunits to be issued in respect of the RUAs granted but not yet vested in the period, the aggregate weighted average value carried by each of the CCAs at30 September 2011 was HK$0.8736 per unit.(6)<strong>The</strong>se represent RUAs lapsed as a result of Dr Allan ZEMAN’s retirement as an Independent Non-Executive Director on 13 July 2011. <strong>The</strong> CCAs grantedin conjunction with such RUAs also lapsed simultaneously.<strong>The</strong> RUAs and CCAs are to be expensed through <strong>The</strong> <strong>Link</strong> <strong>REIT</strong>’s consolidated income statementover the relevant vesting period. Further details of the LTI Plan are set out in Note 17 to thecondensed consolidated interim financial information in this interim report.INTERESTS OF SUBSTANTIAL UNITHOLDERS, DIRECTORS ANDCONNECTED PERSONSInterests of Substantial Unitholders in UnitsAccording to disclosure of interests to the Hong Kong Stock Exchange and the Manager pursuantto the provisions of Part XV of the SFO and the register kept by the Manager, persons having 5% ormore interests in the units of <strong>The</strong> <strong>Link</strong> <strong>REIT</strong> as at 30 September 2011 were as follows:NameCapacityNumber of units inLong Position (L)/Short Position (S)/Lending Pool (LP)Approximatepercentage oftotal units in issue%(1)Blackrock, Inc.Interests of controlledcorporations(L) 140,615,401(S) 51,4456.250.00Capital Research and Management Company Investment Manager (L) 156,727,000 6.96Commonwealth Bank of AustraliaInterests of controlledcorporations(L) 157,472,434 7.00<strong>The</strong> Bank of New York Mellon CorporationInterest of a controlledcorporation(L) 155,104,556(LP) 150,067,8066.896.67Note:(1)<strong>The</strong> approximate percentages were calculated based on 2,249,540,808 units in issue as at 30 September 2011 (rounded down to two decimal places).Save as disclosed above, there were no other persons having 5% or more interests in the units as at30 September 2011.Interim Report 2011/201233
OUR GOVERNANCE (CONTINUED)Interests of Directors in UnitsAccording to disclosure of interests to the Hong Kong Stock Exchange and the Manager pursuant toPart XV of the SFO and the register kept by the Manager, the interests of the Directors in units andunderlying units of <strong>The</strong> <strong>Link</strong> <strong>REIT</strong> as at 30 September 2011 were as follows:NamePersonalinterest (2)Number of unitsFamilyinterestCorporateinterestOtherinterestInterest inunderlyingunits (3)Total interestheld at30 Sep 2011Approximatepercentageof total unitsin issue (4)%Total interestheld at31 Mar 2011Current DirectorsChairman (also an IndependentNon-Executive Director)Nicholas Robert SALLNOW-SMITH 327,025 – – – 319,000 646,025 0.0287 537,602Executive DirectorsGeorge Kwok Lung HONGCHOY 283,672 – – – 925,015 1,208,687 0.0537 838,515Andy CHEUNG Lee Ming – – – – 297,000 297,000 0.0132 168,000Non-Executive DirectorIan Keith GRIFFITHS 70,604 – – – 87,500 158,104 0.0070 128,549Independent Non-Executive DirectorsMichael Ian ARNOLD 114,224 – – – 113,000 227,224 0.0101 190,224William CHAN Chak Cheung – – – – 91,000 91,000 0.0040 52,000Anthony CHOW Wing Kin 308,999 – – – 115,000 423,999 0.0188 379,589Patrick FUNG Yuk Bun 115,620 – – – 97,000 212,620 0.0095 181,416Stanley KO Kam Chuen 102,005 – – – 108,000 210,005 0.0093 172,995David Charles WATT – – – – 75,000 75,000 0.0033 43,000Richard WONG Yue Chim 96,347 – – – 108,000 204,347 0.0091 157,670Former Independent Non-ExecutiveDirectorAllan ZEMAN (1) 95,023 – – – 28,566 123,589 0.0055 160,523Notes:(1)<strong>The</strong>se interests in units and underlying units (referring to unvested RUAs) represented only Dr Allan ZEMAN’s position as at 13 July 2011 (his date ofretirement), adjusted for those RUAs lapsed on his retirement (also see note 6 to the “Long-term Incentive Plan” section above).(2)<strong>The</strong> personal interests of the Directors in units as stated above are long position interests. <strong>The</strong>re is no short position interest held by any Director.(3)<strong>The</strong>se interests in underlying units are long position interests and represent the maximum number of units which may be issued to the Directors onvesting of the RUAs granted to them under the LTI Plan.(4)<strong>The</strong> approximate percentages were calculated based on 2,249,540,808 units in issue as at 30 September 2011.Save as disclosed above, none of the Directors or any of their respective associates held anyinterests in the units or underlying units as at 30 September 2011.34<strong>The</strong> <strong>Link</strong> Real Estate Investment Trust
OUR GOVERNANCE (CONTINUED)Interests of Connected Persons in UnitsAfter making reasonable enquiry and according to information available to the Manager, thefollowing persons (other than Directors and any of their respective associates (5) ), being connectedpersons to <strong>The</strong> <strong>Link</strong> <strong>REIT</strong> as defined under the Code on Real Estate Investment Trusts (the “<strong>REIT</strong>Code”), held interests in units of <strong>The</strong> <strong>Link</strong> <strong>REIT</strong> as at 30 September 2011 as follows:Number of unitsApproximateNumber ofheld as atpercentage ofunits held as atName30 Sep 2011total units in issue (4)31 Mar 2011%<strong>The</strong> Hongkong and Shanghai Banking Corporation Limited(“HSBC”) and its subsidiaries (1) 2,169,665 0.0964 2,155,592Wing Hang Bank, Limited (2) (“Wing Hang Bank”) 100,000 0.0044 100,000Dah Sing Life Assurance Company Limited (3) 1,310,500 0.0583 903,000Dah Sing Insurance Company Limited (3) 25,500 0.0011 25,000Notes:(1)<strong>The</strong> Trustee is an indirect subsidiary of HSBC and hence HSBC and its subsidiaries are connected persons to <strong>The</strong> <strong>Link</strong> <strong>REIT</strong>.(2)Wing Hang Bank is a connected person to <strong>The</strong> <strong>Link</strong> <strong>REIT</strong> as Dr Patrick FUNG Yuk Bun, director of the Manager, is the chairman of Wing Hang Bank.(3)Dah Sing Life Assurance Company Limited and Dah Sing Insurance Company Limited became connected persons to <strong>The</strong> <strong>Link</strong> <strong>REIT</strong> as Mr NicholasRobert SALLNOW-SMITH, Chairman of the Manager, has been appointed an independent non-executive director of each of these two companies.(4)<strong>The</strong> approximate percentages stated above were calculated based on 2,249,540,808 units in issue as at 30 September 2011.(5)<strong>The</strong> interests of Directors (as connected persons to <strong>The</strong> <strong>Link</strong> <strong>REIT</strong>) are disclosed in the “Interests of Directors in Units” section above.CONNECTED PARTY TRANSACTIONS<strong>The</strong> following table sets out the connected persons (as defined under the <strong>REIT</strong> Code) who hadentered into transactions with <strong>The</strong> <strong>Link</strong> <strong>REIT</strong> and/or its subsidiaries during the period:Name of Connected PersonRelationship with<strong>The</strong> <strong>Link</strong> <strong>REIT</strong>Natureof theTransactionsIncomeDerivedHK$’MExpensesIncurredHK$’M<strong>The</strong> <strong>Link</strong> Management Limited Manager of <strong>The</strong> <strong>Link</strong> <strong>REIT</strong> Management fee (1) N/A (223.5) (1)HSBC Institutional Trust Services(Asia) LimitedTrustee of <strong>The</strong> <strong>Link</strong> <strong>REIT</strong> Trustee’s fee (2) N/A (2.8) (2)Jones Lang LaSalle Limited Principal Valuer of <strong>The</strong> <strong>Link</strong> <strong>REIT</strong> Valuation fee N/A (0.9)HSBC and its subsidiaries (excluding theTrustee and its proprietary subsidiaries)(“HSBC Group”)Trustee’s holding company andsubsidiaries of such holding companyTenancy/licence (3) and otherincomeInterest expenses and financingcharges10.2 (4) N/AN/A (39.6)Arrangement fees and bankchargesN/A (1.4)Interim Report 2011/201235
OUR GOVERNANCE (CONTINUED)Name of Connected PersonRelationship with<strong>The</strong> <strong>Link</strong> <strong>REIT</strong>Natureof theTransactionsIncomeDerivedHK$’MExpensesIncurredHK$’MIndustrial and Commercial Bank of China(Asia) Limited (“ICBC (Asia)”)Associate of Professor Richard WONGYue ChimTenancy/licence (3) 2.6 (4) N/AInterest income 1.6 N/AInterest expenses, financingcharges, arrangement fees andbank chargesN/A (0.3) (5)Wing Hang Bank Associate of Dr Patrick FUNG Yuk Bun Interest income 0.4 N/AAedas Limited and its subsidiaries Associates of Mr Ian Keith GRIFFITHS Fees for architectural andrenovation consultancyservicesN/A (1.8)Dah Sing Bank, Limited (“Dah Sing Bank”)Associate of Mr Nicholas RobertSALLNOW-SMITHTenancy/licence (3) 2.6 (4) N/AInterest income 0.1 N/AInterest expenses and financingchargesArrangement fees and bankchargesN/A (0.5)N/A (0.1)N/A (11.7)DTZ Debenham Tie Leung Limited Associate of Mr David Charles WATT Agency commission to act for <strong>The</strong>Fung Plaza (6)<strong>Link</strong> <strong>REIT</strong> in the acquisition ofthe commercial portion of NanNotes:(1)<strong>The</strong> Manager, as an internalised management company of <strong>The</strong> <strong>Link</strong> <strong>REIT</strong>, recovers its expenses from <strong>The</strong> <strong>Link</strong> <strong>REIT</strong> on a cost recovery basis.(2)<strong>The</strong> Trustee is entitled to a fee at the rate of 0.008% per annum of the latest property value as determined in the latest annual valuation report of theindependent valuer, subject to a minimum of HK$150,000 per month.(3)For shops, ATMs and showcases at various locations.(4)Amounts excluding deposits received.(5)<strong>The</strong> amount included arrangement fees and bank charges paid to ICBC (Asia) of approximately HK$39,000.(6)Details of such connected party transaction were set out in the announcement of <strong>The</strong> <strong>Link</strong> <strong>REIT</strong> dated 9 June 2011.Apart from the above, <strong>The</strong> <strong>Link</strong> <strong>REIT</strong> and/or its subsidiaries had also entered into connected partytransactions in the period with Hong Kong Youth Arts Foundation (associate of Mr Nicholas RobertSALLNOW-SMITH); Hong Kong Securities Institute (associate of Mr George Kwok Lung HONGCHOY);BEAM Society Limited (associate of Mr Michael Ian ARNOLD); and Asia Pacific Real EstateAssociation (associate of both Mr Michael Ian ARNOLD and Mr George Kwok Lung HONGCHOY).None of the aggregate value of the connected party transactions with each of these connectedpersons in the period was higher than HK$100,000.36<strong>The</strong> <strong>Link</strong> Real Estate Investment Trust
OUR GOVERNANCE (CONTINUED)Lease Transactions with Connected PersonsIn addition to those tenancies set out on page 91 of the annual report 2011 of <strong>The</strong> <strong>Link</strong> <strong>REIT</strong> (of whichthese tenancies still remained in effect up to period end), the following lease transactions wereentered into by <strong>The</strong> <strong>Link</strong> <strong>REIT</strong> and/or its subsidiaries with connected persons (as defined under the<strong>REIT</strong> Code) in the period with an annual rent exceeding HK$1 million:Name of tenant Nature of transaction Lease term RentHK$’MRental depositreceived as at30 Sep 2011HK$’MICBC (Asia)Renewed tenancy for shops F18& F19 A-C at Oi Man ShoppingCentreTerm of 3 years expiring on31/08/20141.3 (1) 0.4Tenancy for shops 21-23, Ground Floorat Tai Hing Commercial CentreTerm of 2 years expiring on31/07/20131.1 (1) 0.3HSBCRenewed tenancy for shopsL202-L206 at Lok Fu PlazaTerm of 6 months expiring on21/02/20121.1 0.6 (2)Notes:(1)<strong>The</strong> rent is calculated by the monthly base rent on a 12-month basis as if such rent would have been received throughout the financial year ending 31March 2012.(2)In the form of bank guarantee.Provision of Banking and Financial Services by Connected Persons<strong>The</strong> <strong>Link</strong> <strong>REIT</strong> and its subsidiaries engaged the HSBC Group, ICBC (Asia), Wing Hang Bank and DahSing Bank to provide ordinary course banking and financial services in the period. Further detailsare set out in Note 24 to the condensed consolidated interim financial information in this interimreport.In addition, HSBC acted as dealer in two tranches of fixed rate private notes for HK$300 millionand HK$203 million, respectively, issued pursuant to the Guaranteed Euro Medium Term NoteProgramme in the period.Waivers from Strict ComplianceDuring the period, the Manager complied with the terms and conditions of various waivers grantedby the SFC from strict compliance with certain requirements of Chapter 8 of the <strong>REIT</strong> Code inrespect of certain connected party transactions entered into by <strong>The</strong> <strong>Link</strong> <strong>REIT</strong> with its connectedpersons (as defined in the <strong>REIT</strong> Code).Interim Report 2011/201237
OUR GOVERNANCE (CONTINUED)INVESTOR RELATIONS<strong>The</strong> Manager has continually communicated with both the stakeholders and the Unitholdersduring the period under review. Since 1 April 2011, the Manager had participated in the followingroad-shows and investors’ conferences to enhance investors’ understanding of <strong>The</strong> <strong>Link</strong> <strong>REIT</strong>’soperations and developments.Month Event Organiser Venue2011April Property Access Day Bank of America Merrill Lynch Hong KongApril APREA Property Leaders Forum Macquarie BeijingApril DBS Vickers Pulse of Asia Conference DBS Vickers Hong KongJune Post Final Results Roadshow Bank of America Merrill Lynch Hong Kong/SingaporeJune Regional Property Access Conference CLSA Hong KongJune Post Final Results Roadshow Macquarie SydneyJune Asian Financials Conference HSBC LondonJune Real Estate Investment World Asia 2011 Terrapinn SingaporeJune Hong Kong/China Investment Seminar Daiwa Hong KongJuly Hong Kong/China Mini Conference Citi Hong KongAugust North Asia Conference Macquarie Hong KongSeptember 2011 Global Real Estate Conference Bank of America Merrill Lynch New YorkSeptember Daiwa Asia <strong>REIT</strong> day Daiwa Hong KongSeptember Hong Kong/China Property Conference 2011 UBS Hong Kong38<strong>The</strong> <strong>Link</strong> Real Estate Investment Trust
AUDITOR’S REVIEW <strong>REPORT</strong><strong>REPORT</strong> ON REVIEW OF <strong>INTERIM</strong> FINANCIAL INFORMATIONTO THE BOARD OF DIRECTORS OF THE LINK MANAGEMENT LIMITED(as “Manager” of THE LINK REAL ESTATE INVESTMENT TRUST)IntroductionWe have reviewed the interim financial information set out on pages 40 to 67, which comprises the condensedconsolidated statement of financial position of <strong>The</strong> <strong>Link</strong> Real Estate Investment Trust (“<strong>The</strong> <strong>Link</strong> <strong>REIT</strong>”) and itssubsidiaries (together, the “Group”) as at 30 September 2011 and the related condensed consolidated incomestatement, the condensed consolidated statement of comprehensive income, the condensed consolidated statementof changes in equity and net assets attributable to unitholders, the condensed consolidated statement of cash flowsand the consolidated statement of distributions for the six-month period then ended, and a summary of significantaccounting policies and other explanatory notes. <strong>The</strong> Rules Governing the Listing of Securities on <strong>The</strong> Stock Exchangeof Hong Kong Limited require the preparation of a report on interim financial information to be in compliance withthe relevant provisions thereof and Hong Kong Accounting Standard 34 “Interim Financial Reporting” issued by theHong Kong Institute of Certified Public Accountants. <strong>The</strong> directors of the Manager are responsible for the preparationand presentation of this interim financial information in accordance with Hong Kong Accounting Standard 34 “InterimFinancial Reporting”. Our responsibility is to express a conclusion on this interim financial information based on ourreview and to report our conclusion solely to you, as a body, in accordance with our agreed terms of engagement and forno other purpose. We do not assume responsibility towards or accept liability to any other person for the contents of thisreport.Scope of ReviewWe conducted our review in accordance with Hong Kong Standard on Review Engagements 2410, “Review of InterimFinancial Information Performed by the Independent Auditor of the Entity” issued by the Hong Kong Institute ofCertified Public Accountants. A review of interim financial information consists of making inquiries, primarily ofpersons responsible for financial and accounting matters, and applying analytical and other review procedures. Areview is substantially less in scope than an audit conducted in accordance with Hong Kong Standards on Auditing andconsequently does not enable us to obtain assurance that we would become aware of all significant matters that mightbe identified in an audit. Accordingly, we do not express an audit opinion.ConclusionBased on our review, nothing has come to our attention that causes us to believe that the interim financial informationis not prepared, in all material respects, in accordance with Hong Kong Accounting Standard 34 “Interim FinancialReporting”.PricewaterhouseCoopersCertified Public AccountantsHong Kong, 9 November 2011Interim Report 2011/201239
CONDENSED CONSOLIDATED INCOME STATEMENTFor the six months ended 30 September 2011NoteSix monthsended30 September2011(Unaudited)HK$’MSix monthsended30 September2010(Unaudited)HK$’M(Restated)Revenues 4 2,887 2,621Property operating expenses 6 (846) (856)Net property income 2,041 1,765General and administrative expenses (147) (80)Change in fair values of investment properties 3,272 3,259Operating profit 7 5,166 4,944Interest income 11 1Finance costs on interest bearing liabilities 8 (197) (271)Profit before taxation and transactions with Unitholders 4,980 4,674Taxation 10 (288) (236)Profit for the period, before transactions with Unitholders(Note (i)) 11 4,692 4,438Distributions paid to Unitholders (Note (ii)) (1,286) (1,079)Represented by:3,406 3,359Change in net assets attributable to Unitholders,excluding issues of new units 3,373 3,317Amount arising from cash flow hedging reserve movement 21 33 423,406 3,359<strong>The</strong> notes on pages 46 to 67 are an integral part of these condensed consolidated interim financial information.Notes:(i)(ii)Earnings per unit, based upon profit after taxation and before transactions with Unitholders and the weighted average number of units in issue, is setout in Note 11 to the condensed consolidated interim financial information.This represents the final distribution of HK$1,286 million for the year ended 31 March 2011 (2010: HK$1,079 million) paid during the period.(iii) Total Distributable Income (as defined in the Trust Deed constituting <strong>The</strong> <strong>Link</strong> Real Estate Investment Trust) for the six months ended 30 September2011 is determined in the consolidated statement of distributions. <strong>The</strong> interim distribution declared in respect of this financial period as set out in theconsolidated statement of distributions will be paid to Unitholders on or about 13 January 2012.40<strong>The</strong> <strong>Link</strong> Real Estate Investment Trust
CONDENSED CONSOLIDATED STATEMENT OF COMPREHENSIVE INCOMEFor the six months ended 30 September 2011NoteBeforetransactionswith Unitholders(Unaudited)HK$’MTransactionswith Unitholders(Note (i))(Unaudited)HK$’MAftertransactionswith Unitholders(Unaudited)HK$’MSix months ended 30 September 2011Profit for the period 4,692 (4,659) 33Other comprehensive lossCash flow hedging reserve (33) - (33)Total comprehensive income forthe period (ii) 4,659 (4,659) -NoteBeforetransactionswith Unitholders(Unaudited)HK$’M(Restated)Transactionswith Unitholders(Note (i))(Unaudited)HK$’M(Restated)Aftertransactionswith Unitholders(Unaudited)HK$’MSix months ended 30 September 2010Profit for the period 4,438 (4,396) 42Other comprehensive lossCash flow hedging reserve (42) – (42)Total comprehensive income forthe period (ii) 4,396 (4,396) –<strong>The</strong> notes on pages 46 to 67 are an integral part of these condensed consolidated interim financial information.Notes:(i)Transactions with Unitholders comprise the distributions to Unitholders of HK$1,286 million (2010: HK$1,079 million) and change in net assetsattributable to Unitholders, excluding issues of new units, of HK$3,373 million (2010: HK$3,317 million, as restated).(ii) In accordance with the Trust Deed, <strong>The</strong> <strong>Link</strong> Real Estate Investment Trust is required to distribute to Unitholders not less than 90% of TotalDistributable Income for each financial period. Accordingly, the units contain contractual obligations of the trust to pay cash distributions. <strong>The</strong>Unitholders’ funds are therefore classified as a financial liability rather than equity in accordance with Hong Kong Accounting Standard 32: FinancialInstruments: Presentation. Consistent with Unitholders’ funds being classified as a financial liability, the distributions to Unitholders and change in netassets attributable to Unitholders, excluding issues of new units, are finance costs. Accordingly, the total comprehensive income, after the transactionswith Unitholders, is zero.Interim Report 2011/201241
CONSOLIDATED STATEMENT OF DISTRIBUTIONSFor the six months ended 30 September 2011NoteSix monthsended30 September2011(Unaudited)HK$’MSix monthsended30 September2010(Unaudited)HK$’M(Restated)Profit for the period, before transactions with Unitholders 4,692 4,438Adjustments:Change in fair values of investment properties (3,272) (3,259)Other non-cash income - (7)Total Distributable Income (Note (i)) 1,420 1,172Interim distribution for the period, to be paid to the Unitholders(Note (ii)) 1,420 1,172As a percentage of Total Distributable Income 100% 100%Units in issue as at 30 September 20 2,249,540,808 2,217,446,050Distribution per unit to Unitholders for the period (Note (iii)) HK63.11 cents HK52.86 cents<strong>The</strong> notes on pages 46 to 67 are an integral part of these condensed consolidated interim financial information.Notes:(i)Under the terms of the Trust Deed, the Total Distributable Income is the consolidated profit after taxation attributable to Unitholders (equivalent toprofit for the period, before transactions with Unitholders) adjusted to eliminate the effects of certain non-cash adjustments which have been recordedin the condensed consolidated income statement for the relevant period.(ii) Pursuant to the Trust Deed, <strong>The</strong> <strong>Link</strong> Real Estate Investment Trust is required to ensure that the total amount distributed to Unitholders asdistributions for each financial period shall be no less than 90% of Total Distributable Income, plus at its discretion, any other additional amount thatthe Manager determines is distributable. <strong>The</strong> Manager has decided to distribute 100% of Total Distributable Income as the distribution for the sixmonths ended 30 September 2011 (2010: 100%). <strong>The</strong> interim distribution will be paid to Unitholders on or about 13 January 2012.(iii) <strong>The</strong> interim distribution per unit of HK63.11 cents for the six months ended 30 September 2011 is calculated based on the interim distribution ofHK$1,420 million for the period and 2,249,540,808 units in issue as at 30 September 2011. <strong>The</strong> interim distribution per unit of HK52.86 cents for the sixmonths ended 30 September 2010 was calculated based on the interim distribution of HK$1,172 million for the period and 2,217,446,050 units in issueas at 30 September 2010.42<strong>The</strong> <strong>Link</strong> Real Estate Investment Trust
CONDENSED CONSOLIDATED STATEMENT OF CHANGES IN EQUITYAND NET ASSETS ATTRIBUTABLE TO UNITHOLDERSFor the six months ended 30 September 2011NoteTotalequity(Unaudited)HK$’MNet assetsattributable toUnitholders(Unaudited)HK$’MTotal(Unaudited)HK$’MNet assets attributable to Unitholders at1 April 2011 – 54,975 54,975Issuance of unitsunder distribution reinvestment scheme – 420 420under long-term incentive plan – 39 39Profit for the period ended 30 September2011, before transactions with Unitholders – 4,692 4,692Distributions paid to Unitholders2011 final distribution – (1,286) (1,286)Change in fair values of cash flow hedges 21 (139) – (139)Amount transferred to the condensedconsolidated income statement 21 106 – 106Amount arising from cash flow hedgingreserve movement 21 33 (33) –Change in net assets attributable toUnitholders for the period ended30 September 2011, excluding issuesof new units – 3,373 3,373Net assets attributable to Unitholders at30 September 2011 – 58,807 58,807Net assets attributable to Unitholders at1 April 2010 – 38,444 38,444Prior year adjustments in respect ofchanges in accounting policy – 2,701 2,701Net assets attributable to Unitholders at1 April 2010, as restated – 41,145 41,145Issuance of unitsunder distribution reinvestment scheme – 268 268under long-term incentive plan – 36 36Profit for the period ended 30 September2010, before transactions withUnitholders, as restated – 4,438 4,438Distributions paid to Unitholders2010 final distribution – (1,079) (1,079)Change in fair values of cash flow hedges (218) – (218)Amount transferred to the condensedconsolidated income statement 176 – 176Amount arising from cash flow hedgingreserve movement 42 (42) –Change in net assets attributable toUnitholders for the period ended30 September 2010, excluding issuesof new units, as restated – 3,317 3,317Net assets attributable to Unitholders at30 September 2010, as restated – 44,766 44,766<strong>The</strong> notes on pages 46 to 67 are an integral part of these condensed consolidated interim financial information.44<strong>The</strong> <strong>Link</strong> Real Estate Investment Trust
CONDENSED CONSOLIDATED STATEMENT OF CASH FLOWSFor the six months ended 30 September 2011Operating activitiesNoteSix monthsended30 September2011(Unaudited)HK$’MSix monthsended30 September2010(Unaudited)HK$’MNet cash generated from operating activities 1,849 1,627Investing activitiesAcquisition of Nan Fung Plaza 22 (1,170) –Additions to investment properties (406) (297)Additions to property, plant and equipment (10) (3)Proceeds from disposal of property, plant and equipment – 1Interest income received 9 1(Increase)/decrease in short-term bank deposits with originalmaturity of more than three months (906) 243Net cash used in investing activities (2,483) (55)Financing activitiesProceeds from interest bearing liabilities,net of transaction costs 6,597 2,492Repayment of interest bearing liabilities (4,520) (2,730)Interest expenses paid on interest bearing liabilities (201) (249)Distributions paid to Unitholders (866) (811)Net cash generated from/(used in) financing activities 1,010 (1,298)Net increase in cash and cash equivalents 376 274Cash and cash equivalents at 1 April 699 633Cash and cash equivalents at 30 September 1,075 907<strong>The</strong> notes on pages 46 to 67 are an integral part of these condensed consolidated interim financial information.Interim Report 2011/201245
NOTES TO THE CONDENSED CONSOLIDATED<strong>INTERIM</strong> FINANCIAL INFORMATION1 Corporate information<strong>The</strong> <strong>Link</strong> Real Estate Investment Trust (“<strong>The</strong> <strong>Link</strong> <strong>REIT</strong>”) is a collective investment scheme authorised under section104 of the Securities and Futures Ordinance (Chapter 571 of the Laws of Hong Kong). <strong>The</strong> <strong>Link</strong> <strong>REIT</strong> is governed by atrust deed entered into on 6 September 2005 (as amended and supplemented by the First Supplemental Deed dated4 November 2005, the Second Supplemental Deed dated 8 November 2005, the Third Supplemental Deed dated 16January 2006, the Fourth Supplemental Deed dated 21 November 2006, the Fifth Supplemental Deed dated 13 July2007, the Sixth Supplemental Deed dated 23 July 2007, the Seventh Supplemental Deed dated 5 October 2009 andthe Eighth Supplemental Deed dated 23 July 2010) (together the “Trust Deed”).<strong>The</strong> principal activity of <strong>The</strong> <strong>Link</strong> <strong>REIT</strong> and its subsidiaries (the “Group”) is investment in retail properties and carpark operations in Hong Kong. <strong>The</strong> addresses of the registered offices of the Manager, <strong>The</strong> <strong>Link</strong> ManagementLimited, and the trustee of <strong>The</strong> <strong>Link</strong> <strong>REIT</strong>, HSBC Institutional Trust Services (Asia) Limited, are 33/F., AXA Tower,Landmark East, 100 How Ming Street, Kwun Tong, Kowloon, Hong Kong and 1 Queen’s Road Central, Hong Kong,respectively.2 Basis of preparation<strong>The</strong> condensed consolidated interim financial information for the six months ended 30 September 2011 has beenprepared in accordance with Hong Kong Accounting Standard (“HKAS”) 34 “Interim Financial Reporting” issued bythe Hong Kong Institute of Certified Public Accountants (“HKICPA”). <strong>The</strong> condensed consolidated interim financialinformation should be read in conjunction with the audited consolidated financial statements for the year ended 31March 2011.As at 30 September 2011, the Group’s current liabilities exceeded its current assets by HK$1,541 million. Takinginto account the unutilised committed bank loan facilities of HK$2,310 million, the Group considers that its liquidityand financial position as a whole is healthy and it has a reasonable expectation that the Group has adequateresources to meet its liabilities and commitments as and when they fall due and to continue in operationalexistence for the foreseeable future. Accordingly, it continues to adopt the going concern basis in preparing thecondensed consolidated interim financial information.3 Accounting policies<strong>The</strong> accounting policies adopted are consistent with those set out in the audited consolidated financial statementsfor the year ended 31 March 2011, except for the adoption of the following new standards, amendments andinterpretations issued by the HKICPA which became effective for the six months ended 30 September 2011.HKFRS 1 AmendmentHK(IFRIC)-Int 14 AmendmentHK(IFRIC)-Int 19Improvements to HKFRSs 2010Limited Exemptions from Comparative HKFRS 7 Disclosures forFirst-time AdoptersPrepayments of a Minimum Funding RequirementExtinguishing Financial Liabilities with Equity Instruments<strong>The</strong> adoption of these new standards, amendments and interpretations has not had any significant effect on theaccounting policies or results and financial position of the Group.46<strong>The</strong> <strong>Link</strong> Real Estate Investment Trust
NOTES TO THE CONDENSED CONSOLIDATED <strong>INTERIM</strong> FINANCIAL INFORMATION (CONTINUED)3 Accounting policies (continued)Early adoption of amendments to HKAS 12 “Deferred Tax: Recovery of Underlying Assets”<strong>The</strong> HKICPA issued the amendments to HKAS 12 “Deferred Tax: Recovery of Underlying Assets” in December 2010,effective for annual periods beginning on or after 1 January 2012 with early adoption permitted. <strong>The</strong> amendmentsrequire deferred tax on an investment property, carried under the fair value model in HKAS 40, to be measuredpresuming that an investment property is recovered through sale.<strong>The</strong> Group had early adopted these amendments retrospectively for the year ended 31 March 2011 and certaincomparative figures in the condensed consolidated interim financial information for the period ended 30 September2010 have been restated to reflect the change in accounting policy. <strong>The</strong> effects of adoption are summarised below:(i) On the condensed consolidated income statement for the period ended 30 September 2010HK$’MDecrease in taxation (538)Increase in profit for the period, before transactions with Unitholders 538Increase in net assets attributable to Unitholders 538Increase in earnings per unit, basic and dilutedHK$0.24(ii)<strong>The</strong> effects of adopting the amendments to HKAS12 on the consolidated statement of financial position as at31 March 2011 were disclosed in Note 2(c) to the audited consolidated financial statements for the year ended31 March 2011.<strong>The</strong> following new standards, amendments and interpretations, which have been published but are not yet effective,have not been early adopted in the condensed consolidated interim financial information. <strong>The</strong>se are effective for theGroup’s accounting periods beginning on or after 1 April 2012.HKAS 1 (Revised) Amendment Presentation of Items of Other Comprehensive Income 1HKAS 19 (2011) Employee Benefits 2HKAS 27 (2011) Separate Financial Statements 2HKAS 28 (2011) Investments in Associates and Joint Ventures 2HKFRS 1 AmendmentsSevere Hyperinflation and Removal of Fixed Dates forFirst-time Adopters 3HKFRS 7 Amendments Disclosures – Transfers of Financial Assets 3HKFRS 9 Financial Instruments 2HKFRS 10 Consolidated Financial Statements 2HKFRS 11 Joint Arrangements 2HKFRS 12 Disclosures of Interests in Other Entities 2HKFRS 13 Fair Value Measurement 21effective for accounting periods beginning on or after 1 July 20122effective for accounting periods beginning on or after 1 January 20133effective for accounting periods beginning on or after 1 July 2011Interim Report 2011/201247
NOTES TO THE CONDENSED CONSOLIDATED <strong>INTERIM</strong> FINANCIAL INFORMATION (CONTINUED)3 Accounting policies (continued)<strong>The</strong> Group is in the process of making an assessment of the impact of these new and revised Hong Kong FinancialReporting Standards (“HKFRSs”) upon initial application. So far, the Manager has concluded that while the adoptionof the new or revised HKFRSs may result in new or amended disclosures, these are unlikely to have a significantimpact on the Group’s results of operations and financial position.4 RevenuesRevenues recognised during the period comprise:Six monthsended30 September2011(Unaudited)HK$’MSix monthsended30 September2010(Unaudited)HK$’MRental income from retail properties 2,162 1,967Gross rental revenue from car parks 569 5102,731 2,477Other revenuesAir conditioning service fees 143 136Other property related income 13 8156 144Total revenues 2,887 2,621Leases with tenants provide for monthly base rent and recovery of certain outgoings. Additional rents based onbusiness turnover amounted to HK$56 million (2010: HK$38 million) and had been included in the rental income.48<strong>The</strong> <strong>Link</strong> Real Estate Investment Trust
NOTES TO THE CONDENSED CONSOLIDATED <strong>INTERIM</strong> FINANCIAL INFORMATION (CONTINUED)5 Segment informationRetailpropertiesHK$’MCar parksHK$’MHead officeHK$’MTotalHK$’MFor the six months ended30 September 2011(Unaudited)Revenues 2,317 570 – 2,887Segment results 1,642 399 (147) 1,894Change in fair values ofinvestment properties 2,577 695 – 3,272Interest income 11Finance costs on interestbearing liabilities (197)Profit before taxation andtransactions with Unitholders 4,980Taxation (288)Profit for the period, beforetransactions with Unitholders 4,692Capital expenditure 1,486 20 10 1,516Depreciation – – (13) (13)As at 30 September 2011(Unaudited)Segment assets 61,709 10,555 99 72,363Goodwill 321Derivative financial instruments 148Short-term bank deposits 1,061Cash and cash equivalents 1,075Total assets 74,968Segment liabilities 1,403 114 197 1,714Provision for taxation 268Long-term incentive plan provision 48Interest bearing liabilities 12,554Derivative financial instruments 425Deferred tax liabilities 1,152Total liabilities, excluding netassets attributable toUnitholders 16,161Net assets attributable toUnitholders 58,807Interim Report 2011/201249
NOTES TO THE CONDENSED CONSOLIDATED <strong>INTERIM</strong> FINANCIAL INFORMATION (CONTINUED)5 Segment information (continued)RetailpropertiesHK$’MCar parksHK$’MHead officeHK$’MTotalHK$’M(Restated)For the six months ended30 September 2010 (Unaudited)Revenues 2,111 510 – 2,621Segment results 1,472 293 (80) 1,685Change in fair values ofinvestment properties 2,738 521 – 3,259Interest income 1Finance costs on interestbearing liabilities (271)Profit before taxation andtransactions with Unitholders 4,674Taxation (236)Profit for the period, beforetransactions with Unitholders 4,438Capital expenditure 286 11 3 300Depreciation – – (9) (9)As at 31 March 2011(Audited)Segment assets 57,650 9,838 97 67,585Goodwill 281Derivative financial instruments 34Short-term bank deposits 155Cash and cash equivalents 699Total assets 68,754Segment liabilities 1,347 199 219 1,765Provision for taxation 139Long-term incentive plan provision 67Interest bearing liabilities 10,380Derivative financial instruments 369Deferred tax liabilities 1,059Total liabilities, excluding netassets attributable toUnitholders 13,779Net assets attributable toUnitholders 54,97550<strong>The</strong> <strong>Link</strong> Real Estate Investment Trust
NOTES TO THE CONDENSED CONSOLIDATED <strong>INTERIM</strong> FINANCIAL INFORMATION (CONTINUED)6 Property operating expensesSix monthsended30 September2011(Unaudited)HK$’MSix monthsended30 September2010(Unaudited)HK$’MProperty managers’ fees, security and cleaning 251 212Staff costs (Note 9) 129 123Government rent and rates 87 78Repair and maintenance 103 116Utilities 182 182Promotion and marketing expenses 39 39Estate common area costs 51 49Other property operating expenses 4 57846 8567 Operating profit before finance costs, taxation and transactions with UnitholdersOperating profit before finance costs, taxation and transactionswith Unitholders is stated after charging:Six monthsended30 September2011(Unaudited)HK$’MSix monthsended30 September2010(Unaudited)HK$’MStaff costs (Note 9) 188 174Depreciation of property, plant and equipment 13 9Trustee’s fee 3 2Valuation fee 1 1Auditor’s remuneration 2 2Bank charges 2 2Operating lease charges 6 6Other legal and professional fees 4 6Commission to property agents 12 –Interim Report 2011/201251
NOTES TO THE CONDENSED CONSOLIDATED <strong>INTERIM</strong> FINANCIAL INFORMATION (CONTINUED)8 Finance costs on interest bearing liabilitiesSix monthsended30 September2011(Unaudited)HK$’MSix monthsended30 September2010(Unaudited)HK$’MInterest expenses on interest bearing liabilities wholly repayablewithin five years 66 58Interest expenses on interest bearing liabilities wholly repayablebeyond five years 51 43Other borrowing costs (Note) 93 185210 286Less: capitalised under investment properties (13) (15)197 271Note: Other borrowing costs include HK$106 million (2010: HK$176 million) net losses on interest rate swaps designated as cash flow hedges,HK$22 million (2010: HK$15 million) net gains on interest rate swaps and cross currency swaps designated as fair value hedges and variousbanking and financing charges.9 Staff costsSix monthsended30 September2011(Unaudited)HK$’MSix monthsended30 September2010(Unaudited)HK$’MWages and salaries 183 163Contributions to mandatory provident fund scheme 4 4Long-term incentive plan awards (Note 17) 23 27210 194Less: capitalised under investment properties (22) (20)188 174Staff costs can be further analysed as below:Six monthsended30 September2011(Unaudited)HK$’MSix monthsended30 September2010(Unaudited)HK$’MIncluded under property operating expenses (Note 6) 129 123Included under general and administrative expenses 59 5152188 174<strong>The</strong> <strong>Link</strong> Real Estate Investment Trust
NOTES TO THE CONDENSED CONSOLIDATED <strong>INTERIM</strong> FINANCIAL INFORMATION (CONTINUED)10 TaxationHong Kong profits tax has been provided for at the rate of 16.5% (2010: 16.5%) on the estimated assessable profitfor the period.<strong>The</strong> amount of taxation charged to the condensed consolidated income statement represents:Six monthsended30 September2011(Unaudited)HK$’MSix monthsended30 September2010(Unaudited)HK$’M(Restated)Current taxation 195 154Deferred taxation– Accelerated depreciation allowances 93 82Taxation 288 23611 Earnings per unit based upon profit after taxation and before transactionswith UnitholdersSix monthsended30 September2011(Unaudited)Six monthsended30 September2010(Unaudited)(Restated)Profit after taxation and before transactions with Unitholders HK$4,692 million HK$4,438 millionWeighted average number of units for the period for calculatingbasic earnings per unit 2,238,682,214 2,207,118,833Adjustment for dilutive contingently issuable units underlong-term incentive plan 1,921,518 2,059,471Weighted average number of units for the period for calculatingdiluted earnings per unit 2,240,603,732 2,209,178,304Basic earnings per unit based upon profit after taxationand before transactions with Unitholders HK$2.10 HK$2.01Diluted earnings per unit based upon profit after taxationand before transactions with Unitholders HK$2.09 HK$2.01Interim Report 2011/201253
NOTES TO THE CONDENSED CONSOLIDATED <strong>INTERIM</strong> FINANCIAL INFORMATION (CONTINUED)12 Investment properties(a) Details of the movements of investment properties are as follows:Retailproperties(Unaudited)HK$’MCar parks(Unaudited)HK$’MTotal(Unaudited)HK$’MAt 1 April 2011 57,510 9,808 67,318Acquisition of Nan Fung Plaza(Note 22) 1,130 – 1,130Additions 356 20 376Change in fair values 2,577 695 3,272At 30 September 2011 61,573 10,523 72,096(b)Government leases<strong>The</strong> properties included as investment properties on the condensed consolidated statement of financialposition comprise properties where the Group has legal title under government leases for a fixed number ofyears (with renewal rights in one case). As at 30 September 2011, the remaining lease periods range from 32to 49 years (31 March 2011: 32 to 49 years).(c)Fair values<strong>The</strong> investment properties were revalued on an open market value basis as at 31 March and 30 September2011 by Jones Lang LaSalle Limited, an independent firm of professional qualified valuers and the principalvaluer of <strong>The</strong> <strong>Link</strong> <strong>REIT</strong>.(d)Restriction of the Code on Real Estate Investment Trusts (the “<strong>REIT</strong> Code”)<strong>The</strong> commercial portion of the Nan Fung Plaza was acquired on 11 July 2011 and in accordance with the <strong>REIT</strong>Code, <strong>The</strong> <strong>Link</strong> <strong>REIT</strong> is prohibited from disposing of its property for at least two years from the time suchproperty is acquired, unless the Unitholders have passed a special resolution consenting to the proposeddisposal.(e)Security for the Group’s loan facilitiesAs at 30 September 2011, certain of the Group’s investment properties, amounting to approximately HK$7.2billion (31 March 2011: HK$6.9 billion), were pledged to secure the loan from <strong>The</strong> Hong Kong MortgageCorporation Limited (“HKMC”). No property was pledged to secure any bank loan or medium term note.54<strong>The</strong> <strong>Link</strong> Real Estate Investment Trust
NOTES TO THE CONDENSED CONSOLIDATED <strong>INTERIM</strong> FINANCIAL INFORMATION (CONTINUED)13 Property, plant and equipmentLeaseholdimprovements(Unaudited)HK$’MMotorvehicles(Unaudited)HK$’MEquipment(Unaudited)HK$’MTotal(Unaudited)HK$’MAt 1 April 2011 35 4 37 76Additions 3 – 7 10Depreciation charge forthe period (8) (1) (4) (13)At 30 September 2011 30 3 40 73At 30 September 2011Cost 65 4 89 158Accumulated depreciation (35) (1) (49) (85)Net book value 30 3 40 7314 Trade and other receivables30 September2011(Unaudited)HK$’M31 March2011(Audited)HK$’MTrade receivables 51 55Less: provision for impairment of trade receivables (2) (4)Trade receivables – net 49 51Other receivables 104 108153 159Receivables are denominated in Hong Kong Dollars and the carrying amounts of these receivables approximatetheir fair values.<strong>The</strong>re are no specific credit terms given to the tenants. <strong>The</strong> trade receivables are generally fully covered by therental deposits/bank guarantees from corresponding tenants.Interim Report 2011/201255
NOTES TO THE CONDENSED CONSOLIDATED <strong>INTERIM</strong> FINANCIAL INFORMATION (CONTINUED)14 Trade and other receivables (continued)<strong>The</strong> ageing analysis of trade receivables is as follows:30 September2011(Unaudited)HK$’M31 March2011(Audited)HK$’M0 – 30 days 48 4831 – 90 days 2 4Over 90 days 1 351 55Monthly rentals in respect of retail properties are payable in advance by tenants in accordance with the leaseswhile daily gross receipts from car parks are received from the car park operators in arrears.15 Cash and cash equivalents and short-term bank deposits30 September2011(Unaudited)HK$’M31 March2011(Audited)HK$’MCash in hand 1 1Cash at bank 26 36Short-term bank deposits with original maturity of less thanthree months 1,048 662Cash and cash equivalents 1,075 699Short-term bank deposits with original maturity of more thanthree months 1,061 1552,136 85456<strong>The</strong> <strong>Link</strong> Real Estate Investment Trust
NOTES TO THE CONDENSED CONSOLIDATED <strong>INTERIM</strong> FINANCIAL INFORMATION (CONTINUED)16 Trade payables, receipts in advance and accruals30 September2011(Unaudited)HK$’M31 March2011(Audited)HK$’MTrade payables 77 75Receipts in advance 99 123Accruals 714 828890 1,026<strong>The</strong> ageing analysis of trade payables is as follows:30 September2011(Unaudited)HK$’M31 March2011(Audited)HK$’M0 – 30 days 45 6031 – 90 days 31 14Over 90 days 1 177 75Payables are denominated in Hong Kong Dollars and the carrying amounts of these payables approximate their fairvalues.17 Long-term incentive plan provision30 September2011(Unaudited)HK$’M31 March2011(Audited)HK$’MLong-term incentive plan provision 48 67Less: current portion of long-term incentive plan provision (34) (38)Non-current portion of long-term incentive plan provision 14 29Interim Report 2011/201257
NOTES TO THE CONDENSED CONSOLIDATED <strong>INTERIM</strong> FINANCIAL INFORMATION (CONTINUED)17 Long-term incentive plan provision (continued)A long-term incentive plan (the “Plan”) was approved and adopted by ordinary resolution on 23 July 2007 at theannual general meeting of the Unitholders. <strong>The</strong> Plan shall be valid and effective for 10 years commencing on theadoption date.Under the Plan, the Manager may grant three types of awards, the Restricted Unit Awards (“RUA”), Unit Optionsand Conditional Cash Awards (“CCA”) (collectively the “Awards”) to directors and key employees of the Manager.Awards are approved by the Human Resources and Compensation Committee and, in the case of directors of theManager, by the Board on recommendation of Remuneration Committee. No Unit Option has been granted sincethe adoption date.Upon the vesting of RUA, units are to be issued to the grantees on a sliding scale, depending on the scale ofachievement against the total Unitholders return (“TUR”) or net property income (“NPI”), where appropriate,providing that the minimum criteria for the performance measure determined by the Human Resources andCompensation Committee has been met.During the period, certain directors and employees of the Manager were granted the RUA and CCA at nil monetaryconsideration. <strong>The</strong> RUA granted under the Plan, in general, will vest approximately two to three years from the dateof grant.<strong>The</strong> eventual numbers of units to be issued under the RUA on vesting, which are linked to the performance of <strong>The</strong><strong>Link</strong> <strong>REIT</strong> based on the TUR, NPI and/or certain vesting conditions, where appropriate, will range from 0% to 300%of the RUA granted. CCA is granted in conjunction with the grant of RUA, bestowing upon the grantee a conditionalright to receive a cash payment representing an amount equivalent to the aggregate of the distributions per unitto Unitholders during the vesting period, multiplied by the number of units that will eventually be issued to suchgrantee pursuant to RUA vested.During the vesting period, a liability is recognised representing the estimated fair value of the Awards grantedand the portion of the vesting period expired as at the reporting date. <strong>The</strong> fair value of the Awards was estimatedat the reporting date by Towers Watson Hong Kong Limited, an independent external valuer based on valuationtechniques and assumptions on unit prices, lives of the Awards and distribution pay-out rates. <strong>The</strong> change in fairvalue of the outstanding Awards was charged to the condensed consolidated income statement. In the event thatthe vesting conditions are not met, the amount previously accrued will be written back accordingly.During the period, the Group issued 1,428,778 units for RUAs vested under the Plan.58<strong>The</strong> <strong>Link</strong> Real Estate Investment Trust
NOTES TO THE CONDENSED CONSOLIDATED <strong>INTERIM</strong> FINANCIAL INFORMATION (CONTINUED)17 Long-term incentive plan provision (continued)Movements in the number of RUA during the period and the maximum number of units to be issued upon vesting ofRUA are as follows:Date of grantVesting periodOutstandingas at1 April 2011Grantedduringthe periodVestedduringthe period (i)Lapsedduringthe periodOutstandingas at30 September 2011Maximum to beissued onvesting date (ii)5 May 2008 5 May 2008 to 4 May 2011 117,150 – (114,778) (2,372) – –5 May 2008 to 4 May 2012 117,150 – – – 117,150 273,24016 January 2009 16 January 2009 to15 January 2012 140,515 – – – 140,515 140,51513 February 2009 13 February 2009 to30 June 2011 322,500 – (321,500) (iii) (1,000) – –24 September 2009 24 September 2009 to30 June 2011 335,500 – (335,500) (iii) – – –24 September 2009 to30 June 2012 335,500 – – (39,503) 295,997 591,99412 November 2010 12 November 2010 to30 June 2012 633,000 – – (30,504) 602,496 1,204,99212 November 2010 to30 June 2013 633,000 – – (32,210) 600,790 1,201,58023 September 2011 23 September 2011 to30 June 2013 – 618,750 – – 618,750 1,237,50023 September 2011 to30 June 2014 – 618,750 – – 618,750 1,237,500Subtotal 2,634,315 1,237,500 (771,778) (105,589) 2,994,448 5,887,321Additional units vested over 100% of the RUA granted – – (657,000) (iii) – – –Total 2,634,315 1,237,500 (1,428,778) (105,589) 2,994,448 5,887,321Notes:(i) RUA vesting percentages during the period ranged from 98% to 200%.(ii)If certain vesting conditions are met.(iii) Additional units over 100% of the RUA granted were vested pursuant to the relevant vesting conditions.Interim Report 2011/201259
NOTES TO THE CONDENSED CONSOLIDATED <strong>INTERIM</strong> FINANCIAL INFORMATION (CONTINUED)18 Interest bearing liabilities30 September2011(Unaudited)HK$’M31 March2011(Audited)HK$’MBank borrowings 4,855 4,268HKMC loan (secured) 4,000 4,000Medium term notes 3,699 2,11212,554 10,380Less: current portion of interest bearing liabilities (1,850) (2,598)Non-current portion of interest bearing liabilities 10,704 7,782Interest bearing liabilities are repayable as follows:30 September2011(Unaudited)HK$’M31 March2011(Audited)HK$’MDue in the first yearBank borrowings 1,850 2,598Due in the second yearHKMC loan (secured) 1,000 –Bank borrowings 665 –1,665 –Due in the third yearHKMC loan (secured) 2,000 1,000Bank borrowings – 6642,000 1,664Due in the fourth yearHKMC loan (secured) 1,000 2,000Bank borrowings 607 –1,607 2,000Due in the fifth yearBank borrowings 1,733 1,006HKMC loan (secured) – 1,000Medium term notes 186 –1,919 2,006Due beyond the fifth yearMedium term notes 3,513 2,11212,554 10,38060<strong>The</strong> <strong>Link</strong> Real Estate Investment Trust
NOTES TO THE CONDENSED CONSOLIDATED <strong>INTERIM</strong> FINANCIAL INFORMATION (CONTINUED)18 Interest bearing liabilities (continued)Notes:(i)(ii)Except for a bank loan of HK$416 million (31 March 2011: HK$415 million) which is denominated in New Zealand Dollars and mediumterm notes of HK$186 million (31 March 2011: Nil) which is denominated in Australian Dollars, all the other interest bearing liabilities aredenominated in Hong Kong Dollars.<strong>The</strong> effective interest rate of the interest bearing liabilities (taking into account interest rate swap contracts and cross currency swap contracts)at the reporting date was 3.45% (31 March 2011: 3.72%). <strong>The</strong> carrying amounts of the interest bearing liabilities approximate their fair values.19 Derivative financial instruments30 September2011(Unaudited)HK$’M31 March2011(Audited)HK$’MDerivative assetsNon-current itemDesignated as cash flow hedge – interest rate swaps 1 –Designated as fair value hedge– interest rate swaps 131 19– cross currency swaps 16 15148 34Derivative liabilitiesCurrent itemDesignated as cash flow hedge – interest rate swaps (5) (37)Notes:Non-current itemDesignated as cash flow hedge – interest rate swaps (398) (332)Designated as fair value hedge – cross currency swaps (22) –(420) (332)(425) (369)(277) (335)(i)(ii)<strong>The</strong> Group uses interest rate swaps and cross currency swaps (swapping from foreign currencies to Hong Kong Dollars) to minimise itsexposure to movements in interest rates and foreign currency exchange rates in relation to its interest bearing liabilities. <strong>The</strong> fair values ofthese interest rate swaps and cross currency swaps are classified as non-current items should the remaining maturities of the hedged itemsextend for more than 12 months. Any change in fair values of the effective portion of the cash flow hedges in relation to interest rate swaps isrecognised in the hedging reserve. Any change in fair values of the fair value hedges in relation to interest rate swaps and any change in fairvalues of cross currency swaps are recognised directly in the condensed consolidated income statement. A net amount of HK$33 million (2010:HK$42 million) has been debited to the hedging reserve during the period as further set out in Note 21.As at 30 September 2011, the derivative financial instruments qualifying as cash flow hedges have, in effect, provided the Group with an averagefixed interest rate period of 2.7 years on HK$5.3 billion borrowings (31 March 2011: 3.1 years on HK$5.1 billion borrowings) from the reportingdate. <strong>The</strong> notional principal amount and the weighted average fixed interest rate of the outstanding floating rates to fixed rates interest rateswap contracts as at 30 September 2011 were HK$5.3 billion (31 March 2011: HK$5.1 billion) and 4.27% (31 March 2011: 4.39%) respectively.(iii) As at 30 September 2011, the derivative financial instruments qualifying as fair value hedges have, in effect, converted part of the Group’sborrowings into Hong Kong Dollars floating rates interest bearing liabilities. <strong>The</strong> notional principal amounts of the outstanding interest rateswap contracts and cross currency swap contracts qualifying as fair value hedges as at 30 September 2011 were HK$1.5 billion (31 March 2011:HK$1 billion) and HK$607 million (31 March 2011: HK$650 million) respectively.(iv) Gains and losses on interest rate swap contracts recognised in the hedging reserve (Note 21) as at 30 September 2011 will be released to thecondensed consolidated income statement.Interim Report 2011/201261
NOTES TO THE CONDENSED CONSOLIDATED <strong>INTERIM</strong> FINANCIAL INFORMATION (CONTINUED)20 Units in issueNumber of unitsAt 1 April 2011 2,232,284,540Units issued under distribution reinvestment scheme 15,827,490Units issued under long-term incentive plan 1,428,778At 30 September 2011 2,249,540,808Last traded price of the units as at 30 September 2011 was HK$24.70 (31 March 2011: HK$24.35) per unit. Basedon 2,249,540,808 units in issue as at 30 September 2011 (31 March 2011: 2,232,284,540 units), market capitalisationwas HK$55,564 million (31 March 2011: HK$54,356 million).21 ReservesHedging reserve(Unaudited)HK$’MEarnings retainedfor cash flowhedge adjustments(Unaudited)HK$’MTotal reserves(Unaudited)HK$’MAt 1 April 2011 (369) 369 –Cash flow hedges:– Change in fair values (139) – (139)– Amount transferred to the condensedconsolidated income statement (Note) 106 – 106Net assets attributable to Unitholders:(33) – (33)– Amount arising from cash flow hedgingreserve movement – 33 33At 30 September 2011 (402) 402 –Note: Amount transferred to the condensed consolidated income statement in respect of cash flow hedges was included in “Finance costs oninterest bearing liabilities” (Note 8).62<strong>The</strong> <strong>Link</strong> Real Estate Investment Trust
NOTES TO THE CONDENSED CONSOLIDATED <strong>INTERIM</strong> FINANCIAL INFORMATION (CONTINUED)22 Acquisition of Nan Fung PlazaOn 8 June 2011, <strong>The</strong> <strong>Link</strong> <strong>REIT</strong>, through a wholly owned subsidiary, entered into a sale and purchase agreement toacquire the commercial portion of the Nan Fung Plaza from certain vendors which are companies of the Nan Funggroup at a cash consideration of HK$1.17 billion. <strong>The</strong> transaction was completed on 11 July 2011. <strong>The</strong> purchaseconsideration payable to Nan Fung group was HK$1.17 billion, drawn down from <strong>The</strong> <strong>Link</strong> <strong>REIT</strong>’s own cashresources and existing debt facilities. <strong>The</strong> acquisition is expected to enhance distribution yield of <strong>The</strong> <strong>Link</strong> <strong>REIT</strong> andcapitalise on the synergy value when the operations of Hau Tak Shopping Centre are combined with those of NanFung Plaza.Nan Fung Plaza contributed revenues of HK$14 million and NPI of HK$11 million since the acquisition date, whilesuch information before the acquisition date is not available to <strong>The</strong> <strong>Link</strong> <strong>REIT</strong>.<strong>The</strong> fair value of the investment property and goodwill arising from the acquisition are as follows:Fair valueHK$’MInvestment property acquired (Note 12) (Note) 1,130Goodwill 40Cash outflow on acquisition 1,170Acquisition-related costs (included in “General and administrative expenses”in the condensed consolidated income statementfor the six months ended 30 September 2011) 63Note: <strong>The</strong> investment property was revalued at 1 June 2011 by Jones Lang LaSalle Limited, the principal valuer of <strong>The</strong> <strong>Link</strong> <strong>REIT</strong>. This approximatesthe fair value of the investment property at the acquisition date.23 Capital commitmentsImprovement projects to existing investment properties30 September2011(Unaudited)HK$’M31 March2011(Audited)HK$’MAuthorised but not contracted for 1,044 753Contracted but not provided for 616 6031,660 1,356Interim Report 2011/201263
NOTES TO THE CONDENSED CONSOLIDATED <strong>INTERIM</strong> FINANCIAL INFORMATION (CONTINUED)24 Connected party transactions and significant related party transactions andbalancesInformation required to be disclosed concerning related party transactions is set out in this note unless disclosedelsewhere in these condensed consolidated interim financial information.(a)Nature of relationship with connected/related parties<strong>The</strong> table set forth below summarises the names of the connected/related parties, as defined in the <strong>REIT</strong>Code/HKAS 24 (Revised) “Related Party Disclosures”, and nature of their relationship with the Group as at 30September 2011:Connected/related partyHSBC Institutional Trust Services (Asia) Limited (the “Trustee”) *<strong>The</strong> Hongkong and Shanghai Banking Corporation Limited andits subsidiaries (excluding the Trustee and its proprietarysubsidiaries) (the “HSBC Group”) *Jones Lang LaSalle Limited (the “Principal Valuer”)Hong Kong Youth Arts Foundation *Wing Hang Bank, Limited (“Wing Hang Bank”) *Industrial and Commercial Bank of China (Asia) Limited(“ICBC (Asia)”)Aedas Limited and its subsidiaries (the “Aedas Group”) *Hong Kong Securities Institute *Asia Pacific Real Estate AssociationDah Sing Bank, Limited (“Dah Sing Bank”)BEAM Society Limited *DTZ Debenham Tie Leung Limited *Relationship with the Group<strong>The</strong> Trustee of <strong>The</strong> <strong>Link</strong> <strong>REIT</strong>Associates # of the Trustee<strong>The</strong> Principal Valuer of <strong>The</strong> <strong>Link</strong> <strong>REIT</strong>Director in commonDirector in commonDirector in commonAssociates # of directorDirector in commonAssociate # of directorsDirector in commonDirector in commonAssociate # of director* <strong>The</strong>se connected parties are also considered as the related parties of the Group.#“Associate” has the meaning ascribed to it under the <strong>REIT</strong> Code.64<strong>The</strong> <strong>Link</strong> Real Estate Investment Trust
NOTES TO THE CONDENSED CONSOLIDATED <strong>INTERIM</strong> FINANCIAL INFORMATION (CONTINUED)24 Connected party transactions and significant related party transactions andbalances (continued)(b) Transactions with connected/related parties<strong>The</strong> following transactions were carried out with connected/related parties:Six monthsended30 September2011(Unaudited)HK$’MSix monthsended30 September2010(Unaudited)HK$’MTrustee fee paid and payable to the Trustee (Note (ii)) (3) (2)Valuation fee paid and payable to the Principal Valuer(Note (iii)) (1) (1)Transactions with the HSBC Group (Note (iv))Interest expense and various financing charges to theHSBC Group on interest bearing liabilities andinterest rate swaps (41) (39)Staff expense to the HSBC Group on medical/group lifeinsurance and insurance brokerage fee – (3)Rental income from the HSBC Group on leasingof retail units 10 9Transactions with ICBC (Asia) (Note (iv))Interest expense and various financing charges toICBC (Asia) on interest bearing liabilities – (2)Rental income from ICBC (Asia) on leasing of retail units 3 3Interest income from ICBC (Asia) on short-termbank deposits 2 –Transactions with Wing Hang Bank (Note (iv))Interest expense and various financing charges toWing Hang Bank on interest bearing liabilities – (1)Architectural/renovation consultancy services feespaid and payable to the Aedas Group (Note (iv)) (2) (2)Transactions with Dah Sing Bank (Note (iv))Interest expense and various financing charges toDah Sing Bank on interest bearing liabilities (1) (1)Rental income from Dah Sing Bank on leasing ofretail units 3 2Agency commission paid to DTZ Debenham Tie LeungLimited (Note (iv)) (12) –Interim Report 2011/201265
NOTES TO THE CONDENSED CONSOLIDATED <strong>INTERIM</strong> FINANCIAL INFORMATION (CONTINUED)24 Connected party transactions and significant related party transactions andbalances (continued)(b) Transactions with connected/related parties (continued)Notes:(i)All connected party transactions were carried out in accordance with the terms of the relevant agreements governing the transactionsand in the ordinary course of business.(ii) <strong>The</strong> Trustee is entitled to receive an annual trustee’s fee (calculated and paid monthly) at a rate of 0.008% per annum of the latestproperty value as determined in the latest annual valuation report of an independent property valuer recommended by the Manager andappointed by the Trustee for and on behalf of <strong>The</strong> <strong>Link</strong> <strong>REIT</strong> from time to time, subject to a minimum of HK$150,000 per month.(iii) Jones Lang LaSalle Limited was appointed as the Principal Valuer of <strong>The</strong> <strong>Link</strong> <strong>REIT</strong> with effect from 17 November 2010. <strong>The</strong> formerPrincipal Valuer was Knight Frank Petty Limited who was responsible for the property valuation of <strong>The</strong> <strong>Link</strong> <strong>REIT</strong> up till the period ended30 September 2010. Valuation fee for the period ended 30 September 2011 was payable to Jones Lang LaSalle Limited while that for theperiod ended 30 September 2010 was paid to Knight Frank Petty Limited.<strong>The</strong> transactions with the Principal Valuer were entered into at arm’s length on normal commercial terms.(iv) <strong>The</strong> transactions were entered into at arm’s length on normal commercial terms.(c)Balances with related partiesBalances with related parties are set out below:30 September2011(Unaudited)HK$’M31 March2011(Audited)HK$’MInterest bearing liabilities with the HSBC Group (721) (806)Net interest rate swaps with the HSBC Group (136) (159)Security deposits from the HSBC Group (1) (1)Net interest payable to the HSBC Group (6) (6)Short-term bank deposits and savings placed withthe HSBC Group 17 27Short-term bank deposits placed with Wing Hang Bank 150 2166<strong>The</strong> <strong>Link</strong> Real Estate Investment Trust
NOTES TO THE CONDENSED CONSOLIDATED <strong>INTERIM</strong> FINANCIAL INFORMATION (CONTINUED)24 Connected party transactions and significant related party transactions andbalances (continued)(d) Key management compensation<strong>The</strong> aggregate amounts of emoluments of the key management staff of the Group are as follows:Six monthsended30 September2011(Unaudited)HK$’MSix monthsended30 September2010(Unaudited)HK$’MFees 4 4Basic salaries, allowances and other benefits 23 20Long-term incentive plan awards 14 1541 3925 Approval of the condensed consolidated interim financial information<strong>The</strong> condensed consolidated interim financial information was authorised for issue by the Board on 9 November2011.Interim Report 2011/201267
FIVE YEAR PERFORMANCE SUMMARYFINANCIAL DATASix monthsended30 September2011(Unaudited)HK$’MSix monthsended30 September2010(Unaudited)HK$’M(Restated)Six monthsended30 September2009(Unaudited)HK$’M(Restated)Six monthsended30 September2008(Unaudited)HK$’M(Restated)Six monthsended30 September2007(Unaudited)HK$’M(Restated)Condensed consolidated income statementRevenues 2,887 2,621 2,438 2,203 2,056Property operating expenses (846) (856) (821) (854) (813)Net property income 2,041 1,765 1,617 1,349 1,243General and administrative expenses (147) (80) (50) (56) (47)Change in fair values of investment properties 3,272 3,259 3,946 (464) 2,655Operating profit 5,166 4,944 5,513 829 3,851Interest income 11 1 4 24 39Finance costs on interest bearing liabilities (197) (271) (266) (253) (310)Profit before taxation and transactions withUnitholders 4,980 4,674 5,251 600 3,580Taxation (288) (236) (220) (145) (137)Profit for the period, before transactions withUnitholders 4,692 4,438 5,031 455 3,443Distributions paid to Unitholders (1,286) (1,079) (935) (826) (739)3,406 3,359 4,096 (371) 2,704Represented by:Change in net assets attributable toUnitholders, excluding issues of new units 3,373 3,317 4,231 (397) 2,748Amount arising from cash flow hedging reservemovement 33 42 (135) 26 (44)3,406 3,359 4,096 (371) 2,704Consolidated statement of distributionsProfit for the period 4,692 4,438 5,031 455 3,443Adjustments:Change in fair values of investmentproperties (3,272) (3,259) (3,946) 464 (2,655)Deferred taxation on change in tax rate – – – (29) –Other non-cash income – (7) (30) (6) (12)Total distributable income 1,420 1,172 1,055 884 776Distribution per unit (HK cents)Interim DPU 63.11 52.86 48.35 40.86 36.1168<strong>The</strong> <strong>Link</strong> Real Estate Investment Trust
FIVE YEAR PERFORMANCE SUMMARY (CONTINUED)FINANCIAL DATA (continued)As at30 September2011(Unaudited)As at31 March2011(Audited)As at31 March2010(Audited)As at31 March2009(Audited)As at31 March2008(Audited)Assets and liabilitiesInvestment properties HK$’M 72,096 67,318 53,781 43,255 44,307Other non-current assets HK$’M 542 391 367 346 330Current assets HK$’M 2,330 1,045 1,076 1,372 2,007Total assets HK$’M 74,968 68,754 55,224 44,973 46,644Current liabilities HK$’M 3,871 4,577 1,807 1,689 3,481Non-current liabilities HK$’M 12,290 9,202 12,272 13,001 10,903Total liabilities, excluding net assetsattributable to Unitholders HK$’M 16,161 13,779 14,079 14,690 14,384Net assets attributable to Unitholders HK$’M 58,807 54,975 41,145 30,283 32,260Interest bearing liabilities to total assets % 16.7 15.1 19.7 25.7 26.1Total liabilities to total assets % 21.6 20.0 25.5 32.7 30.8ValuationValuation of investment properties HK$’M 72,096 67,318 53,781 43,255 44,307Valuation weighted average capitalisation rate % 6.11 6.16 6.73 7.42 6.95Net assets per unit attributable to Unitholders HK$ 26.14 24.63 18.68 13.97 14.94Market price per unit HK$ 24.70 24.35 19.14 15.32 17.26Market capitalisation HK$’M 55,564 54,356 42,147 33,199 37,259(Discount)/premium of unit price to net assetsper unit attributable to Unitholders % (5.5) (1.1) 2.5 9.7 15.5Units in issue 2,249,540,808 2,232,284,540 2,202,043,479 2,167,040,427 2,158,677,767Interim Report 2011/201269
FIVE YEAR PERFORMANCE SUMMARY (CONTINUED)PORTFOLIO DATASix monthsended30 September2011(Unaudited)Six monthsended30 September2010(Unaudited)(Restated)Six monthsended30 September2009(Unaudited)(Restated)Six monthsended30 September2008(Unaudited)(Restated)Six monthsended30 September2007(Unaudited)(Restated)Operational DataAverage monthly unit rentat period end HK$ psf 34.2 31.7 29.7 26.8 24.4Average monthly unit rent excludingSelf use office, Education/Welfare,HD Office and Ancillaryat period end HK$ psf 36.9 34.1 32.1 29.3 26.6Composite reversion rateShops % 22.7 22.2 25.3 30.2 15.4Overall % 21.5 22.7 22.0 25.7 13.7Occupancy rate at period end % 92.1 90.9 90.6 87.6 90.5Net property income margin % 70.7 67.3 66.3 61.2 60.5Retention rate % 79.3 (i) 74.6 (i) 69.5 (i) 76.3 73.2Number of turnover rent leases(excluding ancillary) at period end 4,590 3,794 2,754 1,403 692Car park income per space per month HK$ 1,193 1,067 1,042 1,015 955Car park utilisation rate at period end % 78.3 72.6 72.4 70.3 71.6Performance DataNet assets attributable to Unitholdersat period end HK$’M 58,807 44,766 34,749 31,958 30,679Net assets per unit attributable toUnitholders at period end HK$ 26.14 20.19 15.93 14.77 14.28<strong>The</strong> highest premium of the tradedprice to net assets per unitattributable to Unitholders(Note (ii)) HK$ 2.06 3.36 2.47 5.03 4.92<strong>The</strong> highest discount of the tradedprice to net assets per unitattributable to Unitholders(Note (ii)) HK$ (2.34) (1.65) (1.85) N/A (0.08)Market price per unit at period end HK$ 24.70 23.00 17.06 16.02 17.10Net yield per unit (Note (iii)) % 2.6 2.3 2.8 2.6 2.1Net yield (annualised) per unit(Note (iii)) % 5.1 4.6 5.7 5.1 4.2Net yield (annualised) per unit onlisting price of HK$10.30 per unit % 12.3 10.3 9.4 7.9 7.0Notes:(i)includes tenants who relocated within the same property.(ii) <strong>The</strong> highest premium and discount are calculated based on the highest and lowest traded prices of HK$28.20 (2010: HK$23.55) and HK$23.80 (2010:HK$18.54) respectively on <strong>The</strong> Stock Exchange of Hong Kong Limited during the period. During the six months ended 30 September 2008, the lowesttraded price was higher than the net assets per unit attributable to Unitholders as at period end date. Accordingly, no discount of the traded price tonet assets per unit attributable to Unitholders was presented at 30 September 2008.(iii)Net yield per unit is calculated based on distribution per unit for the period ended 30 September 2011 of HK63.11 cents (2010: HK52.86 cents) overthe last traded price as at 30 September 2011 of HK$24.70 (2010: HK$23.00).70<strong>The</strong> <strong>Link</strong> Real Estate Investment Trust
FINANCIAL CALENDARListing of the Units<strong>The</strong> <strong>Link</strong> <strong>REIT</strong>’s units are listed on the Main Board of the Hong Kong Stock Exchange (stock code: 823) in board lot size of500 units.<strong>The</strong>re were 2,249,540,808 units in issue as at 30 September 2011. Further details of units in issue as at 30 September2011 are set out in Note 20 to the condensed consolidated interim financial information.Investor CalendarInterim results announcement for the six months ended 30 September 2011 9 November 2011Ex-distribution date 22 November 2011Five trading days to determine unit price for scrip in lieu of interim cash distributionClosure of register of Unitholders (1)22 November to28 November 2011(both days inclusive)24 November to28 November 2011(both days inclusive)Record date for interim distribution 28 November 2011Announcement of unit price for scrip in lieu of interim cash distribution On or about 28 November 2011Despatch of distribution reinvestment scheme circular and related documents On or about 7 December 2011Final date for scrip election (2) 22 December 2011not later than 4:30 pmInterim distribution payment date On or about 13 January 2012Final results announcement for the financial year ending 31 March 2012 On or before 30 June 2012Notes:(1) In order to qualify for the interim distribution, Unitholders should ensure that all transfer documents accompanied by the relevant unit certificatesmust be lodged with <strong>The</strong> <strong>Link</strong> <strong>REIT</strong>’s unit registrar, Computershare Hong Kong Investor Services Limited (the “Unit Registrar”) at Shops 1712-1716, 17/F.,Hopewell Centre, 183 Queen’s Road East, Wanchai, Hong Kong for registration not later than 4:30 pm on 23 November 2011.(2) A distribution reinvestment scheme is available to eligible Unitholders with a registered address in Hong Kong, who may elect to receive the interimdistribution for the six months ended 30 September 2011 wholly in cash or wholly in new units or a combination of both. For those Unitholders electingfor scrip, the relevant election form must reach the Unit Registrar (at its address shown above) not later than 4:30 pm on 22 December 2011.Unitholders should note that any election form arrived/received after the aforesaid deadline will be taken as invalid.Interim Report 2011/201271
FINANCIAL CALENDAR (CONTINUED)Investor InformationFinancial reports, announcements, circulars, notices, corporate communications, press releases and other investorinformation of <strong>The</strong> <strong>Link</strong> <strong>REIT</strong> are available online at its website at www.thelinkreit.com.Investor Relations ContactInvestor Relations DepartmentAddress:33/F., AXA Tower, Landmark East, 100 How Ming Street, Kwun Tong, Kowloon, Hong KongTelephone: (852) 2175 1800Facsimile: (852) 2175 1900Email:ir@thelinkreit.comCorporate Communications ContactCorporate Communications DepartmentAddress:33/F., AXA Tower, Landmark East, 100 How Ming Street, Kwun Tong, Kowloon, Hong KongTelephone: (852) 2175 1800Facsimile: (852) 2175 1938Email:mediaenquiries@thelinkreit.comCustomer Service Hotline: (852) 3168 0080Websiteswww.thelinkreit.comwww.thelinkfunacademy.comwww.lokfuplaza.comwww.stanleyplaza.com.hk(<strong>The</strong> <strong>Link</strong> <strong>REIT</strong> website)(<strong>The</strong> <strong>Link</strong> Fun Academy website)(Lok Fu Plaza website)(Stanley Plaza website)72<strong>The</strong> <strong>Link</strong> Real Estate Investment Trust
CORPORATE INFORMATIONBoard of Directors of the ManagerChairman(also an Independent Non-Executive Director)Nicholas Robert SALLNOW-SMITHExecutive DirectorsGeorge Kwok Lung HONGCHOY(Chief Executive Officer)Andy CHEUNG Lee Ming(Chief Financial Officer)Non-Executive DirectorIan Keith GRIFFITHSIndependent Non-Executive DirectorsMichael Ian ARNOLDWilliam CHAN Chak CheungAnthony CHOW Wing KinPatrick FUNG Yuk BunStanley KO Kam ChuenDavid Charles WATTRichard WONG Yue ChimResponsible Officers of the ManagerGeorge Kwok Lung HONGCHOYAndy CHEUNG Lee MingHubert CHAKJames Andrew CLARKEric YAU Siu KeiCompany Secretary of the ManagerRicky CHAN Ming TakAuthorised RepresentativesGeorge Kwok Lung HONGCHOYRicky CHAN Ming TakTrusteeHSBC Institutional Trust Services (Asia) LimitedAuditorPricewaterhouseCoopersPrincipal ValuerJones Lang LaSalle LimitedPrincipal BankersAustralia and New Zealand Banking Group Limited,Hong Kong BranchBank of China (Hong Kong) LimitedBNP Paribas, Hong Kong BranchDBS Bank Ltd, Hong Kong BranchStandard Chartered Bank (Hong Kong) Limited<strong>The</strong> Bank of East Asia, Limited<strong>The</strong> Bank of Tokyo-Mitsubishi UFJ, Ltd,Hong Kong Branch<strong>The</strong> Hongkong and Shanghai Banking Corporation LimitedRegistered Office of the Manager33/F., AXA Tower, Landmark East,100 How Ming Street,Kwun Tong, Kowloon,Hong KongTown Office of the ManagerSuite 3004, 30/F.,9 Queen’s Road Central,Hong KongUnit Registrar and Transfer OfficeComputershare Hong Kong Investor Services LimitedShops 1712–1716, 17/F., Hopewell Centre,183 Queen’s Road East,Wanchai, Hong KongTelephone: (852) 2862 8555
<strong>The</strong> <strong>Link</strong> Real Estate Investment Trustwww.thelinkreit.comTdA - Concept, design and production www.tda.com.hk