Volume 2: Draft Gorst Planned Action Environmental Impact Statement
Volume 2: Draft Gorst Planned Action Environmental Impact Statement
Volume 2: Draft Gorst Planned Action Environmental Impact Statement
- No tags were found...

You also want an ePaper? Increase the reach of your titles
YUMPU automatically turns print PDFs into web optimized ePapers that Google loves.
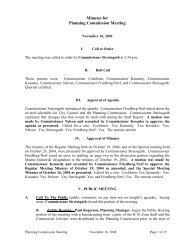
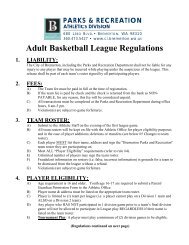
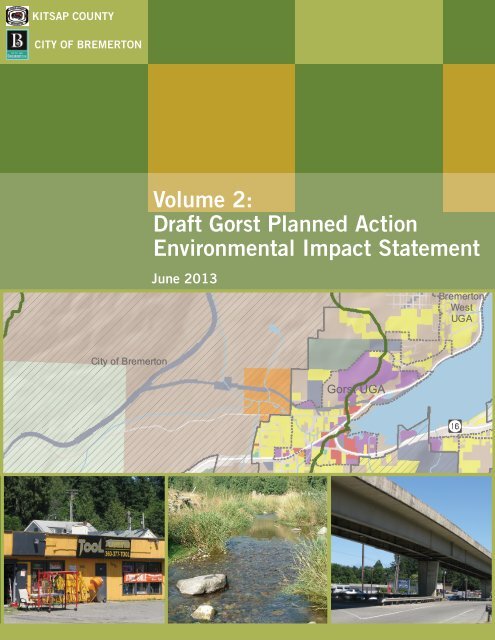
KITSAP COUNTYCITY OF BREMERTONHED PLANNING AREA: CURRENT LAND USE<strong>Volume</strong> 2:<strong>Draft</strong> <strong>Gorst</strong> <strong>Planned</strong> <strong>Action</strong><strong>Environmental</strong> <strong>Impact</strong> <strong>Statement</strong>June 2013BremertonWestUGACity of Bremerton<strong>Gorst</strong> UGACity of BremertonULID6SKIA UGA
THIS PAGE INTENTIONALLY BLANK
VOLUME 2: GORST PLANNED ACTIONENVIRONMENTAL IMPACT STATEMENTPart of a three-volume plan for <strong>Gorst</strong><strong>Volume</strong> 1: <strong>Gorst</strong> Creek Watershed Characterization & Framework Plan (under separate cover)<strong>Volume</strong> 2: <strong>Gorst</strong> <strong>Planned</strong> <strong>Action</strong> <strong>Environmental</strong> <strong>Impact</strong> <strong>Statement</strong> (this document)<strong>Volume</strong> 3: <strong>Gorst</strong> Subarea Plan (under separate cover)June 2013Prepared forCity of BremertonDepartment of Community DevelopmentBremerton, WashingtonPrepared bySeattle, WashingtonThis <strong>Draft</strong> <strong>Environmental</strong> <strong>Impact</strong> <strong>Statement</strong> (EIS) has been prepared in compliance with the State <strong>Environmental</strong> Policy Act(SEPA) of 1971, as amended (Chapter 43.21C, Revised Code of Washington [RCW]); the SEPA Rules, effective April 4, 1984, asamended (Chapter 197-11, Washington Administrative Code [WAC]); and Bremerton SEPA Rules (Bremerton Municipal Code[BMC}} Chapter 20.04 State <strong>Environmental</strong> Policy Act, which implement SEPA.This <strong>Draft</strong> EIS has been prepared for the purpose of review and comment by members of the public, stakeholder groups, andfederal, state, and local agencies. Preparation of this document is the responsibility of the City of Bremerton’s Department ofCommunity Development in consultation with Kitsap County. This <strong>Draft</strong> EIS is not an authorization for an action, nor does itconstitute a decision or recommendation for an action; in its final form, it will accompany the Proposed <strong>Action</strong> and will beconsidered in making the final decision for the Proposed <strong>Action</strong>.
THIS PAGE INTENTIONALLY BLANK
FACT SHEETProject Title<strong>Gorst</strong> Creek Watershed Characterization & Framework Plan, <strong>Gorst</strong> Subarea Plan, and <strong>Gorst</strong> <strong>Planned</strong> <strong>Action</strong>Proposed <strong>Action</strong> and AlternativesThe City of Bremerton, in partnership with Kitsap County and other state, federal, and tribal agencies, is planningthe future of the <strong>Gorst</strong> Creek Watershed and <strong>Gorst</strong> UGA. These coordinated efforts are intended to:• Make <strong>Gorst</strong> a place where people want to live, shop and recreate,• Protect water quality, habitat and fish while fostering economic development,• Identify areas for development, restoration and protection based on science,• Adopt a land use plan for <strong>Gorst</strong>, and• Implement a long-range capital improvement plan to provide for future utility services, public services andtransportation needs.Products of the planning effort to date include a <strong>Draft</strong> <strong>Gorst</strong> Creek Watershed Characterization & Framework Planfor the 6,000-acre watershed as a whole and a <strong>Draft</strong> <strong>Gorst</strong> Subarea Plan for the 335-acre <strong>Gorst</strong> UGA. This <strong>Draft</strong><strong>Gorst</strong> <strong>Planned</strong> <strong>Action</strong> <strong>Environmental</strong> <strong>Impact</strong> <strong>Statement</strong> (<strong>Draft</strong> EIS) evaluates possible environmental impacts of thedraft plans and alternatives.In addition to these plans and development regulations, the City of Bremerton and Kitsap County are consideringdesignating a planned action for some or all of the <strong>Gorst</strong> UGA. A planned action provides more detailedenvironmental analysis during an area-wide planning stage rather than at the project permit review stage.Designating a planned action streamlines environmental review for development proposals consistent with EISmitigation measures that are adopted in a planned action ordinance.To illustrate a range of possible futures in <strong>Gorst</strong>, the following alternatives are evaluated in the <strong>Draft</strong> <strong>Gorst</strong>Subarea Plan and this <strong>Draft</strong> EIS:• Alternative 1 (No <strong>Action</strong>) – <strong>Gorst</strong> is a relatively small highway-oriented commercial and industrial center.• Alternative 2 – <strong>Gorst</strong> is a well-designed regional commercial center.• Alternative 3 – <strong>Gorst</strong> becomes a complete community.Alternative 1 is a required alternative under the SEPA. It represents a continuation of the current ComprehensivePlan and regulations. <strong>Action</strong> alternatives represent a range of land use, growth, policies, and regulations and weredeveloped as part of a public outreach process. These alternatives are discussed more fully in Chapter 2.ProponentThe City of Bremerton and Kitsap CountyTentative Date of ImplementationDecember 2013Lead AgencyCity of Bremerton<strong>Draft</strong> | June 2013III
GORST PLANNED ACTION EIS | FACT SHEETResponsible OfficialAndrea L. Spencer, AICPDirector, Department of Community DevelopmentCity of BremertonContact PersonAllison DanielsCity PlannerCity of BremertonCommunity Development Department345 6 th Street, Suite 600, Bremerton, WA 98337Allison.Daniels@ci.bremerton.wa.us360-473-5845Licenses or Permits RequiredAdoption of a <strong>Gorst</strong> Creek Watershed Characterization & Framework Plan, <strong>Gorst</strong> Subarea Plan, and <strong>Planned</strong> <strong>Action</strong>Ordinance by the City of Bremerton City Council and Kitsap County Board of County Commissioners (BOCC).Recommendations to the City of Bremerton City Council and BOCC will be made by the City of Bremerton andKitsap County Planning Commissions, respectively.In addition, the Washington State Department of Commerce reviews proposed comprehensive plan anddevelopment regulation amendments during a 60-day review period prior to adoption. The Puget Sound RegionalCouncil (PSRC) reviews comprehensive plans amendments for consistency with regional plans.Authors and Principal Contributors to the EISAECOM710 2nd Ave #1000Seattle, WA 98104206.624.2839(Project Management, Geology/Soils, Water Resources, Plants and Animals, Noise, Hazardous Materials,Aesthetics, Cultural Resources, Transportation, Stormwater, Water, Wastewater)BERK2025 First Avenue, Suite 800Seattle, WA 98121206.324.8760(SEPA <strong>Planned</strong> <strong>Action</strong>, Alternatives, Land Use Patterns, Socio-Economics, Public Services, Solid Waste, Power,Telecommunications, Relationship to Plans and Policies)Landau Associates601 Union Street, Suite 1606Seattle, WA 98101206.631.8680(Air Quality)<strong>Draft</strong> | June 2013IV
GORST PLANNED ACTION EIS | FACT SHEETParametrix411 108 th Avenue NEBellevue, WA 98004425.458.6200(Water Resources and Plants and Animals)Kitsap County Public Works Department(Traffic Modeling)<strong>Draft</strong> EIS Date of IssuanceJune 10, 2013<strong>Draft</strong> EIS Comment Due DateThe City of Bremerton is requesting comments from citizens, agencies, tribes, and all interested parties on the<strong>Draft</strong> EIS from June 10, 2013 to July 24, 2013, by 5:00 PM. All written comments should be directed to:Allison DanielsCity PlannerCity of BremertonCommunity Development Department345 6 th Street, Suite 600, Bremerton, WA 98337Allison.Daniels@ci.bremerton.wa.us360-473-5845Public Meeting OpportunitiesThe City of Bremerton and Kitsap County will also hold the following meetings during the comment period at whichcomments may be submitted.<strong>Gorst</strong> <strong>Draft</strong> Plans & EIS IntroductionKitsap County Planning CommissionDate: June 18, 2013Location: Kitsap County Administration Building,Commissioner's Chambers, 619 Division StreetPort Orchard, WA 98366Time: 9:00 amPreferred Alternative Direction<strong>Gorst</strong> <strong>Draft</strong> Plans & EIS IntroductionCity of Bremerton Planning CommissionDate: June 18, 2013Location: First Floor ChambersNorm Dicks Government Center345 6th Street, Bremerton, WA 98337Time: 5:30 pm<strong>Gorst</strong> Preferred Alternative Community WorkshopDate: June 20, 2013Location: Family Worship Center at 3649 W. Frontage Road, Port Orchard, WA 98367 (in <strong>Gorst</strong>)Time: 5:00 PM - 7:00 pmKitsap County Planning CommissionDate: July 16, 2013Location: Kitsap County Administration Building,Commissioner's Chambers, 619 Division StreetPort Orchard, WA 98366Time: 9:00 amDate of Final <strong>Action</strong>December 2013Preferred Alternative DirectionCity of Bremerton Planning CommissionDate: July 16, 2013Location: First Floor ChambersNorm Dicks Government Center345 6th Street, Bremerton, WA 98337Time: 5:30 pm<strong>Draft</strong> | June 2013V
GORST PLANNED ACTION EIS | FACT SHEETPrior <strong>Environmental</strong> ReviewAn inventory was developed for the study area in August 2011. A Watershed Characterization Study has beenprepared in conjunction with the Washington State Departments of Ecology (Ecology) and Fish and Wildlife(WDFW) to evaluate water quality and habitat related issues as they relate to land use planning. These documentsare available at the City of Bremerton’s website www.gorstwatershed.com.The City of Bremerton prepared the South Kitsap Industrial Area (SKIA) Subarea Plan and <strong>Planned</strong> <strong>Action</strong> EIS in2012. A small portion of the SKIA area lies in the watershed.In addition, Kitsap County recently completed the Kitsap County UGA Sizing and Composition Remand Final EIS(August 2012) which addressed the <strong>Gorst</strong> UGA and other UGAs. It contains analysis relevant to the “No <strong>Action</strong>”alternative.Where appropriate, information from these prior environmental documents was used in the preparation of thisEIS.Location of Background DataYou may review the City of Bremerton’s website for more information at www.gorstwatershed.com. If you desireclarification or have questions please contact Allison Daniels at Allison.Daniels@ci.bremerton.wa.us or360-473-5845.<strong>Draft</strong> EIS Purchase PriceThis <strong>Draft</strong> EIS is available for review at Bremerton City Hall: 345 6 th Street, Suite 600, Bremerton, WA 98337.The<strong>Draft</strong> EIS is posted on the City of Bremerton’s website at www.gorstwatershed.com. Compact disks are availablefor purchase at Bremerton City Hall. Cost at the time of this writing is $2.00.<strong>Draft</strong> | June 2013VI
TABLE OF CONTENTSFact Sheet ..................................................................................................................................................................... iiiTable of Contents ........................................................................................................................................................ vii1.0 Summary....................................................................................................................................................... 1-11.1 Purpose of Proposed <strong>Action</strong> ..................................................................................................................... 1-11.2 State <strong>Environmental</strong> Policy Act Process ................................................................................................... 1-1<strong>Planned</strong> <strong>Action</strong> ................................................................................................................................................... 1-2Prior <strong>Environmental</strong> Review .............................................................................................................................. 1-31.3 Public Involvement ................................................................................................................................... 1-31.4 Proposed <strong>Action</strong>, Alternatives, and Objectives ........................................................................................ 1-4Objectives .......................................................................................................................................................... 1-4Proposed <strong>Action</strong> and Alternatives ..................................................................................................................... 1-51.5 Major Issues, Significant Areas of Controversy and Uncertainty, and Issues to be Resolved .................. 1-61.6 Summary of <strong>Impact</strong>s and Mitigation Measures ....................................................................................... 1-6<strong>Impact</strong>s Common to All Alternatives ................................................................................................................. 1-6Matrix of <strong>Impact</strong>s by Alternative ..................................................................................................................... 1-12Summary of Mitigation Measures ................................................................................................................... 1-221.7 Significant Unavoidable Adverse <strong>Impact</strong>s .............................................................................................. 1-402.0 Alternatives .................................................................................................................................................. 2-12.1 Introduction ............................................................................................................................................. 2-12.2 Background .............................................................................................................................................. 2-1Study Area ......................................................................................................................................................... 2-1Current Conditions ............................................................................................................................................ 2-7<strong>Gorst</strong> Watershed Characterization & Framework Plan ..................................................................................... 2-7<strong>Gorst</strong> Subarea Plan ............................................................................................................................................ 2-72.3 Public Review ........................................................................................................................................... 2-82.4 Proposal Objectives ................................................................................................................................ 2-102.5 Study Alternatives .................................................................................................................................. 2-11Alternative 1 – No <strong>Action</strong>, Current Plan: <strong>Gorst</strong> is a relatively small highway-oriented commercial and industrialcenter ............................................................................................................................................................... 2-11Alternative 2 – <strong>Gorst</strong> is a well-designed regional commercial center ............................................................. 2-11Alternative 3 - <strong>Gorst</strong> becomes a complete community ................................................................................... 2-11Watershed Land Use ........................................................................................................................................ 2-12<strong>Gorst</strong> UGA Land Use ........................................................................................................................................ 2-15Future Growth ................................................................................................................................................. 2-28<strong>Draft</strong> | June 2013VII
GORST PLANNED ACTION EIS | TABLE OF CONTENTSWatershed Characterization, Fish Habitat, and Stormwater ........................................................................... 2-28<strong>Planned</strong> <strong>Action</strong> ................................................................................................................................................. 2-392.6 Future Alternatives ................................................................................................................................ 2-402.7 Benefits and Disadvantages of Delaying a Proposed <strong>Action</strong> .................................................................. 2-402.8 Major Issues to Be Resolved .................................................................................................................. 2-413.0 Affected environment, significant impacts, and mitigation measures ......................................................... 3-13.1 Geology/Soils ........................................................................................................................................... 3-2Affected Environment ....................................................................................................................................... 3-2<strong>Impact</strong>s .............................................................................................................................................................. 3-7Mitigation Measures .......................................................................................................................................... 3-9Significant Unavoidable Adverse <strong>Impact</strong>s........................................................................................................ 3-113.2 Water Resources .................................................................................................................................... 3-12Affected Environment ..................................................................................................................................... 3-12<strong>Impact</strong>s ............................................................................................................................................................ 3-21Mitigation Measures ........................................................................................................................................ 3-23Significant Unavoidable Adverse <strong>Impact</strong>s........................................................................................................ 3-253.3 Air Quality .............................................................................................................................................. 3-26Affected Environment ..................................................................................................................................... 3-26Methodology ................................................................................................................................................... 3-31<strong>Impact</strong>s ............................................................................................................................................................ 3-35Mitigation Measures ........................................................................................................................................ 3-41Significant Unavoidable Adverse <strong>Impact</strong>s........................................................................................................ 3-533.4 Plants and Animals ................................................................................................................................. 3-54Affected Environment ..................................................................................................................................... 3-54<strong>Impact</strong>s ............................................................................................................................................................ 3-64Mitigation Measures ........................................................................................................................................ 3-68Significant Unavoidable Adverse <strong>Impact</strong>s........................................................................................................ 3-703.5 Noise ...................................................................................................................................................... 3-71Affected Environment ..................................................................................................................................... 3-71<strong>Impact</strong>s ............................................................................................................................................................ 3-74Mitigation Measures ........................................................................................................................................ 3-76Significant Unavoidable Adverse <strong>Impact</strong>s........................................................................................................ 3-833.6 Hazardous Materials .............................................................................................................................. 3-84Affected Environment ..................................................................................................................................... 3-84<strong>Impact</strong>s ............................................................................................................................................................ 3-94Mitigation Measures ........................................................................................................................................ 3-96<strong>Draft</strong> |June 2013VIII
GORST PLANNED ACTION EIS | TABLE OF CONTENTSSignificant Unavoidable Adverse <strong>Impact</strong>s........................................................................................................ 3-973.7 Land Use Patterns .................................................................................................................................. 3-98Affected Environment ..................................................................................................................................... 3-98<strong>Impact</strong>s .......................................................................................................................................................... 3-106Mitigation Measures ...................................................................................................................................... 3-109Significant Unavoidable Adverse <strong>Impact</strong>s...................................................................................................... 3-1093.8 Socio-economics .................................................................................................................................. 3-110Affected Environment ................................................................................................................................... 3-110<strong>Impact</strong>s .......................................................................................................................................................... 3-112Mitigation Measures ...................................................................................................................................... 3-115Significant Unavoidable Adverse <strong>Impact</strong>s...................................................................................................... 3-1163.9 Aesthetics ............................................................................................................................................. 3-117Affected Environment ................................................................................................................................... 3-117<strong>Impact</strong>s .......................................................................................................................................................... 3-121Mitigation Measures ...................................................................................................................................... 3-126Significant Unavoidable Adverse <strong>Impact</strong>s...................................................................................................... 3-1283.10 Cultural Resources ............................................................................................................................... 3-129Affected Environment ................................................................................................................................... 3-131<strong>Impact</strong>s .......................................................................................................................................................... 3-139Mitigation Measures ...................................................................................................................................... 3-142Significant Unavoidable Adverse <strong>Impact</strong>s...................................................................................................... 3-1443.11 Transportation ..................................................................................................................................... 3-145Affected Environment ................................................................................................................................... 3-145<strong>Impact</strong>s .......................................................................................................................................................... 3-164Mitigation Measures ...................................................................................................................................... 3-173Significant Unavoidable Adverse <strong>Impact</strong>s...................................................................................................... 3-1743.12 Public Services ...................................................................................................................................... 3-1753.12.1. Fire Protection and EMS .................................................................................................................. 3-179Affected Environment ................................................................................................................................... 3-179<strong>Impact</strong>s .......................................................................................................................................................... 3-183Mitigation Measures ...................................................................................................................................... 3-185Significant Unavoidable Adverse <strong>Impact</strong>s...................................................................................................... 3-1863.12.2. Law Enforcement ............................................................................................................................. 3-186Affected Environment ................................................................................................................................... 3-186<strong>Impact</strong>s .......................................................................................................................................................... 3-193Mitigation Measures ...................................................................................................................................... 3-196<strong>Draft</strong> |June 2013IX
GORST PLANNED ACTION EIS | TABLE OF CONTENTSSignificant Unavoidable Adverse <strong>Impact</strong>s...................................................................................................... 3-1973.12.3. Schools ............................................................................................................................................. 3-197Affected Environment ................................................................................................................................... 3-197<strong>Impact</strong>s .......................................................................................................................................................... 3-199Mitigation Measures ...................................................................................................................................... 3-202Significant Unavoidable Adverse <strong>Impact</strong>s...................................................................................................... 3-2023.12.4. Parks, Recreation, and Open Space ................................................................................................. 3-202Affected Environment ................................................................................................................................... 3-202<strong>Impact</strong>s .......................................................................................................................................................... 3-204Mitigation Measures ...................................................................................................................................... 3-213Significant Unavoidable Adverse <strong>Impact</strong>s...................................................................................................... 3-2133.12.5. Libraries ........................................................................................................................................... 3-214Affected Environment ................................................................................................................................... 3-214<strong>Impact</strong>s .......................................................................................................................................................... 3-215Mitigation Measures ...................................................................................................................................... 3-215Significant Unavoidable Adverse <strong>Impact</strong>s...................................................................................................... 3-2163.13 Utilities, Water, Wastewater, Stormwater .......................................................................................... 3-2173.13.1. Power ............................................................................................................................................... 3-217Affected Environment ................................................................................................................................... 3-217<strong>Impact</strong>s .......................................................................................................................................................... 3-217Mitigation Measures ...................................................................................................................................... 3-219Significant Unavoidable Adverse <strong>Impact</strong>s...................................................................................................... 3-2193.13.2. Solid Waste ...................................................................................................................................... 3-219Affected Environment ................................................................................................................................... 3-219<strong>Impact</strong>s .......................................................................................................................................................... 3-221Mitigation Measures ...................................................................................................................................... 3-222Significant Unavoidable Adverse <strong>Impact</strong>s...................................................................................................... 3-2223.13.3. Water, Wastewater, and Stormwater ............................................................................................. 3-222Affected Environment ................................................................................................................................... 3-222<strong>Impact</strong>s .......................................................................................................................................................... 3-225Mitigation Measures ...................................................................................................................................... 3-233Significant Unavoidable Adverse <strong>Impact</strong>s...................................................................................................... 3-2353.13.4. Telecommunications ........................................................................................................................ 3-235Affected Environment ................................................................................................................................... 3-235<strong>Impact</strong>s .......................................................................................................................................................... 3-236Mitigation Measures ...................................................................................................................................... 3-237<strong>Draft</strong> |June 2013X
GORST PLANNED ACTION EIS | TABLE OF CONTENTSSignificant Unavoidable Adverse <strong>Impact</strong>s...................................................................................................... 3-2373.14 Relationship to Plans and Policies ........................................................................................................ 3-238Affected Environment ................................................................................................................................... 3-238<strong>Impact</strong>s .......................................................................................................................................................... 3-253Mitigation Measures ...................................................................................................................................... 3-262Significant Unavoidable Adverse <strong>Impact</strong>s...................................................................................................... 3-2624.0 References .................................................................................................................................................... 4-14.1 Personal Communication ......................................................................................................................... 4-14.2 Printed References ................................................................................................................................... 4-15.0 Distribution LIst ............................................................................................................................................ 5-15.1 Federal Agencies ...................................................................................................................................... 5-15.2 Tribes ........................................................................................................................................................ 5-15.3 State and Regional Agencies .................................................................................................................... 5-15.4 Local Governments .................................................................................................................................. 5-15.5 Services, Utilities, Special Districts, and Transit ....................................................................................... 5-25.6 Community Organizations ........................................................................................................................ 5-25.7 Newspapers .............................................................................................................................................. 5-25.8 Interested Persons and Stakeholders ...................................................................................................... 5-2Figures2-1 <strong>Gorst</strong> Creek Watershed Aerial 2-32-2 <strong>Gorst</strong> Creek Urban Growth Area 2-52-3 <strong>Gorst</strong> Watershed Planning Area Land Use 2-132-4 <strong>Gorst</strong> UGA Land Use: Alternative 1 - Kitsap County No <strong>Action</strong> 2-172-5 Alternative 1 Percentage of Land in Each Land Use Designation 2-192-6 <strong>Gorst</strong> UGA Land Use: Alternative 2 2-212-7 Alternative 2 Percentage of Land in Each Land Use/Zoning Designation 2-232-8 Figure 2-8 <strong>Gorst</strong> UGA Land Use: Alternative 3 2-252-9 Alternative 3 Percentage of Land Use/Zoning Designations 2-272-10 <strong>Gorst</strong> Watershed Assessment Units: Integrated Results 2-292-11 <strong>Gorst</strong> Creek Watershed: Existing Drainage Deficiencies 2-332-12 <strong>Gorst</strong> Creek Watershed Planning Area: Fish Passage Barriers 2-352-13 Proposed Fish Passage Barrier Improvement – Parish Creek 2-372-14 <strong>Planned</strong> <strong>Action</strong> Process 2-403.1-1 <strong>Gorst</strong> Creek Watershed: Geology 3-33.2-1 <strong>Gorst</strong> Creek Watershed: Water Resources 3-133.2-2 <strong>Gorst</strong> Creek Watershed: Floodplain and Shoreline 3-173.2-3 <strong>Gorst</strong> Identified Existing Drainage Deficiencies 3-193.4-1 <strong>Gorst</strong> Creek Watershed: Land Cover 3-553.6-1 <strong>Gorst</strong> Creek Watershed: Hazardous Materials Sites 3-873.7-1 <strong>Gorst</strong> Watershed Planning Area: Current Land Use 3-99<strong>Draft</strong> |June 2013XI
GORST PLANNED ACTION EIS | TABLE OF CONTENTS3.7-2 <strong>Gorst</strong> Creek Watershed: Land Cover 3-1013.7-3 Current Land Use – Percentages 3-1033.8-1 <strong>Gorst</strong> Creek 3-1183.8-2 Visual Character of <strong>Gorst</strong> UGA Highway Corridor 3-1193.8-3 Examples of Building Height, Bulk, and Scale of UGA Highway Corridor 3-1203.8-4 Sinclair Inlet View 3-1213.10-1 <strong>Gorst</strong> Creek Watershed: Cultural Resources Probability 3-1373.11-1 <strong>Gorst</strong> Creek Watershed: Existing Roadway Inventory 3-1473.12-1 <strong>Gorst</strong> Watershed Planning Area Public Facilities 3-1773.12-2 <strong>Gorst</strong> Creek Watershed: Fire Station Map 3-1813.12-3 <strong>Gorst</strong> Creek Watershed: Law Enforcement Facilities Map 3-1913.12-4 <strong>Gorst</strong> Creek Watershed: Parks, Recreation, and Open Space Map 3-2053.13-1 <strong>Gorst</strong>: Drinking Water and Wastewater Systems 3-2293.14-1 <strong>Gorst</strong>: Comparison of Shoreline Designations 3-251TablesTable 1-1 Watershed Characterization & Framework Plan and <strong>Gorst</strong> Subarea Plan Guiding Principles ................... 1-4Table 1-2 Comparison Matrix of <strong>Impact</strong>s ............................................................................................................... 1-12Table 3.1-1 Soil Types in the <strong>Gorst</strong> Creek Watershed and <strong>Gorst</strong> UGA, and Their Associated Construction Limitationsand Erosion Hazard Potential .................................................................................................................................... 3-6Table 3.3-1 National and Washington State Ambient Air Quality Standards .......................................................... 3-28Table 3.3-2 Assumed Land Use and Population Growth for GHG Emission Calculations–<strong>Gorst</strong> UGA ..................... 3-31Table 3.3-3 Assumed Land Use and Population Growth for GHG Emission Calculations <strong>Gorst</strong> Watershed, Excluding<strong>Gorst</strong> UGA ................................................................................................................................................................ 3-32Table 3.3-4 Comparison of Annual GHG Emissions in the <strong>Gorst</strong> Watershed, Excluding the <strong>Gorst</strong> UGA ................. 3-37Table 3.3-5 <strong>Gorst</strong> UGA Contribution to Forecast 2035 Puget Sound Regional VMT ............................................... 3-38Table 3.3-6 Comparison of Annual GHG Emissions – <strong>Gorst</strong> UGA ............................................................................ 3-38Table 3.3-7 Kitsap County Climate Change Responsive Projects ............................................................................. 3-46Table 3.3-8 Potential GHG Reduction Mitigation Measures ................................................................................... 3-48Table 3.3-9 SMAQMD Recommended Measures for Land Use Emission Reductions ............................................. 3-50Table 3.4-1 Land Cover Types within the <strong>Gorst</strong> Creek Watershed and the <strong>Gorst</strong> UGA ........................................... 3-54Table 3.4-2 Occurrence of Anadromous Fish Species in the <strong>Gorst</strong> Creek Watershed ............................................. 3-57Table 3.4-3 Special Status Species that May Be Found in or Near the <strong>Gorst</strong> Creek Watershed.............................. 3-59Table 3.5-1 Typical Noise Levels .............................................................................................................................. 3-71Table 3.5-2 City of Bremerton Noise Control Districts ............................................................................................ 3-77Table 3.5-3 Maximum Permissible Levels at Receiving Property Line ..................................................................... 3-77Table 3.5-4 Adjustment to Maximum Permissible Levels at Receiving Property Line ............................................. 3-77Table 3.5-5 Kitsap County EDNAs ............................................................................................................................ 3-79Table 3.5-6 Maximum Permissible Levels at Receiving Property Line ..................................................................... 3-79Table 3.5-7 Adjustment to Maximum Permissible Levels at Receiving Property Line ............................................. 3-79Table 3.5-8 FHWA Noise Abatement Criteria by Land Use ...................................................................................... 3-80Table 3.6-1 Reasonably Predictable Sites within the <strong>Gorst</strong> UGA ............................................................................. 3-89Table 3.6-2 Substantially Contaminated Sites within the <strong>Gorst</strong> UGA ..................................................................... 3-91<strong>Draft</strong> |June 2013XII
GORST PLANNED ACTION EIS | TABLE OF CONTENTSTable 3.7-1 <strong>Gorst</strong> UGA Existing Land Use .............................................................................................................. 3-103Table 3.7-2 Comparison of Kitsap County and City Zoning for the <strong>Gorst</strong> UGA ..................................................... 3-105Table 3.7-3 Land Use Acres Comparison (Total Parcel Acres by Zone) .................................................................. 3-106Table 3.8-1 PSRC Residential Permits in Watershed (Excluding <strong>Gorst</strong> UGA) ......................................................... 3-110Table 3.8-2 Employment by Sector in Watershed (Excluding <strong>Gorst</strong> UGA) ............................................................ 3-111Table 3.8-3 2010 Employment by Sector in the <strong>Gorst</strong> UGA .................................................................................. 3-112Table 3.8-4 2035 Employment by Alternative in the <strong>Gorst</strong> UGA .......................................................................... 3-112Table 3.8-5 2035 Net New Population and Housing Unit Capacity by Alternative in the <strong>Gorst</strong> UGA.................... 3-113Table 3.8-6 2035 Net New Employment by Alternative in the <strong>Gorst</strong> UGA ............................................................ 3-114Table 3.10-1 Previously Studied Cultural Resources within the Study Area .......................................................... 3-134Table 3.10-2 Known Archaeological Resources within the Study Area ................................................................. 3-134Table 3.10-3 Known Historic Built Environment Resources within the Study Area .............................................. 3-134Table 3.10-4 Archaeologically Sensitive Landforms Likely Present in the Study Area .......................................... 3-139Table 3.10-5 Development and Construction Activities in High and Moderate Probability Areas Discussion ...... 3-141Table 3.10-6 Cultural Resources Mitigation Measures .......................................................................................... 3-143Table 3.11-1 Federal Functional Classifications ..................................................................................................... 3-153Table 3.11-2 LOS Descriptions ............................................................................................................................... 3-155Table 3.11-3 Roadway Capacity/Congestion LOS Standards ................................................................................. 3-157Table 3.11-4 LOS Standards for Highways of Statewide Significance .................................................................... 3-157Table 3.11-5 WSF Traffic Statistics ......................................................................................................................... 3-161Table 3.11-6 V/C Ratio Ranges as They Relate to LOS ........................................................................................... 3-168Table 3.11-7 Summary of <strong>Gorst</strong> Area Travel Statistics .......................................................................................... 3-169Table 3.11-8 Projected Roadway Segment Deficiencies under Alternatives by 2035 ........................................... 3-170Table 3.11-9 Projected State Highway Deficiencies by 2035 ................................................................................. 3-171Table 3.11-10 Projected PM Peak Ferry Demand for Kitsap Service Area ............................................................. 3-171Table 3.12-1 Summary of Adopted LOS Standards by Jurisdiction ........................................................................ 3-175Table 3.12-2 Current SKFR LOS Requirements ...................................................................................................... 3-180Table 3.12-3 SKFR Projected LOS – Alternative 1 .................................................................................................. 3-183Table 3.12-4 SKFR Projected LOS – Alternative 2 .................................................................................................. 3-184Table 3.12-5 SKFR Projected LOS – Alternative 3 .................................................................................................. 3-185Table 3.12-6 Bremerton Police Department Facility Inventory ............................................................................. 3-187Table 3.12-7 Bremerton Police Department – Current Law Enforcement LOS Requirements .............................. 3-187Table 3.12-8 Kitsap County Sheriff’s Office-Facility Inventory .............................................................................. 3-188Table 3.12-9 Kitsap County Sheriff’s Office – Current Law Enforcement LOS Requirements ............................... 3-189Table 3.12-10 Kitsap County Sheriff’s Office Projected LOS – Alternative 1 ......................................................... 3-193Table 3.12-11 Kitsap County Sheriff’s Office Projected LOS – Alternative 2 ......................................................... 3-194Table 3.12-12 Kitsap County Sheriff’s Office Projected LOS – Alternative 3 ......................................................... 3-196Table 3.12-13 SKSD Enrollment Capacity............................................................................................................... 3-198Table 3.12-14 SKSD Current LOS Requirements .................................................................................................... 3-199Table 3.12-15 Projected SKSD LOS – Alternative 1 ................................................................................................ 3-200<strong>Draft</strong> |June 2013XIII
GORST PLANNED ACTION EIS | TABLE OF CONTENTSTable 3.12-16 Projected SKSD LOS – Alternative 2 ................................................................................................ 3-201Table 3.12-17 Projected SKSD LOS – Alternative 3 ................................................................................................ 3-201Table 3.12-18 Current Kitsap County Parks, Recreation, and Open Space LOS Requirements ............................. 3-203Table 3.12-19 City of Bremerton Open Space LOS <strong>Impact</strong>s – Alternative 1 .......................................................... 3-207Table 3.12-20 City of Bremerton Regional Parks LOS <strong>Impact</strong>s – Alternative 1 ...................................................... 3-207Table 3.12-21 City of Bremerton Local Parks LOS <strong>Impact</strong>s – Alternative 1 ........................................................... 3-207Table 3.12-22 Kitsap County Open Space LOS <strong>Impact</strong>s – Alternative 2 ................................................................. 3-208Table 3.12-23 Kitsap County Regional Parks LOS <strong>Impact</strong>s – Alternative 2 ............................................................ 3-209Table 3.12-24 Kitsap County Community Parks LOS <strong>Impact</strong>s – Alternative 2 ....................................................... 3-209Table 3.12-25 City of Bremerton Open Space LOS <strong>Impact</strong>s – Alternative 2 .......................................................... 3-209Table 3.12-26 City of Bremerton Regional Parks LOS <strong>Impact</strong>s – Alternative 2 ...................................................... 3-210Table 3.12-27 City of Bremerton Local Parks LOS <strong>Impact</strong>s – Alternative 2 ........................................................... 3-210Table 3.12-28 Kitsap County Open Space LOS <strong>Impact</strong>s – Alternative 3 ................................................................. 3-211Table 3.12-29 Kitsap County Regional Parks LOS <strong>Impact</strong>s – Alternative 3 ............................................................ 3-211Table 3.12-30 Kitsap County Heritage Parks LOS <strong>Impact</strong>s – Alternative 3 ............................................................ 3-211Table 3.12-31 Kitsap County Community Parks LOS <strong>Impact</strong>s – Alternative 3 ....................................................... 3-211Table 3.12-32 City of Bremerton Open Space LOS <strong>Impact</strong>s – Alternative 3 .......................................................... 3-212Table 3.12-33 City of Bremerton Regional Parks LOS <strong>Impact</strong>s – Alternative 3 ...................................................... 3-212Table 3.12-34 City of Bremerton Local Parks LOS <strong>Impact</strong>s – Alternative 3 ........................................................... 3-212Table 3.12-35 Current and Projected Library Levels of Service ............................................................................. 3-214Table 3.13-1 Solid Waste Facility Inventory .......................................................................................................... 3-220Table 3.13-2 Current Solid Waste LOS Requirements ........................................................................................... 3-220Table 3.13-3 High and Low Estimates of Total and Percent Impervious Surface – Sinclair Inlet Watershed ....... 3-227Table 3.13-4 Comparison of Added Impervious Area in <strong>Gorst</strong> UGA ...................................................................... 3-231Table 3.14-1 Comparison of Growth Targets and Population Capacities ............................................................. 3-240Table 3.14-2 Estimated Net Land Demand by Unincorporated UGA, 2025 .......................................................... 3-241Table 3.14-3 Bremerton and Kitsap County Shoreline, Stream, and Wetland Buffer Comparison ...................... 3-250Table 3.14-4 GMA Goal Consistency...................................................................................................................... 3-254Table 3.14-5 Kitsap County CPP Evaluation ........................................................................................................... 3-259AppendicesAppendix AAppendix BAppendix CAppendix DScoping Summary<strong>Draft</strong> <strong>Planned</strong> <strong>Action</strong> OrdinanceAir Quality GHG Development Reduction Procedures & Sea Level Rise InformationShoreline Buffer Comparison & Options<strong>Draft</strong> |June 2013XIV
GORST PLANNED ACTION EIS | TABLE OF CONTENTSAcronymsACMALSASTMBLSBMCBMPsBNSFBOCCBPACAFÉCAOCERCLACERCLACERCLISCESQGCFPCFPcfscfsCLCSLCNGCOCO2COBDCountyCPPCTRCULCWADAHPdBdBADPS<strong>Draft</strong> EISEcologyEDNAEDREDUEMSEPAESUFCFCCasbestos containing materialsadvanced life supportAmerican Society for Testing and Materialsbasic life supportBremerton Municipal Codebest management practicesBurlington Northern-Santa Fe RailroadBoard of County CommissionersBonneville Power AdministrationCorporate Average Fuel EconomyCritical Areas OrdinanceComprehensive <strong>Environmental</strong> Response, Compensation, and Liability ActComprehensive <strong>Environmental</strong> Response, Compensation, and Liability ActComprehensive <strong>Environmental</strong> Response Compensation and Liability Information SystemConditionally Exempt Small Quantity GeneratorCapital Facilities PlanCapital Facilities Plancubic feet per secondcubic feet per secondConfirmed and Suspected Contaminated Sites ListCascade Natural Gas Corporationcarbon monoxidecarbon dioxideCity of Bainbridge Island DisposalKitsap CountyCountywide Planning PoliciesCommute Trip Reductioncity utility landsClean Water ActDepartment of Archaeology & Historic PreservationdecibelsA-weightedDistinct Population Segment<strong>Draft</strong> <strong>Environmental</strong> <strong>Impact</strong> <strong>Statement</strong>Department of Ecologyenvironmental classification for noise abatement<strong>Environmental</strong> Data Resourceseducation employmentemergency medical servicesU.S. <strong>Environmental</strong> Protection AgencyEvolutionarly Significant Unitfreeway corridorFederal Communications Commission<strong>Draft</strong> |June 2013XV
GORST PLANNED ACTION EIS | TABLE OF CONTENTSFEMAFHWAFINDSFIRESFTE_UGHGGMAHOVHRUHSLHSPFHSSHUCICRJARPAKCCKCHDKCPWKRCCKRLSkVlbsLdnLEDLeqLIDLmaxLminLnLUSTmPaMTCANAAQSNFANHBNHSNO2NOAANoxNPDESNRHPOFMOSPIOVTSPCBFederal Emergency Management AgencyFederal Highway AdministrationFacility Index System;financial, insurance, and real estateFull-time equivalent collegegreenhouse gasGrowth Management Acthigh occupancy vehiclehydrologic response unitsHazardous Sites ListHydrological Simulation Program - FortranHighway of Statewide SignificanceHydrologic Unit CodeIndependent Cleanup ReportJoint Aquatic Resources Permit ApplicationKitsap County CodeKitsap County Health DistrictKitsap County Public WorksKitsap Regional Coordinating CouncilKitsap Regional Library SystemkilovoltpoundsDay-Night Noise Levellight emitting diodeequivalent noise levellow impact developmentmaximum noise levelminimum noise levelstatistical descriptorLeaking Underground Storage Tankmicro-PascalsModel Toxics Control ActNational Ambient Air Quality StandardsNo Further <strong>Action</strong>non-home-based tripsNational Highway Systemnitrogen dioxideNational Oceanic and Atmospheric Administrationnitrogen oxideNational Pollutant Discharge Elimination SystemNational Register of Historic PlacesOffice of Financial ManagementOffice of the Superintendant of Public InstructionOlympic View Transfer StationPolychlorinated Biphenyls<strong>Draft</strong> |June 2013XVI
GORST PLANNED ACTION EIS | TABLE OF CONTENTSPM10PM2.5ppmPROSPSCAAPSEPSNERPPSNSPSRCRAGFRCARCRARCWREETRTPSCOOTSea-TacSEPASIPSKFRSKIASKSDSMAQMDSO2SOVSPCCSTCSUSTAINSWMMWWSWOTSWRCYTAZTCPsTDMTEA-21THPOTIATIPTODUGAUGAMAUSDAUSTV/CVCPParticulate matter less than 10 micrometers in sizeParticulate matter less than 2.5 micrometers in sizeparts per millionParks, Recreation, and Open SpacePuget Sound Clean Air AgencyPuget Sound EnergyPuget Sound Nearshore Ecosystem Restoration ProjectPuget Sound Naval ShipyardPuget Sound Regional CouncilOlalla Recycling & Garbage FacilityResource Conservation and Recovery Act Non-GeneratorResource Conservation and Recovery ActRevised Code of WashingtonReal Estate Excise TaxRegional Transportation PlanSmart Commuter Option of TodaySeattle-TacomaState <strong>Environmental</strong> Policy ActState Implementation PlanSouth Kitsap Fire and RescueSouth Kitsap Industrial AreaSouth Kitsap School DistrictSacramento Metropolitan Air Quality Management Districtsulfur dioxidesingle occupany vehicleSpill Prevention Control and CountermeasureSound Transmission ClassSystem for Urban Stormwater Treatment and Analysis IntegratioNStormwater Management Manual for Western Washingtonstrengths, weaknesses, opportunities, and threatsSolid Waste and RecyclingTransportation Analysis ZonesTraditional Cultural PropertiesTravel Demand ManagementTransportation Equality Act for the 21-CenturyTribal Historic Preservation Officerstotal impervious surfaceTransportation Improvement ProgramTransit Oriented DevelopmentUrban Growth Areaurban growth area management agreementsUnited States Department of AgrigultureUnderground Storage Tanks<strong>Volume</strong>-to-Capacity RatioVoluntary Cleanup Program<strong>Draft</strong> |June 2013XVII
GORST PLANNED ACTION EIS | TABLE OF CONTENTSVMTVOCsWACWDFWWHRWISAARDWMWIWRIAWSDOTWSFWTPWUTCvehicle miles traveledvolatile organic compoundsWashington Administrative CodeWashington Department of Fish and WildlifeWashington Heritage RegisterWashington Information System for Architectural and Archaeological Records DatabaseWaste Management Washington IncorporatedWater Resource Inventory AreaWashington State Department of TransportationWashington State FerriesWashington Transportation PlanWashington Utilities and Transportation Commission<strong>Draft</strong> |June 2013XVIII
1.0 SUMMARY1.1 Purpose of Proposed <strong>Action</strong>The City of Bremerton, in partnership with Kitsap County and other state, federal, and tribal agencies, is planningthe future of the <strong>Gorst</strong> Creek Watershed and UGA. These coordinated efforts are intended to:• Make <strong>Gorst</strong> a place where people want to live, shop and recreate,• Protect water quality, habitat and fish while fostering economic development,• Identify areas for development, restoration and protection based on science,• Adopt a land use plan for <strong>Gorst</strong>, and• Implement a long-range capital improvement plan to provide for future utility services, public services andtransportation needs.Products of the planning effort to date include a <strong>Draft</strong> <strong>Gorst</strong> Creek Watershed Characterization & Framework Planfor the 6,000-acre watershed as a whole and a <strong>Draft</strong> <strong>Gorst</strong> Subarea Plan for the <strong>Gorst</strong> UGA. This <strong>Draft</strong> EIS evaluatespossible environmental impacts of the draft plans and alternatives. In addition to these plans and developmentregulations, the City of Bremerton and Kitsap County are considering designating a planned action for some or allof the <strong>Gorst</strong> UGA. A planned action provides more detailed environmental analysis during an area-wide planningstage rather than at the project permit review stage. Designating a planned action streamlines environmentalreview for development proposals consistent with EIS mitigation measures that are adopted in a planned actionordinance.To illustrate a range of possible futures in <strong>Gorst</strong>, the following alternatives are evaluated in the <strong>Draft</strong> <strong>Gorst</strong>Subarea Plan and this <strong>Draft</strong> EIS:• Alternative 1 (No <strong>Action</strong>) – <strong>Gorst</strong> is a relatively small highway-oriented commercial and industrial center• Alternative 2 – <strong>Gorst</strong> is a well-designed regional commercial center• Alternative 3 – <strong>Gorst</strong> becomes a complete communityAlternative 1 is a required alternative under the SEPA. It represents a continuation of the current ComprehensivePlan and regulations. <strong>Action</strong> alternatives represent a range of land use, growth, policies, and regulations and weredeveloped as part of a public outreach process. These alternatives are discussed more fully in this Chapter.1.2 State <strong>Environmental</strong> Policy Act ProcessSEPA (Chapter 43.21C RCW) requires government officials to consider the environmental consequences of actionsthey are about to take and better or less damaging ways to accomplish these proposals. The officials must considerwhether the proposal will have a probable significant adverse environmental impact on the natural and builtenvironment.The <strong>Draft</strong> EIS is an informational document that provides the City of Bremerton, Kitsap County, members of thepublic, and other agencies with environmental information, an evaluation of alternatives, and potential mitigationmeasures to minimize environmental impacts. This <strong>Draft</strong> EIS is being made available to the City of Bremerton andKitsap County decision makers, other agencies, and the public for review and comment (see Fact Sheet). Followingthe comment period, the City of Bremerton, in consultation with Kitsap County, will prepare a Final EIS thatresponds to comments and describes a preferred alternative that may be similar to a <strong>Draft</strong> EIS alternative or is inthe range of studied alternatives.<strong>Draft</strong> | June 2013 1-1
GORST PLANNED ACTION EIS | SUMMARYThe <strong>Draft</strong> EIS considers potential environmental impacts in <strong>Gorst</strong> Creek Watershed and <strong>Gorst</strong> UGA study area at aprogrammatic level of detail. The adoption of comprehensive plans or other long-range planning activities such asa subarea plan is classified by SEPA as a nonproject (i.e., programmatic) action. A nonproject action is defined as anaction that is broader than a single site-specific project, and involves decisions on policies, plans, and programs. AnEIS for a nonproject proposal does not require site-specific analyses; instead, the EIS discusses impacts andalternatives appropriate to the scope of the nonproject proposal and to the level of planning for the proposal(WAC 197-11-442). The process used to determine the scope of this EIS is found in Appendix A Scoping Summary.Further, portions of the study area that are considered for a planned action are highlighted, and sufficient analysisand mitigation measures are proposed to allow future project expedited environmental review when consistentwith planned action ordinance thresholds and mitigation measures.<strong>Planned</strong> <strong>Action</strong>The City of Bremerton and Kitsap County propose to designate the <strong>Gorst</strong> UGA as a planned action, pursuant toSEPA and implementing rules. 1 According to WAC 197-11-164, a planned action is defined as a project that has thefollowing characteristics:• is designated a planned action by ordinance,• has had significant environmental impacts addressed in an EIS,• has been prepared in conjunction with a comprehensive plan, subarea plan, master planned development, aphased project, or with subsequent or implementing projects of any of these categories,• has had project level significant impacts adequately addressed in an EIS unless the impacts are specificallydeferred for consideration at the project level pursuant to certain criteria specified in the law,• is located within a UGA,• is not an essential public facility, as defined in RCW 36.70A.200, unless an essential public facility is accessoryto or part of a residential, office, school, commercial, recreational, service, or industrial development that isdesignated a planned action under this subsection, and• is consistent with a comprehensive plan or subarea plan adopted under GMA.Review of a planned action is intended to be simpler and more focused than for other projects. If the plannedaction ordinance is adopted, the City or County would follow the applicable procedures contained in the ordinanceto determine if the proposed project impacts are consistent with the <strong>Planned</strong> <strong>Action</strong> EIS. When a permitapplication and environmental checklist are submitted for a project that is being proposed as a planned actionproject, the City or County must first verify the following:• The project meets the description of any project(s) designated as a planned action by ordinance or resolution.• The probable significant adverse environmental impacts were adequately addressed in the EIS.• The project includes any conditions or mitigation measures outlined in the ordinance or resolution.If the project meets the above requirements, the project qualifies as a planned action project and a SEPA thresholddetermination is not required. However, the following actions (i.e., the permit process) are still applicable asdescribed more fully in Chapter 2:1 Another option is to have some land use and environmental standards (for example, the <strong>Planned</strong> <strong>Action</strong>Ordinance) become effective only upon annexation to encourage annexation, which is a Growth Management goalreflected in Kitsap County’s assignment of the UGA to the City.<strong>Draft</strong> | June 2013 1-2
GORST PLANNED ACTION EIS | SUMMARY• The project must continue through the City’s or County’s permit process pursuant to any notices and otherrequirements contained in the City’s or County’s development regulations.• The project must still be analyzed for consistency with the zoning and development regulations.• Designation of a planned action project does not limit the City or County from using other authority (e.g., aconditional use permit) to place conditions on a project. The City or County may still use applicable laws orregulations to impose conditions on a project qualifying as a planned action project.• Public notice for a planned action project is tied to the underlying permit. If notice is otherwise required forthe underlying permit, then the notice will indicate that the project qualifies as a planned action.The manner in which the City or County would monitor the development levels approved in the <strong>Planned</strong> <strong>Action</strong>Area would likely be as follows:• Determine if the proposed land uses are within categories of land use studied in the EIS.• Establish the maximum development potential within the <strong>Planned</strong> <strong>Action</strong> Area as reviewed in the EIS.Development potential can be expressed in terms of total vehicle trips, square feet of development, or othermethods.• As specific development is proposed, deduct from the <strong>Planned</strong> <strong>Action</strong> Area’s development potential. Theplanned action ordinance would establish how methods of measuring projected development capacity relateto one another if more than one method is used.Appendix B <strong>Draft</strong> <strong>Planned</strong> <strong>Action</strong> Ordinance contains a draft of the planned action ordinance including theinformation on the draft process and the parameters used to determine consistency with EIS assumptions.Prior <strong>Environmental</strong> ReviewAn inventory was developed for the study area in August 2011. A Watershed Characterization Study has beenprepared in conjunction with Ecology and WDFW and Fish and Wildlife to evaluate water quality and habitatrelated issues as they relate to land use planning. These documents are available at the City of Bremerton’swebsite www.gorstwatershed.com.The City of Bremerton prepared the SKIA Subarea Plan and <strong>Planned</strong> <strong>Action</strong> EIS in 2012. A small portion of the SKIAarea lies in the watershed.In addition, Kitsap County recently completed the Kitsap County UGA Sizing and Composition Remand Final EIS(August 2012) which addressed the <strong>Gorst</strong> UGA and other UGAs. It contains analysis relevant to the “No <strong>Action</strong>”alternative.Where appropriate, information from these prior environmental documents was used in the preparation of thisEIS.1.3 Public InvolvementThe City of Bremerton and Kitsap County have created a variety of opportunities for public and agency input intothe Watershed Characterization & Framework Plan. <strong>Gorst</strong> Subarea Plan, and <strong>Planned</strong> <strong>Action</strong> EIS. Key efforts aredescribed below:• The City of Bremerton’s website, located at: http://www.gorstwatershed.com/, includes information aboutthe project, links to draft products, and a comment form.• An Advisory Committee, composed of representatives from Bremerton Planning Commission, City ofBremerton Council, Bremerton Mayor, Kitsap County Planning Commission, Kitsap BOCC, and SuquamishTribal Council, represents the interests of their respective bodies and convenes at key project milestones toaddress issues and concerns for <strong>Gorst</strong> Creek Watershed Plan.<strong>Draft</strong> | June 2013 1-3
GORST PLANNED ACTION EIS | SUMMARY• An extensive group of agencies, organizations and individuals are partnering to fund and develop the plan, andworking together as Project Partners to steer the project, including: City of Bremerton, Kitsap County, UnitedState <strong>Environmental</strong> Protection Agency, Ecology and WDFW, Suquamish Tribe, Port of Bremerton, KitsapCounty Health District, Kitsap County Health District, Sustainable Bremerton, West Sound Watershed Counciland <strong>Gorst</strong> property owners, Pat and Cheryl Lockhart.• Scoping comment period and workshop. Public and agency comment was solicited by the City of Bremertonas lead agency in a 21-day written scoping period from October 15 to November 5, 2012. A scoping summaryis provided in Appendix A Scoping Summary.• Preliminary alternatives workshop. At a February 12, 2013 workshop, the City of Bremerton and KitsapCounty asked public input about preliminary land use alternatives that should be evaluated in a draft subareaplan and EIS.• Legislative meetings. On February 19, 2013, the Bremerton Planning Commission and Kitsap County PlanningCommission met separately at their regular meetings to review the preliminary alternatives. AdditionalPlanning Commission, City of Bremerton City Council, and Kitsap County BOCC meetings are planned later inthe process to help identify a preferred alternative, refine and deliberate on the framework and subareaplans, and consider a planned action ordinance. A project schedule is available athttp://www.gorstwatershed.com/.• <strong>Draft</strong> EIS Comment Period. This <strong>Draft</strong> EIS allows for a public comment period (see Fact Sheet) during whichtime the City of Bremerton will accept written comments regarding the alternatives and environmentalimpacts and mitigation measures. The City of Bremerton will issue a Final EIS providing responses tocomments and may address a Preferred Alternative. The Preferred Alternative may include elements from oneor more alternative studied in this <strong>Draft</strong> EIS.1.4 Proposed <strong>Action</strong>, Alternatives, and ObjectivesObjectivesSEPA requires a statement of objectives that address the purpose and need for the proposal. The proposalobjectives for the future of <strong>Gorst</strong> can be found in the Guiding Principles listed in the <strong>Draft</strong> WatershedCharacterization & Framework Plan and <strong>Gorst</strong> Subarea Plan. These Guiding Principles are listed in Table 1-1Watershed Characterization & Framework Plan and <strong>Gorst</strong> Subarea Plan Guiding Principles.Table 1-1Watershed Characterization & Framework Plan and <strong>Gorst</strong> Subarea Plan Guiding PrinciplesCommunity Vision & Economic DevelopmentMake <strong>Gorst</strong> a place where people want to live, shop and recreate.Facilitate development of economically valued land. 1Recognize environmental restoration as a tool that can support the local economy. 1Development PatternIdentify and prioritize land that can be more intensely developed with less environmental consequences.Promote green infrastructure for both new and existing facilities, such as by identifying areas to target for stormwater retrofits.Support development incentives and evaluate options such as off-site mitigation, mitigation banking, and other tools whereappropriate.<strong>Environmental</strong> ProtectionIdentify and protect critical areas.<strong>Draft</strong> | June 2013 1-4
GORST PLANNED ACTION EIS | SUMMARYPrioritize areas to be protected and restored.Protect and enhance water quality/quantity for fish and wildlife habitat as well as for human use.Promote shoreline reclamation.Urban Design, Land Use & TransportationCreate a cohesive and attractive urban character in the <strong>Gorst</strong> UGA such as by improving building design, and creating andenhancing public spaces such as parks, trails, pedestrian corridors and streetscapes.Allow an environmentally sustainable pattern of forestry, low density residential, small scale employment, and recreation usesin the rural areas of watershed.Improve transportation mode choices including transit, bicycle, pedestrian, and autos, recognizing local as well as regionaltravel needs.Promote interpretive art, signage, and public spaces that recognize cultural history and environmental features.Reduce collisions and improve safety.Note:1 Such as by establishing land use plans that offer business and housing opportunities, and capital plans that incentivizeshoreline reclamation and amenities such as open space and recreation, community design, and streetscapes.Proposed <strong>Action</strong> and AlternativesThis <strong>Draft</strong> EIS evaluates three alternatives that set a range of land use patterns and mix of residential andemployment growth:• Alternative 1 – <strong>Gorst</strong> is a relatively small highway-oriented commercial and industrial center. This is a SEPArequiredalternative. It represents No <strong>Action</strong> and continuing with the current Comprehensive Plan.• Alternative 2 – <strong>Gorst</strong> is a well-designed regional commercial center.• Alternative 3 - <strong>Gorst</strong> becomes a complete community.Each alternative proposes a different mix of land use, growth, policies, and regulations described below.Alternative 1 – No <strong>Action</strong>, Current Plan: <strong>Gorst</strong> is a relatively small highway-oriented commercial andindustrial centerThe No <strong>Action</strong> Alternative would retain current Kitsap County and City of Bremerton Comprehensive Plans. TheWatershed Characterization & Framework Plan would not be adopted. New low impact development (LID) andstormwater standards would not be adopted throughout the watershed; however, some portions of thewatershed are already subject to National Pollutant Discharge Elimination System (NPDES) standards that areintended to reduce water quality impacts and promote improved stormwater management.Reflecting the current Comprehensive Plan vision for the <strong>Gorst</strong> UGA, <strong>Gorst</strong> would be a relatively small highwayorientedcommercial and industrial center. Within the UGA, Alternative 1 would allow greater employment growthof 742 jobs and a smaller population growth of 82 persons over the next 20-30 years. No planned action ordinancewould be adopted.No new capital facility improvements, stormwater, or habitat regulations would be implemented beyond adoptedCapital Facility Plans.Alternative 2 – <strong>Gorst</strong> is a well-designed regional commercial centerUnder Alternative 2, the Watershed Characterization & Framework Plan would be adopted. While rural land useand zoning would be retained, amended LID and stormwater standards would be applied throughout thewatershed.Under Alternative 2, the <strong>Gorst</strong> UGA is envisioned as a regional commercial corridor along the waterfront providinglocations for the Bremerton community and Kitsap County residents to shop. Gateway and boulevard treatments,<strong>Draft</strong> | June 2013 1-5
GORST PLANNED ACTION EIS | SUMMARYshoreline access, green infrastructure, and habitat BMPs provide for a more well designed sustainabledevelopment pattern. More medium density clustered residential development would occur in the northwestportion of the UGA, and infill single-family residential development would occur in the western portion of the UGA.Alternative 2 would allow a moderate increase in employment of 606 jobs and a more substantial increase inresidents of 985 persons. A <strong>Planned</strong> <strong>Action</strong> would be designated for most of the UGA except waterward of SR 16and SR 3, along Sinclair Inlet.Capital facility improvements and amended stormwater and habitat regulations would be implemented.Alternative 3 - <strong>Gorst</strong> becomes a complete communityUnder Alternative 3, the Watershed Characterization & Framework Plan would be adopted along with LID andstormwater standards throughout the watershed. Under Alternative 3, the <strong>Gorst</strong> UGA would be guided by aSubarea Plan intended to ensure <strong>Gorst</strong> evolves into a complete community with places to live, play, shop, andwork, in a waterfront setting. Mixed uses would be predominate. Along the waterfront a lower intensitycommercial land use pattern develops with smaller impervious footprints interspersed by trails, parks, andreclaimed shoreline habitat. Central <strong>Gorst</strong> allows more intensive regional commercial, office, hotel, and mixed useresidential developments. Small-scale mixed use neighborhoods lie along West Belfair Road and West Frone Road.Clustered development occurs along <strong>Gorst</strong> Creek. A residential neighborhood along Sherman Heights Roadprovides a range of detached and attached residential choices in clustered patterns and small-scale, neighborhoodservingcommercial uses. Alternative 3 supports less job growth than the other studied alternatives at 333 jobs butthe highest population growth at 1,082 persons. A <strong>Planned</strong> <strong>Action</strong> would be designated for the whole UGA.Capital facility improvements and amended stormwater and habitat regulations would be implemented.Each alternative is further described in Chapter 2.1.5 Major Issues, Significant Areas of Controversy and Uncertainty, and Issues tobe ResolvedMajor issues and issues to be resolved include:• The selection of a preferred land use alternative for the <strong>Gorst</strong> UGA and development of implementing zoningand environmental regulations to address recommendations of the <strong>Gorst</strong> Creek Watershed Characterization &Framework Plan and <strong>Gorst</strong> Subarea Plan.• The provision of infrastructure, public services, and utilities to accommodate growth, create a more walkableand connected community, mitigate stormwater and flooding conditions, and transition from Countygovernance to City governance over time.• The need to reallocate population through amendments to the Countywide Planning Policies recognizing newgrowth capacity in the <strong>Gorst</strong> UGA with action alternatives.1.6 Summary of <strong>Impact</strong>s and Mitigation Measures<strong>Impact</strong>s Common to All AlternativesThis section describes impacts found to be similar among all studied Alternatives 1, 2, and 3.Geology/SoilsWatershed. Creation of impervious surface would result in a long-term loss of soil functions within affected areas,and could lead to increased surface water runoff and erosion of soils in adjacent areas. Removal of trees and othervegetation within these areas could also lead to reduced infiltration and erosion of exposed soils from affectedsites. Additionally, use of heavy equipment for clearing and construction activities could result in compaction of<strong>Draft</strong> | June 2013 1-6
GORST PLANNED ACTION EIS | SUMMARYsoils. Given that geologic hazards and unstable soil conditions occur throughout the watershed, futuredevelopment would have the potential to impact slope stability.<strong>Gorst</strong> UGA. Under all alternatives, most impacts to soils would occur within the <strong>Gorst</strong> UGA, where the majority ofplanned development would be focused. Potential impacts associated with construction activities within the UGAwould be similar to those described for the watershed, although creation of new impervious surface would be asmaller factor in the UGA. The potential for loss of soil through erosion, soil compaction, and soil contaminationwould be present, all of which would have the potential to be minimized, to varying degrees by pertinent plansand BMPs.<strong>Planned</strong> development within the UGA would potentially result in a long-term loss of soil functions over a smallarea if currently undeveloped areas are developed in the future. It is expected that the total area of impervioussurface could increase within the UGA, leading to increased soil erosion. Future development within the UGAwould have the potential to impact slope stability in steep areas.Water ResourcesWatershed. The <strong>Gorst</strong>-Parish floodplain complex is subject to frequent flooding. Anticipated population growthand subsequent development upstream of this location would likely increase the amount of untreated surfacewater, peak runoff flows, and sedimentation. Flooding in the <strong>Gorst</strong>-Parish floodplain complex has been identifiedas priority and would eventually be addressed. Because economic development and population growth in thewatershed would occur under all project alternatives, effects would be similar and considered minor impacts onwater resources.<strong>Gorst</strong> UGA. Under all alternatives, construction activities within the UGA would have the potential to impact waterresources caused by site demolition or construction (water turbidity, debris in the water, etc.), similar to thosedescribed in Section 3.1 Geology/Soils. Overall, construction activities would result in short-term minor impacts onwater resources.Air QualityCurrent air quality regulations would prevent new developments and commercial facilities within the <strong>Gorst</strong> studyarea from generating unacceptable air pollutant emissions that would affect nearby areas during construction oroperation. Because all of the alternatives would increase population, commercial space, and industrial space in the<strong>Gorst</strong> study area above existing conditions, the air pollutant emissions generated within the <strong>Gorst</strong> study area areexpected to increase. Similarly, regional vehicle miles traveled (VMT) by vehicles used by <strong>Gorst</strong> residents and thosewho work in <strong>Gorst</strong> would also increase in the <strong>Gorst</strong> study area, along with the tailpipe emissions generated bythose vehicles. However, the VMT generated by the new homes and businesses in the <strong>Gorst</strong> study area would be asmall fraction of the overall VMT generated within Kitsap County, so it is unlikely that any of the alternatives wouldsignificantly affect regional air quality.Plants and AnimalsWatershed. New construction in rural areas would result in removal of terrestrial habitats, which could injureand/or displace common species of wildlife. Migratory birds could be affected, particularly by construction thatoccurs during the breeding season. Under all alternatives, regulations to protect sensitive species would helpprevent impacts to these species during the construction process. Depending on where it occurs, new constructionin the watershed could also affect wildlife habitat connectivity through fragmentation or interruption of existingwildlife corridors.Noise associated with construction activities in the watershed would likely disturb terrestrial wildlife species,particularly in rural areas where baseline noise levels are low. Noise disturbance would constitute a short-termimpact, lasting only as long as the construction activities, with lower levels of noise associated with residential uses<strong>Draft</strong> | June 2013 1-7
GORST PLANNED ACTION EIS | SUMMARYonce construction is completed. Wildlife could adapt to the noise or leave the area. The greatest risk for adverseeffects would be during breeding periods, when noise could impact nesting/breeding success.Construction activities adjacent to stream channels, other bodies of water, and wetlands would have the potentialto affect these habitats and the species that occur in them, including listed and sensitive fish species. Additionally,stormwater runoff from the developed sites could potentially impact aquatic habitats including creeks that supportsalmon species.<strong>Gorst</strong> UGA. Under all alternatives, development of the remaining privately held open space within the <strong>Gorst</strong> UGAis planned or likely to occur. Such development would decrease the amount of vegetated area, including areaswith wildlife habitat value, such as the block of forestland on the mine property. This reduction in wildlife habitatwould remove populations of some common wildlife species, or force them to move to undeveloped areas nearby.In some cases, newly developed areas would support urban wildlife species such as rats, raccoons, and graysquirrels. It is anticipated that some migratory birds would be impacted as a result of loss of undeveloped habitat,particularly for activities that occur during the breeding season.In areas that are currently developed, noise associated with future redevelopment activities would be short term,lasting only for the duration of construction activities in a given location. Some habitat removal could occur, evenon developed sites, but in most cases these sites would receive new landscaping that provides the same level ofwildlife habitat value. In certain areas, construction activities could disturb wildlife in nearby undeveloped areas,potentially causing some stress to individuals or interfering with nesting or breeding for a limited number ofanimals. These effects would be minimized to baseline levels once the construction is completed. Terrestrialsensitive species and their habitats within the UGA, such as the bald eagle territory along the shoreline of theSinclair Inlet and the osprey nest near Alexander Lake should be protected from long-term harm, and disturbanceto these species minimized, under applicable Critical Area Ordinance (CAO) regulations. However, somedisturbance to these species is likely to occur as a result of nearby construction work.Construction activities adjacent to stream channels, other bodies of water, and wetlands would have the potentialto affect these habitats and the species that occur in them, including listed and sensitive fish species. Additionally,stormwater runoff from the developed sites could potentially impact aquatic habitats, including the creeks thatsupport salmon species, and Sinclair Inlet, which supports numerous sensitive anadromous and marine species. Asdiscussed for the watershed, stormwater plans, BMPs, and SPCC plans would help minimize impacts to aquatichabitats to varying degrees.NoiseWatershed. Development in the watershed, outside of the <strong>Gorst</strong> UGA, may involve construction activity nearexisting residences, temporarily increasing noise levels. Development in the watershed would result in increases infuture traffic volumes on highways and local roads outside of the UGA, resulting in higher ambient noise levelsfrom moving and idling vehicles. Potential noise impacts on sensitive receivers would vary with distance from theroadway.<strong>Gorst</strong> UGA. Potential noise impacts associated with construction activities within the UGA would be similar tothose described for the watershed. However, because construction activity would be concentrated over a smallerarea, and multiple construction activities may occur simultaneously or in overlapping timeframes in the samegeneral area, residences and other noise sensitive receptors within the <strong>Gorst</strong> UGA would likely experiencetemporary increases in noise levels from construction more often and for longer periods of time, and constructionnoise levels may be higher.Development both within and outside of the UGA would result in increases in future traffic volumes on highwaysand local roads within the UGA, resulting in higher ambient noise levels from moving and idling vehicles. Potentialnoise impacts on sensitive receivers would vary with distance from the roadway. Modeled future daily trafficvolumes and PM peak hour vehicles on study area roads are similar under all alternatives, and are estimated to<strong>Draft</strong> | June 2013 1-8
GORST PLANNED ACTION EIS | SUMMARYincrease by less than 35 percent over existing (2010) volumes. Based on the modeled data, traffic noise would beexpected to increase by less than three dB(A), a change that is barely perceptible to the average human ear.Land use within the <strong>Gorst</strong> UGA under all alternatives would include residential and commercial use to varyingdegrees. New commercial development would likely occur near existing or future residences and other sensitivereceivers.Hazardous MaterialsWatershed. Under all alternatives, development and redevelopment would occur within portions of the <strong>Gorst</strong>Creek Watershed. Three sites in the watershed outside of the <strong>Gorst</strong> UGA are currently releasing hazardousmaterials to the environment, although it is assumed that some level of cleanup of these sites would occur in thefuture under all of the alternatives. Redevelopment of these sites would likely include construction activities thatcould disturb contaminated areas, exposing workers, soil, groundwater, and/or surface water to hazardousmaterials. Additionally, construction activities elsewhere in the watershed could expose new contamination notpreviously documented, which would provide opportunities for remediation. Demolition of existing structuresunder any of the alternatives could be associated with risks to workers from exposure to lead-based paint and/orasbestos containing materials (ACMs).<strong>Gorst</strong> UGA. One Reasonably Predictable and seven Substantially Contaminated Sites have been identified withinthe <strong>Gorst</strong> UGA. Many of these sites are currently undergoing cleanup or remedial actions, and it is likely thatcleanup actions would continue into the future under all of the alternatives. However, since many sites in the UGAare currently documented as storing hazardous substances or waste, it is likely that additional contaminated siteswill be discovered in the future. As discussed for the watershed, there would be risks associated with exposures orreleases of hazardous materials during redevelopment activities, including disturbance of contaminated soil,demolition of buildings with lead-based paint or ACMs, and use/storage of hazardous materials at constructionsites.Land Use PatternsUnder all alternatives, additional growth is anticipated in the <strong>Gorst</strong> UGA. Vacant land would, over time, bedeveloped for commercial, residential, recreational, or industrial use, as allowed by the land use and zoningdistricts adopted under that alternative. Properties occupied by nonconforming uses would eventually beredeveloped in a manner consistent with adopted zoning, and new development and redevelopment would alsoentail the eventual modification or demolition of some existing structures, as well as the construction of newbuildings, which could cause temporary construction-related impacts, such as increased levels of noise, fugitivedust, and vehicle traffic.Socio-EconomicsWatershed. Outside the <strong>Gorst</strong> UGA, it is not expected there will be any differences for the <strong>Gorst</strong> Creek Watershedin terms of population and employment growth between the alternatives. Population growth will most likely occuron rural lots in the areas designated Rural Residential and Urban Reserve in the southern part of the watershed.Both designations limit development to relatively low densities. Rural Residential allows one dwelling unit per fiveacres and Urban Reserve allows one unit per 10 acres. Commercial and employment growth will most likely occurwithin parts of SKIA and Bremerton in the watershed. <strong>Impact</strong>s from the large increase in jobs in SKIA are addressedin the SKIA Subarea Plan and EIS.<strong>Gorst</strong> UGA. Under all alternatives, additional growth is anticipated in the <strong>Gorst</strong> UGA. The number and compositionof people and housing varies considerably by alternative. See Table 1-2 Comparison Matrix of <strong>Impact</strong>s.<strong>Draft</strong> | June 2013 1-9
GORST PLANNED ACTION EIS | SUMMARYAestheticsWatershed. <strong>Impact</strong>s to the visual character of the City Utility Lands (CUL), SKIA, and McCormick Woods would beminimal for all alternatives as they would be managed based on present zoning and adopted plans under allalternatives.Cultural ResourcesWatershed. <strong>Impact</strong>s that can adversely affect important cultural resources include anything that mightsignificantly destroy or alter the important features of a cultural resource. Direct and indirect effects to culturalresources can result from human activities or natural events. Under all alternatives, development would occurthroughout the <strong>Gorst</strong> Creek watershed, to varying degrees as allowed by zoning and applicable regulations.<strong>Gorst</strong> UGA. Potential impacts associated with development and construction activities within the UGA would besimilar to those described for the watershed. The potential for loss of significant cultural resources would bepresent, including archaeological sites, historic built environment resources, and traditional cultural properties(TCPs), all of which would have the potential to be minimized, to varying degrees by conducting preconstructioncultural resources inventories and evaluations within the High Probability Areas and implementing mitigationmeasures.TransportationDaily trips and daily vehicle miles are very similar for all three alternatives. See Table 1-2 Comparison Matrix of<strong>Impact</strong>s.Fire Protection and Emergency Medical Service (EMS)Watershed. No land use changes are proposed for the <strong>Gorst</strong> Creek watershed outside the <strong>Gorst</strong> UGA. Growthwould occur based on adopted plans, which already have been accounted for in County and City of BremertonComprehensive Plans and associated capital facility plans. Updated stormwater and habitat regulations in this areaare not anticipated to have any effect on the demand for fire protection and EMS. Therefore, no significantimpacts to these services are anticipated under any of the alternatives that aren’t already accounted for in existingplanning documents.Law EnforcementWatershed. No land use changes are proposed for the <strong>Gorst</strong> Creek watershed outside the <strong>Gorst</strong> UGA. Updatedstormwater and habitat regulations in this area are not anticipated to have any effect on the demand for policeprotection. Therefore, no significant impacts to law enforcement services are anticipated under any of thealternatives that aren’t already accounted for in existing planning documents.SchoolsWatershed. No land use changes are proposed for the <strong>Gorst</strong> Creek watershed outside the <strong>Gorst</strong> UGA beyondalready adopted Comprehensive Plans. Updated stormwater and habitat regulations in this area are notanticipated to have any effect on the number of students in the South Kitsap School District (SKSD).<strong>Gorst</strong> UGA. Annexation by Bremerton of the <strong>Gorst</strong> UGA would not change the district boundaries for childrenliving in <strong>Gorst</strong>. The alternatives will affect SKSD by increasing residential development, and consequently thenumber of students enrolled in SKSD. Under all alternatives, the number of students generated is fairly minimaland should not increase demand much beyond that addressed in the Preferred Alternative adopted in the 2012Kitsap County UGA Sizing and Composition Remand Final Supplemental <strong>Environmental</strong> <strong>Impact</strong> <strong>Statement</strong>.Parks, Recreation, and Open SpaceWatershed. No land use changes are proposed for the <strong>Gorst</strong> Creek watershed outside the <strong>Gorst</strong> UGA beyondadopted Comprehensive Plan. Updated stormwater and habitat regulations in this area are not anticipated to have<strong>Draft</strong> | June 2013 1-10
GORST PLANNED ACTION EIS | SUMMARYany effect on the demand for parks, recreation, and open space. Therefore, no significant impacts to these servicesare anticipated under any of the alternatives.<strong>Gorst</strong> UGACounty <strong>Impact</strong>s. If the <strong>Gorst</strong> UGA remains in the County, all alternatives would result in a marginal increase indemand for County park and recreation facilities. The specific facilities impacted or the geographic need for newfacilities would depend in part on the location of growth, which will vary by alternative.Per Kitsap County Code (KCC) Chapters 410.110.020 and 410.110.210, the County collects a parks impact fee foreach new housing unit developed in unincorporated areas. <strong>Impact</strong> fee revenues are directed toward park planning,land acquisition, site improvements, construction and engineering, mitigation costs, and capital equipment. Newdevelopment under the alternatives would also generate revenue from Real Estate Excise Tax (REET), which can beused for any type of capital project in the County. A portion of increased tax revenues could be used to fundacquisition and development of new parks and recreation facilities, as well as operation and maintenance of newand existing facilities under all alternatives.City of Bremerton <strong>Impact</strong>s. If the City of Bremerton were to annex the <strong>Gorst</strong> UGA, the current population andprojected population growth within the UGA would drive some additional demand for Parks services. While theCity of Bremerton does not charge a parks impact fee to offset the demand from new development, the City ofBremerton could require that any master planned development include park or open space land for its residents.LibrariesUnder all alternatives, population growth in the <strong>Gorst</strong> Creek watershed and within the <strong>Gorst</strong> UGA would increasedemand for library services in proportion to the population growth anticipated. <strong>Impact</strong>s of each alternative aresummarized in Table 1-2 Comparison Matrix of <strong>Impact</strong>s.PowerUnder all alternatives, population growth in the <strong>Gorst</strong> Creek watershed and within the <strong>Gorst</strong> UGA would increasedemand for power in proportion to the population growth anticipated. <strong>Impact</strong>s of each alternative aresummarized in Table 1-2 Comparison Matrix of <strong>Impact</strong>s.Solid WasteWatershed. No land use changes are proposed for the <strong>Gorst</strong> Creek watershed outside the <strong>Gorst</strong> UGA. Updatedstormwater and habitat regulations in this area are not anticipated to have significant effects on solid wastemanagement needs in this area.<strong>Gorst</strong> UGA. Since solid waste service is provided on a regional level, impacts to the service provider (WasteManagement) and management organization are nearly identical whether or not <strong>Gorst</strong> is annexed by the City ofBremerton.The additional population capacity generated under the three alternatives would marginally increase demand forsolid waste capacity. The County, through contracts with private haulers, will continue to be able to provide solidwaste management for an increased population regardless of the alternative ultimately chosen. The County wouldhave adequate time to plan for landfill capacity for solid waste generation under all alternatives, and the County’scurrent contracted landfill location is expected to have sufficient capacity through 2025 and beyond if a new orextended contact is enacted.Water, Wastewater, and StormwaterWatershed. Over the next 20 to 30 year jobs would substantially increase from 264 to 2,305 primarily due toeconomic development in the SKIA. The added jobs in the SKIA area would be subject the SKIA Subarea Plan.Population growth is projected to increase from 1,810 to 2,659. These changes in the watershed would increase<strong>Draft</strong> | June 2013 1-11
GORST PLANNED ACTION EIS | SUMMARYdemand in utilities services. The CFPs for the specific growth areas in the watershed would ensure adequate utilityservices matched the new demand and reduce the potential for disruption of utility services.<strong>Gorst</strong> UGA. Under all alternatives, construction activities within the UGA would have the potential to impactutilities. Depending on the scale, construction projects would likely result in short-term disruptions of service.Scale and intensity of construction projects would vary by alternative.Under all alternatives, the <strong>Gorst</strong> UGA would be annexed to the City of Bremerton, resulting in a transition fromCounty to City governance.Under all alternatives, the water (drinking) and wastewater systems have the capacity to accommodateanticipated growth. However, only the projected growth for no action (Alternative 1) is accounted for in KitsapCounty CFP. Both action alternatives (Alternatives 2 and 3) propose development at the mine site and wouldrequire an evaluation of drinking water and wastewater capital improvements which are described under therespective alternative in Table 1-2 Comparison Matrix of <strong>Impact</strong>s.TelecommunicationsUnder all alternatives, demand for cable television, phone, internet, and other telecommunications services wouldincrease in response to population growth. Additional growth in the <strong>Gorst</strong> Creek watershed and <strong>Gorst</strong> UGA wouldrequire installation of additional infrastructure, installed as development occurs. Compared to the regionalcustomer bases of each of the service providers, the growth anticipated in the <strong>Gorst</strong> area is relatively small andunlikely to have any significant impact on provision of telecommunication services in Kitsap County.Relationship to Plans and PoliciesAll alternatives would maintain adopted land use plans in the watershed, which maintains consistency with currentKitsap County and City of Bremerton plans. All alternatives also maintain present UGA boundaries, allowing forconsistency with Growth Management Act (GMA) provisions regarding UGA sizing. Last each alternative has beendeveloped and reviewed during public outreach opportunities as identified in Section 2.0 Alternatives.Matrix of <strong>Impact</strong>s by AlternativeTable 1-2 Comparison Matrix of <strong>Impact</strong>s provides a summary of impacts by alternative based on the analysis ofChapter 3.0 Affected Environment, Significant <strong>Impact</strong>s, and Mitigation Measures. <strong>Impact</strong>s are presented withoutthe context of the affected environment and are significantly abbreviated. For the full context, Chapter 3.0 shouldbe consulted.Geology/SoilsTable 1-2Comparison Matrix of <strong>Impact</strong>sTopic Alternative 1 Alternative 2 Alternative 3WatershedDevelopment within thewatershed would continueto be haphazard, anddespite existing regulationsand guidance, soil erosionwithin the watershed mayincrease as a result of newdevelopment.On a watershed scale, plannedimprovements to stormwaterfacilities, stream restoration,and protection of key recharge/discharge/ storage areas, ifimplemented, would help tominimize the impacts of newdevelopment and associatederosion, and would likely resultin a reduction in flooding andexport of soils from thewatershed.Similar to Alternative 2.<strong>Draft</strong> | June 2013 1-12
GORST PLANNED ACTION EIS | SUMMARYTopic Alternative 1 Alternative 2 Alternative 3<strong>Gorst</strong> UGACreation of impervioussurface would result in theloss of soils on up to 41 netacres, as well as thefunctions that they provide(e.g., ability to supportnative plant species andother vegetation, andinfiltration of water), andcould contribute toincreased erosion of soils.Development on currentlyundeveloped parcels wouldresult in the long-term loss ofsoils and their functions on upto 70 net acres; though thealternative does recognizepublic park/open space areas.Creation of new impervioussurface could contribute toincreased erosion of soils.Construction on the mine sitecould require substantialmitigation, including projectdesign to minimize impacts tosoils and geologic resources.Developable land wouldequal about 69 net acres.This alternative includes thesame amount of open spaceas Alternative 2, as well asLow Intensity Waterfront,which reduces impervioussurfaces and promotesshoreline reclamation andopen space. Thereforesome soil functions wouldbe retained within thedevelopable land.Potential impactsassociated with the minesite would be similar toAlternative 2.Water ResourcesWater Quality and FloodingCommercial areas wouldlikely be redeveloped onthe previously disturbedimpervious surface withoutwater quality treatment andwould continue to impactfloodplains and theshoreline. Incrementalrestoration and potentialwater quality treatmentwould occur on waters thatare 303(d) listed.Overall, Alternative 2 wouldhave a minor effect on waterresources from short-termconstruction related impactsand moderate effects fromlong-term developmentcontinued development of highdensity commercial areas alongthe shoreline. The long-termeffects of the commercialdevelopment may be offset byimplementation of the adoptedWatershed Characterization &Framework Plan.Due to greater scrutiny ofpermits in floodplains and dueto the listing of fish species, thedevelopability of the <strong>Gorst</strong>Creek floodplain area forintensive commercial uses isexpected to be challenging.Similar to Alternative 2.Air QualityEmissions from Vehicle Travel(VMT) due to <strong>Gorst</strong> UGAGrowthAlternative 1 wouldproduce 29,067 daily VMT,which would contribute lessthan one percent (0.4%) ofthe Kitsap County regionalVMT forecast for 2035.Alternative 2 would produce49,350 daily VMT (0.7%) lessthan one percent of the KitsapCounty VMT forecast for 2035.Alternative 3 wouldproduce 45,707 daily VMT(0.7%) less than onepercent of the KitsapCounty VMT forecast for2035.<strong>Gorst</strong> UGA Emission increase,metric tons CO2-equivalentper year compared to existingconditions7,474 14,371 12,922<strong>Draft</strong> | June 2013 1-13
GORST PLANNED ACTION EIS | SUMMARYTopic Alternative 1 Alternative 2 Alternative 3Soil Carbon GHG EmissionsBased on Removal of ExistingVegetation, metric tons CO2-equivalent per year120 237 237Plants and AnimalsLand and habitat disturbance:UGAUndeveloped land onapproximately 41 net acresin parcels, or less than onepercent of the total area ofthe <strong>Gorst</strong> watershed, wouldbe developed in the future.There is a minimal amountof high quality wildlifehabitat in the UGA.Approximately 70 net acres, orone percent of the total area ofthe <strong>Gorst</strong> watershed, would bedeveloped in the future whichcould affect wildlife habitatthrough permanent or shorttermloss.Parks, recreation areas, andother open spaces would beexpected to provide morewildlife habitat.Subarea Plan and WatershedFramework Plan policies andBMPs would be applied andhelp offset impacts.Similar to Alternative 2,though 69 net parcel acreswould be disturbed.Impervious area and waterquality: UGACreation of new impervioussurface in the UGA couldoccur under this alternative,which would exacerbatewater quality issuesassociated withstormwater. However,adoption of the LIDguidance manual wouldavoid new impacts thoughnot address existingstormwater issues. Existingfish passage barriers wouldcontinue. No new standardspromoting BMPs wouldapply.While impervious surfacescould be added, the newStormwater Management Plan,Watershed Characterization &Framework Plan, and <strong>Gorst</strong>Subarea Plan would includeefforts to minimize impervioussurface in developed/redeveloped areas, improvestormwater facilities, restoredegraded stream channels, andprotect key recharge/discharge/storage areas. All of thesefeatures would benefit aquaticspecies within the watershedand UGA by reducing impacts towater quality.Similar to Alternative 2.Additionally, the LowIntensity Waterfront, wouldallow commercial uses withsmaller amounts ofimpervious area and therewould be incentives forshoreline reclamation. Thiszoning would potentiallyresult in the highest qualitywildlife habitat within thesoutheast portion of theUGA. However, it isexpected that urban wildlifeand common species wouldstill predominate.NoiseTransportation and OperationNoiseLand uses under Alternative1 would include urbanindustrial uses, includingheavy industrial. However,residential land uses underAlternative 1 would coveronly 13 percent of the totalUGA and the overallnumber of existing andfuture sensitive receiversthat could potentiallyexperience noise impacts ismuch smaller than underResidential land uses underAlternative 2 would cover 49percent of the UGA, increasingthe overall number of existingand new sensitive receivers thatcould potentially be affected bynoise from new commercialoperations. While residentialland uses under Alternative 2are zoned separately fromcommercial zones, newcommercial operations couldoccur near existing or newUnder Alternative 3, areaszoned as <strong>Gorst</strong> Mixed Usewould likely includeresidential uses locatedabove or in very closeproximity to commercialuses, and in areas served bypublic transit along majorroadways. Thisdevelopment patternincreases the potential foroperational noise levelsassociated with commercial<strong>Draft</strong> | June 2013 1-14
GORST PLANNED ACTION EIS | SUMMARYTopic Alternative 1 Alternative 2 Alternative 3Alternatives 2 and 3.Regardless, newcommercial and industrialoperations could occur nearexisting or new residencesand other sensitivereceivers, and operationscould cause noise levels toexceed Kitsap County’s andthe City of Bremerton'snoise ordinance.residences and other sensitivereceivers, and operations couldcause noise levels to exceed theKitsap County’s and City ofBremerton's noise ordinance.development to exceednoise thresholds in theKitsap County’s and City ofBremerton's noiseordinance and impactnearby sensitive receivers.Hazardous MaterialsContamination and ExposureNon-residential land useswould make up 87 percentof the land area in the UGA.The potential forcontamination of soil andwater from land uses wouldlikely be greatest under thisland use breakdown, ascompared to the actionalternatives.Redevelopment ofindustrial or commercialproperties to residentialuses would also have anassociated risk of humanexposure to contaminants.Under this alternative, the landuse breakdown within the UGAwould not include an industrialcomponent. The potential forcontamination of soil and waterfrom future land uses would belower under Alternative 2 thanunder Alternative 1.Implementation of theWatershed Characterization &Framework Plan and <strong>Gorst</strong>Subarea Plan would helpaddress flooding andstormwater infiltration issuesthroughout the watershed,which would help minimize theamount of flooding ontodeveloped areas and associatedmovement of hazardousmaterials in surface water.Similar to Alternative 2.Land Use PatternsLand Use PatternsLand use patterns wouldremain similar to existingconditions. Current zoningwould promote a gradualtransition toward morecommercial development inthe <strong>Gorst</strong> UGA.Land use patterns in the <strong>Gorst</strong>UGA would transition awayfrom industrial uses to a greaterproportion of commercial andresidential uses. New land usedesignations and zoning wouldtake effect along Sinclair Inlet,causing existing industrial usesto eventually redevelop ascommercial uses or open spaceas dictated by the subarea plan.Changes in land usepatterns would be subtledue to implementation ofmixed-use zoning. Industrialuses would transition tocommercial, residential,office, or mixed-usedevelopment.Lands Use CompatibilityBecause the <strong>Gorst</strong> UGAcontains a large amount ofresidential developmentwithin commercially-zonedareas, some temporaryincompatibilities may ariseas new commercialdevelopment occursSome temporaryincompatibilities could arise asnew commercial developmentoccurs adjacent to existingresidential uses. In locationswhere residences are adjacentto industrial uses, the transitionof these properties toCommercial developmentwould be designed for amixed-use environmentwith associated designguidelines, therebyreducing the potential forincompatibilities withexisting residential<strong>Draft</strong> | June 2013 1-15
GORST PLANNED ACTION EIS | SUMMARYTopic Alternative 1 Alternative 2 Alternative 3adjacent to existingresidential uses.commercial use may improvecompatibility.development or othersensitive uses. In locationswhere residences areadjacent to industrial uses,the transition of theseproperties to commercialuse may improvecompatibility.Socio-EconomicsPopulation and employmentgrowthThe limited residentialgrowth and lack of changein land use regulationsmake it likely that anychange in the localeconomy will be acontinuation of the currentcharacter with some largerscale and/or more intensecommercial uses that caterto the regional market andpass through traffic. Theadditional employees in thecommunity during the daywould spur demand forsome retail establishments,such as lunch and coffeespots.The additional residentialgrowth and ability for largerscale commercial uses couldlead to the establishment ofnew businesses and change ofcurrent businesses to largerscale ones. The addition ofalmost 1,000 residents wouldlikely increase the demand forsmall scale retail uses,especially convenience itemsand food services.The additional residents andemployees in <strong>Gorst</strong> wouldincrease the need forinfrastructure, open space, andamenities, especially at themine site.These changes would likelychange the character of thelocal economy by adding somesmaller scale businesses thatsupport the new residents aswell as the potential for largerscale and/or more intensivebusinesses, which coulddisplace some of the existingbusinesses and uses withhighway access.The additional residentialgrowth, the allowance ofmore types and intensity ofcommercial usesthroughout the UGA, andbetter access to open spaceand recreational facilitiescould make area moreattractive for more types ofcommercial uses. This maylead to the establishment ofnew businesses andbusiness types that do notcurrently exist in the area.The addition of almost1,100 residents would likelyincrease the demand forsmall scale retail usessimilar to Alternative 2. Inaddition, better access toopens space and recreation,a better connection to thewaterfront, and theassociated view add valueto these sites, which makethem more attractivecertain commercial andrecreational uses. Underthis situation the characterof the local economy hasthe potential to be differentfrom what it is today.AestheticsVisual CharacterWatershed developmentmay incorporate fewerBMPs that retain vegetationand natural features.New development along thehighway corridors wouldcontinue a pattern of lowrise development with largeareas of impervioussurfaces.Some existing, low densityFuture development within thewatershed would result in lessvegetation clearing, fewerimpervious surfaces, and amore natural visual characterthan what would be expectedunder Alternative 1.Implementation of Alternative 2would result in substantialchanges to the present visualcharacter of the UGA. Areas ofThe impacts of Alternative 3are similar to those ofAlternative 2 in terms of theextent of overall change invisual character from thepresent condition to a morecompactly developed urbancenter, the potential forconflicts during thetransition from currentconditions to future build<strong>Draft</strong> | June 2013 1-16
GORST PLANNED ACTION EIS | SUMMARYTopic Alternative 1 Alternative 2 Alternative 3residential uses would bedisplaced by more intenselydeveloped commercial usesof a substantially differentcharacter.existing low-density residentialuses would be converted tomore intense commercialdevelopment, and the mine sitewould be converted from itspresent resource extraction useto a residential neighborhood.New <strong>Gorst</strong> Subarea Plan policiesand urban design conceptswould result in new designguidelines that mitigate manyof the negative aestheticqualities frequently associatedwith the <strong>Gorst</strong> UGA.out, and the overall positiveeffect of new design policiesand concepts.Within mixed use areas, thegreater amount ofresidential may ease someof the potential transitionconflicts in currentlyresidential areas.The Low IntensityWaterfront zone wouldhave the effect oftransitioning this area fromits current condition to onemore characterized by lowimpact commercialdevelopment with lessimpervious area, greatershoreline setbacks, morevegetation, and more publicaccess.Building Height, Bulk, andScale: <strong>Gorst</strong> UGAIn those areas of existinglow density residential orundeveloped land that areidentified for commercialand mixed uses, thepotential exists for negativeimpacts related to buildingheight, bulk, and scale asthese areas transition fromresidential to commercialduring the course of theplan horizon.Similar to Alternative 1, someconflicts of scale may occur asareas currently occupied bylow-density residential usestransition to more intenselydeveloped commercial uses.Subarea Plan policies anddesign concepts should mitigatemuch of this conflict byencouraging a more consistentbuilding-street relationship andavoiding the often haphazardnature of development thatcurrently characterizes much ofthe UGA.Similar to Alternative 2.Views: <strong>Gorst</strong> UGAViews of Sinclair Inlet maybe negatively affected aswaterfront areas are moreintensely developed withcommercial and industrialuses. Given the extent ofdevelopment alreadypresent, however, theseimpacts are not expected tobe significant.Similar to Alternative 1 somelocalized view impacts mayoccur as sites develop;however, these impacts are notexpected to be significant.Development of the mine siteas a residential neighborhoodwould have positive (for newsite users) and negative (due toclearing) view impacts.Similar to Alternative 2.Cultural ResourcesConstruction, Operations,Indirect, and Cumulative<strong>Impact</strong>s: <strong>Gorst</strong> UGADevelopment andassociated constructionactivities would result inground disturbance within41 net developable acres,New development on currentlyundeveloped parcels has thepotential to impact significantcultural resources on up to 70net developable acres, which isThe area of net developableland identified forAlternative 3 isapproximately 69 acres,roughly the same as under<strong>Draft</strong> | June 2013 1-17
GORST PLANNED ACTION EIS | SUMMARYTopic Alternative 1 Alternative 2 Alternative 3and could contribute toincreased disturbance toknown and undocumentedarchaeological sites, historicbuilt environmentresources, and TCPs.greater than that underAlternative 1.Alternative 2, but greaterthan under Alternative 1.TransportationDaily Vehicle Trips:Countywide (and Attributed toAlternatives 2 and 3)Countywide Model DailyVehicle Miles of Travel (VMT)Deficient County RoadwaySegmentsProjected State HighwayDeficiencies by 2035 (Lengthof deficient segments)Countywide Model DailyTransit Person Trips by 2035884,937 887,760 (+2,823) 886,968 (+2,031)6,602,656 6,615,322 6,604,4585.6 5.6 5.61.87 1.87 1.6614,467 14,495 14,533Fire Protection and Emergency ServicesSouth Kitsap Fire and Rescue<strong>Gorst</strong> UGA populationwould increase by 82residents under Alternative1. SKFR’s existing facilitieswill allow it to meet itslevelof service (LOS) through2035.<strong>Gorst</strong> UGA population wouldincrease by 985 residents underAlternative 2. SKFR’s existingfacilities will allow it to meet itsLOS through 2035.<strong>Gorst</strong> UGA populationwould increase by 1,082residents under Alternative3. SKFR’s existing facilitieswill effectively allow it tomeet its LOS through 2035.Bremerton Fire DepartmentAnnexing <strong>Gorst</strong> UGA wouldincrease population servedby 304 people, which wouldnot be expected to impactfire and EMS services.Annexing <strong>Gorst</strong> UGA wouldincrease population served by1,207 people, which would notbe expected to impact fire andEMS services.Annexing <strong>Gorst</strong> UGA wouldincrease population servedby 1,304 people, whichwould not be expected toimpact fire and EMSservices.Law EnforcementKitsap County Sheriff’s OfficeAn estimated 82 additionalresidents from growth inthe <strong>Gorst</strong> UGA underAlternative 1 would haveminimal impact on LOS. TheCounty is estimated to need1 additional work releasebed.An estimated 985 additionalresidents from growth in the<strong>Gorst</strong> UGA under Alternative 2would have minimal impact onLOS. The County is estimated toneed 2 additional work releasebeds.An estimated 1,082additional residents fromgrowth in the <strong>Gorst</strong> UGAunder Alternative 3 wouldhave minimal impact onLOS. The County isestimated to need 2additional work releasebeds and one county jailbed.<strong>Draft</strong> | June 2013 1-18
GORST PLANNED ACTION EIS | SUMMARYTopic Alternative 1 Alternative 2 Alternative 3Bremerton Police Department Annexation of 304additional residents andincreased geography by theCity would require anestimated increase in policeservice of about 0.5commissioned officers.Annexation of 1,207 additionalresidents and increasedgeography by the City wouldrequire an estimated increase inpolice service of about 2.2commissioned officers.Annexation of 1,304additional residents andincreased geography by theCity would require anestimated increase in policeservice of about 2.4commissioned officers.SchoolsSouth Kitsap School DistrictAlternative 1 has the lowestenrollment projections of allalternatives. The District isestimated to have adeficiency of about 2,200students in 2035.Alternative 2 has the secondlowest enrollment projectionsof all alternatives. The District isestimated to have a deficiencyof about 2,400 students in2035.Alternative 3 has thehighest enrollmentprojections of allalternatives. The District isestimated to have adeficiency of about 2,430students in 2035.Parks, Recreation and Open SpaceKitsap County Parks andRecreationThe County will be able tomeet its adopted LOSthrough 2035 underAlternative 1.Under Alternative 2, growth of985 residents in the <strong>Gorst</strong> UGAwould drive estimatedadditional need of 31 openspace acres, 8 regional parkacres, and 7 community parkacres.Under Alternative 3, growthof 1,082 residents in the<strong>Gorst</strong> UGA would driveestimated additional needof 37 open space acres, 9regional park acres, 1heritage park acre, and 8community park acres.Bremerton Parks andRecreationUnder Alternative 1, theCity would need anestimated additional 1 openspace acre and 2 regionalpark acres.Under Alternative 2, the Citywould need an estimatedadditional 2 open space acres,17 regional park acres, and 1local park acre.Under Alternative 3, theCity would need anestimated additional 3 openspace acres, 20 regionalpark acres, and 2 local parkacres.LibrariesAnnual Circulation per CapitaThe No <strong>Action</strong> Alternativewould increase populationby 82 residents. Effects oncountywide demand forcirculation items would benegligible.Alternative 2 would add 985residents. To maintain existinglevels of service, an additional8,816 items in annualcirculation would be required.Alternative 3 would add1,082 residents. Tomaintain existing levels ofservice, an additional 9,684items in annual circulationwould be required.Facility Square Footage perCapitaThe No <strong>Action</strong> Alternativewould increase populationby 82 residents. Effects oncountywide demand forfacility space would benegligible.Alternative 2 would add 985residents. To maintain existinglevels of service, an additional345 square feet of facility spacewould be required. TheDowntown Bremerton and PortOrchard libraries are most likelyto be directly affected.Alternative 3 would add1,082 residents. Tomaintain existing levels ofservice, an additional 379square feet of facility spacewould be required. TheDowntown Bremerton andPort Orchard libraries aremost likely to be directlyaffected.<strong>Draft</strong> | June 2013 1-19
GORST PLANNED ACTION EIS | SUMMARYTopic Alternative 1 Alternative 2 Alternative 3PowerDemand for Electricity andNatural GasThe No <strong>Action</strong> Alternativewould increase populationby 82 residents and 742jobs. Effects on countywidedemand for power wouldbe negligible.Alternative 2 would increasepopulation by 985 residents and606 jobs. Demand for powerwould increase, and additionaldistribution infrastructurewould be installed asdevelopment occurs. Thegrowth anticipated is relativelysmall and is unlikely to havesignificant impacts on regionalprovision of power.Alternative 3 wouldincrease population by1,082 residents and 333jobs. Demand for powerwould increase, andadditional distributioninfrastructure would beinstalled as developmentoccurs. The growthanticipated is relativelysmall and is unlikely to havesignificant impacts onregional provision of power.Solid WasteCountywide DemandAlternative 1 has the leastpopulation growth andtherefore less demand thanother alternatives. TheCounty has adequate solidwaste capacity under allalternatives.Alternative 2 has the secondhighest populationprojection, and thereforehigher demand thanAlternative 1 but lowerdemand than Alternative 3.The County has adequatesolid waste capacity under allalternatives.Alternative 3 has the highestpopulation projects andtherefore the highestdemand for solid wastecapacity. The County hasadequate solid wastecapacity under allalternatives.Water, Wastewater and StormwaterWaterGrowth in the <strong>Gorst</strong> UGAwould be served by currentwater service providers,which have adequatecapacity for growth.The <strong>Gorst</strong> UGA would be servedby current water serviceproviders, which have adequatewater source capacity forgrowth. New development atthe mine site would requiredeveloper installedimprovements for adequatedistribution of drinking water.Adoption of the WatershedCharacterization & FrameworkPlan would provide a directivefor enhancing and protectingwater for human use toresidents of the UGA.Similar to Alternative 2.WastewaterWastewater deficiencieswere addressed followingthe installation of thecollection system in 2010.However, given the gradualincrease in demand,extension of service wouldbe needed for newdevelopment.Projected growth is notaccounted for in the KitsapCounty CFP. In general anextension of sewer mains andimprovement to existing pumpstations may be required forthe proposed Medium DensityResidential area in the minearea.The proposed new residentialSimilar to Alternative 2.<strong>Draft</strong> | June 2013 1-20
GORST PLANNED ACTION EIS | SUMMARYTopic Alternative 1 Alternative 2 Alternative 3area would require developerinstalled improvements to thewastewater system toaccommodate new growthStormwaterNew stormwater standardswould not be adopted, anddeficiencies would continueto be unresolved. However,Kitsap County’s CFP wouldeventual incorporatemeasures for addressingdeficiencies. Runoff duringstorm events wouldcontinue to cause sheetflow over roads anddischarge directly tostreams and water bodiesincluding <strong>Gorst</strong> Creek andSinclair Inlet. The increasein development, particularlyfrom commercialdevelopment would alsolikely increase impervioussurfaces to about 51.3acres.Current deficiencies instormwater conveyance wouldbe resolved. Stormwatermanagement on proposed newdevelopment andredevelopment would followthe Watershed Characterization& Framework Plan and result inreduced stormwater runoff.Compilation of watershed dataand use of the hydrology andhydraulic modeling would alsoassist in identify priority areasand optimize investment ofstormwater facilities. However,for a conservative analysis inthis EIS, a comparison ofimpervious area shows anincrease in impervious areaover the Alternative 1 No <strong>Action</strong>option due to the addeddevelopment of the mine site at68 acres.Similar to Alternative 2, butthe estimated imperviousacres are slightly higher at59 acres.TelecommunicationsDemand forTelecommunication ServiceSee <strong>Impact</strong>s Common to AllAlternativesSee <strong>Impact</strong>s Common to AllAlternativesSee <strong>Impact</strong>s Common to AllAlternativesRelationship to Plans and PoliciesGMA Planning GoalsAlternative 1 meets GMAgoals for economic andhousing growth in urbanareas, supported bytransportation and publicfacility improvements.Alternative 1 would applyshoreline and critical arearegulations.Alternative 2 meets GMA goalsfor economic and housinggrowth in urban areas,supported by transportationand public facilityimprovements. Alternative 2would apply shoreline andcritical area regulations.Alternative 2 would furthermeet the intent of GMA goalsfor open space andenvironmental protection.Similar to Alternative 2.Countywide PopulationForecastsAlternative 1 is consistentwith CPP allocations.Alternative 2 assumes greaterpopulation allocations thanfound in the CPPs.Alternative 3 assumesgreater populationallocations than found inthe CPPs.Countywide Planning PoliciesVision 2040Alternative 1 would beconsistent by focusingAlternative 2 would beconsistent by focusing growthSame as Alternative 2.In terms of reducing<strong>Draft</strong> | June 2013 1-21
GORST PLANNED ACTION EIS | SUMMARYTopic Alternative 1 Alternative 2 Alternative 3Transportation 2040growth in UGAs andoffering employment andhousing opportunities.in UGAs and offeringemployment and housingopportunities.Alternative 2 would promotejoint City-County planning foran assigned UGA consistentwith CPPs. All facilities andservices are addressed in thisEIS are consistent with CPPguidance for joint planning andservice transition.Alternatives 2 and 3 use ascience-based and landscapelevel approach to identifyingareas of protection, restoration,and development with BMPs toprotect water processes andhabitat.congestion, the mixed usepattern and lowercommercial growth inAlternative 3 provides lesscongestion and may in thefuture provide moresupport to transit use.Kitsap County and BremertonComprehensive PlansThe watershed would beprotected through standardnatural environmentpolicies of the County andCity of BremertonComprehensive Plans.Alternative 1 (No <strong>Action</strong>)would continue currentplans and regulations whichare consistent with eachother – the City ofBremerton shows KitsapCounty land usedesignations in its assignedUGAs and has predesignatedzones that mostclosely match County zones.This alternative meets Countyland use policies that assign the<strong>Gorst</strong> UGA to Bremerton andthat promote joint planningwith UGAMAs.This alternative promotes <strong>Gorst</strong>as the southern gateway to theCity of Bremerton, a concept inthe City of Bremerton’sComprehensive Plan.This alternative meets City ofBremerton policies that supportsubarea planning for differenttypes of centers in thecommunitySame as Alternative 2.Shoreline Master Program andCritical AreasBoth the County and Cityhave locally adopted newShoreline Master Programsthat require Ecologyapproval prior to their beingeffective. These pendingShoreline Master Programsprimarily differ with respectto shoreline buffers on<strong>Gorst</strong> Creek.The adoption of the <strong>Gorst</strong>Subarea Plan is an opportunityto develop joint standards forstream and shorelineprotection.Appendix D Shoreline BufferComparison & Options providesoptions for common shorelinesstandards along <strong>Gorst</strong> Creek toachieve some of the WatershedCharacterization Study BMPs.These options could beconsidered as the final SubareaPlan is developed around apreferred alternative.Same as Alternative 2.Summary of Mitigation MeasuresThis section summarizes three types of mitigation measures for each environmental topic:<strong>Draft</strong> | June 2013 1-22
GORST PLANNED ACTION EIS | SUMMARY• Existing plan policies or concepts under Alternative 1 or features of the proposed Watershed Characterization& Framework Plan, <strong>Gorst</strong> Subarea Plan under Alternatives 2 and 3 – that serve as mitigation.• Applicable regulations and commitments at the federal, state, and local level that would mitigate impacts.• Other potential mitigation that could modify current or proposed plans or regulations.For the full text, consult Chapter 3.0, Affected Environment, Significant <strong>Impact</strong>s, and Mitigation Measures.Geology/SoilsIncorporated Plan FeaturesNew plans that would be implemented under Alternatives 2 and 3 include features that would serve as mitigationfor potential impacts to soils and geologic resources. Implementing regulations associated with the <strong>Gorst</strong> SubareaPlan, and <strong>Gorst</strong> Creek Watershed Characterization & Framework Plan would incorporate the suggestedmanagement measures shown in Table 2-8 Integrated Watershed Processes and Habitat Results and ManagementMeasures.Possible plan features that would serve as mitigation for potential impacts to soil include the following:• Minimization of new development in certain areas.• Limiting logging activities and maintain appropriate zoning in areas with high sediment export.• Implementation of measures to reduce erosion and sediment export in areas identified for futuredevelopment (e.g., buffers, setbacks from steep slopes, reduction of overland flow through infiltration).• Restoration of cleared/degraded areas.• Implementation of stormwater retrofits to reduce impervious surface.Additionally, capital facility improvements have been recommended for addressing stormwater deficiencies andflooding issues. Implementation of these improvements would help reduce soil erosion and loss of soil from thewatershed. Based on policies in the proposed <strong>Draft</strong> <strong>Gorst</strong> Subarea Plan and <strong>Draft</strong> <strong>Gorst</strong> Creek WatershedCharacterization & Framework Plan implementing regulations could include a zero stormwater dischargerequirement limiting direct and untreated stormwater and a requirement that future development incorporate aseries of LID measures to infiltrate or detain runoff.Applicable Regulations and Commitments• Kitsap County CAO• City of Bremerton CAO• KCC Chapter 12, Stormwater Drainage, and Kitsap County Stormwater Design Manual.• BMC Chapter 15, Stormwater Management Manual for Western Washington (SWMMWW) and LID GuidanceManual.Other Potential Mitigation MeasuresNo additional mitigation measures are proposed for soil and geologic resources.Water ResourcesIncorporated Plan FeaturesFeatures of the Watershed Characterization & Framework Plan and <strong>Gorst</strong> Subarea Plan that serve as mitigation forpotential impacts on water resources include the following concepts found in Guiding Principles and Goals andPolicies:<strong>Draft</strong> | June 2013 1-23
GORST PLANNED ACTION EIS | SUMMARY• Identify and protect critical areas such as floodplains along <strong>Gorst</strong> Creek.• Prioritize areas for restoration that would improve water quality.• Protect and enhance water quality/quantity.• Promote shoreline reclamation.Additionally, capital facility improvements have been recommended to address runoff from impervious surfacesand flood-prone areas.Applicable Regulations and CommitmentsSurface water quality standards are implemented through the Clean Water Act Section 401 certifications, waterquality modifications, and compliance with the standards in Chapter 90.48 RCW and WAC 173-201A. Applicationsfor water quality related permits include the Joint Aquatic Resources Permit Application (JARPA) process, and theNPDES permits. In addition there are shoreline and critical area regulations applied by the City and County.Other Potential Mitigation MeasuresOther potential mitigation measures could include the following:• During construction, future projects will need to comply with all construction-related stormwaterrequirements, including temporary erosion and sediment control, and development and implementation of astormwater pollution and spill prevention plan.• The project-specific design will determine the necessary permanent, long-term water quality treatmentrequirements, necessary for all vehicle-accessible areas and redevelopments. Large areas of landscaping orlawn, unless strict policies on pesticide and fertilizer use are adopted, will also be subject to water qualitytreatment requirements.• No specific water quality treatment method is proposed at this point, but it is likely that treatment wouldconsist of various LID systems to the extent feasible. Additional erosion protection improvements may beneeded at project outfalls because of increased peak runoff rates caused by an increase in impervious surface.• If <strong>Gorst</strong> Subarea Plan policies and BMPs are implemented with corresponding development regulations therewould be incentives for the removal of existing impervious areas and smaller new impervious footprints.Implementation of these types of incentives and standards could result in beneficial effects on waterresources.The concept of allowing commercial or mixed uses on smaller impervious footprints could be extended to the<strong>Gorst</strong> Creek corridor and floodplain similar to Low Intensity Waterfront designation, recognizing the convergenceof critical areas and difficulties of development in the floodplain. This would replace portions of CommercialCorridor in Alternative 2 and <strong>Gorst</strong> Mixed Use in Alternative 3.Air QualityIncorporated Plan FeatureThe <strong>Gorst</strong> Subarea Plan includes policies promoting compact development as well as a policy on adapting to sealevel rise. It also includes policies promoting incentives for increased heights and densities, increased landscaping,and energy reduction that could encourage GHG reduction. In addition Kitsap County and City of BremertonComprehensive Plans include additional land use and transportation goals that would encourage GHG reduction.Applicable Regulations and Commitments• National Ambient Air Quality Standards• State Ambient Air Quality Standards<strong>Draft</strong> | June 2013 1-24
GORST PLANNED ACTION EIS | SUMMARY• Puget Sound Clean Air Agency State Outdoor Burning Regulations per Washington Clean Air Act at Chapter70.94.743 RCW• Puget Sound Clean Air Agency Regulations related to construction and operation including industrial andcommercial air pollutant sources• State of Washington GHG Reduction Limits• City of Bremerton SKIA Subarea Plan: A subarea plan for SKIA was adopted in 2012. A portion of the <strong>Gorst</strong>Watershed is located within the SKIA subarea. The SKIA subarea plan contains development incentives andrequirements to ensure sustainable development and reduce GHG emissions.• Kitsap County Energy Efficiency and Conservation Plan: In 2011, the Kitsap County developed an EnergyEfficiency and Conservation Plan, which is focused on achieving greater energy efficiency and reducing GHGemissions. The plan outlines a list of recommendations that once implemented would serve to increase energyefficiency and reduce GHGs.Other Potential Mitigation MeasuresConstruction Emission ControlKitsap County and the City of Bremerton should require all construction contractors to implement air qualitycontrol plans for construction activities in the <strong>Gorst</strong> study area. See Section 3.3 Air Quality for more information.GHG Reduction MeasuresWashington State has established GHG reductions with 2020 (1990 levels), 2035 (20 percent reduction below1990) and 2050 (50 percent reduction below 1990) limits and adopted requirements for capital investments, anenergy strategy, and VMT reduction targets. However, neither Ecology nor EPA has adopted numerical GHGemissions standards, GHG reduction requirements, or numerical GHG significance thresholds that direct localgovernment land use development actions. It is the City of Bremerton’s and Kitsap County’s responsibility toimplement its GHG reduction requirements for new developments.Table 3.3-8 Potential GHG Reduction Mitigation Measures in Section 3.3 Air Quality lists a variety of mitigationmeasures that could reduce GHG emissions caused by transportation facilities, building construction, spaceheating, and electricity usage (Ecology 2008). The table lists potential GHG reduction measures and indicateswhere the emission reductions might occur. Kitsap County and the City of Bremerton could require developmentapplicants to consider the reduction measures shown in Table 3.3-8 Potential GHG Reduction Mitigation Measuresfor their projects. Kitsap County and the City of Bremerton can incorporate potential GHG reduction measuresthrough its goals, policies, or regulations, including the proposed <strong>Planned</strong> <strong>Action</strong> Ordinance.In addition, additional vehicle trip reduction measures and land-use-related GHG reduction measures have beenpublished by various air quality agencies. For example, Table 3.3-9 SMAQMD 2 Recommended Measures for LandUse Emission Reductions lists the emission reduction measures developed by SMAQMD, 2010. The table listsSMAQMD’s estimated “mitigation points” value, where each point value corresponds to the percent reduction inemissions. For example, a mitigation point value of 1.0 corresponds to a one percent reduction in land-use-relatedemissions. SMAQMD developed this table to quantify reductions in criteria pollutant emissions, but the listedmeasures would also generally reduce GHG emissions. This table could also be used as a source of potential GHGreduction measures that could be implemented in goals, policies, or regulations, including the proposed <strong>Planned</strong><strong>Action</strong> Ordinance.2 Sacramento Metropolitan Air Quality Management District<strong>Draft</strong> | June 2013 1-25
GORST PLANNED ACTION EIS | SUMMARYPlants and AnimalsIncorporated Plan FeaturesNew plans that would be implemented under Alternatives 2 and 3 include features that would serve as mitigationfor impacts to plants and animals within the study area. Regulation amendments would incorporate the suggestedmanagement measures shown in Table 2-8 Integrated Watershed Processes and Habitat Results and ManagementMeasures.Possible plan features that would serve as mitigation for potential impacts to plants and animals include thepolicies and BMPs that address:• Minimizing new development and maintaining forest cover in areas that have high wildlife habitat value.• Maintaining appropriate zoning to protect areas with high wildlife habitat value.• Restoring areas with high habitat value or a high potential to provide salmon refugia.• Implementing measures to reduce erosion and sediment export in areas identified for future development(e.g., buffers, setbacks from steep slopes, reduction of overland flow through infiltration).Capital facility improvements may include removal or repair of culverts and other fish passage blockages thatrestrict the movement of fish upstream. Other improvements would address stormwater deficiencies and floodingissues, which would help reduce associated water quality impacts and improve aquatic habitats.Applicable Regulations and Commitments• City of Bremerton Comprehensive Plan – Environment Chapter• Kitsap County Comprehensive Plan – Natural Systems Chapter• Kitsap County CAO• City of Bremerton CAO• Kitsap County Shoreline Master Program• City of Bremerton Shoreline Master Program• Federal regulations that pertain to the protection of plants and animals and their habitat include theEndangered Species Act, CWA, Migratory Bird Treaty Act, and the Marine Mammal Protection Act.Other Potential Mitigation Measures• Consider wildlife corridors and connectivity when designing and permitting new developments within the<strong>Gorst</strong> Creek Watershed.• Implement clearing of vegetation and construction activities outside the breeding period for sensitive birdspecies and migratory birds, as feasible.• Consider applying common shoreline standards, such as one of the shoreline buffer options in this <strong>Draft</strong> EISAppendix D Shoreline Buffer Comparison & Options or another similar option to provide for compatibility ofshoreline buffer standards, particularly for <strong>Gorst</strong> Creek.NoiseIncorporated Plan FeaturesUnder Alternative 3, the proposed balance of residential and commercial uses would reduce future trafficcongestion on state routes compared to Alternatives 1 and 2 which have about the same level of congestion.Please see Section 3.11 Transportation.<strong>Draft</strong> | June 2013 1-26
GORST PLANNED ACTION EIS | SUMMARYApplicable Regulations and Commitments• BMC Chapter 6.32 (Noise Levels) establishes limits on noise levels and durations of noise crossing propertyboundaries with the City of Bremerton.• KCC Chapter 10.28 (Noise) establishes limits on noise levels and durations of noise crossing propertyboundaries within the unincorporated areas of Kitsap County.• The FHWA has adopted criteria for evaluating noise impacts associated with federally funded highwayprojects, and for determining whether such impacts are sufficient to justify funding of noise abatement. Thesecriteria are specified in the Code of Federal Regulations (23 CFR 772), Procedures for Abatement of HighwayTraffic Noise and Construction Noise. WSDOT has adopted the FHWA Noise Abatement Criteria for evaluatingnoise impacts and determining whether such impacts are sufficient to justify funding of noise abatement forroadway improvement projects with state funding. Any roadway improvements that would occur within thestudy area that would use state or federal funding would be subject to State and/or FHWA policies andprocedures for evaluating traffic noise impacts and noise abatement. In cases where no state or federalfunding is involved, the WSDOT and FHWA protocols are not applicable.Other Potential Mitigation MeasuresSection 3.5 Noise provides potential mitigation measures regarding site planning, noise barriers, and buildingconstruction that are summarized below:• Proper site planning to reduce noise impacts should be considered for all noise sensitive developments.• Noise barriers such as walls and earthen berms are commonly used to mitigate noise from groundtransportation, commercial and industrial sources. Noise barriers can be used to reduce the noise level bothoutdoors and indoors.• The location of a building on its site, the arrangement of rooms, and the location of doors and windows allhave a bearing on interior noise control.The following mitigation measures are general and programmatic in nature, and may be further refined in projectspecificSEPA documents applicable in the watershed or applied in the <strong>Planned</strong> <strong>Action</strong> Ordinance in the UGA.• Revise the Noise Ordinance and condition development proposals to achieve the following:ooooooooProvide hourly and maximum property line noise level limits for all major zoning districts defined in theZoning OrdinanceLimit the hours of deliveries to commercial, mixed use, and industrial uses adjacent to residential andother noise sensitive land usesLimit the hours of operation for commercial and retail to limit noise intrusion into nearby residential andother noise sensitive land usesLimit noise levels generated by commercial and industrial usesLimit outdoor industrial activities or operations to control excessive noise at adjacent residentialpropertiesLimit the hours of operation of high noise-generating industrial equipmentLimit the hours of operation for refuse vehicles and parking lot sweepers if their activity results in anexcessive noise level that adversely affects adjacent residential usesRequire the placement of loading and unloading areas so that commercial buildings shield nearbyresidential land uses from noise generated by loading dock and delivery activities. If necessary, additionalsound barriers shall be constructed on the commercial sites to protect nearby noise sensitive uses<strong>Draft</strong> | June 2013 1-27
GORST PLANNED ACTION EIS | SUMMARYooRequire the placement of all commercial HVAC machinery to be placed within mechanical equipmentrooms wherever possible. (Equipment manufacturer’s specifications for venting and access to outside airshall be maintained.)Require the provision of localized noise barriers or rooftop parapets around HVAC, cooling towers, andmechanical equipment so that line-of-sight to the noise source from the property line of the noisesensitive receptors is blocked. (Equipment manufacturer’s specifications for venting and access to outsideair shall be maintained.)In project-specific SEPA documents applicable in the watershed or through the <strong>Planned</strong> <strong>Action</strong> Ordinance in theUGA, the Kitsap County and City of Bremerton should require construction contractors to implement the followingmeasures during construction activities through contract provisions and/or conditions of approval as appropriate:• Construction equipment shall be properly maintained per manufacturers’ specifications and fitted with thebest available noise suppression devices (e.g., mufflers, silencers, wraps).• Construction operations and related activities associated with the project shall comply with the operationalhours outlined in the Kitsap County or City of Bremerton Noise Ordinance.• Construction equipment shall not be idled for extended periods of time in the vicinity of noise sensitivereceptors.• Locate fixed and/or stationary construction equipment as far as possible from noise sensitive receptors (e.g.,generators, compressors, rock crushers, cement mixers).• Shroud or shield all impact tools, and muffle or shield all intake and exhaust ports on powered constructionequipment.Where feasible, temporary barriers shall be placed as close to the noise source or as close to the receptor aspossible and break the line of sight between the source and receptor where modeled levels exceed applicablestandards. See Section 3.5 Noise for additional detail.Hazardous MaterialsIncorporated Plan FeaturesThe Watershed Characterization & Framework Plan and <strong>Gorst</strong> Subarea Plan do not contain features that arespecific to hazardous materials. However, features of both plans would have the indirect benefit of reducing risksof exposure to hazardous materials over the long term. Regardless of the land use alternative selected, the <strong>Gorst</strong>UGA would no longer have the urban industrial designation, meaning that new developments would have a lowerpotential for releases of hazardous materials than some current land uses.Features of the Watershed Characterization & Framework Plan and <strong>Gorst</strong> Subarea Plan that would minimizeflooding and increase infiltration of stormwater would help reduce risks of surface water contamination byreducing the likelihood that flood water or stormwater would run onto contaminated sites such as the BremertonAuto Wrecking Landfill. These stormwater features are discussed in detail in Section 3.2 Water Resources.Applicable Regulations and CommitmentsFederal hazardous material and waste laws and regulations would be applicable to hazardous substances used,stored, or generated by the project. Applicable federal laws include the RCRA; Hazardous and Solid WasteAmendments; CERCLA (aka Superfund); and Superfund Amendments and Reauthorization Act. Pursuant toregulations promulgated under Section 102 of CERCLA, as amended, release of a reportable quantity of ahazardous substance to the environment in a 24-hour period must be reported to the National Response Center(40 CFR Part 302). Similarly, Washington hazardous material and waste laws and regulations would be applicableto hazardous substances used, stored, and generated by the project. The Model Toxics Control Act (mobile<strong>Draft</strong> | June 2013 1-28
GORST PLANNED ACTION EIS | SUMMARYsource air toxics) requires reporting of a release of any hazardous substance within 90 days of the release (orwithin 24 hours for releases from a UST; WAC 173-340-300). Cleanup activities at contaminated sites areconducted under the MTCA and disposal of contaminated materials are conducted under the RCRA.Demolition of older facilities may require asbestos and lead-based paint mitigation. Under the WashingtonDepartment of Safety and Health asbestos standards (WAC 296-62, 296-65, and 296-155), thermal systeminsulation (pipe lagging, boiler insulation, etc.), surfacing materials (spray-on acoustical plasters, troweled onplaster coatings, etc.) and flooring materials (vinyl tile, sheet goods, etc.) are all presumed to contain asbestos inbuildings built before 1981 unless these materials are shown not to contain asbestos by a certified contractor.Demolition of asbestos in the project area is regulated by the Puget Sound Clean Air Agency (Article 4: AsbestosControl Standards) and requires an asbestos survey, a notification of demolition, verification that all asbestos wasproperly removed, and proper disposal of the asbestos-containing materials.The Washington State Department of Commerce (WAC 365-230), regulates certification, accreditation,enforcement and compliance for firms and individuals to use lead-safe work practices when working on pre-1978homes or child-occupied facilities. The regulations apply to training and certification requirements for individualsand firms and to accreditation requirements for training programs.Other Potential Mitigation MeasuresThe following general mitigation measures would minimize or eliminate construction impacts within the StudyArea and could be incorporated into the <strong>Planned</strong> <strong>Action</strong> Ordinance:• Since encountering unreported spills or unreported underground fuel tanks is a risk when performingconstruction, require contractors to provide hazardous materials awareness training to all grading andexcavation crews on how to identify any suspected contaminated soil or groundwater, and how to alertsupervisors in the event of suspected contaminated material. Signs of potential contaminated soil includestained soil, odors, oily sheen, or the presence of debris.• Require contractors to implement a contingency plan to identify, segregate, and dispose of hazardous waste infull accordance with the MTCA.• Require contractors to develop and implement the Stormwater Pollution Prevention Plan, BMPs, and otherpermit conditions to minimize the potential for a release of hazardous materials to soil, groundwater, orsurface water during construction.• Require contractors to follow careful construction practices to protect against hazardous materials spills fromroutine equipment operation during construction; prepare and maintain a current spill prevention, control,and countermeasure plan, and have an individual on site designated as an emergency coordinator; andunderstand and use proper hazardous materials storage and handling procedures and emergency procedures,including proper spill notification and response requirements.• Require contractors to identify all ACM and lead-based paint in structures prior to demolition activities inaccordance with 24 CFR Part 35. If ACM or lead-based paint is identified, appropriately trained and licensedpersonnel would contain, remove, and properly dispose of the ACM and/or lead based paint materialaccording to federal and state regulations prior to demolition of the affected area.• If warranted, require contractors to conduct additional studies to locate undocumented USTs and fuel linesbefore construction of specific development projects (areas of concern include current and former commercialand residential structures) and will permanently decommission and properly remove USTs from project sitesbefore commencing general construction activities.The following general mitigation measure would minimize or eliminate operational impacts within the Study Areaand could be incorporated into the <strong>Planned</strong> <strong>Action</strong> Ordinance:<strong>Draft</strong> | June 2013 1-29
GORST PLANNED ACTION EIS | SUMMARY• Require applicants for development on properties identified as having potential for contamination to conducta thorough site assessment. If contamination is discovered then require the applicant to comply with all stateand federal regulations for contaminated sites.Land Use PatternsIncorporated Plan FeaturesAdoption of the Watershed Characterization & Framework Plan and the <strong>Gorst</strong> Subarea Plan are part of both actionalternatives. Adoption of these two plans would include the following:• Alternatives 2 and 3 would include implementation of new capital facility and urban design improvements,such as streetscape improvements and trails.• Alternatives 2 and 3 would include adoption of new policies promoting amended stormwater and habitatregulations throughout the <strong>Gorst</strong> Creek watershed.• Alternatives 2 and 3 would include policies and urban design concepts that would improve the landscape,streetscape, and site design of developments.• As described above, the land use designations proposed for Alternative 3 would guide development toward apredominantly horizontal or vertical mixed-use pattern. Associated development regulations and designguidelines in the subarea plan would ensure that incompatibilities between more intense uses and less intenseuses are minimized.Applicable Regulations and CommitmentsIn addition to the new stormwater regulations that would be applied to the <strong>Gorst</strong> Creek watershed and the designguidelines and development regulations that would be applied to the <strong>Gorst</strong> UGA, the following regulations andcommitments would help mitigate impacts regarding land use compatibility throughout the watershed study area.• KCC 17.382 – Density, Dimensions, and Design• KCC 17.385 – Landscaping• KCC Title 19 – CAOOther Potential Mitigation MeasuresAdoption of implementing zoning and urban design regulations to fulfill <strong>Draft</strong> <strong>Gorst</strong> Subarea Plan policies wouldhelp mitigate changes to land use patterns and compatibility. It is anticipated that such regulations would beprepared with a Preferred Alternative.Socio-EconomicsIncorporated Plan FeaturesUnder Alternative 2 and Alternative 3, the Watershed Characterization & Framework Plan and the <strong>Gorst</strong> SubareaPlan would be adopted. The adoption of these plans includes specific features that help mitigate for the impact ofadditional people and economic activity within the watershed. Features of the plans include:• Implementation of new capital facility improvements and urban design improvements.• Adoption of amended stormwater and habitat regulations throughout the <strong>Gorst</strong> Creek watershed.• The creation of new land use designations, development regulations and design guidelines in Alternative 3 tominimized impacts of development, especially in environmentally sensitive areas.<strong>Draft</strong> | June 2013 1-30
GORST PLANNED ACTION EIS | SUMMARYApplicable Regulations and CommitmentsIn addition to the incorporated plan features, the following regulations and commitments would help mitigateimpacts of additional people, activity, and development within the watershed and UGA. Below are listed keysections of Kitsap County’s code and Comprehensive Plan.• KCC 17.382 – Density, Dimensions, and Design• KCC 17.385 – Landscaping• KCC Title 19 – CAO• Kitsap County Capital Facility Plan, an appendix to the Comprehensive PlanCorollary chapters of the BMC and Comprehensive Plan include:• BMC Title 20, Division III. Zoning, with development standards in each zone as well as general and specificstandards for particular uses• Chapter 20.50, Landscaping• BMC Chapter 20.14, Critical Areas• Bremerton City Services Element of Comprehensive PlanOther Potential Mitigation MeasuresNone.AestheticsIncorporated Plan FeaturesWatershedThe <strong>Gorst</strong> Creek Watershed Framework & Characterization Plan identifies areas for protection, restoration, anddevelopment. The effects of these actions on aesthetics relate to the maintenance of a more natural or rural visualcharacter, the maintenance of vegetation cover, and the minimization of impervious areas.Areas of protection are to be managed for the maintenance of forest cover, limited clearing, and minimalimpervious surfaces. Areas identified for protection include the CUL and other forested areas in the north centralportion of the watershed.Areas of restoration would promote the re-establishment of habitat, including forest cover, riparian areas, andwetlands. Areas of restoration include the Gold Mountain Golf Club in the western portion of the watershed, andrural residential areas along Sunnyslope Road and to the west of the <strong>Gorst</strong> UGA. Existing development wouldremain in these areas, but new regulations would gradually increase native habitat.Areas of development are considered to be suitable for growth, but would implement measures to control erosionand promote infiltration. Clustered development and LID would be encouraged for new development in theseareas. Clustered development allows for the permitted density of a proposed development to be located on asmaller portion of a site, while requiring that the remainder portion be kept in a natural state.LID is a method of land development that seeks to mimic pre-development hydrology through the use ofclustering, retaining native vegetation, and minimizing impervious surfaces, among other measures.Identified areas of development include the SKIA area and adjacent areas, and the currently developed areas ofthe <strong>Gorst</strong> UGA and the McCormick Woods area of the City of Port Orchard. SKIA would be subject to its recentlyadopted design guidelines. McCormick Woods is a master planned development subject to a developmentagreement. The <strong>Gorst</strong> UGA would have its own design guidelines in the Subarea Plan as further described below.<strong>Draft</strong> | June 2013 1-31
GORST PLANNED ACTION EIS | SUMMARY<strong>Gorst</strong> UGAThe <strong>Gorst</strong> Subarea Plan projects growth for the UGA that differ for each alternative. These growth projectionswould affect aesthetics within the UGA as a result of differences in the extent of development expected within theUGA, the mix of development types expected (e.g., residential versus commercial), and the density ofdevelopment expected (e.g., medium density residential versus low density residential). The primary means ofimplementation would be zoning and development regulations that determine allowed and prohibited uses andestablish minimum and maximum densities.Applicable Regulations and CommitmentsCurrent regulations and policies that may affect the aesthetic characteristics of the watershed and UGA includeKitsap County and City of Bremerton comprehensive plans, shoreline master programs, critical area regulations,and zoning and development regulations, including those addressing landscaping, lighting, signage, and projectreview procedures. Following is a list of some of the applicable regulations and policies.Kitsap County• 2012 Comprehensive Plan• KCC Title 16 Land Division and Development• KCC Title 17 Zoning• KCC Title 19 CAO• KCC Title 21 Land Use Development and Procedures• Shoreline Master Program (2013 updated draft adopted by Kitsap County, currently in review by Ecology) –also codified as KCC Title 22City of Bremerton• 2004 Comprehensive Plan• BMC Title 20 Land Use Shoreline Master Program (update adopted by City of Bremerton, currently in reviewby Ecology) – part of BMC Title 20 Land Use, Chapter 16Other Potential Mitigation MeasuresOnce a Preferred Alternative is selected development and design regulations would be prepared and areanticipated to address:• Allowed and prohibited uses/development types• Minimum and maximum density• Building height• Building setbacks• Maximum lot coverage• Maximum impervious area• Critical area buffersIn addition other City or County regulations such as those governing signage, lighting, and landscaping wouldapply.Future design guidelines developed with the Preferred Alternative would likely establish discretionary review offuture development proposals focusing on the design of the public realm and those portions of private<strong>Draft</strong> | June 2013 1-32
GORST PLANNED ACTION EIS | SUMMARYdevelopment sites that directly affect the public realm. The design guidelines are intended to promote walkability,complete streets, identifiable character, the efficient and coordinated use of land and infrastructure, and LID.Accordingly, the design guidelines may address:• Streetscape guidelines• Site planning guidelinesThe streetscape guidelines apply to the design of public rights-of-way. Streetscape guidelines would address:• Design of the roadway, including width of travel, bicycle, and parking lanes• Design of the curb zone, which includes street trees and other amenities and infrastructure• The sidewalk• The transitional zone, which is the area between the sidewalk and edge of right-of-way• Building frontage elements such as the provision of weather protection where buildings abut the right-of-wayThe streetscape guidelines could vary based on type of roadway.The site planning guidelines associated with the Preferred Alternative would likely address the design of individualbuilding sites with regard to several aspects, including:• Building orientation, including the location of entrances• Building façade, including street-facing windows, building articulation, and blank wall limitations• Parking and vehicular access, including location of parking, curb cuts, shared parking, and pedestrianaccessibilityCultural ResourcesIncorporated Plan FeaturesThe <strong>Draft</strong> Watershed Characterization & Framework Plan proposes the following Guiding Principle and Policy:• Promote interpretive art, signage, and public spaces that recognize cultural history and environmentalfeatures• Celebrate cultural history in the watershed through interpretive displays and events. Protect sensitive culturalresources from disturbance.Applicable Regulations and CommitmentsFederal and state laws would apply as listed in Section 3.10 Cultural Resources, “Regulatory Context” section.Kitsap County and the City of Bremerton have adopted historic preservation regulations to promote a special taxvaluation to promote historic site rehabilitation and preservation and protect important archaeological andhistoric sites. Additional County and City regulations include:<strong>Draft</strong> | June 2013 1-33
GORST PLANNED ACTION EIS | SUMMARY• Kitsap County recently approved (January 2013) a shoreline master program undergoing Ecology review. Itincludes several measures designed to protect cultural resources including that “all Tribal Historic PreservationOfficers (THPOs) for tribes with jurisdiction will be provided the opportunity to review and comment on alldevelopment proposals in the Kitsap County shoreline jurisdiction, both terrestrial and aquatic, in order toensure all known or potential archaeological sites, TCP and Traditional Cultural Landscapes are acknowledged,properly surveyed and adequately protected.” In addition, “sites with known or potential archaeologicalresources, as determined pursuant to the resources listed at the beginning of this section, shall require a siteinspection by a professional archaeologist” and “work on sites with identified archaeological resources shallnot re-commence until authorized by the Department of Archaeology and Historic Preservation through anArchaeological Excavation and Removal Permit, which may condition development permits.”• KCC 18.12.020, Eligible lands. The Open Space Act (Chapter 84.34 RCW) describes lands which may beconsidered for current use assessment as open space. Kitsap County has refined this definition to a prioritizedlist of lands which may be eligible for enrollment in the open space taxation program within theunincorporated area of Kitsap County. Kitsap County provides for the preservation of any land area, thepreservation of which in its present use would preserve historic sites.• Bremerton has recently adopted a Shoreline Master Program that would when approved by Ecology includeseveral protective measures including “a site assessment by a qualified professional archaeologist or historicpreservation professional and ensure review by qualified parties including the Washington State Departmentof Archaeology and Historic Preservation, and the Suquamish Tribe Archaeology and Historic PreservationProgram” for properties with known cultural resources and “stop work” orders on any newly discoveredcultural features with a requirement for notification of the State and tribes and an assessment.Other Potential Mitigation MeasuresA cultural resources study should be conducted at the applicant’s expense for specific projects within HighProbability Areas (Table 3.10-6 Cultural Resources Mitigation Measures) to determine if archaeological sites, TCPs,or historic built environment resources are present that may be significant. This should include but is not limited tobackground research, consultation with appropriate Tribes and interested parties, field study, and reporting. Adesktop review of existing background information regarding cultural resources should be conducted at aminimum for projects within Moderate Probability Areas to determine if resources older than 50 years are presentrequiring evaluation and/or additional field studies. Table 3.10-6 Cultural Resources Mitigation Measures identifiesthe potential mitigation measures for significant cultural resources and when they should be completed.TransportationIncorporated Plan FeaturesAll alternatives would implement City of Bremerton and County Comprehensive Plan Transportation Elementsincluding adopted policies regarding levels of service, concurrency, TDM, etc.The <strong>Gorst</strong> Creek Watershed Characterization & Framework Plan and <strong>Gorst</strong> Subarea Plan include the followingpolicies that would address transportation impacts:• Manage land use and growth to avoid increases in traffic congestion, and create opportunities forimprovements to existing congestion.• Improve safety and circulation, and improve transportation mode choices including transit, bicycle,pedestrian, and automobiles.• Encourage improved Kitsap Transit service such as added park and ride facilities.• Design roads to incorporate gateway treatments, boulevard style streetscape improvements, and accessimprovements to invite the community to <strong>Gorst</strong> and allow convenient travel to regional businesses.<strong>Draft</strong> | June 2013 1-34
GORST PLANNED ACTION EIS | SUMMARYIn addition, applicable to Alternatives 2 and 3, the <strong>Gorst</strong> Subarea Plan also identifies areas where connectivityimprovements for non-motorized travel should be considered.Applicable Regulations and CommitmentsCurrent adopted County or City of Bremerton regulations or programs as described in the Affected Environment ofSection 3.11 Transportation.Other Potential Mitigation MeasuresBelfair Road is projected to operationally deficient prior to 2035. This roadway was identified in the Kitsap CountyUGA Remand SEIS as needing widening from 2 to 4 lanes. All of the other County roadways within the <strong>Gorst</strong> SubArea have capacity to support the additional traffic associated with all three alternatives.Due to the lack of capacity on SR 3 and SR 16 within the center of <strong>Gorst</strong> as well as a variety of merging anddiverging movements, any new developments or redevelopments should be designed to direct traffic either north(Sherman Heights) or west (Sam Christopherson Avenue or Belfair Valley Road) of the SR 3/ SR 16 junction.While access to the north via Sherman Heights Road does not provide the most direct route to Werner Avenue andSR 3, this corridor (including Sherman Heights Road, Kent Avenue, 3 rd Avenue and Union Avenue) should beevaluated for spot intersection improvements to make this route and attractive route for traffic originating in the<strong>Gorst</strong> UGA to head north to avoid having to access SR 3 in central <strong>Gorst</strong>.While Werner road is north of the <strong>Gorst</strong> UGA, this roadway is considered an important route for <strong>Gorst</strong> UGA trafficto access SR 3. The Werner Road corridor between Union Avenue and SR 3 should be evaluated as part of trafficimpact analysis reports prepared for new development in order to optimize the traffic flow on this corridor.To address increased pedestrian demand between the proposed residential areas and the waterfront commercialand recreation land uses associated with Alternatives 2 and 3, consideration should be made to construct gradeseparated pedestrian overpasses that would connect the both the residential and walkable commercial areas thatare on both sides of SR 3 and SR 16. The exact location(s) of these overpasses need to be determined inconjunction with any proposed highway improvements in this area.Fire Protection and EMSIncorporated Plan Features• The County CFP determines LOS standards for fire protection/EMS. Future needs and costs can be determinedbased on these standards. Under the CFP, the County fire and rescue districts would continue to improve fireprotection efficiency by focusing on eliminating overlapping responsibilities and system inefficiencies, as wellas coordinating service provision with population growth.• From the County perspective, the No <strong>Action</strong> Alternative levels of growth are already accounted for in existingplanning documents due to the adoption of the 2012 Final Kitsap County Comprehensive Plan and CFP.• Alternatives 2 and 3 focus growth and concentrate densities, allowing for improved efficiency of service, suchas potentially lower response times.Applicable Regulations and Commitments• New development would be required to meet City of Bremerton and County codes, as well as InternationalFire Code and International Building Code regulations, regarding the provision of fire hydrants, fire flow, alarmsystems, sprinklers, and emergency vehicle access.Other Potential Mitigation Measures• If the City of Bremerton experiences unexpected demand needs due to annexation of <strong>Gorst</strong>, the City ofBremerton could work with SKFR to develop a Mutual Aid Agreement to serve the <strong>Gorst</strong> UGA area. Thisagreement could include information on sharing levy revenues generated within the <strong>Gorst</strong> UGA boundaries.<strong>Draft</strong> | June 2013 1-35
GORST PLANNED ACTION EIS | SUMMARYLaw EnforcementIncorporated Plan Features• Alternatives 2 and 3 focus growth and concentrate densities, allowing for improved efficiency of service.Creating a more compact development pattern allows for smaller patrol areas and faster response times.• If urban areas are annexed into adjoining cities or incorporated into new cities, patrol-related functions maybe assumed by the cities, while joint use of some facilities (e.g., jails) could be retained at the County level.Applicable Regulations and Commitments• Police departments and the Sheriff’s Office are maintained primarily through the general fund, which isfunded through sales and property tax revenues. The increased tax base associated with increased populationand development would increase tax revenues and bonding potential, providing additional funding for lawenforcement services and facilities.Other Potential Mitigation Measures• In order to address future deficiencies, the Kitsap County Sheriff’s Office could choose to adjust their LOSstandards to reflect the likely service levels in 2035, given estimated population growth and planned facilities.• The City of Bremerton and County could pursue implementation of mutual aid agreements if increasing <strong>Gorst</strong>population impacts levels of service.SchoolsIncorporated Plan Features• The County’s regular review of the CFP in coordination with the school districts should allow for ongoing longrangeplanning for educational services.Applicable Regulations and Commitments• School districts are required to plan for growth over time by regularly updating their six-year capitalimprovement program.• Adopted school impact mitigation fees would be collected for new residential development within <strong>Gorst</strong> if itremains in unincorporated Kitsap County.Other Potential Mitigation Measures• To address enrollment changes on an ongoing basis, prior to reaching the level of demand that wouldnecessitate construction of a new facility; districts can use portable classrooms to temporarily meet growthdemands. Portables can be funded by impact fees paid by residential developers.• The County, cities, and school districts could work together to identify potential sites for new schooldevelopment in areas where higher amounts of growth are planned.Parks, Recreation, and Open SpaceIncorporated Plan Features• <strong>Gorst</strong> Alternatives 2 and 3 show County-purchased Open Space/Recreation land along Sinclair Inlet. Theproperty on the south shore could allow for some recreation activities consistent with environmentallimitations. Property on the north shore is inaccessible but provides open space and environmentalprotection.• Kitsap County. The County’s 2012 Parks, Recreation, and Open Space (PROS) Plan sets forth strategies, goals,and objectives for development and management of parks, open space, and recreational facilities for a 5-yearplanning period.<strong>Draft</strong> | June 2013 1-36
GORST PLANNED ACTION EIS | SUMMARYooAcquisition. The County plans to acquire new trails, shoreline, and open space as part of the Parks Plan.One of its highest priorities is a partnership to acquire 7,000 acres known as the Kitsap Forest and BayProject, which would effectively double the County’s current park ownership and allow the County tomeet all of its LOS standards in the next 20+ years with this increase in Open Space. This potentialacquisition is not included in this analysis because the details have not been finalized and therefore it isnot included in the Parks Capital Facilities Plan.Partnerships. In cases where the County has identified a need and has determined they will not be able toprovide adequate capacity to meet demand, they will work to partner with other agencies to meet thedemand. Partner agencies can assist with acquisition, funding upgrades, and providing technical expertise.• City of Bremerton. The City has also developed a PROS Plan that aims to refine and improve its LOS standardsgoing forward. Under this Plan, the City would create LOS standards that are geographically based in order tobetter measure how accessible parks are to residents. If the City adopts this Plan, it should review its LOSstandards in relation to the location of the <strong>Gorst</strong> UGA to ensure its residents are being adequately served.Applicable Regulations and Commitments• Kitsap County. <strong>Impact</strong> fees are applied to all new housing developments. Fees could be reassessed to reflectincreased costs of land for park acquisition, or increased impacts within areas of significant intensification suchas the Silverdale or Port Orchard UGAs.Other Potential Mitigation Measures• Kitsap County. The County could adopt updated Base LOS targets that will accommodate the eventualpreferred alternative’s growth in the <strong>Gorst</strong> UGA through 2035. This would involve changing the Base LOS foropen space, regional parks, community parks, and potentially heritage parks, depending on the adoptedalternative. The County would not need to adjust levels of service for shoreline access or trails.• City of Bremerton. The City could require that master planned developments within the <strong>Gorst</strong> UGA provideparks and/or open space as part of the development in order to serve the residents of that development andoffset the need for the City to acquire and develop additional facilities.LibrariesIncorporated Plan FeaturesNone.Applicable Regulations and Commitments• With additional development and population in the <strong>Gorst</strong> UGA, property tax revenues, which are the primarysource of funding for the Kitsap Regional Library, would increase over time. These additional revenues couldbe used to purchase additional circulation materials for the Downtown Bremerton and Port Orchard librariesto offset the additional demand generated by growth.Other Potential Mitigation Measures• The Kitsap Regional Library could partner with the Cities of Bremerton and Port Orchard to acquire additionalcirculation materials or expand their local branches to accommodate growth in <strong>Gorst</strong>.• The Kitsap Regional Library could increase the amount of circulation materials and services that are availableonline to reduce demand for physical library space and offset new growth in <strong>Gorst</strong>.<strong>Draft</strong> | June 2013 1-37
GORST PLANNED ACTION EIS | SUMMARYPowerIncorporated Plan Features• Mixed-use and clustered development is encouraged in select areas under Alternative 3, and bothAlternatives 2 and 3 would result in increased residential density over existing conditions. Providing power tohigher-density and cluster development is often more efficient than provision of power to low-densitydevelopment.Applicable Regulations and Commitments• All future development of energy resources and transmission facilities would be required to comply withfederal and state laws, the regulations of the Northwest Power Planning Council, and the Washington Utilitiesand Transportation Commission (WUTC).Other Potential Mitigation Measures• As development permits are issued for future development in the <strong>Gorst</strong> UGA, either by Kitsap County or theCity of Bremerton, PSE and CNG should be advised of large development or redevelopment projects andallowed to provide input on their ability to adequately serve the project.Solid WasteIncorporated Plan Features• Focusing growth in existing UGAs and cities where solid waste services already exist would reduce impactsrelated to providing curbside pickup for added population and promote more curbside customers. Therewould also be less need for additional Recycling & Garbage Facilities (RAGFs).Applicable Regulations and Commitments• Coordination and monitoring at transfer facilities and RAGFs would be ongoing to ensure adequate solid wastecapacity. Service levels for curbside collection as outlined in the CFP would continue or improve to encouragerecycling.Other Potential Mitigation Measures• Based on available landfill capacity at the County’s current contracted landfill location a new or extendedcontact could be enacted to provide landfill capacity well beyond the 2025 planning horizon.Water, Wastewater, and StormwaterIncorporated Plan FeaturesAll alternatives including the No <strong>Action</strong> would be subject to NPDES programs and rules. Continued application ofCounty and City NPDES programs and stormwater manuals (which incorporated LID) will help reduce impacts.Features of the <strong>Gorst</strong> Creek Watershed Characterization & Framework Plan and <strong>Gorst</strong> Subarea Plan that serve asmitigation include the following:• Implement tailored stormwater standards for the <strong>Gorst</strong> Creek Watershed, including LID standards in areas ofdevelopment, restoration and protection.• Wherever practicable, new development and redevelopment should incorporate LID measures such asinfiltration. Where impractical, stormwater detention may be allowed.• Minimize clearing and promote stormwater management in the upper and middle portions of the watershedto reduce impacts to the lower watershed.• Promote green infrastructure for both new and existing facilities, such as by identifying areas to target forstormwater retrofits.<strong>Draft</strong> | June 2013 1-38
GORST PLANNED ACTION EIS | SUMMARY• Allow zero direct and untreated discharge to streams and marine water bodies in association withdevelopment and redevelopment.Additionally, capital facility improvements have been recommended measures for addressing stormwaterdeficiencies. Implementation of these improvements could result in beneficial effects on stormwater and indirectlyprotect drinking water and wastewater facilities by reducing flood-prone damage and erosion.Applicable Regulations and CommitmentsApplicable regulations and commitments include the following:• Safe Drinking Water Act. Sets national primary drinking water standards. The act includes the designation ofsole source aquifers. The 1996 amendment identifies source water protection.• CWA. Regulates discharge of stormwater from certain industries and municipalities. NPDES permit or waterquality discharge permit. The EPA delegated the Department of Ecology the authority to implement thesepermits in Washington State.• Drinking Water Regulations Chapter 70.116 RCW. Directs the Washington State Department of Health toassure safe and reliable drinking water and protect drinking wells.• Washington State Water Pollution Control Act Chapter 90.48 RCW. Regulates various source control activitiesrelated to sediment management.• City of Bremerton Comprehensive Wastewater Plan and Updates. Ensures adequate existing and futurewastewater capacity.• City of Bremerton Stormwater Management Program. Summarizes the actions to be taken by the City ofBremerton to fulfill its obligations as listed in the NPDES Phase II Municipal Stormwater Permit.• City of Bremerton BMC Chapter 15, Stormwater, SWMMWW and LID Guidance Manual. Regulates forstormwater management associated with new development and redevelopment.• Kitsap County 20-year wastewater facility plan. Ensures adequate existing and future wastewater capacity.• Kitsap County Surface and Stormwater Management Program. Protects people, property and naturalresources by reducing flooding and stormwater runoff, conserving groundwater, restoring fish habitat, andpreventing stormwater pollution.• KCC Chapter 12, Stormwater Drainage, and Kitsap County Stormwater Design Manual. Regulates forstormwater management associated with construction.• Any future development would need to comply with applicable utility franchises and permits.Other Potential Mitigation MeasuresOther potential mitigation measures could include the following:• Evaluate the effect on proposed utility relocations on other nearby utility infrastructure.• Determine the exact location and depth of utilities and work with individual utility providers to verify thelocation.• Complete utility relocation or modification, where feasible, prior to project-specific construction to reduceoperational risks and reduce any potential disruption of service.<strong>Draft</strong> | June 2013 1-39
GORST PLANNED ACTION EIS | SUMMARYTelecommunicationsIncorporated Plan Features• Mixed-use and clustered development is encouraged in select areas under Alternative 3, and both Alternatives2 and 3 would result in increased residential density over existing conditions. Providing wired communicationservices to higher-density and cluster development is often more efficient than provision to low-densitydevelopment.Applicable Regulations and Commitments• Future construction of telecommunications infrastructure would be required to comply with federal and statelaws, including the regulations of the FCC; the provisions of the Cable Television Consumer Protection andCompetition Act, as appropriate; the regulations of the BMC; and the KCC.Other Potential Mitigation Measures• Encourage co-location of telecommunications facilities wherever appropriate and undergrounding ofinfrastructure to minimize aesthetic impacts.• Encourage the use of appropriate site landscaping to screen telecommunications equipment from surroundingproperties and the public realm.Relationship to Plans and PoliciesIncorporated Plan FeaturesThe Watershed Characterization & Framework Plan and <strong>Gorst</strong> Subarea Plan provide a common set of plans andpolicies to ensure consistent and coordinated planning between the City of Bremerton, Kitsap County, and theSuquamish Tribe.Applicable Regulations and Commitments• In order to ensure consistency with GMA requirements, the City of Bremerton and Kitsap County will submitthe <strong>Gorst</strong> plans to the Washington Department of Commerce or review and comment prior to adoption.• As a preferred plan is prepared, the City of Bremerton and County will prepare a land capacity analysis prior tolegislative adoption.Other Potential Mitigation Measures• The County and City of Bremerton could work with KRCC to reallocate population from undersized UGAs to<strong>Gorst</strong> to match Alternatives 2 or 3 population levels. This could be accomplished prior to the County and Cityof Bremerton’s GMA required 2016 Comprehensive Plan Update. Until that time, the mineral resourcesdesignation could remain while the mine is still in active operation, thus not allowing residential growth untilpopulation targets are reallocated.• The final Subarea Plan prepared for the preferred alternative could include coordinated shoreline and criticalarea standards. See EIS Appendix D Shoreline Buffer Comparison & Options for a description of options.1.7 Significant Unavoidable Adverse <strong>Impact</strong>sThis section summarizes conclusions for each topic and indicates if there are residual impacts that are significant,unavoidable, and adverse despite the application of mitigation measures.Geology/SoilsUnder all of the alternatives, future development would lead to the loss of currently undeveloped soils within theUGA, which will eliminate their ability to support other uses. The area of land that is currently undeveloped butwould be available for development ranges from 41 to 70 acres, depending on the alternative, plus land modified<strong>Draft</strong> | June 2013 1-40
GORST PLANNED ACTION EIS | SUMMARYin existing or future rights of way or on lands for public purposes. While the total acreage of soil lost is likely to beless than the acreage of developable acres, it would constitute an unavoidable adverse impact.Under all alternatives, loss of soil from the watershed is likely to continue to occur as a result of flooding andstormwater runoff. Over the long term, these impacts would be greatest under Alternative 1, and lower underAlternatives 2 and 3.Non-renewable mineral resources would continue to be extracted from the study area on an indefinite basis underAlternative 1, and on an interim basis under Alternatives 2 and 3. This ongoing extraction would constitute a longtermloss of these resources, although the material would be used for commercial purposes as intended by theGMA.Water ResourcesUnder all alternatives, the <strong>Gorst</strong> Creek watershed and the <strong>Gorst</strong> UGA would experience additional population andemployment growth. Development in the <strong>Gorst</strong> Creek UGA is anticipated under the alternatives would result in nosignificant unavoidable adverse impacts on water resources. All alternatives would have a minor effect on waterresources from short-term construction related impacts. As previously described, Alternative 1 would have longtermmoderate impacts on water resources. Both Alternatives 2 and 3 would provide long-term beneficial effectson water resources from adoption and implementation of the Watershed Characterization & Framework Plan.Alternative 3 provides the greatest ecological benefit by establishing a low intensity waterfront along the shorelineof Sinclair Inlet that would, as redevelopment occurs, partially restore natural hydrology along that portion of theshoreline.Air QualityNo significant unavoidable adverse impacts on regional or local air quality are anticipated. Temporary, localizeddust and odor impacts could occur during the construction activities. The regulations and mitigation measuresdescribed above are adequate to mitigate any adverse impacts anticipated to occur as a result of <strong>Gorst</strong> study areagrowth increases.Plants and AnimalsMost of the forested watershed is owned by the City of Bremerton and managed for very limited forestry andutility activities (see Section 3.14 Relationship to Plans and Policies). As such, large scale changes to wildlife habitatthere are not anticipated under any alternative. One area designated for protection in the WatershedCharacterization Study south of SR 3 (Assessment Unit 1) is zoned for Rural Residential uses by Kitsap County.Under Alternative 1, no added protective measures are considered and there could be a loss of forest cover thatcould displace wildlife. Under Alternatives 2 and 3, added measures such as LID requirements and clustering couldmitigate that potential impact.New impervious surfaces and cutting of trees would occur under all the alternatives particularly in the <strong>Gorst</strong> UGAbut also on Rural Residential lands in the watershed, contributing to stormwater runoff, flooding, andsedimentation of surface water resources, which would impact aquatic species that occur within the watershedand UGA. These impacts would be greatest under Alternative 1, but reduced under Alternatives 2 and 3 as capitalimprovements to the stormwater system and BMPs to reduce erosion and sediment export would beimplemented.NoiseAt the comprehensive planning level, implementation of the mitigation measures described above would avoidand/or reduce potential noise impacts to less than significant. If project-level impacts are identified as subsequentprojects are proposed, specific mitigation measures would be required to meet Kitsap County and City ofBremerton noise limits.<strong>Draft</strong> | June 2013 1-41
GORST PLANNED ACTION EIS | SUMMARYHazardous MaterialsUnder all of the alternatives future redevelopment of contaminated sites would presumably occur, potentiallyresulting in the release of hazardous materials to soil, groundwater, and surface water, or exposure of workers andthe public to these materials. Most of these potential impacts would occur within the UGA, at industrial sites.Contaminants from existing sites within the study area could continue to be transported off of these sites as aresult of stormwater and flooding issues. Such movement of contaminants would continue to impact surfacewater, groundwater, and soil resources within the study area. These impacts would be greatest under Alternative1, and lower under Alternatives 2 and 3, which would address stormwater and flooding issues in the UGA as well aslimit future land clearing in areas of protection in the watershed. Contaminated sites would be avoided duringproject design when possible. Implementing the mitigation approaches described above would reduce adverseeffects on human health and the environment.Land Use PatternsUnder all alternatives, the <strong>Gorst</strong> Creek watershed in general, and the <strong>Gorst</strong> UGA in particular, would experienceadditional growth in population and employment. Vacant land in the <strong>Gorst</strong> UGA is anticipated to be developed,and some existing properties would redevelop over time. While the overall land use pattern in the area would beirreversibly changed, anticipated impacts can be mitigated with design and development standards.Socio-EconomicsPopulation, employment and housing will increase under any of the alternatives reviewed, to different degrees.Alternative 2 and Alternative 3 have the most growth in population and Alternatives 1 and 2 the most growth inemployment. Additional growth in any of the scenarios will increase the demand for the development of housingand commercial uses. The additional growth will also result in secondary impacts on the natural and builtenvironment and to the demand for utilities and public services, which is addressed in the appropriate sections ofthis EIS. Regarding the character of the local economy, there are no potential significantly adverse impacts areidentified from the anticipated growth in population and employment.AestheticsNew development and redevelopment would result in changes to the current aesthetic conditions of the studyarea under all alternatives. The significance of visual impacts on the study area depends in large part on the valuesof those viewing the changes as well as the overall character and quality of the architectural and urban designfeatures incorporated into future development.Under all alternatives, temporary character and shading impacts would result from different building heightsbetween adjacent properties as development of individual sites occurs. Currently, most properties in the studyarea are at low rise scales and have not developed to the extent allowed under present zoning. In some cases theaction alternatives would allow greater heights than present zoning. <strong>Impact</strong>s would diminish as redevelopmentbecomes more widespread throughout the study area. Existing and potential development regulations regardingheight limits, setbacks, and screening would mitigate for such impacts.The overall aesthetic character of the study area would change under all alternatives as development andredevelopment occurs. All alternatives would be subject to mitigation measures in the form of policies,development regulations, and design standards that will mitigate for potentially adverse aesthetic impacts orresult in a positive change to the aesthetic character of the study area. Therefore, no significant unavoidableadverse impacts on aesthetics are anticipated.Cultural ResourcesThe impacts on cultural resources caused by new development associated with all studied alternatives could besignificant and unavoidable, depending on the nature and proximity of the proposed development project.<strong>Draft</strong> | June 2013 1-42
GORST PLANNED ACTION EIS | SUMMARYImplementation of mitigation measures would identify potential impacts on cultural resources and reduce them toa less than significant level (Table 3.10-6 Cultural Resources Mitigation Measures).TransportationImplementation of any of the growth alternatives would result in increased traffic within the <strong>Gorst</strong> UGA andnetworks in south Kitsap County and Bremerton, with the lowest increase occurring under Alternative 3 andgreater increases under Alternatives 1 and 2 (however, Alternative 2 is no greater than Alternative 1 No <strong>Action</strong> interms of State Route congestion). Due to the large volume of regional ”pass through” traffic that uses both SR 3and SR 16, all three alternatives contribute a relatively small amount to cumulative volumes on state routes. WhileWSDOT has long range plans to address capacity on SR 3, the amount of widening of this roadway will be limitedby the presence of Sinclair Inlet on the east side of the roadway, a steep hillside on the west side of the roadwayand a railway crossing with abutments that limit widening.Fire Protection and EMSFuture population growth and development will continue to increase the need for fire protection/EMS servicesunder any studied alternative, and particularly the action alternatives. With mitigation, significant, unavoidableadverse impacts would not be anticipated.Law EnforcementFuture population growth and development will continue to increase the need for law enforcement services andfacilities under all alternatives. With mitigation, significant, unavoidable adverse impacts would not be anticipated.SchoolsThe demand for school services and facilities will increase as new development occurs and the number of familieswith school-aged children increases. With mitigation, significant, unavoidable adverse impacts would not beanticipated.Parks, Recreation, and Open SpaceWith the increase in population and urbanization of the Watershed and UGA under any of the alternatives, andparticularly the action alternatives, there would be greater demand for parks, recreational facilities, and programs.To avoid impacts, the County and City could work with other agencies and regularly monitor population growth,service levels, and demand to bring supply and demand into balance; this can be accomplished with regular CFPupdates as appropriate.Neighborhoods surrounding existing, new or expanded parks would experience more activity in the form ofvehicles and pedestrians. Cost for acquiring parks is expected to rise with the increased demand for urban land inthe UGA over time.LibrariesAs population increases within the watershed and <strong>Gorst</strong> UGA, the demand for library services will also increase.The library system as a whole will experience increased demand as more people require greater collections ofmaterials and other resources. With advanced coordination between the Library District, Kitsap County, and City ofBremerton; significant, unavoidable, adverse impacts are not anticipated.PowerPopulation and employment growth under all studied alternatives, and particularly the action alternatives, willincrease demands for energy that in turn will increase the need for additional facilities. Planning efforts to managegrowth should reduce the demand and/or accommodate growth in a coordinated fashion than would otherwiseoccur.<strong>Draft</strong> | June 2013 1-43
GORST PLANNED ACTION EIS | SUMMARYSolid WasteFuture population growth and development would continue to increase the amount of solid waste generated inthe county under any alternative, especially the action alternatives. With Solid Waste Management Plans, regularlyupdated as appropriate, no significant unavoidable adverse impacts are anticipated.Water, Wastewater, and StormwaterUnder all alternatives, the <strong>Gorst</strong> Creek Watershed and the <strong>Gorst</strong> UGA would experience additional population andemployment growth. Development in the <strong>Gorst</strong> Creek UGA is anticipated under the alternatives andcomprehensive planning, as well as review of project specific development utility permits, would result in nosignificant unavoidable adverse impacts on water, wastewater, and stormwater.Future project construction associated with any of the project alternatives could cause temporary serviceinterruptions to existing utilities. Under the Alternative 1, the long-term higher frequency of maintenance on agingutility infrastructure and untreated stormwater discharging directly to fish-bearing streams, estuarine wetlands,and tidally influence waters is considered a moderate impact. Both Alternative 2 and 3 would have beneficialeffects on stormwater management from adoption of the Watershed Characterization & Framework Plan.TelecommunicationsPopulation and employment growth under all studied alternatives will increase demands for telecommunicationsthat in turn will increase the need for additional facilities. Planning efforts to manage growth should reduce thedemand and/or accommodate growth in a coordinated fashion than would otherwise occur.Relationship to Plans and PoliciesWith implementation of mitigation measures, no significant unavoidable adverse impacts are anticipated withregards to future plan consistency under any of the alternatives.<strong>Draft</strong> | June 2013 1-44
2.0 ALTERNATIVES2.1 IntroductionThe City of Bremerton, in partnership with Kitsap County and other state, federal, and tribal agencies, is planningthe future of the <strong>Gorst</strong> Creek Watershed and <strong>Gorst</strong> UGA. These coordinated efforts are intended to:• Make <strong>Gorst</strong> a place where people want to live, shop and recreate,• Protect water quality, habitat and fish while fostering economic development,• Identify areas for development, restoration and protection based on science,• Adopt a land use plan for <strong>Gorst</strong>, and• Implement a long-range capital improvement plan to provide for future utility services, public services andtransportation needs.Products of the planning effort to date include a <strong>Draft</strong> <strong>Gorst</strong> Creek Watershed Characterization & Framework Planfor the 6,000-acre watershed as a whole and a <strong>Draft</strong> <strong>Gorst</strong> Subarea Plan for the 335-acre <strong>Gorst</strong> UGA. This <strong>Draft</strong> EISevaluates possible environmental impacts of the draft plans and alternatives. In addition to these plans anddevelopment regulations, the City of Bremerton and Kitsap County are considering designating a planned actionfor some or all of the <strong>Gorst</strong> UGA. A planned action provides more detailed environmental analysis during an areawideplanning stage rather than at the project permit review stage. Designating a planned action streamlinesenvironmental review for development proposals consistent with EIS mitigation measures that are adopted in aplanned action ordinance.To illustrate a range of possible futures in <strong>Gorst</strong>, the following alternatives are evaluated in the <strong>Draft</strong> <strong>Gorst</strong>Subarea Plan and this <strong>Draft</strong> EIS:• Alternative 1 (No <strong>Action</strong>) – <strong>Gorst</strong> is a relatively small highway-oriented commercial and industrial center• Alternative 2 – <strong>Gorst</strong> is a well-designed regional commercial center• Alternative 3 – <strong>Gorst</strong> becomes a complete communityAlternative 1 is a required alternative under the SEPA. It represents a continuation of the current ComprehensivePlan and regulations. <strong>Action</strong> alternatives represent a range of land use, growth, policies, and regulations and weredeveloped as part of a public outreach process. These alternatives are discussed more fully in this Chapter.2.2 BackgroundStudy AreaThe <strong>Gorst</strong> Creek Watershed (Figure 2-1 <strong>Gorst</strong> Creek Watershed Aerial) and <strong>Gorst</strong> UGA (Figure 2-2 <strong>Gorst</strong> UGA)together comprise the study area, and encompass over 6,000 acres in the southwestern portion of Kitsap County.• About 3,597 acres comprise Bremerton city limits.• The unincorporated <strong>Gorst</strong> UGA is approximately 335 gross acres in area (about half of which are in thewatershed).• Approximately 178 acres are in the McCormick Woods area of the City of Port Orchard.• The balance of the watershed, about 1,941 acres, consists of rural unincorporated land.<strong>Draft</strong> | June 2013 2-1
THIS PAGE INTENTIONALLY BLANK
FIGURE 2-1 GORST CREEK WATERSHED AERIALWatershed BoundaryUGA BoundaryCity Limits<strong>Gorst</strong> UGAParcelsDate: May 2013Source: Kitsap County Assessor 2012, WA State Department of Ecology, BERK0 0.5 1Miles
THIS PAGE INTENTIONALLY BLANK
FIGURE 2-2 GORST URBAN GROWTH AREAWatershed BoundaryUGA BoundaryBremerton West UGACity LimitsParcelsCity of Bremerton<strong>Gorst</strong> UGACity of BremertonDate: April 2013Source: DigitalGlobe, Kitsap County Assessor 2012, BERK0 0.1 0.2Miles
THIS PAGE INTENTIONALLY BLANK
GORST PLANNED ACTION EIS | ALTERNATIVESCurrent ConditionsThe 6,000-acre <strong>Gorst</strong> Creek Watershed is diverse with thousands of acres of intact forest land, miles of streamsand acres of wetlands, recreation at the Gold Creek Mountain Golf Course and Jarstad Park, as well as regionalcommercial uses along State Route (SR) 3 and 16, and unincorporated rural residential in between.The <strong>Gorst</strong> Creek Watershed feeds the headwaters of Sinclair Inlet in the Puget Sound. While the overall watershedis largely undeveloped and forested, existing development is concentrated in the downstream areas around themouth of <strong>Gorst</strong> Creek and along the shoreline of Sinclair Inlet. The <strong>Gorst</strong> Creek estuary is a major passageway andnursery for Puget Sound Chinook, Coho, and Chum salmon, along with Steelhead, and Sea-Run Cutthroat trout.The Suquamish Tribe and the Washington State Department of Fish and Wildlife co-manage a hatchery on <strong>Gorst</strong>Creek. The Tribe takes an active role in managing the natural resources within the watershed.Having sub-optimal land use and environmental regulations for decades, development in the <strong>Gorst</strong> UGA, andespecially along the Sinclair Inlet shoreline has occurred haphazardly. Upland residential development andassociated clearing and lack of stormwater management have impacted water quantity and quality in thelowlands. Commercial and industrial activities have maximized impervious pavement resulting in pollutant runoffdirectly into adjacent receiving waters.Historically, <strong>Gorst</strong> Creek has not met fecal coliform standards. Sewers were recently installed to address waterquality concerns associated with fecal coliform. Sewers are also anticipated to make the developed land in the<strong>Gorst</strong> UGA more viable for redevelopment. Likewise, heavy traffic on State Routes 3 and 16 impacts the naturaland built environment, but also may be attractive for future commercial development, with high volumes of trafficcreating an economically desirable location.<strong>Gorst</strong> Watershed Characterization & Framework PlanThe Watershed Characterization &Framework Plan is intended to promote environmentally and economicallysustainable development in the <strong>Gorst</strong> Creek Watershed. The <strong>Draft</strong> Watershed Characterization &Framework Plandescribes watershed conditions and objectives regarding appropriate places for development, restoration, andprotection. The <strong>Draft</strong> Watershed Characterization & Framework Plan also identifies common goals for stormwater,habitat, and land uses. Both Kitsap County and City of Bremerton intend to adopt the Watershed Characterization& Framework Plan.No UGA boundaries are proposed for change. Also no rural land use and zoning are proposed for change. However,the <strong>Draft</strong> Watershed Characterization &Framework Plan includes proposed goals addressing stormwater and LIDmeasures. Kitsap County would implement the goals in the watershed through code amendments. Similarly, theCity of Bremerton would apply stormwater management and LID measures in the watershed primarily on CULs.Within the existing <strong>Gorst</strong> UGA boundaries, however, land use patterns are proposed for change through differentland use alternatives described below under the <strong>Gorst</strong> Subarea Plan.<strong>Gorst</strong> Subarea PlanThe City of Bremerton and Kitsap County have been developing a subarea plan to more directly and fully addressfuture land use, urban design, stormwater, transportation, habitat protection, and other activities in the <strong>Gorst</strong>UGA. A subarea plan is an optional element of a comprehensive plan allowed under the GMA. Subarea plans applyto smaller focused areas than the comprehensive plan, which addresses the whole City of Bremerton or KitsapCounty and its assigned unincorporated UGAs. Subarea plans are typically more detailed than a comprehensiveplan and often establish specific visions, goals, policies, land use plans, design guidelines, zoning, infrastructure andpublic service needs, and other development regulations.The Bremerton Comprehensive Plan includes several subarea plans for Downtown, Manette, SKIA, and severalother locations; the City of Bremerton is now considering a subarea plan for the <strong>Gorst</strong> UGA to facilitate<strong>Draft</strong> | June 2013 2-7
GORST PLANNED ACTION EIS | ALTERNATIVEScoordinated Kitsap County-City of Bremerton planning and to anticipate a smooth transition from Kitsap County toCity governance at the time of annexation, anticipated in the future.Similarly, Kitsap County has a Comprehensive Plan including subarea plans for different urban and ruralcommunities, such as Port Orchard/South Kitsap, Silverdale, Kingston, and other locations. Kitsap County intendsto concurrently adopt the <strong>Gorst</strong> subarea plan, within its own Comprehensive Plan context.Key components of the <strong>Draft</strong> <strong>Gorst</strong> Subarea plan include:• Vision <strong>Statement</strong>• Guiding principles, Goals, and Policies addressing land use, environment, stormwater and flooding, publicservices, and annexation• Land Use Plan• Urban Design ConceptsOnce a preferred alternative is developed as described later in this Chapter, the <strong>Draft</strong> Subarea Plan will be revisedto reflect the preferred vision and land use plan, and new development regulations, design guidelines, and acapital facilities plan will be prepared.2.3 Public ReviewThe City of Bremerton and Kitsap County have created a variety of opportunities for public and agency input intothe Watershed Characterization & Framework Plan. <strong>Gorst</strong> Subarea Plan, and <strong>Planned</strong> <strong>Action</strong> EIS. Key efforts aredescribed below:• The City of Bremerton’s website, located at: http://www.gorstwatershed.com/, includes information aboutthe project, links to draft products, and a comment form.• An Advisory Committee, composed of representatives from Bremerton Planning Commission, City ofBremerton Council, Bremerton Mayor, Kitsap County Planning Commission, Kitsap County, the BOCC, andSuquamish Tribal Council, represents the interests of their respective bodies and convenes at key projectmilestones to address issues and concerns for <strong>Gorst</strong> Creek Watershed Plan. In January 2013, the AdvisoryCommittee reviewed preliminary alternatives and provided direction and advice on the range of alternatives.The Advisory Committee suggested addressing road safety in guiding principles. Also, as a result of AdvisoryCommittee input the preliminary alternatives were modified to show a lower intensity commercial designationalong the waterfront (Alternative 3) and to identify an area that would not be subject to the planned action(areas waterward of highways in Alternative 2). These amended alternatives were then vetted at a publicworkshop and Planning Commission meetings. More meetings are planned in the spring and fall of 2013 as aset of preferred plans are developed.• An extensive group of agencies, organizations and individuals are partnering to develop the plan, and workingtogether as Project Partners to steer the project, including:United States <strong>Environmental</strong> Protection Agency (EPA)EcologyCity of BremertonKitsap CountyPort of BremertonSustainable BremertonSuquamish TribeWashington State Department of Fish and WildlifeCity of Port OrchardKitsap County Health District (KCHD)West Sound Watershed Council<strong>Gorst</strong> property owners, Pat and Cheryl LockhartProject partners have met several times to discuss analysis methods and review technical documents such as theWatershed Characterization Study.<strong>Draft</strong> | June 2013 2-8
GORST PLANNED ACTION EIS | ALTERNATIVES• Scoping comment period and workshop. Public and agency comment was solicited by the City of Bremertonas lead agency in a 21-day written scoping period from October 15 to November 5, 2012. Scoping notices anda meeting announcement were sent by mail to each property owner in the <strong>Gorst</strong> UGA, and to a list of federal,state, and local agencies and tribes. The City of Bremerton and Kitsap County also sent these documents byemail to lists of persons interested in planning issues in the City of Bremerton and Kitsap County. The scopingnotice was published in the Kitsap Sun on October 15, 2012 to notify any other persons having an interest inthe project. The City of Bremerton, in coordination with the Kitsap County, also held a public meeting onOctober 29, 2012 to ask about the vision for <strong>Gorst</strong> and about the EIS scope. A table exercise askingparticipants to identify <strong>Gorst</strong>’s strengths, weaknesses, opportunities, and threats (SWOT) was conducted. Ascoping summary is provided in Appendix A Scoping Summary.• Preliminary alternatives workshop. At a February 12, 2013 workshop, the City of Bremerton and KitsapCounty asked public input about preliminary land use alternatives that should be evaluated in a <strong>Draft</strong> SubareaPlan and EIS. A postcard meeting announcement was sent by mail to each property owner in the <strong>Gorst</strong> UGA. Aflier was emailed to persons who had participated in prior <strong>Gorst</strong> scoping events in fall 2012, and also topersons indicating a general interest in Kitsap County and City of Bremerton planning efforts. An article waspublished in the Kitsap Sun on February 7, 2013. As a result of the public workshop input, the preliminaryalternatives were modified for analysis, including further emphasizing mixed uses in Alternative 3, furtherextending low density residential along <strong>Gorst</strong> Creek in both Alternatives 2 and 3, and recognizing additionalKitsap County-owned property as open space/recreation on the north side of Sinclair Inlet in both Alternatives2 and 3.• Legislative meetings. On February 19, 2013, the Bremerton Planning Commission and Kitsap County PlanningCommission met separately at their regular meetings to review the preliminary alternatives. AdditionalPlanning Commission, City of Bremerton Council, and Kitsap County BOCC meetings are planned later in theprocess to help identify a preferred alternative, refine and deliberate on the framework and subarea plans,and consider a planned action ordinance. A project schedule is available at http://www.gorstwatershed.com/.• <strong>Draft</strong> EIS Comment Period. This <strong>Draft</strong> EIS allows for a 45-day public comment period (see Fact Sheet) duringwhich time the City of Bremerton will accept written comments regarding the alternatives and environmentalimpacts and mitigation measures. The City of Bremerton will issue a Final EIS providing responses tocomments and may address a Preferred Alternative. The Preferred Alternative may include elements from oneor more alternative studied in this <strong>Draft</strong> EIS.<strong>Draft</strong> | June 2013 2-9
GORST PLANNED ACTION EIS | ALTERNATIVES2.4 Proposal ObjectivesSEPA requires a statement of objectives that address the purpose and need for the proposal. The proposalobjectives for the future of <strong>Gorst</strong> can be found in the <strong>Draft</strong> Watershed Characterization & Framework Plan and<strong>Gorst</strong> Subarea Plan Guiding Principles. These are listed in Table 2-1 Watershed Characterization & Framework Planand <strong>Gorst</strong> Subarea Plan Guiding Principles.Table 2-1Watershed Characterization & Framework Plan and <strong>Gorst</strong> Subarea Plan Guiding PrinciplesCommunity Vision & Economic DevelopmentMake <strong>Gorst</strong> a place where people want to live, shop and recreate.Facilitate development of economically valued land. 1Recognize environmental restoration as a tool that can support the local economy .1Development PatternIdentify and prioritize land that can be more intensely developed with less environmental consequences.Promote green infrastructure for both new and existing facilities, such as by identifying areas to target for stormwater retrofits.Support development incentives and evaluate options such as off-site mitigation, mitigation banking, and other tools whereappropriate.<strong>Environmental</strong> ProtectionIdentify and protect critical areas.Prioritize areas to be protected and restored.Protect and enhance water quality/quantity for fish and wildlife habitat as well as for human use.Promote shoreline reclamation.Urban Design, Land Use & TransportationCreate a cohesive and attractive urban character in the <strong>Gorst</strong> UGA such as by improving building design, and creating andenhancing public spaces such as parks, trails, pedestrian corridors and streetscapes.Allow an environmentally sustainable pattern of forestry, low density residential, small scale employment, and recreation uses inthe rural areas of watershed.Improve transportation mode choices including transit, bicycle, pedestrian, and autos, recognizing local as well as regional travelneeds.Promote interpretive art, signage, and public spaces that recognize cultural history and environmental features.Reduce collisions and improve safety.Note:1 Such as by establishing land use plans that offer business and housing opportunities, and capital plans that incentivizeshoreline reclamation and amenities such as open space and recreation, community design, and streetscapes.<strong>Draft</strong> | June 2013 2-10
GORST PLANNED ACTION EIS | ALTERNATIVES2.5 Study AlternativesThis <strong>Draft</strong> EIS evaluates three alternatives that set a range of land use patterns and mix of residential andemployment growth:• Alternative 1 – <strong>Gorst</strong> is a relatively small highway-oriented commercial and industrial center. This is a SEPArequiredalternative. It represents No <strong>Action</strong> and continuing with the current Comprehensive Plan.• Alternative 2 – <strong>Gorst</strong> is a well-designed regional commercial center.• Alternative 3 - <strong>Gorst</strong> becomes a complete community.Each alternative proposes a different mix of land use, growth, policies, and regulations described below.Alternative 1 – No <strong>Action</strong>, Current Plan: <strong>Gorst</strong> is a relatively small highway-orientedcommercial and industrial centerThe No <strong>Action</strong> Alternative would retain current Kitsap County and City of Bremerton Comprehensive Plans. TheWatershed Characterization & Framework Plan would not be adopted. New LID and stormwater standards wouldnot be adopted throughout the watershed; however, portions of the watershed would continue to be subject toNPDES standards that are intended to reduce water quality impacts and promote improved stormwatermanagement.Reflecting the current Comprehensive Plan vision for the <strong>Gorst</strong> UGA, <strong>Gorst</strong> would be a relatively small highwayorientedcommercial and industrial center. Within the UGA, Alternative 1 would allow greater employment growthof 742 jobs and a smaller population growth of 82 persons over the next 20-30 years. No planned action ordinancewould be adopted.No new capital facility improvements, stormwater, or habitat regulations would be implemented beyond adoptedCapital Facility Plans.Alternative 2 – <strong>Gorst</strong> is a well-designed regional commercial centerUnder Alternative 2, the Watershed Characterization & Framework Plan would be adopted. While rural land useand zoning would be retained, amended LID and stormwater standards would be applied throughout thewatershed.Under Alternative 2, the <strong>Gorst</strong> UGA is envisioned as a regional commercial corridor along the waterfront providinglocations for the Bremerton community and Kitsap County residents to shop. Gateway and boulevard treatments,shoreline access, green infrastructure, and habitat BMPs provide for a more well designed sustainabledevelopment pattern. More medium density clustered residential development would occur in the northwestportion of the UGA, and infill single-family residential development would occur in the western portion of the UGA.Alternative 2 would allow a moderate increase in employment of 606 jobs and a more substantial increase inresidents of 985 persons. A <strong>Planned</strong> <strong>Action</strong> would be designated for most of the UGA except waterward of SR 16and SR 3, along Sinclair Inlet.Capital facility improvements and amended stormwater and habitat regulations would be implemented.Alternative 3 - <strong>Gorst</strong> becomes a complete communityUnder Alternative 3, the Watershed Characterization & Framework Plan would be adopted along with LID andstormwater standards throughout the watershed. Under Alternative 3, the <strong>Gorst</strong> UGA would be guided by aSubarea Plan intended to ensure <strong>Gorst</strong> evolves into a complete community with places to live, play, shop, andwork, in a waterfront setting. Mixed uses would be predominate. Along the waterfront a lower intensitycommercial land use pattern develops with smaller impervious footprints interspersed by trails, parks, andreclaimed shoreline habitat. Central <strong>Gorst</strong> allows more intensive regional commercial, office, hotel, and mixed use<strong>Draft</strong> | June 2013 2-11
GORST PLANNED ACTION EIS | ALTERNATIVESresidential developments. Small-scale mixed use neighborhoods lie along West Belfair Road and West Frone Road.Clustered development occurs along <strong>Gorst</strong> Creek. A residential neighborhood along Sherman Heights Roadprovides a range of detached and attached residential choices in clustered patterns and small-scale, neighborhoodservingcommercial uses. Alternative 3 supports less job growth than the other studied alternatives at 333 jobs butthe highest population growth at 1,082 persons. A <strong>Planned</strong> <strong>Action</strong> would be designated for the whole UGA.Capital facility improvements and amended stormwater and habitat regulations would be implemented.Each alternative is further described and compared below.Watershed Land UseThree urban areas are included in the study area:1. Bremerton City Limits, including areas known as the City of Bremerton Utility Lands (CUL) and the SKIA.2. The Port Orchard City Limits, encompassing a master planned community called McCormick Woods.3. The <strong>Gorst</strong> UGA, including unincorporated land assigned to the City of Bremerton UGA.Bremerton’s CUL are owned by the City of Bremerton and are for low intensity forestry purposes. City ofBremerton zoning shows the following intended activities BMC 20.96.010: “The intent of the CUL zone is topreserve resource-related functions of land, and to protect watersheds and timberlands. The CUL zone is alsointended to ensure healthy forest cover and provide habitat for wildlife. The zone will accommodate some limitedcommercial and recreational activities, which adhere to a high standard of environmental BMPs, and LID.” Nochange is proposed in the designation of CUL.The SKIA area is subject to its own subarea plan, recently adopted by the City of Bremerton in 2012. The area isplanned as industrial. The SKIA Subarea Plan encourages development to occur in a sustainable, energy efficientand environmentally protective manner. The <strong>Gorst</strong> Creek Watershed Characterization & Framework Plan assumesthat the SKIA Plan will be implemented.In 2012, the City of Port Orchard annexed the McCormick Woods land in, with the exception of three parcels newlyadded by Kitsap County as a UGA territory in August 2012. These three parcels are for public use purposes and arelikely to be annexed soon by the City of Port Orchard. With an already approved residential master plan, no furtherchange in land use is anticipated in the <strong>Gorst</strong> Creek Watershed Characterization & Framework Plan.Around the <strong>Gorst</strong> UGA “Urban Reserve” designations would be primary locations for any future UGA boundaryincreases, but in the meantime allow rural densities. The balance of the study area is largely Rural Residential.The <strong>Gorst</strong> UGA has been identified by Kitsap County as predominantly a commercial area. It contains a minedesignated in the Comprehensive Plan as Mineral Resource, and zoned as Industrial.Apart from the <strong>Gorst</strong> UGA described below, under all alternatives, the planned land use in the <strong>Gorst</strong> CreekWatershed would remain the same. See Figure 2-3 <strong>Gorst</strong> Watershed Planning Area Land Use.<strong>Draft</strong> | June 2013 2-12
FIGURE 2-3 GORST WATERSHED PLANNING AREA: LAND USELegendLanduse (City and County)IndustrialRural ProtectionWatershed BoundaryLow Density ResidentialIndustrial ParkRural ResidentialCity LimitsMedium Density ResidentialMineral ResourceRural CommercialUGA BoundaryMedium/High Density ResidentialPublic FacilityRural WoodedWaterHigh Density ResidentialCity Utility LandsForest Resource LandsStreamsHigh Intensity Commercial Mixed UseUrban ReserveWatershedDate: March 2013Source: Kitsap County, City of Bremerton, BERK0 0.5 1Miles
THIS PAGE INTENTIONALLY BLANK
GORST PLANNED ACTION EIS | ALTERNATIVES<strong>Gorst</strong> UGA Land UseThe <strong>Gorst</strong> UGA contains about 335 gross acres including streets and public rights of way, or about 281 acres inparcels. Each alternative proposes an urban land use pattern with variable amounts of commercial and residentialuses (see Table 2-2 Land Use Acres Comparison (Total Parcel Acres by Zone). Alternative 1 focuses on commercial,mineral, and industrial uses (combined 87 percent) and less on residential uses (13 percent). Alternative 2 providesa nearly balanced amount of residential (49 percent) and commercial (46 percent) acres with recognition of KitsapCounty-purchased property for open space (6 percent). Last, Alternative 3 provides a more mixed use pattern ofdifferent commercial and residential intensities (about 75 percent combined) and some single-purposedesignations (residential 11 percent, low-intensity waterfront commercial 9 percent) and open space (six percent).Table 2-2Land Use Acres Comparison (Total Parcel Acres by Zone)Alternative 1Zone Acres PercentHigh Intensity Commercial Mixed Use 121.9 43Mineral Resource 96.3 34Low Density Residential 35.3 13Industrial 27.2 10TOTAL 280.7 100Alternative 2Commercial Corridor 127.8 46Medium Density Residential 105.4 38Low Density Residential 31.6 11Open Space/Recreation 16.0 6TOTAL 280.7 100Alternative 3Neighborhood Mixed Use 105.4 38<strong>Gorst</strong> Mixed Use 103.3 37<strong>Gorst</strong> Creek Residential 31.6 11Low Intensity Waterfront 24.5 9Open Space/Recreation 16.0 6TOTAL 280.7 100Source: Kitsap County 2012; BERK<strong>Draft</strong> | June2013 2-15
GORST PLANNED ACTION EIS | ALTERNATIVESAlternative 1 Future Land UseAlternative 1 retains the Kitsap County vision with <strong>Gorst</strong> being a relatively small highway-oriented commercial andindustrial center. The land use plan is shown in Figure 2-4 <strong>Gorst</strong> UGA Land Use: Alternative 1 - Kitsap County No<strong>Action</strong>. A description of the designations is shown in Table 2-3 Alternative 1 Land Use Designation Descriptions. Apie chart showing the amount of land in each designation is provided in Figure 2-5 Alternative 1 Percentage ofLand in Each Land Use Designation. Alternative 1 Percentage of Land in Each Land Use Designation. The currentland use designations focus on commercial activities (Urban High Intensity Commercial/Mixed Use). Another largearea along Sherman Heights would be retained in mineral resource lands. A smaller area in the western UGA isplanned for residential use. A few parcels along the state routes or railroad are planned for industrial use.Table 2-3Alternative 1 Land Use Designation DescriptionsUrban High-Intensity Commercial/Mixed UseThis designation primarily focuses on larger commercial centers, including commercial uses that require large sites anddraw customers at the community and regional scale. Examples of commercial uses appropriate to this designationinclude but are not limited to superstores, department stores, automotive parts and sales, home improvement stores,hotels and motels, and restaurants. Mixed use developments incorporating residential units are also appropriate in thisdesignation. Zones that implement the Urban High-Intensity Commercial/Mixed Use designation include: HighwayTourist Commercial, Regional Commercial, and Mixed Use.Mineral Resource OverlayThe intent of the Mineral Resource Overlay is to protect sand, gravel, and rock deposits identified as significant.Commercial quality deposits should be recognized as non-renewable resources and managed accordingly.Urban IndustrialThis designation includes both industrial and business uses, such as light manufacturing, hi-tech, warehousing, bio-tech,park-like business, 4-year educational institutions, equipment and vehicle repair, as well as heavy industrial activitiesand those requiring access to major transportation corridors. Zones that implement the Urban Industrial designationinclude: Business Center, Business Park, Industrial, and Airport.Urban Low-Density ResidentialThis designation primarily focuses on single-family dwellings but also may include innovative types such as clusteredhousing. It also includes regulated environmentally critical areas within the UGAs and other areas identified for lowdensityurban development. Zones that implement the Urban Low-Density Residential designation include: UrbanRestricted Residential, Illahee Greenbelt Zone, Urban Low Residential, and Urban Cluster Residential and Senior LivingHomestead.Source: Kitsap County 2012<strong>Draft</strong> | June 2013 2-16
FIGURE 2-4 GORST UGA LAND USE: ALTERNATIVE 1 - KITSAP COUNTY NO ACTIONAlternative 1 - County Land UseHigh Intensity Commercial Mixed UseLow Density ResidentialIndustrialMineral ResourceUGA BoundaryCity Limits0 0.1 0.2Date: May 2013Source: Kitsap County, BERKMiles
THIS PAGE INTENTIONALLY BLANK
GORST PLANNED ACTION EIS | ALTERNATIVESFigure 2-5Alternative 1 Percentage of Land in Each Land Use Designation<strong>Draft</strong> | June2013 2-19
GORST PLANNED ACTION EIS | ALTERNATIVESAlternative 2 Future Land UseAlternative 2 promotes <strong>Gorst</strong> as a well-designed regional commercial center serving Kitsap County:<strong>Gorst</strong> is a regional commercial corridor along the waterfront providing locations for theBremerton community and Kitsap County residents to shop for major purchases such as autos,home furnishings, and other goods and services. Gateway treatments, boulevard stylestreetscape improvements, and access improvements invite the community to <strong>Gorst</strong> and allowconvenient travel to regional businesses. Shoreline public access is emphasized along Sinclair Inletand portions of <strong>Gorst</strong> Creek connecting to a regional non-motorized trail network. Along the westand north boundaries of the UGA are low and medium density residential neighborhoods andsmall scale commercial uses providing daily conveniences. The development pattern includes arange of low-scale detached and attached residential choices in traditional and clustereddevelopment patterns. A comprehensive watershed plan guides development and provides landuse, green infrastructure, and habitat BMPs in the UGA and watershed.Figure 2-6 <strong>Gorst</strong> UGA Land Use: Alternative 2 illustrates the land use pattern, and Table 2-4 Alternative 2 Land UseDesignation Descriptions provides the land use/zoning categories. Figure 2-7 Alternative 2 Percentage of Land inEach Land Use/Zoning Designation shows the percentage of land in each land use/zoning classification..<strong>Draft</strong> | June 2013 2-20
FIGURE 2-6 GORST UGA LAND USE: ALTERNATIVE 2Alternative 2 Land UseCommercial CorridorMedium Density ResidentialLow Density ResidentialOpen Space/RecreationUGA BoundaryCity Limits0 0.1 0.2Date: May 2013Source: Kitsap County, BERKMiles
THIS PAGE INTENTIONALLY BLANK
GORST PLANNED ACTION EIS | ALTERNATIVESCommercial CorridorTable 2-4Alternative 2 Land Use Designation DescriptionsThe commercial corridor designation provides locations for high intensity commercial uses serving the entire communitywhile preserving maritime views, forested areas, and buffering impacts to adjacent residential areas. The corridoraccommodates access to businesses by automobile while also creating a pedestrian-friendly, transit-supporting corridor.A planned action would not apply waterward of SR 16 and SR 3, along Sinclair Inlet.Medium Density ResidentialThis district promotes a variety of attached and detached low and medium density housing including detached singlefamily, attached single family, cottages, small scale flats, townhomes, and accessory dwelling units. Developments aredesigned in an environmentally sustainable pattern, such as through clustering, LID techniques, energy conservation, andsimilar methods.Low Density ResidentialThe intent of the low density residential designation is to accommodate single-family housing by infilling at a range of lotsizes consistent with urban growth patterns. Some attached single-family housing may be appropriate when respondingto sensitive areas or with innovative design. Residential development at higher densities is encouraged at the edge ofdesignated centers.Open Space/RecreationThe Open Space/Recreation designation allows for active and passive parks, recreation, and open space facilities.Secondary uses include accessory commercial such as concessions, recreation equipment rental, and other small-scalefacilities that support and enhance public access and recreation.Source: City of Bremerton and Kitsap County, <strong>Draft</strong> <strong>Gorst</strong> Subarea Plan, June 2013Figure 2-7Alternative 2 Percentage of Land in Each Land Use/Zoning Designation<strong>Draft</strong> | June2013 2-23
GORST PLANNED ACTION EIS | ALTERNATIVESAlternative 3 Future Land UseAlternative 3 proposes a vision of <strong>Gorst</strong> as a community offering homes, jobs, and recreation in an environmentallysustainable setting. The alternative promotes a mix of uses and a wider range of residential dwelling options:As the SKIA grows as an employment center, and demand increases for housing such as alongSherman Heights Road, <strong>Gorst</strong> evolves into a complete community with places to live, play, shop,and work, in a waterfront setting. <strong>Gorst</strong> also serves as a community-wide demonstration of lowimpactdevelopment techniques to create a sustainable, compact and enduring place. Views,cultural resources, critical areas are protected and enhanced through a coordinated watersheddevelopment, restoration, and protection plan and BMPs. Along the waterfront a lower intensityland use pattern emerges with commercial uses occurring on smaller impervious footprintsinterspersed by trails, parks, and reclaimed shoreline habitat. A secondary circulation networkimproves business access, creates a pedestrian scale, and provides non-motorized access towaterfront properties. Central <strong>Gorst</strong> allows more intensive regional commercial, office, hotel, andmixed use residential developments. Small-scale mixed use neighborhoods along West BelfairRoad and West Frone Road provide gathering places and daily conveniences for <strong>Gorst</strong> residentsas well as medium density housing as part of horizontal and vertical mixed use developmentpatterns. Along <strong>Gorst</strong> Creek, a restored riparian corridor is created, made possible in part bydevelopment incentives such as cottages, small lot single family, medium density residential andmixed use development. A residential neighborhood along Sherman Heights Road provides arange of detached and attached residential choices in clustered patterns and small-scale,neighborhood-serving commercial uses.The future land use map is shown in Figure 2-8 <strong>Gorst</strong> UGA Land Use: Alternative 3 and accompanying designationsare shown in Table 2-5 Alternative 3 Future Land Use Designation Descriptions. Figure 2-9 Alternative 3 Percentageof Land Use/Zoning Designations shows the percentage of each land use/zoning designation associated withAlternative 3.<strong>Draft</strong> | June 2013 2-24
FIGURE 2-8 GORST UGA LAND USE: ALTERNATIVE 3Alternative 3 Land Use<strong>Gorst</strong> Mixed UseNeighborhood Mixed UseLow Intensity Waterfront<strong>Gorst</strong> Creek ResidentialOpen Space/RecreationUGA BoundaryCity Limits0 0.1 0.2Date: May 2013Source: Kitsap County, BERKMiles
THIS PAGE INTENTIONALLY BLANK
GORST PLANNED ACTION EIS | ALTERNATIVESTable 2-5Alternative 3 Future Land Use Designation DescriptionsLow Intensity WaterfrontThe low intensity waterfront district allows commercial uses to serve the traveling public in a development patternthat reduces impervious surfaces, promotes shoreline reclamation and open space, promotes landscape andstreetscape improvements, promotes pedestrian safety and comfort, and improves vehicular access. Commercial useswould occur on smaller impervious footprints interspersed by trails, parks, and reclaimed shoreline habitat. Newresidential uses are restricted.<strong>Gorst</strong> Mixed UseThe <strong>Gorst</strong> Mixed Use district promotes mixed uses – retail, hotel, office, services, residential – in horizontal or smallscale vertical patterns-- and regional commercial uses designed to maximize shoreline views and allow streamsidepublic access where appropriate. A more intensive development pattern is found in Central <strong>Gorst</strong> and a less intensivepattern is found on <strong>Gorst</strong> Creek, West Belfair Road, Sam Christopherson Road West, and West Frontage Road/ WestFrone Drive.Neighborhood Mixed UseThis district promotes low and medium density housing including detached single family, attached single family,cottages, townhomes, small scale flats, and accessory dwelling units. Developments are accomplished in anenvironmentally sustainable pattern, such as clustering, LID techniques, energy conservation, and similar methods.Small scale commercial uses that serve local residences are allowed. Public and private open spaces are alsopromoted.<strong>Gorst</strong> Creek Residential<strong>Gorst</strong> Creek Residential district applies to low density residential and large lot residential areas along <strong>Gorst</strong> Creek,where LID and riparian and wetland zone protection are priorities. Clustered development patterns and incentives forstream restoration are promoted.Open Space/RecreationThe Open Space/Recreation designation allows for active and passive parks, recreation, and open space facilities.Secondary uses include accessory commercial such as concessions, recreation equipment rental, and other small-scalefacilities that support and enhance public access and recreation.Source: City of Bremerton and Kitsap County, <strong>Draft</strong> <strong>Gorst</strong> Subarea Plan, June 2013Figure 2-9Alternative 3 Percentage of Land Use/Zoning Designations<strong>Draft</strong> | June2013 2-27
GORST PLANNED ACTION EIS | ALTERNATIVESFuture GrowthAs of 2010, there are approximately 222 persons in the <strong>Gorst</strong> UGA and 1,810 persons in the remainder of thewatershed. There are about 237 jobs in the <strong>Gorst</strong> UGA and roughly 264 jobs in the rest of the watershed, primarilyin SKIA.Excluding the <strong>Gorst</strong> UGA, which is separately addressed below, the employment and residential growth in thewatershed would be from SKIA as well as subdivision of rural residential lots. See Table 2-6 Watershed Populationand Employment 2010 and 2035, Excluding <strong>Gorst</strong> UGA.Table 2-6Watershed Population and Employment 2010 and 2035, Excluding <strong>Gorst</strong> UGAYear 2010 2035Population 1,810 2,659Dwellings 742 1,149Jobs 264 2,305Note:Estimates are based on transportation analysis zone estimates approximating watershed boundaries, and thus mayinclude greater growth than the exact boundaries of the watershed, particularly related to jobs. Job increases arelargely due to traffic model assumptions regarding SKIA growth. Within the portion of SKIA in the watershed, growthwould more likely equal about 600 jobs based on the SKIA Subarea Plan Final EIS (2012) which would mean a future jobtotal in the watershed closer to 865 than 2,305. For conservative analysis purposes, the higher total is studied in this<strong>Draft</strong> EIS.Source: BERK 2013With different land use patterns, each alternative would result in a different level of population and employmentgrowth in the <strong>Gorst</strong> UGA. See Table 2-7 Growth Comparison by <strong>Gorst</strong> UGA Alternative. These growth estimateswould be added to the watershed estimates in Table 2-6 Watershed Population and Employment 2010 and 2035,Excluding <strong>Gorst</strong> UGA. Alternative 1 assumes more employment acres and a smaller residential area, resulting in thegreatest employment growth and least residential growth. Alternative 2 has a focus on commercial growth incentral <strong>Gorst</strong> and greater land designated for residential growth along Sherman Heights and <strong>Gorst</strong> Creek, thusresulting in a moderate amount of employment growth and a greater amount of population growth. Last,Alternative 3, with a greater emphasis on mixed use in central <strong>Gorst</strong> and greater potential for small scale mixeduse providing medium density housing has the greatest amount of population and the least amount of job growth.AlternativeTable 2-7Growth Comparison by <strong>Gorst</strong> UGA AlternativeResidential NetDevelopable Acres Dwellings PopulationEmploymentDevelopableAcresAlternative 1 5.9 33 82 34.7 742Alternative 2 46.9 538 985 22.8 606Alternative 3 56.7 597 1082 12.6 333Source: Kitsap County 2012; BERKWatershed Characterization, Fish Habitat, and StormwaterThe <strong>Gorst</strong> Creek Watershed Characterization Study analyzes existing conditions of the watershed with respect towater flow and habitat. The Watershed Characterization Study recommendation is to protect the north centralportion of the watershed, the tributaries, and the estuary, while allowing for additional growth and developmentin the south, and southeastern portions of the watershed. See Figure 2-10 <strong>Gorst</strong> Watershed Assessment Units:Integrated Results.Jobs<strong>Draft</strong> | June 2013 2-28
FIGURE 2-10 GORST WATERSHED ASSESSMENT UNITS: INTEGRATED RESULTS12City of BremertonWatershed BoundaryUGA BoundaryCity LimitsIntegrated Results204132BremertonWestUGADevelopmentDevelopment 3ADevelopment 3BDevelopment and RestorationProtection1914515<strong>Gorst</strong> UGAProtection and RestorationRestoration 2ARestoration 2BRestoration 2C769<strong>Gorst</strong> UGA Development Addition111713ULID6SKIA UGA168PortOrchardUGA10City of Port Orchard18Date: August, 2011Source: Parametrix, Department of Ecology, Department of Fish & Wildlife, BERK0 0.5 1Miles
THIS PAGE INTENTIONALLY BLANK
GORST PLANNED ACTION EIS | ALTERNATIVESBased on the Watershed Characterization Study, the Watershed Characterization & Framework Plan and <strong>Gorst</strong>Subarea Plan associated with Alternatives 2 and 3 include land use, habitat, and stormwater regulationamendments. A summary of the intent of regulations is shown in Table 2-8 Integrated Watershed Processes andHabitat Results and Management Measures.AU No.Table 2-8Integrated Watershed Processes and Habitat Results and Management MeasuresIntegratedResultsNotes and Suggested Management Measures1 Protection Important area for groundwater discharge for <strong>Gorst</strong> Creek; moderate value for habitat dueto rural development and roads. Despite lower habitat assessment rating, developmentshould be minimized in this area due to its immediate impact upon groundwater dischargeprocesses (roads, ditches, and impervious surfaces alter discharge patterns) and <strong>Gorst</strong> Creekflows.2 Protection Jarstad Creek has the highest salmon refugia score in watershed, so extra measures areneeded to protect water flow processes in this AU. Due to high sediment export potential,logging activities should be limited in this AU. Maintain appropriate zoning for protection.3 Developmentand RestorationRelatively high level of degradation. Not rated by salmon refugia study. More appropriatearea for moderate density development provided measures are implemented to reduceerosion and sediment export (adequate stream buffers, setbacks, reduced overland flowthrough infiltration and vegetation cover).4 Protection For headwaters AU, the processes are essentially intact, with high habitat value; given thesevalues and high sediment export potential it is important to maintain forest cover, limitlogging activities and maintain appropriate zoning for protection.5 Protection Area has some degradation due to roads, but has extensive slope wetlands and groundwaterdischarge critical to <strong>Gorst</strong> Creek. High habitat and salmon refuge value indicates that thisarea should be protected from further degradation. Maintain appropriate zoning forprotection.6 Protection andRestorationSouthern portion of AU has more clearing of forest and should be restored. Maintainappropriate zoning to protect this area.7 Restoration 2A High habitat and salmon refugia scores identify this as a higher priority area to undertakerestoration actions. The golf course has degraded many of the wetlands and water courses(also on AU11); a comprehensive restoration program should be developed to restore theseareas. Maintain zoning to protect open space, rural nature, and increase forest cover.8 Development3AArea of low importance for water flow processes and moderate for habitat; moreappropriate area for moderate to higher density development compared to other AUswithin the <strong>Gorst</strong> Creek Watershed. High sediment export potential requires developmentmeasures that reduce erosions through adequate buffers and setbacks (from steep slopes)and reduction of overland flow through infiltration and plantings (LID measures). Clusteringmay be appropriate in this area in order to minimize potential sediment export impacts.9 Restoration 2C Though this area has a low score for habitat and salmon refugia, it is a higher priority forrestoration due to generally intact upstream processes (northern half of watershed).Channelization, culverts, and reduced riparian cover have degraded stream corridor anddischarge processes. A comprehensive program to restore creek corridor should bedeveloped. Effective Impervious surface should be reduced through a stormwater retrofitprogram.10 RestorationArea 2BLow habitat value due to impacts from adjoining residential area but high salmon refugiascore. Large area of wetlands that play an important role in regulating downstream flow.Wetlands and streams should be protected and restored, with appropriate buffers provided.This is an appropriate area for moderate density development provided clustering approachis used.<strong>Draft</strong> | June2013 2-31
GORST PLANNED ACTION EIS | ALTERNATIVESAU No.IntegratedResults11 RestorationArea 2ANotes and Suggested Management MeasuresHigh habitat and salmon refugia scores identify this as a priority area to undertakerestoration actions. The golf course has degraded many of the wetlands and water courses;a comprehensive restoration program should be developed to restore these areas. Rechargeis the key process to restore. Also restore discharge and storage processes.12 Protection Same as No. 4 Headwaters AU: processes essentially intact, high habitat value. Maintainforest cover and protective zoning.13 Protection Same as No. 4 Headwaters AU: processes essentially intact, high habitat value. Maintainforest cover and protective zoning.14 Protection Same as No. 4 Headwaters AU: processes essentially intact, high habitat value. Maintainforest cover and protective zoning.15 Development Relatively high level of degradation and low habitat score; more appropriate area for higherdensity development provided measures are applied to reduce potential sediment export.16 Development The western edge of this AU is degraded by airport development. It has a moderately highscore for salmon refugia, so the AU stream should be adequately protected (appropriatewidth buffers). More appropriate area for higher density development within the <strong>Gorst</strong>Creek Watershed, provided that streams and wetlands have adequate buffer protection.17 DevelopmentArea 3B18 RestorationArea 2BAlthough the overall assessment for water flow indicated “development,” this area shouldreceive a higher degree of protection based on moderate high habitat value. May be anappropriate area for low-to-moderate density development, provided habitat resources(forest, streams, and wetlands) are protected through use of clustering. Landfill indownstream, northern portion of AU has collapsed the culvert-carrying stream, which givesit priority for restoration.Overall, this AU has a low-to-moderate value for water flow processes and habitat.Appropriate area for moderate density development, provided that existing streams andwetlands receive adequate protection and restoration of wetland storage functions wherethey have been degraded; wetlands will help control downstream erosion in AU8.19 Protection Same as No. 4 Headwaters AU: processes essentially intact, high habitat value. Limit forestryactivities given high sediment export potential. Maintain forest cover and protective zoning.20 Protection Same as No. 4 Headwaters AU: processes essentially intact, high habitat value. Limit forestryactivities given high sediment export potential. Maintain forest cover and protective zoning.Source: City of Bremerton 2012In addition, the Watershed Characterization Study has prompted capital planning intended to address stormwaterand flooding deficiencies and fish passage barriers. A map of stormwater improvement locations is shown in Figure2-11 <strong>Gorst</strong> Creek Watershed: Existing Drainage Deficiencies. Where possible regional stormwater solutions can beconsidered in County and City capital facility plans. Potential improvements on private property would be theresponsibility of the private property owner and would be considered at the time of a development application orother property owner initiative.A map of fish passage barriers and an example proposed recommended improvement along Parish Creek areshown in Figure 2-12 <strong>Gorst</strong> Creek Watershed Planning Area: Fish Passage Barriers and Figure 2-13 Proposed FishPassage Barrier Improvement – Parish Creek, respectively.<strong>Draft</strong> | June 2013 2-32
FIGURE 2-11 GORST CREEK WATERSHED: EXISTING DRAINAGE DEFICIENCIES<strong>Gorst</strong> UGAUNNAMEDSite 15. Fish Rearing Ponds- Water Quality ConcernsSite 14. Kitsap Square Dance- Creek, Property & Roadway FloodingSite 2. Tool Liquidators, Wigmam Tavern& Multiple Residences- Hillside Seepage- Property FloodingW SHERMAN HEIGHTS RDURBAN GROWTH BOUNDARYSOLID LN WW BELFAIR VALLEY RDWBELFAIR VALLEY RDSite 13. Navy City Metals- Water Quality ConcernsSite 16. Residence- Water Quality ConcernsSite 8. Multiple Residences- Property Flooding Site 4. Hwy 3 - Roadway FloodingW JARSTAD DR<strong>Gorst</strong> UGASite 7. Multiple Residences- Property FloodingSTATE HWY 3 WSite 1. Elite Exteriors, Betos Tire- Property FloodingPath: P:\ENV\PROJECTSW\60271862 <strong>Gorst</strong> Subarea Plan\400 Technical Information\423 GIS\3_MXDs\EIS Figures\<strong>Gorst</strong> Creek Identified Infrastructure Deficiencies.mxdDIVISION AVE WW FRONE DRSite 9. Multiple Residences- Hillside Seepage- Water Quality ConcernsBIRCH AVE WFRONE LN WBIRCH AVE WW PLEASANT STHAWTHORNE AVE WHAWTHORNE AVE WWSUMMIT STSite 6. Waldbillig Properties- Creek & Property Flooding- Streambank ErosionTHORSON RD WSite 12. Lumber Yard- Creek & Property FloodingW ALDER STIAN DRW OB ROLYMPIC DR WSite 5. Multiple Residences- Creek Flooding- Water Quality ConcernsW FRONTAGE RDFEIGLEY RD WAHERN CT WSite 10. Feigley Rd- Roadway FloodingURBAN GROWTH BOUNDARYW BENS LNSite 3. Peninsula Subaru- Sink Hole0 500 1,000 Feet¯Site 11. Mattress Factory- Sink HoleCAMPUS PKWYW STATE HWY 16
THIS PAGE INTENTIONALLY BLANK
FIGURE 2-12 GORST WATERSHED PLANNING AREA: FISH PASSAGE BARRIERSUnion RiverBremertonWestUGAHeins CreekCity of Bremerton<strong>Gorst</strong> Creek<strong>Gorst</strong> UGACity of BremertonSKIA UGAParish CreekULID6Anderson CreekCity of Port OrchardBremerton NationalAirportCoulter CreekSquare CreekWatershed BoundaryUGA BoundaryCity LimitsWaterWetland (WDFW/NWI)StreamsWDFW Documented Fish PresenceHatcheryDamCulvertOther Fish BarrierDate: March 2013Source: Parametrix, Department of Natural Resources, Department ofFish and Wildlife, BERK0 0.5 1Miles
THIS PAGE INTENTIONALLY BLANK
FIGURE 2-13 PROPOSED FISH PASSAGE BARRIER IMPROVEMENT - PARISH CREEKDate: May 2013Source: Parametrix, Department of Ecology, Department of Fish & Wildlife, BERK
THIS PAGE INTENTIONALLY BLANK
GORST PLANNED ACTION EIS | ALTERNATIVES<strong>Planned</strong> <strong>Action</strong>SEPA provides a planned action process to facilitate proposals in UGAs (WAC 197-11-164 to 172). A planned actionprovides more detailed environmental analysis during an area wide planning stage rather than at the projectpermit review stage. Designating a planned action streamlines environmental review for development proposalsconsistent with EIS mitigation measures that are adopted in a planned action ordinance. <strong>Planned</strong> actions would beallowed if they meet or exceed proposed land use and environmental performance standards. This tool has beenused elsewhere by local governments in Washington State, including Bremerton (e.g. SKIA). The City of Bremertonand Kitsap County are considering designating a planned action for the <strong>Gorst</strong> UGA. 3 Some <strong>Gorst</strong> land usealternatives may vary which areas are included in the planned action (Alternative 2 all areas in UGA exceptwaterward of SR 3 and SR 16; Alternative 3 all lands in the UGA).If the planned action ordinance is adopted, the City of Bremerton and Kitsap County would follow the applicableprocedures contained in the ordinance to determine if the proposed project impacts are consistent with the<strong>Planned</strong> <strong>Action</strong> EIS. When a permit application and environmental checklist are submitted for a project that isbeing proposed as a planned action project, the City of Bremerton and Kitsap County must first verify thefollowing:• The project meets the description of any project(s) designated as a planned action by ordinance or resolution.• The probable significant adverse environmental impacts were adequately addressed in the EIS.• The project includes any conditions or mitigation measures outlined in the ordinance or resolution.If the project meets the above requirements, the project qualifies as a planned action project and a SEPA thresholddetermination is not required. See Figure 2-14 <strong>Planned</strong> <strong>Action</strong> Process, a flow chart of the <strong>Planned</strong> <strong>Action</strong> process.Appendix B <strong>Draft</strong> <strong>Planned</strong> <strong>Action</strong> Ordinance contains a draft of the planned action ordinance including theinformation on the draft process and the parameters used to determine consistency with EIS assumptions.3 Another option is to have some land use and environmental standards (for example, the <strong>Planned</strong> <strong>Action</strong>Ordinance) become effective only upon annexation to encourage annexation, which is a Growth Management goalreflected in Kitsap County’s assignment of the UGA to the City.<strong>Draft</strong> | June2013 2-39
GORST PLANNED ACTION EIS | ALTERNATIVESFigure 2-14 <strong>Planned</strong> <strong>Action</strong> Process2.6 Future AlternativesThe intent of the EIS alternatives is to compare natural and built environment impacts and provide thatinformation to decision makers, citizens, and other agencies. It is anticipated that following the <strong>Draft</strong> EIS commentperiod; the City of Bremerton in consultation with the Kitsap County, Tribe and other agency partners wouldconsider public comment and develop a Preferred Alternative for study in the Final EIS. The Preferred Alternativecould be a mix and match of different features of each <strong>Draft</strong> EIS Alternative. The final plan that would ultimately beadopted would not be exactly one of the EIS alternatives, but would fall within the range of the alternativesanalyzed in the EIS.2.7 Benefits and Disadvantages of Delaying a Proposed <strong>Action</strong>The Proposal includes the adoption of a Watershed Characterization & Framework Plan, a new <strong>Gorst</strong> Subarea Plan,and a planned action ordinance for future development in the <strong>Gorst</strong> UGA. Delaying implementation of theProposal would delay the potential impacts identified in this <strong>Draft</strong> EIS, including potential changes to growth andair emissions, land use patterns, changes to visual character, increased investment in transportation andstormwater infrastructure, and increased demand for public services and utilities.If the Proposal is not adopted, there would be less incentive for environmental restoration along Sinclair Inlet and<strong>Gorst</strong> Creek. There would be less redevelopment and a longer pace to change to newer stormwater standards thatmay benefit water quality. Design guidelines associated with the subarea plan would not implemented, and themixed and haphazard character of development patterns could continue.<strong>Draft</strong> | June 2013 2-40
GORST PLANNED ACTION EIS | ALTERNATIVES2.8 Major Issues to Be ResolvedAdoption of the <strong>Gorst</strong> Subarea Plan would support development and redevelopment of the area to a moreintensive commercial, residential, and mixed use character consistent with the vision of the <strong>Gorst</strong> Subarea Plan,while at the same time promoting environmental protection and enhancement. Key environmental issues facingdecision makers include potential increases in growth and associated air and GHG emissions, conversion of landuse patterns, changes to visual character, stormwater and transportation infrastructure investments, andincreased demand for public services and utilities.<strong>Draft</strong> | June 2013 2-41
THIS PAGE INTENTIONALLY BLANK
GORST PLANNED ACTION EIS | AFFECTED ENVIRONMENT, SIGNIFICANT IMPACTS, AND MITIGATION MEASURES3.0 AFFECTED ENVIRONMENT, SIGNIFICANT IMPACTS, ANDMITIGATION MEASURESThis chapter describes the affected environment, potential impacts, and mitigation measures for the followingenvironmental topics:• 3.1. Geology/Soils• 3. 2. Water Resources• 3.3. Air Quality• 3.4. Plants and Animals• 3.5. Noise• 3.6. Hazardous Materials• 3.7. Land Use Patterns• 3.8. Socio-Economics• 3.9. Aesthetics• 3.10. Cultural Resources• 3.11. Transportation• 3.12 Public Servicesooooo3.12.1 Fire Protection and EMS3.12.2 Law Enforcement3.12.3 Schools3.12.4 Parks, Recreation, and Open Space3.12.5 Libraries• 3.13 Utilitiesoooo3.13.1 Power3.13.2 Solid Waste3.13.3 Water, Wastewater, and Stormwater3.13.4 Telecommunications• 3.14 Relationship to Plans and PoliciesFollowing a description of current conditions (affected environment) the analysis compares and contrasts thealternatives and provides mitigation measures for identified impacts. It also summarizes whether there aresignificant unavoidable adverse impacts.<strong>Draft</strong> | June 2013 3-1
GORST PLANNED ACTION EIS | AFFECTED ENVIRONMENT, SIGNIFICANT IMPACTS, AND MITIGATION MEASURES3.1 Geology/SoilsAffected EnvironmentGEOLOGYWatershedThe study area lies within the Puget Trough physiographic province (Franklin and Dyrness 1988). The area wasinfluenced by glacial activity 13,000 to 15,000 years ago. Soil parent material is predominantly glacial till;compacted glacial till is covered by a thin layer of ablation till. It is underlain by sediments deposited duringprevious glacial or interglacial periods. In the northern portion of the watershed, thin deposits of till occur overbasalt bedrock associated with mountain slopes (United States Department of Agriculture [USDA] SoilConservation Service 1980). In the northern portion of the watershed, a large deposit of recessional outwashconsisting of fine-grained sand occurs, which has an important role in the recharge, storage, and discharge ofwater. The southern portion of the watershed consists primarily of Vashon Till, which has low permeability and lowrates of recharge and discharge (Sceva 1957 in City of Bremerton 2012).The following geologic units have been mapped within the study area (City of Bremerton 2011) (Figure 3.1-1 <strong>Gorst</strong>Creek Watershed: Geology):• Qa – Alluvium• Qga – Advance continental glacial outwash, Fraser-age• Qgo – Continental glacial outwash, Fraser-age• Qgt – Continental glacial till, Fraser-age• Qp – Peat deposits• Qgd – Continental glacial drift, Fraser-age• Qgu – Glacial drift, undivided• Qf – Artificial fill, including modified land• Ev(c) – Basalt flows and flow breccias, Crescent Formation<strong>Gorst</strong> UGAGeology in the northeast portion of the UGA is typified by basalt flows and flow breccias. The remainder of theUGA is typified by continental glacial outwash.<strong>Draft</strong> | June 2013 3-2
Lake UnionReservoirQgdQaQgoQgoBremertonQgtHeinsEv(c)CreekJarstad CreekEv(c)QgtQgaQgoBremerton West UGAQgoUnnamed Stream 1227399475259TwinLakesUnion RiverSKIA UGASKIA UGA QgaQgoQgtUnnamed Stream1227493475317QgdGold MountainGolf ClubBremertonNationalAirport<strong>Gorst</strong>CreekUnnamed Stream1227418475110QgaQgoSKIA UGAParish Creek<strong>Gorst</strong>CreekSinclairInlet 16 Qf Qa 16616QguQga 3 BremertonUnnamed Stream 1227181475299ULID6ULID6QpULID6<strong>Gorst</strong> Tributary 1Unnamed Stream 1226919475271Port OrchardQaQp<strong>Gorst</strong> UGAQaUnnamed Stream 1226824475230Port OrchardQaAndersonCreekBlackjack CreekPath: P:\ENV\PROJECTSW\60271862 <strong>Gorst</strong> Subarea Plan\400 Technical Information\423 GIS\3_MXDs\EIS Figures\Geology.mxdQp Qp QpQpQpQp¯0 0.5 1 Miles
THIS PAGE INTENTIONALLY BLANK
GORST PLANNED ACTION EIS | AFFECTED ENVIRONMENT, SIGNIFICANT IMPACTS, AND MITIGATION MEASURESGEOLOGIC HAZARDSWatershedGeologically Hazardous Areas, as defined by the Kitsap County CAO, and the City of Bremerton CAO, are areas thatbecause of their susceptibility to erosion, sliding, earthquake, or other geological events are difficult locations tosite commercial, residential, or industrial development, consistent with public health or safety concerns. Withinthe <strong>Gorst</strong> watershed, mapped Geologically Hazardous Areas include numerous moderate hazard areas, which haveslopes of 15 to 30 percent and/or other geologic issues, and a few high hazard areas, which have slopes of greaterthan 30 percent and are unstable (Kitsap County 2007). Characteristics of instability may include unstable soils,groundwater seeps or springs, erosion hazards, or seismic hazards. The moderate hazard areas, or areas ofconcern, occur predominantly in the northern portions of the watershed, as well as along stream channels in thesouthern portion of the watershed. The high hazard areas all occur in the southern two-thirds of the watershed,and are associated with steep slopes along Parish Creek, a portion of <strong>Gorst</strong> Creek, and several unnamed streamchannels.<strong>Gorst</strong> UGAModerate geologic hazard areas cover much of the northeast portion of the <strong>Gorst</strong> UGA. No high hazard areas havebeen mapped within the UGA.SOILSWatershedA breakdown of soil types within the study area is presented in Table 3.1-1 Soil Types in the <strong>Gorst</strong> Creek Watershedand <strong>Gorst</strong> UGA, and Their Associated Construction Limitations and Erosion Hazard Potential. Within the watershed,gravelly loams and sandy loams predominate. Alderwood very gravelly sandy loams and Harstine gravelly sandyloams, which occur on glacial till plains and moraines, are prevalent in the southern half of the watershed. Kilchisvery gravelly sandy loams occur over basalt on mountain slopes and Ragnar fine sandy loam occurs on terraces inthe northern half of the watershed.Flooding of streams and associated export of sediment as result of water erosion during rain events have beenidentified as problems within the watershed that may be exacerbated by future cutting of trees and creation ofadditional impervious surface. Table 3.1-1 Soil Types in the <strong>Gorst</strong> Creek Watershed and <strong>Gorst</strong> UGA, and TheirAssociated Construction Limitations and Erosion Hazard Potential summarizes the erodibility of soils within thewatershed. On slopes of less than 15 percent, runoff from Alderwood soils is slight, and the erosion hazard is low.On slopes of 15 to 30 percent, the runoff increases to medium, and the erosion hazard is moderate. Althoughpermeability of Kilchis gravelly sandy loams is moderately rapid, these soils occur on slopes from 15 to 70 percent,therefore runoff is rapid and the erosion hazard is moderate to severe. For Ragnar fine sandy loams, the erosionhazard in flat areas is moderate, increasing to severe at slopes greater than six percent. For Harstine gravelly sandyloams, erosion hazard ranges from slight to moderate, depending on the slope.<strong>Gorst</strong> UGAWithin the UGA, previously developed urban land, and Alderwood (urban land-Alderwood complex), Indianola,Kilchis, Ragnar, and Norma soils are most prevalent.• Alderwood soils occur primarily in relatively flat areas near the Sinclair Inlet along State Route 3 and StateRoute 16, which already support extensive development. These soils are suited to urban development ifcommunity sewer systems are present. The main limitations are the silica-cemented hardpan at a depth of 20to 40 inches and a seasonal perched water table at a depth of 2.5 to 3 feet.<strong>Draft</strong> | June 2013 3-5
GORST PLANNED ACTION EIS | AFFECTED ENVIRONMENT, SIGNIFICANT IMPACTS, AND MITIGATION MEASURES• Indianola loamy sands occur in the southwest portion of the UGA, and include a large portion of the highintensity development in this area. The soil is easily excavated, and in flat areas can support high densitydevelopment and on-site sewage disposal systems.• Kilchis very gravelly sandy loams occur in the hills in the north portion of the UGA, and are mapped as having30 to 70 percent slopes. They are shallow soils, with depth to basalt bedrock of 16 to 20 inches. The shallowdepth to bedrock and steep slopes present severe limitations for development.• Ragnar fine sandy loams occur in flat areas within the northwest portion of the UGA. These deep, well-drainedsoils are well suited to urban development.• Norma fine sandy loams occur in the floodplain of <strong>Gorst</strong> Creek, and in other low areas in the south half of theUGA. These hydric soils have a high water table and pond runoff, making them poorly suited to developmentand on-site sewage systems.Based on the soil survey for the area, approximately 28 percent of the <strong>Gorst</strong> UGA is mapped as having a slope ofgreater than 15 percent. In these areas, moderate to steep slopes present challenges to constructability (USDA SoilConservation Service 1980).Table 3.1-1Soil Types in the <strong>Gorst</strong> Creek Watershed and <strong>Gorst</strong> UGA, and Their Associated ConstructionLimitations and Erosion Hazard PotentialMap UnitAlderwood Very GravellySandy LoamKilchis Very Gravelly SandyLoamAcres inWatershed 1Acres inUGA1,109 01,006 50Ragnar Fine Sandy Loam 986 33 SlightHarstine Gravelly SandyLoamSchneider Very GravellyLoam737 25Indianola Loamy Sand 332 53Kitsap Silt Loam 317 28Constructability ofUGA Soils(Limitations forBuilding and StreetDevelopment)Slight to severe,depending on slopeSevere (shallow depthto rock)Moderate to severe(wetness)356 0 Severe (steep slopes)Slight to severe,depending on slopeModerate to severe(wetness)Dystric Xerothents 249 4 Severe (steep slopes) HighIndianola-Kitsap Complex 256 5See information forIndianola and Kitsapmap units.Neilton Gravelly Loamy Sand 255 0 Slight to severe, SlightErodibility/Erosion HazardSlight – less than 15 percentslope; moderate – 15 to 30percent slopeModerate to severe (rapidrunoff)Moderate – less than 6 percentslope; severe – greater than 6percent slopeSlight – less than 15 percentslope; moderate – 15 to 30percent slopeSevere (rapid runoff)Slight – less than 6 percentslope; moderate – 6 to 10percent slopeSlight – less than 8 percentslope; moderate – 8 to 15percent slope; severe – greaterthan 15 percent slopeSee information for Indianolaand Kitsap map units.<strong>Draft</strong> | June 2013 3-6
GORST PLANNED ACTION EIS | AFFECTED ENVIRONMENT, SIGNIFICANT IMPACTS, AND MITIGATION MEASURESMap UnitAcres inWatershed 1Acres inUGAConstructability ofUGA Soils(Limitations forBuilding and StreetDevelopment)depending on slopeErodibility/Erosion HazardMcKenna Gravelly Loam 162 0 Severe (ponding) None (water is ponded)Kilchis-Shelton Complex 130 0Severe (shallow depthto rock, wetness, slope)Norma Fine Sandy Loam 119 31 Severe (ponding) SlightUrban Land-AlderwoodComplex(0 to 8 percent slope)55 55Slight to moderate(wetness, cementedpan, slope)Water 49 2 NA NAPits 32 32 NA NAShalcar Muck 14 0Severe (ponding, lowstrength)Tacoma Silt Loam 11 11 Severe (floods, wetness) NoneNote:1 Watershed refers to the entire <strong>Gorst</strong> Creek Watershed, inclusive of the UGA.Source: USDA Soil Conservation Service 1980; USDA Natural Resources Conservation Service 2013a,b<strong>Impact</strong>s<strong>Impact</strong>s Common to All AlternativesWatershedSevere (very rapid runoff)Slight; moderate on slopes(slow runoff)None to slight (water is ponded)Under all alternatives, development would occur throughout the <strong>Gorst</strong> watershed, to varying degrees as allowedby zoning and applicable regulations. As discussed in Section 2.5 Study Alternatives: Future Growth, it is assumedthat most development outside of city limits and designated UGAs would be associated with residential dwellings,with less than 500 new dwellings constructed over the next 20 years. Creation of impervious surface would resultin a long-term loss of soil functions within affected areas, and could lead to increased surface water runoff anderosion of soils in adjacent areas. Removal of trees and other vegetation within these areas could also lead toreduced infiltration and erosion of exposed soils from affected sites. Water erosion of soils by stormwater wouldbe the biggest risk, resulting in movement of soil downslope and downstream, and potential loss of soil from thewatershed. In all cases, risks of soil erosion associated with development and other land clearing activities wouldbe greatest on slopes and in areas with highly erodible soils. Additionally, use of heavy equipment for clearing andconstruction activities could result in compaction of soils. Risks of compaction would vary depending on thephysical characteristics of the soil. During construction and operation of new dwellings, there would be risks forlocalized contamination of soils through releases of fuels and other hazardous materials associated with vehiclesand development activities. Stormwater plans, BMPs, and Spill Prevention Control and Countermeasure (SPCC)plans would help minimize these impacts to varying degrees.Given that geologic hazards and unstable soil conditions occur throughout the watershed, future developmentwould have the potential to impact slope stability. However, because of the challenges to construction presentedby slopes, it is expected that development in these areas would be minimal.It is assumed that under all alternatives, future development projects would receive the appropriate permits, andthat buffers, development standards, and other mitigation measures pertaining to slope stability and prevention oferosion would be implemented.<strong>Draft</strong> | June 2013 3-7
GORST PLANNED ACTION EIS | AFFECTED ENVIRONMENT, SIGNIFICANT IMPACTS, AND MITIGATION MEASURES<strong>Gorst</strong> UGAUnder all alternatives, most impacts to soils would occur within the <strong>Gorst</strong> UGA, where the majority of planneddevelopment would be focused. Within the UGA, development could occur within the 281 parcel acres identifiedin Table 3.1-1 Soil Types in the <strong>Gorst</strong> Creek Watershed and <strong>Gorst</strong> UGA, and Their Associated ConstructionLimitations and Erosion Hazard Potential, although the types of development would vary by alternative.Additionally, it is unlikely that all currently developed areas would be redeveloped within the next 20 to 30 years.Potential impacts associated with construction activities within the UGA would be similar to those described forthe watershed, although creation of new impervious surface would be a smaller factor in the UGA. The potentialfor loss of soil through erosion, soil compaction, and soil contamination would be present, all of which would havethe potential to be minimized, to varying degrees by pertinent plans and BMPs.<strong>Planned</strong> development within the UGA would potentially result in a long-term loss of soil functions over a smallarea if currently undeveloped areas are developed in the future. It is expected that the total area of impervioussurface could increase within the UGA, leading to increased soil erosion. Future development within the UGAwould have the potential to impact slope stability in steep areas.Alternative 1Based on the information in Table 2-7 Growth Comparison by <strong>Gorst</strong> UGA Alternative, a total of approximately 41developable acres within the UGA have been identified under Alternative 1. In addition to these developableparcel acres, some land would be modified in existing or future rights of way or on lands for public purposesTherefore, in addition to future projects on already developed parcels, sites that currently do not supportdevelopment would likely be altered. Creation of impervious surface would result in the loss of soils on up to 41acres, as well as the functions that they provide (e.g., ability to support native plant species and other vegetation,and infiltration of water), and could contribute to increased erosion of soils.Under this alternative, sand, gravel, and rock deposits would continue to be mined from the area identified withthe mineral resources overlay in Figure 3.1-1 <strong>Gorst</strong> Creek Watershed: Geology. This ongoing activity would result inthe permanent loss of these mineral resources from the region.Under this alternative, existing regulations and plans to minimize soil erosion, impacts to steep or unstable slopes,and soil contamination would continue to be tied to permitting for new development/redevelopment projects inthe watershed and the UGA (discussed under Applicable Regulations and Commitments in the MitigationMeasures discussion for this section). These regulations and guidelines are effective at minimizing impacts tosteep/unstable slopes, preventing contamination of soils, and minimizing loss of soil from construction sites.Additionally, adoption of the LID guidance manual will help guide new development such that the amount ofeffective impervious surface on a site is reduced. Within the UGA, redevelopment would likely result in an overallreduction in effective impervious surface. On a larger scale, however, shortcomings that have been identified instormwater management throughout the watershed would continue to have a negative impact on surface waterand stormwater flows, leading to ongoing erosion and removal of soil from the watershed.As the Watershed Characterization & Framework Plan would not be implemented under this alternative, therewould be no watershed-level plan for future development identifying protection and restoration zones andassociated actions/restrictions to limit flooding, water erosion, and movement of soil. Development within thewatershed would continue to be haphazard, and despite existing regulations and guidance, soil erosion within thewatershed may increase as a result of new development.Alternative 2A total of approximately 70 developable acres have been identified for Alternative 2. In addition to thesedevelopable parcel acres, some land would be modified in existing or future rights of way or on lands for publicpurposes. Therefore new development on currently undeveloped parcels would result in the long-term loss of soilsand their functions on up to 70 acres, which is greater than that under Alternative 1. However, this alternative<strong>Draft</strong> | June 2013 3-8
GORST PLANNED ACTION EIS | AFFECTED ENVIRONMENT, SIGNIFICANT IMPACTS, AND MITIGATION MEASURESwould include low and medium density residential areas, which would retain some impervious surface for yardsassociated with dwellings. Additionally, small areas of open space and recreation would be maintained. Therefore,the total loss of soil would be less than the full 70 acres. Creation of new impervious surface could contribute toincreased erosion of soils.Under this alternative, the area that is currently used for mineral resource extraction would be developed intoMedium Density Residential with a mix of housing types. This area includes a large moderate geologic hazard area,as well as large coverage of soils with severe limitations for building and street development. Therefore,construction activities in this area could require substantial mitigation, including project design to minimizeimpacts to soils and geologic resources.Under this alternative, existing regulations and plans to minimize soil erosion, impacts to steep or unstable slopes,and soil contamination would continue to apply, but may be revised in the future based on the recommendationsin the <strong>Gorst</strong> Stormwater Management Plan, <strong>Gorst</strong> Subarea Plan, and <strong>Gorst</strong> Creek Watershed Characterization &Framework Plan, which would be implemented under this alternative. Within the UGA, efforts to minimizeimpervious surface in developed/redeveloped areas would likely result in an overall reduction in effectiveimpervious surface. On a watershed scale, planned improvements to stormwater facilities, stream restoration, andprotection of key recharge/discharge/storage areas, if implemented, would help to minimize the impacts of newdevelopment and associated erosion, and would likely result in a reduction in flooding and export of soils from thewatershed.Alternative 3The area of developable land identified for Alternative 3 is approximately 69 acres, roughly the same as underAlternative 2, but greater than under Alternative 1. In addition to these developable parcel acres, some land wouldbe modified in existing or future rights of way or on lands for public purposes. This alternative includes the sameamount of open space as Alternative 2, as well as low intensity waterfront, which reduces impervious surfaces andpromotes shoreline reclamation and open space. Therefore some soil functions would be retained within thedevelopable land, much like under Alternative 2.Under this alternative, the area that is currently used for mineral resource extraction would be developed intoNeighborhood Mixed Use. As under Alternative 2, the geologic hazard area and soils with limitations on buildingand street development would provide challenges to planned development in this area. Construction activitiescould require substantial mitigation, including project design to minimize impacts to soils and geologic resources.Under this alternative, the <strong>Gorst</strong> Stormwater Management Plan, <strong>Gorst</strong> Subarea Plan, and <strong>Gorst</strong> Creek WatershedCharacterization & Framework Plan would be implemented, as under Alternative 2. Existing regulations and plansto minimize soil erosion, impacts to steep or unstable slopes, and soil contamination would continue to apply, butmay be revised in the future based on the recommendations in listed plans, which would be implemented underthis alternative. Within the UGA, efforts to minimize impervious surface in developed/redeveloped areas wouldlikely result in an overall reduction in effective impervious surface, particularly along Sinclair Inlet with the LowIntensity Waterfront designation. On a watershed level, successful implementation of the recommendations withinthese plans would help minimize any potential erosion increases associated with new watershed development,and would likely result in a reduction in flooding and export of soils from the watershed.Mitigation MeasuresIncorporated Plan FeaturesNew plans that would be implemented under Alternatives 2 and 3 include features that would serve as mitigationfor potential impacts to soils and geologic resources. Implementing regulations associated with the <strong>Gorst</strong> SubareaPlan, and <strong>Gorst</strong> Creek Watershed Characterization & Framework Plan would incorporate the suggested<strong>Draft</strong> | June 2013 3-9
GORST PLANNED ACTION EIS | AFFECTED ENVIRONMENT, SIGNIFICANT IMPACTS, AND MITIGATION MEASURESmanagement measures shown in Table 2-8 Integrated Watershed Processes and Habitat Results and ManagementMeasures.Possible plan features that would serve as mitigation for potential impacts to soil include the following:• Minimization of new development in certain areas.• Limiting logging activities and maintain appropriate zoning in areas with high sediment export.• Implementation of measures to reduce erosion and sediment export in areas identified for futuredevelopment (e.g., buffers, setbacks from steep slopes, reduction of overland flow through infiltration).• Restoration of cleared/degraded areas.• Implementation of stormwater retrofits to reduce impervious surface.Additionally, capital facility improvements have been recommended for addressing stormwater deficiencies andflooding issues. Implementation of these improvements would help reduce soil erosion and loss of soil from thewatershed. Based on policies in the proposed <strong>Draft</strong> <strong>Gorst</strong> Subarea Plan and <strong>Draft</strong> <strong>Gorst</strong> Creek WatershedCharacterization & Framework Plan implementing regulations could include a zero stormwater dischargerequirement limiting direct and untreated stormwater and a requirement that future development incorporate aseries of LID measures to infiltrate or detain runoff.Applicable Regulations and CommitmentsKitsap County CAO. Unincorporated portions of the watershed are under the jurisdiction of the Kitsap County CAO.These regulations may require a geologic or geotechnical report to be done to determine whether an areaproposed for development is a geologically hazardous area or area of geologic concern. A minimum buffer of 25feet beyond the top of the slope is required in all geologically hazardous areas, with larger buffers andbuilding/impervious surface setbacks required depending on the site and the degree of the hazard.City of Bremerton CAO. The majority of the watershed is under the jurisdiction of the City of Bremerton CAO.Additionally, the current <strong>Gorst</strong> UGA is likely to be under the jurisdiction of the City of Bremerton CAO as a result ofannexation within the time period covered by this EIS. All development projects with the potential to affect criticalareas in areas under the City of Bremerton’s jurisdiction require review for compliance with the CAO. The CAOprovides development standards that apply to geologically hazardous area, including buffers between steep slopesand structures/impervious surfaces. Applicants are required to mitigate for development in geologically hazardousareas by incorporating design techniques that minimize impacts to steep or unstable slopes and the risksassociated with these areas.KCC Chapter 12, Stormwater Drainage, and Kitsap County Stormwater Design Manual. Construction within areasunder Kitsap County jurisdiction is regulated by KCC Title 12. This section of the KCC requires erosion andsedimentation control measures for minor and major development, with major development requiring anapproved erosion and sedimentation control plan. This section of the code also requires that all site developmentactivities comply with the standards, specifications, and requirements of the Stormwater Design Manual. Minimumrequirements for major development include stabilization of exposed soils, slope stabilization, controls of off-siteerosion, as well as other requirements.BMC Chapter 15, SWMMWW and LID Guidance Manual. BMC Section 15 provides regulations for stormwatermanagement associated with new development and redevelopment. The code contains minimum requirementsfor small parcels and large developments, which includes BMPs and other means of controlling erosion andsediment during construction, permanently stabilizing soil during construction, and preparing a stormwatermanagement plan.The City of Bremerton has adopted the SWMMWW as the guiding criteria for planning, design, and construction ofstormwater facilities in Bremerton. The City of Bremerton has also adopted the LID Guidance Manual for Kitsap<strong>Draft</strong> | June 2013 3-10
GORST PLANNED ACTION EIS | AFFECTED ENVIRONMENT, SIGNIFICANT IMPACTS, AND MITIGATION MEASURESCounty. These manuals were adopted in August 2009, and apply to new construction within the City of Bremertonsince that time. The SWMMWW provides guidance on measures necessary to control the quantity and quality ofstormwater produced by new development and redevelopment. Aspects of stormwater control that pertain to soilerosion include guidance for controlling erosion and sedimentation. The SWMMWW includes appropriateminimum requirements and BMPs, including those for short-term control of stormwater from construction sitesand long-term management of stormwater at developed sites. The LID guidance manual provides guidance onselecting and implementing LID stormwater BMPS that reduce the amount of effective impervious surface on asite.Other Potential Mitigation MeasuresNo additional mitigation measures are proposed for soil and geologic resources.Significant Unavoidable Adverse <strong>Impact</strong>sUnder all of the alternatives, future development would lead to the loss of currently undeveloped soils within theUGA, which will eliminate their ability to support other uses. The area of land that is currently undeveloped butwould be available for development ranges from 41 to 70 acres, depending on the alternative, plus land modifiedin existing or future rights of way or on lands for public purposes. While the total acreage of soil lost is likely to beless than the acreage of developable acres, it would constitute an unavoidable adverse impact.Under all alternatives, loss of soil from the watershed is likely to continue to occur as a result of flooding andstormwater runoff. Over the long term, these impacts would be greatest under Alternative 1, and lower underAlternatives 2 and 3.Non-renewable mineral resources would continue to be extracted from the study area on an indefinite basis underAlternative 1, and on an interim basis under Alternatives 2 and 3. This ongoing extraction would constitute a longtermloss of these resources, although the material would be used for commercial purposes as intended by theGMA.<strong>Draft</strong> | June 2013 3-11
GORST PLANNED ACTION EIS | AFFECTED ENVIRONMENT, SIGNIFICANT IMPACTS, AND MITIGATION MEASURES3.2 Water ResourcesThe following section describes the watershed setting, hydrology, and the ground and surface water features inwatershed and <strong>Gorst</strong> UGA; applicable plans, policies, regulations, and laws pertaining to work in or near waterwaysand the protection of water quality; and the effects of the project alternatives on water resources. Stormwater isdescribed in Section 3.13.3 Water, Wastewater, and Stormwater. Water resources information was collected fromthe <strong>Gorst</strong> Creek Watershed Characterization Report (City of Bremerton 2012), <strong>Gorst</strong> Creek Watershed Inventoryand Characterization Technical Memorandum (City of Bremerton 2011), and Kitsap County’s 2013-2025 CFP (KitsapCounty 2012).Affected EnvironmentWatershedThe <strong>Gorst</strong> watershed is located in the Kitsap Basin (Water Resource Inventory Area [WRIA] 15) and within the 5thfield Hydrologic Unit Code (HUC) 1711001901. Streams in the <strong>Gorst</strong> Watershed drain to Puget Sound and theSinclair Inlet and are typical lowland type streams with moderate gradients. Most streams originate from lakes,headwater wetlands, or seepage from groundwater discharge. The watershed is approximately 6,000 acres in thesouthwestern portion of Kitsap County and mostly undeveloped. Approximately 3,000 acres are forested landowned by the City of Bremerton of Bremerton and zoned as CUL. The intent of the CUL zone is to preserveresource-related functions of land, and to protect watersheds and timberlands. Approximately 120 acres aredeveloped (City of Bremerton 2012). A detailed description of land use and zoning is provided in Section 3.7 LandUse Patterns. Although the watershed includes industrial development in the SKIA UGA and scattered ruralresidence in the Sunnyslope area, most of the development is found in the lower watershed within the <strong>Gorst</strong> UGA.Hydrology and Water QualityDrainages in the <strong>Gorst</strong> watershed are relatively smaller in comparison to other watersheds in the region and flowsare dependent on precipitation and groundwater contribution, as the drainages do not receive snowmelt fromeither the Olympic or Cascade Mountains. Major water features in the watershed include two small lakes (Twinand Alexander), several small streams, and an estuary (Sinclair Inlet) (Figure 3.2-1 <strong>Gorst</strong> Creek Watershed: WaterResources). Sinclair Inlet is described in the <strong>Gorst</strong> UGA section. <strong>Gorst</strong> Creek is the primary drainage feature for thewatershed and had three major tributaries Heins, Jarstad, and Parish creeks.<strong>Gorst</strong> Creek is approximately four-miles-long and originates in the Sunnyslope area from a headwater wetlandcomplex (southern portion of the watershed). The headwaters of <strong>Gorst</strong> Creek are generally flat with a relativelynarrow riparian buffer that is constrained by rural residences, Sunnyslope Road SW, and SR 3. The middle reach isundeveloped with a riparian buffer in good condition. The lower reach is in the <strong>Gorst</strong> UGA and described in thebelow. The <strong>Gorst</strong> Creek Salmon Rearing Facility, jointly operated with the Suquamish Tribe, WDFW, and KitsapPoggie Club, is located approximately 0.75 mile upstream from the mouth of <strong>Gorst</strong> Creek at Sinclair Inlet (City ofBremerton 2011).Heins Creek is approximately two miles long and originates from Alexander Lake in the northern portion of thewatershed and is relatively straight and drains to <strong>Gorst</strong> Creek. Heins Lake contributes flow to the <strong>Gorst</strong> watershedbut is part of the larger basin outside of the study area and not described in the <strong>Draft</strong> EIS. Heins Creek isundeveloped with a riparian buffer that is constrained by a railroad grade. Heins Creek is in good condition (Mayand Peterson 2003). Jarstad Creek is 1.5-miles-long and also in the north portion of the watershed. The riparianbuffer is only disturbed by forest roads and a transmission line corridor. Jarstad Creek has the greatest value forsalmon conservation in the watershed (May and Peterson 2003). Parish Creek is 2-miles-long and originates in thesouthern portion of the watershed in the Sunnyslope area. Parish Creek has a moderately steep gradient and flownorth through a ravine eventually draining to <strong>Gorst</strong> Creek. Parish Creek has flooding issues near the confluencewith <strong>Gorst</strong> Creek related to the culvert under West Belfair Valley Road.<strong>Draft</strong> | June 2013 3-12
City UtilityLandsBremerton West UGA<strong>Gorst</strong> UGAPort Orchard UGASKIA UGASunnyslopeAreaULID6ULID6SKIA UGASKIA UGAPath: P:\ENV\PROJECTSW\60271862 <strong>Gorst</strong> Subarea Plan\400 Technical Information\423 GIS\3_MXDs\EIS Figures\Water Resources.mxd¯ULID6McCormickWoods Area0 0.5 1 Miles
THIS PAGE INTENTIONALLY BLANK
GORST PLANNED ACTION EIS | AFFECTED ENVIRONMENT, SIGNIFICANT IMPACTS, AND MITIGATION MEASURESThe major groundwater source in the watershed is the <strong>Gorst</strong> aquifer. Several wellhead protection areas arescattered throughout the watershed. A large deposit of recessional outwash consisting of fine-grained sand (Sceva1957) dominates the northern portion of the <strong>Gorst</strong> Creek Watershed. Recessional outwash typically has excellentproperties for the recharge, storage, and discharge of water and as a result supports streams with annual flowssufficient to support a diversity of aquatic life. The southern portion of the watershed consists primarily of VashonTill, which due to its low permeability has low rates of recharge and discharge (Sceva 1957).Based on results of the <strong>Gorst</strong> Creek Watershed Characterization Report (City of Bremerton 2012), the northern halfof the watershed has an intact water flow delivery component that is properly functioning. The natural hydrologyin the southern half of the watershed is altered by mixed developments resulting more frequent and higher flows(City of Bremerton 2012). Heins, Jarstad, and Parish creeks have the highest potential for sediment transport whichcould result in an increase in erosion and mass wasting impacting water quality (City of Bremerton 2012).Washington's Water Quality Assessment lists the status of water quality for a particular location in one of fivecategories recommended by the EPA and Section 303(d) of the Clean Water Act (CWA). Administered inWashington State, by Ecology, the 303(d) list reports on Category 5 waters, which are impaired waters of the state.Waters placed on the 303(d) list require the preparation of a plan to improve water quality by limiting pollutantloads. Water quality in the <strong>Gorst</strong> watershed is good with only two creeks (<strong>Gorst</strong> and Parish) on the 303(d) list(Ecology 2012).<strong>Gorst</strong> Creek between rivermile 0 and 1.6 does not meet the water quality standards for dissolved oxygen and wasplaced in Water Quality Assessment Category 5 and Ecology’s 303(d) List of Impaired Waters (Ecology 2012). Thebacteria water quality standard in <strong>Gorst</strong> Creek is currently in the Water Quality Assessment Category 4b.Historically, <strong>Gorst</strong> Creek has not met fecal coliform standards and was placed in Water Quality AssessmentCategory 5 by the EPA. Ecology reclassified <strong>Gorst</strong> Creek as Category 4b in 2004 due to Kitsap County’s PollutionSurface and Stormwater Management Program. The KCHD currently monitors water quality in <strong>Gorst</strong> Creek from amonitoring station located at the mouth of <strong>Gorst</strong> Creek. Cleanup work in the watershed has helped reducepollution (City of Bremerton 2012).Parish Creek between rivermile 0 and 0.7 does not meet the water quality standards for bacteria (exceeded criteriafor fecal coliform) and was placed in Water Quality Assessment Category 5 and Ecology’s 303(d) List of ImpairedWaters (Ecology 2012).Floodplains and ShorelineUnlike watersheds with larger river systems that are prone to flooding from rain-on-snow events, flooding in the<strong>Gorst</strong> watershed are caused by disturbance of natural hydrological patterns caused by development, removal ofnative riparian, and encroachment on floodplains. The Federal Emergency Management Agency (FEMA)regulations define a floodplain as “the lowland and relatively flat areas adjoining inland and coastal watersincluding, at a minimum, that area subject to a one percent or greater chance of flooding in any given year” (44CFR 9.4). Floodplains are mapped upstream of the <strong>Gorst</strong> UGA at the confluence of <strong>Gorst</strong>, Heins, Jarstad, and ParishCreeks and along Parish Creek (<strong>Gorst</strong>-Parish floodplain complex) (Figure 3.2-2 <strong>Gorst</strong> Creek Watershed: Floodplainand Shoreline). Based on results of the <strong>Gorst</strong> Creek Watershed Characterization Report (City of Bremerton 2012),the northern half of the watershed has intact flood storage capacity and is in good condition while the southernwatershed has altered hydrology and includes features that drain floodplains and wetlands. Shoreline in thewatershed is described in the following <strong>Gorst</strong> UGA section.<strong>Gorst</strong> UGAThe major water features in the <strong>Gorst</strong> UGA include the previously described <strong>Gorst</strong> Creek, an unnamed tributary to<strong>Gorst</strong> Creek, and Sinclair Inlet (Figure 3.2-2 <strong>Gorst</strong> Creek Watershed: Floodplain and Shoreline).<strong>Draft</strong> | June 2013 3-15
GORST PLANNED ACTION EIS | AFFECTED ENVIRONMENT, SIGNIFICANT IMPACTS, AND MITIGATION MEASURESHydrology and Water QualityThe lower reach of <strong>Gorst</strong> Creek, <strong>Gorst</strong> tributary 1, and <strong>Gorst</strong> tributary 2, in the UGA is channelized with a riparianbuffer that is constrained by rural residences and commercial development along SR 3 and SR 16. Water quality inthe UGA is moderate with periods of elevated bacteria in <strong>Gorst</strong> Creek but is improving (City of Bremerton 2011).All waters in the <strong>Gorst</strong> UGA drain to Sinclair Inlet. Commercial development on the eastside of the highway is builtup to the edge of the wetland areas of Sinclair Inlet. Sinclair Inlet has a history of poor water quality withcommercial shellfish harvesting closed since the 1960s. Sinclair Inlet contains tidally influenced waters that mixslowly with the more open waters of Puget Sound. Because of its slow mixing rates, shallow depths and proximityto land use activities along the shoreline, Sinclair Inlet is extremely susceptible to pollution. Sinclair Inlet does notmeet the water quality standards for mercury and polychlorinated biphenyls (PCB) and is placed in Water QualityAssessment Category 5 and Ecology’s 303(d) List of Impaired Waters (Ecology 2012).Floodplains and ShorelineFloodplains are mapped based on FEMA information in the <strong>Gorst</strong> UGA along <strong>Gorst</strong> Creek, <strong>Gorst</strong> tributary 1, <strong>Gorst</strong>tributary 2, and in the waterfront along the shoreline of Sinclair Inlet (Figure 3.2-2 <strong>Gorst</strong> Creek Watershed:Floodplain and Shoreline). In the <strong>Gorst</strong> UGA, floodplain connectivity is fragmented by commercial developmentand SR 3. (FEMA floodplain mapping and its potential effect on development in the County including the <strong>Gorst</strong>vicinity is also being considered in a separate Kitsap County Alternatives Futures study undergoing review.)<strong>Gorst</strong> tributary 2 drains the north portion of the UGA near the mine site. This tributary in combination with hillsideseepage contributes to flood of residences and businesses including the Navy City Metals Recycling.Flooding problems and drainage infrastructure deficiencies are identified at 16 sites in and just outside of <strong>Gorst</strong>UGA (Figure 3.2-3 <strong>Gorst</strong> Identified Infrastructure Existing Drainage Deficiencies). Sites included Elite Exterior andBetos Tires, development along W. Belfair Valley Road, and Peninsula Subaru. Elite Exterior has frequent floodingwhen high tides coincide with storm events. Businesses and residences along W. Belfair Valley Road haveexperienced increased flooding from high groundwater in combination with hill slope seepage and insufficientstormwater conveyance from degraded roadside ditches. Peninsula Subaru has drainage issues associated withundersized stormwater drain pipes and culverts with sink holes and slumps occurring on the property.Shorelines regulated under the Shoreline Management include Sinclair Inlet and <strong>Gorst</strong> Creek. The shorelinejurisdiction extends 200 feet landward of these waters which are mostly developed including riprap banks alongSinclair Inlet.<strong>Draft</strong> | June 2013 3-16
<strong>Gorst</strong>Creek.Jarstad CreekBremerton West UGA<strong>Gorst</strong> Tributary 2Hains Creek<strong>Gorst</strong> Parish Floodplain Complex<strong>Gorst</strong> UGAW BELFAIR VALLEY RDSinclair InletParish Creek 16 3 16 166Port Orchard UGAPath: P:\ENV\PROJECTSW\60271862 <strong>Gorst</strong> Subarea Plan\400 Technical Information\423 GIS\3_MXDs\EIS Figures\Floodplain and Shoreline.mxd<strong>Gorst</strong> Tributary 1ULID6¯med Stream 12269194752710 0.25 0.5 MilesAnderson CreekUnnamed Stream1226824475230
THIS PAGE INTENTIONALLY BLANK
FIGURE 3.2-3 GORST: IDENTIFIED EXISTING DRAINAGE DEFICIENCIES<strong>Gorst</strong> UGAUNNAMEDSite 15. Fish Rearing Ponds- Water Quality ConcernsSite 14. Kitsap Square Dance- Creek, Property & Roadway FloodingSite 2. Tool Liquidators, Wigmam Tavern& Multiple Residences- Hillside Seepage- Property FloodingW SHERMAN HEIGHTS RDURBAN GROWTH BOUNDARYSOLID LN WW BELFAIR VALLEY RDWBELFAIR VALLEY RDSite 13. Navy City Metals- Water Quality ConcernsSite 16. Residence- Water Quality ConcernsSite 8. Multiple Residences- Property Flooding Site 4. Hwy 3 - Roadway FloodingW JARSTAD DR<strong>Gorst</strong> UGASite 7. Multiple Residences- Property FloodingSTATE HWY 3 WSite 1. Elite Exteriors, Betos Tire- Property FloodingPath: P:\ENV\PROJECTSW\60271862 <strong>Gorst</strong> Subarea Plan\400 Technical Information\423 GIS\3_MXDs\EIS Figures\<strong>Gorst</strong> Creek Identified Infrastructure Deficiencies.mxdDIVISION AVE WW FRONE DRSite 9. Multiple Residences- Hillside Seepage- Water Quality ConcernsBIRCH AVE WFRONE LN WBIRCH AVE WW PLEASANT STHAWTHORNE AVE WHAWTHORNE AVE WWSUMMIT STSite 6. Waldbillig Properties- Creek & Property Flooding- Streambank ErosionTHORSON RD WSite 12. Lumber Yard- Creek & Property FloodingW ALDER STIAN DRW OB ROLYMPIC DR WSite 5. Multiple Residences- Creek Flooding- Water Quality ConcernsW FRONTAGE RDFEIGLEY RD WAHERN CT WSite 10. Feigley Rd- Roadway FloodingURBAN GROWTH BOUNDARYW BENS LNSite 3. Peninsula Subaru- Sink Hole0 500 1,000 Feet¯Site 11. Mattress Factory- Sink HoleCAMPUS PKWYW STATE HWY 16
THIS PAGE INTENTIONALLY BLANK
GORST PLANNED ACTION EIS | AFFECTED ENVIRONMENT, SIGNIFICANT IMPACTS, AND MITIGATION MEASURES<strong>Impact</strong>sThis <strong>Draft</strong> EIS evaluates a No <strong>Action</strong> Alternative and two action alternatives (Alternative 2 and Alternative 3), asdescribed in Chapters 1 and 2. The No <strong>Action</strong> Alternative provides a future baseline against which to measure bothshort-term and long-term impacts of the action alternatives on water resources.The City of Bremerton is compiling watershed data for models that would identify and prioritize mitigationmeasures that would restore, enhance, and protect water resources and optimize investment in infrastructure.One of these models is a Hydrological Simulation Program-Fortran (HSPF) Model developed for the <strong>Gorst</strong>Watershed and based on current land use conditions. The HSPF Model is described in Section 3.13.3 Water,Wastewater, and Stormwater. Anticipated economic development and population growth in the <strong>Gorst</strong> Creekwatershed and <strong>Gorst</strong> UGA may also affect long-term surface water conditions and potentially change peak flowsand volumes. Potential changes to peak flows and volumes for the action alternatives are compared for eachaction alternative relative to the No-<strong>Action</strong> Alternative.<strong>Impact</strong>s Common to All AlternativesWatershedUnder all project alternatives and as described in Chapter 2.0 Alternatives, areas planned land uses outside of the<strong>Gorst</strong> UGA but within the watershed would remain the same as in adopted plan. These areas include the City ofBremerton’s CUL and SKIA, the City of Port Orchard’s McCormick Woods, and remaining rural unincorporatedKitsap County lands. In addition, over the next 20 to 30 year jobs would substantially increase from 264 to 2,305primarily due to economic development in the SKIA. The added jobs in the SKIA area would be subject the SKIASubarea Plan. Population growth is projected to increase from 1,810 to 2,659. Population growth would likelyoccur south of SR 3 and east of Parish Creek. Groundwater and the <strong>Gorst</strong> aquifer would continue to be protected.One area of concern is the <strong>Gorst</strong>-Parish floodplain complex that is subject to frequent flooding. Anticipatedpopulation growth and subsequent development upstream of this location would likely increase the amount ofuntreated surface water, peak runoff flows, and sedimentation. Flooding in the <strong>Gorst</strong>-Parish floodplain complexhas been identified as priority and would eventually be addressed. Because economic development and populationgrowth in the watershed would occur under all project alternatives, effect would be similar and considered minorimpacts on water resources.<strong>Gorst</strong> UGAUnder all alternatives, construction activities within the UGA would have the potential to impact water resourcescaused by site demolition or construction (water turbidity, debris in the water, etc.), similar to those described inSection 3.1 Geology/Soils. Scale and intensity of construction projects may vary slight by alternative anddifferences are described under each alternative. Overall, construction activities would result in short-term minorimpacts on water resources.Alternative 1Under Alternative 1, over the next 20 to 30 years, construction, maintenance, and operational impacts on waterresources would remain consistent with existing conditions, the <strong>Gorst</strong> Creek Watershed Characterization &Framework Plan would not be adopted, and a planned action would not be adopted for the <strong>Gorst</strong> UGA. Highdensity commercial areas would continue to impact hydrology and water quality immediately adjacent to <strong>Gorst</strong>Creek and Sinclair Inlet. Under Alternative 1, an increase in 742 jobs and a population growth of 82 persons isexpected to occur over the next 20 to 30 years. Commercial businesses would expand along the highways andthere is a potential for new residential development to occur surrounding the existing mine or west of SamChristopherson Road. Current regulations recognize the adverse effects of improper water resource management,development in the floodplain, and armoring of streambanks and shorelines and generally seek to prevent thesethrough a variety of site design requirements and construction methods. However, the UGA was previously<strong>Draft</strong> | June2013 3-21
GORST PLANNED ACTION EIS | AFFECTED ENVIRONMENT, SIGNIFICANT IMPACTS, AND MITIGATION MEASURESdeveloped without these requirements and commercial areas would likely be redeveloped on the previouslydisturbed impervious surface without water quality treatment and would continue to impact floodplains and theshoreline. Incremental restoration and potential water quality treatment would occur on waters that are 303(d)listed. In addition, environmentally sensitive redevelopment in response to chronic flooding that would be likelyaddressed through emergency repairs or actions. Overall, Alternative 1 would have moderate impacts on waterresources in the UGA.Alternative 2Under the Alternative 2 (<strong>Gorst</strong> is a well-designed regional commercial center), the Watershed Characterization &Framework Plan would be adopted, a regional commercial center along the waterfront would be developed, andclustered Medium Density Residential development would occur on the mine site. Construction activitiesassociated with Alternative 2 could result in minor short-term impacts on water resources. Alternative 2 wouldallow a moderate increase in employment of 606 jobs and a more substantial increase in residents of 985 personsover the next 20 to30 years.The proposed Commercial Corridor development would accommodate new water quality treatment and likelyrestore segments of channelized streams as part of development requirements or incentives; however due togreater scrutiny of permits in floodplains and due to the listing of fish species, the developability of the <strong>Gorst</strong> Creekflood plain area for intensive commercial uses is expected to be challenging. The Medium Density Residential areaon the bluffs currently undeveloped but used as mining resources/borrow material would impact surface waterrunoff and alter natural hydrology. However, new designs and development would address potential for flooding,potential need for flow control, and treatment, minimizing impact on hydrology and water quality. In additiondevelopment and environmental retrofits along <strong>Gorst</strong> Creek could address of contributing outfalls. Estimates ofthe natural flow of the stream would need to be assessed to achieve proper hydraulic and aesthetic design. Thepotential for flood conditions and damage to surrounding property would also need to be determined andaddressed.Under Alternative 2, water resources would have additional protection from zero discharge of direct untreatedstormwater to both streams and the estuary and a goal of 100 percent on-site infiltration or detention. The Systemfor Urban Stormwater Treatment and Analysis Integration (SUSTAIN) model, which is described in Section 3.13.3Water, Wastewater, and Stormwater would be used to optimize and prioritize protection zones for waterresources.Overall, Alternative 2 would have a minor effect on water resources from short-term construction related impactsand moderate effects from long-term development continued development of high density commercial areasalong the shoreline. The long-term effects of the commercial development may be offset by implementation of theadopted Watershed Characterization & Framework Plan that would ensure stormwater in the watershed would betreated prior to discharge into sensitive waterways or critical areas. The Watershed Characterization & FrameworkPlan would have a beneficial effect on water resources.Alternative 3Under Alternative 3 (<strong>Gorst</strong> becomes a complete community), the Watershed Characterization & Framework Planwould be adopted, along with LID and stormwater standards. Similar to Alternative 2, construction activitiesassociated with Alternative 3 could result in minor short-term impacts on water resources. Similar to Alternative 2,adoption of the Watershed Characterization & Framework Plan would include a directive for protecting waterresource in the UGA. Under Alternative 3, compare to the other alternative would have less job growth at 333jobs, but the highest population growth at 1,082 persons over the next 20 to30 years.The proposed <strong>Gorst</strong> Mixed Use development would accommodate new water quality treatment and likely restoresegments of channelized streams as part of development requirements or incentives; however due to greater<strong>Draft</strong> | June 2013 3-22
GORST PLANNED ACTION EIS | AFFECTED ENVIRONMENT, SIGNIFICANT IMPACTS, AND MITIGATION MEASURESscrutiny of permits in floodplains and due to the listing of fish species, the developability of the <strong>Gorst</strong> Creek floodplain area for intensive mixed uses is expected to be challenging.The Low Intensity Waterfront and Open Space/Recreation areas along Sinclair Inlet would accommodate newwater quality treatment, reduce impervious surface areas, and provide an adequate buffer to the shoreline. TheNeighborhood Mixed Use area on the bluffs currently undeveloped but used as mining resources/borrow materialwould impact surface water runoff and alter natural hydrology. However, similar to Alternative 2, new designs anddevelopment would address potential for flooding, potential need for flow control, and treatment, minimizingimpact on hydrology and water quality.Also similar to Alternative 2, Alternative 3 would establish a zero stormwater discharge policy to both streams inthe UGA and the estuary; if implemented this would require 100 percent infiltration or detention. The SUSTAINmodel would be used to optimize and prioritize protection zones.Overall, Alternative 3 would have a minor effect on water resources from both short-term construction relatedimpacts that may involve in-water work and long-term redevelopment of high density commercial areas withmixed use developments. The long-term effects of replacing the existing high density commercial developmentswith a low intensity waterfront along the shoreline and implementation of the adopted WatershedCharacterization & Framework Plan would have a beneficial effect on water resources.Mitigation MeasuresSpecific mitigation measures for potential impacts on water resources would be determined during subsequentproject-specific environmental review and permitting in the watershed and application of the <strong>Planned</strong> <strong>Action</strong>ordinance and permitting in the <strong>Gorst</strong> UGA. Mitigation includes incorporated plan features, applicable regulationsand commitments, and other potential measures.Incorporated Plan FeaturesFeatures of the Watershed Characterization & Framework Plan and <strong>Gorst</strong> Subarea Plan that serve as mitigation forpotential impacts on water resources include the following concepts found in Guiding Principles and Goals andPolicies:• Identify and protect critical areas such as floodplains along <strong>Gorst</strong> Creek.• Prioritize areas for restoration that would improve water quality.• Protect and enhance water quality/quantity.• Promote shoreline reclamation.Additionally, capital facility improvements have been recommended to address runoff from impervious surfacesand flood-prone areas.Applicable Regulations and CommitmentsSurface water quality standards are implemented through the CWA Section 401 certifications, water qualitymodifications, and compliance with the standards in Chapter 90.48 RCW and WAC 173-201A. Applications forwater quality related permits include the Joint Aquatic Resources Permit Application (JARPA) process, and theNPDES permits. Applicable regulations and commitments may include the following:• FederalooClean Water ActCoastal Zone Management Act<strong>Draft</strong> | June 2013 3-23
GORST PLANNED ACTION EIS | AFFECTED ENVIRONMENT, SIGNIFICANT IMPACTS, AND MITIGATION MEASURES• TribaloTribal consultation or approval is required under federal statutes including the CWA Section 401 WaterQuality Certification.• StateooooWater Pollution Control Act (Chapter 90.48 RCW)Shoreline Management Act (Chapter 90.58 RCW)Coastal Zone Management Act CertificationWatershed Planning Law (Chapter 90.82 RCW)o Hydraulic Project Approval (WAC 220-110)oooAquatic Lands Use AuthorizationOn-Site Sewage Facility PermitNPDES Construction Stormwater Permit• LocaloooooCAO PermitShoreline Management PermitFloodplain Development PermitBMCKCCOther Potential Mitigation MeasuresOther potential mitigation measures could include the following:• During construction, future projects will need to comply with all construction-related stormwaterrequirements, including temporary erosion and sediment control, and development and implementation of astormwater pollution and spill prevention plan.• The project-specific design will determine the necessary permanent, long-term water quality treatmentrequirements, necessary for all vehicle-accessible areas and redevelopments. Large areas of landscaping orlawn, unless strict policies on pesticide and fertilizer use are adopted, will also be subject to water qualitytreatment requirements.• No specific water quality treatment method is proposed at this point, but it is likely that treatment wouldconsist of various LID systems to the extent feasible. Additional erosion protection improvements may beneeded at project outfalls because of increased peak runoff rates caused by an increase in impervious surface.• If <strong>Gorst</strong> Subarea Plan policies and BMPs are implemented with corresponding development regulations therewould be incentives for the removal of existing impervious areas and smaller new impervious footprints.Implementation of these types of incentives and standards could result in beneficial effects on waterresources.• The concept of allowing commercial or mixed uses on smaller impervious footprints could be extended to the<strong>Gorst</strong> Creek corridor and floodplain similar to Low Intensity Waterfront designation, recognizing theconvergence of critical areas and difficulties of development in the floodplain. This would replace portions ofCommercial Corridor in Alternative 2 and <strong>Gorst</strong> Mixed Use in Alternative 3.<strong>Draft</strong> | June 2013 3-24
GORST PLANNED ACTION EIS | AFFECTED ENVIRONMENT, SIGNIFICANT IMPACTS, AND MITIGATION MEASURESSignificant Unavoidable Adverse <strong>Impact</strong>sUnder all alternatives, the <strong>Gorst</strong> Creek watershed and the <strong>Gorst</strong> UGA would experience additional population andemployment growth. Development in the <strong>Gorst</strong> Creek UGA is anticipated under the alternatives would result in nosignificant unavoidable adverse impacts on water resources. All alternatives would have a minor effect on waterresources from short-term construction related impacts. As previously described, Alternative 1 would have longtermmoderate impacts on water resources. Both Alternatives 2 and 3 would provide long-term beneficial effectson water resources from adoption and implementation of the Watershed Characterization & Framework Plan.Alternative 3 provides the greatest ecological benefit by establishing a low intensity waterfront along the shorelineof Sinclair Inlet that would, as redevelopment occurs, partially restore natural hydrology along that portion of theshoreline.<strong>Draft</strong> | June 2013 3-25
GORST PLANNED ACTION EIS | AFFECTED ENVIRONMENT, SIGNIFICANT IMPACTS, AND MITIGATION MEASURES3.3 Air QualityThis section describes the current air quality conditions in the region, existing regulations and policies that governallowable air pollutant emissions, and existing regulations and policies that have been developed to reduce GHGemissions. <strong>Impact</strong>s of the alternatives (Alternative 1 - No <strong>Action</strong>, Alternative 2 – Regional Commercial Center, andAlternative 3 – Complete Community) and the <strong>Gorst</strong> Watershed Framework Plan are analyzed at a programmaticlevel. This section also provides a screening-level forecast of GHG emission rates that would be generated by thealternatives and within the <strong>Gorst</strong> Watershed area.Current air quality regulations would prevent new developments and commercial facilities within the <strong>Gorst</strong> studyarea from generating unacceptable air pollutant emissions that would affect nearby areas during construction oroperation. Because all of the alternatives would increase population, commercial space, and industrial space in the<strong>Gorst</strong> study area above existing conditions, the air pollutant emissions generated within the <strong>Gorst</strong> study area areexpected to increase. Similarly, regional vehicle miles traveled (VMT) by vehicles used by <strong>Gorst</strong> residents and thosewho work in <strong>Gorst</strong> would also increase in the <strong>Gorst</strong> study area, along with the tailpipe emissions generated bythose vehicles. However, the VMT generated by the new homes and businesses in the <strong>Gorst</strong> study area would be asmall fraction of the overall VMT generated within Kitsap County, so it is unlikely that any of the alternatives wouldsignificantly affect regional air quality.Affected EnvironmentExisting Air Pollution SourcesTypical air pollution sources in the <strong>Gorst</strong> study area include vehicular traffic, commercial and retail businesses, lightindustry, and residential wood-burning devices. While many types of pollutant sources are present, the singlelargest contributor to most criteria pollutant emissions is expected to be derived from on-road vehicles, whichcontribute the majority of the carbon monoxide (CO), volatile organic compounds (VOCs), and nitrogen dioxide(NO2). Secondary sources of emissions are derived from commercial and industrial land uses. Additionally, spaceheating (e.g., gas and diesel heating equipment) and wood-burning appliance emissions contribute to backgroundair quality.Key Criteria Air PollutantsThe following paragraphs describe the sources and environmental effect of key criteria pollutants (CO, ozone, andparticulate matter) considered in this analysis.CO is a product of incomplete combustion generated by mobile sources, residential wood combustion, andindustrial fuel-burning sources. CO is a concern related to on road mobile sources because it is the pollutantemitted in the greatest quantity for which short-term health standards exist. CO is a pollutant whose impact isusually localized, and CO concentrations typically diminish within a short distance of roads. The highest ambientconcentrations of CO usually occur near congested roadways and intersections during wintertime periods of airstagnation.Ozone is a highly reactive form of oxygen created by an atmospheric chemical reaction of nitrogen oxides andVOCs, both of which are emitted directly from industrial and mobile sources. Ozone problems tend to be regionalin nature because the atmospheric chemical reactions that produce ozone occur over a period of time, andbecause, during the delay between emission and ozone formation, ozone precursors can be transported far fromtheir sources. Transportation sources like automobiles and trucks are some of the sources that produce ozoneprecursors.Particulate matter is generated by industrial emissions, residential wood combustion, motor vehicle tailpipes, andfugitive dust from roadways and unpaved surfaces. When first regulated, particle pollution was based on “totalsuspended particulate,” which included all size fractions. As sampling technology has improved and theimportance of particle size and chemical composition has become clearer, ambient standards have been revised to<strong>Draft</strong> | June 2013 3-26
GORST PLANNED ACTION EIS | AFFECTED ENVIRONMENT, SIGNIFICANT IMPACTS, AND MITIGATION MEASURESfocus on the size fractions thought to be most dangerous to people. At present, there are standards for particulatematter less than 10 micrometers in size (PM10) and particulate matter less than 2.5 micrometers in size (PM2.5),because these sizes of particulate contribute the most to human health effects, regional haze, and acid deposition.The highest ambient concentrations generally occur near the emissions sources, which in the <strong>Gorst</strong> study areawould be motor vehicle tailpipes from SR 3, SR 16, and major roads. PM2.5 has a greater impact than PM10 atlocations far from the emitting source, because it remains suspended in the atmosphere longer and travels farther.Air Quality Attainment StatusBased on monitoring information collected over a period of years, the EPA and Ecology designate regions as beingattainment or nonattainment areas for regulated air pollutants. Attainment status indicates that air quality in anarea meets the National Ambient Air Quality Standards (NAAQS), and nonattainment status indicates that airquality in an area does not meet those standards. If the measured concentrations in a nonattainment area improveso they are consistently below the NAAQS, Ecology and EPA can reclassify the nonattainment area to amaintenance area.The <strong>Gorst</strong> study area is currently designated as an attainment area for all criteria air pollutants (ozone, CO, PM10,PM2.5, lead, sulfur dioxide [SO2], and NO2). Additionally, the <strong>Gorst</strong> study area is not located within a maintenancearea. In March 2008, the EPA lowered its 8-hour ozone standard from 0.08 parts per million (ppm) to 0.075 ppm tobetter protect public health. In January 2010, EPA proposed a revision to the 2008 ozone standard, and put all areadesignations to the 2008 standard on hold. Until the revised standard is adopted, the region is still designated anattainment area for ozone.Similarly, in 2010, EPA enacted a new, more stringent 1-hour average ambient air quality standard for NO2. At thistime it is not known which regions in the country will be re-designated based on the new standard. Therefore, asof this time, the <strong>Gorst</strong> study area is still considered an attainment area for NO2.Air Toxics IssuesThe <strong>Gorst</strong> study area includes residential, commercial, and light industrial uses that pose no special issues relatedto air toxics. Although the <strong>Gorst</strong> study area is not near any major industrial facilities that emit large amounts oftoxic air pollutants, SR 3 and SR 16 pass through the <strong>Gorst</strong> study area, and heavy diesel trucks traveling along thehighways have the potential to emit toxic air pollutants. It is expected that existing and future air quality in the<strong>Gorst</strong> study area adjacent to SR 3 and SR 16 could be affected by moderate concentrations of toxic air pollutants.According to EPA’s National Air Toxics Assessment 2005 database, the existing respiratory cancer risk in the censustracts that includes the <strong>Gorst</strong> study area is roughly 37 x 10 -6 or 37 cancer cases per million population (EPA 2013).This reported respiratory cancer risk is typical of other rural areas in Washington State.PSRC Transportation Conformity AnalysisUnder federal and state regulations, PSRC is required to demonstrate that the Regional Transportation Plan (RTP)or Transportation Improvement Program (TIP) conforms to the State Implementation Plan allowable emissionsbudget. The State Implementation Plan provides a blueprint of how maintenance and nonattainment areas such asthe central Puget Sound region will meet or maintain the NAAQS. The most recent air quality analysis (PSRC 2013)for the 2013–2016 Regional TIP and the long-range RTP, demonstrates that 2040 forecasted regional emissionsconform to the State Implementation Plan’s allowable emissions budgets.National Ambient Air Quality StandardsEPA establishes NAAQS and specifies future dates for states to develop and implement plans to achieve thesestandards. The standards are divided into primary and secondary standards; the former are set to protect humanhealth within an adequate margin of safety, and the latter to protect environmental values, such as plant andanimal life. Table 3.3-1 National and Washington State Ambient Air Quality Standards lists the NAAQS for sixcriteria pollutants: CO, ozone, PM10, PM2.5, lead, SO2, and NO2.<strong>Draft</strong> | June 2013 3-27
GORST PLANNED ACTION EIS | AFFECTED ENVIRONMENT, SIGNIFICANT IMPACTS, AND MITIGATION MEASURESTable 3.3-1National and Washington State Ambient Air Quality StandardsFederalPollutant Primary SecondaryCarbon monoxide (CO)Ozone8-hour average a1-hour average a9 ppm35 ppmNo standardNo standardState9 ppm35 ppm8-hour average b 0.075 ppm 0.075 ppm 0.075 ppmTotal suspended particles (TSP)Annual average24-hour average cParticulate matter (PM)—PM10No standardNo standardNo standardNo standard60 µg/m 3150 µg/m 324-hour average c 150 µg/m 3 150 µg/m 3 150 µg/m 3Particulate matter (PM)—PM2.5LeadAnnual average15 µg/m 315 µg/m 315 µg/m 324-hour average d 35 µg/m 3 35 µg/m 3 35 µg/m 3Quarterly average 1.5 µg/m 3 1.5 µg/m 3 1.5 µg/m 3Sulfur dioxide (SO2)Annual average24-hour average a3-hour average a1-hour average eNitrogen dioxide (NO2)Annual average1-hour average f0.03 ppm0.14 ppmNo standardNo standard0.053 ppm0.100 ppmNo standardNo standard0.50 ppmNo standard0.053 ppmNo standard0.02 ppm0.10 ppmNo standard0.40 ppm0.05 ppmNo standardppm = parts per million; µg/m 3 = micrograms per cubic meterNote: Annual standards are never to be exceeded. Short-term standards are not to be exceeded more than once per yearunless noted.aNot to be exceeded once per year.bTo attain this standard, the 3-year average of the fourth-highest daily maximum 8-hour average ozone concentrationsmeasured at each monitor within an area over each year must not exceed 0.075 ppm (effective May 27, 2008).cNot to be exceeded more than once per year on average over 3 years.dTo attain this standard, the 3-year average of the 98th percentile of 24-hour concentrations at each populationorientedmonitor within an area must not exceed 35 µg/m 3 .e0.25 ppm are not to be exceeded more than two times in 7 consecutive days.fTo attain this standard, the 3-year average of the 98th percentile of the daily maximum 1-hour average at eachmonitor within an area must not exceed 0.100 ppm.Source: WAC 173-470–475Transportation Conformity RegulationsKitsap County is classified as an air quality attainment area; therefore, transportation projects are not subject tostate or federal transportation conformity regulations.National <strong>Environmental</strong> Policy Act Requirement for Climate Change AnalysisOn December 7, 2009, EPA signed the Endangerment and Cause or Contribute findings for GHGs under Section202(a) of the Clean Air Act. Under the Endangerment Finding, EPA determines that the current and projected<strong>Draft</strong> | June 2013 3-28
GORST PLANNED ACTION EIS | AFFECTED ENVIRONMENT, SIGNIFICANT IMPACTS, AND MITIGATION MEASURESconcentrations of the six key well-mixed GHGs—CO2, methane, nitrous oxide, hydrofluorocarbons,perfluorocarbons, and sulfur hexafluoride—in the atmosphere threaten the public health and welfare of currentand future generations. Under the Cause or Contribute Finding, EPA determines that the combined emissions ofthese well-mixed GHGs from new motor vehicles and new motor vehicle engines contribute to the GHG emissionsthat threaten public health and welfare.On February 19, 2010, the Council on <strong>Environmental</strong> Quality issued draft National <strong>Environmental</strong> Policy Act (NEPA)guidance on the consideration of the effects of climate change and GHG emissions. This guidance advises federalagencies to consider opportunities to reduce GHG emissions caused by federal actions, adapt their actions toclimate change impacts throughout the NEPA process, and address these issues in their agency NEPA procedures.Where applicable, the scope of the NEPA analysis should cover the GHG emission effects of a proposed action andalternatives and the relationship of climate change effects to a proposed action or alternatives. However, thisguidance document does not set numerical thresholds for what levels of GHG emissions would constitute asignificant impact, nor does the guidance document specify what types of mitigation measures should be requiredby local municipalities.State Ambient Air Quality StandardsEcology establishes state ambient air quality standards for the same six criteria air pollutants that are at least asstringent as the national standards; in the case of SO2, state standards are more stringent. Table 3.3-1 Nationaland Washington State Ambient Air Quality Standards lists the state ambient air quality standards for six criteriapollutants, along with the federal standards.Outdoor BurningBurning yard waste and land-clearing debris is not allowed at any time in urbanized areas of Kitsap County. ThePuget Sound Clean Air Agency (PSCAA) enforces state outdoor burning regulations required by the Chapter70.94.743 RCW.State of Washington GHG RequirementsIn response to growing worldwide concerns, former Washington State Governor Christine Gregoire issuedExecutive Order 07-02 in February 2007. The executive order established the following GHG reduction limits(Ecology 2008a):• Reduce emissions to 1990 levels by 2020, 25 percent below 1990 levels by 2035, and 50 percent below 1990levels by 2050.• Increase “green economy jobs” to 25,000. The term “green economy jobs” means the design, manufacture,marketing, and installation of equipment to support sustainable development both within and beyondWashington State.• Reduce expenditures on fuel imported into Washington State by 20 percent by 2020.The above GHG reduction goals apply state-wide, but they do not specify any requirements for local governmentagencies to implement measures to reduce emissions within their local jurisdictions.The Washington Legislature Chapter 70.235 RCW, Limiting GHG Emissions, into state law. This law codifies the GHGreduction goals of Executive Order 07-02 and specifies them as “limits” rather than “goals.” The new law also addsa fourth requirement to help achieve the GHG reduction targets.• Decrease the annual per capita VMT 18 percent by 2020, 30 percent by 2035, and 50 percent by 2050.The state law applies only to actions taken by Washington State agencies and local governments. State regulationson GHG emissions include prerequisites for distribution of capital funds for infrastructure and economic<strong>Draft</strong> | June 2013 3-29
GORST PLANNED ACTION EIS | AFFECTED ENVIRONMENT, SIGNIFICANT IMPACTS, AND MITIGATION MEASURESdevelopment projects, where projects receiving funding must be evaluated for consistency with state and federalGHG limits and state VMT goals (RCW 70.235.070).Ecology issued guidance in 2010 for SEPA reviews related to GHG emissions, for SEPA actions for which a localgovernment agency is the SEPA lead agency (Ecology 2013a). That guidance indicated all SEPA reviews mustevaluate GHG emissions. The guidance document presented a range of ways that local agencies could setsignificance thresholds and calculate GHG emissions and potentially mitigate those emissions. However, theguidance did not stipulate what GHG significance threshold must be used, nor did it specify what level of GHGemission reductions is required under SEPA. The guidance emphasized those decisions must be made by the SEPAlead agency on a case-by-case basis.Ecology issued revised guidance in June 2011 for SEPA reviews regarding actions where Ecology is the SEPA leadagency (Ecology 2013b). The revised guidance is related to GHG emissions for projects where emissions arepresumed not to be significant and outlining measures for mitigation to meet state emissions reduction limits. Thisguidance is applicable only to projects where Ecology is the lead agency or agency with jurisdiction. The 2011Ecology guidelines do not specify significance thresholds or mitigation requirements for local governmental actionsfor which the municipality is the SEPA lead agency. Regardless, they illustrate the importance of local actions toreduce GHG emissions.In 2011, the Washington State Department of Commerce released an updated Washington State Energy Strategyfor 2012 (Washington State Department of Commerce 2011), which includes short- and long-term policy options tomeet the following goals:1. Maintain competitive energy prices that are fair and reasonable for consumers and businesses and supportWashington’s continued economic success.2. Increase competitiveness by fostering a clean energy economy and jobs through business and workforcedevelopment.3. Meet the state’s obligations to reduce GHG emissions.The Washington State Energy Strategy outlines strategies meeting these goals in the categories of transportationefficiency, building efficiency, distributed energy and pricing.Puget Sound Clean Air Agency RegulationsAll construction sites in the Puget Sound region are required to implement rigorous emission controls to minimizefugitive dust and odors during construction, as required by PSCAA Regulation 1, Section 9.15, Fugitive Dust ControlMeasures.All industrial and commercial air pollutant sources in the Puget Sound region are required to register with PSCAA.Facilities with substantial emissions are required to obtain a Notice of Construction air quality permit beforeconstruction is allowed to begin. The application for this permit requires the facility to install best available controltechnology to reduce emissions, conduct computer modeling to demonstrate that the facility’s emissions will notcause ambient concentrations to exceed the NAAQS limits, and minimize the impacts of odors and toxic airpollutants.In 2004, PSCAA published its strategy document for climate change, entitled Roadmap for Climate Protection:Reducing GHG Emissions in Puget Sound (PSCAA 2004). In this strategy document PSCAA recommended a broadrange of GHG reduction measures including regional vehicle trip reduction, building energy efficiencyimprovements, solid waste reduction, forestry and agriculture practice improvements, and community education.This document also encouraged local municipalities to encourage their own GHG reduction measures; however, itdid not propose a SEPA significance threshold for GHG emissions, nor did it require local governments to imposefuture mitigation measures for future development projects for which the municipality is the SEPA lead agency.Regardless, this document illustrates the importance of local government actions to reduce GHG emissions.<strong>Draft</strong> | June 2013 3-30
GORST PLANNED ACTION EIS | AFFECTED ENVIRONMENT, SIGNIFICANT IMPACTS, AND MITIGATION MEASURESClimate Change in the Kitsap County Energy Efficiency and Conservation PlanThe 2011 Kitsap County Energy Efficiency and Conservation Plan (Kitsap County 2011) includes a list ofrecommended policies and actions to reduce energy use and encourage renewable energy projects. In addition toachieving greater energy efficiency and energy cost reductions, one of the primary goals of the plan is to reduceGHG emissions.Climate Change in the City of Bremerton SKIA Subarea PlanThe City of Bremerton’s SKIA Subarea Plan applicable to a portion of the western watershed includes developmentregulations and incentives that are intended to reduce vehicle trips, encourage alternate modes of transportation,increase energy efficiency, and reduce GHG emissions within SKIA.MethodologyLand Use Values Used for Air Quality and GHG AssessmentsPlanning in the <strong>Gorst</strong> Creek Watershed includes a review of two geographies, the <strong>Gorst</strong> UGA where land usechanges are under consideration and the larger <strong>Gorst</strong> Creek Watershed which would retain current land use plansbut which would show some amount of growth, nevertheless. Each portion of the study area is considered in thissection.This analysis considered future land use growth and future emissions increases in the <strong>Gorst</strong> UGA. The proposedsquare footage of commercial and industrial space in the <strong>Gorst</strong> UGA would be higher for the no action alternative(Alternative 1) than under <strong>Action</strong> Alternatives 2 and 3, whereas population growth is expected to be higher forAlternatives 2 and 3 than under Alternative 1. Table 3.3-2 Assumed Land Use and Population Growth for GHGEmission Calculations–<strong>Gorst</strong> UGA lists the land use values that were used to assess regional VMT) and regionalGHG emissions.Table 3.3-2Assumed Land Use and Population Growth for GHG Emission Calculations–<strong>Gorst</strong> UGANet Increase under Alternatives Compared to ExistingConditionsLand Use Type Existing Alternative 1 Alternative 2 Alternative 3Single-family (dwelling units) 88 33 25 10Multifamily/Townhomes (dwelling units) 18 0 513 587Commercial (square feet) 78,000 316,319 286,325 157,375Light Industrial (square feet) 78,489 76,336 32,128 17,659Note:Existing dwellings are based on US Census block group household data for 2010. Existing square feet are derived fromEmployment Security Department numbers of jobs (as provided by PSRC) for 2010, multiplied by 969 square feet peremployee for industrial uses and 500 square feet per employee for commercial uses. This matches Kitsap County’sComprehensive Plan assumptions.Future estimates of growth are based on each alternative proposed land use and zoning as well as a land capacityanalysis consistent with Kitsap County’s Urban Land Capacity Analysis as updated for the Kitsap County UGA Resizingand Composition Remand in 2012.In addition to considering growth in the <strong>Gorst</strong> UGA, this analysis also considered future land use growth and futureemissions increases in the <strong>Gorst</strong> Watershed. Table 3.3-3 Assumed Land Use and Population Growth for GHGEmission Calculations <strong>Gorst</strong> Watershed, excluding <strong>Gorst</strong> UGA provides land use values that were used to assessregional GHG emissions.<strong>Draft</strong> | June 2013 3-31
GORST PLANNED ACTION EIS | AFFECTED ENVIRONMENT, SIGNIFICANT IMPACTS, AND MITIGATION MEASURESTable 3.3-3Assumed Land Use and Population Growth for GHG Emission Calculations <strong>Gorst</strong> Watershed, Excluding<strong>Gorst</strong> UGANet Increase 2010-2035 Compared toExisting ConditionsLand Use Type Existing 2035Single-family (dwelling units) 619 425Multifamily (dwelling units) 123 (18)Commercial (square feet) 87,500 862,436Light Industrial (square feet) 86,241 574,469Regional VMT Contributing to Regional Tailpipe EmissionsRegional photochemical smog issues in the Puget Sound region are caused largely by tailpipe emissions from carsand trucks traveling on public roads. For this analysis it was assumed the relative amounts of regional tailpipeemissions caused by each alternative would be proportional to the regional VMT caused by each alternative.For purposes of assessing the potential air quality impacts, the regional VMT generated by the various land usecategories within the <strong>Gorst</strong> UGA for each alternative was estimated using the factors embedded in the King CountyGHG emissions estimation spreadsheet (King County 2011). These baseline VMT factors were reduced further on acase-by-case basis for each alternative to account for Kitsap County development strategies aimed at pedestrianaccess and increasing development density. The adjusted VMT factors for the key land use categories of interest inthe <strong>Gorst</strong> UGA are as follows:• Single-family housing: 64.5 daily VMT per dwelling unit• Multifamily housing: 44.8 daily VMT per dwelling unit• Commercial (Office) buildings: 44.28 daily VMT per 1,000 square feet• Industrial buildings: 19.37 daily VMT per 1,000 square feetThe development-related adjustment factors are described in greater detail later in this section. The proceduresfor deriving the development-related reduction factors are presented in Appendix C Air Quality GHG DevelopmentReduction Procedures & Sea Level Rise Information.GHG EmissionsFor the purposes of this analysis, the GHG emissions are expressed in terms of their increase between future landuse if there were no action taken and future proposed land use conditions in the <strong>Gorst</strong> study area based on theaction alternatives. Alternative 1 represents the future no-action scenario that is used as the basis of comparisonto evaluate future GHG emissions from the action Alternatives 2 and 3. The emissions estimate for future land useconditions accounts for GHG emissions reductions expected as a result of existing City of Bremerton and KitsapCounty land use development goals and policies within each jurisdiction’s Comprehensive Plan.An increase in GHG emissions exceeding 10,000 metric tons per year (future action alternative compared to futureno build alternative) was considered to be significant. To evaluate the significance of the estimated GHG emissionincreases for Alternative 2, the relative future increase compared to the future no-action alternative (Alternative 1)was compared to the Washington state GHG reporting threshold for stationary industrial sources. WashingtonState GHG reporting rules (WAC 173-441-030) require that industrial facilities with stationary emission units reportannual GHG emissions if they exceed 10,000 metric tons CO2-equivalent per year. This reporting threshold is notdirectly applicable to the <strong>Gorst</strong> UGA because the rule regulates only stationary industrial sources; whereas, theestimated GHG emissions for the <strong>Gorst</strong> UGA calculated for the purposes of this evaluation are from community-<strong>Draft</strong> | June 2013 3-32
GORST PLANNED ACTION EIS | AFFECTED ENVIRONMENT, SIGNIFICANT IMPACTS, AND MITIGATION MEASURESwide sources (not including stationary industrial sources). However, the stationary source reporting threshold isrelevant for comparison purposes in demonstrating what may be considered a significant level of annual GHGemissions.GHG Emissions Calculation Methods: King County GHG SpreadsheetThe GHG emissions spreadsheet developed by King County was used to provide a screening-level estimate of lifecycle“business as usual” emissions, not including any special project-level emissions reduction measures otherthan the vehicle trip reduction measures inherent to the action alternatives’ land use patterns (King County 2013).The spreadsheet is a screening-level tool that estimates GHG emissions to construct a building, and estimates thelife-cycle emissions generated by building occupants over the presumed life of the building. The King Countyspreadsheet was originally developed for use with project-level SEPA documentation for individual developmentprojects. However, this spreadsheet was also used for this programmatic-level analysis of the <strong>Gorst</strong> study areabecause it is the best available screening-level tool to forecast trends in GHG emissions associated with each of thealternatives. The available input data used for the GHG emission calculations was limited to aggregate squarefootages for commercial and industrial development, and aggregate housing units for single and multiple familyhousing. Given those limitations in the input data, the King County spreadsheet is considered an adequatescreening-level tool for purposes of forecasting GHG emission rates.The King County spreadsheet uses statewide estimates for vehicle travel, building occupancy, and space heating,and allows the user to enter more site-specific values for key assumptions. For this analysis, a limited number ofdefault factors were adjusted to account for information specific to the study area. Specifically, the followingvalues were adjusted:• For the analysis of future years the default value for the average fuel economy was increased to 54.5 miles pergallon to reflect EPA’s newly proposed Corporate Average Fuel Economy (CAFE) vehicle mileage standard for2025. For the analysis of the existing condition the spreadsheet’s default fuel economy of 19.8 miles per gallonwas used. Based on that improvement in future fuel economy, the King County spreadsheet’s default value forper-capita GHG emissions was further reduced to 1.79 metric tons CO2 per capita.• As noted above, the City of Bremerton and Kitsap County Comprehensive Plans contain goals and policies thatencourage greater development density within the UGA, encourage pedestrian and bicycle path connectivitybetween neighborhoods, and encourage development patterns within the UGA that support transit use. Thesegoals and policies are expected to reduce GHG emissions compared to traditional development by reducingvehicle trips and fuel usage. For this assessment, the percent reductions in vehicle usage and thecorresponding GHG emissions reductions for new development were derived based on the SacramentoMetropolitan Air Quality Management District (SMAQMD) document Recommended Guidance for Land UseEmission Reductions. The district’s methodology uses a scoring system to estimate GHG emissions reductionfor a new development based on a number of development factors (SMAQMD 2010). The methodologyestimates GHG reductions only as a result of reduced vehicle trip generation. A 4 percent reduction in VMTand transportation-related GHG emissions was given for the <strong>Gorst</strong> UGA based on Kitsap County and City ofBremerton-specific development goals and policies.The spreadsheet assumes the commercial and industrial buildings in Washington State will be occupied forbetween 58 to 62 years, and estimates life-cycle emissions within that time period. Three types of life-cycleemissions are estimated by the King County spreadsheet: embodied, energy, and transportation emissions.• Embodied emissions are generated by construction of the building, including extraction, production, andeventual disposal of the building materials used to construct the structure. These do not include embodiedemissions during the operating life of the facility to account for consumer productions purchased by residentsand workers.<strong>Draft</strong> | June 2013 3-33
GORST PLANNED ACTION EIS | AFFECTED ENVIRONMENT, SIGNIFICANT IMPACTS, AND MITIGATION MEASURES• Energy emissions are generated by space heating and electrical supply to the building during its lifespan. Thespreadsheet incorporates energy intensity factors specific to Washington State.• Transportation emissions include tailpipe emissions generated by on-road vehicles used by building occupantsafter the building is constructed. For purposes of calculating GHG emissions for this screening-levelprogrammatic analysis all of the forecast commercial space was aggregated into the single land use category“Office”. Additionally, the forecast industrial space was aggregated into the single land use category “Other”.The transportation emissions do not account for vehicles passing through the <strong>Gorst</strong> study area, unless they aredirectly associated with the buildings being evaluated. These emissions account for “upstream” emissionsduring extraction and refining of the fossil fuel used over the lifespan of the building. The transportationemissions for the commercial and industrial land use categories account only for the employees working inthat space, but they do not account for the relatively small amount of vehicle travel by delivery trucks carryinggoods to or from the buildings. In addition, they do not account for vehicle travel by customers at retail orcommercial buildings. The spreadsheet was modified to assume a future fleet-wide fuel economy of 54.5 milesper gallon, consistent with EPA’s newly proposed CAFE vehicle mileage standard for 2025.“Soil Carbon” GHG Emissions from Permanent Removal of BiomassThe general term “soil carbon GHG emissions” refers to the effect of permanently removing existing vegetation forpurposes of constructing new development. This exacerbates global climate change by two mechanisms. First, theexisting biomass consisting of above-ground vegetation and below ground root mass is immediately removed anddisposed of, which immediately causes the biomass to decay and release carbon dioxide (CO2) to the atmosphere.Second, the above-ground vegetation that was permanently removed is no longer available to remove CO2 fromthe atmosphere during natural photosynthesis.The “soil carbon” GHG emission rates for each alternative were estimated using the calculation tool developed byBuild Carbon Neutral (Build Carbon Neutral 2013). That tool queries the user for the acreage of the vegetation typethat is removed, and then displays the annualized GHG emission rate.Tailpipe Emission Reductions Provided by Development Goals and PoliciesDevelopment goals and policies in the <strong>Gorst</strong> UGA are expected to reduce GHG emissions compared to traditionaldevelopment by reducing vehicle trips and fuel usage. As described above, for this assessment, the percentreductions in vehicle usage and the corresponding GHG emissions reductions for new development were derivedbased on the 2010 SMAQMD guidance document. The methodology described in the guidance documentestimates GHG reductions only as a result of reduced vehicle trip generation, but it does not attempt to estimateGHG reductions provided by other mitigation measures such as use of recycled building materials, improvedthermal insulation, reduced electricity consumption, or reduced waste generation.Within the <strong>Gorst</strong> UGA, development goals and policies from the City of Bremerton and Kitsap CountyComprehensive Plans were used to develop a development reduction factor for GHG emissions. Details on how thedevelopment strategies were used to adjust the transportation-related GHG emissions are provided in Appendix CAir Quality GHG Development Reduction Procedures & Sea Level Rise Information. The estimated percentage ofemissions reductions compared to future conditions without these development strategies (business as usual) foreach alternative was calculated to be four percent (transportation-related GHG emissions were reduced by fourpercent). Thus, per-capita and per square foot future trip generation and regional VMT values for the alternativeswere reduced by four percent compared to existing conditions.The procedures for deriving the development-related reduction factors are provided in Appendix C Air Quality GHGDevelopment Reduction Procedures & Sea Level Rise Information. The development reduction factors applied forthis analysis apply only to the land use design features inherent to the general location of the <strong>Gorst</strong> UGA; they donot attempt to account for additional project-specific design features that might be implemented for individualfuture developments in the <strong>Gorst</strong> UGA.<strong>Draft</strong> | June 2013 3-34
GORST PLANNED ACTION EIS | AFFECTED ENVIRONMENT, SIGNIFICANT IMPACTS, AND MITIGATION MEASURES<strong>Impact</strong>sIndirect impacts caused by air pollutant emissions from stationary sources and motor vehicle tailpipes arediscussed. In addition, indirect and cumulative impacts of the alternatives’ contribution to regional growth, travel,and GHG emissions are addressed.<strong>Impact</strong>s Common to All AlternativesThis section describes the qualitative air quality issues associated with all alternatives within the <strong>Gorst</strong> UGA andthe <strong>Gorst</strong> Watershed.Construction <strong>Impact</strong>sDuring construction, dust from excavation and grading could cause temporary, localized increases in the ambientconcentrations of fugitive dust and suspended particulate matter. Construction activity must comply with PSCAAregulations requiring reasonable precautions to minimize dust emissions (Regulation I, Section 9.15). Regardless,construction activity could cause localized fugitive dust impacts at homes and businesses near the constructionsite.Construction activities would likely require the use of diesel-powered, heavy trucks and smaller equipment such asgenerators and compressors. These engines would emit air pollutants that could slightly degrade local air quality inthe immediate vicinity of the activity. However, these emissions would be temporary and localized, and theresulting construction tailpipe emissions would likely be far outweighed by emissions from existing traffic aroundthe <strong>Gorst</strong> study area.Some construction activities could cause odors detectible to some people in the vicinity of the activity, especiallyduring paving operations using tar and asphalt. Such odors would be short-term and localized. Stationaryequipment used for the construction activities must comply with PSCAA regulations requiring the best availablemeasures to control the emissions of odor-bearing air contaminants (Regulation I, Section 9.11). In addition, noslash burning would be permitted in association.Construction equipment and material hauling could temporarily increase traffic flow on city streets adjacent to aconstruction area. If construction delays traffic enough to significantly reduce travel speeds in the area, generaltraffic-related emissions would increase.Operational <strong>Impact</strong>sEmissions from Commercial OperationsThe <strong>Gorst</strong> study area is expected to experience commercial growth. It is likely that new commercial developmentwould occur near either current or future residential property, particularly in areas where mixed-use commercialdevelopment could be interspersed with mixed-use residential developments. Unless properly controlled,stationary equipment (such as gas stations), mechanical equipment (such as commercial boilers and heating units),and trucks at loading docks at office and retail buildings could cause air pollution issues at adjacent residentialproperty. However, the new commercial facilities would be required to register their pollutant-emitting equipmentwith PSCAA (Regulation I and Regulation II). PSCAA requires all commercial facilities to use Best Available ControlTechnology to minimize emissions. The agency may require applicants with high emissions to conduct an airquality assessment to demonstrate that the proposed emissions would not expose off-site areas to odors or airquality concentrations exceeding regulatory limits. Therefore, it is unlikely that new commercial operations wouldcause significant air quality issues.Emissions from Vehicle TravelTailpipe emissions from vehicles traveling on public roads would be the major source of air pollutant emissionsassociated with the growth in the <strong>Gorst</strong> study area. Potential air quality impacts caused by increased tailpipeemissions are divided into two general categories: CO hot-spots caused by localized emissions at heavily congestedintersections and regional photochemical smog caused by combined emissions throughout the Puget Soundregion.<strong>Draft</strong> | June 2013 3-35
GORST PLANNED ACTION EIS | AFFECTED ENVIRONMENT, SIGNIFICANT IMPACTS, AND MITIGATION MEASURESLocalized Hot-Spot Air Quality <strong>Impact</strong>sDevelopment under all studied alternatives would increase vehicle travel on existing public roads. However, it isunlikely that the increased traffic and congestion would cause localized air pollutant concentrations at localintersections to form a hot-spot (i.e., a localized area where air pollutant concentrations exceed NAAQS). PSCAAoperates ambient air pollution monitors at some of the most heavily congested intersections in the Puget Soundregion, and none of those monitors have indicated exceedances over the past several years. Furthermore, ongoingEPA motor vehicle regulations have provided steady decreases in tailpipe emissions from individual vehicles, and itis possible that those continuing decreases from individual vehicles could more than offset the increase in vehicletraffic. For these reasons, it is unlikely that air quality impacts at local intersections would be significant.Regional Air Quality <strong>Impact</strong>sAlthough population and vehicle travel would increase in the <strong>Gorst</strong> study area, the increases in tailpipe emissionsfor all of the alternatives would be very small relative to the overall regional tailpipe emissions within the PugetSound air basin. Photochemical smog (the regional haze produced by ozone and fine particles) is caused byregional emissions throughout the Puget Sound region, rather than localized emissions from any individualneighborhood. Photochemical smog was a serious concern in the Puget Sound region before the late 1980s, butfederal tailpipe emission regulations have reduced vehicular emissions to the point that the region is currently adesignated attainment area for ozone.Prior to 2007, when the Puget Sound region was designated a nonattainment area or maintenance area for ozone,PSRC was required to periodically forecast regional tailpipe emissions of ozone precursors (nitrogen oxide [NOx]and VOC). To forecast the contribution of regional tailpipe emissions with regards to regional ozoneconcentrations, Ecology’s State Implementation Plan for ozone previously set allowable emissions budgets forPuget Sound regional transportation emissions, with the understanding that as long as regional emissions werebelow the allowable budgets then photochemical smog impacts would have been unlikely to resume. Regionaltransportation emission budgets were set for NOx and VOCs. Based on the most recent previous air qualityconformity analysis conducted by PSRC for ozone, forecasted regional emissions for its 2030 planning year were farbelow the allowable budgets (PSRC 2007):• NOx: 16 percent of budget• VOCs: 21 percent of budgetThus, PSRC’s 2007 analysis indicated the forecasted Puget Sound regional tailpipe emissions of NOx and VOC forthe 2030 planning year were well below the levels that would have caused an exceedance of the NAAQS. Becausethe increase in tailpipe emissions in the <strong>Gorst</strong> study area for the alternatives is very small compared to the overallregional tailpipe emissions (refer to Table 3.3-5 <strong>Gorst</strong> UGA Contribution to Forecast 2035 Puget Sound RegionalVMT) in the Puget Sound and because the region is currently designated an attainment area, it is concluded thatnone of the alternatives would result in a significant impact on regional air quality.Mobile Source Air ToxicsFuture development might require future improvements to existing roadways. When a street is widened and, as aresult, moves closer to receptors, the localized level of mobile source air toxics emissions could be higher, but thiscould be offset due to reductions in congestion (which are associated with lower mobile source air toxicsemissions). Furthermore, on a regional basis, EPA’s vehicle and fuel regulations (coupled with ongoing future fleetturnover) will over time cause substantial reductions that will cause region-wide mobile source air toxics levels tobe significantly lower than today in most cases.Local and Regional GHG EmissionsAs described later in this section, all of the alternatives would increase localized GHG emissions within the <strong>Gorst</strong>UGA as a result of localized increases in population and employment. Total gross GHG emissions for Washington<strong>Draft</strong> | June 2013 3-36
GORST PLANNED ACTION EIS | AFFECTED ENVIRONMENT, SIGNIFICANT IMPACTS, AND MITIGATION MEASURESState were estimated to exceed 101,000,000 metric tons CO2-equivalent in 2008 (Ecology 2010b). By comparison,the increase in GHG emissions associated with all of the alternatives would be a very small fraction of total GHGemissions within Washington State; therefore, GHG impacts caused by increased development in the <strong>Gorst</strong> UGAwould not be significant.As listed in Table 3.3-4 Comparison of Annual GHG Emissions in the <strong>Gorst</strong> Watershed, GHG emissions in the <strong>Gorst</strong>Watershed will increase by 2035. In comparison to state-wide annual GHG emissions, the relatively small increasein GHG emissions within the <strong>Gorst</strong> Watershed by 2035 is not considered significant.Note:Table 3.3-4Comparison of Annual GHG Emissions in the <strong>Gorst</strong> Watershed, Excluding the <strong>Gorst</strong> UGAGHG EmissionEstimatesAverage Annual GHG Emissions During 60-Year Project Lifetime(metric tons CO2-equivalent per year)Existing Increase by 203523,055 4,756The GHG emissions increase in the <strong>Gorst</strong> Watershed in 2035 (compared to existing conditions) is based on futurecontinuation of the no action alternative and therefore is not compared to any significance thresholds.Global Climate ChangeAs quantified in later sections, for all alternatives, future increases in population and employment would result inhigher GHG emissions in the <strong>Gorst</strong> UGA than are emitted under existing conditions. These emissions wouldcontribute to global GHG atmospheric concentrations, but would be a very small fraction of the worldwide GHGemissions. By themselves, none of the alternatives would cause discernible changes to global climate change.However, increased worldwide GHG emissions are expected to cause global climate change, and the effects willlikely impact the <strong>Gorst</strong> study area and the Pacific Northwest region. Local impacts are expected to include changesin seasonal temperatures, seasonal precipitation patterns, or local seawater rise (UWCIG 2012). Based on researchconducted by the University of Washington Climate <strong>Impact</strong>s Group and the Washington Department of Ecology sealevel is expected to rise within the Puget Sound between 3 and 22 inches by 2050 and between 6 and 50 inches by2100 (UWCIG, et al 2008). Some images showing how the range of sea level rise could theoretically affect theSinclair Inlet are found in Appendix C Air Quality GHG Development Reduction Procedures & Sea Level RiseInformation.Alternative 1The direct and indirect impacts caused by construction emissions, localized stationary source emissions, localizedCO hot-spots, and regional tailpipe emissions would be the same as described under <strong>Impact</strong>s Common to AllAlternatives.Contribution to Regional Air Pollutant EmissionsPopulation growth and daily VMT can be used as indicators of future transportation-related emissions. Table 3.3-5<strong>Gorst</strong> UGA Contribution to Forecast 2035 Puget Sound Regional VMT shows the future contribution of regionalVMT from the <strong>Gorst</strong> UGA compared to Kitsap County. The VMT generated by each alternative would increasecompared to existing conditions. Alternative 1 would produce 29,067 daily VMT, which would contribute less thanone percent of the Kitsap County regional VMT forecast for 2035. The forecasted VMT from the <strong>Gorst</strong> UGA forAlternative 1 is only a small fraction of the Kitsap County regional totals; therefore, this alternative would notresult in a significant impact on regional air quality.<strong>Draft</strong> | June 2013 3-37
GORST PLANNED ACTION EIS | AFFECTED ENVIRONMENT, SIGNIFICANT IMPACTS, AND MITIGATION MEASURESTable 3.3-5<strong>Gorst</strong> UGA Contribution to Forecast 2035 Puget Sound Regional VMTAlternative 1 Alternative 2 Alternative 3<strong>Gorst</strong> study area daily VMT1 29,067 49,350 45,707Kitsap County 2035 daily VMT2 6,602,656 6,615,322 6,604,458Contribution to Kitsap County 2035 VMT 0.4 percent 0.7 percent 0.7 percentNote:1 Daily VMT is calculated based on default values from King County GHG spreadsheet, scaled down to account for localdevelopment goals and policies: 64.5 VMT per dwelling unit for single-family housing; 44.8 VMT per dwelling unit formultifamily housing; 44.28 VMT per 1,000 square foot for commercial space; and 19.37 VMT per 1,000 square foot forindustrial space.2 Kitsap County VMT totals for 2035 (Kitsap County 2013b).Calculated GHG EmissionsFor the purposes of this analysis, the GHG emissions are expressed in terms of their increase between currentconditions and future proposed land use conditions in the <strong>Gorst</strong> study area. The emissions estimate for future landuse conditions accounts for GHG emissions reductions expected as a result of local development policies and goals.Table 3.3-2 Assumed Land Use and Population Growth for GHG Emission Calculations - <strong>Gorst</strong> UGA lists theprojected <strong>Gorst</strong> UGA land uses that were used for calculating GHG emissions for each alternative. The values listedunder “existing” represent current land use. The values listed for each alternative represent the net increasecompared to existing conditions.As listed in Table 3.3-6 Comparison of Annual GHG – <strong>Gorst</strong> UGA, Alternative 1 would increase GHG emissions in the<strong>Gorst</strong> UGA.GHG Emission EstimatesTable 3.3-6Comparison of Annual GHG Emissions – <strong>Gorst</strong> UGAAverage Annual GHG Emissions During 60-Year Project Lifetime(metric tons CO2-equivalent per year)Alternative 1 Alternative 2 Alternative 3Existing Emissions 6,374 6,374 6,374GHG Increases Compared to Existing ConditionsEmission Increase Within <strong>Gorst</strong> UGA (AlternativeMinus Existing)GHG Increases Compared to Alternative 1 (Future No <strong>Action</strong>)Emission Increase Within <strong>Gorst</strong> UGA (<strong>Action</strong>Alternative Minus Alternative 1)“Soil Carbon” GHG Emissions From Land Disturbance and Removal of BiomassSoil Carbon GHG Emissions Based on Removal ofExisting Vegetation7,474 14,371 12,922N/A 6,897 5,448120 237 237Total gross GHG emissions for Washington State were estimated to exceed 101,000,000 metric tons CO2-equivalent in 2008 (Ecology 2010b). In comparison to state-wide annual GHG emissions, the relatively smallincrease in GHG emissions within the <strong>Gorst</strong> UGA associated with Alternative 1 is not considered to be significant.Alternative 2The direct and indirect impacts caused by construction emissions, localized stationary source emissions, localizedCO hot-spots, and regional tailpipe emissions would be the same as described under <strong>Impact</strong>s Common to AllAlternatives.<strong>Draft</strong> | June 2013 3-38
GORST PLANNED ACTION EIS | AFFECTED ENVIRONMENT, SIGNIFICANT IMPACTS, AND MITIGATION MEASURESConstruction Emissions, Commercial Sources, and Air ToxicsUnder Alternative 2, the <strong>Gorst</strong> UGA is expected to experience greater population growth and less employmentgrowth than under Alternative 1 (no action); therefore, development under Alternative 2 would result in a greaterincrease in localized air pollutant emissions from construction activities and regional tailpipe emissions fromvehicle travel. However, this alternative would result in a smaller increase in commercial activities. Regardless, airquality impacts from construction activities, commercial operations, and mobile source air toxics would be similarto those described under <strong>Impact</strong>s Common to All Alternatives.Emissions from Vehicle TravelAs shown in Table 3.3-5 <strong>Gorst</strong> UGA Contribution to Forecast 2035 Puget Sound Regional VMT, the forecasted VMTfor Alternative 2 is slightly higher than the forecasted values for Alternative 1. However, the <strong>Gorst</strong> UGA VMTforecast as a result of this alternative is inconsequentially small compared to the Kitsap County VMT and itsimplied impact on regional emissions and photochemical smog. Therefore, regional air quality impacts caused bypopulation growth and transportation emissions in the <strong>Gorst</strong> UGA would not be significant under Alternative 2.GHG EmissionsThe annual GHG emissions for Alternative 2 are calculated based on the future land use listed in Table 3.3-2Assumed Land Use and Population Growth for GHG Emission Calculations - <strong>Gorst</strong> UGA and the developmentreduction described previously. Table 3.3-6 Comparison of Annual GHG Emissions - <strong>Gorst</strong> UGA lists the life-cycleGHG emissions increases caused by future development in the <strong>Gorst</strong> UGA under each alternative. Alternative 2would provide more residential growth than Alternative 1 in the <strong>Gorst</strong> UGA. Therefore, it would increase localizedGHG emissions within the <strong>Gorst</strong> UGA compared to Alternative 1. The future GHG emission increases within the<strong>Gorst</strong> UGA for Alternative 2 would be the highest of any studied alternative, though close to Alternative 3.The increase of future GHG emissions in the <strong>Gorst</strong> UGA for Alternative 2 (above what future GHG emissions areestimated for the No <strong>Action</strong> Alternative 1) is only 6,897 metric tons CO2-equivalent per year which is less than the10,000 metric tons CO2-equivalent per year reporting threshold for stationary sources. Therefore, this evaluationdemonstrates that GHG emission increases caused by increased development in the <strong>Gorst</strong> UGA (associated withAlternative 2) would not be significant.Additionally, in comparison to state-wide annual GHG emissions (101,000,000 metric tons CO2-equivalent in2008), the relatively small increase in GHG emissions within the <strong>Gorst</strong> UGA associated with Alternative 2 is notconsidered to be significant.“Soil Carbon” GHG Emissions from Biomass RemovalGHG emissions associated with soil disturbance and biomass removal was calculated based on the total acreage ofdisturbed land that is anticipated. As noted above, impacts associated with land disturbance would be greatest forAlternatives 2 and 3 (117 acres of permanent land disturbance, causing an annualized GHG emission rate of 237metric tons CO2-equivalent per year). This relatively small contribution to GHG emissions by biomass removal ismuch lower than the contribution from future operational activity. For Alternative 3 the annualized GHG emissionrate caused by biomass removal is 237 metric tons per year, while Table 3.3-6 Comparison of Annual GHGEmissions - <strong>Gorst</strong> UGA shows the increased operational GHG emission rate is 12,922 metric tons per year.Therefore, the GHG emissions caused by biomass removal are not considered significant.Alternative 3The direct and indirect impacts caused by construction emissions, localized stationary source emissions, localizedCO hot-spots, and regional tailpipe emissions would be the same as described under <strong>Impact</strong>s Common to AllAlternatives.<strong>Draft</strong> | June 2013 3-39
GORST PLANNED ACTION EIS | AFFECTED ENVIRONMENT, SIGNIFICANT IMPACTS, AND MITIGATION MEASURESConstruction Emissions, Commercial Sources, and Air ToxicsUnder Alternative 3, the <strong>Gorst</strong> UGA is expected to experience greater population growth and less employmentgrowth than under Alternative 1. Development under this alternative would result in a greater increase in localizedair pollutant emissions from construction activities and regional tailpipe emissions from vehicle travel. However,this alternative would result in a smaller increase in commercial activities compared to Alternative 1. Regardless,air quality impacts from construction activities, commercial operations, and mobile source air toxics would besimilar to those described under <strong>Impact</strong>s Common to All Alternatives.Emissions from Vehicle TravelAs shown in Table 3.3-5 <strong>Gorst</strong> UGA Contribution to Forecast 2035 Puget Sound Regional VMT, the forecasted VMTfor Alternative 3 is higher than the forecasted values for Alternative 1. However, the net increases in VMT forecastas a result of this alternative are inconsequentially small compared to the Kitsap County VMT forecast for 2035 andits implied impact on regional emissions and photochemical smog. Therefore, regional air quality impacts causedby population growth and transportation emissions in the <strong>Gorst</strong> UGA (associated with Alternative 3) would not besignificant.GHG EmissionsThe annual GHG emissions for Alternative 3 are calculated based on the future land use listed in Table 3.3-2Assumed Land Use and Population Growth for GHG Emission Calculations - <strong>Gorst</strong> UGA and the developmentreduction described previously. Table 3.3-6 Comparison of Annual GHG Emissions - <strong>Gorst</strong> UGA lists the life-cycleGHG emissions increases caused by future development in the <strong>Gorst</strong> UGA under each alternative. The future GHGemission increases within the <strong>Gorst</strong> UGA for Alternative 3 would be higher than the GHG emission increasesresulting from Alternative 1, but less than the GHG emission increases resulting from Alternative 2.Alternative 3 would provide more residential growth in the <strong>Gorst</strong> UGA than Alternative 1. Therefore, it wouldincrease localized GHG emissions within the <strong>Gorst</strong> UGA compared to Alternative 1. The increase of future GHGemissions in the <strong>Gorst</strong> UGA for Alternative 3 (above what future GHG emissions are estimated for the No <strong>Action</strong>Alternative 1) is only 5,448 metric tons CO2-equivalent per year which is less than the 10,000 metric tons CO2-equivalent per year reporting threshold for stationary sources. Therefore, this evaluation demonstrates that GHGimpacts caused by increased development in the <strong>Gorst</strong> UGA (associated with Alternative 3) would not besignificant.Additionally, in comparison to state-wide annual GHG emissions (101,000,000 metric tons CO2-equivalent in2008), the relatively small increase in GHG emissions within the <strong>Gorst</strong> UGA associated with Alternative 3 is notconsidered to be significant.“Soil Carbon” GHG Emissions From Biomass RemovalGHG emissions associated with soil disturbance and biomass removal was calculated based on the total acreage ofdisturbed land that is anticipated. As noted above, impacts associated with land disturbance would be greatest forAlternatives 2 and 3 (117 acres of permanent land disturbance, causing an annualized GHG emission rate of 237metric tons CO2-equivalent per year). This relatively small contribution to GHG emissions by biomass removal ismuch lower than the contribution from future operational activity. For Alternative 3 the annualized GHG emissionrate caused by biomass removal is 237 metric tons per year, while Table 3.3-6 Comparison of Annual GHGEmissions - <strong>Gorst</strong> UGA shows the increased operational GHG emission rate is 12,922 metric tons per year.Therefore, the GHG emissions caused by biomass removal are not considered significant.Indirect/Cumulative <strong>Impact</strong>sDevelopment facilitated by the alternatives would result in indirect effects. For example, additional people andvehicles in the <strong>Gorst</strong> study area could lead to a greater concentration of pollutants that could adversely affect airquality.<strong>Draft</strong> | June 2013 3-40
GORST PLANNED ACTION EIS | AFFECTED ENVIRONMENT, SIGNIFICANT IMPACTS, AND MITIGATION MEASURESEvery alternative would slightly increase regional VMT, which would contribute to tailpipe emissions throughoutthe Puget Sound region. When added to the forecast population and economic growth throughout the region, theincreased emissions caused by development in the <strong>Gorst</strong> study area could slightly contribute to future worseningof air regional quality.Future development within the <strong>Gorst</strong> study area would also contribute to worldwide emissions of GHG, whichwould contribute to potential future effects caused by global climate change (e.g., changes in seasonaltemperature, seasonal precipitation, and local seawater rise).Mitigation MeasuresIncorporated Plan FeatureThe <strong>Gorst</strong> Subarea Plan includes policies promoting compact development as well as a policy on adapting to sealevel rise. It also includes policies promoting incentives for increased heights and densities, increased landscaping,and energy reduction that could encourage GHG reduction.Kitsap County Comprehensive PlanThe <strong>Gorst</strong> UGA and portions of the <strong>Gorst</strong> Watershed are located within unincorporated Kitsap County. The LandUse and Transportation elements of the Kitsap County Comprehensive Plan include a number of goals and policiesthat could contribute to reducing GHG emissions, including:• LAND USE GOAL 6: Encourage and reinforce development patterns within UGAs that are distinct from those inrural areas:oooPolicy LU-26. Encourage compact development patters within UGAs, allowing for efficiencies intransportation and utilities, as well as public and capital facilities.Policy LU-28. Encourage development patterns in UGAs that support pedestrian connectivity betweenneighborhoods and community destinations where possible.Policy LU-29. Encourage development patterns in UGAs that support and encourage transit use, such as inand around more intensive nodes of mixed use development along major transportation corridors, andmajor employment centers.• LAND USE GOAL 14: Provide residential areas with convenient access to transportation, urban amenities, andgoods and services:oooPolicy LU-62. Encourage non-motorized and pedestrian linkages in UGAs.Policy LU-64. Provide density incentives in the UGA to encourage the provision of significant open space,community amenities, transportation-oriented planning and high quality design.Policy LU-65. Encourage development in residential zones to occur in a manner that results in the designand construction of an interconnected system of pedestrian and bicycle trails linking residentialneighborhoods with open spaces, recreational areas, transportation corridors and retail and employmentopportunities.• LAND USE GOAL 15: Focus most commercial growth within the UGAs where most of the Kitsap County's futurepopulation growth will be guided and where urban public services and facilities will be provided:oPolicy LU-69. Create a new Mixed Use zone, which focuses on pedestrian-friendly urban development, tobe applied within UGAs.• LAND USE GOAL 18: Encourage an attractively designed commercial land use pattern:oPolicy LU-87. Encourage commercial areas to be compact to encourage pedestrian and non-motorizedtravel and transit use.<strong>Draft</strong> | June 2013 3-41
GORST PLANNED ACTION EIS | AFFECTED ENVIRONMENT, SIGNIFICANT IMPACTS, AND MITIGATION MEASURESoPolicy LU-88 Encourage mixed use development that contributes to a compact, pedestrian-oriented landuse pattern at selected locations within the urban area.• LAND USE GOAL 21: Ensure compatibility of industrial uses with neighboring areas.oPolicy LU-111. Provide development regulations that contain minimum performance standards for noise,vibration, smoke and particulate matter, odors, heat and glare and other aspects as appropriate, whichshall address potential environmental impacts and ensure compatibility with adjacent land uses includingresidential neighborhoods.• TRANSPORTATION GOAL 4: Provide the public with the opportunity to make choices among alternativemodes of travel:ooPolicy T-11. Provide a transportation system that allows people to get to and from their destination in anacceptable time period via alternative mode options.Policy T-12. Support and encourage high occupancy vehicle (HOV) and transit use.• TRANSPORTATION GOAL 10: Coordinate land use and transportation planning to help manage growth:oooPolicy T-36. Encourage Transit Oriented Development (TOD) that supports compact growth by designatinghigher density zones near ferry terminals and near transit stations that generate pedestrian activity.Policy T-39. Increase the percentage of Kitsap County residents located within reasonable walkingdistance of designated transit stops.Policy T-40. Encourage the location of development to minimize vehicle miles of travel.• TRANSPORTATION GOAL 11: Where appropriate, designate and encourage mixed use, high density uses, andTOD to reduce reliance on the single occupancy vehicle (SOV):ooPolicy T-42. Develop and implement transit-supportive design standards and facilities for all residential,commercial and institutional developments.Policy T-43. Encourage pedestrian linkages between parking lots and adjacent land uses.• TRANSPORTATION GOAL 12: Promote High Capacity Transit to the greatest extent feasible as an alternative tothe SOV:ooooPolicy T-44. Design roadways classified as minor arterial or higher to accommodate transit vehicles.Policy T-45. Coordinate with Kitsap Transit to develop a transit supportive transportation system.Policy T-52. Maintain the Kitsap County Commute Trip Reduction (CTR) program and make every effort toreduce Kitsap County employee SOV trips.Policy T-54. Increase the percentage of residents who can reach neighborhood retail centers using transit,and who can reach major retail shopping centers without excessive transit/transfer delay.• TRANSPORTATION GOAL 14: Maximize the opportunity for non-motorized travel, including development ofgreenways that are safe for all ages:oPolicy T-63. Require the provision of accessible bicycle/pedestrian facilities within the roadway system ofnew developments.• TRANSPORTATION GOAL 15: Build a greenways network of non-motorized on-road commuter trails and offroadrecreational trails, within and outside of road rights-of-way that interconnect open spaces, urban areas,communities, and recreational areas.oPolicy T-66. Develop a system of non-motorized transportation facilities.<strong>Draft</strong> | June 2013 3-42
GORST PLANNED ACTION EIS | AFFECTED ENVIRONMENT, SIGNIFICANT IMPACTS, AND MITIGATION MEASURES• TRANSPORTATION GOAL 17: Create a continuous non-motorized transportation system that connectsneighborhoods and integrates on- and off-road facilities:oPolicy T-69. Where future bicycle and/or pedestrian facilities are planned in corridors in which futureKitsap County roadway improvement projects (both new construction and rehabilitation projects) areplanned, include the bicycle/pedestrian facilities as part of the roadway project.• TRANSPORTATION GOAL 18: Develop a system of non-motorized transportation facilities that are constructedprimarily within the right-of-way of existing and proposed public streets or roads and that provide safetransportation between a variety of regional, inter-community and local county destinations for bicyclists andpedestrians:oPolicy T-72. Designate a system of pedestrian/bicycle facilities.oPolicy T-73. Assign top priority to the implementation of bicycle facilities and/or pedestrian facilitiesdesignated in the Kitsap County Bicycle Facilities Plan.Bremerton Comprehensive PlanPortions of the <strong>Gorst</strong> Watershed are located within the City of Bremerton. Additionally, it is anticipated that theCity of Bremerton will eventually annex the <strong>Gorst</strong> UGA. The Land Use and Transportation elements of the City ofBremerton Comprehensive Plan include a number of goals and policies that could contribute to reducing GHGemissions, including:• LAND USE GOAL LU1: Identify and enhance distinctive neighborhoods, communities, and centers throughoutthe city:oPolicy LU1L. Encourage residential designs with an orientation towards social interaction, as opposed tothe automobile.• LAND USE GOAL LU2: Integrate an open space system into the land use pattern that increases the amount ofopen space, protects Bremerton’s natural resources, and provides a source of beauty and enjoyment for allresidents:oPolicy LU2D. In order to facilitate a linked system of open space; integrate parks, schools, trails, and otheropen space features in a wide variety of land use designations.• LAND USE GOAL LU3: Create an environment that will promote growth:oPolicy LU3C. Encourage increased density with development incentives and zoning flexibility.• LAND USE GOAL LU4: Provide for walkability throughout Centers and neighborhoods:ooooPolicy LU4A. Improve pedestrian access to commercial and community services within Centers andneighborhoods.Policy LU4B. Develop pedestrian connections between residential areas and neighborhood services.Policy LU4C. Ensure land use designations and designs that support walkability within neighborhoods andthe mobility needs of the community.Policy LU4D. Ensure street design and orientation that encourage pedestrian and bicycle use.• LAND USE GOAL LU9: Create a framework for the initial implementation of Centers:ooPolicy LU9A. Design standards and/or guidelines should be developed that assure pedestrian orientedmixed-use design in Centers.Policy LU9H. Non-motorized transportation links with surrounding neighborhoods should be encouragedand existing pathways preserved.<strong>Draft</strong> | June 2013 3-43
GORST PLANNED ACTION EIS | AFFECTED ENVIRONMENT, SIGNIFICANT IMPACTS, AND MITIGATION MEASURES• LAND USE GOAL LU12: Support community-wide access to amenities and services:oPolicy LU12B. Provide recreational space and trails for pedestrians and bicyclists between communities,Centers, and neighborhoods.• TRANSPORTATION GOAL T1: Encourage the development of an integrated multi-modal transportationsystem, that provides a variety of convenient transportation choices to improve the movement of people,goods, and freight:oPolicy T1A. Require new development and redevelopment to incorporate transit, pedestrian, and nonmotorizedtransportation measures during the development review process.• TRANSPORTATION GOAL T3: Develop and maintain a transportation system that respects the naturalenvironment, including the quality of Bremerton air, water and natural habitats:oPolicy T3B. Encourage transit providers and organizations with large fleets of vehicles to utilize “green”fuel and reduce emissions/air pollution.• TRANSPORTATION GOAL T7: Develop Travel Demand Management (TDM) strategies to minimize the need foradditional transportation infrastructure and expenditure:oPolicy T7A. Continue to coordinate with local employers to implement CTR plans and programs.• TRANSPORTATION GOAL T11: Encourage transportation agencies, especially public transit, to operate andmaintain local/regional services and facilities that reduce the need for single occupant vehicles and supportthe needs of transit-dependent users:ooPolicy T11D. Support efforts to expand usage and infrastructure for mass transportation.Policy T11E. Encourage the use of public transit by bicyclists and pedestrians.• TRANSPORTATION GOAL T12: Provide a transportation system that effectively serves the needs of andencourages pedestrian, bicycle and other non-motorized travel:ooooPolicy T12A. Devise a non-motorized transportation plan.Policy T12B. Ensure that designated Centers are walkable, and encourage connectivity.Policy T12C. Maintain existing and create new engineered bike lanes.Policy T12D. Adopt street standards which require bike lanes on identified bike routes.Applicable Regulations and Commitments• NAAQS: As described above in NAAQS, EPA establishes NAAQS and specifies future dates for states to developand implement plans to achieve these standards.• State Ambient Air Quality Standards: Ecology establishes state ambient air quality standards for the same sixpollutants that are at least as stringent as the national standards; in the case of SO2, state standards are morestringent. Table 3.3-1 National and Washington State Ambient Air Quality Standards lists the state ambient airquality standards for six criteria pollutants.• Outdoor Burning: Burning yard waste and land-clearing debris is not allowed at any time in urbanized areas ofKitsap County. PSCAA enforces state outdoor burning regulations required by the Washington Clean Air Act atRCW 70.94.743.<strong>Draft</strong> | June 2013 3-44
GORST PLANNED ACTION EIS | AFFECTED ENVIRONMENT, SIGNIFICANT IMPACTS, AND MITIGATION MEASURES• Puget Sound Clean Air Agency Regulations: All construction sites in the Puget Sound region are required toimplement rigorous emission controls to minimize fugitive dust and odors during construction, as required byPSCAA Regulation 1, Section 9.15, Fugitive Dust Control Measures. All industrial and commercial air pollutantsources in the Puget Sound region are required to register with PSCAA. Facilities with substantial emissions arerequired to obtain a Notice of Construction air quality permit before construction is allowed to begin.• State of Washington GHG Laws: As described above in State of Washington GHG Requirements, Washingtonenacted a new law establishing GHG reduction limits.• City of Bremerton SKIA Subarea Plan: A subarea plan for SKIA was adopted in 2012. A portion of the <strong>Gorst</strong>Watershed is located within the SKIA subarea. The SKIA subarea plan contains development incentives andrequirements to ensure sustainable development and reduce GHG emissions, including:oooooCTR. Once total new employment within SKIA has exceeded 2,000 new employees (resulting from actionspermitted under the <strong>Planned</strong> <strong>Action</strong> Ordinance), all employers with 50 or more employees shall berequired to participate in the CTR Program.Bicycle Facilities. Bicycle parking shall be provided at 10 percent of the required automobile spaces.Neighborhood Electric Vehicles. Neighborhood Electric Vehicles and Electric Golf Carts shall be allowedon all pedestrian pathways within SKIA that are constructed to the standards contained in SectionC.5.050. Neighborhood Electric vehicles shall also be allowed on all public roadways in SKIA where theiruse is not otherwise prohibited by state or local law (e.g. roadways with a maximum speed limit of 25miles per hour or less are suitable).Non-Motorized Facilities. The trail system in SKIA is intended to form a loop, making non-motorizedconnections throughout the entire Subarea.Energy-Efficient Lighting. Light emitting diode (LED) lighting is encouraged. To the greatest extentfeasible, all light fixtures and bulbs should meet the requirements for certification by the ENERGY STARprogram.• Kitsap County Energy Efficiency and Conservation Plan: In 2011, the Kitsap County developed an EnergyEfficiency and Conservation Plan, which is focused on achieving greater energy efficiency and reducing GHGemissions. The plan outlines a list of recommendations that once implemented would serve to increase energyefficiency and reduce GHGs. A summary of some of the key recommendations are provided as follows:oooooBuilding Design. Incorporate energy efficiency standards into planning and design for any newconstruction, renovation project, or lease agreements.Operations and Maintenance. Adopt an energy conservation policy setting clear goals and guidelines formaximizing the efficiency of building operations.External Energy Use. Survey all parking lot and external building lights and identify retrofit opportunities.Transportation and Fleets. Establish goals to increase fuel efficiency and the use of alternative fuels forthe county fleet. Enhance the CTR program and associated employee training to reduce fuel use andemissions.Renewable Energy. Identify potential opportunities for renewable energy projects on existing and futurecounty buildings. Identify and acquire sources of renewable energy and/or fuel for county operations.• Kitsap County Initiatives: Kitsap County has already pursued a number of local projects related to energyefficiency and climate change including the following shown in Table 3.3-7 Kitsap County Climate ChangeResponsive Projects.<strong>Draft</strong> | June 2013 3-45
GORST PLANNED ACTION EIS | AFFECTED ENVIRONMENT, SIGNIFICANT IMPACTS, AND MITIGATION MEASURESTable 3.3-7Kitsap County Climate Change Responsive ProjectsTransportation Buildings Infrastructure Policies/OtherHybrid vehicles purchased Building Retrofits LED Pedestrian DisplayRetrofitsUsing Space Heaters in KitsapCounty FacilitiesInstall Diesel OxidationCatalysts on Kitsap CountyDump TrucksSolar Hot Water CollectorSystems InstalledLED Traffic Signal RetrofitsHome Energy AssessmentIncentivesVehicle Take Home Policy High efficiency boiler system Computer Room/ServerEnergy EfficiencyImprovementsEnergy Efficiency LoanProgram for HomeownersVehicle Anti-idling and FuelConservationEnergy Efficient LightingRetrofitsSolar Powered TrashCompactor InstallationDevelopment of KitsapCounty Energy PlanTelecommuting forEmployeesHVAC retrofitsGrant Funds Available forKitsap County Home BuildersAssociation WeatherizationSource: Kitsap County 2013aOther Potential Mitigation MeasuresConstruction Emission ControlKitsap County and the City of Bremerton should require all construction contractors to implement air qualitycontrol plans for construction activities in the <strong>Gorst</strong> study area. Kitsap County and the City of Bremerton shouldrequire all future developers to prepare a dust control plan that commits the construction crews to implement allreasonable control measures described in the Associated General Contractors of Washington’s Guide to HandlingFugitive Dust from Construction Projects. Copies of that guidance document are distributed by PSCAA. The airquality control plans should include BMPs to control fugitive dust and odors emitted by diesel constructionequipment.The following BMPs would be used to control fugitive dust.• Use water sprays or other non-toxic dust control methods on unpaved roadways.• Minimize vehicle speed while traveling on unpaved surfaces.• Prevent track-out of mud onto public streets.• Cover soil piles when practical.• Minimize work during periods of high winds when practical.The following mitigation measures should be used to minimize air quality and odor issues caused by tailpipeemissions.• Maintain the engines of construction equipment according to manufacturers’ specifications.• Minimize idling of equipment while the equipment is not in use.If there is heavy traffic during some periods of the day, scheduling haul traffic during off-peak times (e.g., between9:00 a.m. and 4:00 p.m.) would have the least effect on traffic and would minimize indirect increases in trafficrelated emissions.<strong>Draft</strong> | June 2013 3-46
GORST PLANNED ACTION EIS | AFFECTED ENVIRONMENT, SIGNIFICANT IMPACTS, AND MITIGATION MEASURESBurning of slash or demolition debris will not be permitted without express approval from PSCAA. No slash burningis anticipated for any construction projects in the <strong>Gorst</strong> study area.GHG Reduction MeasuresWashington State has established GHG reductions with 2020 (1990 levels), 2035 (20 percent reduction below1990) and 2050 (50 percent reduction below 1990) limits and adopted requirements for capital investments, anenergy strategy, and VMT reduction targets. However, neither Ecology nor EPA has adopted numerical GHGemissions standards, GHG reduction requirements, or numerical GHG significance thresholds that direct localgovernment land use development actions. It is the City of Bremerton’s and Kitsap County’s responsibility toimplement its GHG reduction requirements for new developments.As noted above, development requirements within the SKIA Subarea Plan will help to mitigate GHG impacts withina portion of the <strong>Gorst</strong> Creek Watershed. Additionally, Kitsap County has established an Energy Efficiency andConservation Plan that outlines energy conservation and GHG emissions reduction measures, some of which couldpotentially reduce GHG impacts within the <strong>Gorst</strong> study area. Also, Kitsap County has already implemented manyinitiatives (as described above) that have increased energy efficiency and are aimed at reducing climate changeimpacts. As part of the pending planned action ordinance under consideration, the Kitsap County and the City ofBremerton could require or encourage future developers to implement additional trip-reduction measures andenergy conservation measures that could provide even greater GHG reductions. GHG emissions reductions couldbe provided by using building design and construction methods to use recycled construction materials, reducespace heating and electricity usage, incorporate renewable energy sources and reduce water consumption andwaste generation.Table 3.3-8 Potential GHG Reduction Mitigation Measures lists a variety of mitigation measures that could reduceGHG emissions caused by transportation facilities, building construction, space heating, and electricity usage(Ecology 2008). The table lists potential GHG reduction measures and indicates where the emission reductionsmight occur.Kitsap County and the City of Bremerton could require development applicants to consider the reduction measuresshown in Table 3.3-8 Potential GHG Reduction Mitigation Measures for their projects. Kitsap County and the City ofBremerton can incorporate potential GHG reduction measures through its goals, policies, or regulations, includingthe proposed <strong>Planned</strong> <strong>Action</strong> Ordinance.<strong>Draft</strong> | June 2013 3-47
GORST PLANNED ACTION EIS | AFFECTED ENVIRONMENT, SIGNIFICANT IMPACTS, AND MITIGATION MEASURESReduction MeasuresSite DesignRetain and enhance vegetated open spaces.Plant trees and vegetation near structures to shade buildings.Minimize building footprint.Design water efficient landscaping.Minimize energy use through building orientation.Table 3.3-8Potential GHG Reduction Mitigation MeasuresCommentsRetains or increases sequestration by plants.Reduces on-site fuel combustion emissions and purchased electricity, and enhancescarbon sinks.Reduces on-site fuel combustion emissions and purchased electricity consumption,materials used, maintenance, land disturbance, and direct construction emissions.Minimizes water consumption, purchased energy, and upstream emissions from watermanagement.Reduces on-site fuel combustion emissions and purchased electricity consumption.Building Design and OperationsApply LEED standards (or equivalent) for design and operations.Purchase Energy Star equipment and appliances for public agency use.Incorporate on-site renewable energy production, including installation of photovoltaiccells or other solar options.Design street lights to use energy-efficient bulbs and fixtures.Construct “green roofs” and use high-albedo roofing materials.Install high-efficiency HVAC systems.Eliminate or reduce use of refrigerants in HVAC systems.Maximize interior day lighting through floor plates, increased building perimeter and use ofskylights, celestories, and light wells.Incorporate energy efficiency technology such as super insulation motion sensors forlighting and climate-control-efficient, directed exterior lighting.Use water-conserving fixtures that surpass building code requirements.Reduces on-site fuel combustion emissions and off-site/indirect purchased electricity,water use, waste disposal.Reduces on-site fuel combustion emissions and purchased electricity consumption.Reduces on-site fuel combustion emissions and purchased electricity consumption.Reduces purchased electricity.Reduces on-site fuel combustion emissions and purchased electricity consumption.Minimizes fuel combustion and purchased electricity consumption.Reduces fugitive emissions. Compare refrigerant usage before/after to determine GHGreduction.Increases natural/day lighting initiatives and reduces purchased electrical energyconsumption.Reduces fuel combustion and purchased electricity consumption.Reduces water consumption.<strong>Draft</strong> | June2013 3-48
GORST PLANNED ACTION EIS | AFFECTED ENVIRONMENT, SIGNIFICANT IMPACTS, AND MITIGATION MEASURESReduction MeasuresReuse gray water and/or collect and reuse rainwater.Use recycled building materials and products.Use building materials that are extracted and/or manufactured within the region.Use rapidly renewable building materials.Conduct third-party building commissioning to ensure energy performance.Track energy performance of building and develop strategy to maintain efficiency.CommentsReduces water consumption with its indirect upstream electricity requirements.Reduces extraction of purchased materials, possibly reduces transportation ofmaterials, encourages recycling and reduction of solid waste disposal.Reduces transportation of purchased materials.Reduces emissions from extraction of purchased materials.Reduces fuel combustion and purchased electricity consumption.Reduces fuel combustion and purchased electricity consumption.TransportationSize parking capacity to not exceed local parking requirements and, where possible, seekreductions in parking supply through special permits or waivers or <strong>Gorst</strong>-specific parkingstandards or incentives.Develop and implement a marketing/information program that includes posting anddistribution of ridesharing/transit information.Subsidize transit passes. Reduce employee trips during peak periods through alternativework schedules, telecommuting, and/or flex time. Provide a guaranteed-ride-homeprogram.Provide bicycle storage and showers/changing rooms.Reduced parking discourages auto-dependent travel, encouraging alternative modessuch as transit, walking, and biking. Reduces direct and indirect VMT.Reduces direct and indirect VMT.Reduces employee VMT.Reduces employee VMT.Use traffic signalization and coordination to improve traffic flow and support pedestrianand bicycle safety.Apply advanced technology systems and management strategies to improve operationalefficiency of local streets.Develop shuttle systems around business district parking garages to reduce congestion andcreate shorter commutes.LEED = Leadership in Energy and <strong>Environmental</strong> Design; HVAC = heating, ventilation, and air-conditioningSource: Ecology 2008bReduces transportation emissions and VMT.Reduces emissions from transportation by minimizing idling and maximizingtransportation routes/systems for fuel efficiency.Reduces idling fuel emissions and direct and indirect VMT.<strong>Draft</strong> | June 2013 3-49
GORST PLANNED ACTION EIS | AFFECTED ENVIRONMENT, SIGNIFICANT IMPACTS, AND MITIGATION MEASURESIn addition to the representative GHG reduction mitigation measures listed in Table 3.3-8 Potential GHG ReductionMitigation Measures, additional vehicle trip reduction measures and land-use-related GHG reduction measureshave been published by various air quality agencies. For example, Table 3.3-9 SMAQMD Recommended Measuresfor Land Use Emission Reductions lists the emission reduction measures developed by SMAQMD, 2010. The tablelists SMAQMD’s estimated “mitigation points” value, where each point value corresponds to the percent reductionin emissions. For example, a mitigation point value of 1.0 corresponds to a one percent reduction in land-userelatedemissions. SMAQMD developed this table to quantify reductions in criteria pollutant emissions, but thelisted measures would also generally reduce GHG emissions.Table 3.3-9SMAQMD Recommended Measures for Land Use Emission ReductionsMeasureNumber Title DescriptionBicycle/Pedestrian/Transit Measures1 Bike parking Non-residential projects provide plentiful short-term and long-termbicycle parking facilities to meet peak season maximum demand.2 End of trip facilities Non-residential projects provide “end-of-trip” facilities includingshowers, lockers, and changing space.3 Bike parking atmulti-unitresidential4 Proximity to bikepath/bike lanesLong-term bicycle parking is provided at apartment complexes orcondominiums without garages.Entire project is located within 1/2 mile of an existing Class I or Class IIbike lane and project design includes a comparable network thatconnects the project uses to the existing offsite facility.5 Pedestrian network The project provides a pedestrian access network that internally linksall uses and connects to all existing or planned external streets andpedestrian facilities contiguous with the project site.MitigationPoints0.6250.6250.6250.6251.06 Pedestrian barriersminimizedSite design and building placement minimize barriers to pedestrianaccess and interconnectivity. Physical barriers such as walls, berms,landscaping, and slopes between residential and non-residential usesthat impede bicycle or pedestrian circulation are eliminated.1.07 Bus shelter forexisting transitservice8 Bus shelter forplanned transitserviceBus or Streetcar service provides headways of one hour or less forstops within 1/4 mile; project provides safe and convenientbicycle/pedestrian access to transit stop(s) and provides essentialtransit stop improvements (i.e., shelters, route information, benches,and lighting).Project provides transit stops with safe and convenientbicycle/pedestrian access. Project provides essential transit stopimprovements (i.e., shelters, route information, benches, and lighting)in anticipation of future transit service.0.25-1.00.259 Traffic calming Project design includes pedestrian/bicycle safety and traffic calmingmeasures in excess of jurisdiction requirements. Roadways aredesigned to reduce motor vehicle speeds and encourage pedestrianand bicycle trips by featuring traffic calming features.0.25-1.0Parking Measures10a Paid parking Employee and/or customer paid parking system 1.0-7.2<strong>Draft</strong> | June 2013 3-50
GORST PLANNED ACTION EIS | AFFECTED ENVIRONMENT, SIGNIFICANT IMPACTS, AND MITIGATION MEASURESMeasureNumber Title Description10b Parking cash out Employer provides employees with a choice of forgoing subsidizedparking for a cash payment equivalent to the cost of the parking spaceto the employer.MitigationPoints0.6-4.511 Minimum parking Provide minimum amount of parking required. Special review ofparking required.0.1-6.012 Parking reductionbeyond codeProvide parking reduction less than code. Special review of parkingrequired. Recommend a Shared Parking strategy.0.1-1213 Pedestrian pathwaythrough parkingProvide a parking lot design that includes clearly marked and shadedpedestrian pathways between transit facilities and building entrances.0.514 Off street parking Parking facilities are not adjacent to street frontage. 0.1-1.5Site Design Measures15 Office/Mixed-usedensityProject provides high density office or mixed-use proximate to transit. 0.1-2.016 Orientation toexisting transit,bikeway, orpedestrian corridor17 Orientation towardplanned transit,bikeway, orpedestrian corridorProject is oriented towards existing transit, bicycle, or pedestriancorridor. Setback distance is minimized.Project is oriented towards planned transit, bicycle, or pedestriancorridor. Setback distance is minimized.0.50.2518 Residential density Project provides high-density residential development. 1.0-1219 Street grid Multiple and direct street routing (grid style). 1.020 Neighborhoodelectric vehicleaccessMake physical development consistent with requirements forneighborhood electric vehicles.0.5-1.521 Affordable housingcomponentMixed-use MeasuresResidential development projects of 5 or more dwelling units provide adeed-restricted low-income housing component on-site (as defined inCh 22.35 of Sacramento County Ordinance Code) [Developers who payinto In-Lieu Fee Programs are not considered eligible to receive creditfor this measure].22 Urban mixed-use Development of projects predominantly characterized by properties onwhich various uses, such as office, commercial, institutional, andresidential, are combined in a single building or on a single site in anintegrated development project with functional interrelationships anda coherent physical design.23 Suburban mixeduseHave at least three of the following on site and/or offsite within ¼ mile:Residential Development, Retail Development, Park, Open Space, orOffice.0.6-4.03.0-9.03.024 Other mixed-use All residential units are within ¼ mile of parks, schools or other civicuses.1.0<strong>Draft</strong> | June 2013 3-51
GORST PLANNED ACTION EIS | AFFECTED ENVIRONMENT, SIGNIFICANT IMPACTS, AND MITIGATION MEASURESMeasureNumber Title DescriptionBuilding Component MeasuresMitigationPoints25 No fireplace Project does not feature fireplaces or wood burning stoves. 1.026 Reserved for futuremeasure27 Energy Star roof Install Energy Star labeled roof materials. 0.5-1.028 Onsite renewableenergy systemProject provides onsite renewable energy system(s). 1.0-3.030 Solar orientation Orient 75 or more percent of homes and/or buildings to face eithernorth or south (within 30 degrees of N/S).31 Non-roof surfaces Provide shade (within 5 years) and/or use light-colored/high-albedomaterials (reflectance of at least 0.3) and/or open grid pavement for atleast 30 percent of the site's non-roof impervious surfaces, includingparking lots, walkways, plazas, etc.; OR place a minimum of 50 percentof parking spaces underground or covered by structured parking; ORuse an open-grid pavement system (less than 50 percent impervious)for a minimum of 50 percent of the parking lot area. Unshaded parkinglot areas, driveways, fire lanes, and other paved areas have a minimumalbedo of.3 or greater.0.51.032 Green roof Install a vegetated roof that covers at least 50 percent of roof area. 0.5TDM and Miscellaneous Measures33 TransportationManagementAssociationmembershipInclude permanent TMA membership and funding requirement.Funding to be provided by Community Facilities District or KitsapCounty Service Area or other non-revocable funding mechanism.5.034 Electric lawnmower Provide a complimentary electric lawnmower to each residential buyer. 1.099 Other Other proposed strategies, in consultation with project lead agency andSMAQMD.To BeDeterminedAdaptation to Climate Change <strong>Impact</strong>sPortions of the <strong>Gorst</strong> UGA may be susceptible to future sea level rise due to its close proximity to Sinclair Inlet.Based on research conducted by the University of Washington Climate <strong>Impact</strong>s Group and the WashingtonDepartment of Ecology sea level is expected to rise within the Puget Sound between three and 22 inches by 2050and between six and 50 inches by 2100 (UW CIG et al 2008). The Kitsap County and City of Bremerton shouldconsider adaptation strategies to mitigate future sea level rise impacts within the <strong>Gorst</strong> UGA. The Center forScience in the Earth Systems developed an adaptation guidebook for local, regional, and state governments to usewhile preparing for impacts associated with climate change (CSES 2007). Guidebook planning recommendationsfor local jurisdictions include:• Building a climate change preparedness team• Identifying planning areas relevant to climate change• Conducting a climate change vulnerability assessment• Conducting a climate change risk assessment<strong>Draft</strong> | June 2013 3-52
GORST PLANNED ACTION EIS | AFFECTED ENVIRONMENT, SIGNIFICANT IMPACTS, AND MITIGATION MEASURES• Set preparedness goals and develop a preparedness planThe Kitsap County and City of Bremerton should consider developing goals, policies, and revising code on aprogrammatic level to mitigate for potential sea level rise impacts, such as:• <strong>Impact</strong>s associated with flooding (e.g. verify proposal is above the flood zone)• <strong>Impact</strong>s to transportation corridors• <strong>Impact</strong>s on utilitiesFor any City of Bremerton or Kitsap County-funded infrastructure projects or any private development projectsbetween SR 3 and Sinclair Inlet, a sea-level rise adaptation analysis should be required.Significant Unavoidable Adverse <strong>Impact</strong>sNo significant unavoidable adverse impacts on regional or local air quality are anticipated. Temporary, localizeddust and odor impacts could occur during the construction activities. The regulations and mitigation measuresdescribed above are adequate to mitigate any adverse impacts anticipated to occur as a result of <strong>Gorst</strong> study areagrowth increases.<strong>Draft</strong> | June 2013 3-53
GORST PLANNED ACTION EIS | AFFECTED ENVIRONMENT, SIGNIFICANT IMPACTS, AND MITIGATION MEASURES3.4 Plants and AnimalsAffected EnvironmentWatershedThe <strong>Gorst</strong> Creek Watershed provides habitat for terrestrial and aquatic plant and animal species. It includes variousterrestrial habitats, the marine nearshore habitat of the Puget Sound (including estuarine wetlands), freshwaterwetlands, and stream channels. Figure 3.4-1 <strong>Gorst</strong> Creek Watershed: Land Cover shows the land cover types andundeveloped/developed land that occur within the watershed, based on USGS land cover mapping data. Table 3.4-1 Land Cover Types within the <strong>Gorst</strong> Creek Watershed and the <strong>Gorst</strong> UGA summarizes this information for thewatershed and the UGA.Table 3.4-1Land Cover Types within the <strong>Gorst</strong> Creek Watershed and the <strong>Gorst</strong> UGALand Cover Type Acreage in Watershed 1 Acreage in UGAEvergreen Forest 3,381 4Mixed Forest 638 23Deciduous Forest 290 33Shrubland 211 1Grasslands, herbaceous 161 21Woody Wetlands 95 9Emergent, Herbaceous Wetlands 42 14Bare Rock 34 4Open Water 13 0Total Undeveloped 4,865 109Developed, Open Space 788 50Developed, Low Intensity 335 58Developed, Medium Intensity 129 63Developed, High Intensity 55 48Total Developed 1,307 219Total 6,172 328Note:1 Watershed refers to the entire <strong>Gorst</strong> Creek Watershed, inclusive of the UGA.Source: USGS Land Cover Data (Homer et al. 2007)<strong>Draft</strong> | June 2013 3-54
FIGURE 3.4-1 GORST CREEK WATERSHED: LAND COVERUnion RiverBremertonWestUGAHeins CreekCity of Bremerton<strong>Gorst</strong> Creek<strong>Gorst</strong> UGACity of BremertonSKIA UGAParish CreekULID6Anderson CreekCity of Port OrchardBremerton NationalAirportCoulter CreekSquare CreekWatershed BoundaryLand CoverDeveloped, Medium IntensityMixed ForestUGA BoundaryOpen WaterDeveloped, High IntensityScrub/ShrubCity LimitsPerennial Ice, SnowBare rock, sandGrasslands, herbaceousWaterDeveloped, Open SpaceDeciduous ForestPastureStreamsDeveloped, Low IntensityEvergreen ForestCultivated CropsWetland (WDFW/NWI)Date: March 2013Source: Parametrix, Department of Ecology, Department of Fish & Wildlife, USGS, BERK0 0.5 1Miles
THIS PAGE INTENTIONALLY BLANK
GORST PLANNED ACTION EIS | AFFECTED ENVIRONMENT, SIGNIFICANT IMPACTS, AND MITIGATION MEASURESPriority Habitats and SpeciesGenerally, undeveloped land cover categories provide wildlife habitat of various quality, while developedcategories provide limited wildlife habitat. Evergreen and mixed forests make up the largest component of landcover within the watershed boundary. Approximately 3,000 acres within the watershed are forested land ownedby the City of Bremerton.According to fish and wildlife habitat assessments completed for the <strong>Gorst</strong> Creek Watershed CharacterizationReport (City of Bremerton 2012), the most important fish and wildlife habitats in the <strong>Gorst</strong> Creek Watershed are:• The streams that support anadromous fish species• The <strong>Gorst</strong> Creek estuary that supports waterfowl, shorebirds, and juvenile salmon• The large contiguous area of forest on the north side of the watershed that is owned and managed by the Cityof BremertonFreshwater Habitats – <strong>Gorst</strong> Creek and its tributaries provide important habitat and refugia for fish populations,including salmon and other anadromous species. <strong>Gorst</strong> Creek is inhabited by chinook, chum, and coho salmon,steelhead trout, and cutthroat trout. Based on the 2003 Kitsap Salmonid Refugia Report (May and Peterson 2003in City of Bremerton 2012), <strong>Gorst</strong> Creek is a class C salmonid refugia, which means that it has been altered fromnatural conditions and does not fully support native salmonid populations. Among tributaries to <strong>Gorst</strong> Creek,Jarstad Creek has the greatest value for salmonid conservation. Heins Creek and portions of <strong>Gorst</strong> Creek also had arelatively high salmonid conservation value, while Parish Creek and Lower <strong>Gorst</strong> Creek had a relatively low value.Without the influence of the <strong>Gorst</strong> Creek Fish Hatchery, portions of the watershed would likely classify as Class Brefugia, and the watershed has the potential to contribute to the recovery of federally listed salmonid species.Table 3.4-2 Occurrence of Anadromous Fish Species in the <strong>Gorst</strong> Creek Watershed summarizes documented use offreshwater habitats within the watershed by anadromous fish species.Table 3.4-2Occurrence of Anadromous Fish Species in the <strong>Gorst</strong> Creek WatershedSpecies Location Habitat ProvidedFall Chinook salmon <strong>Gorst</strong> Creek Spawning, juvenile rearingHeins CreekParish CreekSpawningSpawningCoho salmon <strong>Gorst</strong> Creek Spawning, presence/migrationHeins CreekParish CreekJarstad CreekUnnamed Stream1226919475271SpawningFall Chum Salmon <strong>Gorst</strong> Creek SpawningHeins CreekParish CreekJarstad CreekUnnamed Stream1226919475271Spawning, Presence/migrationPresence/migrationPresence/migrationSpawningResident cutthroat trout <strong>Gorst</strong> Creek PresenceParish CreekPresence/migrationPresence/migrationPresence/migrationPresence<strong>Draft</strong> | June 2013 3-57
GORST PLANNED ACTION EIS | AFFECTED ENVIRONMENT, SIGNIFICANT IMPACTS, AND MITIGATION MEASURESJarstad CreekUnnamed Stream1227026475270Unnamed Stream1226919475271PresencePresencePresenceWinter steelhead trout <strong>Gorst</strong> Creek Spawning, presence/migrationSources: WDFW 2013a, bParish CreekJarstad CreekPresence/migrationPresence/migrationTerrestrial Habitats – The study area is located within the western hemlock (Tsuga heterophylla) zone (Franklinand Dyrness 1988). In native forests, Douglas-fir, bigleaf maple, Pacific madrone, vine maple, western hemlock,and western redcedar are the predominant tree species. Forest understory species include western swordfern,Oregon grape, salal, and Pacific rhododendron. The evergreen forests that make up the vast majority of thewatershed land cover would be expected to support these plant species. The <strong>Gorst</strong> Creek watershed is expected toprovide habitat for a variety of terrestrial forest-dwelling wildlife. The forested areas are likely to support anabundance of large and small mammals, birds, reptiles, and amphibians.In the <strong>Gorst</strong> Creek Watershed, high value terrestrial wildlife habitats occur in the forested areas north andnorthwest of the <strong>Gorst</strong> UGA, where there is a low edge-to-area ratio and a low density of paved roads, and whichhas not been platted for development. South of the UGA, forested areas also provide relatively high value wildlifehabitat, although there is a higher edge-to-area ratio and a higher paved-road density, and the large areas havebeen subdivided into five- and two-acre parcels.The forested area that comprises the north and central portion of the <strong>Gorst</strong> Creek Watershed is publicly owned,and lies within a contiguous area that also contains the Green Mountain and Tahuya State Forest. Taken together,this area comprises the largest open-space block in the Puget Trough Ecoregion of the Puget Sound Basin.The forests on the north side of the <strong>Gorst</strong> Creek Watershed are especially valuable from a wildlife standpoint forthree reasons:• They are protected in public ownership, and occur in the aforementioned large open-space block.• They cover nearly half of the watershed, and therefore have a beneficial effect on freshwater habitats thatsupport anadromous fish species.• They help to sustain water flow and water quality processes within the watershed, and contribute to theoverall quality of habitats in the <strong>Gorst</strong> Creek Estuary.Wetlands - Wetlands within the study area have been mapped by Kitsap County based on National WetlandsInventory Data and other data sources. Mapped wetland coverage within the <strong>Gorst</strong> Creek Watershed isapproximately 110 acres. This acreage is comprised of freshwater forested/shrub wetlands, emergent wetlands,ponds, and other open water habitats. The largest of these are Alexander Lake in the northern portion of thewatershed, an emergent estuarine intertidal wetland associated with Sinclair Inlet, and open water and scrubshrubhabitats associated with Twin Lake in the eastern portion of the wetland. Additionally, portions of the largeestuarine/marine wetland complex associated with Sinclair Inlet are outside but adjacent to the watershed.Marine Nearshore Habitat – The estuary at the mouth of <strong>Gorst</strong> Creek contains intertidal wetlands and salt marshthat support concentrations of shorebirds and waterfowl, including migratory species. This area is known tosupport a bald eagle nest and territory, and is likely used by great blue herons as foraging habitat. Glaucouswingedgulls are very common.<strong>Draft</strong> | June 2013 3-58
GORST PLANNED ACTION EIS | AFFECTED ENVIRONMENT, SIGNIFICANT IMPACTS, AND MITIGATION MEASURESMarine mammals that reside in Puget Sound may utilize the Sinclair Inlet adjacent to the <strong>Gorst</strong> UGA. Harbor seals,Dall’s porpoises, river otters, harbor porpoises, southern resident killer whale, Minke whales, California andnorthern sea lions, and gray whales may be found within the Sinclair Inlet during portions of the yearA variety of marine fauna occur in the Sinclair Inlet, including oysters, clams, crabs, mussels, scallops, octopus, andnumerous species of fish, including various salmonids, surf smelt, English sole, rock sole, and starry flounder(National Park Service 2011). The Sinclair Inlet provides rearing habitat for juvenile Chinook salmon. The <strong>Gorst</strong>Creek Hatchery has a large influence on the estuary, and hatchery fish make up 40 to 100 percent of the juvenileChinook in the estuary, depending on the season. In Sinclair Inlet, juvenile Chinook salmon are most abundant nearthe mouth of <strong>Gorst</strong> Creek (Fresh et al. 2006 in City of Bremerton 2012).Based on habitat assessments, the shoreline along the <strong>Gorst</strong> Creek Estuary, the shoreline has a relatively highbiological index score, particular for segments that support shorebirds, waterfowl, and salt marsh vegetation.However, the Sinclair Inlet received a relatively low score on the condition of its marine nearshore salmon habitatin the 2003 Kitsap Salmonid Refugia Report (May and Peterson 2003). This assessment considered fish habitat,riparian condition, and watershed factors.The <strong>Gorst</strong> Creek estuary is a shallow estuary in which little tidal energy or exchange occurs. Based on anassessment of drift cells, the Puget Sound Nearshore Ecosystem Restoration Project made an “enhance low”recommendation for beaches and embayments within the estuary (Cereghino et al 2012). This recommendationindicates that critical ecosystem functions should be improved, but substantive restoration of ecosystem processesis unlikely. Estuary functions that could be improved by enhancement actions include habitat for salmonids,shellfish, and waterfowl.Special Status SpeciesPlantsBased on data from the Washington Natural Heritage Program, no historical or current occurrences of rare plantspecies populations or endangered ecosystems have been mapped within the <strong>Gorst</strong> Creek watershed (WashingtonNatural Heritage Program 2013).WildlifeTable 3.4-3 Special Status Species that May Be Found in or Near the <strong>Gorst</strong> Creek Watershed provides a completelist of Wildlife with a special conservation status that may be found in the <strong>Gorst</strong> Creek watershed, based oninformation compiled from the U.S. Fish and Wildlife Service (for Kitsap County), WDFW priority habitats andspecies (specific to study area), WDFW SalmonScape, and the National Oceanic and Atmospheric Administration(NOAA) Fisheries Northwest Regional Office. Some of the species listed in this are not known to presently occurwithin the watershed but may have occurred there in the past. Additionally, some of the marine species listed inthis table may be only occasional visitors to the area.Table 3.4-3Special Status Species that May Be Found in or Near the <strong>Gorst</strong> Creek WatershedCommon Name Scientific Name State Status Federal StatusReptiles and AmphibiansGreen Sea Turtle Chelonia mydas -- ELeatherback Sea Turtle Dermochelys coriacea -- ELoggerhead Sea Turtle Caretta caretta -- TNorthwestern pond turtle Emys marmorata marmorata E SCOlive Ridley Sea Turtle Lepidochelys olivacea -- E<strong>Draft</strong> | June 2013 3-59
GORST PLANNED ACTION EIS | AFFECTED ENVIRONMENT, SIGNIFICANT IMPACTS, AND MITIGATION MEASURESCommon Name Scientific Name State Status Federal StatusTailed frog Ascaphus truei M SCWestern toad Bufo boreas C SCBirdsBald eagle Haliaeetus leucocephalus S SCMarbled murrelet Brachyramphus marmoratus T TNorthern goshawk Accipiter gentilis C SCPeregrine falcon Falco peregrinus S SCYellow-billed cuckoo Coccyzus americanus C CPurple martin Progne subis C --MammalsHumpback whale Megaptera novaeangliae E ELong-eared myotis Myotis evotis -- SCLong-legged myotis Myotis volans -- SCNorthern sea otter Enhydra lutris kenyoni E SCPacific Townsend’s big-eared bat Corynorhinus townsendii marmorata C SCSouthern Resident Killer Whale Orcinus orca E ESteller sea lion Eumetopias jubatus T TFishBocaccio (Georgia Basin DPS) Sebastes paucispinis C EBull trout(Coastal-Puget Sound DPS)Canary rockfish(Georgia Basin DPS)Chinook salmon(Puget Sound ESU)Chum salmon (Puget Sound/ Strait ofGeorgia ESU)Coho salmon (Puget Sound/ GeorgiaBasin ESU)Salvelinus confluentus C TSebastes pinniger C TOncorhynchus tshawytscha C TOncorhyncus keta C --Oncorhyncus kisutch C SCEulachon (Southern DPS) Taleichthys pacificus C TPacific lamprey Lampetra tridentata M SCRiver lamprey Lampetra ayresi C SCSteelhead Trout Oncorhynchus mykiss -- TYelloweye rockfish(Georgia Basin DPS)Sebastes ruberimus C T<strong>Draft</strong> | June 2013 3-60
GORST PLANNED ACTION EIS | AFFECTED ENVIRONMENT, SIGNIFICANT IMPACTS, AND MITIGATION MEASURESState Status: S = Sensitive, C = Candidate for listing; M = MonitoredFederal Status: SC = Species of ConcernDPS = Distinct Population Segment; ESU = Evolutionary Significant UnitSource: NOAA Fisheries 2013, U.S. Fish and Wildlife Service 2012, WDFW 2013a, bReptiles and AmphibiansSensitive amphibians are associated with wetlands and riparian areas, and may be found in these habitats withinthe study area. Tailed frogs are associated with cold, clear, fast-flowing streams in mature forests. Northwesternpond turtles are associated with ponds and lakes, but may winter on land. Only four populations of this subspeciesare known to occur in Washington State, none of which are in the study area. The western toad occurs in a varietyof terrestrial habitats, but is often found near water bodies. Western toads typically breed in habitats with openwater, including wetlands, ponds, lakes, reservoir coves, and off-channel river areas (Washington Natural HeritageProgram 2009).The sea turtles listed in Table 3.4-3 Special Status Species that May Be Found in or Near the <strong>Gorst</strong> Creek Watershedoccur in marine waters, occasionally off the coast of Washington, and have been included because these speciescould make their way into the Puget Sound. However, these species breed in warmer waters much further south,and are unlikely to occur in the Sinclair Inlet, even occasionally.BirdsAll migratory birds are protected under the Migratory Bird Treaty Act. Bald and Golden eagles are also protectedby the Bald and Golden Eagle Protection Act. Numerous bird species protected by these two acts are likely to occurwithin the <strong>Gorst</strong> Watershed. Additionally, several sensitive bird species occur in the area.Bald Eagle – A bald eagle nest has been mapped just outside the watershed boundary, near the south shore ofSinclair inlet. Its associated territory, as mapped by WDFW, is located throughout the west end of the estuary.Almost the entire shoreline of the Sinclair Inlet within the watershed is mapped as bald eagle nest buffer.Marbled Murrelet – Marbled murrelets are generally found in nearshore waters (within about three miles ofshore) near their nesting sites (USFWS 2009). They feed in nearshore marine waters and use older stands near thecoastline for nesting. The <strong>Gorst</strong> Creek Watershed is located within Zone 1 of potential marbled murrelet nestinghabitat, which extends approximately 40 miles from the coast. Marbled murrelets are listed as threatened at boththe federal and state level. Critical habitat for the species has not been mapped within the <strong>Gorst</strong> Creek Watershed.Northern Goshawk – Northern goshawks occur in all forested regions of Washington, and are likely to be found inforested habitats within the watershed, but has largely been extirpated from urbanized landscapes and to somedegree moderately developed areas and areas with intensive timber management. Goshawks generally prefer tonest in mature or old forest habitats with a high density of large trees (Desimone and Hayes 2003).Peregrine Falcon – Peregrine falcons occur year-round in Washington as either nesting or migrating individuals.Within coastal areas, peregrine falcons typically nest and roost on cliffs, although in urban areas they rarely neston tall buildings, bridges, and vegetated slopes (Hayes and Buchanan 2002). There are no mapped nesting areasfor this species in the <strong>Gorst</strong> Watershed.Yellow-Billed Cuckoo – Yellow billed cuckoos are unlikely to occur in the <strong>Gorst</strong> Creek Watershed. They are officiallyconsidered extirpated in Washington, although occasional sightings occur. None of the recent sightings of thisspecies has been in Kitsap County. Historical nesting habitat in Washington State is along wooded rivers (SeattleAudubon Society 2013).Purple Martin – Purple martins nest and forage in open land near water, and can be found in developed areas,along waterfronts, and in fields, wetlands, and clearings. They are fairly common in the Puget Trough area duringMay through August (Seattle Audubon Society 2013). The Kitsap Audubon society has installed purple martinnesting boxes at various locations in Kitsap County.<strong>Draft</strong> | June 2013 3-61
GORST PLANNED ACTION EIS | AFFECTED ENVIRONMENT, SIGNIFICANT IMPACTS, AND MITIGATION MEASURESTerrestrial MammalsThree sensitive species of bat potentially occur within the <strong>Gorst</strong> Creek Watershed: long-eared myotis, long-leggedmyotis, and Pacific Townsend’s big-eared bat. These bat species occur in a variety of habitats, including forests andriparian wetlands that are found in the <strong>Gorst</strong> Creek Watershed. They roost in a variety of places, including trees,caves, and built structures (Woodruff and Ferguson 2005). All three species are likely to be found in the watershed.Marine MammalsMarine mammals that occur in Puget Sound may make their way into the Sinclair Inlet. These include sea ottersand various seals, sea lions, porpoises, and whales. All marine mammals are protected under the Marine MammalProtection Act of 1972, which prohibits (with certain exceptions) the “take” of marine mammals in U.S. waters.Commonly occurring marine mammals in Puget Sound include Pacific harbor seal, California sea lion, Steller sealion, northern elephant seal, Southern Resident killer whale, harbor and Dall’s porpoises, and Minke and Graywhales.Humpback Whale – humpback whales typically occur at higher latitudes in the summer and lower latitudes in thewinter. While humpback whales were seen very rarely in Puget Sound through the late, 1990s, sightings of thisspecies have increased in recent decades, although they are still infrequent (Falcone et al. 2005). Therefore thisendangered species could potentially occur occasionally in Sinclair Inlet.Northern Sea Otter – Northern sea otters are predominantly a coastal species, occurring along the northernWashington coast and into the Strait of Juan de Fuca. There is minimal evidence for historic occurrence of northernsea otters in Puget Sound, and recent sightings of the species in Puget Sound have been of isolated individuals,near Olympia (Lance et al. 2004). Therefore, this species is unlikely to occur in Sinclair Inlet.Southern Resident Killer Whale – the Southern Resident DPS of killer whale, which is listed as endangered at thefederal and state level, resides in the inland waterways of Washington, including the Puget Sound, from spring tofall (Ford et al. 2000, Krahn et al. 2002). This species is likely to be found in Sinclair Inlet, which is designatedcritical habitat for the species.Steller Sea Lion – Steller sea lions reside year-round along the outer coast of Washington, and are associated witha variety of terrestrial and marine habitats (National Marine Fisheries Service 2008). The species also occurs in thePuget Sound. No Steller sea lion rookeries occur in Washington, however, they may haul out on jetties, offshorerocks, and coastal islands. Occasionally, they haulout on navigation buoys in Puget Sound (WDFW 2000).FishChinook Salmon. Fall Chinook salmon occur in portions of <strong>Gorst</strong> Creek, Heins Creek, and Parish Creek, as well as inthe Sinclair Inlet. <strong>Gorst</strong> Creek provides known spawning and juvenile rearing habitat, and Heins and Parish creeksprovide known spawning habitat (WDFW 2013a). These stretches of stream are mapped as critical habitat forChinook salmon. Juvenile fish originating in the <strong>Gorst</strong> Creek Hatchery comprise a large proportion of juvenilesalmon in the study area, although fish from wild stocks are also present. Juvenile salmon from 14 differentwatersheds and as far away as the Fraser River in Canada have been documented in the Sinclair Inlet. Designatedcritical habitat for Chinook salmon occurs within the <strong>Gorst</strong> UGA, in portions of <strong>Gorst</strong> Creek, Parish Creek, and HeinsCreekSteelhead Trout. Winter steelhead are ocean-maturing fish that spawn in freshwater systems between Novemberand April. Spawning habitat consists of gravel substrates free of excessive silt (NOAA Fisheries Office of ProtectedResources 2013). Steelhead trout occur in portions of <strong>Gorst</strong> Creek, Parish Creek, and Jarstad Creek, as well as theSinclair Inlet. Spawning has been documented in <strong>Gorst</strong> Creek. In January, 2013, the National Marine FisheriesService proposed designating critical habitat for Puget Sound steelhead, which is currently federally listed as athreatened species, in portions of <strong>Gorst</strong>, Parish, and Heins creeks within the watershed.<strong>Draft</strong> | June 2013 3-62
GORST PLANNED ACTION EIS | AFFECTED ENVIRONMENT, SIGNIFICANT IMPACTS, AND MITIGATION MEASURESChum and Coho Salmon. Chum and Coho salmon ESUs within the watershed are candidates for listing at the statelevel. Both species occur in <strong>Gorst</strong> Creek, Heins Creek, Parish Creek, Jarstad Creek, and Unnamed Stream1226919475271. <strong>Gorst</strong> Creek and Heins Creek provide spawning habitat for chum and coho salmon, and ParishCreek provides spawning habitat for coho salmon.Rockfish. Rockfishes are bottom and mid-water dwelling fish that occur in various coastal water habitats. Bocaccio,yelloweye rockfish, and canary rockfish have all been federally listed under ESA. Bocaccio are very rare in PugetSound, and are most frequently found in areas lacking hard substrates. In the past, they were most commonlycaught in the South Puget Sound. Yelloweye rockfish often occur in areas with high relief and complex rockyhabitats. They are distributed throughout the Strait of Georgia, but are less frequently observed in Puget Sound.Canary rockfish are associated with the various rocky and coarse habitats throughout Puget Sound (NMFS 2009).All three of these species could potentially make their way into Sinclair Inlet.Pacific and River Lamprey. Pacific lampreys occur in most large rivers and streams along the coast and the Strait ofJuan de Fuca, through Puget Sound, with a distribution similar to that of salmon and steelhead. River lampreysoccur in rivers and streams along the coast from the mouth of the Columbia River to the mouth of the Hoh River,throughout Puget Sound, and in the Lake Washington Basin. Both species use riffle and side channel habitats forspawning and rearing, and good water quality is essential for rearing (U.S. Fish and Wildlife Service 2013).<strong>Gorst</strong> UGAFreshwater Habitats – Freshwater habitats in the UGA include <strong>Gorst</strong> Creek and two unnamed tributaries, as well astwo unnamed streams that drain to the Sinclair Inlet. A discussion of <strong>Gorst</strong> Creek and its tributaries is provided inthe discussion for the watershed. The freshwater habitats in the <strong>Gorst</strong> UGA have been degraded by urbandevelopment in this area, and four fish passage barriers have been identified, one culvert on <strong>Gorst</strong> Creek, andthree culverts on an unnamed tributary stream.Terrestrial Habitats – Based on USGS land cover data and as shown in Table 3.4-1 Land Cover Types within the<strong>Gorst</strong> Creek Watershed and the <strong>Gorst</strong> UGA, roughly two thirds of the land area within the UGA is developed and athird is undeveloped. The majority of the <strong>Gorst</strong> UGA supports residential, commercial, and industrial land uses, andis therefore assumed to have little to no habitat value for native species. These areas may support landscapedareas, native and non-native trees, shrubs and forbs, grass, and various other plants commonly found in urbanareas. It is expected that these areas would support some common urban wildlife species, such as black rat,Norway rat, house mouse, raccoon, opossum, European starling, glaucous-winged gull, house finch, housesparrow, and rock dove.A portion of the area within the UGA that currently supports mineral resource extraction is undeveloped openspace, including deciduous forests with connections to high value habitats to the north. These areas are likely to beused by a variety of forest-dwelling species.Wetlands – The only mapped wetlands within the <strong>Gorst</strong> UGA are those associated with the estuarine/marinewetland complex at the Sinclair Inlet, and the manmade open water habitat between SR 3 and the Navy railroad.Marine Nearshore Habitat – The marine nearshore habitats in and adjacent to the <strong>Gorst</strong> UGA and their associatedwildlife species were discussed previously for the <strong>Gorst</strong> Creek watershed.Priority Habitats and Special Status SpeciesPlantsBased on data from the Washington Natural Heritage Program, no historical or current occurrences of rare plantspecies populations or endangered ecosystems have been mapped within the <strong>Gorst</strong> UGA (Washington NaturalHeritage Program 2013).<strong>Draft</strong> | June 2013 3-63
GORST PLANNED ACTION EIS | AFFECTED ENVIRONMENT, SIGNIFICANT IMPACTS, AND MITIGATION MEASURESWildlifeTable 3.4-3 Special Status Species that May Be Found in or Near the <strong>Gorst</strong> Creek Watershed summarizes the specialstatus for Kitsap County, and that are likely to be found in or near the <strong>Gorst</strong> Creek watershed. Given the lack ofundeveloped and undisturbed land in the UGA, many of the forest- and freshwater wetland-dwelling species listedin Table 3.4-3 Special Status Species that May Be Found in or Near the <strong>Gorst</strong> Creek Watershed are unlikely to befound within the UGA. Sensitive species that use Sinclair Inlet, freshwater streams, and estuarine wetland habitatsare likely to be found within the UGA. Bald eagles are known to use the area around Sinclair Inlet. All of the marinespecies listed in Table 3.4-3 Special Status Species that May Be Found in or Near the <strong>Gorst</strong> Creek Watershed thatare likely to occur in Puget Sound could occur in Sinclair Inlet adjacent to the UGA. Additionally, all of the marineand anadromous species listed in the table occur (or potentially occur) in aquatic habitats in or adjacent to theUGA.<strong>Impact</strong>sIMPACTS COMMON TO ALL ALTERNATIVESUnder all alternatives, the City of Bremerton and Kitsap County CAOs and Shoreline Master Programs includeregulations that have been developed to protect sensitive species and habitats. These regulations are discussedlater in this section under Applicable Regulations and Commitments, as well as in Section 3.14 Relationship toPlans and Policies. The City of Bremerton and Kitsap County regulations differ, particularly in terms of buffers thatapply to development near shorelines within the UGA. Additionally, proposed Shoreline Master Programs will altersome existing regulations, once adopted. The <strong>Gorst</strong> UGA, once annexed, will switch from Kitsap County jurisdictionto City of Bremerton jurisdiction. Therefore, it is important to understand which regulations will apply, and howthey differ from current regulations. In order to provide a better context for the Plants and Animals effectsanalysis, the differences in City of Bremerton and County regulations, as they apply to fish and wildlife and theirhabitats, are highlighted here.For terrestrial species, regulations pertaining to fish and wildlife habitat conservation areas apply. Under both theCity of Bremerton and Kitsap County CAOs, Habitat Management Plans (HMPs) are required for development forwildlife habitat conservation areas associated with federally and state listed endangered, threatened, and sensitivespecies, as well as for some areas associated with state listed candidate and monitored species and otherimportant terrestrial habitat areas. HMPs are used to determine appropriate buffers on a project-by-project basis,as well as other measures to protect sensitive species and habitats. Therefore, the City of Bremerton and KitsapCounty regulations are similar in regards to protection of terrestrial wildlife species and habitats. Regulatoryrequirements that protect these species would be very similar after annexation of the UGA.For wetlands and aquatic habitats (and their associated species), there are some differences in the City ofBremerton and Kitsap County regulations as far as standard and reduced buffer widths. These differences havebeen summarized in Table 3.14-3 Bremerton and Kitsap County Shoreline, Stream, and Wetland Buffer Comparison.Currently, the CAO regulations apply to wetlands and streams. They are very similar in terms of standard buffers,and range from 35 to 150 feet for City of Bremerton-regulated streams, and from 50 to 150 feet for Kitsap County-Regulated streams. Under both CAOs, buffers for Category I and II wetlands are the same (200 feet and 100 feet,respectively), but the buffers for Category III and IV wetlands are slightly smaller under Kitsap County regulationsthan City of Bremerton regulations. Building setbacks of 15 feet are required under Kitsap County CAO regulationsbut not the City of Bremerton CAO regulations (see Table 3.14-3 Bremerton and Kitsap County Shoreline, Stream,and Wetland Buffer Comparison). In the case of wetlands, annexation of the UGA to the City of Bremerton wouldresult in slightly larger buffers (20 to 25 feet) for Category III and IV wetlands, although building setbacks wouldnot be required. Buffer averaging would continue to be allowed for reduction of wetland buffers in certain areas.The greatest differences in regulatory protections for aquatic habitats are found when comparing the proposedKitsap County Shoreline Master Program to the Proposed City of Bremerton Shoreline Master Program. In both<strong>Draft</strong> | June 2013 3-64
GORST PLANNED ACTION EIS | AFFECTED ENVIRONMENT, SIGNIFICANT IMPACTS, AND MITIGATION MEASUREScases the proposed Shoreline Master Program would override the current CAO regulations that pertain to streams.Kitsap County standard buffers for streams are 200 feet, with 15-foot setbacks, building setbacks. Once the UGA isannexed to the City of Bremerton, greater marine shoreline buffers and reduced shoreline stream buffers wouldapply. The Proposed City of Bremerton standard buffers under the Shoreline Master Program range from 50 feetfor commercial uses to 175 feet for Urban Conservancy Land (Table 3.14-3 Bremerton and Kitsap County Shoreline,Stream, and Wetland Buffer Comparison). Some buffer reductions would be allowed, and 15-foot setbacks wouldcontinue to apply. Therefore, for freshwater aquatic habitats within the UGA, regulatory buffers would be reducedfor shoreline-designated streams (i.e., <strong>Gorst</strong> Creek). For marine habitats (i.e., Sinclair Inlet), regulatory buffers forUrban Conservancy area would increase after annexation, from 100 feet to 175 feet, except where paralleldesignations apply in which case buffer would extend to the edge of the Urban Conservancy designation(approximately 100 feet). It should be noted that both the City and County Shoreline Master Program proposalswere the subject of cumulative impact analyses that demonstrated no-net-loss of shoreline ecological function.The City’s buffers particularly on <strong>Gorst</strong> Creek recognize current degraded conditions. The County’s buffer onshoreline streams such as <strong>Gorst</strong> Creek is uniform at 200 feet regardless of conditions, but there are allowances toreduce the buffer with enhancements.The <strong>Draft</strong> Subarea Plan for the <strong>Gorst</strong> UGA under Alternatives 2 and 3 includes a policy promoting adequate andequivalent standards for stream and shoreline protection. Appendix D Shoreline Buffer Comparison & Optionsprovides a review of several <strong>Gorst</strong> Creek shoreline management options, including proposed City standards,proposed County standards, and alternative standards that blend proposed City and County standards withWatershed Characterization results and BMPs.WatershedUnder all alternatives, development would occur throughout the watershed, primarily in the urban and suburbanareas associated with the <strong>Gorst</strong> UGA (described in its own section below) and the SKIA Subarea Plan. Mostdevelopment outside these areas would be residential dwellings, with an estimate that less than 500 newdwellings would be constructed over the next 20 to 30 years. New construction in rural areas would result inremoval of terrestrial habitats, which could injure and/or displace common species of wildlife. Migratory birdscould be affected, particularly by construction that occurs during the breeding season. Under all alternatives,regulations to protect sensitive species would help prevent impacts to these species during the constructionprocess. Depending on where it occurs, new construction in the watershed could also affect wildlife habitatconnectivity through fragmentation or interruption of existing wildlife corridors.Noise associated with construction activities in the watershed would likely disturb terrestrial wildlife species,particularly in rural areas where baseline noise levels are low. Noise disturbance would constitute a short-termimpact, lasting only as long as the construction activities, with lower levels of noise associated with residential usesonce construction is completed. Wildlife could adapt to the noise or leave the area. The greatest risk for adverseeffects would be during breeding periods, when noise could impact nesting/breeding success.Construction activities adjacent to stream channels, other bodies of water, and wetlands would have the potentialto affect these habitats and the species that occur in them, including listed and sensitive fish species. Additionally,stormwater runoff from the developed sites could potentially impact aquatic habitats, including the creeks listed inTable 3.4-2 Occurrence of Anadromous Fish Species in the <strong>Gorst</strong> Creek Watershed that support salmon species. Asdiscussed elsewhere in this <strong>Draft</strong> EIS (primarily Section 3.2 Water Resources), flooding and sedimentation intosurface water systems as a result of inadequate stormwater infiltration are currently impacting aquatic habitatswithin the watershed. Sedimentation and turbidity associated are primary contributors to the degradation ofsalmonid habitat (Bash et al. 2001). High levels of turbidity can reduce feeding efficiency and food availability, cloggillrakers, and erode gill filaments of salmonids (Bruton 1985; Gregory 1993). Clearing of trees and developmentactivities within the watershed could lead to an exacerbation of these issues, potentially further degrading aquatichabitats and reducing the likelihood that these habitats would be able to provide suitable habitat for aquaticspecies, including listed Chinook salmon, steelhead trout, and other anadromous species. Stormwater Plans, BMPs,<strong>Draft</strong> | June 2013 3-65
GORST PLANNED ACTION EIS | AFFECTED ENVIRONMENT, SIGNIFICANT IMPACTS, AND MITIGATION MEASURESand SPCC plans would help minimize impacts to aquatic habitat and the species that they support as a result ofconstruction activities.<strong>Gorst</strong> UGAUnder all alternatives, development of the remaining privately held open space within the <strong>Gorst</strong> UGA is planned orlikely to occur. Such development would decrease the amount of vegetated area, including areas with wildlifehabitat value, such as the block of forestland on the mine property. This reduction in wildlife habitat would removepopulations of some common wildlife species, or force them to move to undeveloped areas nearby. In some cases,newly developed areas would support urban wildlife species such as rats, raccoons, and gray squirrels. It isanticipated that some migratory birds would be impacted as a result of loss of undeveloped habitat, particularlyfor activities that occur during the breeding season.In areas that are currently developed, noise associated with future redevelopment activities in the UGA wouldlikely disturb wildlife to some degree, although it is likely that existing populations are acclimated to urban noisesand would be able to tolerate some degree of noise disturbance. These noise effects would be short term, lastingonly for the duration of construction activities in a given location. Some habitat removal could occur, even ondeveloped sites, but in most cases these sites would receive new landscaping that provides the same level ofwildlife habitat value. In certain areas, construction activities could disturb wildlife in nearby undeveloped areas,potentially causing some stress to individuals or interfering with nesting or breeding for a limited number ofanimals. These effects would be minimized to baseline levels once the construction is completed. Terrestrialsensitive species and their habitats within the UGA, such as the bald eagle territory along the shoreline of theSinclair Inlet and the osprey nest near Alexander Lake should be protected from long-term harm, and disturbanceto these species minimized, under applicable CAO regulations. However, some disturbance to these species is likelyto occur as a result of nearby construction work.Construction activities adjacent to stream channels, other bodies of water, and wetlands would have the potentialto affect these habitats and the species that occur in them, including listed and sensitive fish species. Additionally,stormwater runoff from the developed sites could potentially impact aquatic habitats, including the creeks listed inTable 3.4-3 Special Status Species that May Be Found in or Near the <strong>Gorst</strong> Creek Watershed that support salmonspecies, and Sinclair Inlet, which supports numerous sensitive anadromous and marine species. As discussed forthe watershed, stormwater plans, BMPs, and SPCC plans would help minimize impacts to aquatic habitats tovarying degrees.Alternative 1Under this alternative, undeveloped land on approximately 41 acres in parcels, or less than one percent of thetotal area of the <strong>Gorst</strong> watershed, would be developed in the future; additionally, existing or future rights of wayand lands for public purposes would be disturbed. All of this development would happen within the UGA, where aminimal amount of high quality wildlife habitat occurs. Over some of this acreage, habitat for certain species, suchas forest dwellers, would be lost permanently, and over some of this acreage, urban wildlife habitat would bereplaced with similar habitat. No open space/recreation is formally designated under this alternative. Existingregulations should be suitable for preventing impacts to sensitive terrestrial habitats and species fromdevelopment activities. In the case of wetlands, appropriate mitigation could be used to compensate for some ofthe unavoidable development impacts.Creation of new impervious surface in the UGA could occur under this alternative, which would exacerbate waterquality issues associated with stormwater. However, adoption of the LID guidance manual would help guide newdevelopment such that the amount of effective impervious surface on a site is reduced. Therefore, redevelopmentwould likely result in an overall reduction in impervious surface. However, the existing stormwater issues wouldnot otherwise be addressed, and associated water quality impacts would continue to affect aquatic species,including listed salmonid species, in the streams within the watershed and UGA.Under this alternative, all existing barriers to fish passage would continue to prevent movement of fish upstreamwithin the watershed.<strong>Draft</strong> | June 2013 3-66
GORST PLANNED ACTION EIS | AFFECTED ENVIRONMENT, SIGNIFICANT IMPACTS, AND MITIGATION MEASURESWith annexation of the <strong>Gorst</strong> UGA, City of Bremerton regulations pertaining to aquatic habitats would apply. Asdescribed in Section 3.14 Relationship to Plans and Policies, City of Bremerton buffer standards are smaller along<strong>Gorst</strong> Creek than Kitsap County’s standard buffers. Under Alternative 1, the <strong>Gorst</strong> Subarea Plan, which includesadditional protective measures recognized with the shift from Kitsap County to City of Bremerton shorelineregulation, would not be implemented. Therefore BMPs proposed in the Subarea Plan would not apply and wouldnot promote buffer enhancement.Alternative 2Under this alternative, approximately 70 acres, or one percent of the total area of the <strong>Gorst</strong> watershed, would bedeveloped in the future; additionally, existing or future rights of way and lands for public purposes would bedisturbed. Therefore, the amount of existing wildlife habitat that would be impacted either through permanentloss, permanent modification to more urban wildlife habitat, or short-term loss and eventual replacement withhabitat of similar value, would be nearly double that under Alternative 1. The total impacted acreage wouldremain very small, however. Under this alternative, sensitive terrestrial and wetland species and habitats wouldgenerally be protected from impacts associated with development within the UGA by applicable CAO regulations.The <strong>Draft</strong> <strong>Gorst</strong> Subarea Plan includes a policy that promotes compatible and equivalent environmentalregulations. Since the City of Bremerton and Kitsap County regulations pertaining to terrestrial and wetlandspecies and habitats are currently very similar, it is expected that the new regulations would be similar to thosethat are currently in place under the CAOs, and that these would continue to protect sensitive terrestrial andwetland species and habitats.Alternative 2 includes 16 acres of land zoned as Open Space/Recreation within the UGA. Parks, recreation areas,and other open spaces would be expected to provide more wildlife habitat and a wider variety of wildlife speciesthan the commercial and industrial areas it would be replacing. Because this area would be surrounded bycommercial development, it is likely to have a large component of urban wildlife species.Under Alternative 2, the <strong>Gorst</strong> UGA would shift from Kitsap County to City of Bremerton regulatory oversight, asdiscussed earlier in this section. Buffer distances under the proposed City of Bremerton Shoreline Master Programwould be less for <strong>Gorst</strong> Creek than those under the Kitsap County Shoreline Master Program recognizing currentdegraded creek conditions, but the proposed <strong>Gorst</strong> Creek Watershed Characterization & Framework Plan and<strong>Gorst</strong> Subarea Plan policies would promote recommended BMPs from the Watershed Characterization Study.Policies promote minimization of new impervious surface associated with development, such as retention ofvegetation and enhancement of degraded areas to offset increases in impervious surfaces. If these policies areimplemented with similar regulations this would help minimize potential impacts to <strong>Gorst</strong> Creek and the aquaticspecies it supports associated with reduced standard buffers. Additionally, the final Subarea Plan addressing apreferred alternative could incorporate one of the shoreline buffer options in this <strong>Draft</strong> EIS Appendix D ShorelineBuffer Comparison & Options or another similar option to provide for compatibility of standards.At a watershed scale, the new Stormwater Management Plan, Watershed Characterization & Framework Plan, and<strong>Gorst</strong> Subarea Plan would include efforts to minimize impervious surface in developed/redeveloped areas,improve stormwater facilities, restore degraded stream channels, and protect key recharge/discharge/storageareas. All of these features would benefit aquatic species within the watershed and UGA by reducing impacts towater quality.The following zoning and BMPs would have the following benefits to wildlife and their habitats within thewatershed:• Zoning actions that minimize certain types of development in key areas would help improve groundwaterrecharge and flows in streams that provide habitat for sensitive fish species.• Limiting logging and maintaining forest cover in certain areas would help protect water flows and minimizesediment export.<strong>Draft</strong> | June 2013 3-67
GORST PLANNED ACTION EIS | AFFECTED ENVIRONMENT, SIGNIFICANT IMPACTS, AND MITIGATION MEASURES• Restoration of certain areas would improve currently degraded habitat values in these areas.• Stormwater system improvements would reduce flooding and overland flows and associated sedimentationand transport of pollutants from developed areas into fish-bearing stream channels.• Improvements to fish passage barriers along Parish Creek would potentially increase the amount of suitablehabitat for salmon and other fish that are found within this stream.These proposed amendments would provide beneficial impacts to wildlife and their habitats at the watershedlevel. In addition to addressing future development and potential impacts from a landscape-scale perspective,planned restoration actions could potentially improve existing degraded habitats.Alternative 3Under this alternative, approximately 69 acres, or 1 percent of the total area of the <strong>Gorst</strong> watershed, would bedeveloped in the future; additionally, existing or future rights of way and lands for public purposes would bedisturbed. Therefore, the amount of existing wildlife habitat that would be impacted by development activities inthe UGA would be nearly the same as that under Alternative 2, and nearly double that under Alternative 1. Thetotal impacted acreage would remain very small, however.Like Alternative 2, Alternative 3 includes 16 acres of land zoned as Open Space/Recreation within the UGA.Additionally, the area surrounding this open space would be zoned as Low Intensity Waterfront, rather than thecommercial zoning under Alternative 2; while it would allow commercial uses, the pattern would have smalleramounts of impervious area and there would be incentives for shoreline reclamation. Therefore, out of the threealternatives, this zoning would potentially result in the highest quality wildlife habitat within the southeast portionof the UGA. However, it is expected that urban wildlife and common species would still predominate.Like under Alternative 2, the <strong>Gorst</strong> Creek Watershed Characterization & Framework Plan and <strong>Gorst</strong> Subarea Planwould be implemented under Alternative 3. In addition stormwater improvement projects would be identified andimplemented. <strong>Draft</strong> policies promote compatible shoreline regulations and minimization of impervious surfaces,sedimentation, and stormwater runoff associated with future development in order to minimize associatedimpacts to habitats and species in <strong>Gorst</strong> Creek, including listed salmonids. Additionally, the final Subarea Planaddressing a preferred alternative could incorporate one of the shoreline buffer options in this <strong>Draft</strong> EIS AppendixD Shoreline Buffer Comparison & Options or another similar option to provide for compatibility of standards.As the Shoreline Master Program, Watershed Characterization & Framework Plan, <strong>Gorst</strong> Subarea Plan andimprovements to stormwater facilities would be implemented under this alternative, effects to fish and wildlifeassociated with implementing the plan would be similar to those discussed for Alternative 2. At a landscape scale,protection of fish and wildlife habitats and populations within the watershed would be greater than underAlternative 1. Additionally, some of the proposed policies and plans would have the potential to improve existingdegraded habitats. Aquatic species, including listed salmon and steelhead, would receive the greatest amount ofbenefit from actions under the proposed plans.Mitigation MeasuresIncorporated Plan FeaturesNew plans that would be implemented under Alternatives 2 and 3 include features that would serve as mitigationfor impacts to plants and animals within the study area. Regulation amendments would incorporate the suggestedmanagement measures shown in Table 2-8 Integrated Watershed Processes and Habitat Results and ManagementMeasures.Possible plan features that would serve as mitigation for potential impacts to plants and animals include thepolicies and BMPs that address:• Minimizing new development and maintaining forest cover in areas that have high wildlife habitat value.<strong>Draft</strong> | June 2013 3-68
GORST PLANNED ACTION EIS | AFFECTED ENVIRONMENT, SIGNIFICANT IMPACTS, AND MITIGATION MEASURES• Maintaining appropriate zoning to protect areas with high wildlife habitat value.• Restoring areas with high habitat value or a high potential to provide salmon refugia.• Implementing measures to reduce erosion and sediment export in areas identified for future development(e.g., buffers, setbacks from steep slopes, reduction of overland flow through infiltration).Capital facility improvements may include removal or repair of culverts and other fish passage blockages thatrestrict the movement of fish upstream. Other improvements would address stormwater deficiencies and floodingissues, which would help reduce associated water quality impacts and improve aquatic habitats.Applicable Regulations and CommitmentsCity of Bremerton Comprehensive Plan – Environment Chapter. The City of Bremerton’s Comprehensive Planaddresses wetlands, marine resources, wildlife habitat conservation areas and corridors, streams, riparian areas,and other important wildlife habitats. The plan includes goals and policies pertaining to conservation of criticalareas and non-renewable resources, open space, marine protected areas, native wildlife habitats and other wildlifefeatures within the City of Bremerton. The goals and policies in the plan provide direction to individuals and policymakers about how the City of Bremerton’s environmental resources should be treated.Kitsap County Comprehensive Plan – Natural Systems Chapter. The Kitsap County’s Comprehensive Plan guidesnon-regulatory efforts to enhance natural resources, including habitat/open space planning, salmon recovery, andwater resources planning. Goals of these efforts include protecting the ecological integrity of aquatic habitats andwetlands, and protecting and restoring fish and wildlife habitat, including priority habitats for sensitive species.Kitsap County CAO. The County CAO includes regulations to protect wetlands and Fish and Wildlife HabitatConservation Areas. Wetlands are regulated based on their category. New development requires a wetlanddelineation report, a mitigation report, and erosion and sedimentation control measures, as required underregulations pertaining to stormwater management. Wetland buffers are determined based on wetland category,and a building or impervious surface setback line of 15 feet is required from the edge of any wetland buffer.Additional regulations pertain to roads, utilities, and stormwater discharges, and other aspects of development.Fish and Wildlife Habitat Conservation Areas are areas that support regulated fish or wildlife species habitats,which are typically identified by known point locations of species (e.g., a nest or den), habitat areas, or both. Theyinclude certain categories of streams, saltwater shorelines, certain lakes, habitats for federal and/or state listedspecies, habitat areas targeted for preservation by federal, state, and/or local governments, areas that containhabitats and species of local importance, and important habitats for state-listed candidate and monitored species.Kitsap County development standards require buffers and building setbacks in order to protect these importantwildlife habitats. For development within wildlife habitat conservation areas, a habitat management plan may berequired.City of Bremerton CAO. The City of Bremerton CAO provides development standards for protecting wetlands thatare similar to those provided in the Kitsap County CAO. Wetlands are rated using the same system, althoughstandard buffers may be different. Compensatory mitigation for alterations to wetlands is required to achieveequivalent or greater biologic functions.The City of Bremerton CAO defines Fish and Wildlife Habitat Conservation Areas as areas necessary for maintainingspecies in suitable habitats within their natural geographic distribution, so that isolated subpopulations are notcreated. They include areas with which federally or state listed or sensitive species have a primary association,priority habitats and species of local importance, streams and watercourses used by juvenile salmonids, habitat ofspecies essential to the juvenile salmonid diet, commercial and recreational shellfish areas, kelp and eelgrass beds,sandlance spawning habitat, herring and smelt spawning areas, ponds under 20 acres, Waters of the State, waterbodies planted with game fish by a governmental or tribal entity, state natural area preserves and natural resourceconservation areas, and land essential for preserving connections between habitat blocks and open spaces. The<strong>Draft</strong> | June 2013 3-69
GORST PLANNED ACTION EIS | AFFECTED ENVIRONMENT, SIGNIFICANT IMPACTS, AND MITIGATION MEASURESCity of Bremerton CAO requires a habitat management plan for development in or adjacent to certain wildlifehabitat conservation areas in order to protect state and federally listed and sensitive species, bald eagles, andanadromous fish. Building setbacks and buffers are determined based on the type of habitat conservation area,and additional development standards provide further protection to wildlife habitat.Kitsap County Shoreline Master Program. Kitsap County Shoreline Master Program, KCC Title 22, is acomprehensive shoreline land-use plan that includes policies and regulations for use and development of theshoreline; it has been recently amended by the County and is awaiting Ecology approval. The program includesregulations specific to a variety of land use activities. The general policies of these regulations include, but are notlimited to, minimizing effects to water quality, preserving estuaries and wetlands, and maintaining aquatic plantsand animals in a healthy condition.City of Bremerton Shoreline Master Program. The City of Bremerton Shoreline Master Program was developed inaccordance with RCW 90.58.020, which stipulates that shorelines of the state must be developed in a way that willpromote and enhance public interest, while also protecting against adverse effects to terrestrial vegetation andwildlife, as well as aquatic habitats and species. A draft Shoreline Master Program has been approved by the City ofBremerton but is currently awaiting approval by Ecology. Shorelines of the state within the <strong>Gorst</strong> watershedinclude Sinclair Inlet and <strong>Gorst</strong> Creek. Standards and regulations within the Shoreline Master Program that pertainto plants and animals include building setbacks and buffers for wetlands and shorelines within the shorelinejurisdiction that supersede those in the CAO, conservation of vegetation near shorelines, and mitigationrequirements.Other Regulations. Federal regulations that pertain to the protection of plants and animals and their habitatinclude the Endangered Species Act, CWA, Migratory Bird Treaty Act, and the Marine Mammal Protection Act.Other Potential Mitigation MeasuresThe following potential mitigation measures apply to terrestrial species and habitats.• Consider wildlife corridors and connectivity when designing and permitting new developments within the<strong>Gorst</strong> Creek Watershed.• Implement clearing of vegetation and construction activities outside the breeding period for sensitive birdspecies and migratory birds, as feasible.• Consider applying common shoreline standards, such as one of the shoreline buffer options in this <strong>Draft</strong> EISAppendix D Shoreline Buffer Comparison & Options or another similar option to provide for compatibility ofshoreline buffer standards, particularly for <strong>Gorst</strong> Creek.Significant Unavoidable Adverse <strong>Impact</strong>sMost of the forested watershed is owned by the City of Bremerton and managed for very limited forestry andutility activities (see Section 3.14 Relationship to Plans and Policies). As such, large scale changes to wildlife habitatthere are not anticipated under any alternative. One area designated for protection in the WatershedCharacterization Study south of SR 3 (Assessment Unit 1) is zoned for Rural Residential uses by Kitsap County.Under Alternative 1, no added protective measures are considered and there could be a loss of forest cover thatcould displace wildlife. Under Alternatives 2 and 3, added measures such as LID requirements and clustering couldmitigate that potential impact.New impervious surfaces and cutting of trees would occur under all the alternatives particularly in the <strong>Gorst</strong> UGAbut also on Rural Residential lands in the watershed, contributing to stormwater runoff, flooding, andsedimentation of surface water resources, which would impact aquatic species that occur within the watershedand UGA. These impacts would be greatest under Alternative 1, but reduced under Alternatives 2 and 3 as capitalimprovements to the stormwater system and BMPs to reduce erosion and sediment export would beimplemented.<strong>Draft</strong> | June 2013 3-70
GORST PLANNED ACTION EIS | AFFECTED ENVIRONMENT, SIGNIFICANT IMPACTS, AND MITIGATION MEASURES3.5 NoiseThis section characterizes the noise environment in the study area, and addresses the potential changes in thenoise environment that could occur from implementation of the project alternatives.Affected EnvironmentThe affected environment includes noise sensitive receptors, noise sources, and existing ambient noise levels inthe study area. This section also provides a brief description of sound, noise, and noise terminology.Sound and Noise FundamentalsSound is a vibratory disturbance created by a moving or vibrating source, which is capable of being detected by thehearing organs. Noise is defined as sound that is loud, unpleasant, unexpected, or undesired and may therefore beclassified as a more specific group of sounds. The effects of noise on people can include general annoyance,interference with speech communication, sleep disturbance, and, in the extreme, hearing impairment.Decibels (dB) and FrequencyIn its most basic form, a continuous sound can be described by its frequency or wavelength (pitch) and itsamplitude (loudness). Frequency is expressed in cycles per second, or hertz. Frequencies are heard as the pitch ortone of sound. High-pitched sounds produce high frequencies; low-pitched sounds produce low frequencies.Sound pressure amplitude is measured in micro-Pascals (mPa). Sound pressure amplitudes for different kinds ofnoise environments can range from 20 to 100,000,000 mPa. Because this huge range of values is cumbersome anddifficult to use, a logarithmic scale is used to describe sound pressure level in terms of dB. The threshold of hearingfor young people is about 0 dB, which corresponds to 20 mPa.As dB are measured on a logarithmic scale that quantifies sound intensity, similar to the Richter scale used forearthquake magnitudes, dB cannot be added or subtracted through ordinary arithmetic. A doubling of the energyof a noise source, such as doubling of traffic volume, would increase the noise level by 3-dB; a halving of theenergy would result in a 3 dB decrease. In way of example, if an air conditioner produces a sound pressure level of85 dB at 50 feet, two air conditioners at the same distance would produce 88 dB—not 170 dB.Perception of Noise at the Receiver and A-WeightingThe human ear is not equally sensitive to all frequencies within the soundspectrum. To accommodate this phenomenon, the A-scale, which approximates the frequency response of theaverage young ear when listening to most ordinary everyday sounds, was devised. When people make relativejudgments of the loudness or annoyance of a sound, their judgments correlate well with the A-scale sound levelsof those sounds. Therefore, the “A-weighted” noise scale is used for measurements and standards involving thehuman perception of noise. Noise levels using A-weighted measurements are written dB(A) or dBA. Table 3.5-1Typical Noise Levels shows the relationship of various noise levels to commonly experienced noise events.Common Outdoor ActivitiesTable 3.5-1Typical Noise LevelsNoise Level(dBA)Jet Fly-over at 300 meters (1,000 feet) --100--Gas Lawn Mower at 1 meter (3 feet) --90--Diesel Truck at 15 meters (50 feet), at 80 km/hr (50 mph) --80----110-- Rock BandCommon Indoor ActivitiesFood Blender at 1 meter (3 feet) GarbageDisposal at 1 meter (3 feet)Noisy Urban Area, Daytime --70-- Vacuum Cleaner at 3 meters (10 feet)<strong>Draft</strong> | June 2013 3-71
GORST PLANNED ACTION EIS | AFFECTED ENVIRONMENT, SIGNIFICANT IMPACTS, AND MITIGATION MEASURESCommon Outdoor ActivitiesGas Lawn Mower at 30 meters (100 feet)Commercial Area Heavy Traffic at 90 meters(300 feet)Noise Level(dBA)Common Indoor Activities--60-- Normal Speech at 1 meter (3 feet)Quiet Urban Daytime --50-- Large Business Office Dishwasher in Next RoomQuiet Urban Nighttime --40-- Theater, Large Conference Room (Background)Quiet Suburban Nighttime --30-- LibraryQuiet Rural Nighttime --20-- Bedroom at Night, Concert Hall (Background)--10-- Broadcast/Recording StudioLowest Threshold of Human Hearing --0-- Lowest Threshold of Human HearingSource: Caltrans 2009Human perception of noise has no simple correlation with acoustical energy. The perception of noise is not linearin terms of dBA or in terms of acoustical energy. Two noise sources do not “sound twice as loud” as one source. Itis widely accepted that the average healthy ear can barely perceive changes of three dBA, increase or decrease;that a change of five dBA is readily perceptible; and that an increase (decrease) of 10 dBA sounds twice (half) asloud.Noise PropagationFrom the source to the receiver, noise changes both in level and frequency spectrum. The most obvious is thedecrease in noise as the distance from the source increases. The manner in which noise reduces with distancedepends on the important factors described in the following discussion.Geometric spreading from point and line sources: Sound from a small localized source (approximating a “point”source) radiates uniformly outward as it travels away from the source in a spherical pattern. The sound levelattenuates or drops off at a rate of six dBA for each doubling of the distance. The movement of the vehicles makesthe source of the sound appear to emanate from a line (line source) rather than a point when viewed over sometime interval. The sound level attenuates or drops off at a rate of three dBA per doubling of distance for linesources (Crocker et al. 2007).Ground absorption: Hard sites (i.e., sites with a reflective surface between the source and the receiver, such asparking lots or smooth bodies of water) receive no excess ground attenuation, and the changes in noise levels withdistance (drop-off rate) are simply the geometric spreading of the source. Soft sites are sites that have anabsorptive ground surface such as soft dirt, grass, or scattered bushes and trees and receive an excess groundattenuation value of 1.5 dBA per doubling of distance (Crocker et al. 2007).Atmospheric effects: Wind speed will bend the path of sound to “focus” it on the downwind side and make a“shadow” on the upwind side of the source. At short distances, up to 164 feet, the wind has minor influence on themeasured sound level. For longer distances, the wind effect becomes appreciably greater. Temperature gradientscreate effects similar to those of wind gradients, except that they are uniform in all directions from the source. Ona sunny day with no wind, temperature decreases with altitude, giving a shadow effect for sound. On a clear night,temperature may increase with altitude, focusing sound on the ground surface (Caltrans 2009).Shielding by natural and man-made features, noise barriers, diffraction, and reflection: A large object in the pathbetween a noise source and a receiver can significantly attenuate noise levels at that receiver location. Theamount of attenuation provided by this “shielding” depends on the size of the object and the frequencies of thenoise levels. Natural terrain features such as hills and dense woods, as well as fabricated features such as buildingsand walls, can significantly alter noise levels.<strong>Draft</strong> | June 2013 3-72
GORST PLANNED ACTION EIS | AFFECTED ENVIRONMENT, SIGNIFICANT IMPACTS, AND MITIGATION MEASURESNoise DescriptorsThe intensity of environmental noise fluctuates over time, and several different descriptors of time-averaged noiselevels are used. The selection of a proper noise descriptor for a specific source depends on the spatial andtemporal distribution, duration, and fluctuation of both the noise source and the environment. The noisedescriptors used in this report to describe environmental noise are defined below.• L max (Maximum Noise Level): The highest A-weighted integrated noise level occurring during a specific periodof time.• L min (Minimum Noise Level): The lowest A-weighted integrated noise level during a specific period of time.• Peak: The highest weighted or unweighted instantaneous peak-to-peak value occurring during a measurementperiod.• L n (Statistical Descriptor): The noise level exceeded n percent of a specific period of time, generally acceptedas an hourly statistic. An L 10 would be the noise level exceeded 10 percent of the measurement period.• L eq (Equivalent Noise Level): The energy mean (average) noise level. The steady-state sound level that, in aspecified period of time, contains the same acoustical energy as a varying sound level over the same timeperiod.• L dn (Day-Night Noise Level): The 24-hour L eq with a 10-dBA “penalty” applied during nighttime noise-sensitivehours, 10:00 p.m. through 7:00 a.m. The L dn attempts to account for the fact that noise during this specificperiod of time is a potential source of disturbance with respect to normal sleeping hours.AMBIENT NOISE ENVIRONMENTThe ambient noise environment includes noise sensitive receivers, noise sources, and noise levels within the studyarea. Unincorporated portions of the watershed are under the jurisdiction of Kitsap County. KCC Chapter 10.28(Noise) establishes noise levels and durations of noise crossing property boundaries within unincorporated KitsapCounty. The majority of the watershed is currently under the jurisdiction of the City of Bremerton. In addition, the<strong>Gorst</strong> UGA is likely to be under the jurisdiction of the City of Bremerton as a result of annexation in the time periodcovered by this <strong>Draft</strong> EIS. BMC Chapter 6.32 (Noise Levels) establishes limits on noise levels and durations of noisecrossing property boundaries within the City of Bremerton. Kitsap County and City of Bremerton noise regulationsare detailed below under Mitigation Measures, Applicable Regulations and Commitments.Noise sensitive receivers are generally considered humans engaged in activities or utilizing land uses that may besubject to the stress of significant interference from noise. Activities usually associated with sensitive receptorsinclude, but are not limited to, talking, reading, and sleeping. Land uses often associated with sensitive receptorsinclude residential dwellings, mobile homes, hotels, motels, hospitals, nursing homes, education facilities, libraries,and churches. Parks and open space are also sometimes considered to be noise sensitive land uses. Generally,outdoor areas of frequent human use are considered to be noise sensitive. Industrial and commercial land uses aregenerally not considered sensitive to noise.WatershedNoise sensitive receivers in the watershed include single-family residences, mobile homes, an RV park, churches,the Sunnyslope Elementary School, the Gold Mountain Golf Course, and the Rodeo Drive-In Theater. Sensitivereceivers outside of the UGA are likely affected the most by vehicular traffic on SR 3, West Belfair Valley Road,Sunnyslope Road Southwest, and on local roads. Aircraft overflights from the Bremerton National Airport are alikely intermittent noise source throughout the watershed; noise associated with aircraft take-off and landingslikely contribute to the ambient noise environment in the vicinity of the mobile home park and drive-in near theeast end of the Bremerton National Airport runway. Although no sound-level measurements were taken as part ofthis evaluation, typical ambient outdoor daytime sound levels are expected to range from as low as 35 to 40 dBA in<strong>Draft</strong> | June 2013 3-73
GORST PLANNED ACTION EIS | AFFECTED ENVIRONMENT, SIGNIFICANT IMPACTS, AND MITIGATION MEASURESrural areas away from major highways to as high as 50 to 75 dBA in more urban areas (near <strong>Gorst</strong>) near SR 3(Caltrans 2009; FTA 2006).<strong>Gorst</strong> UGANoise sensitive receivers within the UGA primarily include single-family residences along SR 3, SR 6, West BelfairValley Road, West Sam Christopherson Avenue, and other local roads, and the Family Worship Center on WestFrontage Road on the south side of SR 6. Noise sensitive receivers within the UGA are likely affected the most byvehicular traffic on SR 3 and SR 6, West Belfair Valley Road, and on local roads. Mechanical equipment and truckloading and unloading operations associated with commercial and industrial operations along SR 3 and SR 6,operations associated with the quarry north of Sherman Heights Road, also likely contribute to the overall noiseenvironment within the UGA. Other intermittent noise sources likely include periodic aircraft overflights and railnoise associated railroad connecting the Puget Sound Naval Shipyard (PSNS) with the Bangor submarine facilityand the Port of Shelton along the shoreline of Sinclair Inlet. Although, no sound-level measurements were taken aspart of this evaluation, typical ambient, outdoor, daytime sound levels are expected to be between 60 and 75 dBAwithin the UGA, depending on distance from the roadway (Caltrans 2009; FTA 2006).<strong>Impact</strong>sThis section describes the potential changes to the existing ambient noise environment from implementation ofthe project alternatives.IMPACTS COMMON TO ALL ALTERNATIVESWatershedConstruction NoiseUnder all alternatives, development would occur throughout the <strong>Gorst</strong> Creek watershed to varying degrees asallowed by zoning and applicable regulations. As discussed in Section 2.5 Study Alternatives: Future Growth, it isassumed that most development outside of the UGA would be associated with residential dwellings, with less than500 new dwellings constructed over the next 20-30 years.Development in the watershed, outside of the <strong>Gorst</strong> UGA, may involve construction activity near existingresidences, temporarily increasing noise levels. Sounds originating from temporary construction sites as a result ofconstruction activity are exempt from daytime noise limits in the Kitsap County noise ordinance (KCC 10.28.070).Construction noise levels immediately adjacent to construction sites could be up to twice as loud as existingambient noise levels and could cause annoyance or interfere with speech communication at adjacent outdoorlocations. Construction noise levels could be discernible up to several hundred feet away from the constructionsite. Nighttime construction activity, if required, is not exempt from the Kitsap County's noise ordinance, andwould be required to comply with the nighttime limits specified in the Kitsap County's noise ordinance.Compliance with the Kitsap County's nighttime noise ordinance limits would minimize any impacts from nighttimeconstruction activity.Traffic NoiseDevelopment in the watershed would result in increases in future traffic volumes on highways and local roadsoutside of the UGA, resulting in higher ambient noise levels from moving and idling vehicles. Potential noiseimpacts on sensitive receivers would vary with distance from the roadway.Any roadway improvements that would occur in the watershed that would use state or federal funding would besubject to State and/or Federal Highway Administration (FHWA) policies and procedures for evaluating trafficnoise impacts and noise abatement. In cases where no state or federal funding is involved, the WSDOT and FHWAprotocols are not applicable.<strong>Draft</strong> | June 2013 3-74
GORST PLANNED ACTION EIS | AFFECTED ENVIRONMENT, SIGNIFICANT IMPACTS, AND MITIGATION MEASURES<strong>Gorst</strong> UGAConstruction NoiseUnder all alternatives, the majority of planned development would be focused within the <strong>Gorst</strong> UGA. Within theUGA, development could occur within the 281 parcel acres identified in Table 2-2 Land Use Acres Comparison(Total Parcel Acres by Zone), although the types of development would vary by alternative. Potential noise impactsassociated with construction activities within the UGA would be similar to those described for the watershed.However, because construction activity would be concentrated over a smaller area, and multiple constructionactivities may occur simultaneously or in overlapping timeframes in the same general area, residences and othernoise sensitive receptors within the <strong>Gorst</strong> UGA would likely experience temporary increases in noise levels fromconstruction more often and for longer periods of time, and construction noise levels may be higher. Soundsoriginating from temporary construction sites as a result of construction activity are exempt from daytime noiselimits in the City of Bremerton noise ordinance. Construction noise levels immediately adjacent to constructionsites could be up to twice as loud as existing ambient noise levels and could cause annoyance or interfere withspeech communication at adjacent outdoor locations. Construction noise levels could be discernible up to severalhundred feet away from the construction site. Nighttime construction activity, if required, is not exempt from theCity of Bremerton's noise ordinance, and would be required to comply with the nighttime limits specified in theCity of Bremerton's noise ordinance. Compliance with the City of Bremerton's nighttime noise ordinance limitswould minimize any impacts from nighttime construction activity.Traffic NoiseDevelopment both within and outside of the UGA would result in increases in future traffic volumes on highwaysand local roads within the UGA, resulting in higher ambient noise levels from moving and idling vehicles. Potentialnoise impacts on sensitive receivers would vary with distance from the roadway. Modeled future daily trafficvolumes and PM peak hour vehicles on study area roads are similar under all alternatives, and are estimated toincrease by less than 35 percent over existing (2010) volumes. Based on the modeled data, traffic noise would beexpected to increase by less than three dB(A), a change that is barely perceptible to the average human ear.At this time, specific roadway improvements within the UGA have not yet been identified. Any roadwayimprovements that would occur within the UGA that would use state or federal funding would be subject to Stateand/or FHWA policies and procedures for evaluating traffic noise impacts and noise abatement. In cases where nostate or federal funding is involved, the WSDOT and FHWA protocols are not applicable.Noise from New Commercial OperationsLand use within the <strong>Gorst</strong> UGA under all alternatives would include residential and commercial use to varyingdegrees. New commercial development would likely occur near existing or future residences and other sensitivereceivers. Mechanical equipment and trucks at loading docks could cause ambient noise levels at nearbyresidences to exceed the Kitsap County’s and City of Bremerton's noise ordinance. However, the Kitsap County andCity of Bremerton would require that all new development meet the Kitsap County’s and City of Bremerton'sdaytime and nighttime noise ordinance limits.Alternative 1Construction, traffic, and noise from new commercial operations under Alternative 1 would be similar to that forall alternatives (described above). Land uses under Alternative 1 would include urban industrial uses, includingheavy industrial. However, residential land uses under Alternative 1 would cover only 13 percent of the total UGAand the overall number of existing and future sensitive receivers that could potentially experience noise impacts ismuch smaller than under Alternatives 2 and 3. Regardless, new commercial and industrial operations could occurnear existing or new residences and other sensitive receivers, and operations could cause noise levels to exceedKitsap County’s and the City of Bremerton's noise ordinance. Under Alternative 1, the majority of land zoned asLow Density Residential would be adjacent or in close proximity to areas zones as High Intensity Commercial Mixed<strong>Draft</strong> | June 2013 3-75
GORST PLANNED ACTION EIS | AFFECTED ENVIRONMENT, SIGNIFICANT IMPACTS, AND MITIGATION MEASURESUse along West Belfair Valley Road, West Sam Christopherson Avenue, and West Frone Drive. A small area north ofWest Sherman Heights Road that would be zoned as Low Density Residential under Alternative 1 would bebounded by High Intensity Mixed Use and Industrial areas and Mineral Resource lands to the north (see Figure 2-3<strong>Gorst</strong> Watershed Planning Area Land Use). The Kitsap County and City of Bremerton would require that all newdevelopment meet the Kitsap County’s and City of Bremerton's daytime and nighttime noise ordinance limits.Alternative 2Construction, traffic, and noise from new commercial operations under Alternative 2 would be similar to that forall alternatives (described above). However, residential land uses under Alternative 2 would cover 49 percent ofthe UGA, increasing the overall number of existing and new sensitive receivers that could potentially be affectedby noise from new commercial operations. While residential land uses under Alternative 2 are zoned separatelyfrom commercial zones, new commercial operations could occur near existing or new residences and othersensitive receivers, and operations could cause noise levels to exceed the Kitsap County’s and City of Bremerton'snoise ordinance. Under Alternative 2, land zoned as Low Density Residential would be adjacent or in closeproximity to areas zones as Commercial Corridor along West Belfair Valley Road, West Sam ChristophersonAvenue, West Frone Drive, and SR 3. Areas zoned as Medium Density Residential would be in close proximity toCommercial Corridor zones along West Sherman Heights Road (see Figure 2-4 <strong>Gorst</strong> UGA Land Use: Alternative 1 –Kitsap County No <strong>Action</strong>). The Kitsap County and City of Bremerton would require that all new development meetthe Kitsap County’s and City of Bremerton's daytime and nighttime noise ordinance limits.Alternative 3Construction, traffic, and noise from new commercial operations under Alternative 3 would be similar to that forall alternatives (described above). The overall increase in number of dwellings and population would be onlyslightly greater than Alternative 2 (See Section 2.5 Study Alternatives: Future Growth). However, under Alternative3, areas zoned as <strong>Gorst</strong> Mixed Use would likely include residential uses located above or in very close proximity tocommercial uses, and in areas served by public transit along major roadways. This development pattern increasesthe potential for operational noise levels associated with commercial development to exceed noise thresholds inthe Kitsap County’s and City of Bremerton's noise ordinance and impact nearby sensitive receivers. As under allalternatives, the Kitsap County and City of Bremerton would require that all new development meet the KitsapCounty’s and City of Bremerton's daytime and nighttime noise ordinance limits.Mitigation MeasuresIncorporated Plan FeaturesUnder Alternative 3, the proposed balance of residential and commercial uses would reduce future trafficcongestion on state routes compared to Alternatives 1 and 2 which have about the same level of congestion.Please see Section 3.11 Transportation.Applicable Regulations and CommitmentsCity of Bremerton Noise RegulationsBMC Chapter 6.32 (Noise Levels) establishes limits on noise levels and durations of noise crossing propertyboundaries with the City of Bremerton. Permissible noise levels at a receiving land use depend on the NoiseControl District classification of the both the sound source and the receiving property. The City of Bremerton NoiseControl District classifications for land use zones designated in the City of Bremerton's zoning ordinance are shownin Table 3.5-2 City of Bremerton Noise Control Districts. These will need to be updated with the possibility of newzoning classifications to be applied in <strong>Gorst</strong> through the subarea plan.<strong>Draft</strong> | June 2013 3-76
GORST PLANNED ACTION EIS | AFFECTED ENVIRONMENT, SIGNIFICANT IMPACTS, AND MITIGATION MEASURESDistrict IDistrict IIDistrict IIINoise Control DistrictSource: BMC Chapter 5.32.010(c)Table 3.5-2City of Bremerton Noise Control DistrictsR-10, CCR, MRLand Use ZoneNB, BC, CC, WWRC, NCC, DCC, DW, DC, LC, EC, INSTIP, I, CUL, WS, MI, FCPermissible noise limits are shown in Table 3.5-3 Maximum Permissible Levels at Receiving Property Line. Betweenthe hours of 10:00 p.m. and 7:00 a.m. (nighttime hours) permissible noise levels are reduced by ten (10) dB(A) forreceiving properties within Noise Control District 1.Noise Control District ofSound SourceTable 3.5-3Maximum Permissible Levels at Receiving Property LinePermissible Noise Level in dBA Noise Control District of Receiving PropertyDistrict I District 2 II District IIIDaytime Nighttime All Hours All HoursDistrict I 55 45 57 60District II 57 47 60 65District III 60 50 65 70Source: BMC Chapter 5.32.040(a) (b)For noise levels that exceed the above levels for short durations, maximum permissible sounds levels are regulatedas shown in Table 3.5-4 Adjustment to Maximum Permissible Levels at Receiving Property Line.Table 3.5-4Adjustment to Maximum Permissible Levels at Receiving Property LineDuration of Sound Level within 1 1-Hour IntervalAdjustment to Maximum Permissible Sound Level15 minutes + 5 dBA5 minutes + 10 dBA1.5 minutes + 15 dBANote:BMC Chapter 5.32.040 (d) specifies sounds that are exempt from some or all of these provisions.Source: BMC Chapter 5.32.040(c)Sounds that are exempt from the maximum permissible noise levels adopted by the City of Bremerton betweenthe hours of 7:00 a.m. and 10:00 p.m. include:• Sounds originating from residential property relating to temporary projects for the maintenance or repair ofhomes, grounds, and appurtenances.• Sounds created by the discharge of firearms on authorized shooting ranges.• Sounds created by aircraft engine testing and maintenance not related to flight operations; provided thataircraft testing and maintenance shall be conducted at remote sites whenever possible.Sounds that are exempt from the maximum permissible noise levels adopted by the City of Bremerton betweenthe hours of 10:00 p.m. and 7:00 a.m. include:• Noise from electrical substations and existing stationary equipment used in the conveyance of water, wastewater, and natural gas by a utility.<strong>Draft</strong> | June 2013 3-77
GORST PLANNED ACTION EIS | AFFECTED ENVIRONMENT, SIGNIFICANT IMPACTS, AND MITIGATION MEASURES• Noise from existing industrial installations which exceed the standards contained in these regulations andwhich, over the past three years, have consistently operated in excess of 15 hours per day as a consequence ofprocess necessity and/or demonstrated routine normal operation. Changes in working hours, which wouldaffect exemptions under this regulation, require approval from Ecology.Sounds that are exempt from the maximum permissible noise levels adopted by the City of Bremerton at all times,except where provisions relate to the reception of noise within Noise Control District I between the hours of 10:00p.m. and 7:00 a.m. include:• Sounds originating from temporary construction sites as a result of construction activity.• Sounds originating from forest harvesting and silviculture activity.Sounds that are exempt from the maximum permissible noise levels adopted by the City of Bremerton at all timesinclude:• Sounds created by motor vehicles when regulated by Chapter 173-62 of the WAC.• Sounds originating from aircraft in flight and sounds that originate at airports which are directly related toflight operations.• Sounds created by surface carriers engaged in interstate commerce by railroad.• Sounds created by warning devices not operating continuously for more than five minutes, or bells, chimes,and carillons.• Sounds created by safety and protective devices where noise suppression would defeat the intent of thedevice or is not economically feasible.• Sounds created by emergency equipment and work necessary in the interest of law enforcement or for healthsafety or welfare of the community.• Sounds originating from motor vehicle racing events at existing authorized facilities.• Sounds originating from officially sanctioned parades and other public events.• Sounds emitted from petroleum refinery boilers during start-up of said boilers; provided the start-upoperation is performed during daytime hours whenever possible.• Sounds created by watercraft.• Sounds created by the discharge of firearms in the course of hunting.• Sounds created by motor vehicles, licensed or unlicensed, when operated off public highways except whensuch sounds are received in District I.All new development would be required to comply with current noise regulations in the BMC. If nighttimeconstruction is required, the developer will need to demonstrate compliance with the City of Bremerton'snighttime noise ordinance limits or apply for a variance.Kitsap County Noise RegulationsKCC Chapter 10.28 (Noise) establishes limits on noise levels and durations of noise crossing property boundarieswithin the unincorporated areas of Kitsap County. Permissible noise levels at a receiving land use depend on itsenvironmental classification for noise abatement (EDNA). Kitsap County EDNA classifications are shown in Table3.5-5 Kitsap County EDNAs:<strong>Draft</strong> | June 2013 3-78
GORST PLANNED ACTION EIS | AFFECTED ENVIRONMENT, SIGNIFICANT IMPACTS, AND MITIGATION MEASURESEDNAClass AClass BClass CTable 3.5-5Kitsap County EDNAsLand Use ZoneResidential Zones: all single-family residential zones, all multiple-family residential zones, residentialmobile home zone, agricultural zone, forestry zone, undeveloped land zone.Commercial Zones: business neighborhood zone, business general zone, commercial zone, lightmanufacturing zone.Industrial Zones: manufacturing zone.Non-conforming uses, as defined by Chapter 17.460 of the Kitsap County Zoning Ordinance, are classifiedaccording to the actual use of the property under the above EDNAs.Permissible noise limits are shown in Table 3.5-6 Maximum Permissible Levels at Receiving Property Line. Betweenthe hours of 10:00 p.m. and 7:00 a.m. (nighttime hours) permissible noise levels are reduced by ten dB(A) forreceiving properties within Class A EDNAs.EDNA of Noise SourceTable 3.5-6Maximum Permissible Levels at Receiving Property LinePermissible Noise Level in dBAEDNA of Receiving PropertyClass A Class B Class CDaytime Nighttime All Hours All HoursClass A 55 45 57 60Class B 57 47 60 65Class C 60 50 65 70Source: KCC Chapter 10.28.040(a) (b)For noise levels that exceed the above levels for short durations, maximum permissible sounds levels are regulatedas shown in Table 3.5-7 Adjustment to Maximum Permissible Levels at Receiving Property Line.Table 3.5-7Adjustment to Maximum Permissible Levels at Receiving Property LineDuration of Sound Level within 1 1-Hour IntervalAdjustment to Maximum Permissible Sound Level15 minutes + 5 dBA5 minutes + 10 dBA1.5 minutes + 15 dBASource: KCC Chapter 10.28.040(c)Chapter 10.28.050 specifies sounds that are exempt from some or all of the provision in Chapter 10.28.050 (a) (b).• Sounds that are exempt from the maximum permissible noise levels adopted by Kitsap County between thehours of 7:00 a.m. and 10:00 p.m. include the same sounds exempted by the City of Bremerton, in addition toblasting.• Sounds that are exempt from the maximum permissible noise levels adopted by Kitsap County between thehours of 10:00 p.m. and 7:00 a.m. are similar to sounds exempted by the City of Bremerton during nighttimehours.<strong>Draft</strong> | June 2013 3-79
GORST PLANNED ACTION EIS | AFFECTED ENVIRONMENT, SIGNIFICANT IMPACTS, AND MITIGATION MEASURES• Sounds that are exempt from the maximum permissible noise levels adopted by Kitsap County at all times,except where provisions relate to the reception of noise within Class A EDNAs between the hours of 10:00p.m. and 7:00 a.m. are the same as sounds exempted by the City of Bremerton.• Sounds that are exempt from the maximum permissible noise levels adopted by Kitsap County at all times aresimilar to sounds exempted by the City of Bremerton, but include: sounds from existing refrigerationequipment for preservation of retail food goods, sounds caused by natural phenomena and unamplifiedhuman voices, and sounds created by the discharge of legal fireworks only during specific days, times, andlocations where discharge is allowable pursuant to existing state and local law. Kitsap County exemptions donot include: sounds created by watercraft or sounds created by the discharge of firearms in the course ofhunting.All new development would be required to comply with current noise regulations in the KCC. If nighttimeconstruction is required, the developer will need to demonstrate compliance with the County's nighttime noiseordinance limits or apply for a variance.Federal and State Noise RegulationsThe FHWA has adopted criteria for evaluating noise impacts associated with federally funded highway projects,and for determining whether such impacts are sufficient to justify funding of noise abatement. These criteria arespecified in the Code of Federal Regulations (23 CFR 772), Procedures for Abatement of Highway Traffic Noise andConstruction Noise. WSDOT has adopted the FHWA Noise Abatement Criteria for evaluating noise impacts anddetermining whether such impacts are sufficient to justify funding of noise abatement for roadway improvementprojects with state funding.Traffic noise impacts occur when predicted Leq(h) noise levels approach or exceed the noise abatement criteriaestablished by the FHWA, or substantially exceed existing noise levels. WSDOT considers a noise impact to occur ifpredicted noise Leq(h) noise levels approach within one dBA of the noise abatement criteria. The FHWA noiseabatement criteria specify exterior Leq(h) noise levels for various land activity categories as described in Table 3.5-8 FHWA Noise Abatement Criteria by Land Use. WSDOT considers an increase of 10-dBA or more to be asubstantial increase and a traffic noise impact.ActivityCategoryAFHWA NoiseAbatement(dBA Leq)57 (exterior)Table 3.5-8FHWA Noise Abatement Criteria by Land UseDescription of Activity CategoryLands on which serenity and quiet are of extraordinary significance and serve an importantpublic need and where the preservation of those qualities is essential if the area is tocontinue to serve its intended purpose.B 67 (exterior) Residential (single and multi-family units)CDE67 (exterior)52 (interior)72 (exterior)Active sport areas, amphitheaters, auditoriums, campgrounds, cemeteries, day carecenters, hospitals, libraries, medical facilities, parks, picnic areas, places of worship,playgrounds, public meeting rooms, public or nonprofit institutional structures, radiostudios, recording studios, recreation areas, Section 4(f) sites, schools, television studios,trails, and trail crossingsAuditoriums, day care centers, hospitals, libraries, medical facilities, places of worship,public meeting rooms, public or nonprofit institutional structures, radio studios, recordingstudios, schools, and television studios.Hotels, motels, offices, restaurants/bars, and other developed lands, properties oractivities not included in A-D or F. Includes undeveloped land permitted for these activities.F - Agriculture, airports, bus yards, emergency services, industrial, logging, maintenance<strong>Draft</strong> | June 2013 3-80
GORST PLANNED ACTION EIS | AFFECTED ENVIRONMENT, SIGNIFICANT IMPACTS, AND MITIGATION MEASURESActivityCategoryFHWA NoiseAbatement(dBA Leq)Description of Activity Categoryfacilities, manufacturing, mining, rail yards, retail facilities, shipyards, utilities (waterresources, water treatment, electrical), and warehousingG - Undeveloped lands that are not permittedAny roadway improvements that would occur within the study area that would use state or federal funding wouldbe subject to State and/or FHWA policies and procedures for evaluating traffic noise impacts and noise abatement.In cases where no state or federal funding is involved, the WSDOT and FHWA protocols are not applicable.Other Potential Mitigation MeasuresEffective noise abatement measures are unique for each situation. The physical techniques to mitigate noise varyin their noise reduction capabilities. Factors to consider when evaluating potential noise mitigation include: theamount of noise reduction desired, situations where physical techniques would be most effective, and aesthetics.The following measures may be used to mitigate noise impacts:Site PlanningProper site planning to reduce noise impacts should be considered for all noise sensitive developments. Buildingscan be oriented on a site in such a way as to exploit the site's noise attenuating features. By consideration of asite’s natural topography, size and shape, it is often possible to reduce and possibly eliminate noise impacts fromvehicular traffic and railroads. Site planning techniques includes the following:• Increasing the distance from the noise source to sensitive receptors by creation of setbacks;• Placing non-noise sensitive uses such as parking lots and utility areas between the noise source and receiver;and• Orienting usable outdoor living space such as balconies, patios, and child play areas away from roadways.BarriersNoise barriers such as walls and earthen berms are commonly used to mitigate noise from ground transportation,commercial and industrial sources. Noise barriers can be used to reduce the noise level both outdoors and indoors.The effectiveness of a barrier depends upon factors such as the relative height of the barrier relative to the line-ofsightfrom the source to the receiver, the distance from the barrier to the source and to the receiver and thereflections of sound. To be effective, a barrier must block the line-of-sight from the source to the receiver. Abarrier must also be of solid construction (i.e., masonry) without holes or gaps and be long enough to preventsound from passing around the ends. Under the best of circumstances, a properly designed noise barrier canreduce noise as much as 15 dB. A site-specific acoustical analysis is required to determine the proper height andplacement of a barrier. A row of houses or other buildings may act as a barrier. A row of one- or two-story houses(with about 30 percent open gaps) provides a barrier attenuation of approximately three to five dB; two rows ofhouses, six to 10 db; and three or more rows of houses, 10 to 12 db.Building DesignThe location of a building on its site, the arrangement of rooms, and the location of doors and windows all have abearing on interior noise control. The sides of a building which face a roadway or other noise source should housethose activities that can tolerate the greatest amount of noise. Noise-sensitive areas include bedrooms, livingrooms and dens. Less noise sensitive areas may include kitchens and bathrooms. Hallways, closets and storagerooms are generally not noise-sensitive.<strong>Draft</strong> | June 2013 3-81
GORST PLANNED ACTION EIS | AFFECTED ENVIRONMENT, SIGNIFICANT IMPACTS, AND MITIGATION MEASURESIndoor noise levels are controlled by the noise reduction characteristics of the building shell. In general, doors andwindows are the acoustical weak link in a building. Therefore, careful consideration should be given to theirplacement. By limiting the number and size of these openings on the sides of the building exposed to noise,interior noise levels will be reduced.Often it is necessary to allow for a closed window condition to control interior noise. When this occurs, analternative means of ventilation such as heat pumps or forced air units may be necessary to meet building coderequirements. Heavy-pane or double-pane windows are frequently required to increase the sound insulationwithin a room. Doors facing a noise source should be solid-core and should be equipped with an appropriategasket.Local/Applicable Noise Level StandardsThe following mitigation measures are general and programmatic in nature, and may be further refined in projectspecificSEPA documents applicable in the watershed or applied in the <strong>Planned</strong> <strong>Action</strong> Ordinance in the UGA.Revise the Noise Ordinance and condition development proposals to achieve the following:• Provide hourly and maximum property line noise level limits for all major zoning districts defined in the ZoningOrdinance• Limit the hours of deliveries to commercial, mixed use, and industrial uses adjacent to residential and othernoise sensitive land uses• Limit the hours of operation for commercial and retail to limit noise intrusion into nearby residential and othernoise sensitive land uses• Limit noise levels generated by commercial and industrial uses• Limit outdoor industrial activities or operations to control excessive noise at adjacent residential properties• Limit the hours of operation of high noise-generating industrial equipment• Limit the hours of operation for refuse vehicles and parking lot sweepers if their activity results in an excessivenoise level that adversely affects adjacent residential uses• Require the placement of loading and unloading areas so that commercial buildings shield nearby residentialland uses from noise generated by loading dock and delivery activities. If necessary, additional sound barriersshall be constructed on the commercial sites to protect nearby noise sensitive uses• Require the placement of all commercial HVAC machinery to be placed within mechanical equipment roomswherever possible. (Equipment manufacturer’s specifications for venting and access to outside air shall bemaintained.)• Require the provision of localized noise barriers or rooftop parapets around HVAC, cooling towers, andmechanical equipment so that line-of-sight to the noise source from the property line of the noise sensitivereceptors is blocked. (Equipment manufacturer’s specifications for venting and access to outside air shall bemaintained.)In project-specific SEPA documents applicable in the watershed or through the <strong>Planned</strong> <strong>Action</strong> Ordinance in theUGA, the Kitsap County and City of Bremerton should require construction contractors to implement the followingmeasures during construction activities through contract provisions and/or conditions of approval as appropriate:• Construction equipment shall be properly maintained per manufacturers’ specifications and fitted with thebest available noise suppression devices (e.g., mufflers, silencers, wraps).• Construction operations and related activities associated with the project shall comply with the operationalhours outlined in the Kitsap County or City of Bremerton Noise Ordinance.<strong>Draft</strong> | June 2013 3-82
GORST PLANNED ACTION EIS | AFFECTED ENVIRONMENT, SIGNIFICANT IMPACTS, AND MITIGATION MEASURES• Construction equipment shall not be idled for extended periods of time in the vicinity of noise sensitivereceptors.• Locate fixed and/or stationary construction equipment as far as possible from noise sensitive receptors (e.g.,generators, compressors, rock crushers, cement mixers).• Shroud or shield all impact tools, and muffle or shield all intake and exhaust ports on powered constructionequipment.Where feasible, temporary barriers shall be placed as close to the noise source or as close to the receptor aspossible and break the line of sight between the source and receptor where modeled levels exceed applicablestandards. Acoustical barriers shall be constructed material having a minimum surface weight of 2 pounds (lbs) persquare foot or greater, and a demonstrated Sound Transmission Class (STC) rating of 25 or greater as defined byAmerican Society for Testing and Materials (ASTM) Test Method E90. Placement, orientation, size, and density ofacoustical barriers shall be determined by analysis.Significant Unavoidable Adverse <strong>Impact</strong>sAt the comprehensive planning level, implementation of the mitigation measures described above would avoidand/or reduce potential noise impacts to less than significant. If project-level impacts are identified as subsequentprojects are proposed, specific mitigation measures would be required to meet Kitsap County and City ofBremerton noise limits.<strong>Draft</strong> | June 2013 3-83
GORST PLANNED ACTION EIS | AFFECTED ENVIRONMENT, SIGNIFICANT IMPACTS, AND MITIGATION MEASURES3.6 Hazardous MaterialsAffected EnvironmentPast and present land used within the watershed could have resulted in the use, storage, and release of hazardousmaterials within the study area. Because development is concentrated within the UGA, and because all of theproposed development alternatives pertain to land uses within the UGA, this area is of primary concern forcontaminants and exposure to contaminants as a result of the proposed project activities.MethodologyMaterials reviewed to collect information on hazardous materials within the UGA or in proximity to the UGA in thewatershed include readily available records, as well as reports from previous investigations.For watershed-level review, an online search of Ecology databases (http://www.ecy.wa.gov/database.html) wasconducted to determine the presence of facilities that generate, transport, store, or dispose of hazardousmaterials. Additionally, a review of regulatory database information for facilities located within 1 mile of the UGAwas conducted. An environmental records database search was contracted to <strong>Environmental</strong> Data Resources (EDR)and was supplemented by online search of the Ecology and EPA databases to determine whether properties withinthe UGA would appear on lists of entities that generate, transport, store, or dispose of hazardous materials. Thisdatabase review was consistent with the ASTM Practice E1527-05, Standard Practice for <strong>Environmental</strong> SiteAssessments: Phase I <strong>Environmental</strong> Site Assessment Process. Interviews with current facility operators were notconducted for this analysis.Each identified hazardous materials site was categorized into one of the following groups, based on the review ofrecords, current land use, and other available reports described previously:• Sites with No Apparent Risk. Sites with No Apparent Risk include those sites for which the records indicate noknow releases of hazardous materials, and there suggests little potential for contaminants to migrate into thestudy area.• Reasonably Predictable Sites. Reasonably Predictable Sites are sites where the nature of potentialcontamination is known based on existing investigation data, or where it can be reasonably predicted basedon observations of the site, and/or experience at similar sites, and/or best engineering judgment. Reasonablypredictable sites are typically small to medium in size; the potential contaminants are not extremely toxic ordifficult to treat; and probable remediation approaches are straightforward and well proven.• Substantially Contaminated Sites. Substantially Contaminated Sites warrant additional regulatory review andpossibly additional remediation by either the current owner or new buyers. These sites may represent healthrisks or economic risks for the future developers resulting from a combination of characteristics: highly toxicand/or highly mobile contaminants; difficult or costly site remediation requirements; and potential forconstruction delays. If the site has undergone a detailed investigation and feasibility study, and a remediationstrategy would be available and remediation costs may have already been predicted.Reasonably Predictable Sites and Substantially Contaminated Sites were considered areas of concern for thepurposes of this <strong>Draft</strong> EIS. Sites with No Apparent Risk are not discussed further in this section.The Final <strong>Draft</strong> Engineering Evaluation/Cost Analysis for Bremerton Auto Wrecking Landfill – <strong>Gorst</strong> Creek Site(Ecology and Environment, Inc. 2012) was reviewed to determine the historical land use of this landfill site, and thedocumented condition of soil and groundwater in the study area. The report summarizes proposed removalactions aimed at protecting human health and the environment by preventing human and ecological receptorcontact with landfill contents and associated hazardous substances and to comply with applicable or relevant andappropriate requirements to the extent practicable.<strong>Draft</strong> | June 2013 3-84
GORST PLANNED ACTION EIS | AFFECTED ENVIRONMENT, SIGNIFICANT IMPACTS, AND MITIGATION MEASURESWatershedAccording to the regulatory database review, the following facilities are located within the <strong>Gorst</strong> Creek Watershedwhich are either known or suspected to have released hazardous materials into soil or groundwater:• Victory Station Landfill – This facility is located at Victory Drive Southwest and State Route 3. Conventionalinorganic contaminants, conventional organic contaminants, halogenated organics, Priority Pollutant metals,and unspecified petroleum products are suspected in soil and groundwater, and Priority Pollutant metals aresuspected in surface water. This facility is reportedly awaiting cleanup. It is considered a SubstantiallyContaminated Site.• Airport Auto Wrecking I – This facility is located at 6504 Southwest Old Clifton Road. Priority Pollutant metals,unspecified petroleum products, and polynuclear aromatic hydrocarbons have been confirmed in soil and aresuspected in groundwater, and surface water and halogenated organics and non-halogenated solvents aresuspected in soils. This facility is reportedly awaiting cleanup. It is considered a Substantially ContaminatedSite.• Washington Cedar and Supply Company – This facility is located at 4041 West State Highway 3. Gasoline,diesel, and other petroleum have been confirmed in soil. Cleanup at this facility is reportedly underway. Thisfacility is considered a Reasonably Predictable Site.In addition, nine hazardous waste generators (one of which is located in the SKIA UGA), four facilities withUnderground Storage Tanks ([USTs]; one of which is located within the SKIA UGA), and one facility which storesthreshold quantities of hazardous materials under the Emergency Preparedness and Community Right to Know Actwere identified within the <strong>Gorst</strong> Creek Watershed (but outside of the <strong>Gorst</strong> UGA). These facilities were not listedon contamination-related databases and are considered Sites with No Apparent Risk. (Ecology 2013).<strong>Gorst</strong> UGAAccording to regulatory database review, numerous existing and historical commercial/industrial facilities withinthe UGA are either known or suspected to have released hazardous materials into the soil or groundwater. Thesesites are shown on Figure 3.6-1 <strong>Gorst</strong> Creek Watershed: Hazardous Materials Sites.Many sites in the UGA are reported as storing hazardous substances or waste (i.e., Resource Conservation andRecovery Act [RCRA] generators) in quantities large enough to trigger federal or state regulation. However, unlessa known or suspected release or contamination is listed on the appropriate federal or state databases, the site isconsidered a Site with No Apparent Risk. Only Reasonably Predictable Sites and Substantially Contaminated Sitesare included in this discussion and shown in Figure 3.6-1 <strong>Gorst</strong> Creek Watershed: Hazardous Materials Sites.Reasonably Predictable Sites are listed in Table 3.6-1 Reasonably Predictable Sites within the <strong>Gorst</strong> UGA. Thedatabase review showed historical contamination on these sites that is currently known and is being overseen byEcology or another appropriate regulatory agency. Substantially Contaminated Sites are listed in Table 3.6-2Substantially Contaminated Sites with the <strong>Gorst</strong> UGA. The database review or previous environmentalinvestigations showed reported contamination at these sites that could pose a health or economic risk.As shown in Table 3.6-1 Reasonably Predictable Sites within the <strong>Gorst</strong> UGA, contaminants of concern (gasoline,diesel, and other petroleum) were identified for only two of the Reasonably Predictable Sites, the <strong>Gorst</strong> Gas Martand Washington Cedar and Supply Co. Releases from USTs at these sites have resulted in contamination of soil andgroundwater. The remaining sites on this list are either of unknown status or have been cleaned up.As shown in Table 3.6-2 Substantially Contaminated Sites with the <strong>Gorst</strong> UGA, there are seven SubstantiallyContaminated Sites within the <strong>Gorst</strong> UGA. Contaminants from these sites consist of arsenic, inorganic and organicconventional contaminants, halogenated organics, lead, mercury, metals, non-halogenated solvents, petroleumproducts, polycyclic aromatic hydrocarbons, organics, pesticides, PCBs, and benzene. Contaminants have beenconfirmed or are expected in soil, groundwater, and surface water. With the exception of Valley Produce, for<strong>Draft</strong> | June 2013 3-85
GORST PLANNED ACTION EIS | AFFECTED ENVIRONMENT, SIGNIFICANT IMPACTS, AND MITIGATION MEASURESwhich additional information was not known, all of these facilities are currently undergoing cleanup or remedialactions.Bremerton Auto Wrecking Landfill, located on State Route 3, is a source of contamination of particular concernwithin the UGA. According to the report that was reviewed for this site, it is a former landfill site that operatedfrom the 1950s until 1989, and contains approximately 150,000 cubic yards of waste. The landfill primarilyreceived auto wrecking wastes but also received other wastes such as medical waste from PSNS as well asdemolition debris and municipal solid waste.Sediment and groundwater sampling results at this facility indicated the presence of contaminants associated withlandfill waste. The report indicated that during significant storm events <strong>Gorst</strong> Creek floods and overtops thelandfill, carrying eroded waste downstream in the stream sediments. Contaminated groundwater is also beingtransported down-gradient into the watershed. The contamination at this facility includes pesticides, PCBs, semi-VOCs, metals, and VOCs. This report identifies microtunneling/pipe jacking as the recommended removal actionalternative. By installing a creek bypass pipe, the potential for backup and overtopping of the landfill duringsignificant storm events would be reduced, as a primary new pathway for <strong>Gorst</strong> Creek would be provided beneaththe landfill.<strong>Draft</strong> | June 2013 3-86
Bremerton West UGAW BELFAIR VALLEY RDBurels <strong>Gorst</strong> TexacoAbandoned Rock Quarry<strong>Gorst</strong> UGAMurray Heike WarehousePioneer Landfill<strong>Gorst</strong> Gas Mart!.!.!. !.David A Krick!.!. !. !.166Stutz Fuel Oil !.!.!. !. !.Valley Produce 3Jackpot Station 363Bayview Subaru!.Navy City MetalsStarr AutomotiveSadtler PropertyPort Orchard Sand and Gravel <strong>Gorst</strong> PlantPath: P:\ENV\PROJECTSW\60271862 <strong>Gorst</strong> Subarea Plan\400 Technical Information\423 GIS\3_MXDs\EIS Figures\Hazardous Materials Sites.mxdSKIA UGA!.!.!.!.!.!.SKIA UGAVictory Station LandfillULID6Bremerton Auto Wrecking Landfill/<strong>Gorst</strong> Creek Landfill/Washington Cedar & Supply COPacific Welding and SupplyLab Pack DumpULID6!. Airport Auto Wrecking I¯ULID6SW OLD CLIFTON RD0 0.5 1 Miles
THIS PAGE INTENTIONALLY BLANK
GORST PLANNED ACTION EIS | AFFECTED ENVIRONMENT, SIGNIFICANT IMPACTS, AND MITIGATION MEASURESTable 3.6-1Reasonably Predictable Sites within the <strong>Gorst</strong> UGALocation/AddressBusiness NameSiteIdentifierDatabaseListingsSummaryContaminants of Concern(Identified by Ecology)3888 West Highway 16 Bayview Subaru 56413466 RCRA NonGen,FINDS, Allsites,UST4110 West StateHighway 16One UST which was installed in 1964 was removed in1996. No violations were reported in association withthe RCRA generator status.David A. Krick 48752156 Allsites, UST Three unleaded gasoline USTs, one leaded gasolineUST, and a diesel UST were removed from the facility in1999.4121 Highway 16 West <strong>Gorst</strong> Gas Mart 42261459 CSCSL, HSL,Allsites, LUST, UST,ICR6402 State Highway 3 Pacific Welding andSupply3408 West BelfairValley RoadMurray HeikeWarehouse2800 SR 3 Abandoned RockQuarryThe facility received a No Further <strong>Action</strong> designation inrelation to the LUST listing in 2002. Four gasoline USTsremain operational at the facility, one diesel UST wasremoved in 1998, and three additional USTs wereremoved in 2001.75997319 UST, LUST Based on the available information, it appears that theLUST listing was closed in 1997 and USTs were removedby 2000.8257809 FINDS, Allsites,CSCSL NFA, UST,InstitutionalControl, VCP, LUST2240695 Allsites, CSCSLNFA, VCP,Brownfields3772 State Highway 3 Burels <strong>Gorst</strong> Texaco 81639146 FINDS, Allsites,UST4041 West StateHighway 3Washington Cedarand Supply Co.52429541 CSCSL, Allsites,LUST, USTThe USTs were closed in place in 2003 and the facilityreceived a No Further <strong>Action</strong> Designation from Ecologyunder the VCP at that time. An environmental covenantexists for the facility which includes maintenancerequirements, soil restrictions, impermeable surfacerequirements, land use restrictions, and groundwaterrestrictions.This facility received a No Further <strong>Action</strong> designation byEcology in 2008 under the VCP.The status of the USTs at this facility is unknown.Three USTs were removed from this facility in 2010 andcleanup at the site from a leaking UST has started.3401 Highway 16 Starr Automotive 8261546 Allsites, UST The status of the USTs at this facility is unknown NANANAGasoline: Confirmed in soil andgroundwaterNANANADiesel: Confirmed in soilGasoline: Confirmed in soilPetroleum-other: Confirmed in soil<strong>Draft</strong> | June 2013 3-89
GORST PLANNED ACTION EIS | AFFECTED ENVIRONMENT, SIGNIFICANT IMPACTS, AND MITIGATION MEASURESLocation/AddressNorth of 7338Highway 33020 West ShermanHeights RoadBusiness NameBelfair Lab PackDumpKitsap Reclamationand MaterialsSiteIdentifierDatabaseListingsSummary1002739 CERCLIS The listing stated that removal only was necessary atthis facility and no site assessment work was needed.The facility was cleaned up in 2008.NAMines, SWRCY,Allsites, NPDES,RCRA-CESQG,FINDSThis facility is identified as a non-coal mining facilitywhich accepts asphalt paving, concrete, and brick forrecycling. No violations were reported in associationwith the RCRA listing.NAContaminants of Concern(Identified by Ecology)CERCLIS = Comprehensive <strong>Environmental</strong> Response Compensation and Liability Information System; CSCSL = Confirmed and Suspected Contaminated Sites List; CSCSL NFA = CSCSL NoFurther <strong>Action</strong>; FINDS = Facility Index System; HSL = Hazardous Sites List; ICR = Independent Cleanup Report; LUST = Leaking Underground Storage Tank; NPDES = NationalPollution Discharge Elimination System; RCRA NonGen = Resource Conservation and Recovery Act Non-Generator; RCRA-CESQG = RCRA Conditionally Exempt Small QuantityGenerator; SWRCY = Solid Waste and Recycling; UST = Underground Storage Tank; VCP = Voluntary Cleanup ProgramNA = Not Available/Not ApplicableSource: Ecology Inc. 2013NA<strong>Draft</strong> | June 2013 3-90
GORST PLANNED ACTION EIS | AFFECTED ENVIRONMENT, SIGNIFICANT IMPACTS, AND MITIGATION MEASURESTable 3.6-2Substantially Contaminated Sites within the <strong>Gorst</strong> UGALocation/AddressBusinessNameSiteIdentifierData Source and Findings Summary Contaminants of Concern(Identified by Ecology)3302 WestHighway 16Jackpot Station3631786697 CSCSL, Allsites, LUST, UST,VCPThree USTs were removed in 1996 and three additionalUSTs were abandoned in place. As of 2002, cleanupactions had been started at this facility.Benzene: Confirmed in groundwaterNon-halogenated solvents: Confirmedin groundwaterDiesel: Confirmed in groundwaterGasoline: Confirmed in groundwaterOther petroleum products: Confirmedin groundwater and soil3140 StateHighway 16SouthwestPort OrchardSand and Gravel<strong>Gorst</strong> Plant77255681 CSCSL, Allsites, LUST, UST,BrownfieldsFive USTs were removed in 1991 and two USTs wereclosed in place in 1996. This facility has beenundergoing independent remedial action since 1991.Arsenic: Confirmed in soil andgroundwater, suspected in surfacewaterInorganic conventional contaminants:Confirmed in soil and groundwater,suspected in surface waterPriority pollutant metals: Suspected insoil, groundwater, and surface waterNon-halogenated solvents: Suspectedin soilDiesel: Confirmed in soilGasoline: confirmed in soil3282 WestHighway 16Sadtler Property 595815 FINDS, CSCSL, Allsites, VCP,BrownfieldsThis facility is undergoing cleanup under Ecologyoversight.Arsenic: Confirmed in groundwater,suspected in soilPriority pollutant metals: Confirmed ingroundwater, suspected in soilUnspecified petroleum products:Confirmed in groundwater, suspectedin soilPAHs: Suspected in soil3805 StateHighway 3WestNavy CityMetals2633 SWRCY, RCRA NonGen,FINDS, ICR, Allsites, CSCSLNFA, SWF/LF, Spills,Institutional Control, VCP,This facility received an NFA designation by Ecologythrough the Voluntary Cleanup Program in 1999.However, a petroleum spill of unspecified volume tookplace at the facility in 2008. Institutional controls existat this facility including maintenance requirements,NA<strong>Draft</strong> | June 2013 3-91
GORST PLANNED ACTION EIS | AFFECTED ENVIRONMENT, SIGNIFICANT IMPACTS, AND MITIGATION MEASURESLocation/Address3976 West SR163140 West SR164275 SR 3SouthwestBusinessNameSiteIdentifierData Source and Findings Summary Contaminants of Concern(Identified by Ecology)NPDESproperty use restrictions, and land use restrictions.Stutz Fuel Oil 4264138 UST, LUST This facility reportedly had a release from a UST whichis awaiting cleanup. An end date for the UST programwas listed for 2008.Valley Produce NA Brownfields, FINDS Additional information regarding this brownfields listingwas not available. The media affected are reported asunknown.Bremerton AutoWreckingLandfill/<strong>Gorst</strong>CreekLandfill/PioneerLandfill62752314/97682663FINDS, CSCSL, HSL, Allsites,NPDES, Brownfields, VCPReleases from a former auto wrecking landfill havemigrated offsite. Independent remedial action iscurrently underway at this facility. This facility isdiscussed further in the main text.Diesel: Confirmed in groundwaterPetroleum-other: Confirmed ingroundwaterPetroleum products-unspecified:Confirmed in soilNAArsenic: Confirmed in groundwater,below cleanup levels in soilInorganic conventional contaminants:Confirmed in groundwater, suspectedin soilOrganic conventional contaminants:Suspected in soil and surface waterHalogenated organics: Suspected insoil, groundwater, and surface waterLead: Confirmed in groundwaterMercury: Confirmed in groundwaterOther metals: Suspected in soil,groundwater, and surface waterPriority pollutant metals: Confirmed insoil and groundwater, suspected insurface waterNon-halogenated solvents: Suspectedin soil, groundwater, and surface waterUnspecified petroleum products:Confirmed in soil, groundwater, andsurface waterDiesel: Confirmed in groundwater,below cleanup levels in soilOther petroleum products: Belowcleanup levels<strong>Draft</strong> | June 2013 3-92
GORST PLANNED ACTION EIS | AFFECTED ENVIRONMENT, SIGNIFICANT IMPACTS, AND MITIGATION MEASURESLocation/AddressBusinessNameSiteIdentifierData Source and Findings Summary Contaminants of Concern(Identified by Ecology)Polycyclic aromatic hydrocarbons:Confirmed in soil, suspected ingroundwater and surface waterBase/neutral/acid organics: Suspectedin soilUnspecified pesticides: Suspected ingroundwater and surface waterPCBs: Suspected in soil, groundwaterand surface waterPAHs: Confirmed in groundwater andsoilCSCSL = Confirmed and Suspected Contaminated Sites List; CSCSL NFA = CSCSL No Further <strong>Action</strong>; FINDS = Facility Index System; HSL = Hazardous Sites List; ICR = Independent CleanupReport; LUST = Leaking Underground Storage Tank; NPDES = National Pollution Discharge Elimination System; RCRA NonGen = Resource Conservation and Recovery Act Non-Generator; SWF/LF = Solid Waste/Landfill; SWRCY = Solid Waste and Recycling; UST = Underground Storage Tank; VCP = Voluntary Cleanup ProgramNA = Not Available/Not ApplicableSource: Ecology Inc. 2013<strong>Draft</strong> | June 2013 3-93
GORST PLANNED ACTION EIS | AFFECTED ENVIRONMENT, SIGNIFICANT IMPACTS, AND MITIGATION MEASURES<strong>Impact</strong>sIMPACTS COMMON TO ALL ALTERNATIVESWatershedUnder all alternatives, development and redevelopment would occur within portions of the <strong>Gorst</strong> CreekWatershed. Based on the online search of databases, the only contaminated sites of concern in the watershed thatare outside the UGA are located in the southern half of the watershed, near the <strong>Gorst</strong> and SKIA UGAs. These threesites are currently releasing hazardous materials to the environment, as described under the Affected Environmentsection, although it is assumed that some level of cleanup of these sites would occur in the future under all of thealternatives. Redevelopment of these sites would likely include construction activities that could disturbcontaminated areas, exposing workers, soil, groundwater, and/or surface water to hazardous materials.Additionally, construction activities elsewhere in the watershed could expose new contamination not previouslydocumented, which would provide opportunities for remediation. It is expected that most likely areas toencounter contamination would be at industrial sites. Hazardous materials are not expected to be a concern inundeveloped and rural portions of the watershed, where most development would be residential.Demolition of existing structures under any of the alternatives could be associated with risks to workers fromexposure to lead-based paint and/or ACMs. However, implementation of proper techniques for removing thesehazardous materials should minimize the risks. As all new structures would be constructed without the use ofthese materials, there would be a benefit to the public over the long term as buildings that contain these materialsare taken down.A variety of hazardous materials would be used and stored at construction sites, such as fuel, cleaning solvents,and paint. Improper storage or handling of these materials could result in a release of these chemicals to the soil,groundwater, or surface water. However with proper spill plans in place and followed, these risks should beminimized.<strong>Gorst</strong> UGAUnder all alternatives, redevelopment of the <strong>Gorst</strong> UGA would be allowed, based on the zoned land uses. Asdiscussed in the Affected Environment section, one Reasonably Predictable and seven Substantially ContaminatedSites have been identified within the <strong>Gorst</strong> UGA. Many of these sites are currently undergoing cleanup or remedialactions, and it is likely that cleanup actions would continue into the future under all of the alternatives. However,since many sites in the UGA are currently documented as storing hazardous substances or waste, it is likely thatadditional contaminated sites will be discovered in the future.As discussed for the watershed, there would be risks associated with exposures or releases of hazardous materialsduring redevelopment activities, including disturbance of contaminated soil, demolition of buildings with leadbasedpaint or ACMs, and use/storage of hazardous materials at construction sites. Given the number ofcontaminated sites in the UGA and the amount of likely redevelopment in the future under all of the alternatives,the greatest amount of risk associated with hazardous materials would be in the UGA.Alternative 1Under this alternative, current land use designations would remain. Non-residential land uses (high intensitycommercial, mineral resource, and industrial) would make up 87 percent of the land area in the UGA. These landuses are typically associated with a higher risk of contamination than residential uses. Additionally, many of theexisting industrial facilities would likely remain operational, or would eventually be replaced by other industrialfacilities. The potential for contamination of soil and water from land uses would likely be greatest under this landuse breakdown, as compared to the action alternatives. Redevelopment of industrial or commercial properties toresidential uses would also have an associated risk of human exposure to contaminants, particularly for siteswhere soil and groundwater contamination is not previously known.<strong>Draft</strong> | June 2013 3-94
GORST PLANNED ACTION EIS | AFFECTED ENVIRONMENT, SIGNIFICANT IMPACTS, AND MITIGATION MEASURESThe Watershed Characterization & Framework Plan and <strong>Gorst</strong> Subarea Plan would not be implemented under thisalternative. Stormwater improvements and new LID regulations identified under the plan would not beimplemented as part of the action. Issues with stormwater, which are discussed in Sections 3.2 Water Resourcesand 3.13.3 Water, Wastewater, and Stormwater, include flooding onto developed sites which can cause themovement of hazardous materials into surface waters and downstream areas. Of particular concern is theBremerton Auto Wrecking Landfill, at which there is documentation of movement of contaminated, eroded wastedownstream in the stream sediments as a result of flooding. While it is possible that this problem will be addressedin current remedial actions, there is no set timeline for resolution of these issues, and they would be expected tocontinue until such a resolution has occurred. Under this alternative there would be no WatershedCharacterization & Framework Plan and <strong>Gorst</strong> Subarea Plan in place for reducing flooding and directing andinfiltrating stormwater. Therefore, it is likely that flooding would continue to be a problem throughout thewatershed and hazardous materials would continue to be transported downstream in surface water under thisalternative.Alternative 2Under this alternative, the land use breakdown within the UGA would not include an industrial component.Approximately 46 percent of the UGA would be Commercial Corridor, and the remainder would be Low andMedium Density Residential and Open Space/Recreation. Therefore, land uses typically associated with a high riskof contamination would be much less prevalent than under Alternative 1. Additionally, the Industrial land usezoning would no longer be present. However, existing industrial facilities may continue to operate for many yearsbefore they are redeveloped into a different use. Additionally, hazardous material contamination associated withthese sites would continue to be present, subject to ongoing and future cleanup/remediation activities. Futuredevelopment in the UGA, however, would likely consist of land uses that are less likely to store hazardoussubstances or waste, and therefore less likely to cause future environmental contamination or human exposure tothese hazardous materials. The potential for contamination of soil and water from future land uses would be lowerunder Alternative 2 than under Alternative 1.The Bremerton Auto Wrecking Landfill would continue to be a site of concern under this alternative, as thecontaminated waste would continue to be present and subject to movement offsite and into surface water duringflooding events, until such time as the site is remediated. However, the Watershed Characterization & FrameworkPlan and <strong>Gorst</strong> Subarea Plan would be implemented under this alternative, which would help reduce flooding andimprove stormwater infiltration throughout the watershed and particularly the UGA, and would help preventfuture exacerbation of these issues by guiding future development throughout the watershed. <strong>Planned</strong>improvements to stormwater facilities, such as modifying culverts or providing means of diverting stormwaterflows, would be likely to lessen flooding onto developed sites and associated movement of contaminants insurface water. Since new developments would be required to infiltrate stormwater, it is likely that over timeflooding would be reduced, which would also lessen these impacts.Alternative 3Under Alternative 3, the land use breakdown would not include industrial components. Approximately 26 percentof the UGA would be zoned as Open Space/Recreation, Low Intensity Waterfront, or residential. Future land usesin these areas would be expected to have a fairly low associated risk of contamination with hazardous materials.The remainder of the UGA would be zoned as <strong>Gorst</strong> Mixed Use or Neighborhood Mixed Use. Commercialdevelopment would be more diffuse throughout the UGA than under the other alternatives. Similar to Alternative2, the Industrial land use zoning would no longer be present, although existing industrial facilities may continue tooperate for many years before they are redeveloped. Hazardous material contamination and risk forcontamination associated with these sites would continue to be present, subject to remediation/cleanup activities.Overall, the potential for contamination of soil and water from future land uses would likely be lowest under thisalternative.<strong>Draft</strong> | June 2013 3-95
GORST PLANNED ACTION EIS | AFFECTED ENVIRONMENT, SIGNIFICANT IMPACTS, AND MITIGATION MEASURESIssues associated with movement of hazardous materials in stormwater from existing sites would be similar tothose under Alternative 2. Bremerton Auto Wrecking Landfill would continue to be a site of particular concern,with contaminated waste carried offsite during flooding events. Implementation of the WatershedCharacterization & Framework Plan and <strong>Gorst</strong> Subarea Plan would help address flooding and stormwaterinfiltration issues throughout the watershed, which would help minimize the amount of flooding onto developedareas and associated movement of hazardous materials in surface water.Mitigation MeasuresIncorporated Plan FeaturesThe Watershed Characterization & Framework Plan and <strong>Gorst</strong> Subarea Plan do not contain features that arespecific to hazardous materials. However, features of both plans would have the indirect benefit of reducing risksof exposure to hazardous materials over the long term. Regardless of the land use alternative selected, the <strong>Gorst</strong>UGA would no longer have the urban industrial designation, meaning that new developments would have a lowerpotential for releases of hazardous materials than some current land uses.Features of the Watershed Characterization & Framework Plan and <strong>Gorst</strong> Subarea Plan that would minimizeflooding and increase infiltration of stormwater would help reduce risks of surface water contamination byreducing the likelihood that flood water or stormwater would run onto contaminated sites such as the BremertonAuto Wrecking Landfill. These stormwater features are discussed in detail in Section 3.2 Water Resources.Applicable Regulations and CommitmentsFederal hazardous material and waste laws and regulations would be applicable to hazardous substances used,stored, or generated by the project. Applicable federal laws include the RCRA; Hazardous and Solid WasteAmendments; CERCLA (aka Superfund); and Superfund Amendments and Reauthorization Act. Pursuant toregulations promulgated under Section 102 of CERCLA, as amended, release of a reportable quantity of ahazardous substance to the environment in a 24-hour period must be reported to the National Response Center(40 CFR Part 302). Similarly, Washington hazardous material and waste laws and regulations would be applicableto hazardous substances used, stored, and generated by the project. The Model Toxics Control Act (mobilesource air toxics) requires reporting of a release of any hazardous substance within 90 days of the release (orwithin 24 hours for releases from a UST; WAC 173-340-300). Cleanup activities at contaminated sites areconducted under the MTCA and disposal of contaminated materials are conducted under the RCRA.Demolition of older facilities may require asbestos and lead-based paint mitigation. Under the WashingtonDepartment of Safety and Health asbestos standards (WAC 296-62, 296-65, and 296-155), thermal systeminsulation (pipe lagging, boiler insulation, etc.), surfacing materials (spray-on acoustical plasters, troweled onplaster coatings, etc.) and flooring materials (vinyl tile, sheet goods, etc.) are all presumed to contain asbestos inbuildings built before 1981 unless these materials are shown not to contain asbestos by a certified contractor.Demolition of asbestos in the project area is regulated by the Puget Sound Clean Air Agency (Article 4: AsbestosControl Standards) and requires an asbestos survey, a notification of demolition, verification that all asbestos wasproperly removed, and proper disposal of the asbestos-containing materials.The Washington State Department of Commerce (Chapter 365-230 WAC) regulates certification, accreditation,enforcement and compliance for firms and individuals to use lead-safe work practices when working on pre-1978homes or child-occupied facilities. The regulations apply to training and certification requirements for individualsand firms and to accreditation requirements for training programs.Other Potential Mitigation MeasuresThe following general mitigation measures would minimize or eliminate construction impacts within the StudyArea and could be incorporated into the <strong>Planned</strong> <strong>Action</strong> Ordinance.<strong>Draft</strong> | June 2013 3-96
GORST PLANNED ACTION EIS | AFFECTED ENVIRONMENT, SIGNIFICANT IMPACTS, AND MITIGATION MEASURES• Since encountering unreported spills or unreported underground fuel tanks is a risk when performingconstruction, require contractors to provide hazardous materials awareness training to all grading andexcavation crews on how to identify any suspected contaminated soil or groundwater, and how to alertsupervisors in the event of suspected contaminated material. Signs of potential contaminated soil includestained soil, odors, oily sheen, or the presence of debris.• Require contractors to implement a contingency plan to identify, segregate, and dispose of hazardous waste infull accordance with the MTCA.• Require contractors to develop and implement the Stormwater Pollution Prevention Plan, BMPs, and otherpermit conditions to minimize the potential for a release of hazardous materials to soil, groundwater, orsurface water during construction.• Require contractors to follow careful construction practices to protect against hazardous materials spills fromroutine equipment operation during construction; prepare and maintain a current spill prevention, control,and countermeasure plan, and have an individual on site designated as an emergency coordinator; andunderstand and use proper hazardous materials storage and handling procedures and emergency procedures,including proper spill notification and response requirements.• Require contractors to identify all ACM and lead-based paint in structures prior to demolition activities inaccordance with 24 CFR Part 35. If ACM or lead-based paint is identified, appropriately trained and licensedpersonnel would contain, remove, and properly dispose of the ACM and/or lead based paint materialaccording to federal and state regulations prior to demolition of the affected area.• If warranted, require contractors to conduct additional studies to locate undocumented USTs and fuel linesbefore construction of specific development projects (areas of concern include current and former commercialand residential structures) and will permanently decommission and properly remove USTs from project sitesbefore commencing general construction activities.The following general mitigation measure would minimize or eliminate operational impacts within the Study Areaand could be incorporated into the <strong>Planned</strong> <strong>Action</strong> Ordinance.• Require applicants for development on properties identified as having potential for contamination to conducta thorough site assessment. If contamination is discovered then require the applicant to comply with all stateand federal regulations for contaminated sites.Significant Unavoidable Adverse <strong>Impact</strong>sUnder all of the alternatives future redevelopment of contaminated sites would presumably occur, potentiallyresulting in the release of hazardous materials to soil, groundwater, and surface water, or exposure of workers andthe public to these materials. Most of these potential impacts would occur within the UGA, at industrial sites.Contaminants from existing sites within the study area could continue to be transported off of these sites as aresult of stormwater and flooding issues. Such movement of contaminants would continue to impact surfacewater, groundwater, and soil resources within the study area. These impacts would be greatest under Alternative1, and lower under Alternatives 2 and 3, which would address stormwater and flooding issues in the UGA as well aslimit future land clearing in areas of protection in the watershed. Contaminated sites would be avoided duringproject design when possible. Implementing the mitigation approaches described above would reduce adverseeffects on human health and the environment.<strong>Draft</strong> | June 2013 3-97
GORST PLANNED ACTION EIS | AFFECTED ENVIRONMENT, SIGNIFICANT IMPACTS, AND MITIGATION MEASURES3.7 Land Use PatternsThis section describes existing land uses and land use patterns within the <strong>Gorst</strong> UGA. The section also comparesthe three alternatives described in Section 2.5 Study Alternatives with respect to the land uses proposed andevaluates their potential impacts on land use patterns and land use compatibility. Where implementation of analternative would have significant adverse impacts, appropriate mitigation measures are identified.Affected EnvironmentWatershedExisting Land UseThe <strong>Gorst</strong> Creek watershed encompasses approximately 6,000 acres in southwestern Kitsap County, of which themajority is undeveloped or engaged in natural resource uses. Approximately 120 acres are developed forcommercial, industrial, or residential uses. Most of this development is concentrated near where the creek flowsinto Sinclair Inlet, within the <strong>Gorst</strong> UGA. Low to moderate-intensity development is also present in the southcentralportion of the watershed in the form of a residential subdivision and some associated commercial andindustrial development. Figure 3.7-1 <strong>Gorst</strong> Watershed Planning Area: Current Land Use shows existing land usethroughout the <strong>Gorst</strong> Creek Watershed.Comprehensive Plan Land Use and ZoningThe <strong>Gorst</strong> Creek Watershed covers portions of several local government jurisdictions, including the Cities ofBremerton and Port Orchard, unincorporated Kitsap County, and the <strong>Gorst</strong>, SKIA, and West Bremerton UGA’sassociated with the City of Bremerton. Comprehensive Plan Land Use designations and zoning throughout thewatershed are established by each of these local jurisdictions. Figure 3.7-2 <strong>Gorst</strong> Creek Watershed: Land Covershows the adopted land use designations for the <strong>Gorst</strong> Watershed vicinity. Land use designations in the watershedconsist primarily of CUL, Rural Residential, and Urban Reserve designations. Industrial designations are present inand around the SKIA UGA, located in the southwestern portion of the watershed, and isolated transportation andpublic facilities (railroad traversing north of SR 3 and airport in SKIA). Urban residential, commercial, and industrialdesignations are concentrated within the <strong>Gorst</strong> UGA and are described in greater detail below.<strong>Draft</strong> | June 2013 3-98
FIGURE 3.7-1 GORST WATERSHED PLANNING AREA: CURRENT LAND USEBremertonWestUGACity of Bremerton<strong>Gorst</strong> UGACity of BremertonULID6SKIA UGACity of Port OrchardLegendCurrent Land UseWatershed BoundaryWaterResidentialInstitutionalPublic FacilityUGA BoundaryStreamsCommercialIndustrialForestryCity LimitsRecreationalTransportation/UtilitiesUndevelopedDate: April 2013Source: Kitsap County, BERK0 0.5 1Miles
THIS PAGE INTENTIONALLY BLANK
FIGURE 3.7-2 GORST CREEK WATERSHED: LAND COVERUnion RiverBremertonWestUGAHeins CreekCity of Bremerton<strong>Gorst</strong> Creek<strong>Gorst</strong> UGACity of BremertonSKIA UGAParish CreekULID6Anderson CreekCity of Port OrchardBremerton NationalAirportCoulter CreekSquare CreekWatershed BoundaryLand CoverDeveloped, Medium IntensityMixed ForestUGA BoundaryOpen WaterDeveloped, High IntensityScrub/ShrubCity LimitsPerennial Ice, SnowBare rock, sandGrasslands, herbaceousWaterDeveloped, Open SpaceDeciduous ForestPastureStreamsDeveloped, Low IntensityEvergreen ForestCultivated CropsWetland (WDFW/NWI)Date: March 2013Source: Parametrix, Department of Ecology, Department of Fish & Wildlife, USGS, BERK0 0.5 1Miles
THIS PAGE INTENTIONALLY BLANK
GORST PLANNED ACTION EIS | AFFECTED ENVIRONMENT, SIGNIFICANT IMPACTS, AND MITIGATION MEASURES<strong>Gorst</strong> UGAExisting Land UseThe <strong>Gorst</strong> UGA contains approximately 335 gross acres, of which about 54 acres are public right-of-way. Industrialand residential uses account for the majority of land in the <strong>Gorst</strong> UGA. Industrial land (including mineralextraction) is concentrated north of Sherman Heights Road and along the Sinclair Inlet waterfront east of theSR 3/SR 16 interchange, though smaller areas of industrial development are present throughout the <strong>Gorst</strong> UGA.Residential uses are concentrated in the southwestern portion of the UGA, mostly in the area between WestBelfair Valley Road and SR 3. A concentration of residential uses is also present south of SR 16 along Feigley Road,and several residences are located adjacent to the existing mine along Sherman Heights Road. Commercial usesare generally located along the two state highways that pass through the UGA. Current land use in the <strong>Gorst</strong> UGAis summarized in Table 3.7-1 <strong>Gorst</strong> UGA Existing Land Use. Figure 3.7-3 Current Land Use - Percentages illustratesthe land area by percentage in a pie chart. Figure 3.7-2 <strong>Gorst</strong> Creek Watershed: Land Cover maps the current landuses by assessor code in the UGA as well as in the watershed for reference.Table 3.7-1<strong>Gorst</strong> UGA Existing Land UseLand Use Category Acres PercentCommercial 30.06 10.71%Industrial 115.63 41.19%Institutional 0.58 0.21%Public Facility 0.28 0.10%Residential 67.87 24.18%Transportation/Utilities 16.38 5.83%Undeveloped Land 49.91 17.78%TOTAL 280.70 100.00%Source: Kitsap County 2012; BERKFigure 3.7-3 Current Land Use – PercentagesSource: Kitsap County Assessor<strong>Draft</strong> | June 2013 3-103
GORST PLANNED ACTION EIS | AFFECTED ENVIRONMENT, SIGNIFICANT IMPACTS, AND MITIGATION MEASURESKitsap County Comprehensive Plan Land Use and ZoningThe Kitsap County Comprehensive Plan designates the <strong>Gorst</strong> UGA with a mix of commercial, mineral resource,industrial, and residential land use designations. The High Intensity Commercial Mixed Use designation makes upthe largest portion of the UGA (43 percent), followed by Mineral Resource (34 percent). The remainder of the UGAconsists of Low Density Residential (13 percent) and Industrial (10 percent) designations. The purpose and intentof these designations is described in the Kitsap County Comprehensive Plan as follows (Kitsap County 2012):• Urban High-Intensity Commercial Mixed Use: This designation primarily focuses on larger commercialcenters, including commercial uses that require large sites and draw customers at the community and regionalscale. Examples of commercial uses appropriate to this designation include, but are not limited to,superstores, department store, automotive parts and sales, home improvement stores, hotels and motels, andrestaurants. Mixed use developments incorporating residential units are also appropriate in this designation.Within the <strong>Gorst</strong> UGA, this land use designation is implemented by following zoning district:oHighway/Tourist Commercial (10-30 DU/Ac): This zone is intended to provide for those commercial usesthat require large sites. The zone also serves the shopping and service needs for large sections of thecounty and provides visitor services and accommodations travelers. (KCC 17.355.010.B)• Mineral Resources: The intent of the Mineral Resources designation is to protect sand, gravel, and rockdeposits identified as significant. Commercial-quality deposits should be recognized as non-renewableresources and managed accordingly. Within the <strong>Gorst</strong> UGA, this land use designation is implemented byfollowing zoning district:oIndustrial: This zone allows a wide range of industrial activities, including heavy industry such asfabrication, warehousing, processing of raw materials, bulk handling and storage, construction, and heavytransportation. This zone is intended to provide sites for activities that require processing, fabrication,storage, and wholesale trade. (KCC 17.370.010)• Urban Low-Density Residential: This designation focuses primarily on single-family dwellings but also mayinclude innovative types such as clustered housing. It also includes regulated environmentally critical areaswithin the UGAs and other areas identified for low-density urban development. Within the <strong>Gorst</strong> UGA, thisland use designation is implemented by following zoning districts:ooUrban Low Residential (5-9 DU/Ac): The intent of this zone is to recognize, maintain, and encourageurban low density residential areas by including a full range of urban services and facilities that areadequate at the time of development. This zone is also intended to create cost-efficient residential areasthat are capable of allowing the provision of community services in a more economical manner. (KCC17.330.010)Urban Restricted (1-5 DU/Ac): The Urban Restricted Zone is applied to areas within UGAs that have beenidentified with a significant concentration of environmentally critical areas or that are planned asgreenbelts, and therefore are appropriate for lower-density development. These areas may includesignificant salmon spawning streams, wetlands, or steep slopes. Actual development densities will bedetermined at the time of land use approval, following site-specific analysis and review of potentialimpacts to nearby critical areas. (KCC 17.325.010) Approximately 11.8 acres within the <strong>Gorst</strong> UGA arezoned Urban Restricted, located in a contiguous block adjacent to the south side of West Belfair ValleyRoad and the west side of West Sam Christopherson Avenue.• Urban Industrial: This designation includes both industrial and business uses, such as light manufacturing, hitech,warehousing, bio-tech, park-like business, four-year educational institutions, equipment and vehiclerepair, as well as heavy industrial activities and those requiring access to major transportation corridors.Within the <strong>Gorst</strong> UGA, this land use designation is implemented by following zoning district:<strong>Draft</strong> | June 2013 3-104
GORST PLANNED ACTION EIS | AFFECTED ENVIRONMENT, SIGNIFICANT IMPACTS, AND MITIGATION MEASURESoIndustrial: This zone allows a wide range of industrial activities, including heavy industry such asfabrication, warehousing, processing of raw materials, bulk handling and storage, construction, and heavytransportation. This zone is intended to provide sites for activities that require processing, fabrication,storage, and wholesale trade. (KCC 17.370.010)City of Bremerton Comprehensive Plan Land Use and ZoningWhile the <strong>Gorst</strong> UGA is planned to be annexed by the City of Bremerton at some point in the future, it is currentlyan unincorporated part of Kitsap County. Through its Comprehensive Plan and development regulation docketprocess, the City of Bremerton has identified equivalent City of Bremerton zoning districts to the Kitsap Countyzoning currently in effect in the <strong>Gorst</strong> UGA, as illustrated in Table 3.7-2 Comparison of Kitsap County and CityZoning for the <strong>Gorst</strong> UGA.Note:Table 3.7-2Comparison of Kitsap County and City Zoning for the <strong>Gorst</strong> UGAKitsap County ZoningHighway/Tourist CommercialResidential Density: 10-30 du/acBuilding Height Max: 35 ftIndustrialBuilding Height: 35 ftUrban Low ResidentialResidential Density: 5-9 du/acMin Lot Size: 2,400 sq ftBuilding Height Max: 35 ftUrban RestrictedResidential Density: 1-5 du/acMin Lot Size: 5,800 sq ftBuilding Height Max: 35 ftThe City of Bremerton has no adopted zones that allow residential density below 5 units per acre. Landcurrently zoned as Urban Restricted will be rezoned when Bremerton annexes the <strong>Gorst</strong> UGA.Source: KCC 2012, BMC 2012Equivalent Bremerton ZoningFreeway CorridorNo residential allowedBuilding Height Max: 60 ftIndustrialBuilding Height: 50 ftLow Density ResidentialResidential Density: 5-10 du/acMin Lot Size: 4,300 sq ftBuilding Height Max: 35 ftNo City Equivalent*N/AN/AN/AThe purpose and intent of these equivalent zones are described in BMC Title 20:• Freeway Corridor (FC): The intent of the FC zone is to identify areas for commercial activities that will typicallybe region-serving in nature and scale. Uses in the zone benefit from high visibility from freeways serving theregion, incorporate signage legible to fast-moving traffic, provide large areas for parking, and may includelarge-scale structures and/or outdoor display or storage areas. Design standards, buffering and/or othertechniques are used to mitigate the effects of the intense uses allowed in the FC zone on less intense adjacentuses. (BMC 20.86.010)• Industrial: The intent of the industrial (I) zone is to accommodate light and heavy industrial uses in locationswhere there is limited interaction with residential uses. Uses include large-scale and/or heavy industries in amanner that reduces impact to the community while meeting industry’s needs for easy access, large sites, andlocations that do not cause conflicts with residential and other less intense use areas. (BMC 20.94.010)• Low Density Residential: The intent of the low density residential (R-10) zoning district is to accommodatesingle-family housing by infilling at a range of lot sizes consistent with urban growth patterns. Some attachedsingle-family housing may be appropriate when responding to sensitive areas or with innovative design.Residential development at higher densities is encouraged at the edge of designated centers. (BMC 20.60.010)<strong>Draft</strong> | June 2013 3-105
GORST PLANNED ACTION EIS | AFFECTED ENVIRONMENT, SIGNIFICANT IMPACTS, AND MITIGATION MEASURES<strong>Impact</strong>sThe impact discussion evaluates the amount and intensity of development under each of the alternatives, withspecific focus on potential changes in land use patterns and compatibility with adjacent land uses. Thedetermination of impacts to land use patterns was made based on a comparison of current and proposed land usedesignations under each of the alternatives and a comparison of the scale and intensity of current developmentwith that of development likely to occur under each alternative.IMPACTS COMMON TO ALL ALTERNATIVESWatershedOutside the <strong>Gorst</strong> UGA, no changes to land use designations or zoning are proposed for the <strong>Gorst</strong> Creek watershedunder any of the alternatives. The area is anticipated to add homes in the Rural Residential and Urban Reservedesignations as they are in place today. Within SKIA principally, more jobs are anticipated based on current plans.Because the City of Bremerton and Kitsap County plans and zones would be retained, including zoning anddevelopment standards addressing site design, landscaping, and other appropriate standards, no adverse impactsare anticipated with respect to land use patterns or compatibility.<strong>Gorst</strong> UGAUnder all alternatives, additional growth is anticipated in the <strong>Gorst</strong> UGA. Vacant land would, over time, bedeveloped for commercial, residential, recreational, or industrial use, as allowed by the land use and zoningdistricts adopted under that alternative, see Table 3.7-3 Land Use Acres Comparison (Total Parcel Acres by Zone).Table 3.7-3Land Use Acres Comparison (Total Parcel Acres by Zone)Alternative 1Zone Acres PercentHigh Intensity Commercial Mixed Use 121.9 43Mineral Resource 96.3 34Low Density Residential 35.3 13Industrial 27.2 10TOTAL 280.7 100Alternative 2Commercial Corridor 127.8 46Medium Density Residential 105.4 38Low Density Residential 31.6 11Open Space/Recreation 16.0 6TOTAL 280.7 100Alternative 3Neighborhood Mixed Use 105.4 38<strong>Gorst</strong> Mixed Use 103.3 37<strong>Gorst</strong> Creek Residential 31.6 11Low Intensity Waterfront 24.5 9Open Space/Recreation 16.0 6TOTAL 280.7 100Source: Kitsap County 2012; BERK<strong>Draft</strong> | June 2013 3-106
GORST PLANNED ACTION EIS | AFFECTED ENVIRONMENT, SIGNIFICANT IMPACTS, AND MITIGATION MEASURESProperties occupied by nonconforming uses (e.g. single family in Alternative 1 commercial zones) would eventuallybe redeveloped in a manner consistent with adopted zoning. The precise mix of land uses and intensity ofdevelopment would vary by alternative, as described in the following impact analysis sections.New development and redevelopment within the <strong>Gorst</strong> UGA would also entail the eventual modification ordemolition of some existing structures, as well as the construction of new buildings. These construction activitieswould have the potential to cause temporary impacts to neighboring properties during the period of activeconstruction. These temporary construction-related impacts would result from increased levels of noise, fugitivedust, and vehicle traffic. Dust is addressed in Section 3.3 Air Quality, noise impacts are analyzed in Section 3.5Noise, and traffic impacts are discussed in detail in Section 3.11 Transportation.Alternative 1Land Use PatternsUnder the No <strong>Action</strong> Alternative, the <strong>Gorst</strong> Watershed Plan would not be adopted, and a planned action would notbe adopted for the <strong>Gorst</strong> UGA. New stormwater regulations and LID standards would not be adopted in the <strong>Gorst</strong>Creek watershed, and existing comprehensive plan land use designations and zoning regulations for the <strong>Gorst</strong> UGAwould remain in effect. Land use patterns in the <strong>Gorst</strong> UGA are therefore anticipated to remain similar to existingconditions, though some residential parcels that are designated and zoned for commercial use may redevelop inthe future, thereby shifting the land use mix away from residential development and toward more commercialuses. (See Figure 2-4 <strong>Gorst</strong> UGA Land Use: Alternative 1 – Kitsap County No <strong>Action</strong> in Section 2.5 StudyAlternatives.) Undeveloped land within commercial zones would also be developed over time, extending this useto greater portions of land along highways and towards the current residential neighborhoods (e.g. West Belfair).Land Use CompatibilityUnder the No <strong>Action</strong> Alternative, existing comprehensive plan land use designations and zoning regulations wouldguide development in the <strong>Gorst</strong> UGA. The current development standards for building height, setbacks, andallowed uses would remain in effect. The overall low rise suburban character of development in the <strong>Gorst</strong> UGAwould remain similar to existing conditions, particularly along state highways. Because residential uses areprevalent in portions of the <strong>Gorst</strong> UGA zoned for commercial development, some localized incompatibilities mayoccur as infill development of vacant parcels and redevelopment of individual residential properties occurs.Localized incompatibilities may also occur surrounding the existing mine, where approximately 11 acres zoned forresidential use are located adjacent to industrial zoning.Alternative 2Land Use PatternsUnder Alternative 2 (<strong>Gorst</strong> is a well-designed regional commercial center), the <strong>Gorst</strong> Watershed Plan would beadopted, and new low-impact development and stormwater standards would be applied throughout thewatershed, though no significant changes to land use patterns are anticipated outside the <strong>Gorst</strong> UGA. Within the<strong>Gorst</strong> UGA, new land use designations and associated zoning would be applied as shown in Figure 2-6 <strong>Gorst</strong> UGALand Use: Alternative 2. Under Alternative 2, the land use pattern in the <strong>Gorst</strong> UGA would transition over time toinclude substantially less industrial property than currently exists in the area. The existing mine site, which is thelargest industrial property in the UGA, would be reclaimed and redeveloped for Medium-Density Residentialdevelopment, and the application of the Commercial Corridor designation to the central portion of the UGA wouldultimately result in the redevelopment of most of these industrial properties for commercial use. Though the areaswaterward of SR 3 and SR 16 along Sinclair Inlet would not be included in the planned action, new land usedesignations and zoning would take effect, causing the existing industrial uses in this portion of the UGA toeventually redevelop as commercial uses or open space as dictated by the subarea plan.<strong>Draft</strong> | June 2013 3-107
GORST PLANNED ACTION EIS | AFFECTED ENVIRONMENT, SIGNIFICANT IMPACTS, AND MITIGATION MEASURESLand Use CompatibilityAs described in Chapter 2.0 Alternatives, Alternative 2 would apply new land use designations to the <strong>Gorst</strong> UGA.Similar to the No <strong>Action</strong> Alternative, most of the central and southern portions of the UGA would be designated forcommercial development, as well as those parcels adjacent to SR 3 in the northeastern corner of the UGA. Asdescribed under the No <strong>Action</strong> Alternative, much of the central and southern portions of the <strong>Gorst</strong> UGA arecurrently occupied by residential development, despite the applied commercial zoning. Continued designation ofthese areas for commercial development could result in localized land use incompatibilities as the area transitions.These incompatibilities would primarily consist of commercial development located adjacent to previously existingresidences as infill development of vacant parcels, lot consolidation for commercial development, andredevelopment of individual residences occurred.In limited circumstances where existing residences are adjacent to an industrial use, redevelopment of theindustrial property for commercial use could potentially result in greater compatibility compared to currentconditions. New commercial development under Alternative 2 would include the application of landscaping,streetscape improvements, and design guidelines, thereby reducing incompatibilities with adjacent residentialuses. Transitions such as this are most likely to occur near the mine site once it is reclaimed and redeveloped forMedium Density Residential, as well as in the residential neighborhood south of SR 16.Alternative 3Land Use PatternsUnder Alternative 3, the <strong>Gorst</strong> Watershed Plan would be adopted, and new low-impact development andstormwater standards would be applied throughout the watershed, though no significant changes to land usepatterns are anticipated outside the <strong>Gorst</strong> UGA. Within the <strong>Gorst</strong> UGA, new land use designations and associatedzoning would be applied as shown in Figure 2-8 <strong>Gorst</strong> UGA Land Use: Alternative 3 in Section 2.5 StudyAlternatives. Under Alternative 3, the land use pattern in the <strong>Gorst</strong> UGA would shift toward a focus on mixed usesand a balance between residences, commercial development, recreation, and the natural environment.Alternative 3 would result in relatively subtle changes to the overall land use pattern of the <strong>Gorst</strong> UGA. Becausethe proposed land use designations would allow for a broader range of uses to be intermixed than is allowedunder current zoning, the <strong>Gorst</strong> UGA is unlikely to experience the large-scale conversion of residential propertiesto commercial use, which is anticipated under both Alternatives 1 and 2. Industrial properties in the central andsouthern portions of the UGA, however, are still anticipated to gradually convert to commercial, office, residential,or a mix of these uses in accordance with the proposed <strong>Gorst</strong> Mixed Use designation. Properties along the SinclairInlet waterfront would also be redeveloped over time, replacing industrial and high-intensity commercial uses withlower-intensity uses featuring reduced impervious cover and integrated shoreline habitat and recreation features.Similar to Alternative 2, the existing mine site in the northern portion of the UGA would be reclaimed andredeveloped. Under Alternative 3, this area would be converted to neighborhood-scale mixed use developmentfeaturing low and medium-density housing, as well as small commercial uses designed to serve local residences.Land Use CompatibilitySimilar to Alternatives 1 and 2, localized incompatibilities could potentially arise as the <strong>Gorst</strong> UGA transitions fromthe current land use pattern to the proposed land use designations. Commercial development occurring underAlternative 3 would be designed for a mixed-use environment with associated design guidelines, thereby reducingthe potential for incompatibilities with existing residential development or other sensitive uses. Similar toAlternative 2, existing incompatibilities could potentially be alleviated as industrial properties adjacent toresidences are redeveloped to more compatible uses, such as low-intensity commercial, office, or multi-familyresidential.<strong>Draft</strong> | June 2013 3-108
GORST PLANNED ACTION EIS | AFFECTED ENVIRONMENT, SIGNIFICANT IMPACTS, AND MITIGATION MEASURESMitigation MeasuresIncorporated Plan FeaturesAdoption of the Watershed Characterization & Framework Plan and the <strong>Gorst</strong> Subarea Plan are part of both actionalternatives. Adoption of these two plans would include the following:• Alternatives 2 and 3 would include implementation of new capital facility and urban design improvements,such as streetscape improvements and trails.• Alternatives 2 and 3 would include adoption of new policies promoting amended stormwater and habitatregulations throughout the <strong>Gorst</strong> Creek watershed.• Alternatives 2 and 3 would include policies and urban design concepts that would improve the landscape,streetscape, and site design of developments.• As described above, the land use designations proposed for Alternative 3 would guide development toward apredominantly horizontal or vertical mixed-use pattern. Associated development regulations and designguidelines in the subarea plan would ensure that incompatibilities between more intense uses and less intenseuses are minimized.Applicable Regulations and CommitmentsIn addition to the new stormwater regulations that would be applied to the <strong>Gorst</strong> Creek watershed and the designguidelines and development regulations that would be applied to the <strong>Gorst</strong> UGA, the following regulations andcommitments would help mitigate impacts regarding land use compatibility throughout the watershed study area.• KCC 17.382 – Density, Dimensions, and Design• KCC 17.385 – Landscaping• KCC Title 19 – CAOOther Potential Mitigation Measures• Adoption of implementing zoning and urban design regulations to fulfill <strong>Draft</strong> <strong>Gorst</strong> Subarea Plan policieswould help mitigate changes to land use patterns and compatibility. It is anticipated that such regulationswould be prepared with a Preferred Alternative.Significant Unavoidable Adverse <strong>Impact</strong>sUnder all alternatives, the <strong>Gorst</strong> Creek watershed in general, and the <strong>Gorst</strong> UGA in particular, would experienceadditional growth in population and employment. Vacant land in the <strong>Gorst</strong> UGA is anticipated to be developed,and some existing properties would redevelop over time. While the overall land use pattern in the area would beirreversibly changed, anticipated impacts can be mitigated with design and development standards as described inthe Mitigation Measures section above.<strong>Draft</strong> | June 2013 3-109
GORST PLANNED ACTION EIS | AFFECTED ENVIRONMENT, SIGNIFICANT IMPACTS, AND MITIGATION MEASURES3.8 Socio-economicsThis section provides a summary of 2010 population, housing, and employment for the <strong>Gorst</strong> Watershed and the<strong>Gorst</strong> UGA, trends for the last 10 years, and the studied growth for 2035. This section also evaluates the impacts ofadditional people and jobs in the three alternatives on the <strong>Gorst</strong> UGA. Lastly, the section identifies mitigationmeasures for any significantly adverse impacts.Affected EnvironmentWatershedThe <strong>Gorst</strong> Watershed covers multiple jurisdictions and does not align with U.S. Census geographies. To estimatepopulation, housing, and employment for this geography, the analysis used Kitsap County Transportation AnalysisZones (TAZs) that overlapped with the watershed to approximate the watershed boundaries. These TAZs werethen used determine the total and projected figures for areas in the watershed excluding the <strong>Gorst</strong> UGA, whichwas separately calculated by Census block groups. Figures for the entire watershed sum the select TAZs’ totals withthe totals for the <strong>Gorst</strong> UGA.Population and HousingIn the 2010, the entire watershed had an estimated total population of 2,032. By 2035 the population is projectedto increase to 2,886, an average annual growth rate of 1.4 percent. In comparison, from 2003 4 to 2010 thepopulation grew at an average annual rate of 1.1 percent.The majority of the watershed’s population is outside of the <strong>Gorst</strong> UGA. Excluding the <strong>Gorst</strong> UGA, the watershedhad a population 1,810 in 2010 with a projected population of 2,659 by 2035. This population increase representsan average annual rate of 1.5 percent. The 2003 population was 1,661 and grew at an average rate of 1.2 percentannually.The watershed excluding the <strong>Gorst</strong> UGA had 742 housing units in 2010. The vast majority, 83 percent, ofhouseholds were single-family homes. By 2035 under current Kitsap County and City of Bremerton plans thewatershed is projected to have 1,149 housing units with 93 percent being single-family homes. All the projectednew housing is anticipated to consist of single-family homes. This increase represents an average of over 15 homesadded each year. Multi-family housing is projected to decrease slightly by 17 units.From 2001 to 2011 there were 63 residential building permits issued within the watershed outside of the <strong>Gorst</strong>UGA. All the permits issued were for single-family houses or mobile homes. See Table 3.8-1 PSRC ResidentialPermits in Watershed (Excluding <strong>Gorst</strong> UGA).Table 3.8-1PSRC Residential Permits in Watershed (Excluding <strong>Gorst</strong> UGA)Sector 2001 2002 2003 2004 2005 2006 2007 2008 2009 TotalSingle-Family 1 5 4 6 7 1 4 3 2 33Multi-Family 0 0 0 0 0 0 0 0 0 0Manufacturedhome 10 6 1 0 5 2 3 2 0 29Total 11 11 5 6 12 3 7 5 2 63Source: PSRC, 20094 Population and household figures are available by transportation analysis zone for the years 2003, 2010, and2035.<strong>Draft</strong> | June 2013 3-110
GORST PLANNED ACTION EIS | AFFECTED ENVIRONMENT, SIGNIFICANT IMPACTS, AND MITIGATION MEASURESThe area averaged over 7 permits per year over this 9-year period, about half the rate projected from 2010 to2035. The majority of the permits were issued between 2001 and 2005, and the number tapered with toward theend of the decade with the recession, which started in 2008. The population and housing growth studied in this<strong>Draft</strong> EIS, whether considering current plans or projected plans, is more than the watershed experienced duringthe housing boom period before 2008.EmploymentIn 2010, there were 551 jobs within the watershed. Less than half (264) were in the area of the watershedexcluding the <strong>Gorst</strong> UGA. Employment present represents a variety of sectors. The government and education andfinance, insurance, and real estate (FIRE) sectors had the largest share of total employment in 2010 with about onethird of the total for each sector. Table 3.8-2 Employment by Sector in Watershed (Excluding <strong>Gorst</strong> UGA)belowshows the breakdown of total employment by major sector for the watershed not in the <strong>Gorst</strong> UGA for 2010 andthe projected totals for 2035 based on current plans.Table 3.8-2Employment by Sector in Watershed (Excluding <strong>Gorst</strong> UGA)2010 2035 ChangeSector Employment Percent Employment Percent 2010-2035Government and Education 88 33.30 90 3.90 2Finance, Insurance, and Real Estate (FIRE) 78 29.50 1,157 50.20 1,079Construction and Resources 56 21.20 29 1.30 -27Warehouse, Transportation, and Utilities 18 6.80 32 1.40 14Manufacturing 15 5.70 918 39.80 903Retail 9 3.40 78 3.40 69Total 264 100.00 2,305 100.00 2,041Source: Kitsap County, 2012; BERK, 2012The watershed excluding the <strong>Gorst</strong> UGA is projected to add a significant number of jobs by 2035. The FIRE andmanufacturing sectors are projected to realize almost all of the 2,305 jobs. Much of the projected growth is withinparts of the SKIA and the City of Bremerton in the watershed.From 2001 to 2010, there was just one commercial building permit issued to the Sunnyslope Water District withinthe watershed area excluding the <strong>Gorst</strong> UGA. This indicates that the projected employment gains would be newdevelopment above and beyond any recent market trends.<strong>Gorst</strong> UGAPopulation and employment figures studied for the <strong>Gorst</strong> UGA are drawn from the Kitsap County UGA Sizing andComposition Remand Final Supplemental EIS and the current Kitsap County Comprehensive Plan (August 2012).Population and HousingIn 2010, the population of the <strong>Gorst</strong> UGA was 222 with 106 housing units, 83 percent of which are single-familyhomes. Future growth estimated in the Kitsap County Comprehensive Plan is 83 persons and 33 dwelling units, allsingle family, which would bring the totals to 304 persons and 139 dwellings. Based on residential building permitdata compiled by the PSRC, from 2001 to 2009 there was one residential building permit issued within the <strong>Gorst</strong>UGA for a mobile home in 2009. The permit data indicates that the current market for new housing in <strong>Gorst</strong> is notstrong. Kitsap County’s growth estimates in the current Comprehensive Plan would represent a stronger growththan experienced in permit trends, though the addition of 33 dwellings is a modest addition in itself.<strong>Draft</strong> | June 2013 3-111
GORST PLANNED ACTION EIS | AFFECTED ENVIRONMENT, SIGNIFICANT IMPACTS, AND MITIGATION MEASURESEmploymentThe <strong>Gorst</strong> UGA had a total of 237 jobs in 2010. The largest share of these was retail sector jobs with 103. Table3.8-3 2010 Employment by Sector in the <strong>Gorst</strong> UGA shows the breakdown of total employment by major sector forthe <strong>Gorst</strong> UGA for 2010, and Table 3.8-4 2035 Employment by Alternative in the <strong>Gorst</strong> UGA shows the breakdownof employment by commercial and industrial uses under the Kitsap County’s current plan for the year 2035.Table 3.8-32010 Employment by Sector in the <strong>Gorst</strong> UGASector Jobs PercentRetail 103 43.5Finance, Insurance, and Real Estate (FIRE) 49 20.7Construction and Resources 42 17.7Warehouse, Transportation, and Utilities (WTU) 25 10.5Manufacturing 14 5.9Government and Education 4 1.7Total 237 100.0Source: Kitsap County, 2012; BERK, 2012Table 3.8-42035 Employment by Alternative in the <strong>Gorst</strong> UGAAlternative 1Sector Jobs PercentCommercial 606 81.7Industrial 136 18.3Total 742 100.0Source: Kitsap County, 2012; BERK, 2012The <strong>Gorst</strong> UGA is projected to sizably increase the number of jobs within the UGA under current plans by 2035.From 2001 to 2010 there were seven commercial building permits issued within the UGA. Four of the sevenpermits issues were for the Peninsula Auto Group for their property on SR 16. The other three permits were forretail and general commercial establishments. The current Comprehensive Plan assumes employment growthsignificantly above what the UGA has experienced over the last decade.<strong>Impact</strong>sThis section evaluates potential impacts of the additional growth in population and employment within the <strong>Gorst</strong>Creek Watershed and the <strong>Gorst</strong> UGA. As a result of the expected growth, areas within the watershed would see anincrease in land development and economic activity. <strong>Impact</strong>s of the additional land development and activityinclude:• Conversion of open space, undeveloped land, and underutilized land, for new residential, commercial and/orindustrial uses• Increased need for infrastructure, public services, and amenities• Increase in the number of trip within and to and from the watershed• Change in character of the local business composition and economy<strong>Draft</strong> | June 2013 3-112
GORST PLANNED ACTION EIS | AFFECTED ENVIRONMENT, SIGNIFICANT IMPACTS, AND MITIGATION MEASURESOther sections of this <strong>Draft</strong> EIS address the first three impacts listed more specifically. Sections 3.12 Public Servicesand 3.13 Utilities address impacts on public services and utilities in more detail, respectively. Section 3.7 Land UsePatterns addresses land use impacts and the conversion of land, and Section 3.11 Transportation discusses trafficand transportation impacts. The following section, discusses potential impacts to the local economy in more detail.IMPACTS COMMON TO ALL ALTERNATIVESThe current character of the local economy in <strong>Gorst</strong> is a mix of small to medium scale auto-oriented businessesserving a larger geographic area as well as pass through traffic on SR 3 and SR 16. These types of businesses oftenneed large amount of land area, for parking and easy access, with relatively inexpensive rent. The resultingcharacter is low scale buildings on large lots of land, what one currently sees in <strong>Gorst</strong>. The small population base inthe <strong>Gorst</strong> UGA, just 222 in 2010, makes it difficult for the local economy to support smaller scale local serving retailand commercial service businesses.The increase in people living, working, and passing through in the watershed is anticipated to increase the demandfor retail and commercial services in the UGA. The increase in demand for housing and commercial uses will likelymake land more valuable as businesses are able to be more productive and serve larger and/or new markets. As aresult, the types of businesses located in <strong>Gorst</strong> could also change over time, especially if land owners are able toget higher rents for their land. The types of businesses currently there and those that are able and willing to payhigher rents in the future may be different, leading to a change in businesses located in the UGA.All of the alternatives studied anticipate an increase in some mix of residents and jobs within the UGA by 2035. Asa result, changes in the character of the local economy, as discussed above, could take place. <strong>Impact</strong>s of thesechanges could include the displacement of existing businesses and the establishment new businesses. Additionalimpacts from the increase in economic activity could include higher tax revenues for local jurisdictions, especiallyfrom retail sales taxes, business and occupation taxes, and utility taxes.WatershedOutside the <strong>Gorst</strong> UGA, it is not expected there will be any differences for the <strong>Gorst</strong> Creek Watershed in terms ofpopulation and employment growth between the alternatives. Population growth will most likely occur on rurallots in the areas designated Rural Residential and Urban Reserve in the southern part of the watershed. Bothdesignations limit development to relatively low densities. Rural Residential allows one dwelling unit per five acresand Urban Reserve allows one unit per 10 acres. Commercial and employment growth will most likely occur withinparts of SKIA and Bremerton in the watershed. <strong>Impact</strong>s from the large increase in jobs in SKIA are addressed in theSKIA Subarea Plan and EIS.<strong>Gorst</strong> UGAUnder all alternatives, additional growth is anticipated in the <strong>Gorst</strong> UGA. The number and composition of peopleand housing varies considerably by alternative, however. Table 3.8-5 2035 Net New Population and Housing UnitCapacity by Alternative in the <strong>Gorst</strong> UGA lists the population and housing unit mix for each alternative.Table 3.8-52035 Net New Population and Housing Unit Capacity by Alternative in the <strong>Gorst</strong> UGASector Alternative 1 Alternative 2 Alternative 3Population 304 1,207 1,304Housing Units 139 644 703Single-Family 121 113 98Multi-Family 18 531 605Source: Kitsap County, 2012; BERK, 2012<strong>Draft</strong> | June 2013 3-113
GORST PLANNED ACTION EIS | AFFECTED ENVIRONMENT, SIGNIFICANT IMPACTS, AND MITIGATION MEASURESThe growth in Alternatives 2 and 3 would diverge from past trends in the UGA based on the development of themine site. Alternative 2 and Alternative 3 have sizable population growth, with much of the growth occurring asmore dense housing, primarily townhomes style, at the mine site in the northwest portion of the UGA. Alternative1 would have much less population and housing growth. The little growth that does occur is all in lower densitysingle-family homes.The <strong>Gorst</strong> UGA is projected to sizably increase the number of jobs by 2035 within the UGA for all alternatives,particularly Alternative 1 and Alternative 2 in Table 3.8-6 2035 Net New Employment by Alternative in the <strong>Gorst</strong>UGA. Alternative 3 would also see an increase in employment, but much less than in the other two alternatives.The vast majority of the new employment for all the alternatives will be in commercial uses, such as retail andcommercial services. Industrial employ would have a sizable increase in Alternative 1 and stay the relatively thesame under Alternatives 2 and 3 as it is today.Table 3.8-62035 Net New Employment by Alternative in the <strong>Gorst</strong> UGAAlternative 1 Alternative 2 Alternative 3Sector Jobs Percent Jobs Percent Jobs PercentCommercial 606 81.7 573 94.6 315 94.6Industrial 136 18.3 33 5.4 18 5.4Total 742 100.0 606 100.0 333 100.0Source: Kitsap County, 2012; BERK, 2012Alternative 1The growth assumed in Alternative 1 (No <strong>Action</strong>, <strong>Gorst</strong> is a relatively small highway-oriented commercial andindustrial center) is mostly employment growth for commercial uses with a small population increase. Alternative1 also assumes the current comprehensive plan land use designations and zoning regulations stay in effect. Thelimited residential growth and lack of change in land use regulations make it likely that any change in the localeconomy will be a continuation of the current character with some larger scale and/or more intense commercialuses that cater to the regional market and pass through traffic.The additional employees in the community during the day would spur demand for some retail establishments,such as lunch and coffee spots.Alternative 2Alternative 2 (<strong>Gorst</strong> is a well-designed regional commercial center) has a substantial increase in population andmoderate employment growth. Land use and zoning changes in this alternative allow Medium-Density Residentialdevelopment on the mine site in the northwest portion of the UGA and more commercial development on areascurrently designated for industrial uses. Most of the population and housing growth is accommodated by theredevelopment of the mine site. Larger and more intense commercial and retail uses could be developed along SR3 and SR 16.The additional residential growth and ability for larger scale commercial uses could lead to the establishment ofnew businesses and change of current businesses to larger scale ones. The addition of almost 1,000 residentswould likely increase the demand for small scale retail uses, especially convenience items and food services. Largerretail establishments, such as a grocery store or department store, need to be supported by a larger populationbase. The proximity to Bremerton and Port Orchard and the amount of pass by traffic may allow <strong>Gorst</strong> to supportthese types of businesses. Traffic congestion and highway access would likely be key factors in whether this scaleof auto-oriented businesses materializes.<strong>Draft</strong> | June 2013 3-114
GORST PLANNED ACTION EIS | AFFECTED ENVIRONMENT, SIGNIFICANT IMPACTS, AND MITIGATION MEASURESThe additional residents and employees in <strong>Gorst</strong> would increase the need for infrastructure, open space, andamenities, especially at the mine site. To make the mine site an attractive location for significant residentialdevelopment the site would benefit from attractive community design, access to more park and recreationfacilities, and taking advantage of scenic views for those who would live there.These changes would likely change the character of the local economy by adding some smaller scale businessesthat support the new residents as well as the potential for larger scale and/or more intensive businesses, whichcould displace some of the existing businesses and uses with highway access.Alternative 3Alternative 3 (<strong>Gorst</strong> becomes a complete community) assumes the most population growth, and the smallestamount of employment growth. This alternative would change the land use designations and zoning to allow amixture uses not currently allowed. Along the waterfront a lower intensity commercial land use pattern developswith smaller impervious footprints interspersed by trails, parks, and reclaimed shoreline habitat. Central <strong>Gorst</strong>allows more intensive regional commercial, office, hotel, and mixed use residential developments. Highwayorienteduses would be less likely, especially along the Sinclair Inlet waterfront because of the zoning changes.Most of the population and housing growth is accommodated by the redevelopment of the mine site, which wouldalso allow small scale retail uses on the site to serve the local population.The additional residential growth, the allowance of more types and intensity of commercial uses throughout theUGA, and better access to open space and recreational facilities could make area more attractive for more types ofcommercial uses. This may lead to the establishment of new businesses and business types that do not currentlyexist in the area. The addition of almost 1,100 residents would likely increase the demand for small scale retailuses, especially convenience items and food services. In addition, better access to opens space and recreation, abetter connection to the waterfront, and the associated view add value to these sites, which make them moreattractive certain commercial and recreational uses. The broader range of uses allowed may also attract businessesthat currently cannot locate in the community, but the accessibility the area has to south Kitsap County. As aresult, these businesses would likely be willing to pay more in rent to be located by them then many of the currentbusinesses, which could lead to the redevelopment of sites overtime with higher value and more intense uses. Theflexibility in the zoning would also allow residential uses, which also value the added amenities and regionalaccess.Under this situation the character of the local economy has the potential to be quite different from what it istoday. The land use and zoning changes allow the potential for more mixture of residential and commercial usesadjacent to each other. The community may have more small scale businesses that support the new residents. Inaddition, the potential for more uses may attract new business types, especially those that value the additionalamenities of the area and/or regional access it provides. The amenity-oriented businesses would be lessdependent of pass by traffic and likely less highway-oriented that many of the currently businesses. Thosebusinesses that value the accessibility, such as a hotel/motel or an office building, would still be auto-oriented innature. However, these businesses would add to the mix and character of businesses currently in the UGA.Mitigation MeasuresIncorporated Plan FeaturesUnder Alternative 2 and Alternative 3, Watershed Characterization & Framework Plan and the <strong>Gorst</strong> Subarea Planwould be adopted. The adoption of these plans includes specific features that help mitigate for the impact ofadditional people and economic activity within the watershed. Features of the plans include:• Implementation of new capital facility improvements and urban design improvements.• Adoption of amended stormwater and habitat regulations throughout the <strong>Gorst</strong> Creek watershed.<strong>Draft</strong> | June 2013 3-115
GORST PLANNED ACTION EIS | AFFECTED ENVIRONMENT, SIGNIFICANT IMPACTS, AND MITIGATION MEASURES• The creation of new land use designations, development regulations and design guidelines in Alternative 3 tominimized impacts of development, especially in environmentally sensitive areas.Applicable Regulations and CommitmentsIn addition to the incorporated plan features, the following regulations and commitments would help mitigateimpacts of additional people, activity, and development within the watershed and UGA. Below are listed keysections of Kitsap County’s code and Comprehensive Plan.• KCC 17.382 – Density, Dimensions, and Design• KCC 17.385 – Landscaping• KCC Title 19 – CAO• Kitsap County Capital Facility Plan, an appendix to the Comprehensive PlanCorollary chapters of the BMC and Comprehensive Plan include:• BMC Title 20, Division III. Zoning, with development standards in each zone as well as general and specificstandards for particular uses• Chapter 20.50, Landscaping• BMC Chapter 20.14, Critical Areas• Bremerton City Services Element of Comprehensive PlanOther Potential Mitigation MeasuresNone.Significant Unavoidable Adverse <strong>Impact</strong>sPopulation, employment and housing will increase under any of the alternatives reviewed, to different degrees.Alternative 2 and Alternative 3 have the most growth in population and Alternatives 1 and 2 the most growth inemployment. Additional growth in any of the scenarios will increase the demand for the development of housingand commercial uses. The additional growth will also result in secondary impacts on the natural and builtenvironment and to the demand for utilities and public services, which is addressed in the appropriate sections ofthis <strong>Draft</strong> EIS. Regarding the character of the local economy, there are no potential significantly adverse impactsare identified from the anticipated growth in population and employment.<strong>Draft</strong> | June 2013 3-116
GORST PLANNED ACTION EIS | AFFECTED ENVIRONMENT, SIGNIFICANT IMPACTS, AND MITIGATION MEASURES3.9 AestheticsThis section discusses the existing aesthetic character of the study area and the aesthetic impacts associated withthe three alternatives. The aesthetic character of the study area is described in terms of the overall visualcharacter, building height, bulk, and scale, and views.Affected EnvironmentThe aesthetic character of the study area comprises a wide range visual characteristics and distinct physicalenvironments. The <strong>Gorst</strong> watershed is largely undeveloped and rural in character, while the <strong>Gorst</strong> UGA contains amix of more developed, urban, and highway oriented uses.The identity of the subject area is strongly influenced by its aesthetic qualities, both positive and negative.Comments received during the course of the public process, including those gathered during the SWOT analysis(see Section 2 Alternatives), indicate that strong opinions exist regarding the aesthetic quality of the study area.<strong>Impact</strong>s to aesthetics, whether maintaining positive attributes or remedying undesirable conditions, is a highpriority issue for area stakeholders.Positive aesthetic qualities noted during the public process include:• Waterfront aesthetic, which is attractive to development• Views of the water and Olympic mountains• Natural beauty of forested areas, streams, and wildlifeNegative aesthetic qualities noted, include:• Unattractive, poorly maintained buildings• “Seedy” highway commercial businesses• “Junky” properties• Haphazard development• No sense of place• Litter, especially on the beach• Traffic congestionSuch comments, in combination with observations of existing physical characteristics, provide a baseline forevaluating aesthetic impacts of the three alternatives.VISUAL CHARACTERThis section describes the existing visual character of the study area, including the defining characteristics andrelative quality of the natural and built environments; the design, character, and condition of buildings; and thedesign, character, and condition of public spaces, including streetscapes.WatershedThis section describes the visual character of the <strong>Gorst</strong> watershed, excluding that portion of the watershed withinthe <strong>Gorst</strong> UGA.The City of Bremerton owns approximately 3,000 acres in the upper <strong>Gorst</strong> watershed, commonly referred to as theCUL. The CUL are managed for low intensity forestry uses, limited commercial and recreational uses, and for theprotection of the watershed and wildlife habitat. The CUL are largely composed of native evergreen and mixedforest and previously cleared forested areas in various stages of regrowth. Users of the area may include<strong>Draft</strong> | June 2013 3-117
GORST PLANNED ACTION EIS | AFFECTED ENVIRONMENT, SIGNIFICANT IMPACTS, AND MITIGATION MEASURESrecreational users, forestry workers, or people passing through on area roads. The overall character of the UtilityLands consists of undisturbed or resource-oriented forest.The Gold Mountain Golf Club is located in the central western portion of the <strong>Gorst</strong> Watershed. The character ofthis area is of developed open space.In the western portion of the watershed along SR 3 are portions of SKIA UGA and the Bremerton National Airport.A mix of land uses currently occupies this area, including a mobile home park, drive-in movie theater, lightindustrial uses, and undeveloped land. As a result, the area lacks a cohesive aesthetic but is generally highwayoriented and fairly utilitarian.Low density, rural residential uses occupy significant portions of the watershed, including the area south of SR 3along Sunnyslope Road SW and the areas immediately west and south of the <strong>Gorst</strong> UGA. These areas are occupiedby a mix of house types on larger lots and a road network characterized by two-lane or unstriped paved roadswithout curbs or sidewalks.The Port Orchard city limits extend into the southeastern portion of the <strong>Gorst</strong> watershed. This area contains apartially developed master planned residential community known as McCormick Woods.Figure 3.8-1<strong>Gorst</strong> Creek<strong>Gorst</strong> UGASource: City of Bremerton, undatedThe <strong>Gorst</strong> UGA is more intensely developed and urban in character than the non-UGA portions of the <strong>Gorst</strong>watershed. A mix of uses occupy the UGA including highway oriented commercial, single-family residential, lightindustrial uses, developed and undeveloped open space, and an operating gravel quarry. The UGA can be thoughtof as comprising several distinct aesthetic environments: the highway corridors of SR 3 and SR 16, the generallysingle-family residential areas located off the highway, the quarry, and scattered areas of undeveloped openspace.<strong>Draft</strong> | June 2013 3-118
GORST PLANNED ACTION EIS | AFFECTED ENVIRONMENT, SIGNIFICANT IMPACTS, AND MITIGATION MEASURESThe heavily trafficked state highways, SR 3 and SR 16, form the backbone of the UGA and dominate the visualcharacter of the area in the minds of area stakeholders. The aesthetic character of these highway corridors isheavily highway and automobile oriented, with a prevalence of impervious surfaces, overhead power lines,highway signage, highway scale lighting, pole mounted signage, and an overall lack of pedestrian facilities andpedestrian scale. Land uses are a mix of industrial and commercial and lack any cohesive design character.The area waterward of SR 3 and SR 16 consists of a combination of much the same type of highway stripdevelopment as is found elsewhere along the state highways, alternating with undeveloped shoreline andintertidal areas. As such, the character of this area is mixed. Areas that provide views to the water have apotentially high aesthetic quality; however, the larger area is still largely dominated by roadways with heavy trafficand uncoordinated development.The quarry site located north of West Sherman Heights Road encompasses an active quarry as well asundeveloped, forested land.The remainder of the UGA is characterized by a mix of low density, single-family residential development,undeveloped open space, and scattered industrial uses, such as along and north of West Belfair Valley Road. Theresidential development tends to have a rural feel, similar to the rural residential located in the <strong>Gorst</strong> Watershed.Density is low, housing types, ages, and conditions are mixed without consistent design elements, and roads tendto be low-volume roads without curbs or sidewalks.<strong>Gorst</strong> Creek traverses the UGA in the triangle north of SR 3 and south of W Belfair Valley Road. This area ischaracterized by a mix of undeveloped forested riparian land adjacent to <strong>Gorst</strong> Creek and some low-densityresidential uses.Figure 3.8-2Visual Character of <strong>Gorst</strong> UGA Highway CorridorSource: BERK July 2011BUILDING HEIGHTS, BULK, AND SCALEWatershedResidential buildings in the <strong>Gorst</strong> Watershed are predominately modestly scaled, one- and two-story, single-familyhomes and outbuildings, modular homes, and mobile homes. The bulk and scale of these homes is consistent witha low-density, rural residential area. Due to the limited height and low-density nature of the residential area,shading impacts of existing structures on adjacent properties are negligible.A variety of other building types exist in the watershed, particularly in the SKIA area, including industrial oragricultural pole buildings, warehouses, and other structures. While the height and bulk of some of these<strong>Draft</strong> | June 2013 3-119
GORST PLANNED ACTION EIS | AFFECTED ENVIRONMENT, SIGNIFICANT IMPACTS, AND MITIGATION MEASURESstructures is greater than that of nearby residential areas, the density of development is low, and topographycombined with trees and other vegetation provides some screening. The result is that the more industrial areasstill have a somewhat rural scale and do not tend to dominate the landscape.The screen at the drive-in movie theater along SR 3 is a unique structure that is taller than other structures in theareas. But given the generally low density of development in the area, it does not detract from the rural feel of thearea.<strong>Gorst</strong> UGABuildings along the SR 3 and SR 16 corridors tend to be low-rise, one- or two-story buildings in a range of sizes.Smaller buildings include restaurants, taverns, markets, and espresso stands, while larger buildings includeindustrial buildings, an auto dealership, and self-storage buildings. The height and bulk of buildings does notdominate the scale of the area. Rather, it is the automobile-oriented nature of development, with buildings spreadapart from one another, separated by paved parking areas and driveways, and set back from the highway thatdefines the scale of the area. The area is not pedestrian scaled.Residential development in the UGA is similar in height, bulk, and scale to rural residential development elsewherein the watershed. Buildings are one- and two-story, modestly scaled single-family homes. Density is low and roadslack curbs and sidewalks. Homes are set back from the street and often screened by vegetation and fences.Shading impacts are negligible.Scattered industrial uses elsewhere in the UGA consist of larger buildings as well as an electrical substation. Thelarger buildings and the substation are screened from nearby residential development by trees and othervegetation.Figure 3.8-3Examples of Building Height, Bulk, and Scale of UGA Highway CorridorSource: BERK, July 2011VIEWSWatershedThe <strong>Gorst</strong> Watershed provides numerous scenic mountain and water views. The Olympic Mountains, MountRainier, and the Sinclair Inlet are all visible from various points in the watershed. Territorial views also exist,including views of local hills and forested areas.<strong>Draft</strong> | June 2013 3-120
GORST PLANNED ACTION EIS | AFFECTED ENVIRONMENT, SIGNIFICANT IMPACTS, AND MITIGATION MEASURES<strong>Gorst</strong> UGASinclair Inlet and local forested hills provide a scenic backdrop within the UGA, particularly at higher elevations,such as along Sherman Heights Road.Figure 3.8-4Sinclair Inlet View<strong>Impact</strong>sSource: BERK, August 2011The following sections assess potential aesthetic impacts for three alternatives. The assessment considers theprojected growth associated with each alternative as well as the proposed Watershed Framework &Characterization Plan and Subarea Plan measures that would affect the aesthetic characteristics of the built andnatural environment.When assessing aesthetic impacts, it is important to acknowledge that the aesthetic preferences of individualviewers varies, and what one perceives as a negative impact, another may see as neutral or positive. Considerationis given to the comments received during the public process, as noted above. These comments indicate a level ofagreement regarding the positive attributes of the natural scenery present within the watershed, as well as thenegative attributes of the highway-dominated, haphazard development present in the UGA. Other considerationsinclude generally accepted urban design principles regarding land use compatibility, cohesiveness of designcharacter, potential conflicts of building height, bulk, and scale, and view impacts.IMPACTS COMMON TO ALL ALTERNATIVESVISUAL CHARACTERWatershed<strong>Impact</strong>s to the visual character of the CUL, SKIA, and McCormick Woods would be minimal for all alternatives,including Alternative 1. The CUL would continue to be managed as undeveloped or for limited resource-oriented<strong>Draft</strong> | June 2013 3-121
GORST PLANNED ACTION EIS | AFFECTED ENVIRONMENT, SIGNIFICANT IMPACTS, AND MITIGATION MEASURESuses. Existing roads would be maintained and new development would be minimal. The visual character of thisarea would remain as largely forested, undeveloped, or resource-oriented.SKIA is subject to a separate subarea plan. The <strong>Gorst</strong> Creek Watershed Characterization & Framework Plan wouldnot affect the implementation of the SKIA plan. The majority of projected future employment growth in thewatershed would occur in SKIA. It is expected that future development in SKIA would include a mix of lightindustrial, commercial, and airport oriented uses under all alternatives. The resulting visual character would bemore intensely developed than the current conditions, but with a similar mix of uses and primarily oriented aroundSR 3 and the Bremerton National Airport.McCormick Woods is subject to a development agreement under the jurisdiction of the City of Port Orchard. It isunlikely that the <strong>Gorst</strong> Creek Watershed Characterization & Framework Plan would affect the terms of thisagreement or the nature of development that is to occur. Under all alternatives, future development in McCormickWoods would consist of low density residential uses. The visual character would remain as low density residential,but with a greater total extent of developed area.<strong>Gorst</strong> UGAThe <strong>Gorst</strong> Creek Watershed Characterization & Framework Plan would not have any adverse impacts within the<strong>Gorst</strong> UGA. The Watershed Characterization & Framework Plan supports the Guiding Principles that protect forestlands, maintain rural densities, and promote well-designed urban development in the <strong>Gorst</strong> UGA.BUILDING HEIGHT, BULK, AND SCALEWatershedThe <strong>Gorst</strong> Creek Watershed Framework & Characterization Plan would not affect building height, bulk, and scale.Future buildings would continue to be regulated by existing City of Bremerton and Kitsap County zoning andbuilding regulations under all alternatives. While development is expected to increase over the planning horizon,future buildings would be of a similar height, bulk, and scale to existing conditions and therefore no significantadverse impacts are anticipated under any of the alternatives.<strong>Gorst</strong> UGAThe <strong>Gorst</strong> Creek Watershed Framework & Characterization Plan would direct building height, bulk, and scale withinthe <strong>Gorst</strong> UGA.VIEWSWatershedThe <strong>Gorst</strong> Creek Watershed Characterization & Framework Plan is not anticipated to significantly affect viewsunder any of the alternatives. The Framework Plan would not affect building design or building heights. Whilefuture development is expected to result in vegetation clearing, the effects of this clearing would be localized andunlikely to significantly affect views. No significant adverse impacts to views are expected under any of thealternatives.<strong>Gorst</strong> UGAThe proposed <strong>Gorst</strong> Creek Watershed Characterization & Framework Plan does not regulate views. None of thealternatives propose to reroute the major highway corridors within the UGA. As such, existing mountain views asseen when traveling along these corridors are unlikely to be significantly altered under any alternative.<strong>Draft</strong> | June 2013 3-122
GORST PLANNED ACTION EIS | AFFECTED ENVIRONMENT, SIGNIFICANT IMPACTS, AND MITIGATION MEASURESAlternative 1: No <strong>Action</strong>VISUAL CHARACTERWatershedExcluding the CUL, SKIA, and McCormick Woods, the remaining portions of the watershed are expected see limitedrural scale development during the plan horizon. Future development is assumed to continue to be regulated bycurrent Kitsap County and City of Bremerton zoning and building regulations. The character of future developmentis expected to remain as largely rural residential. Under current regulations, a greater amount of vegetationclearing and impervious area is expected compared to action alternatives, which to a greater extent implement LIDand cluster development measures that intend to reduce impervious area and increase native vegetationretention. This would result in the visual character of these areas being somewhat more developed and lessnatural than under the two action alternatives. However, given the limited amount of development expected (e.g.less than 500 new dwellings), and the low density and rural character of future development, no significantadverse impacts to visual character under Alternative 1 are expected.<strong>Gorst</strong> UGAUnder Alternative 1, the <strong>Gorst</strong> UGA would be subject to the current Kitsap County Comprehensive Plan land usedesignations, and is projected to see substantial employment growth of 742 jobs and limited population growth of82 persons during the plan horizon.In some respects, the visual character of Alternative 1 would be similar to current conditions. Much of the existingdevelopment would continue in its present form, and a substantial portion of new development along the highwaycorridors would be similarly highway oriented, low rise development with large areas of impervious surfaces.Alternative 1 also assumes that the gravel quarry would continue operations.Alternative 1 would result in significant changes to the current visual character. This change would be the result ofthe substantial projected growth in employment-generating uses (e.g., commercial and industrial). The currentland use designations identify large areas that are currently occupied by low density residential uses or areundeveloped that would be available for high intensity commercial and mixed uses in the future. Therefore it islikely that some existing, low density residential uses would be displaced by more intensely developed commercialuses of a substantially different character. Current Kitsap County development regulations establish buildingsetbacks and landscaping and screening requirements that are intended to ensure compatibility of residential andnon-residential uses. These regulations would mitigate transition impacts.BUILDING HEIGHT, BULK, AND SCALEWatershedThe impacts associated with building height, bulk, and scale under Alternative 1would be the same as thosedescribed for <strong>Impact</strong>s Common to All Alternatives.<strong>Gorst</strong> UGAAlong the highway corridors, impacts related to building height, bulk, and scale and likely to be negligible. Thecurrent conditions include a wide variety of building bulk and scale, while buildings tend to one or two stories.Future development of commercial and industrial uses would likely fall within the current range of building height,bulk, and scale.In those areas of existing low density residential or undeveloped land that are identified for commercial and mixeduses, the potential exists for negative impacts related to building height, bulk, and scale as these areas transitionfrom residential to commercial during the course of the plan horizon. Current land use designations would allowfor buildings of substantially greater height, bulk, and scale adjacent to small single-family residences. CurrentKitsap County setback and landscaping standards would mitigate these impacts.<strong>Draft</strong> | June 2013 3-123
GORST PLANNED ACTION EIS | AFFECTED ENVIRONMENT, SIGNIFICANT IMPACTS, AND MITIGATION MEASURESVIEWSWatershedThe impacts associated with views under Alternative 1 would be the same as those described for <strong>Impact</strong>s Commonto All Alternatives.<strong>Gorst</strong> UGAFor the most part, mountain and water views would be minimally affected under Alternative 1. Some localizedimpacts may occur if, for instance, a new building blocks or alters an existing view from a neighboring parcel.However, these types of impacts are difficult to predict and, when considering the UGA as a whole, are not likely tobe significant.Views of Sinclair Inlet may be negatively affected as waterfront areas are more intensely developed withcommercial and industrial uses. Given the extent of development already present in these waterfront areas,however, these impacts are not expected to be significant.Alternative 2VISUAL CHARACTERWatershedAlternative 2 assumes that the recommendations of the <strong>Gorst</strong> Creek Watershed Characterization & FrameworkPlan are fully implemented, which would affect the visual character of future development in the watershed,excluding the CUL, SKIA, and McCormick Woods. The remaining portions of the watershed are expected to seelimited, largely rural residential development and the continuation of existing uses such as the Gold Mountain GolfClub and existing rural residential areas. The <strong>Gorst</strong> Creek Watershed Framework & Characterization Plan wouldresult in new development regulations and other actions that would restore vegetation cover in currentlydeveloped areas and would promote the use of clustering and LID for proposed new development. The result ofthese measures would be that future development within the watershed would result in less vegetation clearing,fewer impervious surfaces, and a more natural visual character than what would be expected under Alternative 1.The promotion of a more natural character to future development would serve to maintain the positiveimpressions of the watershed by area stakeholders as an area possessing natural beauty. No significant adverseimpacts are expected for Alternative 2.<strong>Gorst</strong> UGAAlternative 2 projects employment to grow by 606 jobs and population to grow by 985 persons. The employmentgrowth is somewhat less than the growth projected under Alternative 1, but population growth is considerablymore. Much of this projected population growth is expected to occur as medium-density residential developmentof the quarry site, once mining operations cease and reclamation requirements are met. Alternative 2 would alsoimplement new development standards and design guidelines that would result in more pedestrian oriented andsustainable development than that envisioned by current standards.Implementation of Alternative 2 would result in substantial changes to the present visual character of the UGA.Areas of existing low-density residential uses would be converted to more intense commercial development, andthe quarry site would be converted from its present resource extraction use to a residential neighborhood. Thistransition would occur incrementally over the course of the planning horizon and may have localized negativeimpacts, such as in areas where more intense commercial development displaces existing low-density residentialuses or where currently forested portions of the quarry site are cleared for development. Similarly, some existingdevelopment would continue in its present form as legal nonconforming uses, resulting in some juxtaposition ofbuilding sites with divergent visual characters.<strong>Draft</strong> | June 2013 3-124
GORST PLANNED ACTION EIS | AFFECTED ENVIRONMENT, SIGNIFICANT IMPACTS, AND MITIGATION MEASURESThe overall impact of Alternative 2 on the visual character of the UGA is likely to be positive, however, as new<strong>Gorst</strong> Subarea Plan policies and urban design concepts would result in new design guidelines that mitigate many ofthe negative aesthetic qualities frequently associated with the <strong>Gorst</strong> UGA. Streetscapes would be improved asstreet trees, planter boxes, planter strips, and sidewalks are introduced. Buildings would be brought closer to thestreet with entrances oriented to the street and connected to sidewalks, with street-facing windows and weatherprotection, creating a more welcoming, pedestrian friendly environment. Impervious surfaces would be reducedand parking would be placed to the sides or rear of buildings, reducing the desert-like quality of large expanses ofpavement.BUILDING HEIGHT, BULK, AND SCALEWatershedThe impacts associated with building height, bulk, and scale under Alternative 2 would be the same as thosedescribed for <strong>Impact</strong>s Common to All Alternatives.<strong>Gorst</strong> UGASimilar to Alternative 1, some conflicts of scale may occur as areas currently occupied by low-density residentialuses transition to more intensely developed commercial uses. Subarea Plan policies and design concepts shouldmitigate much of this conflict by encouraging a more consistent building-street relationship and avoiding the oftenhaphazard nature of development that currently characterizes much of the UGA.New development along the highway corridors would likely be within the existing range of building heights, bulk,and scale, but would have a more consistent and attractive design and streetscape.VIEWSWatershedThe impacts associated with views under Alternative 2 would be the same as those described for <strong>Impact</strong>s Commonto All Alternatives.<strong>Gorst</strong> UGASimilar to Alternative 1 some localized view impacts may occur as sites develop; however, these impacts are notexpected to be significant. Development of the quarry site as a residential neighborhood would have positive andnegative view impacts. Positive impacts would result from new views of Sinclair Inlet being opened up from thenew neighborhood. Views of the new neighborhood from elsewhere in the UGA may be considered negative ascurrently forested areas are cleared and replaced by development.Alternative 3VISUAL CHARACTERWatershedThe impacts associated with visual character under Alternative 3 are the same as those described for Alternative 2.<strong>Gorst</strong> UGAAlternative 3 would support greater population growth, at 1,082 persons, and less employment growth, at 333jobs, than the other two alternatives. The types of development envisioned in this alternative differ from otheralternatives as well. Alternative 3 places a greater emphasis on mixed use development as well as more aggressiveLID measures in sensitive areas of the UGA, such as adjacent to <strong>Gorst</strong> Creek and waterward of SR 3 and SR 16.The impacts of Alternative 3 are similar to those of Alternative 2 in terms of the extent of overall change in visualcharacter from the present condition to a more compactly developed urban center, the potential for conflicts<strong>Draft</strong> | June 2013 3-125
GORST PLANNED ACTION EIS | AFFECTED ENVIRONMENT, SIGNIFICANT IMPACTS, AND MITIGATION MEASURESduring the transition from current conditions to future build out, and the overall positive effect of new designpolicies and concepts.There are several differences between Alternatives 3 and 2. Alternative 3 envisions more residential and lesscommercial growth, with a greater emphasis on mixed use development. The greater amount of residential mayease some of the potential transition conflicts in currently residential areas.Alternative 3 proposes a Low Intensity Waterfront zone waterward of SR 3 and SR 16. This would have the effect oftransitioning this area from its current condition to one more characterized by low impact commercialdevelopment with less impervious area, greater shoreline setbacks, more vegetation, and more public access. Asthis area is largely built out at present, the transition would occur slowly as parcels redevelop and transitionconflicts would likely be minimal. Upon full implementation, the aesthetic effect would be positive as the shorelinewould have a more natural aesthetic and there would be more opportunities for public viewing of the shoreline.BUILDING HEIGHT, BULK, AND SCALEWatershedThe impacts associated with building height, bulk, and scale under Alternative would be the same as thosedescribed for <strong>Impact</strong>s Common to All Alternatives.<strong>Gorst</strong> UGABuilding height, bulk, and scale impacts of Alternative 3 would be similar to those described for Alternative 2.VIEWSWatershedThe impacts associated with views under this alternative would be the same as those described for <strong>Impact</strong>sCommon to All Alternatives.<strong>Gorst</strong> UGAView impacts of Alternative 3 would be similar to those described for Alternative 2.Mitigation MeasuresIncorporated Plan FeaturesWatershedThe <strong>Gorst</strong> Creek Watershed Framework & Characterization Plan identifies areas for protection, restoration, anddevelopment. The effects of these actions on aesthetics relate to the maintenance of a more natural or rural visualcharacter, the maintenance of vegetation cover, and the minimization of impervious areas.Areas of protection are to be managed for the maintenance of forest cover, limited clearing, and minimalimpervious surfaces. Areas identified for protection include the CUL and other forested areas in the north centralportion of the watershed.Areas of restoration would promote the re-establishment of habitat, including forest cover, riparian areas, andwetlands. Areas of restoration include the Gold Mountain Golf Club in the western portion of the watershed, andrural residential areas along Sunnyslope Road and to the west of the <strong>Gorst</strong> UGA. Existing development wouldremain in these areas, but new regulations would gradually increase native habitat.Areas of development are considered to be suitable for growth, but would implement measures to control erosionand promote infiltration. Clustered development and LID would be encouraged for new development in theseareas. Clustered development allows for the permitted density of a proposed development to be located on asmaller portion of a site, while requiring that the remainder portion be kept in a natural state.<strong>Draft</strong> | June 2013 3-126
GORST PLANNED ACTION EIS | AFFECTED ENVIRONMENT, SIGNIFICANT IMPACTS, AND MITIGATION MEASURESLID is a method of land development that seeks to mimic pre-development hydrology through the use ofclustering, retaining native vegetation, and minimizing impervious surfaces, among other measures.Identified areas of development include the SKIA area and adjacent areas, and the currently developed areas ofthe <strong>Gorst</strong> UGA and the McCormick Woods area of the City of Port Orchard. SKIA would be subject to its recentlyadopted design guidelines. McCormick Woods is a master planned development subject to a developmentagreement. The <strong>Gorst</strong> UGA would have its own design guidelines in the Subarea Plan as further described below.<strong>Gorst</strong> UGAThe <strong>Gorst</strong> Subarea Plan projects growth for the UGA that differ for each alternative. These growth projectionswould affect aesthetics within the UGA as a result of differences in the extent of development expected within theUGA, the mix of development types expected (e.g., residential versus commercial), and the density ofdevelopment expected (e.g., medium density residential versus low density residential). The primary means ofimplementation would be zoning and development regulations that determine allowed and prohibited uses andestablish minimum and maximum densities.Applicable Regulations and CommitmentsCurrent regulations and policies that may affect the aesthetic characteristics of the watershed and UGA includeKitsap County and City of Bremerton comprehensive plans, shoreline master programs, critical area regulations,and zoning and development regulations, including those addressing landscaping, lighting, signage, and projectreview procedures. Following is a list of some of the applicable regulations and policies.Kitsap County• 2012 Comprehensive Plan• KCC Title 16 Land Division and Development• KCC Title 17 Zoning• KCC Title 19 CAO• KCC Title 21 Land Use Development and Procedures• Shoreline Master Program (2013 updated draft adopted by Kitsap County, currently in review by Ecology) –also codified as KCC Title 22City of Bremerton• 2004 Comprehensive Plan• BMC Title 20 Land Use Shoreline Master Program (update adopted by City of Bremerton, currently in reviewby Ecology) – part of BMC Title 20 Land Use, Chapter 16Other Potential Mitigation MeasuresOnce a Preferred Alternative is selected development and design regulations would be prepared and areanticipated to address:• Allowed and prohibited uses/development types• Minimum and maximum density• Building height• Building setbacks• Maximum lot coverage• Maximum impervious area<strong>Draft</strong> | June 2013 3-127
GORST PLANNED ACTION EIS | AFFECTED ENVIRONMENT, SIGNIFICANT IMPACTS, AND MITIGATION MEASURES• Critical area buffersIn addition other City or County regulations such as those governing signage, lighting, and landscaping wouldapply.Future design guidelines developed with the Preferred Alternative would likely establish discretionary review offuture development proposals focusing on the design of the public realm and those portions of privatedevelopment sites that directly affect the public realm. The design guidelines are intended to promote walkability,complete streets, identifiable character, the efficient and coordinated use of land and infrastructure, and LID.Accordingly, the design guidelines may address:• Streetscape guidelines• Site planning guidelinesThe streetscape guidelines apply to the design of public rights-of-way. Streetscape guidelines would address:• Design of the roadway, including width of travel, bicycle, and parking lanes• Design of the curb zone, which includes street trees and other amenities and infrastructure• The sidewalk• The transitional zone, which is the area between the sidewalk and edge of right-of-way• Building frontage elements such as the provision of weather protection where buildings abut the right-of-wayThe streetscape guidelines could vary based on type of roadway.The site planning guidelines associated with the Preferred Alternative would likely address the design of individualbuilding sites with regard to several aspects, including:• Building orientation, including the location of entrances• Building façade, including street-facing windows, building articulation, and blank wall limitations• Parking and vehicular access, including location of parking, curb cuts, shared parking, and pedestrianaccessibilitySignificant Unavoidable Adverse <strong>Impact</strong>sNew development and redevelopment would result in changes to the current aesthetic conditions of the studyarea under all alternatives. The significance of visual impacts on the study area depends in large part on the valuesof those viewing the changes as well as the overall character and quality of the architectural and urban designfeatures incorporated into future development.Under all alternatives, temporary character and shading impacts would result from different building heightsbetween adjacent properties as development of individual sites occurs. Currently, most properties in the studyarea are at low rise scales and have not developed to the extent allowed under present zoning. In some cases theaction alternatives would allow greater heights than present zoning. <strong>Impact</strong>s would diminish as redevelopmentbecomes more widespread throughout the study area. Existing and potential development regulations regardingheight limits, setbacks, and screening would mitigate for such impacts.The overall aesthetic character of the study area would change under all alternatives as development andredevelopment occurs. All alternatives would be subject to mitigation measures in the form of policies,development regulations, and design standards that will mitigate for potentially adverse aesthetic impacts orresult in a positive change to the aesthetic character of the study area. Therefore, no significant unavoidableadverse impacts on aesthetics are anticipated.<strong>Draft</strong> | June 2013 3-128
GORST PLANNED ACTION EIS | AFFECTED ENVIRONMENT, SIGNIFICANT IMPACTS, AND MITIGATION MEASURES3.10 Cultural ResourcesThe analysis of impacts to cultural resources for the proposed project was completed at a programmatic level forthe anticipated impacts of growth and civic investment throughout the Study Area. The analysis included extensivebackground research and tribal consultation; no fieldwork or project specific inventory and evaluation of culturalresources was conducted.The term cultural resource in this document refers to archaeological sites, TCPs and historic built environmentstructures, regardless of eligibility for listing in the Washington Heritage Register (WHR) or the National Register ofHistoric Places (NRHP). The term significant cultural resource refers to archaeological sites, TCPs, and structuresthat are eligible for listing in the WHR or NRHP.Regulatory ContextThe following regulatory context applies to both the Watershed and <strong>Gorst</strong> UGA.Washington SEPASEPA requires that all major actions sponsored, funded, permitted, or approved by state and/or local agencies beplanned so that environmental considerations—such as impacts on cultural resources—are considered when stateagency-enabledprojects affect properties of historical, archaeological, scientific, or cultural importance WAC 197-11-960). These regulations closely resemble NEPA.Under SEPA, DAHP is the specified agency with the technical expertise to consider the effects of a proposed actionon cultural resources and to provide formal recommendations to local governments and other state agencies forappropriate treatments or actions.Minor construction currently exempt from SEPA review includes the following, except when undertaken wholly orpartly on lands covered by water (WAC 197-11-800(1))(b):(i) The construction or location of four detached single family residential units.(ii) The construction or location of four multifamily residential units.(iii) The construction of a barn, loafing shed, farm equipment storage building, produce storage or packingstructure, or similar agricultural structure, covering 10,000 square feet, and to be used only by the propertyowner or his or her agent in the conduct of farming the property. This exemption shall not apply to feed lots.(iv) The construction of an office, school, commercial, recreational, service or storage building with 4,000square feet of gross floor area, and with associated parking facilities designed for twenty automobiles. Thisexemption includes stand-alone parking lots.(v) Any landfill or excavation of 100 cubic yards throughout the total lifetime of the fill or excavation notassociated with an exempt project in subsection (b)(i), (ii), (iii), or (iv); and any fill or excavation classified as aClass I, II, or III forest practice under RCW 76.09.050 or regulations thereunder.Cities and counties may increase the exemption for minor new construction. Currently, the City of Bremerton usesstandard exemptions, except these do not apply on lands wholly or partially covered by water or in the case ofcritical areas (wetlands, critical aquifer recharge areas, flood hazard areas, geologic hazards, and fish and wildlifeconservation areas). However, in the case of critical areas, SEPA review is limited to determining impacts on criticalareas not otherwise covered by CAOs. The City is considering increasing its exemption levels consistent with newSEPA rules.Kitsap County has adopted similar SEPA rules as the City of Bremerton; it applies flexile exemption levels in UGAsincluding <strong>Gorst</strong>, as follows:<strong>Draft</strong> | June 2013 3-129
GORST PLANNED ACTION EIS | AFFECTED ENVIRONMENT, SIGNIFICANT IMPACTS, AND MITIGATION MEASURESA. The county establishes the following exempt levels for minor new construction under WAC 197-11-800(1)(c):1. For the construction or location of residential dwelling units in WAC 197-11-800(1)(b)(i):a. Up to nine residential dwelling units within the boundaries of an UGA; orb. Up to four residential dwelling units outside the boundaries of an UGA2. For agricultural structures in WAC 197-11-800(1)(b)(ii): up to fifteen thousand square feet ofground coverage. This exemption shall not apply to feed lots3. For the construction or location of office, school, commercial, recreational, service or storagebuildings in WAC 197-11-800(1)(b)(iii): up to eight thousand square feet with associatedparking up to forty parking spaces4. For the construction or location of parking lots in WAC 197-11-800(1)(b)(iv): up to fortyparking spaces5. For any landfills or excavations in WAC 197-11-800(1)(b)(v):Washington Heritage Registera. Up to five hundred cubic yards; orb. Up to one hundred fifty cubic yards if the proposal is located on property subject tothe provisions in Title 22, Shoreline Management Master Program.The WHR is an official listing of historically significant sites and properties found throughout the state. The list ismaintained by DAHP and includes districts, sites, buildings, structures, and objects that have been identified anddocumented as being significant in local or state history, architecture, archaeology, engineering, or culture. Toqualify for placement on the WHR, the resource must meet the following criteria:• A building, site, structure or object must be at least 50 years old. If newer, the resource should havedocumented exceptional significance.• The resource should have a high to medium level of integrity (i.e., it should retain important characterdefiningfeatures from its historic period of construction).• The resource should have documented historical significance at the local, state, or federal level.Governor’s Executive Order 05-05Washington State Executive Order 05-05—which requires state agencies with capital improvement projects tointegrate Washington State Department of Archaeology & Historic Preservation (DAHP), the Governor’s Office ofIndian Affairs, and concerned tribes into their capital project planning processes—was signed into action byGovernor Chris Gregoire in November 2005. All state agency capital construction projects or land acquisitions, nototherwise reviewed under federal law, must comply with this executive order, if the projects or acquisitions havethe potential to affect cultural resources. Agencies with projects or acquisitions subject to review under theexecutive order must consult with DAHP and concerned tribes and invite their participation in project planning. Ifcultural resources are present, then reasonable steps to avoid, minimize, or mitigate potential effects must betaken.Other Applicable Cultural Resources LawsOther state laws that govern the protection of archaeological resources include:• Chapter 27.44 RCW, Indian Graves and Records, provides for the protection of Native American graves andburial grounds, encourages voluntary reporting of said sites when they are discovered, and mandates apenalty for disturbance or desecration of such sites.<strong>Draft</strong> | June 2013 3-130
GORST PLANNED ACTION EIS | AFFECTED ENVIRONMENT, SIGNIFICANT IMPACTS, AND MITIGATION MEASURES• Chapter 27.53 RCW, Archaeological Sites and Resources, governs the protection and preservation ofarchaeological sites and resources and establishes DAHP as the administering agency for these regulations.• RCW 36.70A.020 includes a goal to “Identify and encourage the preservation of lands, sites, and structuresthat have historical, cultural, and archaeological significance.” Cities planning under the Washington StateGMA must consider and incorporate this historic preservation goal in their Comprehensive Plans andimplementing development regulations.• Chapter 68.60 RCW, Abandoned and Historic Cemeteries and Historic Graves, provides for the protection andpreservation of abandoned and historic cemeteries and historic graves.Affected EnvironmentThis section describes the environmental and cultural setting of the Study Area, including the Watershed and <strong>Gorst</strong>UGA, and was used to assess the potential for cultural resources to be present within the study area and to definethe potential impacts. A review of the physical environments that affect human behavior and the cultural settingcan help generate expectations about how archaeological sites could be distributed across the landscape and thekinds of activities that occurred there.<strong>Environmental</strong> Context: Watershed and UGAGeologyThe Puget Lobe of the Fraser Glaciation covered parts of Puget Sound with up to 1250 meters (4060 ft.) of ice. Theglacier’s terminus was located south of Budd Inlet. The Puget Lobe retreated to the area near Port Townsend byapproximately 15000 BP (Thorson 1980). When it retreated north into the Strait of Juan de Fuca, proglacial lakeswere inundated with saltwater, the water level dropped and the glacial processes of deposition were replaced by alandform of unconsolidated glacial clay, silt, sand and gravel. Surface geology is characterized as unconsolidatedsediments from the Pleistocene continental glacial drift, Quaternary alluvium, dune sand and loess (Troost andBooth 2008; Puget Soundkeeper Alliance 2008).The <strong>Gorst</strong> Creek Watershed is located within the Puget Trough Physiographic Province (Franklin and Dyrness 1988).The specific geographic province is referred to as the Puget Lowland or Puget Sound Lowland. The landform of theKitsap Peninsula is characterized by gently rolling, low hills dissected by numerous rivers and stream. Within theproject vicinity there are a number of small coves and inlets consisting of sandy beaches and mud flats.PaleoenvironmentVegetation composition and animal distributions in the Puget Lowlands have changed dramatically since the end ofthe Pleistocene. Lodgepole pine covered the newly deglaciated surface, following in succession by Douglas fir,white pine, spruce and alder (Barnosky 1984). The climate of the region became warmer and drier between 10000and 6000BP then present day. Forests were more open and prairies were common throughout the Puget Lowlandin gravelly outwash soils. Beginning at about 6000 to 5000 BP conditions began to change with coolertemperatures and increased precipitation and have remained relatively stable to the present with forests ofwestern red cedar, western hemlock and Douglas fir (Whitlock 1992).Cultural Context: Watershed and UGAThis section presents an overview of the cultural setting of the Study Area, including the Precontact, ethnographicand historic period contexts.PrecontactStudies of the prehistory of the Puget Sound and surrounding areas divide the prehistoric cultural sequence intomultiple phases or periods from about 12,500 to 225 years ago, and are delineated by changes in regional patternsof land use, subsistence, and tool types over time. These phases are academic constructs and do not necessarilyreflect tribal viewpoints. This document uses the Pacific Northwest coast precontact cultural sequence provided by<strong>Draft</strong> | June 2013 3-131
GORST PLANNED ACTION EIS | AFFECTED ENVIRONMENT, SIGNIFICANT IMPACTS, AND MITIGATION MEASURESAmes and Maschner (1999) to help describe patterns in precontact cultural developments in the Puget Soundregion. The sequence includes five periods, which are briefly summarized below:• Paleo-Indian (prior to 12,500 years ago). Characterized by sparse and highly mobile groups that primarily usedterrestrial resources. Assemblages include large stone bifaces and bone technology.• Archaic (12,500 to 6,400 years ago). Characterized by generalized resource use. Assemblages include leafshapedbifaces, cobble and cobble-flake tools, bone tools, thin shell midden and faunal remains along coastalareas, and an absence of faunal remains in upland areas.• Early Pacific (6,400 to 3,800 years ago). Characterized by increased sedentism, expanded use of intertidalresources, and increased dependence on bone and antler tools. Assemblages include bone points, barbs, andharpoons, ground stone points and celts, and extensive shell middens.• Middle Pacific (3,800 to 1,800–1,500 years ago). Characterized by the first evidence of permanent socialinequality, as well as a shifting emphasis to storage-based economy, intensification of salmon fishing, increasein the variety of bone and antler tools, and near-modern art styling. Assemblages include artifacts from theEarly Pacific period, as well as plank house remains, wooden boxes, toggling harpoons, fish hooks, and fishrakes.• Late Pacific (1,800–1,500 to around 225 years ago). Characterized by the emergence of extremely largehouses, heavy-duty woodworking tools, and a decreased reliance on chipped stone tools.The first widely accepted evidence of human occupation of the Puget Sound region comes in the form of largefluted stone bifaces, identified as Clovis technology. This technology has been dated to between 13,300 and12,800 years ago across North America (Waters and Stafford 2007), but has not been found in datable contexts inthe Puget Sound. It is commonly thought that this technology was used by highly mobile foragers (Bonnichsen andTurnmire 1991; Waguespack and Surovell 2003). Although widespread, artifacts attributed to Clovis occupation ofthe Puget Sound are rare and commonly recorded as isolated finds on upland terraces associated with peatdeposits (Williams et al. 2008). Near the project vicinity, one Clovis-style isolate has been identified on the KitsapPeninsula near Port Orchard (Stein et al. 2004), and another was identified near Waughop Lake (Avey 1991:15–18).Archaeological sites attributed to the Archaic and Early Pacific periods are most commonly situated on uplandplains with very few coastal sites from this period. Throughout the Puget Sound region, sites with heavilyweathered basalt flakes, cores, and lanceolate, or Cascade-style bifaces, are commonly assigned to the Archaic andEarly Pacific periods. Based on well-dated stylistic comparison of bifaces from the Glenrose Cannery site in BritishColumbia, Nelson (1990) suggests that these upland sites are comparable in age and date between 10,000 and6,000 years ago. However, several investigators have noted that leaf-shaped points are found in a variety of welldatedcontexts that range from 9,950 to 2,260 years in age (Blukis Onat et al. 2001; Greengo and Houston 1970;Shong et al. 2007). Upland archaeological sites tend to consist of scatters of lithic materials at or just below theground surface, rarely contain organic materials such as charcoal and bone, and tend to show signs of disturbancefrom bioturbation (Kiers and Blukis Onat 2008).Archaeological sites situated along the coastal margin and in riverine settings become increasingly prevalent duringthe Middle Pacific period, although the highest frequency of known coastal sites have been dated to the LatePacific period. Accumulations of shell and bone (termed shell middens), technological innovation andintensification in the form of increasingly complex composite food-procurement technology (e.g., togglingharpoons, fish weirs), greater numbers of groundstone artifacts, as well as large wooden plank houses appearduring these periods. These periods are also characterized by increased warfare and interpersonal violence asevidenced by physical trauma indicators observed in burials from this time (Ames and Maschner 1999). Analysis offaunal remains from archaeological sites dated to these periods indicates that salmon were an important,consistently exploited, resource in the region (Butler and Campbell 2004). Several coastal archaeological sites arelocated along the shoreline of Quartermaster Harbor in the vicinity of the APE (J. Stein 2002).<strong>Draft</strong> | June 2013 3-132
GORST PLANNED ACTION EIS | AFFECTED ENVIRONMENT, SIGNIFICANT IMPACTS, AND MITIGATION MEASURESEthnography and EthnohistoryThe Study Area is in the ethnographic territory of the Suquamish, a south Puget Sound Lushootseed speakinggroup. The traditional territory of the Suquamish centered along Puget Sound from the Kitsap Peninsula to HoodCanal, including Bainbridge Island and portions of Whidbey Island (Ruby and Brown1992; Snyder 1968).Suquamish subsistence was traditionally based upon seasonal availability of terrestrial and marine resources. Themost important resources of which was salmon, though a variety of other fish, shellfish, roots, bulbs and berrieswere also part of their diet. Winter villages were often located on sheltered bays at or near the mouths of streams.Ethnographically recorded Suquamish villages included a village at Sandy Hook south of Suquamish and on MillerBay north of Suquamish (Snyder 1968; Waterman 2001). Spring, summer and fall month’s small family groupsdispersed to camps along inlet, shallow bays and creeks for fishing and hunting and gathering. Resources wereharvested in quantity and preserved for consumption in the winter (Haeberlin and Gunther 1930).With the establishment of Fort Nisqually in 1832, the Suquamish regularly traded with the Hudson’s Bay Company.In 1855, Chief Sealth, a member of the Duwamish, signed the Point Elliott Treaty creating the Port MadisonReservation for several Puget Sound groups including the Suquamish (Ruby and Brown 1992).HistoryIn 1972, Captain George Vancouver was the first Euroamerican to record many of the prominent landmarks onKitsap Peninsula, including Hood Canal, Bainbridge Island and Port Orchard. The Wilkes Expedition surveyed thearea in 1841, naming Gig Harbor, Agate Passage, Port Madison and Sinclair Inlet. Many of the earliestEuroamerican settlements were associated with Fort Nisqually at the southern end of Puget Sound near presentday DuPont. Farming and livestock were the primary activities at Fort Nisqually, although trading of furs and othercommodities with Native American took place (Kirk and Alexander 1990).Lumber became a major export industry for the Puget Sound in its early history. The California Gold Rush of 1849had a significant impact in that industries development as it did for much of the Pacific Northwest. The miningcamps and boomtowns in California required timber resources, and Washington’s heavily timbered land and deepwater ports provided the economic solution (Andrews 1956; Ficken1987).Known Cultural Resources and Previous Studies within the Study Area: Watershed and UGAA records search of existing data was conducted of the Study Area using the Washington Information System forArchitectural and Archaeological Records Database (WISAARD). This records search included a review of previouslyrecorded cultural resources, including archaeological sites, built environment resources, and traditional culturalproperties, as well as cultural resources studies within the Study Area that are listed in the WISAARD database.Three previous studies were conducted within the Study Area, resulting in the identification of one archaeologicalsite located within the Study Area. A summary of cultural resource studies identified during the literature review isprovided in Table 3.10-1 Previously Studied Cultural Resources within the Study Area. Table 3.10-2 KnownArchaeological Resources within the Study Area presents the known historic built environment resources that havepreviously been recorded within the Study Area.One archaeological site has been previously recorded within the Study Area and has been determined eligible forlisting in the NRHP: Site 45KP109, the Seshwa′p Site. Site 45KP109 consists of precontact artifacts fish bones andshell midden. The site was recommended eligible for listing in the NRHP for its ability to provide data significant inprehistory.Three historic built environment resources have been previously recorded within the Study Area and aresummarized in Table 3.10-3 Known Historic Built Environment Resources within the Study Area. None were foundeligible for listing on the National Register of Historic Places.<strong>Draft</strong> | June 2013 3-133
GORST PLANNED ACTION EIS | AFFECTED ENVIRONMENT, SIGNIFICANT IMPACTS, AND MITIGATION MEASURESTable 3.10-1Previously Studied Cultural Resources within the Study AreaNADB# Author (Year) Report Title Description CulturalResources1345515 Chambers andHartman (2005)Cultural Resources Assessment for the <strong>Gorst</strong> CreekEstuary Restoration Project, Kitsap County,Washington1348864 Chambers (2007) Archaeological Monitoring for Phase 1 <strong>Gorst</strong> CreekEstuary Restoration Project, Kitsap County,Washington1347532 Berger (2006) Cultural Resources Assessment for the Sinclair InletRestoration and Trail Project, Kitsap County,Washington1342954 Hartmann (1999) Data Recovery Plan for Investigations at 45KP109for the WSDOT State Route 3 ProjectArchival research;archaeologicalsurvey.ArchaeologicalMonitoring.Archival research;archaeologicalsurvey.Archival researchand reportNoneNoneNonePrecontactSiteTable 3.10-2Known Archaeological Resources within the Study AreaSite Trinomial Description DateRecorded45PI109(precontact site)Precontact camp and/or village location. Archaeological resources includecharcoal, fish bones, shellfish fragments. Site was dated to 928-991 BPNRHPEligibility1992 EligibleTable 3.10-3Known Historic Built Environment Resources within the Study AreaCommon Name Address DateConstructedNRHPEligibilitySvedburg Dwelling 9371 Thorson Rd W, Bremerton, WA 1941 Not EligibleHarold Davis Dwelling 3657 W Frontage Rd, Port Orchard, WA 1941 Not EligibleTheresa Lutz 4124 Division Ave Ct W, Bremerton, WA 1942 Not EligibleExpectations for Cultural Resources Sensitivity within the Study AreaArchaeologyThis section describes the expectations for where archaeological resources are anticipated within the Study Area.Expectations were developed based on an analysis of the environmental setting of the Study Area, and therelationship to human behavior. Analysis of the available background information, including the Suquamish TribesGIS Archaeological Sensitivity Model for Kitsap County (Suquamish Tribe and Peterson GIS 2010) indicates that theStudy Area is sensitive for buried archaeological resources.The geology and geomorphology of coastal Puget Sound and surrounding uplands are conducive to thepreservation of cultural resources (i.e., comprised primarily of stable or depositional landforms). Severaldocumented precontact and historical archaeological sites are located within the Study Area or in the vicinity.Although only one site has been evaluated for NRHP eligibility, it is highly probable that eligible sites will beidentified when project specific inventories and evaluations are conducted. The paucity of documented culturalresources within the Study Area is a function of lack of previous inventory efforts rather than lack of culturalresources.<strong>Draft</strong> | June 2013 3-134
GORST PLANNED ACTION EIS | AFFECTED ENVIRONMENT, SIGNIFICANT IMPACTS, AND MITIGATION MEASURESTable 3.10-4 Archaeologically Sensitive Landforms Likely Present in the Study Area depicts the archaeologicalsensitivity areas within the Study Area and is based on the Suquamish Tribes GIS Archaeological Sensitivity Modelfor Kitsap County (Suquamish Tribe and PetersonGIS 2010). Figure 3.10-1 <strong>Gorst</strong> Creek Watershed: CulturalResources Probability depicts high and moderate probability locations within the Study Area. The High ProbabilityAreas include the locations where known archaeological sites and historic built environment resources have beenrecorded as well as those areas where archaeological sites are anticipated based on geology, soils, slope, Lidar, andethnographic data. The Moderate Probability Areas include locations where there is the potential forarchaeological sites and historic built environment resources to be located based on the available data; howevernone have been identified to date and historic and modern land use and alteration (e.g. freeway construction,mining activities, etc.) may have disturbed.Historical and Modern Landscape AlterationThe landscape of the Study Area has undergone extensive modification since the first Euroamerican settlementswere established in the area. Two of the most widespread landscape modification methods included the removalof sediment and filling of topographical depressions. Each of these methods has a unique effect on archaeologicalsite preservation and visibility. By understanding these effects, expectations about archaeological potential can begenerated for developed areas and then used to inform archaeological investigation strategies to identify wherearchaeological deposits are most likely to be present.Sediment removal is used to decrease the elevation of and/or level the ground surface. Removal, also referred toas “cutting” is achieved through a variety of processes including mechanical excavation, hydraulic sluicing, and theuse of explosives. Since cutting results in the removal of sediment, it provides no direct sedimentary indicators.However, locations where sediments have been removed can be recognized by truncation or absence of soilhorizons. Cutting does not affect archaeological potential equally across landforms. For example, on landformsformed as a result of glacial advance and retreat, such as till plains, precontact human activity would have onlyoccurred on the exposed ground surface. Removal of this surface would result in the removal of all sediments thathave the potential to contain intact archaeological deposits. For example, the ground disturbance associated withthe quarry within the Study Area would have substantially disturbed, and likely removed, all evidence ofprecontact habitation and use.Filling is used to raise the elevation of the ground surface. The composition of fill deposits is defined by thedeposit’s source or origin. Fill deposits may contain accumulations of precontact, historical, and/or modern objectsthat have been displaced from the location of their primary deposition. Since widespread filling began during thehistorical period, precontact archaeological deposits within these fill deposits are not expected to be in primarydepositional context and, therefore, do not represent an intact archaeological site.Anticipated Archaeological Property TypesPrecontact human habitation, however, was dependent on the availability of water and the ease with whichresources could be transported. Consequently, habitation areas were likely located along coastal, river, and lakemargins. The Study Area encompasses a coastal environment with several rivers, creeks, and lacustrine areas andis considered highly sensitive for archaeological sites. The Study Area extends across two broad environments—coastal and upland. Eight landform types likely to be found in these environments that have the potential tocontain archaeological sites are discussed in detail below. A summary table of these landforms is provided in Table3.10-4 Archaeologically Sensitive Landforms Likely Present in the Study Area.<strong>Draft</strong> | June 2013 3-135
THIS PAGE INTENTIONALLY BLANK
Lake UnionReservoirBremertonHeinsCreekJarstad CreekBremerton West UGAUnnamed Stream1227493475317TwinLakesUnion RiverUnnamed Stream 1227399475259<strong>Gorst</strong> UGASKIA UGASKIA UGAGold MountainGolf ClubBremertonNationalAirport<strong>Gorst</strong>CreekUnnamed Stream1227418475110SKIA UGAParish Creek<strong>Gorst</strong>CreekSinclairInlet 16616 16 3 BremertonUnnamed Stream 1227181475299ULID6ULID6ULID6<strong>Gorst</strong> Tributary 1Unnamed Stream 1226919475271Port OrchardUnnamed Stream 1226824475230Port OrchardAndersonCreekBlackjack CreekPath: P:\ENV\PROJECTSW\60271862 <strong>Gorst</strong> Subarea Plan\400 Technical Information\423 GIS\3_MXDs\EIS Figures\Cultural Probability Map.mxd ¯00.5 1 Miles
THIS PAGE INTENTIONALLY BLANK
GORST PLANNED ACTION EIS | AFFECTED ENVIRONMENT, SIGNIFICANT IMPACTS, AND MITIGATION MEASURESTable 3.10-4Archaeologically Sensitive Landforms Likely Present in the Study AreaLandform Age Accessibility ResourcesSalt marsh Holocene Inundated for short periods duringthe day.Tide flat Holocene Inundated for long periods duringthe day.Fish, waterfowl, plants, terrestrialmammals.Fish, shellfish.Subtidal coastal Holocene Permanently inundated. Fish, aquatic plants.Berm Holocene Seasonally inundated. Tool stone, grasses.Intertidal beach Holocene Inundated for long periods duringthe day.Fish, shellfish, tool stone, aquatic plants.Upland plain Pleistocene Permanently accessible. Terrestrial mammals and plants, tool stone,ochre.Nearshorelacustrine/marshHolocene Seasonally accessible. Waterfowl, fish, plants, terrestrialmammals.Several specific activities are likely to have occurred in the Study Area given expectations about human behaviorand landforms and their attributes (e.g., stability and accessibility) discussed above. The precontact property typespresented in this section are modeled after types, developed by Lewarch and Larson (2003:6-1–6 11), that focus oncharacterizing the activities represented by an archaeological assemblage (e.g., fishing and fish capture location).The precontact property types that may be present within the Study Area are as follows:• Fish Capture and Processing• Shellfish Processing• Lithic Procurement and Processing• Plant Collection and Processing• Terrestrial Mammal Hunting and Butchering• Habitation• Multiple Processing ActivitiesHistoric Built Environment ResourcesSeveral historic built environment resources have been identified within the Study Area; however a completeinventory of buildings and structures older than 50 years has not been completed. The Study Area contains thelocation of domestic, industrial, recreation, or other activities that have the potential to contain buildings andstructures older than 50 years. A review of the land use history and historical development reveals that theresidential, commercial, and industrial areas were established within the Study Area and that there is highpotential for buildings and structures older than 50 years to be currently located within the Study Area.<strong>Impact</strong>s<strong>Impact</strong>s Common to All AlternativesWatershed<strong>Impact</strong>s that can adversely affect important cultural resources include anything that might significantly destroy oralter the important features of a cultural resource. Direct and indirect effects to cultural resources can result fromhuman activities or natural events. Under all alternatives, development would occur throughout the <strong>Gorst</strong>watershed, to varying degrees as allowed by zoning and applicable regulations. As discussed in Section 2.5 Study<strong>Draft</strong> | June 2013 3-139
GORST PLANNED ACTION EIS | AFFECTED ENVIRONMENT, SIGNIFICANT IMPACTS, AND MITIGATION MEASURESAlternatives: Future Growth, it is assumed that most development outside of city limits and designated UGAswould be associated with residential dwellings, with increased construction over the next 20 years. Construction ofnew buildings, structures, and infrastructure would result in ground disturbance within affected areas andpotential effects to historic built environment resources older than 50 years. Removal of trees and othervegetation within these areas could also lead to reduced infiltration and erosion of exposed soils from affectedsites. Ground disturbance and increased construction may result in the potential loss of significant culturalresources. Under all the alternatives, risks of disturbance to significant cultural resources associated withdevelopment and other ground disturbing activities would be greatest on within those areas identified as HighProbability Areas (Table 3.10-5 Development and Construction Activities in High and Moderate Probability AreasDiscussion). Preconstruction cultural resources inventories and evaluations within the High Probability Areas wouldhelp minimize these impacts to varying degrees.One significant cultural resource is known to exist in the Study Area: Site 45KP109. Future development in theStudy Area would not affect known cultural resources unless they occur on the same parcels where Site 45KP109 islocated or results in the discovery of a previously unknown resource. The potential for impacts on unknowncultural resources cannot be accurately measured at this time because the Study Area has not been inventoried forsignificant cultural resources. The only cultural resources studies that have been completed in the Study Areainclude those listed in Table 3.10-1 Previously Studied Cultural Resources within the Study Area 1. Other portions ofthe Study Area have not been surveyed for cultural resources, including archaeological sites, built environmentresources, and TCPs. Portions of the Study Are have been identified as having high probability for containingsignificant cultural resources.Both Alternatives 2 and 3 accommodate future growth in the Study Area, which could occur on any parcel withinthe Study Area, including those areas determined to have High Probability and Moderate Probability, andtherefore have the potential to affect unknown cultural resources. Therefore, potential impacts on unknowncultural resources would be the same under all studied alternatives, although the rate and timing of these impactswould vary. Implementation of mitigation measures would identify potential impacts on cultural resources reducethem to less than significant.Given that significant cultural resources are present within the Study Area and that High Probability Areas havebeen identified, future development would have the potential to impact these resources. It is assumed that underall alternatives, future development projects would receive the appropriate permits, and that buffers,development standards, and other mitigation measures pertaining to identifying and preserving significant culturalresources would be implemented.<strong>Gorst</strong> UGAUnder all alternatives, most impacts to cultural resources would occur within the <strong>Gorst</strong> UGA, where the majority ofplanned development would be focused. Within the UGA, development could occur within the 281 parcel acrespreviously discussed, although the types of development would vary by alternative. Additionally, it is unlikely thatall currently developed areas would be redeveloped within the next 20 to 30 years. Potential impacts associatedwith development and construction activities within the UGA would be similar to those described for thewatershed. The potential for loss of significant cultural resources would be present, including archaeological sites,historic built environment resources, and TCPs, all of which would have the potential to be minimized, to varyingdegrees by conducting preconstruction cultural resources inventories and evaluations within the High ProbabilityAreas and implementing mitigation measures.Prior to initiating development and construction activities in High and Moderate Probability Areas (Table 3.10-5Development and Construction Activities in High and Moderate Probability Areas Discussion), it is recommendedthat intensive surveys of the High and Moderate Probability Areas be conducted and evaluations prepared todetermine which of those resources would be considered significant for the purposes of SEPA and listed in theWHR and/or the NRHP. Intensive surveys would provide economies of scale in evaluating each survey area, rather<strong>Draft</strong> | June 2013 3-140
GORST PLANNED ACTION EIS | AFFECTED ENVIRONMENT, SIGNIFICANT IMPACTS, AND MITIGATION MEASURESthan evaluation properties individually as they area directly affected by proposed activities. Knowledge of therelative importance of certain buildings and neighborhoods can inform the planning process. However, it isrecognized that some projects will take place before such surveys can be completed. The following impacts willaddress activity types that are known to have the potential to impact significant cultural resources (e.g.archaeological sites, historic built environment resources, TCPs). Projects proposed within High and ModerateProbability Areas that involves these activity types will be required to implement the associated mitigationmeasures in an attempt to reduce the impacts to a level of less than significant.Table 3.10-5Development and Construction Activities in High and Moderate Probability Areas DiscussionConstructionType of <strong>Impact</strong>Operations, Indirect, andCumulative <strong>Impact</strong>sAlternative 1<strong>Impact</strong> DiscussionTypical project impacts that could affect cultural resources in the Study Area includedemolition, removal, or substantial alteration of resources older than 50 years of age withoutconsideration of historic built environment, archaeological sites, and TCPs.Development could occur on or near parcels in the Study Area that contain previouslyidentified and/or unknown cultural resources. Development within parcels containingpreviously identified cultural resources will require further study to determine if the projecthas the potential to impact significant resources and if so, the appropriate mitigationmeasures. This development would likely include ground disturbance and modifications tobuildings and structures, which could result in potentially significant impact on culturalresources. Due to the potential to impact unknown cultural resources, a detailed review ofpotential impacts on cultural resources would be required on a project-specific basis for thoseprojects within the High and Moderate Probability Areas.Based on the information in Table 2-7 Growth Comparison by <strong>Gorst</strong> UGA Alternative, a total of approximately 41developable acres within the UGA have been identified under Alternative 1. In addition to these developableparcel acres, some land would be modified in existing or future rights of way or on lands for public purposesTherefore, in addition to future projects on already developed parcels, locations that currently do not supportdevelopment would likely be altered. Development and associated construction activities would result in grounddisturbance within 41 acres, and could contribute to increased disturbance to known and undocumentedarchaeological sites, historic built environment resources, and TCPs.Under this alternative, sand, gravel, and rock deposits would continue to be mined from the area identified withthe mineral resources overlay in Figure 3.1-1 <strong>Gorst</strong> Creek Watershed: Geology. There would be no additionalimpacts to cultural resources within the mining area because of the substantial ground disturbance that haspreviously occurred and the fact that the same activities will continue.Given that significant cultural resources are present within the Study Area, future development would have thepotential to impact these resources. It is assumed that under Alternative 1, future development projects wouldreceive the appropriate permits, and that buffers, development standards, and other mitigation measurespertaining to identifying and preserving significant cultural resources would be implemented.As the Watershed Characterization & Framework Plan would not be implemented under this alternative, therewould be no watershed-level plan for future development to assess specific impacts to cultural resources.Alternative 2A total of approximately 70 developable acres have been identified for Alternative 2. In addition to thesedevelopable parcel acres, some land would be modified in existing or future rights of way or on lands for publicpurposes. Therefore new development on currently undeveloped parcels has the potential to impact significantcultural resources on up to 70 acres, which is greater than that under Alternative 1. Additionally, small areas ofopen space and recreation would be maintained. Development and associated construction activities would result<strong>Draft</strong> | June 2013 3-141
GORST PLANNED ACTION EIS | AFFECTED ENVIRONMENT, SIGNIFICANT IMPACTS, AND MITIGATION MEASURESin ground disturbance within the proposed 70 acres, and could disturb known and undocumented archaeologicalsites, historic built environment resources, and TCPs.Under this alternative, the area that is currently used for mineral resource extraction would be developed intoMedium Density Residential with a mix of housing types. This area includes large existing mining areas that hasdrastically altered the landscape and affected the potential for intact archaeological resources to be present at thislocation. Therefore, construction activities in this area would have limited potential to encounter significantcultural resources.Given that significant cultural resources are present within the Study Area and several areas are High ProbabilityAreas have been identified, future development would have the potential to impact these resources. It is assumedthat under Alternative 2, future development projects would receive the appropriate permits, and that avoidance,development standards, and other mitigation measures pertaining to identifying and preserving significant culturalresources would be implemented.Alternative 3The area of developable land identified for Alternative 3 is approximately 69 acres, roughly the same as underAlternative 2, but greater than under Alternative 1. In addition to these developable parcel acres, some land wouldbe modified in existing or future rights of way or on lands for public purposes. This alternative includes the sameamount of open space as Alternative 2, as well as low intensity waterfront, which include High Probability Areas forsignificant cultural resources.Under this alternative, the area that is currently used for mineral resource extraction would be developed intoNeighborhood Mixed Use. This area includes large existing mining areas that has drastically altered the landscapeand affected the potential for intact archaeological resources to be present at this location. Therefore,construction activities in this area would have limited potential to encounter significant cultural resources.Given that significant cultural resources are present within the Study Area as well as the designation of severalareas as High Probability Areas; future development has the potential to impact these resources. It is assumed thatunder Alternative 3, future development projects would receive the appropriate permits, and that avoidance,development standards, and other mitigation measures pertaining to identifying and preserving significant culturalresources would be implemented.Mitigation MeasuresIncorporated Plan FeaturesThe <strong>Draft</strong> Watershed Characterization & Framework Plan proposes the following Guiding Principle and Policy:• Promote interpretive art, signage, and public spaces that recognize cultural history and environmentalfeatures• Celebrate cultural history in the watershed through interpretive displays and events. Protect sensitive culturalresources from disturbance.Applicable Regulations and CommitmentsFederal and state laws would apply as listed in the “Regulatory Context” above.Kitsap County and the City of Bremerton have adopted historic preservation regulations to promote a special taxvaluation to promote historic site rehabilitation and preservation and protect important archaeological andhistoric sites. Additional County and City regulations include:<strong>Draft</strong> | June 2013 3-142
GORST PLANNED ACTION EIS | AFFECTED ENVIRONMENT, SIGNIFICANT IMPACTS, AND MITIGATION MEASURES• Kitsap County recently approved (January 2013) a shoreline master program undergoing Ecology review. Itincludes several measures designed to protect cultural resources including that “all Tribal Historic PreservationOfficers (THPOs) for tribes with jurisdiction will be provided the opportunity to review and comment on alldevelopment proposals in the Kitsap County shoreline jurisdiction, both terrestrial and aquatic, in order toensure all known or potential archaeological sites, Traditional Cultural Properties and Traditional CulturalLandscapes are acknowledged, properly surveyed and adequately protected.” In addition, “sites with knownor potential archaeological resources, as determined pursuant to the resources listed at the beginning of thissection, shall require a site inspection by a professional archaeologist” and “work on sites with identifiedarchaeological resources shall not re-commence until authorized by the Department of Archaeology andHistoric Preservation through an Archaeological Excavation and Removal Permit, which may conditiondevelopment permits.”• KCC 18.12.020, Eligible lands. The Open Space Act (Chapter 84.34 RCW) describes lands which may beconsidered for current use assessment as open space. Kitsap County has refined this definition to a prioritizedlist of lands which may be eligible for enrollment in the open space taxation program within theunincorporated area of Kitsap County. Kitsap County provides for the preservation of any land area, thepreservation of which in its present use would preserve historic sites.• Bremerton has recently adopted a Shoreline Master Program that would when approved by Ecology includeseveral protective measures including “a site assessment by a qualified professional archaeologist or historicpreservation professional and ensure review by qualified parties including the Washington State Departmentof Archaeology and Historic Preservation, and the Suquamish Tribe Archaeology and Historic PreservationProgram” for properties with known cultural resources and “stop work” orders on any newly discoveredcultural features with a requirement for notification of the State and tribes and an assessment.Other Potential Mitigation MeasuresA cultural resources study should be conducted at the applicant’s expense for specific projects within HighProbability Areas (Table 3.10-6 Mitigation Measures) to determine if archaeological sites, TCPs, or historic builtenvironment resources are present that may be significant. This should include but is not limited to backgroundresearch, consultation with appropriate Tribes and interested parties, field study, and reporting. A desktop reviewof existing background information regarding cultural resources should be conducted at a minimum for projectswithin Moderate Probability Areas to determine if resources older than 50 years are present requiring evaluationand/or additional field studies. Table 3.10-6 Cultural Resources Mitigation Measures identifies the potentialmitigation measures for significant cultural resources and when they should be completed.Table 3.10-6Cultural Resources Mitigation MeasuresMitigation Measure DescriptionA. For future projects that are qualified as planned actions and that involve,development, ground disturbance, and/or construction in the Study Area in areasshown as high or moderate probability on the predictive model map in Figure3.10-1 <strong>Gorst</strong> Creek Watershed: Cultural Resources Probability, Kitsap County orCity of Bremerton should determine if cultural resources are located in thespecific project area (at the applicant’s expense). This should consist ofbackground research, a field visit (particularly for High Probability Areas), andconsultation with the Department of Archaeology and Historic Preservation(DAHP) and the Tribes to determine if cultural resources (sites, buildings, TCPs)are located within the project area. The following provides guidance for qualifiedplanned action activities requiring land use, construction, or building permitsfrom Kitsap County or City of Bremerton and located within high or moderateprobability areas:TimingPrior to Construction<strong>Draft</strong> | June 2013 3-143
GORST PLANNED ACTION EIS | AFFECTED ENVIRONMENT, SIGNIFICANT IMPACTS, AND MITIGATION MEASURESMitigation Measure Descriptioni. Areas with prior negative archaeological survey, no ground disturbance,or in 100 percent culturally-sterile fill: 1) document reason no survey isrequired; 2) require no further review.ii. For all ground-disturbing projects not addressed in “i” above: 1) consultstatewide predictive model and tribal predictive model; 2) provide tribalnotification; 3) if no known cultural resources are present, conditionpermit with standard inadvertent discovery language; 4) if knowncultural resources are present, provide state and tribal notification,conduct survey; 5) In the event that a proposed project would disturban archaeological resource, the responsible local government shallimpose any and all measures to avoid or substantially lessen the impact;6) if avoidance of the archaeological resource is not possible, anappropriate research design/treatment program must be designed andimplemented with data recovery to occur prior to project relatedground disturbance; 7) the avoidance of archaeological resourcesthrough selected of project alternatives and changes in design to avoidthe archaeological resource would eliminate the need for measuring ormitigating impacts.B. In the event that a proposed development location within the Study Areacontains a building or structure at least 45 years of age that is not listed in theWHR or the NRHP, the project shall be required to undergo a review to determineif the building/structure is considered eligible for listing on the State or NationalRegisters. If impacts cannot be avoided on a historic resource that is determinedeligible for listing on either state or national historic registers, the responsiblelocal government is required to consult with DAHP about mitigation options.C. If human skeletal remains are encountered during construction, thecontractor/project proponent will stop work and the Kitsap County Sheriff, DAHP,and the necessary Tribes will be contacted immediately.D. If archaeological resources are encountered during construction, work must stopuntil state and tribal notifications are made and until a qualified archaeologist canassess the discovery and implement mitigation if necessary.TimingPrior to ConstructionDuring ConstructionDuring Construction• Kitsap County and the City of Bremerton in coordination with the Suquamish Tribe could periodically conducteducational activities with residents and businesses regarding the importance of cultural resources, how toavoid impacts, and what to do in cases of inadvertent discovery. Such educational activities could promotevoluntary notification to the local government and tribe of activities exempt from SEPA or the planned action,but which may result in ground disturbance (e.g. fences, gardening, etc.).Significant Unavoidable Adverse <strong>Impact</strong>sThe impacts on cultural resources caused by new development associated with all studied alternatives could besignificant and unavoidable, depending on the nature and proximity of the proposed development project.Implementation of mitigation measures would identify potential impacts on cultural resources and reduce them toa less than significant level (Table 3.10-6 Cultural Resources Mitigation Measures).<strong>Draft</strong> | June 2013 3-144
GORST PLANNED ACTION EIS | AFFECTED ENVIRONMENT, SIGNIFICANT IMPACTS, AND MITIGATION MEASURES3.11 TransportationCumulatively, the study area transportation system has been addressed in the following EISs, for which thetransportation analysis is incorporated by reference:• SKIA Subarea Plan and <strong>Planned</strong> <strong>Action</strong> August 2012. A small portion of the SKIA area lies in the watershed.• UGA Sizing and Composition Remand Final EIS August 2012. This EIS addressed eight UGAs including the <strong>Gorst</strong>UGA as well as a cumulative analysis countywide including South County.To the extent relevant, this transportation analysis updates the Kitsap County transportation analysis reflecting thelower employment growth adopted in the City of Bremerton’s SKIA Subarea Plan. It tests the differences in thegrowth in the <strong>Gorst</strong> UGA, which is the focus of land use changes under consideration in the <strong>Gorst</strong> Subarea Plan.Affected EnvironmentWatershedThe primary arterial network roadways in the Watershed include State Route 3, West Belfair Valley Road, SW OldClifton Road, and Sunnyslope Road SE. See Figure 3.11-1 <strong>Gorst</strong> Creek Watershed: Existing Roadway Inventory. Thefocus of future land use changes is in the <strong>Gorst</strong> UGA, The affected environment related to transportation isdiscussed in the <strong>Gorst</strong> UGA section.<strong>Gorst</strong> UGAThe affected environment related to transportation in the <strong>Gorst</strong> UGA includes state highways, Kitsap Countyrights-of-way, state interchanges and bridges, bikeways and trails, public transportation facilities and services, andDepartment of Defense railroad. In addition marine ports, ferries, and airports located outside of the <strong>Gorst</strong> UGAare considered key transportation facilities. The State, County, and special districts share jurisdiction over thesefacilities.This section discusses existing conditions relating to transportation in the <strong>Gorst</strong> UGA, including state and localregulations and policies; inventory of transportation infrastructure and services, including roadway, transit, nonmotorized,rail, air, and ferry; and existing operational conditions of the transportation system.Planning ContextWashington GMAGMA provides direction regarding preparation of the transportation chapter of the Comprehensive Plan. The GMArequires a transportation chapter to be consistent with the land use chapter of the comprehensive plan, ascodified in RCW 36.70A.070 (6). <strong>Planned</strong> land use must be reflected in the travel forecasts that are prepared toevaluate the impacts of development. The transportation improvements and implementation measures in thetransportation chapter must adequately support planned land use at adopted LOS standards.<strong>Draft</strong> | June 2013 3-145
THIS PAGE INTENTIONALLY BLANK
Lake UnionReservoirBremertonHeinsCreekUnnamed Stream1227493475317West Sherman Heights Road Bremerton West UJarstad CreekSam Christopherson Ave. W<strong>Gorst</strong> UGAUnnamed Stream 1227399475259kPath: P:\ENV\PROJECTSW\60271862 <strong>Gorst</strong> Subarea Plan\400 Technical Information\423 GIS\3_MXDs\EIS Figures\Existing Roadway Map.mxdTwinLakesUnion RiverSKIA UGASKIA UGASTATE HWY 3 SWGold MountainGolf ClubBremertonNationalAirport<strong>Gorst</strong>CreekUnnamed Stream1227418475110SW OLD CLIFTON RDSKIA UGAW BELFAIR VALLEY RDParish Creek<strong>Gorst</strong>Creek 16616 16 16Bremerton 3 ULID6Unnamed Stream 1227181475299 3 16ULID6ULID6SW OLD CLIFTON RD¯0<strong>Gorst</strong> Tributary 1Unnamed Stream 1226919475271Port OrchardUnnamed Stream 12268244752300.5 1 MilesSinclairInletPort OrchAndersonCreekBlackjack Creek
THIS PAGE INTENTIONALLY BLANK
GORST PLANNED ACTION EIS | AFFECTED ENVIRONMENT, SIGNIFICANT IMPACTS, AND MITIGATION MEASURESAs described in WAC 365-196-430, a transportation chapter must specifically present the following information:• Land use assumptions used in estimating travel• Estimated traffic impacts to state-owned transportation facilities resulting from land use assumptions• Inventory of air, water, and ground transportation facilities and services, including transit alignments andgeneral aviation airports facilities• LOS standards for all locally owned arterials and transit routes, and actions necessary to allow transportationfacilities and services to meet the standards• For state-owned transportation facilities, LOS standards for highways to gauge the performance of the system• Specific actions and requirements for bringing into compliance locally owned transportation facilities that arebelow an established LOS standard• Forecasts of traffic for at least ten years based on the adopted land use plan• Identification of state and local transportation system needs to meet current and future travel demand• An analysis of funding capability to judge needs against probable funding resources• A multi-year financing plan based on the needs identified in the comprehensive plan• If probable funding falls short of meeting identified needs, a discussion of how additional funding will beraised, or how land use assumptions will be reassessed to ensure that LOS standards will be met• Intergovernmental coordination and impact assessment• Strategies for reducing travel demand• Pedestrian and bicycle component• Consistency between the transportation element, six-year plan for cities, counties, public transportationsystems, and the ten-year plan for the stateBoth the County and City of Bremerton have adopted transportation elements and capital facility plans that mayrequire amendment or adjustment to incorporate the results of the <strong>Gorst</strong> Subarea Planning process.Transportation Facilities and Services of Statewide SignificanceTransportation related issues of growth management planning in Washington are further addressed through RCW47.06.140. The Washington State Legislature declares a number of transportation facilities and services to be ofstatewide significance, including Highways of statewide significance (in <strong>Gorst</strong>, this includes SR 3 and SR 16) asdesignated by the legislature under Chapter 47.05 RCW, the interstate highway system, interregional stateprincipal arterials including and ferry connections that serve statewide travel. This legislation further declares thatthe state shall plan for improvements to transportation facilities and services of statewide significance in thestatewide multimodal transportation plan in cooperation with regional transportation planning organizations,counties, cities, transit agencies, public ports, private railroad operators, and private transportation providers, asappropriate.Furthermore, the department of transportation, in consultation with local governments, shall set LOS standards forstate highways and state ferry routes of statewide significance. Although local governments will be consultedwhen setting LOS standards, the department retains authority to make final decisions regarding LOS standards forstate highways and state ferry routes of statewide significance. In establishing these levels of service standards,the department will consider the necessary balance between providing for the free inter-jurisdictional movementof people and goods and the needs of local communities using the facilities.<strong>Draft</strong> | June 2013 3-149
GORST PLANNED ACTION EIS | AFFECTED ENVIRONMENT, SIGNIFICANT IMPACTS, AND MITIGATION MEASURESWashington Transportation Plan (WTP)The WTP 2007-2026 fulfills the requirements for both state multi-modal and federal long-range plan requirements.WTP 2007-2026, developed collaboratively by the Washington State Transportation Commission and the WSDOT,outlines transportation goals and objectives for Washington State. It offers policy guidance for all jurisdictionsstatewide on matters related to the transportation system over the next 20 years. The WTP provides a blueprintand strategies to guide decisions and investments needed to develop Washington’s transportation system to servethe future needs of its citizens, communities, and economy while safeguarding its environment. The core principleof the investment guidelines is that the existing system cannot be allowed to deteriorate. The plan identifies thetop transportation investment priorities for the entire state in the areas of preservation, safety, economic vitality,mobility, and environmental quality and health. It addresses all modes of Washington’s transportation system:roadways, ferries, public transportation, aviation, freight rail, passenger rail, marine ports and navigation, bicyclesand pedestrians.The Washington State Transportation Commission developed the WTP 2030 at the direction of the StateLegislature. It is the overarching state policy framework intended to provide policy guidance and recommendationsacross all transportation modes and regions in the state. WTP 2030 serves as the policy update to the federallycompliant WTP 2007-2026, reflecting recent changes and new challenges.The WTP addresses the roles of WSDOT, regional planning organizations, local jurisdictions, and Tribalgovernments in Washington State. The WTP is required by state and federal law to be regularly updated. UnderGMA, the Kitsap County Transportation Chapter must assess the impact of future land use on state transportationfacilities, and must be consistent with the WTP.Regional PlanningPSRC – Transportation 2040Transportation 2040, adopted by the PSRC in 2010, is the long-range transportation plan for the central PugetSound region of Washington State, which comprises King, Pierce, Snohomish, and Kitsap Counties. The planoutlines a long-term template for how the region should invest in transportation to accommodate rising traveldemand, while at the same time embracing the need to be flexible and responsive to change. Transportation 2040identifies investments to support the region’s expected growth and improve transportation service to people andbusinesses, includes a financing plan that suggests a long-term shift in how we fund transportation improvementswith more reliance on users paying for transportation improvements, and proposes a strategy for reducingtransportation’s contribution to climate change and its impact on regional concerns such as air pollution and thehealth of Puget Sound.Built upon the foundation of Vision 2040, Transportation 2040 establishes three integrated and sustainablestrategies: congestion and mobility, environment, and funding. These strategies guide transportation investmentdecisions to meet growing travel needs for people and freight, with more transit, more biking and walkingfacilities, more ferries, and more complete roadways. Within these strategies, the plan identifies four majorcategories of investment: preservation, maintenance and operations, safety and security, efficiency, and strategiccapacity.Transportation 2040 supports Vision 2040’s Regional Growth Strategy. A fundamental goal of Vision 2040 is tofocus growth (people and jobs) in urban areas in a way that improves transportation efficiency, increases the useof transit, biking, and walking, and improves the balance between jobs and housing. Transportation 2040 supportsfocusing approximately 97 percent of growth within designated UGAs, and to more than double currentdevelopment in designated regional growth centers by 2040. It outlines specific projects to support the growthstrategy.The PSRC is responsible for allocating federal transportation funding to local jurisdictions, as well as certification oflocal transportation chapters within the four-county region.<strong>Draft</strong> | June 2013 3-150
GORST PLANNED ACTION EIS | AFFECTED ENVIRONMENT, SIGNIFICANT IMPACTS, AND MITIGATION MEASURESThe Transportation 2040 plan does recognize operational shortcomings within the <strong>Gorst</strong> UGA and includes somemidterm and long projects associated with improvements to SR 3 and the interchange of SR3 and SR 16.Countywide Planning Policies (CPP)KRCC is the local council of governments for Kitsap County; the Cities of Bremerton, Bainbridge Island, PortOrchard, and Poulsbo; the Port of Bremerton; and the Suquamish and Port Gamble/S’Klallam Tribes. The KRCC isresponsible for: maintaining and updating Kitsap CPP; allocating federal transportation funding; 2060 Low IncomeHousing Program grants; Community Development Block Grant funding; and facilitating intraregional andinterregional coordination. The Council’s Board is composed of elected officials from Kitsap County, cities locatedwithin the county, Tribes located within the county, and the Port of Bremerton.CPP, which were developed by the KRCC and adopted in 2011, support the following stated goals.• Optimize and manage the safe use of transportation facilities and services.• Reduce the rate of growth in auto traffic, including the number of vehicle trips, the number of miles traveled,and length of vehicle trips taken, for both commute and non-commute trips.• Minimize the environmental impacts of transportation facilities and improvements.• Recognize differences in density, character, and development patterns throughout the county.• Support transit and pedestrian travel appropriate to each type of urban and rural development.• Create multimodal transportation linkages between designated local and regional centers.• Identify preferred routes for freight movement and support compatible land uses along those routes.• Facilitate inter-jurisdictional coordination.• Coordinate intra-county transportation planning efforts.• Provide coordinated and consistent LOS standards.Kitsap County Comprehensive Plan Transportation ChapterThe Kitsap County Comprehensive Plan Transportation Chapter is the County’s long-range transportation planningdocument, which satisfies the requirements of GMA and defines the transportation policies, methods, andpriorities for the County transportation system over a 20-year planning period. The Transportation Chapter isguided by the countywide transportation planning policies, as described in the previous section. The collectiveanalysis in the County’s integrated Comprehensive Plan/EIS and CFP, meets the content requirements of GMA andother guiding laws and rules, and includes an inventory of transportation infrastructure and services within thecounty; establishes operational standards; provides analysis methods and results for operations of thetransportation system; and provides a financially balanced transportation improvement plan to ensure that thetransportation system is adequate to support the long-range land use plan.Bremerton Comprehensive Plan Transportation ChapterThe City of Bremerton Comprehensive Plan Transportation Element is the City of Bremerton’s long-rangetransportation planning document, which satisfies the requirements of GMA and defines the transportationpolicies, methods, and priorities for the City of Bremerton’s transportation system. The Transportation Elementprimarily supports the Land Use Element of the Comprehensive Plan but also complements each of the other planelements. The Transportation element emphasizes the need to consider pedestrians and bicycles in transportationplanning as well as working toward setting standards on heavily used arterials to enable mobility. TheTransportation Element establishes LOS Criteria, documents existing deficiencies, discusses future conditions andassociated deficiencies and provides proposed transportation improvements and costs.<strong>Draft</strong> | June 2013 3-151
GORST PLANNED ACTION EIS | AFFECTED ENVIRONMENT, SIGNIFICANT IMPACTS, AND MITIGATION MEASURESHighways and RoadwaysState HighwaysThe <strong>Gorst</strong> UGA is served by two state highways that provide access to and serve mobility needs within and beyondthe county. The two major state highways that connect to Kitsap County from the Puget Sound region are SR 16,which connects to Pierce County, and SR 3, which connects to Mason County and the Olympic peninsula.At the community of <strong>Gorst</strong>, SR 16 connects with SR 3. SR 3 continues north through Kitsap County to the HoodCanal Bridge and south to Shelton. Just north of the <strong>Gorst</strong> UGA boundary, SR 304 connects to SR 3 providing a linkfrom SR 3 to downtown Bremerton and the Bremerton to Seattle Ferry. To the south of the <strong>Gorst</strong> UGA boundary,SR 3 provides access to the SKIA and the Bremerton National Airport.Highways of Statewide SignificanceIn 1998, Highway of Statewide Significance (HSS) legislation was passed by the Washington State Legislature andcodified as RCW 47.06.140. HSS facilities are those highways that promote and maintain significant statewidetravel and economic linkages. The legislation emphasizes that these significant facilities should be planned from astatewide perspective. Local jurisdictions will assess the effects of local land use plans on state facilities. HSSfacilities located in whole or in part within the <strong>Gorst</strong> UGA are listed below:• SR 3–US 101 (Shelton) to SR 104 (Hood Canal Bridge).• SR 16–I-5 (Tacoma) to SR 3 (<strong>Gorst</strong>).National Highway System (NHS)The NHS is one component of the national transportation system, defined as part of the federal Intermodal SurfaceTransportation Efficiency Act, which was the precursor to Transportation Equality Act for the 21-Century (TEA-21)and Safe, Accountable, Flexible, Efficient Transportation Equity Act: A Legacy for Users (SAFETEA-LU). The purposeof the NHS is to focus resources on roadways that are most important to interstate travel and national defense,that connect other modes of transportation, and that are essential for international commerce. The entireinterstate highway system is part of the NHS, which also includes a large percentage of urban and rural principalarterials, the defense-strategic highway network, and other strategic highway connectors. Both of the highways inthe <strong>Gorst</strong> UGA are part of the NHS.Functional ClassificationsClassifying roadways by their function helps in system planning, maintenance, and operations. The classificationsystem is used in day-to-day decisions and long range planning for land use and transportation purposes. Allroadways exist to serve two functions: mobility and land access. Mobility refers to the movement of vehicles orpeople at a reasonable speed. Access refers to the ability to get on the roadway, and includes features such asdriveways, parking, and loading areas on the street. At times, these functions conflict with each other.To minimize these conflicts, a system of classifying arterials, collectors, and local streets has been established.Functional classifications are based on the following characteristics:• Average trip lengths.• Traffic characteristics such as volumes, design, and posted speeds.• Roadway design characteristics such as right-of-way requirements, number of travel lanes, lane widths,shoulder widths, medians, sidewalks, and turn lanes.• System continuity.• Degree of access control.• Operations, including parking and signal systems.<strong>Draft</strong> | June 2013 3-152
GORST PLANNED ACTION EIS | AFFECTED ENVIRONMENT, SIGNIFICANT IMPACTS, AND MITIGATION MEASURES• Ability to serve other travel modes, including buses, bicycles, pedestrians, and equestrians.• Reasonable spacing, depending on population density.• Directness of travel and distance between points of economic importance.• Connection of population centers.Both the County and the City of Bremerton use the Federal Functional Classification (FFC) system fortransportation systems planning, financial planning and administrations, and developing design criteria andstandards for County and private sector roadway improvements.• Transportation Systems Planning. Functional classification is a tool for building a transportation system thatserves all types of travel needs. It helps in setting priorities and making evaluations for improvement projects.It helps jurisdictions to coordinate their approaches to the transportation system, and it affects land useplanning and zoning decisions.• Financial Planning and Administration. The classification system also helps in the allocation of funds fortransportation system improvements and maintenance like Moving Ahead for Progress in the 21st Century(MAP-21), Surface Transportation Program (STP) [Urban and Rural], and the Washington State Urban ArterialBoard (UAB) fund, are reserved for specific types of facilities. WSDOT distributes Federal Aid highway funds tocities and counties in the state. The classification system is used to determine which roads are eligible forcertain state and federal funds.• Design Issues. The County has developed an extensive set of road design standards by functional classification.These standards guide the design of improvements for individual County roads. They also are used in thereview of land development proposals to determine infrastructure requirements (e.g., right-of way, pavement,and sidewalk requirements) for both on- and offsite roads. The standards, used with the functionalclassification system, are especially useful for longer-range planning, helping to make sure that enough land isset aside for roadways in developing areas.Table 3.11-1 Federal Functional Classifications explains the various federal functional classifications of roadwayswithin the <strong>Gorst</strong> UGA. The table describes the primary access and mobility functions for each major classification.Each classification is also further designated as “Urban” or “Rural”.FunctionalClassificationFreewayPrincipal ArterialMinor ArterialTable 3.11-1Federal Functional ClassificationsDescriptionA freeway is a multilane, high-speed, high-capacity roadway intended exclusively formotorized traffic. All access is controlled by interchanges and road crossings are gradeseparated.The freeways in the <strong>Gorst</strong> UGA are under the jurisdiction of WSDOT.Principal arterials primarily serve a mobility function, and typically have either full or semicontrolledaccess. Principal arterials provide for movement between urban and rural intracountypopulation centers. As such, this roadway facility classification predominantly serves"through" traffic with minimum direct service to abutting land uses. Principal arterialsprovide routes for public transit systems between major communities within the county.Minor arterials provide access to the principal arterial and freeway systems. They provide alower level of travel mobility than principal arterials to major communities within thecounty. They provide primary access to or through communities of high-density residential,commercial or retail, or industrial land areas. They provide access to abutting properties atpredetermined locations. Trip lengths on minor arterials generally exceed 5 miles. Minorarterials provide routes for public transit systems between major communities within thecounty.<strong>Draft</strong> | June 2013 3-153
GORST PLANNED ACTION EIS | AFFECTED ENVIRONMENT, SIGNIFICANT IMPACTS, AND MITIGATION MEASURESFunctionalClassificationMajor CollectorMinor CollectorLocalDescriptionMajor collectors provide the primary access to a minor arterial for one or moreneighborhoods or non-residential areas. Collectors distribute trips to and from the arterialsystem. They provide a limited amount of travel through neighborhoods and non-residentialareas that originates and terminates externally. Collectors provide direct connections tolocal roads and minor collectors. They provide collection and distribution routes for publictransit systems. The basic trip length is generally between 2 and 10 miles.Minor collectors provide direct access to local roads and driveway access points to abuttingproperties. They provide for internal distribution of trips within a neighborhood or nonresidentialarea, or part of a neighborhood or non-residential area. Minor collectors containa limited amount of through traffic; traffic is primarily local in nature.A local access street provides access immediately to adjacent properties. Characteristics oflocal streets include: low traffic volumes, maximum of two travel lanes, no medians, noshoulders, no access control, and no preference at signals. Sidewalks and parking may bepermitted. Local streets should connect local properties to minor collector streets and, inturn, to higher-class facilities. Fixed bus service is generally not provided along local streets.Source: Kitsap County Public Works Department 2001County Roadway InventoryWithin the <strong>Gorst</strong> UGA there are a number of short local roadways that essentially provide access to the variousresidential developments within the area. These local roadways feed directly into the state highways or into othercounty roadways. Outside of the state highways there are four main roadways that provide the majority of theaccess to the <strong>Gorst</strong> UGA.W. Belfair Valley RoadW. Belfair Valley Road is a two lane roadway that is classified as an Urban Minor Arterial in the vicinity of theintersection with Sam Christopherson Avenue. The classification of this roadway changes to a rural major collectoras the roadway proceeds west out of the <strong>Gorst</strong> UGA. W. Belfair road provides an alternative route to the town ofBelfair that is located southwest of <strong>Gorst</strong> on SR 3. W Belfair Road begins at SR 3 just north of the SR 3/SR 16intersection and heads southwest toward the town of Belfair. This roadway generally parallels SR 3 and is a viablealternative route to SR 3 from the <strong>Gorst</strong> UGA to BelfairSherman Heights RoadSherman Heights Road is a two lane roadway that is classified as a local roadway. This road connects to W BelfairValley Road north of the intersection of SR 3 and SR 16 and continues north generally paralleling SR 3. ShermanHeights Road provides the local access to the existing quarry area. North of the <strong>Gorst</strong> UGA Sherman Heights Roadconnects with a series of local roadways and eventually connects to Werner Road. There is an existing interchangeat SR 3 and Werner Road/W. Loxie Eagans Blvd. Sherman Heights Road and the other local roadway provide aconnection from the City of Bremerton and SR 3 to the <strong>Gorst</strong> UGA that does not require travelling on the heavilytravelled SR 3 corridor.Sam Christopherson AvenueSam Christopherson Avenue is a relatively short two lane local roadway with provides an important connectionbetween W. Belfair Valley Road and SR 3/ SR 16 west of the SR 3/SR 16 intersection. Sam Christopherson Avenue isthe primary connection from the northwest portion of the <strong>Gorst</strong> UGA to both SR 3 and SR 16.Feigley RoadFeigley Road is a two lane local roadway that provides access to SR 16 and SR 3 from the south east portion of<strong>Gorst</strong> UGA. This roadway primarily serves the existing residences in the southern portion of the UGA.<strong>Draft</strong> | June 2013 3-154
GORST PLANNED ACTION EIS | AFFECTED ENVIRONMENT, SIGNIFICANT IMPACTS, AND MITIGATION MEASURESRoadway LOSLOS designations are qualitative measures of congestion that describe operational conditions within a trafficstream and take into consideration such factors as volume, speed, travel time, and delay. LOS is represented byletter grades A through F. LOS A through C imply traffic flows with minimal delay, while LOS D and E implyconditions that approach capacity, and LOS F implies unstable flow with potential for substantial delays(Transportation Research Board 2000). The characteristics of the six LOS designations for roadway segments andintersections are summarized in Table 3.11-2 LOS Descriptions. The LOS scale has been adopted by the Institute ofTransportation Engineers, the Transportation Research Board, and by most jurisdictions throughout the country.Methods applied to calculate LOS for roadway segments and intersections is described later in this chapter inMethodology.ABCDETable 3.11-2LOS DescriptionsLOS Roadways IntersectionsDescribes primarily free-flow operations ataverage travel speeds, usually about 90percent of the free-flow speed for the arterialclass. Vehicles are completely unimpeded intheir ability to maneuver within the trafficstream. Stopped delay at signalizedintersections is minimal.Represents reasonably unimpeded operationsat average travel speeds, usually about 70percent of the free-flow speed for the arterialclass. The ability to maneuver within the trafficstream is only slightly restricted and stoppeddelays are not bothersome. Drivers are notgenerally subjected to appreciable tension.Represents stable conditions; however, abilityto maneuver and change lanes in mid-blocklocation may be more restricted than at LOS B,and longer queues and/or adverse signalcoordination may contribute to lower averagetravel speeds of about 50 percent of theaverage free-flow speed for the arterial class.Motorists will experience appreciable tensionwhile driving.Borders on a range in which small increases inflow may cause substantial increases inapproach delay and, hence, decreases inarterial speed. This may be due to adversesignal progression, inappropriate signal timing,high volumes, or some combination of these.Average travel speeds are about 40 percent offree-flow speed.Characterized by significant approach delaysand average travel speeds of one-third thefree-flow speed or lower. Such operations arecaused by some combination of adverseprogression, high signal density, extensivequeuing at critical intersections, andinappropriate signal timing.Describes operations with low control delay, up to 10seconds per vehicle (s/veh). This LOS occurs whenprogression is extremely favorable and most vehiclesarrive during the green phase. Many vehicles do notstop at all. Short cycle lengths may tend to contributeto low delay values.Describes operations with control delay greater than10 and up to 20 s/veh. This level generally occurs withgood progression, short cycle lengths, or both. Morevehicles stop than at LOS A, causing higher levels ofdelay.Describes operations with control delay greater than20 and up to 35 s/veh. These higher delays may resultfrom only fair progression, longer cycle lengths, orboth. Individual cycle failures may begin to appear atthis level. Cycle failure occurs when a given greenphase does not serve queued vehicles, and overflowsoccur. The number of vehicles stopping is significant atthis level, though many still pass through theintersection without stopping.Describes operations with control delay greater than35 and up to 55 s/veh. At LOS D, the influence ofcongestion becomes more noticeable. Longer delaysmay result from some combination of unfavorableprogression, long cycle lengths, and high vehicle-tocapacity(V/C) ratios. Many vehicles stop, and theproportion of vehicles not stopping declines. Individualcycle failures are noticeableDescribes operations with control delay greater than55 and up to 80 s/veh. These high delay valuesgenerally indicate poor progression, long cycle lengths,and high V/C ratios. Individual cycle failures arefrequent.<strong>Draft</strong> | June 2013 3-155
GORST PLANNED ACTION EIS | AFFECTED ENVIRONMENT, SIGNIFICANT IMPACTS, AND MITIGATION MEASURESLOS Roadways IntersectionsFSource: TRB 2000LOS StandardsCharacterizes arterial flow at extremely lowspeeds below one-third to one-quarter of thefree-flow speed. Intersection congestion islikely at critical signalized locations, withresultant high approach delays. Adverseprogression is frequently a contributor to thiscondition.Describes operations with control delay in excess of 80s/veh. This level, considered unacceptable to mostdrivers, often occurs with over saturation—that is,when arrival flow rates exceed the capacity of lanegroups. It may also occur at high V/C ratios with manyindividual cycle failures. Poor progression and longcycle lengths may also contribute significantly to highdelay levels.LOS standards are used to evaluate the transportation impacts of long-term growth and to ensure concurrency.Jurisdictions must adopt standards by which the minimum acceptable roadway operating conditions aredetermined and deficiencies may be identified.LOS standards for county arterials and state highways in Kitsap County involve three different policy approachesestablished by Kitsap County, and WSDOT. While somewhat diverse in application, all the standards andmethodologies are consistent with the Highway Capacity Manual (Transportation Research Board 2010) definitionsand procedures.County Roadways Kitsap County’s LOS policy generally recognizes that urban areas are likely to have morecongestion than rural areas. This reflects the different characteristics of land use and transportation in these areas.For purposes of defining LOS standards, all roadways within the <strong>Gorst</strong> UGA are considered urban.In rural areas, the system of major roads must have sufficient access to the abutting land uses, but because of thelow level of land development, rural roads have small capacity requirements. In contrast, urban areas typicallyattract and generate high volumes of traffic. In order to facilitate through traffic and minimize congestion, majorroads may have limited access to adjacent land uses while the more minor roads serve as access points to thesurrounding development. The increased density and activity in an urban area inherently results in higher levels ofcongestion. Drivers are aware of the differences in land use between urban and non-urban areas and generally aremore tolerant of congestion and the associated lower LOS in urban areas than in rural areas.The LOS standards shown in Table 3.11-3 Roadway Capacity/Congestion LOS Standards are based on the locationand functional classification of the roadway facilities to which they apply. Kitsap County uses traditionalengineering methodology to evaluate LOS of roadway segments, which are sections of roadway located betweenmajor intersections. LOS is based on the <strong>Volume</strong>-to-Capacity Ratio (V/C), which is calculated by dividing the trafficvolume on a roadway by the roadway’s vehicle capacity. LOS methodologies are described in further detail in theMethodology section of this chapter.<strong>Draft</strong> | June 2013 3-156
GORST PLANNED ACTION EIS | AFFECTED ENVIRONMENT, SIGNIFICANT IMPACTS, AND MITIGATION MEASURESFunctional ClassificationTable 3.11-3Roadway Capacity/Congestion LOS StandardsMaximum V/C Ratio/LOS StandardUrban 1 Rural 2Principal Arterial 0.89/D 0.79/CMinor Arterial 0.89/D 0.79/CCollector 0.89/D 0.79/CMinor Collector 0.89/D 0.79/CResidential/Local 0.79/C 0.79/CNote:1 Urban area is located within UGA boundaries.2Rural area is located outside UGA boundaries.Source: Kitsap County Public Works Department 2003City of Bremerton Roadways LOS standards are as follows: V=<strong>Volume</strong> and C= capacity.• Maintain LOS E or better (v/C less than or equal to 1.0) in the SR 303 (Warren/Wheaton) corridor, Kitsap way(SR 310), Sylvan Way, and the Manette Bridge.• Maintain LOS D or better (V/C less than or equal to 0.9) on all other arterial streets in the City of Bremerton.WSDOT Standards for HSS Facilities WSDOT sets LOS standards for use in evaluating the performance of HSSfacilities based on RCW 47.06.140 (2), which in the <strong>Gorst</strong> UGA consist of all or portions of SR 3, and SR 16.Table 3.11-4 LOS Standards for Highways of Statewide Significance presents the congestion indices for urban andrural highways (freeway and arterial types) that equate to an urban LOS D and a rural LOS C for peak-hour travel.UrbanTable 3.11-4LOS Standards for Highways of Statewide SignificanceArea / Facility Type LOS Congestion IndexFreeway D 10Arterial D 10RuralFreeway C 6Arterial C 6Source: WSDOT 2010The HSS standards make a distinction between urban and rural areas. For urban areas, the standard is LOS D,whereas the standard is LOS C in rural areas. Urban/Rural designation is based upon the federal urban area ratherthan by UGA.Concurrency Management SystemKitsap County - GMA requires that Kitsap County adopt and enforce ordinances that prohibit developmentapproval if the development causes the LOS on a transportation facility to decline below the standards adopted inthe transportation chapter of the Comprehensive Plan, unless transportation improvements or strategies toaccommodate the impacts of development are made concurrent with the development. This requirement,commonly referred to as concurrency, is described in WAC 365-196-840. Concurrency means that transportationinfrastructure and services must be adequate to support land use, with adequacy defined by locally adopted<strong>Draft</strong> | June 2013 3-157
GORST PLANNED ACTION EIS | AFFECTED ENVIRONMENT, SIGNIFICANT IMPACTS, AND MITIGATION MEASURESstandards. Under GMA, transportation improvements needed to maintain concurrency must be in place within sixyears of the time that the need for those improvements is triggered by new development.The purposes of concurrency management are summarized below.• Provide adequate levels of service on transportation facilities for existing uses, as well as new development inthe <strong>Gorst</strong> UGA.• Provide adequate transportation facilities that achieve and maintain County LOS standards as provided in the<strong>Gorst</strong> Sub Area plan.• Ensure that County LOS standards are maintained as new development occurs, as mandated by theconcurrency requirements of the GMA.The Kitsap County Concurrency Ordinance, codified in KCC Chapter 20.04, establishes a process for testing whethera development project meets concurrency. As established by the ordinance, concurrency is satisfied if no morethan 15 percent of county road lane-miles exceed LOS standards.By adopting an area-wide standard, the County acknowledges the fact that not every roadway facility or link in thenetwork will meet the adopted facility LOS standards all the time. Measures of area-wide concurrency areconducted periodically, such as during updates of the comprehensive plan, for sub-area planning, and whencorridor studies are conducted.The 15 percent allowance relates to individual development proposals undergoing a concurrency test. If LOS isequal to or better than the adopted standard, the concurrency test is passed, and an applicant is issued a CapacityReservation Certificate. For purposes of concurrency determination, the analysis of LOS adequacy would only beapplied to County arterials and collectors in rural areas and urban areas under the County’s jurisdiction. ACertificate of Concurrency is not issued to any proposed development if the standards in this section are notachieved and maintained within the 6-year period allowed by GMA for transportation concurrency. The applicanthas the option of accepting the denial of application; appealing the denial of application; or accepting a 90-dayreservation period and, within this time, revising the development proposal to bring transportation withinconcurrency requirements.The ordinance allows for the concurrency test to be applied on either a countywide or sub-area level, but does notdefine methods for defining the area of impact at the sub-area level. Consequently, the concurrency test iscurrently only applied at the countywide level.City of Bremerton - Over the longer term, the GMA requires that the level of transportation investment must keeppace with growth in traffic volumes so that the LOS thresholds established in the transportation element aremaintained.The LOS standards establish the maximum threshold of congestion on each facility. This relates to the concurrencydefinition in the GMA that requires adequate public facilities (operating better than the LOS standard) to beavailable when the impacts of development occur. “Concurrent with development” as applied to transportationmeans that “improvements or strategies are in place at the time of development, or that financial commitment isin place to complete the improvements or strategies within six years.” Therefore, any development within the Cityof Bremerton or County that would cause a LOS standard to be exceeded could not be approved unless thefinancial commitment to improve the deficiency was in place within the required six-year timeframe. LOS wouldneed to be monitored annually to ensure that the LOS standards established would not be exceeded.The City of Bremerton also has a Transportation Development Code (BMC Chapter 11.12). The purpose of theTransportation Development Code is to implement the transportation element of the City of BremertonComprehensive Plan, and to provide an orderly process for the adoption, implementation, interpretation andmodification of City of Bremerton transportation system development standards. (Chapter 11.12.020) TheTransportation Development Code gives the City of Bremerton Engineer the authority to request traffic impact<strong>Draft</strong> | June 2013 3-158
GORST PLANNED ACTION EIS | AFFECTED ENVIRONMENT, SIGNIFICANT IMPACTS, AND MITIGATION MEASURESanalysis reports for proposed development projects if there is reason to believe the impact on the City ofBremerton’s existing or planned future transportation facilities will be significant. The City of Bremerton Engineershall impose conditions necessary to mitigate all impacts of traffic, circulation and parking resulting from a project.For segments, intersections, or other portions of the street system for which a LOS Standard has been adopted,mitigation measures shall be sufficient to assure that such segments, intersections or other portions of the streetsystem continue to meet or exceed the adopted LOS standards after full project occupancy and operation. Forsegments, intersections or other portions of the street system for where the present LOS is below the adoptedstandard, the mitigation measure shall be sufficient to maintain or exceed the present LOS. (BMC Chapters11.12.060 and 11.12.070)TransitKitsap Transit is the public transportation provider in Kitsap County. Formally known as the Kitsap PublicTransportation Authority, it was established by the voters in the fall of 1982. Its mission initially was to providepublic transportation services in the greater Bremerton and Port Orchard areas. Since then, Kitsap Transit hasexpanded through a number of annexations to cover the entire county.Kitsap Transit is a multi-program system that provides fixed route and paratransit bus service, manages a Park andRide lot system, operates a passenger-only ferry service between Bremerton and Port Orchard, and supportstransit-oriented development. The Kitsap Transit 2010-2016 Transit Development Plan (2010) assesses existingservice and facilities and lays out its transit improvement plan.Fixed Route Bus ServiceKitsap Transit operates 22 local bus routes throughout the county. Most routes provide everyday service. Saturdayservice is limited, and there are no Sunday operations. Typical headways (time between buses) range between 15minutes and 90 minutes, but most commonly are 60 minutes.Kitsap Transit operates 17 commuter bus routes. Service is provided to support commute travel patterns and timesof day. These routes provide weekday service and focus on major employment centers and ferry terminal areas ofthe county.There are no local or commuter bus routes that directly service the <strong>Gorst</strong> UGA. Transit riders from <strong>Gorst</strong> need todrive to park and ride lots located north and east of the <strong>Gorst</strong> UGA in order to utilize transit. The closest park andride lot to the east is located approximately 5 miles from the center of <strong>Gorst</strong> in Port Orchard. The closest bus routeto the north is Route 20 which follows Werner Road north of the <strong>Gorst</strong> UGA, while the closes bus to the east isroute 5 which services Tremont Street in Port Orchard.Paratransit Bus ServiceKitsap Transit operates ACCESS paratransit service for elderly and disabled people throughout most of the county.This service is designed to provide transportation for seniors and people with disabilities who are unable to useKitsap Transit regular fixed route buses (Kitsap Transit 2010).Foot Ferry ServiceKitsap Transit operates contract passenger ferries between Port Orchard and Bremerton and between Annapolisand Bremerton. The Port Orchard/Bremerton ferry operates weekdays and Saturdays at average headways of 30minutes. The Annapolis/Bremerton ferry operates weekdays during the morning and evening commute periods ataverage headways of 10 minutes. In 2010, the foot ferries carried 444,296 riders (Kitsap Transit 2010).RideshareKitsap Transit operates a large rideshare program composed of worker/driver buses (subscription or bus poolservice), vanpools, and a ride-matching service. The vanpool program provides service to and from majoremployment destinations in and near Kitsap County. Currently, vanpool commute destinations include Bangor;<strong>Draft</strong> | June 2013 3-159
GORST PLANNED ACTION EIS | AFFECTED ENVIRONMENT, SIGNIFICANT IMPACTS, AND MITIGATION MEASURESBellevue/Eastgate; Boeing in Eastgate, Everett, Kent, Renton, and Seattle; Everett Naval Station; Fort Lewis;Keyport; Mountlake Terrace; Naval Station Bremerton; PSNS; and numerous Seattle destinations.Park and RideKitsap Transit manages 24 Park and Ride lots located throughout the county. Collectively, these lots have acapacity of more than 2,563 parking stalls. None of these Park and Ride lots are located within the <strong>Gorst</strong> UGA. Theclosest Park and Ride lot is located 5 miles from the <strong>Gorst</strong> UGA. The closest park and ride lot to the east is locatedapproximately five miles from the center of <strong>Gorst</strong> in Port Orchard. The closest park and ride to the north is alsoapproximately five miles from the center of <strong>Gorst</strong> and is located in Bremerton.Transportation Demand ManagementTDM consists of strategies that seek to maximize the efficiency of the transportation system by reducing demandon the system. The results of successful TDM can include the following benefits.• Travelers switching from driving alone in a SOV to HOV modes such as transit, vanpools, or carpools.• Travelers switching from driving to non-motorized modes such as bicycling or walking.• Travelers changing the time they make trips from more congested to less congested times of day.• Travelers eliminating trips altogether either through means such as compressed workweeks, consolidation oferrands, or use of telecommunications.CTR LawPassed in 1991 as part of the Washington Clean Air Act (Chapter 70.94 RCW), the CTR law seeks to reduceworkplace commute trips in the 10 most populous counties in the state. This law requires that in designated highpopulation counties, including Kitsap County and Bremerton, each employer with more than 100 employees willadopt a CTR plan. Programs provide various incentives or disincentives to encourage use of alternativetransportation modes other than the SOV. City of Bremerton and County ordinances set goals for the reduction ofSOV trips. Kitsap County maintains a CTR Plan, codified in KCC Chapter 20.08.In 2006, the Legislature amended the CTR law with the CTR Efficiency Act to make the CTR program more effective,efficient, and targeted. The modified CTR program requires WSDOT to work with cities, counties, planningorganizations, and transit systems to develop programs that reduce drive-alone trips and VMT per capita.TDM ProgramsKitsap Transit serves as the TDM lead for the County, and is the agency responsible for the implementation of CTRLaw requirements for major Kitsap employers. The agency works with local governments and state agencies topromote its services and alternatives to SOV, including pedestrian/bicycle access and the facilities and land usepatterns that support alternative modes. Kitsap Transit also advocates for TDM programs and overall land useprograms that will benefit the array of alternatives described above throughout the county. TDM programs arebriefly described below.• Smart Commuter. To be in the Smart Commuter Program, a person must regularly commute to work bywalking, bicycling, riding a bus, carpooling, vanpooling, or riding a ferry as a foot passenger at least three timesper week. Participants must register in the program, at which time they receive a Smart Commuter DiscountCard from Kitsap Transit, which provides discounts on a variety of merchandise and services from more than100 local merchants.• Guaranteed Ride Home. Employers may participate in Kitsap Transit’s Guaranteed Ride Home program. Underthis program, for employees registered as Smart Commuters, Kitsap Transit will arrange guaranteedtransportation in case of emergency.<strong>Draft</strong> | June 2013 3-160
GORST PLANNED ACTION EIS | AFFECTED ENVIRONMENT, SIGNIFICANT IMPACTS, AND MITIGATION MEASURES• Priority Parking. Participants in carpool and vanpool programs receive priority parking at some public Park andRide lots.• Smart Commuter Option of Today (SCOOT). Kitsap Transit operates the SCOOT program, a membership-basedmobility club in which members have access to cars located around Kitsap County. The mission of the SCOOTprogram is to encourage commuters who work in targeted areas in Kitsap County to use alternatives to drivingto work alone by offering a ‘smart option’ for personal errands. Currently, cars are provided in the BremertonBusiness District at the Bremerton Harborside Building, Norm Dick’s Government Center, Kitsap CountyCourthouse in Port Orchard, and Kitsap Mental Health. Members are given a key card that allows them accessto any vehicle in the fleet. When a member needs to use a vehicle for personal errands or appointments, he orshe makes a reservation via the web or phone. Users pick up the car at a convenient location and return thecar once finished.RailBurlington Northern–Santa Fe Railroad (BNSF) provides rail service in the county, but its use is restricted to the U.S.military and solid waste providers. The U.S. Navy owns the rail lines from Shelton to the PSNS and from <strong>Gorst</strong> northto the Bangor Naval Submarine Base. Under an agreement with the U.S. Navy, BNSF operates and maintains thelines, with major improvements funded by the Navy. The railroad in Kitsap County is maintained at Federal RailwayAdministration Class 3.Washington State Ferries (WSF)The WSF System is an important element of Kitsap County’s transportation system. Four WSF terminals are locatedin Kitsap County: at Bremerton, Bainbridge Island, Southworth, and Kingston. Service between Kitsap County andthe Seattle metropolitan area is provided by four state ferry routes, with endpoints at each of these terminals.Table 3.11-5 WSF Traffic Statistics summarizes ridership in 2010 and 2011 for each route.Edmonds/KingstonSeattle/BremertonSeattle/BainbridgeIslandFauntleroy/SouthworthVashon Island/SouthworthVehiclesPassengersTable 3.11-5WSF Traffic Statistics2010 2011TotalRidersPercentChangefrom2009 Vehicles PassengersTotalRiders2,156,875 1,916,642 4,073,517 0.0 2,063,102 1,818,530 3,881,632 (4.7)656,979 1,859,050 2,516,029 3.6 642,839 1,718,724 2,361,563 (6.1)1,950,941 4,026,194 5,977,135 (2.3) 1,947,986 4,158,216 6,106,202 2.2490,991 325,503 816,494 (4.9) 489,059 332,913 821,972 0.798,388 76,646 175,034 5.4 90,980 72,540 163,520 (6.6)PercentChangefrom2010Source: WSDOT 2011, 2012Non-motorized FacilitiesNon-motorized modes include all transportation that does not utilize a motor for movement. In Kitsap County, themain non-motorized modes are walking and bicycling. In addition, equestrian transportation is included in nonmotorizedmodes.<strong>Draft</strong> | June 2013 3-161
GORST PLANNED ACTION EIS | AFFECTED ENVIRONMENT, SIGNIFICANT IMPACTS, AND MITIGATION MEASURESCurrently, there are limited developed designated non-motorized facilities in Kitsap County; however, a roadwayshoulder-paving program has increased safety for pedestrians and bicyclists on numerous roads throughout thecounty.The Kitsap County Greenways Plan provides a comprehensive review and recommendation list for all types of nonmotorizedtravel, including separated walking and hiking facilities, multipurpose trails, separated bike facilities, andequestrian trails. The plan will integrate non-motorized facilities into the existing and future roadway network.The transportation component of the Kitsap County Greenways Plan designates a system of bicycle facilities toaddress these concerns. These facilities seek to connect destinations of interest to the broad range of commuters,inter-community users, and local users. The main role of the Kitsap County Bicycle Facilities Plan is to provide nonmotorizedtransportation alternatives to the existing County transportation system. This non-motorized systemstrives also to interconnect neighborhood communities, urban and rural areas, schools, parks, places ofemployment, and inter modal nodes such as transit stops, park and ride facilities and ferry terminals in order tocreate a viable non-motorized transportation system.The City of Bremerton Non –Motorized Transportation Plan is a comprehensive document that provides aninventory and assessment of existing bicycle and pedestrian conditions with the City of Bremerton. It also providesrecommendations and strategies for system-wide improvements and opportunities to connect to regional systemssuch as the Mosquito Fleet Trail. While the City of Bremerton Non-Motorized Transportation Plan does notspecifically address the <strong>Gorst</strong> UGA, it does provide some routing options to the Mosquito Fleet Trail to provide andefficient non-motorized connection from <strong>Gorst</strong> to Bremerton.Pedestrian FacilitiesPedestrian facilities are an integral part of the transportation system. For some citizens, particularly elderlyresidents and children, walking is the primary mode of travel. It is also a key link to transit service and betweenland uses in urban areas.The Kitsap County Road Standards 2007 indicate that pedestrian facilities may be required as part of roadimprovements where there are anticipated or existing origins and destinations with acceptable pedestrian traveldistances that will generate trips. If required sidewalk width is a minimum of five-feet wide.The City of Bremerton Roadway Standards, indicate that sidewalks are required on all roadway classifications. Thepreferred location of the sidewalk is away from the roadway (separated by a landscape buffer). The minimumwidth of sidewalks in the City of Bremerton is five feet.Bicycle FacilitiesAccording to the Kitsap County Bicycle Facilities Plan, the only facility that currently exists or is planned within the<strong>Gorst</strong> UGA is the Mosquito Fleet Trail that is anticipated to follow along the shoreline with the <strong>Gorst</strong> UGA. Aspreviously discussed, the Mosquito Fleet Trail is an integral part of the City of Bremerton Bicycle plan to provide aregional connection from the City of Bremerton to other areas within Kitsap County.Multi-use TrailsFor more than 20 years, the County has had planning programs for non-motorized modes, including several trailplans. Trails within the county include the Clear Creek Trail in central Kitsap, the Hansville Greenway Trails in northKitsap, and the Mosquito Fleet Trail between north and south Kitsap. However, not much has been constructedwith the Mosquito Fleet Trail.Mosquito Fleet TrailThe Mosquito Fleet Trail Master Plan defines in greater detail a project that is both part of the Kitsap County OpenSpace Plan and the Kitsap County Bicycle Facilities Plan. The basic concept is that of a trail corridor for use bybicyclists and pedestrians that skirts the eastern shoreline of Kitsap County and Bainbridge Island, connecting<strong>Draft</strong> | June 2013 3-162
GORST PLANNED ACTION EIS | AFFECTED ENVIRONMENT, SIGNIFICANT IMPACTS, AND MITIGATION MEASUREShistoric Mosquito Fleet docks along the way. It is a route for usage by commuters, school children, bicycle touringgroups, recreational users, and tourists. It links cultural resources and scenic sites, parks and docks, businesses andschools, transit and public facilities, and communities and cities. It connects all four of the county’s cities and 25 ofthe county’s communities.In fall 1999, the County began the planning process for this trail corridor with an extensive inventory of the routeand an in-depth public process to ensure the development of a master plan that would reflect the needs andconcerns of the citizens of Kitsap County.The trail is an approximate 100-mile roadside hike and bike route along the shores of the Kitsap Peninsula. Theroute will be marked with distinctive signs, making it easy to follow on foot, by bicycle, or by automobile. It linksthe old Mosquito Fleet docks from Kingston to Southworth. It provides access to many other interesting stoppingpoints including villages and towns, parks, historic sites, and scenic vistas (Kitsap County 2012).The Mosquito Fleet Trail Master Plan identifies “Project 7 – Bremerton to Port Orchard”. This section of the trailwould connect Port Orchard with Bremerton through the <strong>Gorst</strong> UGA. The primary route would provide a separatedpath that would generally follow SR 16 and SR 3 through <strong>Gorst</strong>. A secondary route is also identified that wouldinclude pave shoulders on Sherman Heights Road, Kent Avenue, 3 rd Avenue and Union Avenue. This secondaryroute would connect to the primary corridor at SR 3 and Sherman Heights road and continue north to WernerRoad.<strong>Gorst</strong>- Heins Creek TrailsThe City of Bremerton is considering a number of options for a <strong>Gorst</strong> –Heins Creek trail system that would beultimately be part of the Kitsap Regional Trail currently being considered as part of a non-motorized plan beingdeveloped by Kitsap County. This trail system would provide a connection to the <strong>Gorst</strong> UGA and would head northtoward Heins Lake. Approximately 6.5 miles of trail alignments have been considered with options for additionalconnections and side trails as necessary. Approximately 1/4 of a mile of trail currently exists with Jarstad Parkwhich would be the beginning of this proposed trail system.Air TravelBremerton National AirportKitsap County is served by Bremerton National Airport, which is the county’s major public airport. It is considered aWashington State Public Use Airport identified in the Washington State Aviation System Plan. WSDOT guidelinesaddress airport land use compatibility for public use airports.The Bremerton National Airport is approximate four miles south of the <strong>Gorst</strong> UGA and is owned and operated bythe Port of Bremerton. Charter, rental, flight instruction, maintenance, and avionics services are available at theairport. The airport has two runways, only one of which is now in use. This runway has the capacity of more thantwice the current number of takeoffs and landings. In addition, the runway is sufficiently long to handle planes thatare larger than the current aircraft size using this facility; the Navy has expressed an interest in upgraded facilitiesto support even larger aircraft.Seattle-Tacoma (Sea-Tac) International AirportSea-Tac International Airport, located in King County, is the principal passenger air terminal serving Kitsap Countyresidents and businesses. Access to the airport from the <strong>Gorst</strong> UGA is via SR 16 and the Tacoma Narrows Bridge toInterstate 5, as well as via ferry service to Edmonds, Seattle, and Fauntleroy and then ground transportation to theairport via SR 99 or Interstate 5. Travel time from the <strong>Gorst</strong> UGAS to Sea-Tac via Tacoma is slightly more than onehour during nonpeak travel times. An airport shuttle service operates hourly from Bremerton and other points inKitsap County to the airport.<strong>Draft</strong> | June 2013 3-163
GORST PLANNED ACTION EIS | AFFECTED ENVIRONMENT, SIGNIFICANT IMPACTS, AND MITIGATION MEASURES<strong>Planned</strong> Future Roadway ImprovementsAnalysis of future conditions assumes the completion of transportation improvement projects to whichcommitment has been made by the implementing agency. The reason for this is that if committed capacityimprovement projects are not assumed in place, potential exists for future impacts to be over-predicted. For theanalysis presented in this SEIS, future improvements were identified for county roadways and state highways asdescribed below.• County roadway improvements were identified if they are included in the County’s TIP and had committedfunding in place.• State highway improvements were identified if they were included in the WTP.The following improvements to State and County Roadways that are assumed in place for the 2035 transportationmodel analysis that would affect the <strong>Gorst</strong> UGA:• SR 3 and SR 304 interchange assume an additional lane is in place on SR 3. WSDOT is currently studying thisinterchange to finalize the improvements need to this interchange.• SKIA Connector from Lake Flora Road to SR 3 – New 2 lane roadwayThe assumed transportation improvements needed to meet the adopted Kitsap County roadway segment LOS asshown in the Kitsap County’s Capital Facility Plan in the <strong>Gorst</strong> vicinity include:• Belfair Valley Rd (W), Mason County Line - Bremerton City Limits Widen to undivided four lanes: 2019-2025• Belfair Valley Rd (W), Bremerton City Limits - Sam Christopherson Ave W, Widen to undivided 4 lanesThese improvements are not in the base model but were developed as mitigation measures for the Kitsap CountyComprehensive Plan amendments in 2012.The Washington Department of Transportation Bremerton Economic Development Study has developed a numberof transportation improvement projects along SR 3 and SR 16 within the <strong>Gorst</strong> area. While these projects were notincluded in the County Transportation model many of them are or will be included in the PSRC Transportation2040 plan and amendments. The following are a summary of these projects:• SR 3 from Belfair to <strong>Gorst</strong>: Widen to four lanes with inside and outside shoulders. Widening will also includeimproved intersections and access management.• SR 16/SR 3 from Sedgwick Road Interchange to Loxie Eagans Boulevard Interchange: Widen to provide a sixlane, divided, limited access highway with HOV lanes. Improved access management will be includedthroughout this segment.• Sam Christopherson Avenue/SR 3: Construct a four lane bridge with shoulders over Sam ChristophersonAvenue.• As part of the improvements for the SR16/SR 3 intersection area, WSDOT is in the process of evaluatingwhether a roundabout would be feasible at this location to eliminate the existing merging, weaving, andaccess issues.<strong>Impact</strong>sMethodologiesTravel Demand ForecastsThe Kitsap County travel demand forecasting model was updated in 2011 using TransCAD software. The model wascalibrated using 2010 data. A primary goal of the Kitsap County model has been to maintain the highestcompatibility with the PSRC regional travel demand forecasting model. To achieve this goal, the core structure of<strong>Draft</strong> | June 2013 3-164
GORST PLANNED ACTION EIS | AFFECTED ENVIRONMENT, SIGNIFICANT IMPACTS, AND MITIGATION MEASURESthe PSRC model was maintained as much as possible. The major components of the Kitsap County model are listedbelow.1. Existing Land Use2. TAZ3. Transportation Network4. Trip Generation5. Trip Distribution6. Mode Choice7. Network Assignment8. Model Calibration9. Model of Future Traffic ConditionsA detailed description of the Kitsap County model is provided in the technical report Kitsap County Travel DemandModel Development Report, 2012. Each major component of the model, as described in the technicalmemorandum, is summarized in the following sections.Existing Land UseLand use data were compiled for Kitsap County for 2010. For purposes of transportation modeling, land use dataare categorized as residential and nonresidential. Each category is further divided into several land use types.Residential land use is divided into single-family and multi-family households. This was developed from 2010 USCensus block data.Non-residential land use is converted into employment data, which are divided into the following categories (unitsare employees), based on State Employment Security Department Data provided to the PSRC:• Financial, insurance, and real estate• Manufacturing• Government• Warehouse, communication, transportation, utility• Education employment• Full-time equivalent college studentThe PSRC database was used because the Kitsap County system did not include employment data. The PSRCemployment database did not include data for the major military bases, such as the PSNS and Bangor SubmarineBase, so an adjustment was made to include military employment based on the latest data compiled by KitsapCounty.Transportation Analysis ZonesFor purposes of transportation modeling, the entire county, including the <strong>Gorst</strong> UGA, is divided into TAZs. One ofthe main objectives for this model was to maintain as much consistency as possible to the previous Kitsap model,as well as the PSRC model from which it was derived. To achieve this, the PSRC TAZ outside of the county wereaggregated to develop 10 external zones. PSRC to Kitsap TAZ equivalencies were maintained for consistency indata aggregation. This reduced the size of the model and improved operating efficiency. Past Kitsap models haddisaggregated the Kitsap zones in the PSRC model to develop a 411 internal zone system. This 411 zone system,which added much needed detail to the model, was maintained. The <strong>Gorst</strong> UGA encompasses 8 of these zones.<strong>Draft</strong> | June 2013 3-165
GORST PLANNED ACTION EIS | AFFECTED ENVIRONMENT, SIGNIFICANT IMPACTS, AND MITIGATION MEASURESThese zone systems provide the Kitsap model the geographic detail needed to better estimate and forecast localtraffic, while maintaining consistency with the PSRC model for data input, such as trip rates, population and landuse forecasts, etc.Within the <strong>Gorst</strong> UGA, the proposed land used assumptions for each model were broken down to each of the eightzones that make up the <strong>Gorst</strong> UGA. The trips that the model generated from these land use assumptions weredistributed to the roadway network via centroid connectors. Depending on the number of local roadways that passthrough the various zones, more than one centroid connector was included to provide a clear direction as tolocation of the origin and/or destination of the trips.Transportation NetworkThe roadway network is represented in the computer as a series of links (roadway segments) and nodes(intersections). Characteristics such as capacity, length, speed, and turning restrictions at intersections are codedinto the network. The approach taken in developing the transportation network was similar to that employed inTAZ development. It started with the PSRC network as the base, but a more detailed network was developed insideKitsap County. Within the <strong>Gorst</strong> UGA each of the existing roadways that provided a connection to either arterialroadways and/or state highways was included. Roadway that serviced a small residential community without adirect connection to larger roadways was not included in the network. It is assumed that these types of roadwaysare best replicated in a group and reflected as centroid connectors.Trip GenerationThe trip generation step estimates the total number of trips produced by and attracted to each TAZ in the studyarea. The trips are estimated using statistical data that take into account population and household characteristics,employment information, economic model output, and land use information. Trip generation in the Kitsap modelis based on the procedures developed by PSRC. The PSRC model is a cross-classification model, which requires landuses to be cross-classified by income groups, number of workers, number of college-aged persons, and number ofschool-aged persons. For non-residential land uses, it uses a linear regression procedure. The PSRC procedureapplied only to the Kitsap internal zones (1 through 411). For other zones outside the county border, trip data fromthe PSRC model were directly imported.Trips generated are categorized by their general purpose; these are listed below.• Home based work trips—any trip with home as one end and work as the other end• Home based college trips—any trip with home as one end and college as the other end• Home based other trips—any non-work trip with home as one end• Non-home-based trips—any trip that does not have home as either endThe trip generation model generally estimates the number of trips that are generated per household during theanalysis period for each of the purposes under consideration. For its output, the trip generation model estimatesthe total number of trips produced in each TAZ and the total number of trips attracted to each TAZ, categorized bytrip purpose.Trip DistributionThe trip distribution step allocates the trips estimated by the trip generation model to create a specific zonal originand destination for each trip. This is accomplished through use of the gravity model, which distributes tripsaccording to two basic assumptions:1. More trips will be attracted to larger zones (the size of a zone is defined by the number of attractionsestimated in the trip generation phase, not the geographical size).<strong>Draft</strong> | June 2013 3-166
GORST PLANNED ACTION EIS | AFFECTED ENVIRONMENT, SIGNIFICANT IMPACTS, AND MITIGATION MEASURES2. More trips will take place between zones that are closer together than will take place between zones that arefarther apart. The result is a trip matrix (for each of the trip purposes specified in trip generation) thatestimates how many trips are taken from each zone (origin) to every other zone (destination).Modal ChoiceThe modal choice model reflects the total zone-to-zone person trips resulting from the trip distribution model, splitinto trips using each available mode between each zone pair. Modes included in the Kitsap County model are listedbelow.• Automobile—drive alone• Automobile—carpool• Transit —drive access• Transit—walk accessFactors that are considered in the modal choice model are travel time and distance; out-of-vehicle time (includingwalk, wait, and transfer time); and cost (transit fare, parking cost). The mode-specific trip tables are converted intovehicle trips by using auto-occupancy factors, and loaded onto the roadway network in the trip assignmentprocess.Network AssignmentThe arterial street system is represented in the computer model as a series of links, which represent roadways; andnodes, which represent the intersection of those roadways. Each roadway link and intersection node is assigned afunctional classification, with associated characteristics of length, capacity, and speed. The computer model usesthis information to determine the optimum path between all the zones based on travel time and distance. Themodel then distributes the trips from each of the zones onto the street network.Model CalibrationA crucial step in the modeling process is the calibration of the model. The modeling process can generally bedescribed as defining the existing street system as a model network and applying trip patterns based on existingland use. The model output, which consists of estimated traffic volumes on each roadway segment, is compared toexisting traffic counts and observed travel patterns. Adjustments are made to the model inputs until the modeledexisting conditions replicate actual existing conditions within accepted parameters. Once the model is calibratedfor existing conditions, it can be used as the basis for analyzing future traffic conditions, as well as potential futureimprovements to address existing and future deficiencies.Model of Future Traffic ConditionsUsing the same general process described for modeling existing conditions, the forecast land use data are used toestimate the number of trips that will be generated in future travel. The forecast land use was based on a landcapacity analysis for the UGAs (including the <strong>Gorst</strong> UGA - the focus of this analysis), city estimates of growth in citylimits based on their comprehensive plans, and a distribution of rural growth based on 2010 patterns, but grown tothe CPP rural growth target. These trips are then distributed among the TAZs and assigned to the street network.The result is a model of projected future traffic conditions under the projected future land use scenario.Allocation of future land use under the different alternatives is based upon overall population projections, overallemployment projections, the zoning of each TAZ, and the available capacity for the TAZ.LOS MethodologiesAs described earlier in this chapter, LOS designations are qualitative measures of congestion that describeoperational conditions within a traffic stream and take into consideration such factors as volume, speed, traveltime, and delay. LOS is represented by letter grades A through F. LOS A through C imply traffic flows with minimal<strong>Draft</strong> | June 2013 3-167
GORST PLANNED ACTION EIS | AFFECTED ENVIRONMENT, SIGNIFICANT IMPACTS, AND MITIGATION MEASURESdelay, while LOS D and E imply conditions that approach capacity, and LOS F implies unstable flow with potentialfor substantial delays (Transportation Research Board 2000). The characteristics of the six levels of servicedesignations for roadway segments and intersections are summarized in Table 3.11-2 LOS Descriptions. Thefollowing sections describe the methods applied to calculate LOS for roadway segments and intersections.Roadway Segment LOSKitsap County uses a traditional engineering methodology to evaluate LOS of roadway segments, which aresections of roadway located between major intersections. LOS is based on V/C ratios, by which roadway travelvolumes are compared to roadway capacity. The V/C ratio relates directly to measures of LOS. Table 3.11-6 V/CRatio Ranges as They Relate to LOS shows the relationships between LOS, V/C ratios, peak hour, and free-flowspeed on a roadway segment.To calculate V/C ratio on a roadway segment, the projected daily traffic volume that travels on the roadway isdivided by its capacity. For planning-level estimates such as those presented in this SEIS, capacities are calculatedon the basis of characteristics such as functional classification, access characteristics, number of lanes, presence ofmedians, and whether the roadway is located in an urban or a rural setting.Table 3.11-6V/C Ratio Ranges as They Relate to LOSLOS V/C Range Percent of Free-Flow Speed (Peak Hour)A 0.50 and below 90 or greaterB 0.60 to 0.69 70 to 90C 0.70 to 0.79 50D 0.80 to 0.89 40E 0.90 to 0.99 33F 1.00 and above 25 or lessSource: Kitsap County 2012.In addition to the roadway segment LOS that is used by Kitsap County, the City of Bremerton also applies the LOSto intersections. LOS for intersections considers the control delay experienced for each vehicle whether it be a stopor signalized intersection and relates the delay to the LOS.IMPACTS COMMON TO ALL ALTERNATIVESThe three alternatives are expected to experience common types of impacts, with the intensity of the impactsincreasing as population and employment levels increase. This section provides a side-by-side summary of traveldemand and roadway LOS impacts projected to result from each of the three alternatives. Potential impacts onother modes of travel are also discussed.System-wide Travel <strong>Impact</strong>sTable3.11-7 Summary of <strong>Gorst</strong> Area Travel Statistics summarizes a number of numerical measures that have beendefined for the alternatives based upon the <strong>Gorst</strong> UGA population and employment projections, the proposed landuse plan for each alternative, planned infrastructure improvements, and travel demand modeling results. Since the<strong>Gorst</strong> UGA is a relatively small area compared to the overall county, the Daily Vehicle Trips and Daily Vehicle Milesof Travel shown in the table are for the entire county. The differences between the three alternatives are theresult of the varying land use assumptions for the <strong>Gorst</strong> UGA. Table 3.11-7 Summary of <strong>Gorst</strong> Area Travel Statisticsindicates that the daily trips and daily vehicle miles are very similar for all three alternatives. Alternative 1 results inthe fewest trips in 2035 while Alternative 2 generates the most trips. Alternative 2 results in 2,823 more daily tripsthat Alternative 1 while Alternative 3 produces 2,031 more trips that Alternative 1.<strong>Draft</strong> | June 2013 3-168
GORST PLANNED ACTION EIS | AFFECTED ENVIRONMENT, SIGNIFICANT IMPACTS, AND MITIGATION MEASURESTable 3.11-7 Summary of <strong>Gorst</strong> Area Travel StatisticsCategory Alternative 1 Alternative 2 Alternative 3<strong>Gorst</strong> Area Population 1Existing (2010) 2,108 2,108 2,1082035 3,288 4,191 4,289Percent Increase 56 99 103<strong>Gorst</strong> Area Employment 1Existing 786 786 7862035 2,126 1,991 1,718Percent Increase 170 153 118Lane-Miles of <strong>Gorst</strong> Area Roadways 2Existing 8.16 8.16 8.162035 8.16 8.16 8.16Percent Increase 0 0 0Countywide Model Daily Vehicle TripsExisting 666,968 666,968 666,9682035 884,937 887,760 886,968Trips attributed to <strong>Gorst</strong> Alts 2&3 2,823 2,031Percent Increase 32.68 33.10 32.98Countywide Model Daily Vehicle Miles of Travel (VMT)Existing 5,064,708 5,064,708 5,064,7082035 6,602,656 6,615,322 6,604,458Percent Increase 30.36 30.61 30.40Countywide Model Daily Rideshare Vehicle TripsExisting 14,854 14,854 14,8542035 19,511 19,578 19,560Percent Increase 30.35 31.80 31.68Countywide Model Daily Transit Person TripsExisting 11,309 11,309 11,3092035 14,467 14,495 14,533Percent Increase 27.92 28.17 28.50Countywide Model PM Peak Hour VehiclesExisting 64,029 64,029 64,0292035 84,954 85,225 85,149Trips attributed to <strong>Gorst</strong> Alts 2&3 271 195Percent Increase 32.68 33.10 32.98Note:1Based on TAZ encompassing the <strong>Gorst</strong> UGA. Net differences are due to land use changes in the <strong>Gorst</strong> UGA.2Includes functionally classified arterial and collector roadways, does not include State Highways.3Kitsap county-wide travel demand model, with updated <strong>Gorst</strong> area population and employment data, and updatedSKIA employment data matching City of Bremerton SKIA Subarea Plan December 2012. Net differences are due to landuse changes in the <strong>Gorst</strong> UGA.Source: Kitsap County 2013<strong>Draft</strong> | June 2013 3-169
GORST PLANNED ACTION EIS | AFFECTED ENVIRONMENT, SIGNIFICANT IMPACTS, AND MITIGATION MEASURESLOS <strong>Impact</strong>sOperational impacts were assessed by calculating the LOS of roadways and intersections in 2035 under trafficconditions projected to result from build-out of each of the three alternatives.Roadway segmentsTable 3.11-8 Projected Roadway Segment Deficiencies under Two Alternatives by 2035 summarizes the lane-milesof deficient roadway segments within the <strong>Gorst</strong> UGA projected by 2035 under the three alternatives. As notedearlier in this chapter, a county roadway is considered deficient if the projected V/C ratio exceeds the County’sadopted standards (Table 3.11-6 V/C Ratio Ranges as they Relate to LOS).Table 3.11-8Projected Roadway Segment Deficiencies under Alternatives by 2035Alternative 1 Alternative 2 Alternative 3<strong>Gorst</strong> Area Total Deficient Lane-Miles 0.46 0.46 0.46Total 2025 <strong>Gorst</strong> Roadway Lane-Miles 8.16 8.16 8.16Percent of Deficient Lane-miles 5.6 5.6 5.6Source: Kitsap County 2013Table 3.11-8 Projected Roadway Segment Deficiencies under Alternatives by 2035 shows that all three alternativesare projected to have a similar number of deficient lane miles. The projected 2035 volume on Belfair Valley Roadbetween Sam Christopherson Avenue and the UGA limits is expected to increase with all three alternatives to apoint where this section of roadway will be deficient by 2035. It is noted that this section of roadway wasidentified as needing improvement in the Kitsap County UGA Remand SEIS. None of the alternatives are expectedto result in a percentage of deficient lane-miles of roadway that exceeds the County concurrency standard of 15percent when considering either the <strong>Gorst</strong> UGA or for the entire County.IntersectionsDue to the uncertainty in timing and configuration of the state highway improvements within the <strong>Gorst</strong> UGA, anintersection analysis was not performed. It is recommended that as land is developed in the future, a traffic impactanalysis be prepared for the development that will look at the intersections within the area as well as thoseintersections outside of the <strong>Gorst</strong> UGA that could be affected.<strong>Impact</strong>s on State FacilitiesState HighwaysTable 3.11-9 Projected State Highway Deficiencies by 2035 summarizes the miles of deficient state highwaysegments projected by 2035 under each alternative. As noted earlier in this chapter, a county roadway isconsidered deficient if its operations are projected to exceed adopted highway standards (Table 3.11-8 ProjectedRoadway Segment Deficiencies under Alternatives by 2035).This table shows that Alternative 3 will have the least impact on the State Highways within the <strong>Gorst</strong> UGA in termsof the length of deficient roadway length with the <strong>Gorst</strong> area. Table 3.11-9 Projected State Highway Deficiencies by2035 shows that 1.87 miles of the 2.7 miles of SR 3 that is located in the <strong>Gorst</strong> Area will be deficient withAlternative 1 and 2 while 1.66 miles will be deficient with Alternative 3. None of the 1.14 miles of SR 16 within the<strong>Gorst</strong> UGA is projected to be deficient by 2035.The table shows that 63 percent of the state highway miles in Kitsap County are projected to be deficient underAlternative 1 and 63 percent are projected to be deficient under Alternative 2.<strong>Draft</strong> | June 2013 3-170
GORST PLANNED ACTION EIS | AFFECTED ENVIRONMENT, SIGNIFICANT IMPACTS, AND MITIGATION MEASURESStateHighwayTotalLength(miles)Table 3.11-9Projected State Highway Deficiencies by 2035Length ofDeficientSegments(miles)Alternative 1 Alternative 2 Alternative 3Percentageof TotalLengthLength ofDeficientSegments(miles)Percentageof TotalLengthLength ofDeficientSegments(miles)Percentageof TotalLengthSR 3 2.7 1.87 69.25 1.87 69.25 1.66 61.48SR 16 1.14 0 0 0 0 0 0Total 3.84 1.87 48.67 1.87 48.67 1.66 43.22Source: Kitsap County 2013WSFLong-range capacity and service needs for state ferry routes are identified by the Washington State Department ofTransportation (WSDOT) Ferries Division in its Long-Range Plan (WSDOT Ferries Division 2009). Forecasts are basedon the regional population and employment projections that form the basis for the other projections presented inthis SEIS; as well as financial analysis of projected future ferry fares. The WSDOT Ferries Division projects thatsystem-wide, annual ferry ridership will increase from 23.7 million (based upon 2006 counts) to 32.3 millionpassengers per year; and vehicle demand will increase from 10.8 million to 14.1 million vehicles per year. (WSDOTFerries Division 2009) Table 3.11-10 Projected PM Peak Ferry Demand for Kitsap Service Area summarizes the peakhour demand projected by WSF for the Kitsap service area within this time period. The table shows that totalridership is projected to increase by approximately one-third by 2030.Table 3.11-10Projected PM Peak Ferry Demand for Kitsap Service AreaRidership Existing(based on 2006) Projected 2030 Demand Percentage IncreaseVehicles 4,980 6,490 30Walk-On Passengers 4,790 6,420 34In-vehicle Passengers 2,440 3,370 38Total Ridership 12,210 16,280 33Note:Represents ridership totals for Vashon-Southworth, Fauntleroy-Southworth, Seattle-Southworth, Seattle-Bremerton,Seattle-Bainbridge Island, and Edmonds-Kingston routes.Source: WSDOT 2009The methodology utilized for these projections, as well as the WSF’s plan for accommodating projected futuredemand is presented in the Long-Range Strategic Plan (Washington State Ferries 2009). Regular review and updateof this plan will help ensure that capacity and services needed to meet the increased demand will be identified. Asthe ferry routes serve the entire Kitsap service area, changes to the land use with the <strong>Gorst</strong> UGA will have anegligible effect on projected ferry demand.<strong>Impact</strong>s on Other Modes of TravelNon-MotorizedIncreases in population and employment levels are expected to increase the demand for additional facilities; thus,all three alternatives would affect non-motorized facilities through increased demand for additional trails andbikeways. The increase in urbanized area would result in more trail and bicycle facility demands in those areas.These bicycle and trail facilities may either be located along roadways as bike lanes/sidewalks or as separatedfacilities and would provide opportunities for both recreational and commuter users. As development occurs, the<strong>Draft</strong> | June 2013 3-171
GORST PLANNED ACTION EIS | AFFECTED ENVIRONMENT, SIGNIFICANT IMPACTS, AND MITIGATION MEASURESdevelopment of connections from residential areas to regional trail systems should be identified to promoteincrease use of these facilities.Infrastructure needs for non-motorized transportation/commuter and mixed bicycle/pedestrian user groups areidentified in the Kitsap County Bicycle Facilities Plan. Planning programs for trails are maintained in trail plans, suchas the Mosquito Fleet Trail Master Plan. Regular review and update of these plans will help ensure thatinfrastructure and services needed to meet increased demand for non-motorized facilities will be identified.TransitTransit operations and facilities would be affected by the increase in travel demand created by any of thealternatives. The travel statistics summarized in Table 3.11-7 Summary of <strong>Gorst</strong> Area Travel Statistics indicate thattransit person trips would increase by about 28 percent county wide. These increases would require a substantialincrease in hours of operations and some capital facilities such as park and ride lots. Expansion of the urban areaswould result in new or extended bus routes in addition to more frequent service. Commuter routes would also seeincreased demand, affecting park and ride lots, transit centers, and flyer stops. As discussed previously, the <strong>Gorst</strong>Area currently is not served directly by Kitsap Transit. With the projected county wide increase in transit persontrips, it is conceivable that new routes could be added which could include the <strong>Gorst</strong> area.Rail and AirportsProjected growth in the county would affect demand on rail and airports in Kitsap County. In general asemployment and population increase, the requirement for these services would also increase.Rail activity would be affected by an increase in commerce reflected in increased employment and is owned by theU.S. Department of Defense. Airport activity would increase as recreational and employment activities increase.The demand on rail and airports from the <strong>Gorst</strong> UGA is considered negligible when compared to the overalldemand from the county.<strong>Impact</strong>s of Alternative 1Alternative 1 retains the existing highway-oriented commercial and industrial center as well as the large mineralresource along Sinclair Heights. This land use results in the projections for employment being 74 percent higherthan the projected number of households. From a transportation perspective, this land use promotes trips into the<strong>Gorst</strong> Area to the various employers from other area in the County. The largest employment densities will remainin the center part of the <strong>Gorst</strong> Area near the intersection of SR 3 and SR 16. WSDOT has indicated that the junctionof SR 3 and SR 16 is the most congested location in Kitsap County. This alternative will only further degrade thisintersection due to access to and from the highways to the local business located on both sides of the highways.As this alternative does not provide as much housing as Alternatives 2 and 3, the projected traffic on the countyroadways will be less with this alternative as there would less work to home trips that originate outside of the<strong>Gorst</strong> Area.<strong>Impact</strong>s of Alternative 2The commercial area envisioned for Alternative 2 is similar to the commercial areas in Alternative 1 with theexception that the mineral resource area along Sinclair Heights would be would developed as medium densityresidential. With this change, Alternative 2 is projected to have 479 additional households compared to Alternative1 and 135 fewer jobs. With the majority of the housing being added to the north portion of the <strong>Gorst</strong> UGA, thehome-work trips associated with this development are primarily routed on the existing county roadways ratherthan the highways. The traffic projections for this alternative show that the majority of the trips generated fromthe new residential developments are directed north toward Werner Road to access employment areas to thenorth and east while the remaining trips are directed to the southwest and east via Belfair Road and SamChristopherson Avenue.<strong>Draft</strong> | June 2013 3-172
GORST PLANNED ACTION EIS | AFFECTED ENVIRONMENT, SIGNIFICANT IMPACTS, AND MITIGATION MEASURESWhile some of the commercial areas near the waterfront are converted to open space with this alternative, thedensity of the type of commercial developments envisioned for this alternative will result in similar trafficoperational concerns on SR 3 and SR 16 in the center of the <strong>Gorst</strong> UGA as Alternative 1. Trips accessing thiscommercial area will be employment trips originating from outside of the <strong>Gorst</strong> Area as well as number of tripsoriginating outside of the area that are destined to the various commercial developments along the statehighways.The inclusion of pedestrian friendly commercial developments between SR 3 and Sinclair inlet will result in anincreased pedestrian demand from the residential areas to the waterfront. This increase in demand will create asafety concern for pedestrians crossing the highway at grade.<strong>Impact</strong>s of Alternative 3Alternative 3 would convert the resource area along Sinclair Heights to residential but with a different mix ofresidential than Alternative 2. Under this alternative, an additional 536 housing units would be added incomparison to Alternative 1. However due to the presence of small scale commercial developments near theresidential development as well as the inclusion of trails and pedestrian facilities, these additional housing unitswould actually result in a reduction in the volumes on the local county roadway as compared to Alternative 2. Aswith Alternative 2, the traffic projections for this alternative show that the majority of the trips generated from thenew residential developments are directed north toward Werner Road to access employment areas to the northand east while the remaining trips are directed to the southwest and east via Belfair Road and Sam ChristophersonAvenue.The biggest change with this Alternative is the change in the type and intensity of commercial developments withthe central area of the <strong>Gorst</strong> UGA. This lower intensity development will result in 408 fewer jobs in the <strong>Gorst</strong> UGAas compared with Alternative 1. The combination of lower density commercial and the change in the land usealong the waterfront such that access control along SR 3 can be more readily implemented, the traffic operationsalong the state highways with this alternative is expected to be the least disruptive with this alternative than theother 2 alternatives.The inclusion of pedestrian friendly commercial developments between SR 3 and Sinclair inlet will result in anincreased pedestrian demand from the residential areas to the waterfront. This increase in demand will create asafety concern for pedestrians crossing the highway at grade.Mitigation MeasuresIncorporated Plan FeaturesAll alternatives would implement City of Bremerton and County Comprehensive Plan Transportation Elementsincluding adopted policies regarding levels of service, concurrency, TDM, etc.The <strong>Draft</strong> <strong>Gorst</strong> Creek Watershed Characterization & Framework Plan and <strong>Draft</strong> <strong>Gorst</strong> Subarea Plan include thefollowing policies that would address transportation impacts:• Manage land use and growth to avoid increases in traffic congestion, and create opportunities forimprovements to existing congestion.• Improve safety and circulation, and improve transportation mode choices including transit, bicycle,pedestrian, and automobiles.• Encourage improved Kitsap Transit service such as added park and ride facilities.• Design roads to incorporate gateway treatments, boulevard style streetscape improvements, and accessimprovements to invite the community to <strong>Gorst</strong> and allow convenient travel to regional businesses.<strong>Draft</strong> | June 2013 3-173
GORST PLANNED ACTION EIS | AFFECTED ENVIRONMENT, SIGNIFICANT IMPACTS, AND MITIGATION MEASURESApplicable Regulations and CommitmentsCurrent adopted County or City of Bremerton regulations or programs as described in the Affected Environment ofthis section.Other Potential Mitigation MeasuresAs discussed previously, Belfair Road is projected to operationally deficient prior to 2035. This roadway wasidentified in the Kitsap County UGA Remand SEIS as needing widening from 2 to 4 lanes. All of the other Countyroadways within the <strong>Gorst</strong> Sub Area have capacity to support the additional traffic associated with all threealternatives.Due to the lack of capacity on SR 3 and SR 16 within the center of <strong>Gorst</strong> as well as a variety of merging anddiverging movements, any new developments or redevelopments should be designed to direct traffic either north(Sherman Heights) or west (Sam Christopherson Avenue or Belfair Valley Road) of the SR 3/ SR 16 junction.While access to the north via Sherman Heights Road does not provide the most direct route to Werner Avenue andSR 3, this corridor (including Sherman Heights Road, Kent Avenue, 3 rd Avenue and Union Avenue) should beevaluated for spot intersection improvements to make this route and attractive route for traffic originating in the<strong>Gorst</strong> UGA to head north to avoid having to access SR 3 in central <strong>Gorst</strong>.While Werner road is north of the <strong>Gorst</strong> UGA, this roadway is considered an important route for <strong>Gorst</strong> UGA trafficto access SR 3. The Werner Road corridor between Union Avenue and SR 3 should be evaluated as part of trafficimpact analysis reports prepared for new development in order to optimize the traffic flow on this corridor.To address increased pedestrian demand between the proposed residential areas and the waterfront commercialand recreation land uses associated with Alternatives 2 and 3, consideration should be made to construct gradeseparated pedestrian overpasses that would connect the both the residential and walkable commercial areas thatare on both sides of SR 3 and SR 16. The exact location(s) of these overpasses need to be determined inconjunction with any proposed highway improvements in this area.Significant Unavoidable Adverse <strong>Impact</strong>sImplementation of any of the growth alternatives would result in increased traffic within the <strong>Gorst</strong> UGA andnetworks in south Kitsap County and Bremerton, with the lowest increase occurring under Alternative 3 andgreater increases under Alternatives 1 and 2 (however, Alternative 2 is no greater than Alternative 1 No <strong>Action</strong> interms of State Route congestion). Due to the large volume of regional ”pass through” traffic that uses both SR 3and SR 16, all three alternatives contribute a relatively small amount to cumulative volumes on state routes. WhileWSDOT has long range plans to address capacity on SR 3, the amount of widening of this roadway will be limitedby the presence of Sinclair Inlet on the east side of the roadway, a steep hillside on the west side of the roadwayand a railway crossing with abutments that limit widening.<strong>Draft</strong> | June 2013 3-174
GORST PLANNED ACTION EIS | AFFECTED ENVIRONMENT, SIGNIFICANT IMPACTS, AND MITIGATION MEASURES3.12 Public ServicesThe purpose of this section is to review existing levels of service, estimated needs and demand for service, andprojected levels of service under each alternative for police and fire protection, parks, schools, and libraries.It should be noted that for the purposes of this <strong>Draft</strong> EIS, the future countywide population growth targets for2025 are presumed to apply to the year 2035, with the only difference being the increase in population studied in<strong>Gorst</strong>. Currently the Kitsap Regional Coordinating Council (KRCC) is developing new growth targets for the year2035 which are anticipated to be similar to year 2025 target. However, if the population targets are changed, someadditional analysis may be needed with the County and City of Bremerton Comprehensive Plan updates due in2016.Facility InventoryFigure 3.12-1 <strong>Gorst</strong> Watershed Planning Area Public Facilities shows the location of public facilities in relationshipto the study area.Levels of ServiceOne of the aspects of this public services analysis is the potential for the <strong>Gorst</strong> UGA to be annexed by the City ofBremerton, which would move its public services from unincorporated county services to city levels of service.Table 3.12-1 Summary of Adopted LOS Standards by Jurisdiction summarizes the adopted levels of service for eachof the public services analyzed in this section. For most of the services, the adopted levels of service units ofmeasure are different between the County and the City of Bremerton, so it is difficult to compare directly.However, cities generally provide a higher LOS expectation than unincorporated areas of the County.Fire & EMSPoliceProtectionTable 3.12-1Summary of Adopted LOS Standards by JurisdictionCity of BremertonKitsap CountyProvider LOS Provider LOSResponse Times South Kitsap- Fire: 4.0 minutes Fire and Rescue- EMS: 4.0 min. (BLS)- EMS: 8.0 min. (ALS)Bremerton FireDepartmentBremertonPoliceDepartmentSchools South KitsapSchool DistrictParks, City ofRecreation, and BremertonOpen SpaceLibrariesKitsap CountyPublic Libraries250 sq.ft. per officer Kitsap County1.8 officers per 1,000 pop SheriffAdequate studentcapacityAcres per 1,000 Pop:- Local: 1.48- Regional: 14.64- Open Space: 2.21N/ASouth KitsapSchool DistrictKitsap CountyKitsap CountyPublic Libraries0.36 fire units per 1,000popSq. Ft per 1,000 Pop:- Sheriff offices: 129Beds per 1,000 Pop:- County Jail: 1.43- Work Release: 0.15- Juvenile: 0.084Adequate studentcapacityAcres per 1,000 Pop:- Open Space: 57.1- Regional: 8.9- Heritage: 11.5- Community: 3.5Miles Per 1,000 Pop:- Shoreline: 0.61- Trails: 0.20Source: City of Bremerton Comprehensive Plan, 2010; 2012 Kitsap County Comprehensive Plan Capital Facilities Element, 2012;and BERK, 2013N/A<strong>Draft</strong> | June 2013 3-175
THIS PAGE INTENTIONALLY BLANK
FIGURE 3.12-1 GORST WATERSHED PLANNING AREA: PUBLIC FACILITIESWatershed BoundaryCommunity FacilitiesLaw Enforcement FacilitiesOpen SpaceUGA BoundaryCommunity CenterPolice DepartmentBremertonCity LimitsWaterStreamsMuseumPublic LibrarySolid Waste Disposal FacilityKitsap County SheriffWashington State PatrolKitsap CountyStateUrgent Care ClinicParkFire StationDate: April 2013Source: Parametrix, Department of Natural Resources, Department ofFish and Wildlife, BERK0 1 2Miles
THIS PAGE INTENTIONALLY BLANK
GORST PLANNED ACTION EIS | AFFECTED ENVIRONMENT, SIGNIFICANT IMPACTS, AND MITIGATION MEASURES3.12.1. Fire Protection and EMSAffected EnvironmentWatershedFire protection and EMS within the <strong>Gorst</strong> Creek watershed is provided by the Bremerton Fire Department andSouth Kitsap Fire and Rescue (SKFR). Bremerton Fire Department serves those areas within the corporate limits ofthe City of Bremerton, and SKFR serves the unincorporated portions of the watershed, as well as the City of PortOrchard and the Bremerton National Airport under contractual agreements.Bremerton Fire DepartmentThe Bremerton Fire Department provides fire protection and EMS within the limits of the City of Bremerton andmaintains a response force of 51 professional line personnel, as well as five staff personnel. The Departmentserves about 37,729 people.Facility InventoryStations and equipment. The Department has three staffed fire stations, but does not maintain any fire stationswithin the <strong>Gorst</strong> Creek watershed. Fire protection and EMS services are provided from other stations locatedwithin the City of Bremerton. The closest station is Station 2 located near the intersection of SR 3 and Kitsap Way(5005 Kitsap Way), approximately four miles from the center of the <strong>Gorst</strong> UGA. The equipment housed at Station 2includes two engine units and two medic units.LOSThe levels of service for EMS and fire protection is measured in terms of response time (to understand locationneeds) and call volumes (to understand staffing levels). Response time is defined as the amount of time thatelapses between the initial call for assistance and arrival of the first emergency unit on site. Response timeplanning is tied to the geographic distribution of stations, the equipment housed at each facility, and the level ofstaffing.Bremerton Fire Department’s currently adopted LOS for fire protection is a 4.0 minute response time. For EMS, theLOS is a 4.0 minute response time for basic life support (BLS) and an 8.0 minute response time for advanced lifesupport (ALS).South Kitsap Fire and RescueSKFR covers approximately 118 square miles in southern Kitsap County and, at the end of 2012, employed 102career personnel, supplemented by approximately 76 volunteer firefighters and support staff. The district servesan estimated population of approximately 72,046 residents.Facilities InventoryFire Stations and equipment. SKFR responds to all types of fire, medical and related emergency situations from 16stations throughout the district. SKFR maintains two fire stations within the Watershed:• Station 6 – A volunteer fire station in the Sunnyslope area, located at 6170 SW Rhododendron Drive whichhouses one engine and one water tender.• Station 16 – A professional station just outside of <strong>Gorst</strong>, located at 4058 W. State Highway 3, which housesone engine, one medic unit and one brush truck with the capability to fight fires in forested areas.LOSKitsap County has adopted levels of service based on fire/emergency units per 1,000 population in its CFP.Fire/emergency units include fire engines, water tenders, and medic units. Fire stations are included in the CFP<strong>Draft</strong> | June 2013 3-179
GORST PLANNED ACTION EIS | AFFECTED ENVIRONMENT, SIGNIFICANT IMPACTS, AND MITIGATION MEASURESwhen considering capital facilities housing fire units and personnel; however, fire stations themselves are notincluded in the LOS calculation. Although personnel is an integral component to the operation of any fire district,personnel is not considered a capital facility item under the requirements of the GMA.In comparison to the Bremerton Fire Department’s LOS, the County’s adopted LOS addresses fire units, notresponse time. However, SKFR does monitor its service levels in terms of response times because the state statuteChapter 52.33 RCW requires substantially career fire districts to adopt and annually report response timeobjectives. SKFR has adopted a number of detailed response metrics. Regarding turnout time, the district has agoal of ninety seconds (90) or less 90 percent of the time. In 2010 and 2011, the district did not meet this standardwith an actual performance of 2:30 minutes in 2010 and 2:17 minutes in 2011. The District has a number of traveltime standards to urban, suburban, and rural areas for both fire units and EMS units. These travel times range forfire units from 5:00 to 10:50 depending on the urban, suburban, or rural nature of the call. In 2010, theDepartment met its suburban and rural travel times for fire units but not its urban travel times. In 2011, theDepartment met its suburban travel time but not its urban and rural travel times. The Department’s travel timesfor EMS services ranged from 6:20 to 11:15 minutes in 2010 depending on the urban, suburban, or rural nature ofthe call and likewise met its suburban and rural goals and came very close to its urban goals (missing by 2 seconds)in 2010 (SKFR 2011). In 2011, the EMS response improved to meet all urban, suburban, and rural standards,showing a range of actual response times of 6.50, 8.48, and to 13.57 minutes, all within the urban, suburban, andrural goals respectively (SKFR 2012). The County will be working with the SKFR and other districts to update LOSstandards for its 2016 Comprehensive Plan Update.Table 3.12-2 Current SKFR LOS Requirements shows the adopted LOS for SKFR in fire units per 1,000 populationand whether or not the district is currently meeting the County’s adopted standard in the CFP. Determination of aLOS using the fire unit’s per capita method is calculated by dividing the number of fire units operated in a districtby the district's population. Multiplying the established LOS by future population projections is a proven methodfor reasonably predicting growth-related fire and emergency service capital facilities requirements.Table 3.12-2Current SKFR LOS RequirementsSOUTH KITSAP FIRE AND RESCUEOrchard)Source: SKFR, 2012; Kitsap County Comprehensive Plan Capital Facilities Element, 2012; Washington State Office ofFinancial Management, 2012; and BERK, 2013SKFR has a LOS of 0.36 fire units per 1,000 population. It is currently exceeding this standard by more than tenunits.<strong>Gorst</strong> UGATime PeriodDistrict ServiceArea PopulationLOS = 0.36 FIRE UNITS PER 1,000 POPULATIONFire Units Neededto Meet LOSstandardFire UnitsAvailableNet Reserve or(Deficiency)2010 72,329 26.0 36.0 10.0Fire protection and EMS within the <strong>Gorst</strong> UGA are provided by SKFR. This is a regional service, and is describedabove for the <strong>Gorst</strong> Creek watershed. SKFR maintains one fire station that serves this area just outside of the <strong>Gorst</strong>UGA area, located at 4058 W. State Highway 3, just west of the SR-3/SR-16 interchange. This station is mannedfull-time by career firefighting staff.Figure 3.12-2 <strong>Gorst</strong> Creek Watershed: Fire Station Map for the <strong>Gorst</strong> Creek Watershed and <strong>Gorst</strong> UGA shows thecurrent locations of the South Kitsap Fire Department and Bremerton Fire Department’s fire stations that serve theWatershed and <strong>Gorst</strong> Creek UGA areas.<strong>Draft</strong> | June 2013 3-180
FIGURE 3.12-2 GORST CREEK WATERSHED: FIRE STATION MAPBremertonFire DepartmentBremertonWestUGACity of Bremerton<strong>Gorst</strong> UGAULID6SKIA UGAPoOrchUGCity of Port OrchardSouth KitsapFire DistrictFire DistrictsCentral KitsapSouth KitsapBremertonFire StationsUrban Growth Area BoundaryIncorporated City BoundaryWatershed Boundary0 1 2MilesDate: April 2013Source: Parametrix, Department of Natural Resources, Department ofFish and Wildlife, BERK
THIS PAGE INTENTIONALLY BLANK
GORST PLANNED ACTION EIS | AFFECTED ENVIRONMENT, SIGNIFICANT IMPACTS, AND MITIGATION MEASURES<strong>Impact</strong>sIMPACTS COMMON TO ALL ALTERNATIVESWatershedNo land use changes are proposed for the <strong>Gorst</strong> Creek watershed outside the <strong>Gorst</strong> UGA. Growth would occurbased on adopted plans, which already have been accounted for in County and City of Bremerton ComprehensivePlans and associated capital facility plans. Updated stormwater and habitat regulations in this area are notanticipated to have any effect on the demand for fire protection and EMS services. Therefore, no significantimpacts to these services are anticipated under any of the alternatives that aren’t already accounted for in existingplanning documents.<strong>Gorst</strong> UGAAlternative 1Under the No <strong>Action</strong> Alternative, population in the <strong>Gorst</strong> UGA would grow by approximately 82 people through2035. This Alternative is identical to the Preferred Alternative adopted in the 2010 Kitsap County UGA Sizing andComposition Remand Final Supplemental <strong>Environmental</strong> <strong>Impact</strong> <strong>Statement</strong>.County <strong>Impact</strong>s. The estimated 82 additional residents would have minimal impact on the LOS for SKFR, althoughthe specific need for personnel services, equipment, and facilities would be determined through ongoing planningwithin SKFR. In the 2012 Kitsap County Comprehensive Plan CFP, the County adopted an LOS standard that willserve all No <strong>Action</strong> growth through 2035, as shown in Table 3.12-3 SKFR Projected LOS – Alternative 1.Table 3.12-3SKFR Projected LOS – Alternative 1SOUTH KITSAP FIRE AND RESCUETime PeriodDistrict ServiceArea PopulationLOS = 0.36 FIRE UNITS PER 1,000 POPULATIONFire Units Neededto Meet LOSstandardFire UnitsAvailableNet Reserve or(Deficiency)2010 72,329 26.0 36.0 10.02035 Alternative 1 99,212 35.7 36.0 0.3Source: SKFR, 2012; Kitsap County Comprehensive Plan Capital Facilities Element, 2012; Washington State Office of FinancialManagement, 2012; and BERK, 2013There will be no change to the impacts from the <strong>Gorst</strong> UGA under the No <strong>Action</strong> Alternative. The County LOS canbe met.City of Bremerton <strong>Impact</strong>s. If the <strong>Gorst</strong> UGA were to be annexed by the City of Bremerton before 2035, thecurrent population of the <strong>Gorst</strong> UGA and the projected growth of 82 residents would come under the jurisdictionof the Bremerton Fire Department, for a total population of about 304 people over the next 20-30 years. Underthe Kitsap County Final SEIS prepared in 2012 for the Kitsap County UGA Resizing and Composition Remand, theCity of Bremerton was estimated to grow by about 14,288 residents over the next 20 years without annexing <strong>Gorst</strong>or any other assigned UGA. The additional population from a <strong>Gorst</strong> annexation would only represent anapproximately 2 percent additional population growth increase, which would not be expected to affect the level offire and EMS services in the City of Bremerton.Since the growth from the <strong>Gorst</strong> UGA is both small and spread out over time, the City of Bremerton would haveadequate time to plan for service changes as population increases impact levels of service. Interim demand needscould be served through mutual aid agreements with SKFR, who currently serves the population. As mentioned inthe affected environment discussion, the closest City of Bremerton fire station is approximately 4 miles away,almost all of which is travel along a state highway.<strong>Draft</strong> | June 2013 3-183
GORST PLANNED ACTION EIS | AFFECTED ENVIRONMENT, SIGNIFICANT IMPACTS, AND MITIGATION MEASURESFire district fire protection service, equipment and facilities are funded almost exclusively by levies. If annexationoccurs, Bremerton Fire Department would have access to additional revenues and could be funded by the City ofBremerton’s general fund, with revenue from property and other taxes. This revenue increase could partially orfully offset any increased need for services and facilities. Alternatively, the City of Bremerton could contract withthe SKFR for continued service provision from SKFP Station 16 which is located just outside the <strong>Gorst</strong> UGAboundary. In this case there would also likely be sufficient revenues from the area to fund the contracted services.Alternative 2Alternative 2 models a moderate growth level for the <strong>Gorst</strong> UGA, higher than under the Alternative 1 but lowerthan under Alternative 3. Alternative 2 assumes a 2035 <strong>Gorst</strong> UGA population of 1,207, which is an increase of 985residents over current population levels.County <strong>Impact</strong>s. The estimated 985 additional residents would have minimal impact on the LOS for SKFR, althoughthe specific need for personnel services, equipment, and facilities would be determined through ongoing planningwithin SKFR. The County Fire LOS in the 2012 Final Comprehensive Plan CFP will serve all Alternative 2 growththrough 2035, as shown in Table 3.12-4 SKFR Projected LOS – Alternative 2.Table 3.12-4SKFR Projected LOS – Alternative 2SOUTH KITSAP FIRE AND RESCUETime PeriodDistrict ServiceArea PopulationLOS = 0.36 FIRE UNITS PER 1,000 POPULATIONFire Units Neededto Meet LOSstandardFire UnitsAvailableNet Reserve or(Deficiency)2010 72,329 26.0 36.0 10.02035 Alternative 2 100,115 36.0 36.0 -Source: SKFR, 2012; Kitsap County Comprehensive Plan Capital Facilities Element, 2012; Washington State Office of FinancialManagement, 2012; and BERK, 2013Although the assumed population is higher than under the No <strong>Action</strong> Alternative, SKFR will have adequate capacityto serve the additional residents under Alternative 2.City of Bremerton <strong>Impact</strong>s. If the <strong>Gorst</strong> UGA were to be annexed by the City of Bremerton before 2035, thecurrent population of the <strong>Gorst</strong> UGA and the projected growth of 985 residents would come under the jurisdictionof the Bremerton Fire Department, for a total population of about 1,207 people over the next 20-30 years. Underthe Kitsap County Final SEIS prepared in 2012 for the Kitsap County UGA Resizing and Composition Remand, theCity of Bremerton was estimated to grow by about 14,288 residents without annexing <strong>Gorst</strong> or any other assignedUGA. The additional population from a <strong>Gorst</strong> annexation would only represent about eight percent additionalpopulation growth, which would not be expected to affect the level of fire and EMS services in the City ofBremerton.As with Alternative 1, there would be time for the City of Bremerton to plan for any additional growth from the<strong>Gorst</strong> UGA and the total impact is still relatively small in terms of overall growth in the City of Bremerton. As thearea grew there would be opportunities to assess the best operational approach to meeting the fire needs, whichcould include options involving mutual aid agreements with SKFR, who currently serves the population.Fire district fire protection service, equipment and facilities are funded almost exclusively by levies. If annexationoccurs, Bremerton Fire Department would have access to additional revenues and could be funded by the City ofBremerton’s general fund, with revenue from property and other taxes. This revenue increase could partially orfully offset any increased need for services and facilities. Also, if it was determined that it was more efficient tocontinue to serve the fire and EMS needs of the <strong>Gorst</strong> UGA from the SKFP station 16, then the revenues from theannexation and new growth in the area would likely be adequate to support contracted services for this area.<strong>Draft</strong> | June 2013 3-184
GORST PLANNED ACTION EIS | AFFECTED ENVIRONMENT, SIGNIFICANT IMPACTS, AND MITIGATION MEASURESAlternative 3Alternative 3 models the highest growth level for the <strong>Gorst</strong> UGA, and assumes a 2035 <strong>Gorst</strong> UGA population of1,304, which is an increase of 1,082 residents over current population levels.County <strong>Impact</strong>s. The estimated 1,082 additional residents would have minimal impact on the LOS for SKFR,although the specific need for personnel services, equipment, and facilities would be determined through ongoingplanning within SKFR. The County Fire LOS adopted in the 2012 Final Kitsap County Comprehensive Plan CFP willnearly serve all Alternative 3 growth through 2035, as shown in Table 312-5 SKFR Projected LOS – Alternative 3.Table 3.12-5SKFR Projected LOS – Alternative 3SOUTH KITSAP FIRE AND RESCUETime PeriodSource: SKFR, 2012; Kitsap County Comprehensive Plan Capital Facilities Element, 2012; Washington State Office of FinancialManagement, 2012; and BERK, 2013Under this alternative, the current LOS would be deficient by about one-tenth of a fire unit in 2035. This is a minordiscrepancy between the required LOS level and actual service levels that would likely have no impact on actualservice to County residents.City of Bremerton <strong>Impact</strong>s. If the <strong>Gorst</strong> UGA were to be annexed by the City of Bremerton before 2035, thecurrent population of the <strong>Gorst</strong> UGA and the projected growth of 1,082 residents would come under thejurisdiction of the Bremerton Fire Department, for a total population of about 1,304 people over the next 20-30years. Under the Kitsap County Final SEIS prepared in 2012 for the Kitsap County UGA Resizing and CompositionRemand the City of Bremerton was estimated to grow by about 14,288 residents without annexing <strong>Gorst</strong> or anyother assigned UGA. The additional population from a <strong>Gorst</strong> annexation would only represent about nine percentadditional population growth, which would not be expected to affect the level of fire and EMS services in the Cityof Bremerton.Since the growth from the <strong>Gorst</strong> UGA is both small and spread out over time, the City of Bremerton would haveadequate time to plan for service changes as population increases impact levels of service. Interim demand needscould be served through mutual aid agreements with SKFR, who currently serves the population.Fire district fire protection service, equipment and facilities are funded almost exclusively by levies. If annexationoccurs, Bremerton Fire Department would have access to additional revenues and could be funded by the City ofBremerton’s general fund, with revenue from property and other taxes. This revenue increase could partially orfully offset any increased need for services and facilities. Also, if it was determined that it was more efficient tocontinue to serve the fire and EMS needs of the <strong>Gorst</strong> UGA from the SKFP station 16, then the revenues from theannexation and new growth in the area would likely be adequate to support contracted services for this area.Mitigation MeasuresIncorporated Plan FeaturesDistrict ServiceArea PopulationLOS = 0.36 FIRE UNITS PER 1,000 POPULATIONFire Units Neededto Meet LOSstandardFire UnitsAvailableNet Reserve or(Deficiency)2010 72,329 26.0 36.0 10.02035 Alternative 3 100,212 36.1 36.0 (0.1)• The County CFP determines LOS standards for fire protection/EMS. Future needs and costs can be determinedbased on these standards. Under the CFP, the County fire and rescue districts would continue to improve fireprotection efficiency by focusing on eliminating overlapping responsibilities and system inefficiencies, as wellas coordinating service provision with population growth.<strong>Draft</strong> | June 2013 3-185
GORST PLANNED ACTION EIS | AFFECTED ENVIRONMENT, SIGNIFICANT IMPACTS, AND MITIGATION MEASURES• From the County perspective, the No <strong>Action</strong> Alternative levels of growth are already accounted for in existingplanning documents due to the adoption of the 2012 Final Kitsap County Comprehensive Plan and CFP.• Alternatives 2 and 3 focus growth and concentrate densities, allowing for improved efficiency of service, suchas potentially lower response times.Applicable Regulations and Commitments• New development would be required to meet City of Bremerton and County codes, as well as InternationalFire Code and International Building Code regulations, regarding the provision of fire hydrants, fire flow, alarmsystems, sprinklers, and emergency vehicle access.Other Potential Mitigation Measures• If the City of Bremerton experiences unexpected demand needs due to annexation of <strong>Gorst</strong>, the City ofBremerton could work with SKFR to develop a Mutual Aid Agreement to serve the <strong>Gorst</strong> UGA area. Thisagreement could include information on sharing levy revenues generated within the <strong>Gorst</strong> UGA boundaries.Significant Unavoidable Adverse <strong>Impact</strong>sFuture population growth and development will continue to increase the need for fire protection/EMS servicesunder any studied alternative, and particularly the action alternatives. With mitigation, significant, unavoidableadverse impacts would not be anticipated.3.12.2. Law EnforcementAffected EnvironmentWatershedPolice service within the <strong>Gorst</strong> Creek watershed is provided by a mixture of City of Bremerton and County lawenforcement personnel. The watershed covers portions of the Cities of Bremerton and Port Orchard, as well asunincorporated Kitsap County. Those portions of the watershed Bremerton and Port Orchard corporate limits areserved by the police departments of those municipalities, and the Kitsap County Sheriff’s Office oversees lawenforcement in the unincorporated portions of the watershed, including the <strong>Gorst</strong> UGA. None of these lawenforcement agencies currently maintain any precinct offices or other facilities within the watershed.Bremerton Police DepartmentThe Bremerton Police Department consists of 12 civilian personnel and 57 sworn police personnel, including onechief, two captains, two lieutenants, seven sergeants, and 45 officers. In addition, there are five volunteerchaplains that assist the department. The Department provides law enforcement services, and contracts withKitsap County to provide jail services.Facilities InventoryThe Department is spread over three facilities: Administrative functions in City Hall, Patrol Division in the WestPrecinct, and a Special Operations Group house in another facility. See Table 3.12-6 Bremerton Police DepartmentFacility Inventory.<strong>Draft</strong> | June 2013 3-186
GORST PLANNED ACTION EIS | AFFECTED ENVIRONMENT, SIGNIFICANT IMPACTS, AND MITIGATION MEASURESTable 3.12-6Bremerton Police Department Facility InventorySource: City of Bremerton Comprehensive Plan City Service Appendix, 2010; and BERK, 2013LOSThe LOS for the Bremerton Police Department is a function of two different measures:1. The number of officers per 1,000 population2. The number of facility square feet per officer. The currently adopted LOS standards are 1.8 officers per 1,000population and 250 square feet per officer.Currently, the City of Bremerton is below its LOS standard for officers by 11 positions (see Table 3.12-7 BremertonPolice Department – Current Law Enforcement LOS Requirements). While there is adequate facility square footageto serve the existing number of officers, the City of Bremerton would be deficient in square feet per officer if itincreased staffing to 68 officers.Time PeriodName Location Size/QuantityTable 3.12-7Bremerton Police Department – Current Law Enforcement LOS RequirementsSource: City of Bremerton Comprehensive Plan City Service Appendix, 2010; and BERK, 2013Port Orchard Police DepartmentThe Port Orchard Police Department consists of 27 personnel, including one chief, one commander, threesergeants, three detectives, 15 officers, two records/evidence staff, and one public service officer. The Departmentprovides law enforcement services, and contracts with Kitsap County to provide jail services.The Port Orchard Police Department serves a very small section of the watershed; there are no facilities locateddirectly in the watershed and the Department will not be impacted by any of the growth alternatives.Kitsap County Sheriff’s OfficeCity Hall/Police 239 4th Street 7,085 sq ftWest Precinct/Patrol Headquarters 4846 Auto Center Way 3,700 sq ftCapital Hills Fire Station/SpecialInvestigative UnitDepartment TotalService NeedOFFICERS (LOS = 1.8 OFFICERS PER 1,000 POPULATION)3001 6th Street 5,400 sq ftNeeded to MeetLOS StandardAvailable16,185 sq ftNet Reserve or(Deficiency)2010 37,729 68 57 (11)FACILITIES (LOS = 250 SQUARE FEET PER OFFICER)2010 57 14,250 16,185 1,935The Kitsap County Sheriff’s Office (Sheriff’s Office) serves the unincorporated portion of the county. The majorresponsibilities of the Sheriff’s Office are law enforcement, maintenance of order, crime investigation andprevention, traffic control, marine enforcement, process and service of civil papers for the courts, service ofcriminal warrants, and emergency services. The Sheriff’s Office is made up of several divisions, which are under theadministration of the sheriff. Separate from the Sheriff’s Office are the County correctional facilities, which aremade up of a jail, a work release facility, and a juvenile facility.<strong>Draft</strong> | June 2013 3-187
GORST PLANNED ACTION EIS | AFFECTED ENVIRONMENT, SIGNIFICANT IMPACTS, AND MITIGATION MEASURESThe Sheriff’s main office facility located in Port Orchard houses the Sheriff, Undersheriff, records, detectives,patrol, patrol chief, administration, corrections, and the evidence/storage rooms. The Central Office located inSilverdale houses a patrol division, while the patrol chief maintains his administrative office at the courthouse. TheSilverdale office space includes the patrol captain, reception area, civil and records extension, patrol shiftsupervisor offices, and the deputies’ report/meeting room. The north office located in Kingston and the Kitsap MallOffice are satellite stations. The Readiness Center houses training classrooms and office space.The Sherriff’s office currently employs 114 Commissioned Deputies, 83 Corrections Officers and 31 supportpersonnel that are supplemented by well over 150 volunteers. Over time, the Sherriff’s office has seen crime ratesgo down, generally as staffing has increased. The Total Crime Index Rate has decreased from a rate of 31.24 per1,000 population in 2002 to 24.70 per 1,000 population in 2010. (Kitsap County 2012; Kitsap County 2010)The County correctional facilities, which serve the population of incorporated cities and the unincorporatedcounty, consist of a jail, a work release facility, and a juvenile facility. The correctional facilities, which are locatedon the courthouse campus in Port Orchard, are primarily two separate structures: the jail and the work releasebuilding. The jail is attached to the second floor of the courthouse and is accessible from the sheriff's main office.The work release facility is a separate two-story building on the courthouse campus. The capacity of the facility isapproximately 48 people. Unlike the facilities of the Sheriff’s Office, the work release facility is used by all lawenforcement agencies in the county. These facilities include corrections administration, warrant service, prisonerbooking, prisoner housing, reception and visiting, food service, medical and psychiatric care, recreation, andlibrary.Facilities InventoryLaw enforcement facilities include sheriff administration and operations offices (28,010 square feet), correctionsfacility (472 beds), work release facility (48 beds), and juvenile facility (35 beds). Table 3.12-8 Kitsap CountySheriff’s Office-Facility Inventory lists the facilities along with their current capacity and location. There are nofacilities located directly within the watershed.OFFICE FACILITIESTable 3.12-8Kitsap County Sheriff’s Office-Facility InventoryName Location Size/QuantitySheriffMain Office 614 Division Street, Port Orchard, WA 16,500 sq ftCentral Office 3951 Randall Way, Silverdale, WA 5,800 sq ftNorth Office 26076 Illinois Street, Kingston, WA 1,200 sq ftKitsap Mall Office 10315 Silverdale Way NW, Silverdale, WA 1,200 sq ftReadiness Center Office Space North Kitsap 3,200 sq ftFire District 17 Office McCormick Woods 110 sq ftTotal SheriffCorrections28,010 sq ftJail (lease) 614 Division Street, Port Orchard 472 bedsWork Release Facility (lease) Courthouse Campus, Port Orchard 48 bedsJuvenile Facility (lease) 1338 Old Clifton Road, Port Orchard 35 bedsTotal Corrections555 bedsSource: Kitsap County Sheriff’s Office, 2012; and BERK, 2013<strong>Draft</strong> | June 2013 3-188
GORST PLANNED ACTION EIS | AFFECTED ENVIRONMENT, SIGNIFICANT IMPACTS, AND MITIGATION MEASURESLOSSheriff Offices. In the 2012 Kitsap County Comprehensive Plan CFP, the County adopted an LOS of 129 square feetof sheriff offices per 1,000 unincorporated countywide population. There is no LOS standard established for thenumber of commissioned officers.County Jail. In the 2012 Kitsap County Comprehensive Plan CFP, the County adopted an LOS of 1.43 county jailbeds per 1,000 total countywide population.Work Release Facility. In the 2012 Kitsap County Comprehensive Plan CFP, the County adopted an LOS of 0.15work release facility beds per 1,000 total countywide population.Juvenile Facility. In the 2012 Kitsap County Comprehensive Plan CFP, the County adopted an LOS of 0.084 juvenilefacility beds per 1,000 total countywide population.Table 3.12-9 Kitsap County Sheriff’s Office – Current Law Enforcement LOS Requirements shows how the County’scurrent LOS compares to its adopted standard.Table 3.12-9Kitsap County Sheriff’s Office – Current Law Enforcement LOS RequirementsCURRENT LEVEL OF SERVICESource: Kitsap County Sheriff’s Office, 2012; and BERK, 2013The Sheriff’s Office is currently exceeding all of its adopted LOS standards related to law enforcement.<strong>Gorst</strong> UGATime PeriodPopulationServedNeeded to MeetLOS StandardSHERIFF OFFICES (LOS = 129 SQUARE FEET PER 1,000 POPULATION)AvailableNet Reserve or(Deficiency)2010 168,172 21,694 28,010 6,316COUNTY JAIL (LOS = 1.43 BEDS PER 1,000 POPULATION)2010 251,133 359 472 113WORK RELEASE FACILITY (LOS = 0.15 BEDS PER 1,000 POPULATION)2010 251,133 38 48 10JUVENILE FACILITY (LOS = 0.084 BEDS PER 1,000 POPULATION)2010 251,133 21 35 14Law enforcement services within the <strong>Gorst</strong> UGA are provided by the Kitsap County Sheriff’s Office. This is aregional service, and is described above for the <strong>Gorst</strong> Creek watershed.Figure 3.12-3 <strong>Gorst</strong> Creek Watershed: Map of Law Enforcement Facilities shows the current locations of theBremerton and Port Orchard Police Departments and Kitsap County Sheriff’s Office Facilities, including policestations.<strong>Draft</strong> | June 2013 3-189
THIS PAGE INTENTIONALLY BLANK
FIGURE 3.12-3 GORST CREEK WATERSHED: LAW ENFORCEMENT FACILITIES MAPBremertonWestUGACity of Bremerton<strong>Gorst</strong> UGAULID6SKIA UGAPortOrchardUGACity of Port OrchardLaw Enforcement FacilitiesPolice DepartmentKitsap County SheriffUrban Growth Area BoundaryIncorporated City BoundaryWatershed Boundary0 1 2MilesWashington State PatrolDate: May 2013Source: Kitsap County Sheriff, Bremerton Police Deparment, Washington State Patrol, Port Orchard Police Department
THIS PAGE INTENTIONALLY BLANK
GORST PLANNED ACTION EIS | AFFECTED ENVIRONMENT, SIGNIFICANT IMPACTS, AND MITIGATION MEASURES<strong>Impact</strong>sIMPACTS COMMON TO ALL ALTERNATIVESWatershedNo land use changes are proposed for the <strong>Gorst</strong> Creek watershed outside the <strong>Gorst</strong> UGA. Updated stormwater andhabitat regulations in this area are not anticipated to have any effect on the demand for police protection.Therefore, no significant impacts to law enforcement services are anticipated under any of the alternatives thataren’t already accounted for in existing planning documents.<strong>Gorst</strong> UGAAlternative 1Under the No <strong>Action</strong> Alternative, population in the <strong>Gorst</strong> UGA would grow by approximately 82 people through2035. This Alternative is identical to the Preferred Alternative adopted in the 2010 Kitsap County UGA Sizing andComposition Remand Final Supplemental <strong>Environmental</strong> <strong>Impact</strong> <strong>Statement</strong>.County <strong>Impact</strong>s. The estimated 82 additional residents would have minimal impact on the LOS for the KitsapCounty Sheriff’s Office. The County’s will be able to meet nearly all of its adopted LOS standards through 2035under Alternative 1, although it should consider adding an additional work release facility bed for full compliance.LOS impacts for Alternative 1 are shown in Table 3.12-10 Kitsap County Sheriff’s Office Projected LOS – Alternative1.ALTERNATIVE 1Time PeriodTable 3.12-10Kitsap County Sheriff’s Office Projected LOS – Alternative 1PopulationServedNeeded to MeetLOS StandardSHERIFF OFFICES (LOS = 129 SQUARE FEET PER 1,000 POPULATION)AvailableSource: Kitsap County Sheriff’s Office, 2012; Kitsap County Comprehensive Plan Capital Facilities Element, 2012;Washington State Office of Financial Management, 2012; and BERK, 2013There will be no change to the impacts from the <strong>Gorst</strong> UGA under the No <strong>Action</strong> Alternative.Net Reserve or(Deficiency)2010 168,172 21,694 28,010 6,3162035 Alternative 1 216,250 27,896 28,010 114COUNTY JAIL (LOS = 1.43 BEDS PER 1,000 POPULATION)2010 251,133 359 472 1132035 Alternative 1 329,473 471 472 1WORK RELEASE FACILITY (LOS = 0.15 BEDS PER 1,000 POPULATION)2010 251,133 38 48 102035 Alternative 1 329,473 49 48 (1)JUVENILE FACILITY (LOS = 0.084 BEDS PER 1,000 POPULATION)2010 251,133 21 35 142035 Alternative 1 329,473 28 35 7City of Bremerton <strong>Impact</strong>s. If the <strong>Gorst</strong> UGA were to be annexed by the City of Bremerton before 2035, thecurrent population of the <strong>Gorst</strong> UGA and the projected growth of 82 residents would come under the jurisdictionof the Bremerton Police Department, for a total population of about 304 people over the next 20-30 years. Underthe adopted Kitsap County Final prepared in 2012 for the Kitsap County UGA Resizing and Composition Remandthe City of Bremerton was estimated to grow by about 14,288 residents without annexing <strong>Gorst</strong> or any other UGA.<strong>Draft</strong> | June 2013 3-193
GORST PLANNED ACTION EIS | AFFECTED ENVIRONMENT, SIGNIFICANT IMPACTS, AND MITIGATION MEASURESThe additional population from a <strong>Gorst</strong> annexation would only represent an approximately two percent additionalpopulation growth increase.If the annexation were to occur in the relatively near future, the impact on police LOS would be a relatively modestadditional need for 0.4 commissioned officers. This impact would grow only marginally under Alternative 1, as theadditional 82 residents would require 0.15 commissioned officers. Since the growth from the <strong>Gorst</strong> UGA is bothsmall and spread out over time, the City of Bremerton would have adequate time to plan for service changes aspopulation increases impact levels of service. However, the City of Bremerton acknowledges in its 2010 CFP thatthe City of Bremerton already has a staffing level that is too low, and would generally benefit from increasedstaffing, especially if required to take on additional geography and population. Though, an additional 82 residentswould be unlikely to have a substantial impact on overall demand for police services.The County and City of Bremerton LOS standards are not based on employment growth, but it is likely the caseloadcould increase due to calls for service related to commercial businesses.Alternative 2Alternative 2 models a moderate growth level for the <strong>Gorst</strong> UGA, higher than under the No <strong>Action</strong> Alternative butlower than under Alternative 3. Alternative 2 assumes a 2035 <strong>Gorst</strong> UGA population of 1,207, which is an increaseof 985 residents over current population levels.County <strong>Impact</strong>s. The estimated 985 additional residents would have minimal impact on the LOS for the KitsapCounty Sheriff’s Office. The County’s will be able to meet nearly all of its adopted LOS standards through 2035under Alternative 2. LOS impacts for Alternative 2 are shown in Table 3.12-11 Kitsap County Sheriff’s OfficeProjected LOS – Alternative 2.ALTERNATIVE 2Time PeriodTable 3.12-11Kitsap County Sheriff’s Office Projected LOS – Alternative 2PopulationServedNeeded to MeetLOS StandardSHERIFF OFFICES (LOS = 129 SQUARE FEET PER 1,000 POPULATION)AvailableNet Reserve or(Deficiency)2010 168,172 21,694 28,010 6,3162035 Alternative 2 217,153 28,013 28,010 (3)COUNTY JAIL (LOS = 1.43 BEDS PER 1,000 POPULATION)2010 251,133 359 472 1132035 Alternative 2 330,376 472 472 -WORK RELEASE FACILITY (LOS = 0.15 BEDS PER 1,000 POPULATION)2010 251,133 38 48 102035 Alternative 2 330,376 50 48 (2)JUVENILE FACILITY (LOS = 0.084 BEDS PER 1,000 POPULATION)2010 251,133 21 35 142035 Alternative 2 330,376 28 35 7Source: Kitsap County Sheriff’s Office, 2012; Kitsap County Comprehensive Plan Capital Facilities Element, 2012;Washington State Office of Financial Management, 2012; and BERK, 2013The small increase in population growth in Alternative 2 drives a few potential needs for additional facilities. TheSheriff Offices LOS would be deficient by only three square feet, which is not a meaningful difference from meetingthe standard and would not need to be addressed. However, the County should consider adding a couple workrelease facility beds in order to meet the LOS fully by 2035 under Alternative 2. Since the County does not have anadopted standard for police personnel, the potential impacts on police service delivery cannot be evaluated.<strong>Draft</strong> | June 2013 3-194
GORST PLANNED ACTION EIS | AFFECTED ENVIRONMENT, SIGNIFICANT IMPACTS, AND MITIGATION MEASURESCity of Bremerton <strong>Impact</strong>s. If the <strong>Gorst</strong> UGA were to be annexed by the City of Bremerton before 2035, thecurrent population of the <strong>Gorst</strong> UGA and the projected growth of 985 residents would come under the jurisdictionof the Bremerton Police Department, for a total population of about 1,207 people over the next 20-30 years.Under the Kitsap County Final SEIS prepared in 2012 for the Kitsap County UGA Resizing and Composition Remand,the City of Bremerton was estimated to grow by about 14,288 residents without annexing <strong>Gorst</strong> or any other UGA.The additional population from a <strong>Gorst</strong> annexation would only represent an approximately eight percentadditional population growth increase.If the annexation were to occur in the relatively near future, the impact on police LOS would be a relatively modestadditional need for 0.4 commissioned officers. This impact would be higher under this alternative as the additional985 residents would require1.8 commissioned officers. While this level of additional growth would imply the needto add 2.2 commissioned police officers at the adopted LOS, the growth from the <strong>Gorst</strong> UGA will likely be relativelymodest and spread out over time, giving the City of Bremerton adequate time to plan for service changes aspopulation increases impact levels of service. In addition, the incremental tax revenues that would come with anannexation would be available to at least partially fund incremental public safety costs.However, the City of Bremerton acknowledges in its 2010 CFP that the City of Bremerton already has a staffinglevel that is too low, and would generally benefit from increased staffing, especially if required to take onadditional geography and population.The County and City of Bremerton LOS standards are not based on employment growth, but it is likely the caseloadcould increase due to calls for service related to commercial businesses.Alternative 3Alternative 3 models the highest growth level for the <strong>Gorst</strong> UGA, and assumes a 2035 <strong>Gorst</strong> UGA population of1,304, which is an increase of 1,082 residents over current population levels.County <strong>Impact</strong>s. The estimated 1,082 additional residents would have minimal impact on the LOS for the KitsapCounty Sheriff’s Office. The County’s will be able to meet nearly all of its adopted LOS standards through 2035under Alternative 3. LOS impacts for Alternative 3 are shown in Table 3.12-12 Kitsap County Sheriff’s OfficeProjected LOS – Alternative 3.<strong>Draft</strong> | June 2013 3-195
GORST PLANNED ACTION EIS | AFFECTED ENVIRONMENT, SIGNIFICANT IMPACTS, AND MITIGATION MEASURESALTERNATIVE 3Time PeriodTable 3.12-12Kitsap County Sheriff’s Office Projected LOS – Alternative 3Source: Kitsap County Sheriff’s Office, 2012; Kitsap County Comprehensive Plan Capital Facilities Element; WashingtonState Office of Financial Management, 2012; and BERK, 2013The small increase in population growth in Alternative 3 drives a few potential needs for additional facilities. TheSheriff Offices LOS would be deficient by about 15 square feet, which is not a meaningful difference from meetingthe standard and would not need to be addressed. However, the County should consider adding a couple workrelease facility beds and one county jail bed in order to meet the LOS fully by 2035 under Alternative 3.City of Bremerton <strong>Impact</strong>s. If the <strong>Gorst</strong> UGA were to be annexed by the City of Bremerton before 2035, thecurrent population of the <strong>Gorst</strong> UGA and the projected growth of 1,082 residents would come under thejurisdiction of the Bremerton Police Department, for a total population of about 1,304 people over the next 20-30years. Under the Kitsap County Final SEIS prepared in 2012 for the Kitsap County UGA Resizing and CompositionRemand, the City of Bremerton was estimated to grow by about 14,288 residents without annexing <strong>Gorst</strong> or anyother UGA. The additional population from a <strong>Gorst</strong> annexation would only represent an approximately ninepercent additional population growth increase.If the annexation were to occur in the relatively near future, the impact on police LOS would be a relatively modestadditional need for 0.4 commissioned officers. This impact would be highest among the alternatives as theadditional 1,082 residents would require1.95 commissioned officers. While this level of additional growth wouldimply the need to add almost 2.4 commissioned police officers at the adopted LOS, the growth from the <strong>Gorst</strong> UGAis likely to be out over time, giving the City of Bremerton adequate time to plan for service changes as populationincreases impact levels of service. However, the City of Bremerton acknowledges in its 2010 CFP that the City ofBremerton already has a staffing level that is too low, and would generally benefit from increased staffing,especially if required to take on additional geography and population.The County and City of Bremerton LOS standards are not based on employment growth, but it is likely the caseloadcould increase due to calls for service related to commercial businesses.Mitigation MeasuresIncorporated Plan FeaturesPopulationServedNeeded to MeetLOS StandardSHERIFF OFFICES (LOS = 129 SQUARE FEET PER 1,000 POPULATION)AvailableNet Reserve or(Deficiency)2010 168,172 21,694 28,010 6,3162035 Alternative 3 217,250 28,025 28,010 (15)COUNTY JAIL (LOS = 1.43 BEDS PER 1,000 POPULATION)2010 251,133 359 472 1132035 Alternative 3 330,473 473 472 (1)WORK RELEASE FACILITY (LOS = 0.15 BEDS PER 1,000 POPULATION)2010 251,133 38 48 102035 Alternative 3 330,473 50 48 (2)JUVENILE FACILITY (LOS = 0.084 BEDS PER 1,000 POPULATION)2010 251,133 21 35 142035 Alternative 3 330,473 28 35 7• Alternatives 2 and 3 focus growth and concentrate densities, allowing for improved efficiency of service.Creating a more compact development pattern allows for smaller patrol areas and faster response times.<strong>Draft</strong> | June 2013 3-196
GORST PLANNED ACTION EIS | AFFECTED ENVIRONMENT, SIGNIFICANT IMPACTS, AND MITIGATION MEASURES• If urban areas are annexed into adjoining cities or incorporated into new cities, patrol-related functions maybe assumed by the cities, while joint use of some facilities (e.g., jails) could be retained at the County level.Applicable Regulations and Commitments• Police departments and the Sheriff’s Office are maintained primarily through the general fund, which isfunded through sales and property tax revenues. The increased tax base associated with increased populationand development would increase tax revenues and bonding potential, providing additional funding for lawenforcement services and facilities.Other Potential Mitigation Measures• In order to address future deficiencies, the Kitsap County Sheriff’s Office could choose to adjust their LOSstandards to reflect the likely service levels in 2035, given estimated population growth and planned facilities.• The City of Bremerton and County could pursue implementation of mutual aid agreements if increasing <strong>Gorst</strong>population impacts levels of service.Significant Unavoidable Adverse <strong>Impact</strong>sFuture population growth and development will continue to increase the need for law enforcement services andfacilities under all alternatives. With mitigation, significant, unavoidable adverse impacts would not be anticipated.3.12.3. SchoolsAffected EnvironmentWatershedKitsap County Districts. There are six school districts within Kitsap County: North Kitsap, Central Kitsap, SouthKitsap, Bremerton, Bainbridge Island, and North Mason School District. Only the SKSD is affected by the differentsubarea alternatives, as it encompasses the <strong>Gorst</strong> UGA and the <strong>Gorst</strong> Creek watershed. All other districts would beunaffected by varying levels of growth within the <strong>Gorst</strong> UGA.Enrollment and Capacity Methodology. Enrollment data is measured by the Washington State Office of theSuperintendent of Public Instruction (OSPI). They conduct semi-annual student counts in October and May of eachschool year. The enrollment data presented here reflects the October 2011 student counts for the SKSD.Facility InventoryFacility Capacity. The inventories and analysis of capacity are presented in two ways:1. With interim facilities, such as portables2. Without interim facilities. Districts base their capital improvement projects on the capacity without interimfacilities because portables have significant limitations in areas such as heating, ventilation, noise, security,restrooms, storage cupboards, and intercom communications. For these reasons, portables are not consideredpermanent capacity by either the state or the districts. The capacity of portable rooms is presented in order toshow the interim facilities that the districts use to meet short-term enrollment fluctuations or to serve astemporary facilities until permanent facilities are built.Finally, capacity figures are generally based on teacher-to-student ratios (expressed as students per classroom)that the school district determines to be most appropriate to accomplish its educational program. These ratios areoften contained in employment agreements between districts and their teachers.The <strong>Gorst</strong> Creek watershed is served by the SKSD. The district includes 10 elementary schools, three junior highschools, and one alternative and one comprehensive high school. The majority of the schools are locatedthroughout the southern portion of unincorporated Kitsap County, while South Kitsap High School, Cedar Heights<strong>Draft</strong> | June 2013 3-197
GORST PLANNED ACTION EIS | AFFECTED ENVIRONMENT, SIGNIFICANT IMPACTS, AND MITIGATION MEASURESJunior High School, and Sidney Glen Elementary are located within the Port Orchard city limits. The gradeconfiguration is based on grades K–6, elementary; grades 7–9, junior high; and grades 10–12, senior high school.Current School Inventory. Table 3.12-3 SKSD Enrollment Capacity lists the schools of the SKSD and their enrollmentcapacity.LOSSchoolElementary Schools (K–6)Source: SKSD, 2012Table 3.12-13SKSD Enrollment CapacityCurrentEnrollmentCapacityBurley-Glenw ood 528East Port Orchard 467Hidden Creek 526Manchester 441Mullenix Ridge 480Olalla 408Orchard Heights 729Sidney Glen 467South Colby 216Sunnyslope 417Total Elementary Permanent Facilities 4,679Total Elementary Interim (Portables) Facilities 1,008Explorer Alternative Program – Interim (Portable) Facilities 48Total Elementary Permanent and Interim Facilities 5,735Junior High Schools (7–9)Cedar Heights 605John Sedgw ick 839Marcus Whitman 796Total Junior High Permanent Facilities 2,240Total Junior High – Interim (Portable) Facilities 443Explorer Alternative Program – Interim (Portable) Facilities 26Total Junior High Permanent and Interim Facilities 2,709Senior High Schools (10–12)South Kitsap 1,972Alternative 174Total Senior High Permanent Facilities 2,146Total Senior High Interim (Portables) Facilities 218Explorer Alternative Program – Interim (Portable) Facilities 26Total Senior High Permanent and Interim Facilities 2,390A LOS capacity analysis was applied to SKSD based on a student to household ratio that was developed bycomparing 2011 Office of the Superintendent of Public Instruction (OSPI) enrollment numbers to 2011 estimates of<strong>Draft</strong> | June 2013 3-198
GORST PLANNED ACTION EIS | AFFECTED ENVIRONMENT, SIGNIFICANT IMPACTS, AND MITIGATION MEASUREShouseholds by school district. The results, expressed in the number of students a school is able to accommodatebased on the enrollment capacity inventories noted above are shown below. Where numbers are shown aspositive, the district has a net reserve of school capacity in terms of the number of students it can accommodate.Where numbers are shown in the negative, the district has a deficit of school capacity in terms of the number ofstudents it can accommodate.SKSD’s current LOS summary is shown in Table 3.12-14 SKSD Current LOS Requirements. The district has adequatecapacity to serve its existing students with its interim facilities included in total capacity.Time PeriodTable 3.12-14SKSD Current LOS Requirements1 LOS analysis compares student capacity to enrollment. Where information is available, total capacity includes portablefacilities.2 October 2011 student count.Source: SKSD, 2012; Washington State OSPI, 2012; Washington State Office of Financial Management (OFM), 2012; and BERK,2013<strong>Gorst</strong> UGAThe <strong>Gorst</strong> UGA is also served by the SKSD. The inventory and current levels of service are as noted above for the<strong>Gorst</strong> Creek watershed.<strong>Impact</strong>sIMPACTS COMMON TO ALL ALTERNATIVESWatershedNo land use changes are proposed for the <strong>Gorst</strong> Creek watershed outside the <strong>Gorst</strong> UGA beyond already adoptedComprehensive Plans. Updated stormwater and habitat regulations in this area are not anticipated to have anyeffect on the number of students in the SKSD.<strong>Gorst</strong> UGAStudent perHouseholdRatio 1HouseholdsEnrollment2Perm.CapacityNet Reserve or(Deficiency)TotalCapacity 3Net Reserve or(Deficiency)2011 0.38 25,860 9,742 9,065 (677) 10,834 1,092Annexation by Bremerton of the <strong>Gorst</strong> UGA would not change the district boundaries for children living in <strong>Gorst</strong>.Under both circumstances, these students would attend SKSD.The alternatives will affect SKSD by increasing residential development, and consequently the number of studentsenrolled in SKSD. Under all alternatives, the number of students generated is fairly minimal and should notincrease demand much beyond that addressed in the Preferred Alternative adopted in the 2012 Kitsap CountyUGA Sizing and Composition Remand Final Supplemental <strong>Environmental</strong> <strong>Impact</strong> <strong>Statement</strong>.While SKSD has its own growth projections based on the needs of its own services, this analysis starts with the2010 Census and projects future growth to 2035 using the Kitsap County urban land capacity analysis methodologyconsistent with other regional planning efforts. This analysis bases future enrollment levels on a student-perhouseholdratio using the number of households projected from the land capacity analysis described in Chapter 3.The net change in household growth for each alternative was added to the 2010 base household number fromOFM’s small area estimates. The student-per-household ratios were then applied to the increase in householdsfrom 2010 to 2035.<strong>Draft</strong> | June 2013 3-199
GORST PLANNED ACTION EIS | AFFECTED ENVIRONMENT, SIGNIFICANT IMPACTS, AND MITIGATION MEASURESEach school district has adopted its own CFP, which was reviewed for this analysis and augmented with personalcommunication to surface any updates since the last CFP was adopted. Funding for each district is generated froma variety of sources including impact fees, city and county property taxes, and state and federal funding based onstudent enrollment. SKSD is planning two capacity projects: the first will result in two new double portables, for acapacity increase of about 100 students by 2018, and the second will result in a new high school that will addpermanent capacity for about 1,800 students. Non-capacity projects include myriad improvements to existingfacilities, and modernization or replacement of three elementary schools, Cedar Heights Junior High School, andSouth Kitsap High School. The district also plans to modernize some administrative buildings. Costs and funding formost projects are yet to be determined.Per KCC 4.110.100 D, each school district is to establish an impact fee for new housing built within the district.<strong>Impact</strong> fees for SKSD are collected by Kitsap County from development in unincorporated areas of the County, butare not collected within the City of Bremerton for its areas served by SKSD.<strong>Impact</strong> fee revenue from unincorporated development can be used to make system improvements listed in theCFP, which may include school planning, land acquisition, site improvements, offsite improvements such assidewalks, and construction and engineering. Fees are $962.60 for each single-family dwelling unit ormanufactured home and $555.35 for each multifamily dwelling unit for all districts. If in the judgment of the schooldistrict, none of the fee categories or fee amounts set forth in KCC 4.110.220 accurately describe or capture theimpacts of a new development on schools, the school district may conduct independent fee calculations andsubmit such calculations to the director.The following tables summarize projected capacity surpluses and deficits in 2035 based on current capacity andfuture enrollment under the alternatives. Estimated enrollment in 2035 is district-wide, including bothunincorporated and incorporated areas.Alternative 1Table 3.12-15 Projected SKSD LOS – Alternative 1 summarizes projected capacity for SKSD in 2035 based on currentcapacity, planned capacity improvements, and projected enrollment based on household growth. The analysis isshown based on both permanent capacity and capacity including interim facilities. This Alternative is identical tothe Preferred Alternative adopted in the 2012 Kitsap County UGA Sizing and Composition Remand FinalSupplemental <strong>Environmental</strong> <strong>Impact</strong> <strong>Statement</strong>.Time PeriodStudent perHouseholdRatio 1Table 3.12-15Projected SKSD LOS – Alternative 1HouseholdsEnrollment2Perm.CapacityNet Reserve or(Deficiency)TotalCapacity 3Net Reserve or(Deficiency)2011 0.38 25,860 9,742 9,065 (677) 10,834 1,092Additional <strong>Planned</strong> Capacity Through 2035 1,900 1,9002035 Alternative 1 0.42 35,653 14,927 10,965 (3,962) 12,734 (2,193)Note:1 This is the effective ratio calculated by applying the multifamily and single family generation rates to growth in thosespecific types of households.2 October 2011 headcount from OSPI.3 Includes permanent and interim (portables) facilities.Source: SKSD, 2012; Washington State OSPI, 2012; Washington State OFM, 2012; and BERK, 2013By 2035, SKSD is estimated to have a deficit of about 2,200 student spaces under Alternative 1.<strong>Draft</strong> | June 2013 3-200
GORST PLANNED ACTION EIS | AFFECTED ENVIRONMENT, SIGNIFICANT IMPACTS, AND MITIGATION MEASURESAlternative 2Table 3.12-16 Projected SKSD LOS – Alternative 2 summarizes projected capacity for SKSD in 2035 based on currentcapacity, planned capacity improvements, and projected enrollment based on household growth. The analysis isshown based on both permanent capacity and capacity including interim facilities. This Alternative has a higherlevel of projected growth than Alternative 1, but less than Alternative 2.Time PeriodStudent perHouseholdRatio 1Table 3.12-16Projected SKSD LOS – Alternative 2HouseholdsEnrollment2Perm.CapacityNet Reserve or(Deficiency)TotalCapacity 3Net Reserve or(Deficiency)2011 0.38 25,860 9,742 9,065 (677) 10,834 1,092Additional <strong>Planned</strong> Capacity Through 2035 1,900 1,9002035 Alternative 2 0.42 36,158 15,139 10,965 (4,174) 12,734 (2,405)Note:1 This is the effective ratio calculated by applying the multifamily and single family generation rates to growth in thosespecific types of households.2 October 2011 headcount from OSPI.3 Includes permanent and interim (portables) facilities.Source: SKSD, 2012; Washington State OSPI, 2012; Washington State OFM, 2012; and BERK, 2013By 2035, SKSD is estimated to have a deficit of about 2,400 student spaces under Alternative 2. This is about 200additional students that the District would need to plan for above the No <strong>Action</strong> level of growth.Alternative 3Table 3.12-17 Projected SKSD LOS – Alternative 3 summarizes projected capacity for SKSD in 2035 based on currentcapacity, planned capacity improvements, and projected enrollment based on household growth. The analysis isshown based on both permanent capacity and capacity including interim facilities. This Alternative has a higherlevel of projected growth than Alternative 1, but less than Alternative 2.Time PeriodStudent perHouseholdRatio 1Table 3.12-17Projected SKSD LOS – Alternative 3HouseholdsEnrollment2Perm.CapacityNet Reserve or(Deficiency)TotalCapacity 3Net Reserve or(Deficiency)2011 0.38 25,860 9,742 9,065 (677) 10,834 1,092Additional <strong>Planned</strong> Capacity Through 2035 1,900 1,9002035 Alternative 3 0.42 36,217 15,164 10,965 (4,199) 12,734 (2,430)Note:1 This is the effective ratio calculated by applying the multifamily and single family generation rates to growth in thosespecific types of households.2 October 2011 headcount from OSPI.3 Includes permanent and interim (portables) facilities.Source: SKSD, 2012; Washington State OSPI, 2012; Washington State OFM, 2012; and BERK, 2013By 2035, SKSD is estimated to have a deficit of about 2,430 student spaces under Alternative 3. This is about 230additional students the District would need to accommodate by 2035, compared to the adopted No <strong>Action</strong> level ofgrowth.<strong>Draft</strong> | June 2013 3-201
GORST PLANNED ACTION EIS | AFFECTED ENVIRONMENT, SIGNIFICANT IMPACTS, AND MITIGATION MEASURESMitigation MeasuresIncorporated Plan Features• The County’s regular review of the CFP in coordination with the school districts should allow for ongoing longrangeplanning for educational services.Applicable Regulations and Commitments• School districts are required to plan for growth over time by regularly updating their six-year capitalimprovement program.• Adopted school impact mitigation fees would be collected for new residential development within <strong>Gorst</strong> if itremains in unincorporated Kitsap County.Other Potential Mitigation Measures• To address enrollment changes on an ongoing basis, prior to reaching the level of demand that wouldnecessitate construction of a new facility; districts can use portable classrooms to temporarily meet growthdemands. Portables can be funded by impact fees paid by residential developers.• The County, cities, and school districts could work together to identify potential sites for new schooldevelopment in areas where higher amounts of growth are planned.Significant Unavoidable Adverse <strong>Impact</strong>sThe demand for school services and facilities will increase as new development occurs and the number of familieswith school-aged children increases. With mitigation, significant, unavoidable adverse impacts would not beanticipated.3.12.4. Parks, Recreation, and Open SpaceAffected EnvironmentWatershedParks and recreational opportunities within the <strong>Gorst</strong> Creek watershed are provided by several agencies, includingthe City of Bremerton, Kitsap County, and the City of Port Orchard, as well as private owners. The majority of thewatershed is located within Bremerton city limits, and the City of Bremerton owns a large portion of the land.Facility InventoryThe City of Bremerton currently provides its residents with about 680 acres of parks and open space, while KitsapCounty owns and manages about 6,700 acres of parks and open space, seven miles of shoreline access, and 74miles of trails.Major public parks and private recreational facilities within and near the watershed include the following:• Gold Mountain Golf Club. Located north of the Bremerton National Airport, Gold Mountain Golf Club is apublic golf club, owned by the City of Bremerton that includes two 18-hole courses. The club also includes arestaurant, which is available for weddings and other private events.• McCormick Woods. McCormick Woods is a master-planned community in Port Orchard, located just east ofBremerton National Airport. The community features an 18-hole golf course, a clubhouse restaurant, andhomes near the course. Membership to the golf club is available for a monthly fee.• Otto Jarstad Park. Located on <strong>Gorst</strong> Creek within the City of Bremerton’s City Utility forest lands, Otto JarstadPark was the site of stream restoration project in 2000. The park features covered picnic areas, restrooms,barbecue grills, horseshoe pits, volleyball courts, running water, and electrical outlets. Reservations can bemade through the Bremerton Department of Public Works and Utilities.<strong>Draft</strong> | June 2013 3-202
GORST PLANNED ACTION EIS | AFFECTED ENVIRONMENT, SIGNIFICANT IMPACTS, AND MITIGATION MEASURESLOSCity of Bremerton. The City of Bremerton set LOS standards for open space, regional parks, and local parks as partof its most recent comprehensive plan, adopted in 2010. Its LOS standards are:• Open Space. The adopted LOS for open space is 2.21 acres per 1,000 population. Currently, the City ofBremerton provides about 82 acres of open space, which is one acre fewer than the 83 acres needed to meetpopulation-driven LOS standard.• Regional Parks. The adopted LOS for regional parks is 14.64 acres per 1,000 population. Currently, the City ofBremerton provides about 544 acres of regional parks, which is about eight acres fewer than the 552 acresneeded to meet the population-driven LOS standard.• Local Parks. The adopted LOS for local parks is 1.48 acres per 1,000 population. The City of Bremertoncurrently provides about 52 acres of local parks. In order to meet the adopted LOS standard, the City ofBremerton should provide about 56 acres, which would involve adding an additional four acres of local parks.Kitsap County. The levels of service analyzed in this section are based on those adopted in the 2012 Kitsap CountyComprehensive Plan CFP. The County CFP adopted two levels of LOS standard for parks, recreation, and openspace:1. “Target” LOS based on the 2012 Kitsap County PROS Plan2. “Base” LOS, which reflects a fiscally constrained CFP and the likely ability to acquire and develop park landsover time. Should the County secure additional funding, projects may be added that would move the Countycloser to the Target LOS.The County is currently meetings its Base LOS for all categories as shown in Table 3.12-18 Current Kitsap CountyParks, Recreation, and Open Space LOS Requirements. The County is meeting its higher Target LOS for shorelineaccess and trails.<strong>Gorst</strong> UGATable 3.12-18Current Kitsap County Parks, Recreation, and Open Space LOS Requirements“Target” LOS(per 1,000 pop)2010 AchievedLOS(per 1,000 pop)“Base” LOS(per 1,000 pop)Open Space 71.0 acres 74.2 acres 57.1 acresRegional Parks 16.0 acres 11.6 acres 8.9 acresHeritage Parks 19.0 acres 15.1 acres 11.5 acresCommunity Parks 4.65 acres 4.58 acres 3.5 acresShoreline Access 0.061 miles 0.096 miles 0.061 milesTrails 0.20 miles 0.29 miles 0.20 milesSource: Kitsap County Comprehensive Plan Capital Facilities Element, 2012; and BERK, 2013The <strong>Gorst</strong> UGA is served by the Kitsap County Parks and Recreation Department, whose facility inventory andcurrent levels of service are noted above in the <strong>Gorst</strong> Creek watershed section. The <strong>Gorst</strong> UGA contains very littledesignated park or recreational land within the UGA, but some recreational opportunities are in close proximity:<strong>Draft</strong> | June 2013 3-203
GORST PLANNED ACTION EIS | AFFECTED ENVIRONMENT, SIGNIFICANT IMPACTS, AND MITIGATION MEASURES• Sinclair Inlet Wildlife Area. Kitsap County owns approximately 15 acres of shoreline property immediatelyadjacent to the eastern boundary of the <strong>Gorst</strong> UGA. This park is programmed for passive use, primarily wildlifeviewing and habitat restoration. The park features a wildlife viewing platform that provides visual access tothe Sinclair Inlet mudflats.Figure 3.12-4 <strong>Gorst</strong> Creek Watershed: Parks, Recreation, and Open Space Map shows the location of publicly andprivately owned parks, recreation areas, and open space near the <strong>Gorst</strong> Creek watershed and <strong>Gorst</strong> UGA.<strong>Impact</strong>sIMPACTS COMMON TO ALL ALTERNATIVESWatershedNo land use changes are proposed for the <strong>Gorst</strong> Creek watershed outside the <strong>Gorst</strong> UGA beyond adoptedComprehensive Plan. Updated stormwater and habitat regulations in this area are not anticipated to have anyeffect on the demand for parks, recreation, and open space. Therefore, no significant impacts to these services areanticipated under any of the alternatives.<strong>Gorst</strong> UGACounty <strong>Impact</strong>s. If the <strong>Gorst</strong> UGA remains in the County, all alternatives would result in a marginal increase indemand for County park and recreation facilities. The specific facilities impacted or the geographic need for newfacilities would depend in part on the location of growth, which will vary by alternative.Per KCC Chapters 410.110.020 and 410.110.210, the County collects a parks impact fee for each new housing unitdeveloped in unincorporated areas. <strong>Impact</strong> fee revenues are directed toward park planning, land acquisition, siteimprovements, construction and engineering, mitigation costs, and capital equipment. New development underthe alternatives would also generate revenue from REET, which can be used for any type of capital project in theCounty. A portion of increased tax revenues could be used to fund acquisition and development of new parks andrecreation facilities, as well as operation and maintenance of new and existing facilities under all alternatives.City of Bremerton <strong>Impact</strong>s. If the City of Bremerton were to annex the <strong>Gorst</strong> UGA, the current population andprojected population growth within the UGA would drive some additional demand for Parks services. While theCity of Bremerton does not charge a parks impact fee to offset the demand from new development, the City ofBremerton could require that any master planned development include park or open space land for its residents.<strong>Draft</strong> | June 2013 3-204
FIGURE 3.12-4 GORST CREEK WATERSHED: PARKS, RECREATION, AND OPEN SPACEKitsap Lake ParkForest Ridge ParkPendergast Regional ParkUnion RiverView Point ParkCity of BremertonBremertonWestUGAHeins CreekBremerton Watershed& Utility Lands<strong>Gorst</strong> CreekOtto JarstandPark <strong>Gorst</strong> UGASinclair InletWildlife AreaRoss CreekVan Zee ParkSKIA UGAParish CreekULID6City of BremertonAnderson CreekCity of Port OrchardPortOrchardUGAPowers ParkBlackjack CreekBremerton NationalAirportCoulter CreekCalvinwoodSquare CreekSquare Lake State ParkBlackjack CreekWatershed BoundaryUGA BoundaryCity LimitsWaterStreamsParkPrivateBremertonSouth Kitsap Park DistrictKitsap CountyStateDate: May 2013Source: Parametrix, Department of Natural Resources, Department ofFish and Wildlife, BERK0 0.5 1Miles
THIS PAGE INTENTIONALLY BLANK
GORST PLANNED ACTION EIS | AFFECTED ENVIRONMENT, SIGNIFICANT IMPACTS, AND MITIGATION MEASURESTime PeriodTable 3.12-19City of Bremerton Open Space LOS <strong>Impact</strong>s – Alternative 1City ofBremertonPopulationLOS = 2.21 ACRES PER 1,000 POPULATIONAcres to MeetLOS StandardAcres AvailableNet Reserve or(Deficiency)2010 37,729 83 82 (1)2035 City w /o <strong>Gorst</strong> 52,017 115 82 (33)2035 Alternative 1 52,321 116 82 (33)Source: Washington State OFM, 2012; Bremerton Parks, Recreation, and Open Space Plan, 2007; City of BremertonComprehensive Plan, 2010; and BERK, 2013Table 3.12-20City of Bremerton Regional Parks LOS <strong>Impact</strong>s – Alternative 1Time PeriodCity ofBremertonPopulationLOS = 14.64 ACRES PER 1,000 POPULATIONAcres to MeetLOS StandardAcres AvailableNet Reserve or(Deficiency)2010 37,729 552 544 (8)2035 City w /o <strong>Gorst</strong> 52,017 762 544 (217)2035 Alternative 1 52,321 766 544 (222)Source: Washington State OFM, 2012; Bremerton Parks, Recreation, and Open Space Plan, 2007; City of BremertonComprehensive Plan, 2010; and BERK, 2013Table 3.12-21City of Bremerton Local Parks LOS <strong>Impact</strong>s – Alternative 1Time PeriodCity ofBremertonPopulationLOS = 1.48 ACRES PER 1,000 POPULATIONAcres to MeetLOS StandardAcres AvailableNet Reserve or(Deficiency)Alternative 12010 37,729 56 52 (4)2035 City w /o <strong>Gorst</strong> 52,017 77 52 (25)2035 Alternative 1 52,321 77 52 (25)Source: Washington State OFM, 2012; Bremerton Parks, Recreation, and Open Space Plan, 2007; City of BremertonComprehensive Plan, 2010; and BERK, 2013Under the No <strong>Action</strong> Alternative, population in the <strong>Gorst</strong> UGA would grow by approximately 82 people through2035. This Alternative is identical to the Preferred Alternative adopted in the 2012 Kitsap County ComprehensivePlan CFP. Since this alternative assumes mostly employment growth and very little housing growth, there is anegligible effect on a population-based service like parks and recreation.County <strong>Impact</strong>s. Given that the Base LOS standards were adopted to meet growth projections from the currentComprehensive Plan, the County will be able to meet its parks LOS measures under Alternative 1 with theprojected growth in the <strong>Gorst</strong> UGA.City of Bremerton <strong>Impact</strong>s. If the City of Bremerton annexes the <strong>Gorst</strong> UGA, it would have the following impactson demand for City of Bremerton parks services as compared to the adopted LOS:<strong>Draft</strong> | June 2013 3-207
GORST PLANNED ACTION EIS | AFFECTED ENVIRONMENT, SIGNIFICANT IMPACTS, AND MITIGATION MEASURES• Additional demand for about one acre of open space by 2035. (Shown in Table 3.12-19 City of Bremerton OpenSpace LOS <strong>Impact</strong>s – Alternative 1).• Additional demand for about two acres of regional parks by 2035. (Shown in Table 3.12-20 City of BremertonRegional Parks LOS <strong>Impact</strong>s – Alternative 1).• No additional demand for local parks. (Shown in Table 3.12-21 City of Bremerton Local Parks LOS <strong>Impact</strong>s –Alternative 1). Although the LOS may be met on a citywide basis, the City of Bremerton should considerregional assessments of its parks services to ensure that new development within the <strong>Gorst</strong> UGA would beserved by local parks.Alternative 2Alternative 2 models a moderate growth level for the <strong>Gorst</strong> UGA, higher than under the No <strong>Action</strong> Alternative butlower than under Alternative 3. Alternative 2 assumes a 2035 <strong>Gorst</strong> UGA population of 1,207, which is an increaseof 985 residents over current population levels.County <strong>Impact</strong>s. Given that Alternative 2 population projections are higher than Alternative 1, the growth in the<strong>Gorst</strong> UGA would drive the following additional needs for parks and recreation services if the <strong>Gorst</strong> UGA remainsunincorporated:• Thirty one additional acres of open space. (Shown in Table 3.12-22 Kitsap County Open Space LOS <strong>Impact</strong>s –Alternative 2).• Eight additional acres of regional parks. (Shown in Table 3.12-23 Kitsap County Regional Parks LOS <strong>Impact</strong>s –Alternative 2).• Seven acres of community parks. (Shown in Table 3.12-24 Kitsap County Community Parks LOS <strong>Impact</strong>s –Alternative 2).• No need for additional heritage parks, shoreline access, or trails.Table 3.12-22Kitsap County Open Space LOS <strong>Impact</strong>s – Alternative 2Time PeriodKitsapCountywidePopulationLOS = 57.1 ACRES PER 1,000 POPULATIONAcres to MeetLOS StandardAcres AvailableNet Reserve or(Deficiency)2010 251,133 14,340 18,640 4,300Additional <strong>Planned</strong> Capacity through 2035 1932035 Alternative 2 330,376 18,864 18,833 (31)Source: Kitsap County Comprehensive Plan Capital Facilities Element, 2012; and BERK, 2013.<strong>Draft</strong> | June 2013 3-208
GORST PLANNED ACTION EIS | AFFECTED ENVIRONMENT, SIGNIFICANT IMPACTS, AND MITIGATION MEASURESTable 3.12-23Kitsap County Regional Parks LOS <strong>Impact</strong>s – Alternative 2Time PeriodKitsapCountywidePopulationLOS = 8.9 ACRES PER 1,000 POPULATIONAcres to MeetLOS StandardAcres AvailableNet Reserve or(Deficiency)2010 251,133 2,235 2,932 697Additional <strong>Planned</strong> Capacity through 2035 02035 Alternative 2 330,376 2,940 2,932 (8)Source: Kitsap County Comprehensive Plan Capital Facilities Element, 2012; and BERK, 2013Table 3.12-24Kitsap County Community Parks LOS <strong>Impact</strong>s – Alternative 2Time PeriodKitsapCountywidePopulationLOS = 3.5 ACRES PER 1,000 POPULATIONAcres to MeetLOS StandardAcres AvailableNet Reserve or(Deficiency)2010 251,133 879 1,149 270Additional <strong>Planned</strong> Capacity through 2035 02035 Alternative 2 330,376 1,156 1,149 (7)Source: Kitsap County Comprehensive Plan Capital Facilities Element, 2012; and BERK, 2013City of Bremerton <strong>Impact</strong>s. If the City of Bremerton annexes the <strong>Gorst</strong> UGA, it would have the following impactson demand for City of Bremerton parks services as compared to the adopted LOS:• Additional demand for about two acres of open space by 2035. (Shown in Table 3.12-25 City of BremertonOpen Space LOS <strong>Impact</strong>s – Alternative 2).• Additional demand for about 17 acres of regional parks by 2035. (Shown in Table 3.12-26 City of BremertonRegional Parks LOS <strong>Impact</strong>s – Alternative 2).• Additional demand for about one acre of local parks. (Shown in Table 3.12-27 City of Bremerton Local ParksLOS <strong>Impact</strong>s – Alternative 2).Time PeriodTable 3.12-25City of Bremerton Open Space LOS <strong>Impact</strong>s – Alternative 2City ofBremertonPopulationLOS = 2.21 ACRES PER 1,000 POPULATIONAcres to MeetLOS StandardAcres AvailableNet Reserve or(Deficiency)2010 37,729 83 82 (1)2035 City w /o <strong>Gorst</strong> 52,017 115 82 (33)2035 Alternative 2 53,224 118 82 (35)Source: Washington State OFM, 2012; Bremerton Parks, Recreation, and Open Space Plan, 2007; City of BremertonComprehensive Plan, 2010; and BERK, 2013<strong>Draft</strong> | June 2013 3-209
GORST PLANNED ACTION EIS | AFFECTED ENVIRONMENT, SIGNIFICANT IMPACTS, AND MITIGATION MEASURESTable 3.12-26City of Bremerton Regional Parks LOS <strong>Impact</strong>s – Alternative 2Time PeriodCity ofBremertonPopulationLOS = 14.64 ACRES PER 1,000 POPULATIONAcres to MeetLOS StandardAcres AvailableNet Reserve or(Deficiency)2010 37,729 552 544 (8)2035 City w /o <strong>Gorst</strong> 52,017 762 544 (217)2035 Alternative 2 53,224 779 544 (235)Source: Washington State OFM, 2012; Bremerton Parks, Recreation, and Open Space Plan, 2007; City of BremertonComprehensive Plan, 2010; and BERK, 2013Table 3.12-27City of Bremerton Local Parks LOS <strong>Impact</strong>s – Alternative 2Time PeriodCity ofBremertonPopulationLOS = 1.48 ACRES PER 1,000 POPULATIONAcres to MeetLOS StandardAcres AvailableNet Reserve or(Deficiency)Alternative 32010 37,729 56 52 (4)2035 City w /o <strong>Gorst</strong> 52,017 77 52 (25)2035 Alternative 2 53,224 79 52 (26)Source: Washington State OFM, 2012; Bremerton Parks, Recreation, and Open Space Plan, 2007; City of BremertonComprehensive Plan, 2010; and BERK, 2013Alternative 3 models the highest growth level for the <strong>Gorst</strong> UGA, and assumes a 2035 <strong>Gorst</strong> UGA population of1,304, which is an increase of 1,082 residents over current population levels.County <strong>Impact</strong>s. Given that Alternative 3 population projections are higher than Alternative 1 and slightly higherthan Alternative 2, the growth in the <strong>Gorst</strong> UGA would drive the following additional needs for parks andrecreation services if the <strong>Gorst</strong> UGA remains unincorporated:• 37 additional acres of open space. (Shown in Table 3.12-28 Kitsap County Open Space LOS <strong>Impact</strong>s –Alternative 3).• Nine additional acres of regional parks. (Shown in Table 3.12-29 Kitsap County Regional Parks LOS <strong>Impact</strong>s –Alternative 3).• One acre of heritage parks (Shown in Table 3.12-30 Kitsap County Heritage Parks LOS <strong>Impact</strong>s – Alternative 3).• Eight acres of community parks. (Shown in Table 3.12-31 Kitsap County Community Parks LOS <strong>Impact</strong>s –Alternative 3).• No need for additional shoreline access, or trails.<strong>Draft</strong> | June 2013 3-210
GORST PLANNED ACTION EIS | AFFECTED ENVIRONMENT, SIGNIFICANT IMPACTS, AND MITIGATION MEASURESTable 3.12-28Kitsap County Open Space LOS <strong>Impact</strong>s – Alternative 3Time PeriodKitsapCountywidePopulationLOS = 57.1 ACRES PER 1,000 POPULATIONAcres to MeetLOS StandardAcres AvailableNet Reserve or(Deficiency)2010 251,133 14,340 18,640 4,300Additional <strong>Planned</strong> Capacity through 2035 1932035 Alternative 3 330,473 18,870 18,833 (37)Source: Kitsap County Comprehensive Plan Capital Facilities Element, 2012; and BERK, 2013Table 3.12-29Kitsap County Regional Parks LOS <strong>Impact</strong>s – Alternative 3Time PeriodKitsapCountywidePopulationLOS = 8.9 ACRES PER 1,000 POPULATIONAcres to MeetLOS StandardAcres AvailableNet Reserve or(Deficiency)2010 251,133 2,235 2,932 697Additional <strong>Planned</strong> Capacity through 2035 02035 Alternative 3 330,473 2,941 2,932 (9)Source: Kitsap County Comprehensive Plan Capital Facilities Element, 2012; and BERK, 2013Table 3.12-30Kitsap County Heritage Parks LOS <strong>Impact</strong>s – Alternative 3Time PeriodKitsapCountywidePopulationLOS = 11.5 ACRES PER 1,000 POPULATIONAcres to MeetLOS StandardAcres AvailableNet Reserve or(Deficiency)2010 251,133 2,888 3,799 911Additional <strong>Planned</strong> Capacity through 2035 02035 Alternative 3 330,473 3,800 3,799 (1)Source: Kitsap County Comprehensive Plan Capital Facilities Element, 2012; and BERK, 2013Table 3.12-31Kitsap County Community Parks LOS <strong>Impact</strong>s – Alternative 3Time PeriodKitsapCountywidePopulationLOS = 3.5 ACRES PER 1,000 POPULATIONAcres to MeetLOS StandardAcres AvailableNet Reserve or(Deficiency)2010 251,133 879 1,149 270Additional <strong>Planned</strong> Capacity through 2035 02035 Alternative 3 330,473 1,157 1,149 (8)Source: Kitsap County Comprehensive Plan Capital Facilities Element, 2012; and BERK, 2013City of Bremerton <strong>Impact</strong>s. If the City of Bremerton annexes the <strong>Gorst</strong> UGA, it would have the following impactson demand for City of Bremerton parks services as compared to the adopted LOS:<strong>Draft</strong> | June 2013 3-211
GORST PLANNED ACTION EIS | AFFECTED ENVIRONMENT, SIGNIFICANT IMPACTS, AND MITIGATION MEASURES• Additional demand for about three acres of open space by 2035. (Shown in Table 3.12-32 City of BremertonOpen Space LOS <strong>Impact</strong>s – Alternative 3).• Additional demand for about 20 acres of regional parks by 2035. (Shown in Table 3.12-33 City of BremertonRegional Parks LOS <strong>Impact</strong>s – Alternative 3).• Additional demand for about two acres of local parks. (Shown in Table 3.12-34 City of Bremerton Local ParksLOS <strong>Impact</strong>s – Alternative 3).Time PeriodTable 3.12-32City of Bremerton Open Space LOS <strong>Impact</strong>s – Alternative 3City ofBremertonPopulationLOS = 2.21 ACRES PER 1,000 POPULATIONAcres to MeetLOS StandardAcres AvailableNet Reserve or(Deficiency)2010 37,729 83 82 (1)2035 City w /o <strong>Gorst</strong> 52,017 115 82 (33)2035 Alternative 3 53,321 118 82 (36)Source: Washington State OFM, 2012; Bremerton Parks, Recreation, and Open Space Plan, 2007; City of BremertonComprehensive Plan, 2010; and BERK, 2013Table 3.12-33City of Bremerton Regional Parks LOS <strong>Impact</strong>s – Alternative 3Time PeriodCity ofBremertonPopulationLOS = 14.64 ACRES PER 1,000 POPULATIONAcres to MeetLOS StandardAcres AvailableNet Reserve or(Deficiency)2010 37,729 552 544 (8)2035 City w /o <strong>Gorst</strong> 52,017 762 544 (217)2035 Alternative 3 53,321 781 544 (237)Source: Washington State OFM, 2012; Bremerton Parks, Recreation, and Open Space Plan, 2007; City of BremertonComprehensive Plan, 2010; and BERK, 2013Table 3.12-34City of Bremerton Local Parks LOS <strong>Impact</strong>s – Alternative 3Time PeriodCity ofBremertonPopulationLOS = 1.48 ACRES PER 1,000 POPULATIONAcres to MeetLOS StandardAcres AvailableNet Reserve or(Deficiency)2010 37,729 56 52 (4)2035 City w /o <strong>Gorst</strong> 52,017 77 52 (25)2035 Alternative 3 53,321 79 52 (27)Source: Washington State OFM, 2012; Bremerton Parks, Recreation, and Open Space Plan, 2007; City of BremertonComprehensive Plan, 2010; and BERK, 2013<strong>Draft</strong> | June 2013 3-212
GORST PLANNED ACTION EIS | AFFECTED ENVIRONMENT, SIGNIFICANT IMPACTS, AND MITIGATION MEASURESMitigation MeasuresIncorporated Plan Features• <strong>Gorst</strong> Alternatives 2 and 3 show County-purchased Open Space/Recreation land along Sinclair Inlet. Theproperty on the south shore could allow for some recreation activities consistent with environmentallimitations. Property on the north shore is inaccessible but provides open space and environmentalprotection.• Kitsap County. The County’s 2012 PROS Plan sets forth strategies, goals, and objectives for development andmanagement of parks, open space, and recreational facilities for a 5-year planning period.ooAcquisition. The County plans to acquire new trails, shoreline, and open space as part of the Parks Plan.One of its highest priorities is a partnership to acquire 7,000 acres known as the Kitsap Forest and BayProject, which would effectively double the County’s current park ownership and allow the County tomeet all of its LOS standards in the next 20+ years with this increase in Open Space. This potentialacquisition is not included in the analysis above because the details have not been finalized and thereforeit is not included in the Parks CFP.Partnerships. In cases where the County has identified a need and has determined they will not be able toprovide adequate capacity to meet demand, they will work to partner with other agencies to meet thedemand. Partner agencies can assist with acquisition, funding upgrades, and providing technical expertise.• City of Bremerton. The City has also developed a PROS Plan that aims to refine and improve its LOS standardsgoing forward. Under this Plan, the City would create LOS standards that are geographically based in order tobetter measure how accessible parks are to residents. If the City adopts this Plan, it should review its LOSstandards in relation to the location of the <strong>Gorst</strong> UGA to ensure its residents are being adequately served.Applicable Regulations and Commitments• Kitsap County. <strong>Impact</strong> fees are applied to all new housing developments. Fees could be reassessed to reflectincreased costs of land for park acquisition, or increased impacts within areas of significant intensification suchas the Silverdale or Port Orchard UGAs.Other Potential Mitigation Measures• Kitsap County. The County could adopt updated Base LOS targets that will accommodate the eventualpreferred alternative’s growth in the <strong>Gorst</strong> UGA through 2035. This would involve changing the Base LOS foropen space, regional parks, community parks, and potentially heritage parks, depending on the adoptedalternative. The County would not need to adjust levels of service for shoreline access or trails.• City of Bremerton. The City could require that master planned developments within the <strong>Gorst</strong> UGA provideparks and/or open space as part of the development in order to serve the residents of that development andoffset the need for the City to acquire and develop additional facilities.Significant Unavoidable Adverse <strong>Impact</strong>sWith the increase in population and urbanization of the Watershed and UGA under any of the alternatives, andparticularly the action alternatives, there would be greater demand for parks, recreational facilities, and programs.To avoid impacts, the County and City could work with other agencies and regularly monitor population growth,service levels, and demand to bring supply and demand into balance; this can be accomplished with regular CFPupdates as appropriate.Neighborhoods surrounding existing, new or expanded parks would experience more activity in the form ofvehicles and pedestrians. Cost for acquiring parks is expected to rise with the increased demand for urban land inthe UGA over time.<strong>Draft</strong> | June 2013 3-213
GORST PLANNED ACTION EIS | AFFECTED ENVIRONMENT, SIGNIFICANT IMPACTS, AND MITIGATION MEASURES3.12.5. LibrariesAffected EnvironmentWatershedLibrary service throughout Kitsap County is provided by the Kitsap Regional Library System (KRLS). The systemserves approximately 251,000 people countywide and has an annual countywide circulation of over 2.27 millionbooks, audio items, videos, and periodicals. In addition to its nine permanent library locations, KRLS operates atraveling bookmobile, provides outreach services for youth and the homebound, and provides online access tomany library materials and services.None of the KRLS’s permanent library locations are within the <strong>Gorst</strong> Creek watershed. The two closest locationsare in downtown Bremerton and Port Orchard:• The Downtown Bremerton Library building was constructed in 1938 and is owned by the City of Bremerton.This 5,514 square-foot facility was renovated in 2006 and serves an average of 62,140 patrons each year.Annual circulation for this library is approximately 88,746 items.• The Port Orchard Library operates out of a buildings owned by the City of Port Orchard. Built in 1954, the8,000 square-foot facility serves an average of 197,814 patrons annually and has an approximate annualcirculation of 381,592 items.No new library facilities are planned in the <strong>Gorst</strong> area for the immediate future, nor are any major renovationsplanned for either the Bremerton or Port Orchard libraries.LOSFor the purpose of this <strong>Draft</strong> EIS, LOS for libraries is calculated based on two factors: annual per capital circulationand total facility square footage. Because circulation is shared between all library branches, per capita circulation iscalculated based on total countywide circulation and population. While not formally adopted by the KRLS, thesemetrics are useful in tracking how the library system is serving the local population. Table 3.12-35 Current andProjected Library Levels of Service illustrates the levels of service for libraries in Kitsap County under presentconditions and under each alternative, assuming no additional circulation or facility square footage.Table 3.12-35Current and Projected Library Levels of Service<strong>Gorst</strong> UGASource: Office of Financial Management 2013, BERK 2012Library service is provided on a regional basis, which is described above for the <strong>Gorst</strong> Creek watershed. Residentsof the <strong>Gorst</strong> UGA patronize either the Downtown Bremerton or Port Orchard libraries.<strong>Draft</strong> | June 2013 3-214
GORST PLANNED ACTION EIS | AFFECTED ENVIRONMENT, SIGNIFICANT IMPACTS, AND MITIGATION MEASURES<strong>Impact</strong>sIMPACTS COMMON TO ALL ALTERNATIVESWatershedNo land use changes are proposed for the <strong>Gorst</strong> Creek watershed outside the <strong>Gorst</strong> UGA beyond adoptedComprehensive Plan. Updated stormwater and habitat regulations in this area are not anticipated to have anyeffect on the demand for library service. Therefore, no significant impacts to library service are anticipated underany of the alternatives.<strong>Gorst</strong> UGAAlternative 1Under the No <strong>Action</strong> Alternative, population in the <strong>Gorst</strong> UGA would grow by approximately 82 residents, whichwould have minimal effect on the countywide LOS for the KRLS. While the Downtown Bremerton and Port Orchardlocal branches may experience a small increase in patronage from the <strong>Gorst</strong> community, it is unlikely that such asmall increase in population will have any significant effects on the KRLS’s ability to adequately serve the public.Alternative 2Under Alternative 2, the <strong>Gorst</strong> UGA would experience moderate population growth, adding 985 residents duringthe planning period. To maintain existing levels of service, this increase in population would require an additional8,816 items in annual circulation and an additional 345 square feet of library facility space, while this level ofgrowth would not significantly affect the countywide library LOS, it is likely that the Downtown Bremerton andPort Orchard branches would each experience a slight increase in patronage over time. How many of these newresidents would make use of the available library resources is unknown, as is the proportion of them who wouldpatronize the Bremerton branch versus the Port Orchard branch, making it difficult to quantify the precise level ofimpact. While Alternative 2 would have a greater effect on demand for library services than the No <strong>Action</strong>Alternative, it would have a lower impact than Alternative 3.Alternative 3Under Alternative 3, the <strong>Gorst</strong> UGA would experience greater population growth than under Alternatives 1 or 2,adding 1082 residents during the planning period. To maintain existing levels of service, this increase in populationwould require an additional 9,684 items in annual circulation and an additional 379 square feet of library facilityspace. While this level of growth would not significantly affect the countywide library LOS, it is likely that theDowntown Bremerton and Port Orchard branches would each experience a slight increase in patronage over time.How many of these new residents would make use of the available library resources is unknown, as is theproportion of them who would patronize the Bremerton branch versus the Port Orchard branch, making it difficultto quantify the precise level of impact. Because it would generate the greatest growth in population, Alternative 3is anticipated to have a greater effect on demand for library services than either the No <strong>Action</strong> Alternative orAlternative 2.Mitigation MeasuresIncorporated Plan FeaturesNone.Applicable Regulations and Commitments• With additional development and population in the <strong>Gorst</strong> UGA, property tax revenues, which are the primarysource of funding for the Kitsap Regional Library, would increase over time. These additional revenues couldbe used to purchase additional circulation materials for the Downtown Bremerton and Port Orchard librariesto offset the additional demand generated by growth.<strong>Draft</strong> | June 2013 3-215
GORST PLANNED ACTION EIS | AFFECTED ENVIRONMENT, SIGNIFICANT IMPACTS, AND MITIGATION MEASURESOther Potential Mitigation Measures• The Kitsap Regional Library could partner with the Cities of Bremerton and Port Orchard to acquire additionalcirculation materials or expand their local branches to accommodate growth in <strong>Gorst</strong>.• The Kitsap Regional Library could increase the amount of circulation materials and services that are availableonline to reduce demand for physical library space and offset new growth in <strong>Gorst</strong>.Significant Unavoidable Adverse <strong>Impact</strong>sAs population increases within the watershed and <strong>Gorst</strong> UGA, the demand for library services will also increase.The library system as a whole will experience increased demand as more people require greater collections ofmaterials and other resources. With advanced coordination between the Library District, County, and City ofBremerton; significant, unavoidable, adverse impacts are not anticipated.<strong>Draft</strong> | June 2013 3-216
GORST PLANNED ACTION EIS | AFFECTED ENVIRONMENT, SIGNIFICANT IMPACTS, AND MITIGATION MEASURES3.13 Utilities, Water, Wastewater, Stormwater3.13.1. PowerAffected EnvironmentWatershedElectricity – Puget Sound Energy (PSE)Electric service in the <strong>Gorst</strong> Creek watershed is provided by PSE. PSE, an investor-owned private utility, was formedin a 1997 merger between Puget Sound Power & Light Company and Washington Natural Gas. PSE serves over115,000 electric customers in Kitsap County and maintains over 132 miles of transmission and distribution linesthroughout the county.The electricity serving the <strong>Gorst</strong> Creek watershed arrives in Kitsap County via 230 kilovolt (kV) transmission linesoperated by the Bonneville Power Administration (BPA). These 230 kV lines arrive at a BPA substation just north ofthe <strong>Gorst</strong> UGA and then connect to PSE’s South Bremerton switching station, located northeast of the <strong>Gorst</strong> UGA.From this substation, 115kV distribution lines provide power to PSE customers throughout the area.PSE began construction on a series of upgrades to the South Bremerton switching station in 2011 to increaseoperational flexibility during outages. The upgrades are proceeding in phases and are scheduled for completion by2014. While the improvements will provide increased consistency in the local power distribution system, they donot increase the capacity of the current electrical infrastructure.Natural Gas – Cascade Natural Gas (CNG)Headquartered in Kennewick, the CNG serves more than 260,000 customers in nearly 100 communities acrossWashington and Oregon, covering more than 32,000 square miles of service area. CNG maintains a district office inBremerton and serves customers throughout the Kitsap Peninsula, including <strong>Gorst</strong>. CNG initiates connections atthe request of customers; therefore, not every property within the service area is currently served with naturalgas. CNG does not plan for customer connections in advance of customer requests.<strong>Gorst</strong> UGAElectricity – Puget Sound EnergyElectric service in the <strong>Gorst</strong> UGA is provided by PSE, as described above for the <strong>Gorst</strong> Creek watershed. Power isprovided to the area by regional 230 kV transmission lines that arrive at the BPA substation adjacent to thenorthern edge of the <strong>Gorst</strong> UGA (north of SR 3 at the end of Solid Lane West). From here, the power is transferredto the PSE switching station adjacent to the northern edge of the existing mine. From here, electricity is distributedvia 115 kV distribution lines to the surrounding region, including the <strong>Gorst</strong> UGA.Natural Gas – CNGAs described above for the <strong>Gorst</strong> Creek watershed, natural gas service is provided to the <strong>Gorst</strong> community by CNG.CNG supplies natural gas service within its service area upon customer request.<strong>Impact</strong>sIMPACTS COMMON TO ALL ALTERNATIVESWatershedNo land use changes are proposed for the <strong>Gorst</strong> Creek watershed outside the <strong>Gorst</strong> UGA. Updated stormwater andhabitat regulations in this area are not anticipated to have significant effects on the rate of population growth inthis area or the demand for power. Therefore, no significant impacts to power service are anticipated under any ofthe alternatives.<strong>Draft</strong> | June 2013 3-217
GORST PLANNED ACTION EIS | AFFECTED ENVIRONMENT, SIGNIFICANT IMPACTS, AND MITIGATION MEASURES<strong>Gorst</strong> UGAAlternative 1Under the No <strong>Action</strong> Alternative, residential, commercial, and industrial growth in the <strong>Gorst</strong> UGA would continueaccording to adopted land use designations and zoning, bringing an additional 82 residents and 742 jobs to thearea. Growth in the UGA would increase demand for electric and natural gas service. Neither PSE nor CNG haveadopted a formal LOS standard, but both utilities conduct ongoing supply planning to ensure adequate service tocustomers. While the No <strong>Action</strong> Alternative would result in the least increase in residential power consumption, itwould increase commercial and industrial power consumption to a greater degree than either of the <strong>Action</strong>Alternatives. Compared with the size of PSE and CNG’s regional customer bases, the anticipated growth in the<strong>Gorst</strong> UGA is relatively small is unlikely to have any significant impacts on the regional provision of electric ornatural gas service in Kitsap County.Alternative 2Under Alternative 2, residential and commercial growth in the <strong>Gorst</strong> UGA would increase in accordance with theproposed land use designations and zoning, bringing an additional 985 residents and 606 jobs to the area. Growthin the UGA would increase demand for electric and natural gas service connections, as well as overall consumptionof electricity and natural gas. Neither PSE nor CNG have adopted a formal LOS standard, but both utilities conductongoing supply planning to ensure adequate service to customers. While the <strong>Gorst</strong> UGA is already served by bothPSE and CNG, the increased number of connections is likely to require the installation of additional transmissionand distribution infrastructure or upgrades to existing infrastructure, particularly in previously undevelopedportions of the UGA, such as the existing mine site. This infrastructure would be upgraded or installed at the timenew development occurs, and connections would be made at the time of customer request.While Alternative 2 would create a higher demand for residential electric and natural gas service than the No<strong>Action</strong> Alternative, it would create less demand than Alternative 3. Alternative 2 would create greater commercialdemand for power than Alternative 3, but less than then No <strong>Action</strong> Alternative. Compared with the size of PSE andCNG’s regional customer bases, the growth anticipated in the <strong>Gorst</strong> UGA under Alternative 2 is relatively small isunlikely to have any significant impacts on the regional provision of electric or natural gas service in Kitsap County.Alternative 3Under Alternative 3, residential and commercial growth in the <strong>Gorst</strong> UGA would increase in accordance with theproposed land use designations and zoning, bringing an additional 1,082 residents and 333 jobs to the area.Growth in the UGA would increase demand for electric and natural gas service connections, as well as overallconsumption of electricity and natural gas. Neither PSE nor CNG have adopted a formal LOS standard, but bothutilities conduct ongoing supply planning to ensure adequate service to customers. While the <strong>Gorst</strong> UGA is alreadyserved by both PSE and CNG, the increased number of connections is likely to require the installation of additionaltransmission and distribution infrastructure or upgrades to existing infrastructure, particularly in previouslyundeveloped portions of the UGA, such as the existing mine site. This infrastructure would be upgraded orinstalled at the time new development occurs, and connections would be made at the time of customer request.While Alternative 3 would create a higher residential demand for electric and natural gas service than the No<strong>Action</strong> Alternative or Alternative 2, it would create the least commercial power demand of the three alternatives.Compared with the size of PSE and CNG’s regional customer bases, the growth anticipated in the <strong>Gorst</strong> UGA underAlternative 3 is relatively small is unlikely to have any significant impacts on the regional provision of electric ornatural gas service in Kitsap County.<strong>Draft</strong> | June 2013 3-218
GORST PLANNED ACTION EIS | AFFECTED ENVIRONMENT, SIGNIFICANT IMPACTS, AND MITIGATION MEASURESMitigation MeasuresIncorporated Plan Features• Mixed-use and clustered development is encouraged in select areas under Alternative 3, and bothAlternatives 2 and 3 would result in increased residential density over existing conditions. Providing power tohigher-density and cluster development is often more efficient than provision of power to low-densitydevelopment.Applicable Regulations and Commitments• All future development of energy resources and transmission facilities would be required to comply withfederal and state laws, the regulations of the Northwest Power Planning Council, and the WUTC.Other Potential Mitigation Measures• As development permits are issued for future development in the <strong>Gorst</strong> UGA, either by Kitsap County or theCity of Bremerton, PSE and CNG should be advised of large development or redevelopment projects andallowed to provide input on their ability to adequately serve the project.Significant Unavoidable Adverse <strong>Impact</strong>sPopulation and employment growth under all studied alternatives, and particularly the action alternatives, willincrease demands for energy that in turn will increase the need for additional facilities. Planning efforts to managegrowth should reduce the demand and/or accommodate growth in a coordinated fashion than would otherwiseoccur.3.13.2. Solid WasteAffected EnvironmentWatershedKCPW provides solid waste management in the <strong>Gorst</strong> Creek watershed area. KCPW contracts with WasteManagement Washington Incorporated (WMWI) to provide curbside collection of garbage, recycling, and yard andfood waste to residents and businesses in the Cities of Bremerton and Port Orchard as well as unincorporatedareas within the watershed.Within the Cities of Bremerton and Port Orchard, garbage collection is mandatory, while it is voluntary within theunincorporated county. WMWI offers collection of garbage and recycling to all residents of the watershed. Yardand food debris collection is available to residents of Bremerton and Port Orchard and to county residents withinthe burn ban boundary.Facility InventoryCapital facilities are an integral part of the solid waste management system, and within Kitsap County they areowned and operated by a variety of entities. Table 3.13-1 Solid Waste Facility Inventory shows the major solidwaste disposal facilities in the County. Olympic View Transfer Station serves the study area.<strong>Draft</strong> | June 2013 3-219
GORST PLANNED ACTION EIS | AFFECTED ENVIRONMENT, SIGNIFICANT IMPACTS, AND MITIGATION MEASURESTable 3.13-1Solid Waste Facility InventoryName Owner Operator LocationDisposalOVTS KCPW WMWI City of BremertonSolid Waste CollectionOlalla RAGF KCPW WMWI South KitsapHansville RAGF KCPW KCPW North KitsapSilverdale RAGF KCPW WMWI Central KitsapBainbridge Island Transfer Station COBD Bainbridge Disposal City of Bainbridge IslandHousehold Hazardous WasteCollection FacilityResidential RecyclablesCollectionNotes: Olympic View Transfer Station (OVTS), Recycling & Garbage Facility (RAGF), Kitsap County Public Works (KCPW), WasteManagement Washington, Inc. (WMWI), City of Bainbridge Island Disposal (COBD)Source: Kitsap County Solid Waste Division, 2012; and BERK, 2013LOSKCPW KCPW City of BremertonOVTS Recycling Area KCPW WMWI South KitsapOlalla RAGF KCPW WMWI South KitsapHansville RAGF Kitsap County KCPW North KitsapSilverdale RAGF KCPW WMWI Central KitsapBainbridge Island Transfer Station Bainbridge Disposal Bainbridge Disposal Bainbridge IslandPoulsbo Recycle Center KCPW KCPW City of PoulsboThe existing LOS is calculated based on estimated service population and the average per-capita generation ratesfor solid waste and recycling, as shown in Table 3.13- 2 Current Solid Waste LOS Requirements. The figures in thistable were taken from Kitsap County’s Solid Waste and Hazardous Waste Management Plan Wise Communities:The Future of Solid and Hazardous Waste Management in Kitsap County (Kitsap County, 2011).Time PeriodCountywidePopulationTable 3.13-2Current Solid Waste LOS RequirementsSW GenerationRate 1(lbs/cap/day)SW Tons GeneratedPer Year 2SW RecyclingRate(lbs/cap/day)Recycled TonsPer Year2010 251,133 5.0 229,000 2.0 92,000Note:1 SW Generation Rate shown is calculated from SW produced within Kitsap County and North Mason County.2SW generated does not include recycled waste.Source: Kitsap County Solid Waste Division, 2012 communication; and BERK, 2013The County is in the middle of a 20-year contract that took effect in 2002 to send waste to a landfill owned byWMWI. The landfill has capacity for 50 to 100 years and has additional acreage that could be permitted to increaseits capacity further. Planning at the County level with WMWI occurs on a yearly basis based on future projectedneeds. The County will have adequate time to plan for 2035 levels of waste generation, and projected levels, asnoted below, could be accommodated at the current landfill site if a new or extended contract is enacted.<strong>Draft</strong> | June 2013 3-220
GORST PLANNED ACTION EIS | AFFECTED ENVIRONMENT, SIGNIFICANT IMPACTS, AND MITIGATION MEASURES<strong>Gorst</strong> UGAAs noted above, solid waste management is managed by Kitsap County Public Works (KCPW) in contract withWMWI. This is a regional service, and the facilities and levels of service are as noted above for the <strong>Gorst</strong> Creekwatershed.<strong>Impact</strong>sIMPACTS COMMON TO ALL ALTERNATIVESWatershedNo land use changes are proposed for the <strong>Gorst</strong> Creek watershed outside the <strong>Gorst</strong> UGA. Updated stormwater andhabitat regulations in this area are not anticipated to have significant effects on solid waste management needs inthis area.<strong>Gorst</strong> UGASince solid waste service is provided on a regional level, impacts to the service provider (Waste Management) andmanagement organization are nearly identical whether or not <strong>Gorst</strong> is annexed by the City of Bremerton.The additional population capacity generated under the three alternatives would marginally increase demand forsolid waste capacity. The County, through contracts with private haulers, will continue to be able to provide solidwaste management for an increased population regardless of the alternative ultimately chosen. The County wouldhave adequate time to plan for landfill capacity for solid waste generation under all alternatives, and the County’scurrent contracted landfill location is expected to have sufficient capacity through 2025 and beyond if a new orextended contact is enacted.Alternative 1Under the No <strong>Action</strong> Alternative, population in the <strong>Gorst</strong> UGA would grow by approximately 82 people through2035. This Alternative is identical to the Preferred Alternative adopted in the 2012 Kitsap County ComprehensivePlan CFP.Assuming a solid waste generation rate of 5 lbs/capita/day and recycling rate of 2 lbs/capita/day results in about301,000 tons of solid waste and 120,000 tons of recycling per year. These totals could be managed with existinglandfill capacity.Alternative 2Alternative 2 models a moderate growth level for the <strong>Gorst</strong> UGA, higher than under the No <strong>Action</strong> Alternative butlower than under Alternative 3. Alternative 2 assumes a 2035 <strong>Gorst</strong> UGA population of 1,207, which is an increaseof 985 residents over current population levels.Assuming a solid waste generation rate of 5 lbs/capita/day and recycling rate of 2 lbs/capita/day results in about301,000 tons of solid waste and 121,000 tons of recycling per year. These totals could be managed with existinglandfill capacity.Alternative 3Alternative 3 models the highest growth level for the <strong>Gorst</strong> UGA, and assumes a 2035 <strong>Gorst</strong> UGA population of1,304, which is an increase of 1,082 residents over current population levels.Assuming a solid waste generation rate of 5 lbs/capita/day and recycling rate of 2 lbs/capita/day results in about301,000 tons of solid waste and 121,000 tons of recycling per year. These totals could be managed with existinglandfill capacity.<strong>Draft</strong> | June 2013 3-221
GORST PLANNED ACTION EIS | AFFECTED ENVIRONMENT, SIGNIFICANT IMPACTS, AND MITIGATION MEASURESMitigation MeasuresIncorporated Plan Features• Focusing growth in existing UGAs and cities where solid waste services already exist would reduce impactsrelated to providing curbside pickup for added population and promote more curbside customers. Therewould also be less need for additional RAGFs.Applicable Regulations and Commitments• Coordination and monitoring at transfer facilities and RAGFs would be ongoing to ensure adequate solid wastecapacity. Service levels for curbside collection as outlined in the CFP would continue or improve to encouragerecycling.Other Potential Mitigation Measures• Based on available landfill capacity at the County’s current contracted landfill location a new or extendedcontact could be enacted to provide landfill capacity well beyond the 2025 planning horizon.Significant Unavoidable Adverse <strong>Impact</strong>sFuture population growth and development would continue to increase the amount of solid waste generated inthe county under any alternative, especially the action alternatives. With Solid Waste Management Plans, regularlyupdated as appropriate, no significant unavoidable adverse impacts are anticipated.3.13.3. Water, Wastewater, and StormwaterThis section describes the environmental considerations related to utilities in the study area. An evaluation andreview of existing levels of service, estimated needs and demand for service, and projected levels of service undereach alternative for water, wastewater, and stormwater is provided. Surface water, groundwater, and waterquality was previously described in Section 3.2 Water Resources. The utilities analysis is based on the stormwaterplan and capital improvement program. Utilities information was collected from the City of Bremerton CityServices Element of the Comprehensive Plan (City of Bremerton 2010) and City of Bremerton GIS data. Othersources used in this analysis include: <strong>Gorst</strong> Creek Watershed Characterization Report (City of Bremerton 2012),<strong>Gorst</strong> Creek Watershed Inventory and Characterization Technical Memorandum (Parametrix 2011), and KitsapCounty’s 2013-2025 CFP (Kitsap County 2012).Affected EnvironmentWatershedWaterWater (drinking) for residents in the watershed is supplied from City of Bremerton utility lands and also theAnderson Creek aquifer. Primary water service is provided by both the City of Bremerton and Port Orchard in thestudy area. The Sunnyslope Water District No. 15 provides water to unincorporated rural areas in the watershed.The <strong>Gorst</strong> aquifer currently has five wells and six wellhead protection areas. The City of Bremerton supplies waterto the <strong>Gorst</strong> UGA and portions of the SKIA UGAs (City of Bremerton 2012). The City of Bremerton partially supplieswater to the McCormick Woods area. There is one reservoir in the watershed, which is not in the City ofBremerton, located near the Twin Lakes area, just upstream from the Gold Mountain Golf Course. There are twomajor water mains in the watershed. One of the water mains is a 28-inch diameter pipe installed in 1950 along WBelfair Valley Road and <strong>Gorst</strong> Creek that supplies water from the Union River reservoir and surrounding wells formthe <strong>Gorst</strong> UGA. The other 18-inch water main, which was installed in 1976, follows the shoreline of Alexander Lakeand then heads along Heins Creek to the <strong>Gorst</strong> UGA. Two water pump stations are located in the watershed, one inthe central portion of <strong>Gorst</strong> Creek (Pump Station #3) and the other along W Belfair Valley Road near Division<strong>Draft</strong> | June 2013 3-222
GORST PLANNED ACTION EIS | AFFECTED ENVIRONMENT, SIGNIFICANT IMPACTS, AND MITIGATION MEASURESAvenue W (Pump Station #17). The two major water mains converge at this pump station, which is near theconfluence of <strong>Gorst</strong> Creek with Heins and Parish creeks. The 18-inch is the discharge pipe for Pump Station #17.See Figure 3.13-1 <strong>Gorst</strong>: Drinking Water and Wastewater Systems for a map of water facilities water mains andwells in the <strong>Gorst</strong> UGA vicinity.WastewaterWastewater (sanitary sewer) in the watershed is managed on most parcels with on-site septic systems. Twowastewater systems exist in the watershed. One wastewater system, maintained by the City of Port Orchard PublicWorks and West Sound Utility District, is located in the southeastern portion of the watershed and servesdevelopments connected to SW Old Clifton Road. The other wastewater system, maintained by the City ofBremerton, includes two sewer pump stations and is associated with the <strong>Gorst</strong> UGA and described later.See Figure 3.13-1 <strong>Gorst</strong>: Drinking Water and Wastewater Systems for a map of pump stations and sewer mains inthe <strong>Gorst</strong> UGA vicinity.StormwaterIn 2006, Kitsap County analysis of its Comprehensive Plan indicated the level of impervious area in differentwatersheds (Kitsap County 2012a). The <strong>Gorst</strong> Creek Watershed was found to have approximately nine percentimpervious area, which is relatively low due to the Bremerton CULs that remain forested, as well as the as yetundeveloped SKIA, which is slated for much employment growth in the future.The urban areas of Port Orchard, part of Bremerton, and <strong>Gorst</strong> currently occupy 6,650 acres (24 percent) of thelarger Sinclair Inlet watershed encompassing the <strong>Gorst</strong> Creek Watershed and other territory including the City ofBremerton and the PSNS occupying the majority of the north shoreline, and the City of Port Orchard centrallylocated on the south shore. Other commercial centers in the watershed include Annapolis, Manchester, andSunnyslopeStormwater runoff in the watershed that is not naturally dispersed and infiltrated is conveyed over impervioussurfaces including roofs, streets, and parking lot into roadside ditches that eventually discharge directly to streamswater bodies including <strong>Gorst</strong> Creek and Sinclair Inlet. Currently, only the McCormick Woods development haswater quality treatment ponds. No other formal water quality facilities or flow control structures in the watershed.As previously stated in Section 3.2 Water Resources and Section 3.4 Plants and Animals the majority of the upperand central portions of the watershed is forested and owned by the City of Bremerton. The forested land naturallydisperses and infiltrates stormwater, recharging groundwater in the <strong>Gorst</strong> aquifer. In the lower portion of thewatershed, stormwater runoff from roads including SR 3 and scattered rural residences is conveyed throughroadside ditches and culverts. Sediment accumulation occurs at culverts and sediment removal occurs often as amaintenance practice.Existing conditions of water flow and habitat were analyzed in the <strong>Gorst</strong> Creek Characterization Report (City ofBremerton 2012). The water flow assessment is based on the major watershed-scale hydrologic processes thatnaturally contribute to and affect stream flows; the subcomponents of the water flow process include an analysisof surface water delivery, storage, discharge, and recharge capacity (Stanley et al. 2010). Stormwater runoff frompollutant generating impervious surfaces often impact water resources including water flow. The characterizationreport (City of Bremerton 2012) included a model that integrated individual components of the water flowprocess, as well as human activities that are impairments to the process and contribute to stormwater runoff. Thereport divided the watershed into assessment units and identify areas for protection, restoration, conservation,and development.In general, the characterization report (City of Bremerton 2012)and model output provided data that supportedland use planning for protection of the north central portion of the watershed, the tributaries, and the estuary,while allowing for additional growth and development in the south, and southeastern portions of the watershed.<strong>Draft</strong> | June 2013 3-223
GORST PLANNED ACTION EIS | AFFECTED ENVIRONMENT, SIGNIFICANT IMPACTS, AND MITIGATION MEASURESSpecifically, areas in the City of Bremerton Utility Lands and near Heins and Jarstad creeks are highly important forwater flow processes and are subject to relatively low degradation and pollution generating impervious surfaceand stormwater runoff (City of Bremerton 2012).Areas of lower relative importance for water flow processes but also have relatively low levels of degradation arelocated west of the City of Bremerton Utility Lands and north of the golf course and the headwaters of <strong>Gorst</strong> andParish creeks (City of Bremerton 2012). Generally, due to these conditions, these areas require a relatively lowlevel of active management, provided that land uses and activities are not allowed to degrade processes The areasnear the Gold Mountain Golf Club, along the <strong>Gorst</strong> Unnamed Tributary 1, and the <strong>Gorst</strong> UGA area areas identifiedby the model that require the most active management (City of Bremerton 2012). They denote areas which have arelatively high importance to water flow processes but are highly degraded. These are focal areas for activemanagement.The model maps these areas as of relatively low importance to the water flow process and high degradation. In thecontext of model output results (City of Bremerton 2012), these are typically areas within which continueddevelopment will have the least effect on water flow processes, as compared to other locations within thewatershed. These areas include portions of the SKIA UGA, and the Sunnyslope Area.<strong>Gorst</strong> UGAWaterWater (drinking) in the <strong>Gorst</strong> UGA is supplied by the City of Bremerton. Water mains are located along W BelfairValley Road, W Frone Drive, Feigley Road W, West Sherman Heights Road, SR 3, and SR 16. Most water mains wereinstalled between 1986 and 1990. A few water lines, such as those along West Sherman Heights Road, wereinstalled in 1940.The Kitsap County CFP (August 2012) coordinates water improvements planned by the County, cities, and specialdistricts. Within the <strong>Gorst</strong> UGA, the City of Bremerton identified the following improvement:• Project #2 – 36” Transmission Main McKenna Falls to <strong>Gorst</strong>WastewaterIn 2010, a wastewater (sanitary sewers) collection system was built in the <strong>Gorst</strong> UGA. Wastewater is conveyedthrough several 8-inch gravity mains located along W Belfair Valley Road, W Frone Drive, Feigley Road W, SR 3, andSR 16. These mains tie into two sewer pump stations and an 18-inch force main that connects to a wastewatertreatment plant on Oyster Bay Avenue in Bremerton. As previously described in Section 3.2 Water Resources,Kitsap County Public Health found 7 water quality hotspot areas in the <strong>Gorst</strong> UGA. After the wastewater collectionsystem was constructed in 2010, 6 of the 7 areas were downgraded to a level of no significance. A total of 125residences and commercial properties have connected to the <strong>Gorst</strong> wastewater system as of August 2011.Remaining parcels in the UGA manage wastewater through on-site septic systems. The high ground water andpoor draining soils in the area tend to cause septic systems to fail prematurely, resulting in the discharge ofuntreated sanitary sewage into <strong>Gorst</strong> Creek and its tributaries (City of Bremerton 2009).The Kitsap County CFP (August 2012) coordinates wastewater improvements planned by the County, cities, andspecial districts. Within the <strong>Gorst</strong> UGA, the City of Bremerton identified the following improvement:• Project #1 – Pump Station SB 3 (<strong>Gorst</strong>) Upgrade: 2019-2025 periodStormwaterSimilar to facilities in the greater watershed, stormwater facilities in the <strong>Gorst</strong> UGA consist primarily of roadsidedrainage ditches with culverts located at road crossings. In addition, most of the UGA near the Sinclair Inlet isdeveloped, with two highways and several commercial developments. Stormwater in these areas is impounded or<strong>Draft</strong> | June 2013 3-224
GORST PLANNED ACTION EIS | AFFECTED ENVIRONMENT, SIGNIFICANT IMPACTS, AND MITIGATION MEASURESconveyed as sheet flow over impervious surfaces that discharge to ditches and eventually to fish-bearing streamsand estuarine wetlands in Sinclair Inlet.Stormwater infrastructure deficiencies identified in the UGA include the lack of flow control measures forattenuating peak flows and low capacity for stormwater conveyance, as well as several undersized and crushedculverts which impound stormwater and accumulate sediment that results in flooding of areas in the UGA(Parametrix 2011, City of Bremerton 2013)The Watershed Characterization Report and model identified the <strong>Gorst</strong> UGA as an area of relatively highimportance to water flow processes but is highly degraded (City of Bremerton 2012). Given that this area is alreadydeveloped with urban uses, Creeks in the UGA are channelized with a reduced riparian cover that has impactedwater flow and increased stormwater runoff and degraded stream corridor discharge processes (City of Bremerton2012).The <strong>Gorst</strong> Creek Watershed Existing Drainage Deficiencies Technical Memorandum (City of Bremerton 2013)documents the existing drainage infrastructure deficiencies within the <strong>Gorst</strong> Creek Watershed and has beenprepared as part of the Watershed Characterization Plan. Drainage system problems and untreated stormwaterrunoff currently impact areas in the UGA. Drainage system problems were identified and categorized by type aschemical, biological and physical. Some of the problems identified include erosion, pollution loading, flooding, andfish passage barriers within the watershed. To identify system deficiencies, the City of Bremerton and K drainagecomplaint records were reviewed; discussions were held with the K Surface and Stormwater Management Division;and the Kitsap County Public Health District; and discussions were held with business and home owners nearidentified problem areas on the day after a food rainfall event of 4.09 inches within 24 hours on November 19th,2012. Drainage infrastructure deficiencies are identified at 16 sites (see Figure 3.2-3 <strong>Gorst</strong> Creek IdentifiedInfrastructure Existing Drainage Deficiencies).As previously described in Section 3.2, Water Resources, stormwater related problems included Elite Exterior andBetos Tires, development along W. Belfair Valley Road, and Peninsula Subaru. Elite Exterior has frequent floodingwhen high tides coincide with storm events. Businesses and residences along W. Belfair Valley Road haveexperienced increased flooding from high groundwater in combination with hill slope seepage and insufficientstormwater conveyance from degraded roadside ditches. Peninsula Subaru has drainage issues associated withundersized stormwater drain pipes and culverts with sink holes and slumps occurring on the property.Other stormwater runoff and drainage deficiencies during storm events included lanes of SR 3 closed down forseveral hours from when high tides coincide with storm events. Drainage ditches near Washington Cedar lumberyard and the Walidbilig properties are insufficient for conveyance of stormwater and sandbagging are required toprotect homes from overflowing banks. A drainage complaint was received by the K where the two residencesflood due to installation of private driveway culvert upstream along Sam Christopherson Road. The Countyinspected the site and noted that the culvert and driveway was on private property. The Kitsap County PublicHealth District cited an owner claimed a residence loss from streambank erosion in <strong>Gorst</strong> Creek three to four yearsago. Properties southeast of Old Belfair Valley Road and Sam Christopherson Avenue W. and west of Navy CityMetal reported past flooding. Many homes in the area are now abandoned.<strong>Impact</strong>sThis utilities analysis is based on guidance provided by WAC 197-11-960 (SEPA environmental checklist) regardingidentification, characterization, and mitigation of impacts. The analysis of environmental consequences of theproject alternatives on utilities within the study area includes a description of the methods and summary ofimpacts.The City of Bremerton is compiling watershed data for several models that would identify and prioritize mitigationmeasures that would restore, enhance, and protect water resources and optimize investment in infrastructuresuch as water quality facilities.<strong>Draft</strong> | June 2013 3-225
GORST PLANNED ACTION EIS | AFFECTED ENVIRONMENT, SIGNIFICANT IMPACTS, AND MITIGATION MEASURESThe following is a description of each model for evaluating stormwater-related impacts. The watershedcharacterization model used is described in Ecology publication #10-06-05, “Puget Sound WatershedCharacterization Project: Description of Methods, Models and Analysis”. The document provides guidance on howto conduct a coarse-scale characterization for multiple watershed processes. Application and analysis of the <strong>Gorst</strong>Creek Watershed Characterization was undertaken by a project team from the Department of Ecology. The initialstep involves identifying the geographic area upon which the analysis was run, and selecting GIS map units thatcorrespond to the area of interest. The GIS model brings together the attributes that contribute to water flow inthe landscape where stormwater runoff is a factor in the model.Another model developed for the specifically for the <strong>Gorst</strong> Watershed as a tool to improve stormwater relatedimpacts is a HSPF Model. HSPF is a mathematical model designed to simulate the hydrology and movement ofcontaminants in a basin (Bicknell et al. 2000). Runoff from a basin is quantified by the continuous simulation of thehydrologic response to rainfall and other meteorological records. In HSPF, a basin is represented by a collection ofhydrologically similar areas referred to as hydrologic response units (HRUs) that drain to a stream network. HRUsreflect areas of similar land use, soil, subsurface geology, and other factors that respond the same wayhydrologically to climatic conditions. Runoff is predicted separately for each HRU (inch per hour per acre) androuted to obtain the total runoff for the watershed. This output for this model is a quantified discharge rate thatcan be used with different land use scenarios to predict stormwater runoff and optimize investment stormwaterinfrastructure. These models are used in identifying opportunities for improving stormwater deficiencies. TheSUSTAIN model would be built after a preferred alternative has been determined from the <strong>Draft</strong> EIS process. Thegoal of this SUSTAIN model would optimize the BMPs that could be used in conjunction with the final land usealternative. The results of the model would provide data to support development of the stormwater plan.<strong>Impact</strong>s related to stormwater are predicted based on these models in combination with comparing future landuse designations and description for each alternative. Because specific project-related changes in impervioussurface area are not available, an approximation of proportional changes in stormwater runoff relative to eachland use is used to evaluate of potential effects. Specific new development standards such as the limiting theamount of impervious surface are not capture in this analysis. <strong>Impact</strong>s are generalized and based onapproximations of impervious surface and related stormwater impacts relative to land use classifications asdocumented in Hill et al. 2003 technical report, A Rapid Land Cover Classification Method for Use in UrbanWatershed Analysis.The impact analysis for water (drinking) and wastewater systems addresses both physical impacts on infrastructure(i.e., impacts that could disrupt service or require facility relocations because of proposed development) andcapacity impacts (i.e., the ability of existing infrastructure to accommodate the projected growth in park visitor,employee, and/or residential populations).IMPACTS COMMON TO ALL ALTERNATIVESWatershedUnder all project alternatives and as described in Section 2.0 Alternatives, areas planned land uses outside of the<strong>Gorst</strong> UGA but within the watershed would remain the same as at present. These areas include the City ofBremerton’s CULs and SKIA, the City of Port Orchard’s McCormick Woods, and remaining rural unincorporatedKitsap County lands. In addition, over the next 20 to 30 year jobs would substantially increase from 264 to 2,305primarily due to economic development in the SKIA. The added jobs in the SKIA area would be subject the SKIASubarea Plan. Population growth is projected to increase from 1,810 to 2,659. These changes in the watershedwould increase demand in utilities services. The CFPs for the specific growth areas in the watershed would ensureadequate utility services matched the new demand and reduce the potential for disruption of utility services.The Kitsap County Final EIS for the UGA Sizing and Composition Remand (Kitsap County 2012b) found that withimplementation of the Kitsap County Preferred Alternative Comprehensive Plan, including growth in the cities,<strong>Draft</strong> | June 2013 3-226
GORST PLANNED ACTION EIS | AFFECTED ENVIRONMENT, SIGNIFICANT IMPACTS, AND MITIGATION MEASURESSKIA and <strong>Gorst</strong>, impervious area would make up between 29.9 percent to 30.9 percent in the larger Sinclair Inletwatershed area; no estimates were available at the <strong>Gorst</strong> Creek Watershed boundaries only. Since the <strong>Gorst</strong> CreekWatershed outside of the <strong>Gorst</strong> UGA is not planned for land use changes, this result will apply to all alternatives forterritory outside of the <strong>Gorst</strong> UGA. See Table 3.13-3 High and Low Estimates of Total and Percent ImperviousSurface – Sinclair Inlet Watershed.Table 3.13-3High and Low Estimates of Total and Percent Impervious Surface – Sinclair Inlet WatershedWatershedGroupTotal Acres TIA Low Percent TotalImperviousSurfacePercentSinclair Inlet 27,012 8,071 29.9 8,334 30.9Source: Kitsap County 2012b<strong>Gorst</strong> UGAUnder all alternatives, construction activities within the UGA would have the potential to impact utilities.Depending on the scale, construction projects would likely result in short-term disruptions of service. Scale andintensity of construction projects would vary by alternative. However, differences in scale and intensity of effectsare described in the following sections.Under all alternatives, the <strong>Gorst</strong> UGA would be annexed to the City of Bremerton, resulting in a transition fromCounty to City governance.The City of Bremerton has coordinated with the County during a UGA sizing and composition remand in 2012 thatidentified water and wastewater improvements listed above. Disruption in service would not likely occur becausethe City of Bremerton currently supplies drinking water and collects wastewater (Figure 3.13-1 <strong>Gorst</strong> DrinkingWater and Wastewater Systems.Under all alternatives, the water (drinking) and wastewater systems have the capacity to accommodateanticipated growth. However, only the projected growth for no action (Alternative 1) is accounted for in KitsapCounty CFP. Both action alternatives (Alternatives 2 and 3) propose development at the mine site and wouldrequire an evaluation of drinking water and wastewater capital improvements which are described under therespective alternative.Considering the land use plans described in Section 2 Alternatives and the proposed developable coverage limitsproposed in the <strong>Draft</strong> Subarea Plan, all alternatives would have the potential to increase impervious areas asshown in Table 13.3-4 Comparison of Added Impervious Area in <strong>Gorst</strong> UGA. Alternatives 2 and 3 assume a greateramount of developable land than Alternative 1, largely due to the anticipated conversion of the mine site forresidential or mixed uses.<strong>Draft</strong> | June 2013 3-227
THIS PAGE INTENTIONALLY BLANK
Bremerton West UGA<strong>Gorst</strong> UGAPump Station)[SB-3Booster Station)[SB-4!A!A[Port Orchard UGA!A!A)A!A ! ! A !!A A !SB-1Pump StationPath: P:\ENV\PROJECTSW\60271862 <strong>Gorst</strong> Subarea Plan\400 Technical Information\423 GIS\3_MXDs\EIS Figures\Drinking and Sewer Water.mxd!A ) [ ULID6¯0 0.25 0.5 Miles
THIS PAGE INTENTIONALLY BLANK
GORST PLANNED ACTION EIS | AFFECTED ENVIRONMENT, SIGNIFICANT IMPACTS, AND MITIGATION MEASURESTable 3.13-4Comparison of Added Impervious Area in <strong>Gorst</strong> UGALand Alternative 1 2 Alternative 2 Alternative 3Vacant and Underutilized Acres, excluding critical areas 1 74.0 117.1 117.1Estimated Impervious Acres 51.3 68.0 68.8Share of Developable Acres in Impervious Surfaces (percentage) 69 58 59Note:1 This includes land that could be used for rights of way and public facilities and is not discounted for market factors.2Includes Kitsap County owned property on Sinclair Inlet, assuming a lower impervious area consistent withSource: BERK 2013park/open space assumed in Alternatives 2 and 3.Restoration may be limited to stormwater retrofit actions. However, restoration of in-stream alterations (removalof channel armoring, berms) and re-establishment of natural stream structure (i.e., reducing channelization in thelower reaches of the stream) may be appropriate given that upstream processes for the northern half of thewatershed are relatively intact.Alternative 1Growth in the <strong>Gorst</strong> UGA would be served by current water service providers, which have adequate capacity forgrowth.Wastewater deficiencies were addressed following the installation of the collection system in 2010. Theinstallation of new wastewater mains in 2010 has allowed residents to abandon on-site septic systems in areassusceptible to failure due to saturated soils and flooding. However, given the gradual increase in demand,extension of service would be needed for new development.New stormwater standards would not be adopted, and deficiencies would continue to be unresolved underexisting stormwater plans. However, Kitsap County’s CFP would eventual incorporate measures for addressingdeficiencies. Runoff during storm events would continue to cause sheet flow over roads and discharge directly tostreams and water bodies including <strong>Gorst</strong> Creek and Sinclair Inlet. The increase in development, particularly fromcommercial development would also likely increase impervious surfaces. Table 3.13-4 Comparison of AddedImpervious Area in <strong>Gorst</strong> UGA above indicates an increase in about 51.3 acres of impervious area.Future utility needs from the increase in 742 jobs and a population growth of 82 persons over the next 20 to 30years would be addressed through incremental capital facility planning.Overall, the effects on utilities under the Alternative 1 would be moderate from the long-term higher frequency ofmaintenance on aging utility infrastructure and untreated stormwater discharging directly to fish-bearing streamsand estuarine wetlands in Sinclair Inlet.Alternative 2Under the Alternative 2, a regional commercial center corridor along the waterfront would be developed, theWatershed Characterization & Framework Plan would be adopted, and clustered Medium Density Residentialdevelopment would occur. Construction activities associated with Alternative 2 could result in minor short-termdisruption of service.Similar to Alternative 1, the City of Bremerton would continue to provide clean drinking water to the residents ofthe UGA. The <strong>Gorst</strong> UGA would be served by current water service providers, which have adequate water sourcecapacity for growth. New development at the mine site would require developer installed improvements foradequate distribution of drinking water.<strong>Draft</strong> | June 2013 3-231
GORST PLANNED ACTION EIS | AFFECTED ENVIRONMENT, SIGNIFICANT IMPACTS, AND MITIGATION MEASURESUnlike Alternative 1, adoption of the Watershed Characterization & Framework Plan would provide a directive forenhancing and protecting water for human use to residents of the UGA. Generally, the Watershed Characterization& Framework Plan would protect the north central portion of the watershed, the tributaries, and the estuary,while allowing for additional growth and development in the south, and southeastern portions of the watershed,subject to existing protection measures and BMPs. The Guiding Principles would direct more specific action thatmay include water quality treatment for new impervious surfaces.Alternative 2 would allow a moderate increase in employment of 606 jobs and a more substantial increase inresidents of 985 persons over the next 20 to30 years that would substantially increase demand for wastewatertreatment. This projected growth is not accounted for in Kitsap County CFP. In general an extension of sewer mainsand improvement to existing pump stations may be required for the proposed Medium Density Residential area inthe mine area. The mine area is currently undeveloped and wastewater system installation is not anticipated todisrupt service in the area. A preliminary analysis of sewer capacity at the mine where approximately 96 acrescurrently used for mineral resources would be converted to Medium Density Residential results in a projectedsanitary flow consistent with the recommended 8-inch diameter system documented in the Kitsap County CFP andcould accommodate the additional residential population at the mine site. In addition, the proposed newresidential area would require developer installed improvements to the wastewater system to accommodate newgrowth.In addition, current deficiencies in stormwater conveyance would be resolved, and standards would be establishedto promote natural stormwater management. Stormwater management on proposed new development andredevelopment would follow the Watershed Characterization & Framework Plan and result in reduced stormwaterrunoff. Proposed LID techniques would reduce flooding problems. Compilation of watershed data and use of thehydrology and hydraulic modeling would also assist in identify priority areas and optimize investment ofstormwater facilities. However, for a conservative analysis in this <strong>Draft</strong> EIS, a comparison of impervious area showsan increase in impervious area over the Alternative 1 No <strong>Action</strong> option due to the added development of the minesite. As described, the stormwater standards would be stricter and zero discharge of direct untreated stormwaterwould be allowed, and greater water quality standards would be instituted.The watershed characterization model identifies the <strong>Gorst</strong> UGA as a restoration and development zone. The modelresults for storage suggest that the mid to lower reaches of Parish Creek and two west of the upper reaches of<strong>Gorst</strong> Creek are appropriate for urban development involving permanent change in land cover (buildings, roads,sewers). The reclassification of industrial areas to open space/recreation and redevelopment as strictly commercialareas provides an opportunity to improve buffer along the shoreline and set aside areas for stormwaterinfiltration. Potential redevelopment in the low density residential areas also provides opportunities for protectionof critical areas such as the <strong>Gorst</strong>-Parish floodplain complex and encourages greater floodplain storage which, inturn would reduce stormwater runoff.Overall, Alternative 2 would have a minor effect on utilities from short-term construction related disruptions ofservice and long-term development continued development of high density commercial areas along the shoreline.The long-term effects of the commercial development may be offset by implementation of the adopted WatershedCharacterization & Framework Plan that would ensure stormwater in the watershed would be treated prior todischarge into sensitive waterways or critical areas. The Watershed Characterization & Framework Plan wouldhave a beneficial effect on stormwater management.Alternative 3Under Alternative 3, the Watershed Characterization & Framework Plan would be adopted, along with LID andstormwater standards. Similar to Alternative 2, construction activities associated with Alternative 3 could result inminor short-term disruption of service. Similar to Alternatives 1 and 2, the <strong>Gorst</strong> UGA would be served by currentwater service providers, which have adequate water source capacity for growth. New development at the minesite would require developer installed improvements for adequate distribution of drinking water. Similar to<strong>Draft</strong> | June 2013 3-232
GORST PLANNED ACTION EIS | AFFECTED ENVIRONMENT, SIGNIFICANT IMPACTS, AND MITIGATION MEASURESAlternative 2, adoption of the Watershed Characterization & Framework Plan would ensure a directive forenhancing and protect water for human use to residents of the UGA. Alternative 3 supports less job growth at 333jobs, but the highest population growth at 1,082 persons over the next 20 to30 years. Again, this projected growthis not accounted for in Kitsap County CFP. This would substantially increase demand for wastewater treatment, butsimilar to Alternative 2, the current wastewater system has the capacity to accommodate the anticipated growth.Extension of sewer mains and improvement to existing pump stations may be required for the proposedNeighborhood Mixed Use zone in the mine area. A preliminary analysis of sewer capacity at the mine whereapproximately 96 acres currently used for mineral resources would be converted to Neighborhood Mixed Useresults in a projected sanitary flow consistent with the recommended 8-inch diameter system documented in theKitsap County CFP and could accommodate the addition residential population at the mine site. In addition, theproposed new residential area would require developer installed improvements to the wastewater system toaccommodate new growth.Similar to Alternative 2, the watershed characterization model identifies the <strong>Gorst</strong> UGA as a restoration anddevelopment zone. The reclassification of industrial areas to open space/recreation provides a greater area thanAlternative 2 for stormwater infiltration. The reclassification of commercial areas to mixed used development hasmoderate opportunity to reduce impervious surface and stormwater runoff but greater than Alternative 2.Potential redevelopment across the UGA also provide opportunities for protection critical areas such as the <strong>Gorst</strong>-Parish floodplain complex and encourage greater floodplain storage and reduce stormwater runoff.Overall, Alternative 3 would have a minor effect on utilities from short-term construction related disruptions ofservice and long-term redevelopment of high density commercial areas with mixed use developments. Thesubstantial increase in residential development and population would affect demand of existing utility services. Acomparison of impervious area shows an increase in impervious area over the Alternative 1 No <strong>Action</strong> option andslightly more than Alternative 2 due to the added development of the mine site and mixed use areas. As described,the stormwater standards would be stricter, zero discharge of direct untreated stormwater would be allowed, andgreater water quality standards would be instituted. The long-term effects of replacing the existing high densitycommercial developments with a low intensity waterfront along the shoreline and implementation of the adoptedWatershed Characterization & Framework Plan would have a beneficial effect on stormwater management.Mitigation MeasuresSpecific mitigation measures for potential impacts on utilities would be determined during subsequent projectspecificenvironmental review and permitting or through the <strong>Planned</strong> <strong>Action</strong> Ordinance. Mitigation includesincorporated plan features, applicable regulations and commitments, and other potential measures.Incorporated Plan FeaturesAll alternatives including the No <strong>Action</strong> would be subject to NPDES programs and rules. Continued application ofCounty and City NPDES programs and stormwater manuals (which incorporate LID measures) will help reduceimpacts of new development on stormwater.Features of the <strong>Gorst</strong> Creek Watershed Characterization & Framework Plan and <strong>Gorst</strong> Subarea Plan that serve asmitigation include the following:• Implement tailored stormwater standards for the <strong>Gorst</strong> Creek Watershed, including LID standards in areas ofdevelopment, restoration and protection.• Wherever practicable, new development and redevelopment should incorporate LID measures such asinfiltration. Where impractical, stormwater detention may be allowed.• Minimize clearing and promote stormwater management in the upper and middle portions of the watershedto reduce impacts to the lower watershed.<strong>Draft</strong> | June 2013 3-233
GORST PLANNED ACTION EIS | AFFECTED ENVIRONMENT, SIGNIFICANT IMPACTS, AND MITIGATION MEASURES• Promote green infrastructure for both new and existing facilities, such as by identifying areas to target forstormwater retrofits.• Allow zero direct and untreated discharge to streams and marine water bodies in association withdevelopment and redevelopment.Additionally, capital facility improvements have been recommended measures for addressing stormwaterdeficiencies. Implementation of these improvements could result in beneficial effects on stormwater and indirectlyprotect drinking water and wastewater facilities by reducing flood-prone damage and erosion.Applicable Regulations and CommitmentsApplicable regulations and commitments include the following:• Safe Drinking Water Act. Sets national primary drinking water standards. The act includes the designation ofsole source aquifers. The 1996 amendment identifies source water protection.• CWA. Regulates discharge of stormwater from certain industries and municipalities. NPDE) permit or waterquality discharge permit. The EPA delegated the Department of Ecology the authority to implement thesepermits in Washington State.• Drinking Water Regulations Chapter 70.116 RCW. Directs the Washington State Department of Health toassure safe and reliable drinking water and protect drinking wells.• Washington State Water Pollution Control Act RCW 90.48. Regulates various source control activities relatedto sediment management.• City of Bremerton Comprehensive Wastewater Plan and Updates. Ensures adequate existing and futurewastewater capacity.• City of Bremerton Stormwater Management Program. Summarizes the actions to be taken by the City ofBremerton to fulfill its obligations as listed in the NPDES Phase II Municipal Stormwater Permit.• City of Bremerton BMC Chapter 15, Stormwater, SWMMWW and LID Guidance Manual. Regulates forstormwater management associated with new development and redevelopment.• Kitsap County 20-year wastewater facility plan. Ensures adequate existing and future wastewater capacity.• Kitsap County Surface and Stormwater Management Program. Protects people, property and naturalresources by reducing flooding and stormwater runoff, conserving groundwater, restoring fish habitat, andpreventing stormwater pollution.• KCC Chapter 12, Stormwater Drainage, and Kitsap County Stormwater Design Manual. Regulates forstormwater management associated with construction.• Any future development would need to comply with applicable utility franchises and permits.Other Potential Mitigation MeasuresOther potential mitigation measures could include the following:• Evaluate the effect on proposed utility relocations on other nearby utility infrastructure.• Determine the exact location and depth of utilities and work with individual utility providers to verify thelocation.• Complete utility relocation or modification, where feasible, prior to project-specific construction to reduceoperational risks and reduce any potential disruption of service.<strong>Draft</strong> | June 2013 3-234
GORST PLANNED ACTION EIS | AFFECTED ENVIRONMENT, SIGNIFICANT IMPACTS, AND MITIGATION MEASURESSignificant Unavoidable Adverse <strong>Impact</strong>sUnder all alternatives, the <strong>Gorst</strong> Creek Watershed and the <strong>Gorst</strong> UGA would experience additional population andemployment growth. Development in the <strong>Gorst</strong> Creek UGA is anticipated under the alternatives andcomprehensive planning, as well as review of project specific development utility permits, would result in nosignificant unavoidable adverse impacts on water, wastewater, and stormwater.Future project construction associated with any of the project alternatives could cause temporary serviceinterruptions to existing utilities. Under the Alternative 1, the long-term higher frequency of maintenance on agingutility infrastructure and untreated stormwater discharging directly to fish-bearing streams, estuarine wetlands,and tidally influence waters is considered a moderate impact. Both Alternative 2 and 3 would have beneficialeffects on stormwater management from adoption of the Watershed Characterization & Framework Plan.3.13.4. TelecommunicationsAffected EnvironmentThe telecommunications services discussed in the section include telephones, cable television, and cellular phones.The WUTC regulates telephone and radio communications; cable television and cellular telephone service are notunder WUTC jurisdiction and are regulated by the Federal Communications Commission (FCC). Telecommunicationproviders must also comply with local regulations such as land use and public rights-of-way. The companiesdiscussed here often provide more than one type of telecommunications service. In this discussion, they areintroduced under the category with which they are most commonly associated.WatershedTelecommunication ServicesTelephone service providers are require by state law to provide adequate telecommunications service on demandper Chapter 80.36.090 RCW. Telephone service providers are therefore required to provide services in a mannerthat accommodates growth within their service area, wherever it may occur. As such, telephone service providersgenerally do not conduct detailed long-range planning activities. General improvements and maintenancenecessary keep the current system operational and to accommodate future growth are implemented as required.CenturyLink provides local and long-distance telephone service throughout Kitsap County and also provides digitaltelevision and DSL Internet. Kitsap PUD also operates a fiber-optic network, providing wholesale broadbandinternet access. State law prevents the PUD from offering this service directly to residents, but they sell access tothe network to various telecommunications retailers, who offer that access to consumers. Othertelecommunications providers in the vicinity of the study area include AT&T, McLeodUSA, NW CommNet LLC,Sprint, and Verizon.Cable TelevisionCable television providers are regulated under the Cable Television Consumer Protection and Competition Act of1992, which is enforced by the FCC. Cable television providers enter franchise agreements with local governments;these franchise agreements regulate service rates to ensure compliance with FCC guidelines. Cable televisionservice in the <strong>Gorst</strong> watershed is provided by Comcast, DirectTV, and Wave Broadband. Comcast and WaveBroadband also provide digital phone service and broadband internet access.Cellular TelephoneCellular telephone service in the watershed is provided by a variety of national and regional carriers, includingVerizon Wireless, AT&T, T-Mobile, Sprint, and Cricket Wireless. Cellular telephone providers are regulated directlyby the FCC. Cellular service depends upon a series of transmitting antennae located on towers throughout aprovider’s service area. Additional antennae are constructed when a particular area begins to experience capacityoverload, and providers will expand capacity in response to consumer demand.<strong>Draft</strong> | June 2013 3-235
GORST PLANNED ACTION EIS | AFFECTED ENVIRONMENT, SIGNIFICANT IMPACTS, AND MITIGATION MEASURES<strong>Gorst</strong> UGATelecommunications services in the vicinity of the <strong>Gorst</strong> UGA are provided on a regional basis. As such, existingservice conditions within the UGA are the same as for the watershed as a whole.<strong>Impact</strong>sIMPACTS COMMON TO ALL ALTERNATIVESWatershedNo land use changes are proposed for the <strong>Gorst</strong> Creek watershed outside the <strong>Gorst</strong> UGA. Updated stormwater andhabitat regulations in this area are not anticipated to have significant effects on the rate of population growth inthis area or the demand for telecommunication services. Therefore, no significant impacts are anticipated underany of the alternatives.<strong>Gorst</strong> UGAAs population and employment increases in the <strong>Gorst</strong> UGA, telecommunication service providers will experienceincreased demand for service. Funding for necessary system improvements or expansions would be generated byuser fees.Alternative 1Under the No <strong>Action</strong> Alternative, residential, commercial, and industrial growth in the <strong>Gorst</strong> UGA would continueaccording to adopted land use designations and zoning, bringing an additional 82 residents and 742 jobs to thearea. Growth in the UGA would increase demand for telecommunications services. While the No <strong>Action</strong> Alternativewould result in the least increase in residential demand, it would increase commercial demand to a greater degreethan either of the <strong>Action</strong> Alternatives. Compared with the size of the regional customer bases for each of theservice providers, the anticipated growth in the <strong>Gorst</strong> UGA is relatively small and is unlikely to have any significantimpacts on the regional provision of telecommunication services in Kitsap County.Alternative 2Under Alternative 2, residential and commercial growth in the <strong>Gorst</strong> UGA would increase in accordance with theproposed land use designations and zoning, bringing an additional 985 residents and 606 jobs to the area. Growthin the UGA would increase demand for telecommunications service. The increased demand could potentiallyrequire additional infrastructure or upgrades to existing infrastructure, particularly in previously undevelopedportions of the UGA, such as the existing mine site. This infrastructure would be upgraded or installed at the timenew development occurs, and connections would be made at the time of customer request.While Alternative 2 would create a higher demand for residential service than the No <strong>Action</strong> Alternative, it wouldcreate less demand than Alternative 3. Alternative 2 would create greater commercial demand than Alternative 3,but less than then No <strong>Action</strong> Alternative. Compared with the size of the regional customer bases for each of theservice providers, the anticipated growth in the <strong>Gorst</strong> UGA is relatively small and is unlikely to have any significantimpacts on the regional provision of telecommunication services in Kitsap County.Alternative 3Under Alternative 3, residential and commercial growth in the <strong>Gorst</strong> UGA would increase in accordance with theproposed land use designations and zoning, bringing an additional 1,082 residents and 333 jobs to the area.Growth in the UGA would increase demand for telecommunications service. The increased demand couldpotentially require additional infrastructure or upgrades to existing infrastructure, particularly in previouslyundeveloped portions of the UGA, such as the existing mine site. This infrastructure would be upgraded orinstalled at the time new development occurs, and connections would be made at the time of customer request.<strong>Draft</strong> | June 2013 3-236
GORST PLANNED ACTION EIS | AFFECTED ENVIRONMENT, SIGNIFICANT IMPACTS, AND MITIGATION MEASURESWhile Alternative 3 would create a higher residential demand for telecommunications service than the No <strong>Action</strong>Alternative or Alternative 2, it would create the least commercial demand of the three alternatives. Comparedwith the size of the regional customer bases for each of the service providers, the anticipated growth in the <strong>Gorst</strong>UGA is relatively small and is unlikely to have any significant impacts on the regional provision oftelecommunication services in Kitsap County.Mitigation MeasuresIncorporated Plan Features• Mixed-use and clustered development is encouraged in select areas under Alternative 3, and both Alternatives2 and 3 would result in increased residential density over existing conditions. Providing wired communicationservices to higher-density and cluster development is often more efficient than provision to low-densitydevelopment.Applicable Regulations and Commitments• Future construction of telecommunications infrastructure would be required to comply with federal and statelaws, including the regulations of the FCC; the provisions of the Cable Television Consumer Protection andCompetition Act, as appropriate; the regulations of the BMC; and the KCC.Other Potential Mitigation Measures• Encourage co-location of telecommunications facilities wherever appropriate and undergrounding ofinfrastructure to minimize aesthetic impacts.• Encourage the use of appropriate site landscaping to screen telecommunications equipment from surroundingproperties and the public realm.Significant Unavoidable Adverse <strong>Impact</strong>sPopulation and employment growth under all studied alternatives will increase demands for telecommunicationsthat in turn will increase the need for additional facilities. Planning efforts to manage growth should reduce thedemand and/or accommodate growth in a coordinated fashion than would otherwise occur.<strong>Draft</strong> | June 2013 3-237
GORST PLANNED ACTION EIS | AFFECTED ENVIRONMENT, SIGNIFICANT IMPACTS, AND MITIGATION MEASURES3.14 Relationship to Plans and PoliciesThis section evaluates the alternatives for consistency with state, regional, countywide, and city plans and policiesincluding GMA Goals, PSRC’s Vision 2040, Kitsap County CPP, and the City of Bremerton and Kitsap CountyComprehensive Plans.Affected EnvironmentWashington GMAThe Washington State GMA was adopted in 1990 by the Washington State Legislature. The GMA contains acomprehensive framework for managing growth and coordinating land use with infrastructure. Kitsap County andall of its cities are subject to GMA and must create comprehensive plans and development regulations that guidegrowth to meet state goals for compact land use patterns that provide a range of housing and economicopportunities, environmental protection, and efficient public services and infrastructure. A summary of GMAprovisions relevant to the <strong>Gorst</strong> Creek Watershed and <strong>Gorst</strong> UGA is presented in this section.GMA Planning GoalsGMA contains 13 broad planning goals (RCW 36.70A.020) to guide local jurisdictions in determining their vision forthe future and in developing plans, regulations, programs and budgets to implement that vision. The goals aresummarized below. They are not ranked in any order but can be balanced by the jurisdiction.• Guide growth in urban areas• Reduce sprawl• Encourage an efficient multimodal transportationsystem• Encourage a variety of housing types includingaffordable housing• Promote economic development• Recognize property rights• Protect agricultural, forest, and mineral lands• Retain and enhance open space, protecthabitat, and develop parks and recreationfacilities• Protect the environment• Ensure adequate public facilities and services• Encourage historic preservation• Foster citizen participation• Ensure timely and fair permit proceduresA fourteenth goal of GMA consists of the goals and policies of the Shoreline Management Act as set forth in RCW90.58.020.Comprehensive PlansGMA requires the preparation of a comprehensive plan with the following required elements: land use, rural(counties only), housing, transportation, utilities, capital facilities, parks and recreation, and economicdevelopment. The plan is to contain a land use plan, inventories of conditions, and goals and policies consistentwith GMA goals. Development regulations are to be consistent with the community’s Comprehensive Plan.The City of Bremerton and County have been developing a subarea plan to more directly and fully address futureland use, urban design, stormwater, transportation, habitat protection, and other activities in the study area. Asubarea plan is an optional element of a comprehensive plan allowed under the GMA. Subarea plans apply tosmaller focused areas than the comprehensive plan, which addresses the whole City of Bremerton or County andits assigned unincorporated UGAs. Subarea plans are typically more detailed than a comprehensive plan and oftenestablish specific visions, goals, policies, land use plans, design guidelines, zoning, infrastructure and public serviceneeds, and other development regulations.<strong>Draft</strong> | June 2013 3-238
GORST PLANNED ACTION EIS | AFFECTED ENVIRONMENT, SIGNIFICANT IMPACTS, AND MITIGATION MEASURESGMA requires early and continuous public participation during the preparation and adoption of comprehensiveplans and development regulations, including subarea plans. Public participation procedures that are described inthe procedural rules (WAC 365-196-600) include broad dissemination of proposals and alternatives, opportunityfor written comment, public meetings after effective notice, provision for open discussion, communicationprograms, information services, and consideration of and response to public comments. See Chapter 2 of this <strong>Draft</strong>EIS for a description of public participation opportunities associated with the <strong>Gorst</strong> Creek Watershed Framework &Characterization Plan and <strong>Gorst</strong> Subarea Plan.Urban Growth AreasCounties and cities must create comprehensive plans, and counties must designate UGAs—areas characterized byurban development or adjacent to areas characterized by urban development. Designated UGAs shouldaccommodate future urban growth; services and facilities and their areas should be available or planned tosupport future urban growth. All cities must be within UGAs; unincorporated land within UGAs must be urban incharacter or adjacent to such lands. Under GMA, the preferred urban service providers in UGAs are cities.Lands outside of UGAs are to be designated as rural or resource lands of long-term commercial significance such aslands used for forestry activities. In general, urban development is not to be permitted on these lands and alldevelopment must be rural in character.Within the watershed there are urban lands including McCormick Woods that was annexed to the City of PortOrchard from the McCormick Woods UGA. Also, the City of Bremerton limits contain the SKIA with the BremertonNational Airport and lands designated for industrial and commercial use surrounding the airport. The <strong>Gorst</strong> UGAcontains lands that are characterized by urban development, having lands with intensive commercial developmentas well as single family lots of a suburban character.<strong>Gorst</strong> is an unincorporated community under the management of Kitsap County, and its UGA was established in1998. Kitsap County has associated the <strong>Gorst</strong> UGA with the City of Bremerton, meaning the City of Bremerton isthe designated future service provider for the UGA and may annex it.Areas in between the Bremerton and Port Orchard city limits and the <strong>Gorst</strong> UGA are designated as RuralResidential and Urban Reserve with 5 and 10 acre minimum lot sizes, respectively. Urban Reserve areas are to beconsidered in future UGA expansions if needed to support population growth. However, prior to expanding a UGA,Kitsap County would need to demonstrate that there was insufficient capacity and that reasonable measures toincrease the capacity for urban growth within existing UGA boundaries have been taken.Population and Employment EstimatesGMA requires the Washington State Office of Financial Management to prepare population forecasts, high,medium, and low, for counties. Counties have a responsibility to allocate population in consultation with cities. InKitsap County, future growth is based on population distributions recommended by the KRCC, which is composedof elected officials and planning directors from all city and Tribal jurisdictions in addition to the BOCC and KitsapCounty’s planning director. The population distributions were adopted by the BOCC and ratified by the cities.As established in 2004, the Kitsap County CPPs establish a population target of 331,571 people by 2025 with anassumption of 99,602 added persons between 2000 and 2025. The growth allocated to <strong>Gorst</strong> UGA was only 73 newpersons for same 25 year period. As a result of the County’s 2006 Comprehensive Plan Update, the <strong>Gorst</strong>. UGA wasexpanded west of Sam Christopherson Road to add capacity for the additional growth. As a result of expanding theUGA single family homes and lots created pre-GMA were included, adding residents once in the rural area into theUGA.In 2012, Kitsap County conducted a UGA Resizing and Recomposition Remand and amended its ComprehensivePlan with an updated base year of 2010 and a horizon year of 2025. The new 2010 base compared to the 2025allocation meant that the net population growth would be 76 persons, meaning that there slightly fewer persons<strong>Draft</strong> | June 2013 3-239
GORST PLANNED ACTION EIS | AFFECTED ENVIRONMENT, SIGNIFICANT IMPACTS, AND MITIGATION MEASURESin 2010 compared to the 2000 population. 5 Accordingly, the capacity for growth within the <strong>Gorst</strong> UGA boundariesas adjusted in 2006 would still be needed to meet the growth allocation to the year 2025. The land capacityanalysis in 2006 and 2012 assumed the mine site would continue as a mine since it has a mineral lands designationand is currently being mined.While the <strong>Gorst</strong> growth target and land capacity are low, Bremerton has population that is unaccommodated inother assigned UGAs (e.g. Bremerton East and Bremerton West, in particular, total 1,776 of unaccommodatedpopulation). Kitsap County Comprehensive Plan policies support population reallocation discussions through theKRCC. In addition, the KRCC is planning to prepare new growth targets for the 2010-2035 time periods, and theremay be opportunities to reallocate or newly allocate population growth. See Table 3.14-1 Comparison of GrowthTargets and Population Capacities.Table 3.14-1Comparison of Growth Targets and Population Capacities2012 Kitsap CountyComprehensive PlanUGAGrowth Target2010-2025CapacityDifferencefrom TargetKingston UGA 2,805 2,821 16Poulsbo UGA 3,739 2,152 -1,587Silverdale UGA 7,779 7,768 -11Central Kitsap UGA 6,191 6,500 309Bremerton East UGA 3,529 2,017 -1,512Bremerton West UGA 2,346 2,082 -264<strong>Gorst</strong> UGA 76 82 6Port Orchard UGA 8,506 8,006 -500McCormick Woods UGA ULID6 6,780 8,093 1,313Bremerton Port UGA (SKIA) -129 0 -129Unincorporated UGA Total 41,622 39,521 -2,359Percent Difference from Target (including Poulsbo and SKIA) -6Source: Kitsap County 2012Employment projections were used in 2006 to help allocate future land use in UGAs. While the County projectsfuture employment, there is no specific employment target for Kitsap County or its jurisdictions.The County last studied employment growth for a planning period of 2005-2025. The County’s 2006 analysisshowed that the <strong>Gorst</strong> UGA had an approximate demand for about 700 commercial and industrial jobs (based ontrends between 1995 and 2004), a surplus of commercial land and a low demand for industrial land. See Table3.14-2 Estimated Net Land Demand by Unincorporated UGA, 2025. The County’s land capacity analysis in 2006showed a capacity for about 742 jobs, close to the trended analysis of 1995-2004. Based on trends from 2000-2010, there has been some investment in commercial activities (e.g. Subaru dealership), though with the recession5 This is consistent with permit trends in the Socio-economics section of the EIS where only one building permit fora home was issued in the last 10 years in the <strong>Gorst</strong> UGA.<strong>Draft</strong> | June 2013 3-240
GORST PLANNED ACTION EIS | AFFECTED ENVIRONMENT, SIGNIFICANT IMPACTS, AND MITIGATION MEASURESand recovery, job growth has been slower. The County will revisit employment growth in its 2016 ComprehensivePlan Update.Table 3.14-2Estimated Net Land Demand by Unincorporated UGA, 2025Estimated Net New Jobs 2005 - 2025 Existing Vacant Land Supply (Acres)Estimated Net Land Need by2025UGA Commercial Industrial Total Commercial Industrial Total Commercial IndustrialBremerton East 75 331 406 6 - 6 insignificant very lowBremerton West 1,501 308 1,809 10 13 23 low lowCentral Kitsap 3,876 2,029 5,905 101 10 110 mid very high<strong>Gorst</strong> 86 606 692 31 6 37 surplus lowKingston 1,406 457 1,863 34 10 44 low lowMcCormick Woods 25 70 95 - 53 53 insignificant none*Port Orchard 2,237 1,115 3,352 231 19 250 none* midPoulsbo 729 681 1,411 - 10 10 low lowSilverdale 6,322 3,646 9,969 133 293 426 very high very highSKIA 529 3,196 3,726 - 1,575 1,575 very low none*ALL 16,787 12,440 29,228 547 1,988 2,535Notes:Source:Job forecasts for unincorporated UGAs begin with a straight line projection of observed growthbetween 1995 and 2004, and are then increased so that total unincorporated UGA job growth matchesthe county’s residual growth (after city growth is subtracted) of 29,228. This residual target is aproduct of a county-generated countywide forecast that included a policy commitment to significantlyincrease the county’s manufacturing jobs base. City forecasts, prepared according to varyingmethodologies, were subtracted from this total. The total unincorporated UGA target forecast reflectsambitious manufacturing growth targets, compensates for lower growth trends that cities may haveassumed, and assumes that most growth generated from rural area employment (approximately 13,000jobs in 2004) is allocated to UGA boundaries. Ten percent of residual county employment growth hasbeen reserved for rural areas outside of the Urban Growth Areas.*The past employment trends that ground this land demand analysis may or may not be carried intothe future (particularly if circumstances such as available infrastructure change). This data should beviewed as contextual information rather than a limiting factor in policy decisions.PSRC; Kitsap County, Kitsap County Updated Land Capacity Analysis (2005), E.D. Hovee &Company.Source: Kitsap County 2006Plan ConsistencyUnder GMA comprehensive plans must be internally and externally consistent. Internal consistency means that the“differing parts of the comprehensive plan must fit together so that no one feature precludes the achievement ofany other.” (GMA — procedural criteria WAC 365-196-500(1)). Externally, local comprehensive plans are requiredto be consistent with the comprehensive plans of other jurisdictions with common borders or related regionalissues. (WAC 365-196-510(1)) State Department of Commerce rules (WAC 365-196-510(2)) indicate that interjurisdictional (external) consistency is accomplished by consistency with CPPs discussed below.Each county or city that is preparing a GMA comprehensive plan or implementing development regulations, oramendments to them, is required to submit the proposed plan or regulations to the Washington State Departmentof Commerce and other departments for review and comment before final adoption.The <strong>Draft</strong> <strong>Gorst</strong> Creek Watershed Framework & Characterization Plan and <strong>Draft</strong> <strong>Gorst</strong> Subarea Plan weredeveloped in conjunction with federal, tribal, state and local partners (see Chapter 2), and are under review bystate agencies as part of the draft comment period (see Fact Sheet).SEPASEPA (RCW 43.21C), requires government officials to consider the environmental consequences of actions they areabout to take and consider better or less damaging ways to accomplish those proposed actions. They mustconsider whether the proposed action would have a probable significant adverse environmental impact on thenatural and built environment. This <strong>Draft</strong> EIS provides a programmatic analysis of the non-project <strong>Gorst</strong> CreekWatershed Framework & Characterization Plan and <strong>Gorst</strong> Subarea Plan. The SEPA process is more fully describedin Chapter 2 of this document.<strong>Draft</strong> | June 2013 3-241
GORST PLANNED ACTION EIS | AFFECTED ENVIRONMENT, SIGNIFICANT IMPACTS, AND MITIGATION MEASURESVISION 2040 and Transportation 2040VISION 2040 is a regional growth strategy prepared by the PSRC and its member governments, including King,Kitsap, Pierce, and Snohomish Counties. Transportation 2040 is a transportation plan for the central Puget Soundregion. Both plans provide a coordinated framework for guiding growth and transportation actions over the nexttwenty years.VISION 2040 is based on a centers concept, encouraging growth to take place within regional centers of growth,and focusing economic development and transportation infrastructure investments there. Under VISION 2040, thePSRC designates the following urban areas/municipalities of Kitsap County.• Downtown Bremerton as a “Regional Growth Center.”• Silverdale as a “Regional Growth Center.”• SKIA as a “Regional Manufacturing/Industrial Center.”In addition to the Centers concept, VISION 2040 classifies different communities according to the roles they play inthe region and allocates population accordingly. The majority of the region’s employment and housing growth isallocated to Metropolitan Cities and Core Cities, which include the centers, and thus include Bremerton andSilverdale. Larger Cities also play an important role over time as places that accommodate growth; only BainbridgeIsland is considered a Large City. Small Cities provide jobs and housing that support vital and active communities ata less intensive scale; both Port Orchard and Poulsbo are considered Small Cities.VISION 2040 contains a variety of elements addressing regional growth and development. Each of these topicareas are described below, providing overarching goals where applicable.• General Policies: The general policies address coordination of jurisdictions, monitoring of Vision 2040, andfiscal challenges and opportunities including exploring funding sources for services and infrastructure.• Environment: The region will care for the natural environment by protecting and restoring natural systems,conserving habitat, improving water quality, reducing GHG emissions and air pollutants, and addressingpotential climate change impacts. The region acknowledges that the health of all residents is connected to thehealth of the environment. Planning at all levels should consider the impacts of land use, developmentpatterns, and transportation on the ecosystem.• Development Patterns: The region will focus growth within already urbanized areas to create walkable,compact, and transit-oriented communities that maintain unique local character. Centers will continue to be afocus of development. Rural and natural resource lands will continue to be permanent and vital parts of theregion.• Housing: The region will preserve, improve, and expand its housing stock to provide a range of affordable,healthy, and safe housing choices to every resident. The region will continue to promote fair and equal accessto housing for all people.• Economy: The region will have a prospering and sustainable regional economy by supporting businesses andjob creation, investing in all people, sustaining environmental quality, and creating great central places,diverse communities, and high quality of life.• Transportation: The region will have a safe, cleaner, integrated, sustainable, and highly efficient multimodaltransportation system that supports the regional growth strategy and promotes economic and environmentalvitality, and better public health.• Public Services: The region will support development with adequate public facilities and services in acoordinated, efficient, and cost-effective manner that supports local and regional growth planning objectives.<strong>Draft</strong> | June 2013 3-242
GORST PLANNED ACTION EIS | AFFECTED ENVIRONMENT, SIGNIFICANT IMPACTS, AND MITIGATION MEASURESVISION 2040 is implemented through PSRC’s policy and plan review of each county and city comprehensive planand their amendment. PSRC also certifies transportation elements, as well as the regional TIP, and evaluatingperformance measures.Transportation 2040 supports VISION 2040 planning for a transportation system supporting the growth strategy.Transportation 2040 is built around three key strategies, as stated in the plan’s executive summary:• Congestion and Mobility. The plan improves mobility through a combination of effective land use planning,demand management, efficiency enhancements, and strategic capacity investments. To improve systemefficiency, the plan creates “smart corridors” with advanced technology, better information for travelers, andadvanced tolling approaches which adjust for actual traffic conditions. Capacity improvements strategicallyexpand roadway, transit, and non-motorized facilities, with new roadways limited to key missing links andenhancing existing facilities. This plan includes additional attention to monitoring system performance.• Environment. A key focus of the plan is to protect and improve the region’s environmental health. Thisincludes ensuring that the region has healthy air that meets all standards, ensuring that transportationprojects improve the handling of stormwater runoff to protect Puget Sound and other surface waters, andaddressing emerging issues such as transportation’s role in reducing GHG emissions and adapting to climatechange. The plan includes a specific strategy to address state GHG goals and VMT reduction benchmarks. Thefour-part strategy includes Land Use, Transportation Pricing, Transportation Choices, and Technology. Inaddition, the plan builds on current efforts to protect natural areas and support vibrant, livable communities.• Funding. The Transportation 2040 financial strategy relies on traditional funding sources in the early years ofthe plan. Over time the region will transition to a new funding structure based on user fees, which couldinclude high-occupancy toll lanes, facility and bridge tolls, highway system tolls, VMT charges, and otherpricing approaches that replace the gas tax and further fund and manage the transportation system. Fundingstrategies need to include a nexus between the tax, fee, or toll and the use of the revenues.Kitsap CPPThe GMA requires that counties adopt CPPs express a regional vision, provide a common framework to developcomprehensive plans, and to help measure consistency of local plans (RCW 36.70A.210). GMA also specifiessubjects that must be addressed, including policies for urban and rural uses.On August 10, 1992, the Kitsap County BOCC adopted the Kitsap County CPPs. Seven agencies participated indevelopment of the CPPs through the KRCC including representatives of Kitsap County, the cities of BainbridgeIsland, Port Orchard, Bremerton, and Poulsbo, the Port Gamble/S’Klallam Tribe, and the Suquamish Tribe. TheCPPs have been amended several times since notably in November 2004 (established population distributions),and most recently in November 2011. The CPPs include policies that address the following topics.• Countywide Growth Pattern. Establishes the countywide vision which includes livable urban communities andneighborhoods, centers for employment, civic activities and housing; a vital diversified economy; efficientmulti-modal transportation system; natural systems protection; maintaining the character of rural areas; andresponsive government.oThe role of cities in achieving the countywide growth pattern is to:• The primary role of Kitsap’s urban communities is to encourage growth, through new development,re-development and in-fill. Population growth should be directed to Cities, UGAs and centers with atransportation system that connects people with jobs and housing.• Each of Kitsap’s urban communities should foster its unique vision as a high quality place to live andwork, through urban design, historic preservation, and arts that improve the natural and humanmadeenvironments; promote healthy lifestyles; contribute to a prosperous economy; and, increasethe region’s resiliency in adapting to changes or adverse events.<strong>Draft</strong> | June 2013 3-243
GORST PLANNED ACTION EIS | AFFECTED ENVIRONMENT, SIGNIFICANT IMPACTS, AND MITIGATION MEASURES• In Kitsap, urban communities are closely linked to water and natural amenities and provide openspace links to the natural environment.oThe role of Kitsap County in the countywide growth pattern is to:• Keep regional vision in mind when making local decisions.• Promote stewardship of unincorporated urban areas and promote annexation into cities orincorporation.• Maintain/enhance natural systems and rural character.• Include a variety of low density rural communities, densities, and uses.• UGAs. Includes the outline of the land capacity analysis program, which serves as the basis for UGA expansion,establishes policies on population increments, and establishes process and criteria for expanding and adjustingUGAs. These criteria include:oooooooooUGAs are areas “within which urban growth shall be encouraged”Unincorporated UGAs shall be associated with an existing or future city.All UGAs shall be reflected in County and respective city comprehensive plans.Sufficient area must be included in the UGAs to accommodate the adopted 20-year populationdistribution as adopted by the KRCC and consistent with OFM projections.A jurisdiction may focus public and/or private investment where growth is desired and can phase utilities.Any jurisdiction seeking to expand its UGA shall achieve densities consistent with the GMA and the City ofBremerton’s adopted Comprehensive Plan and any interlocal agreement between the City of Bremertonand the County.If an adopted or proposed 20-year projected population distribution requires expansion of its UGA, therespective jurisdiction shall conduct planning and analysis, including a land capacity analysis, assessmentof present zoning; consideration of reasonable measures; and ability to provide services.A jurisdiction, as part of its Comprehensive Plan amendment or sub-area plan process that proposes anexpansion of the UGA, shall prepare or update a comparison of potential areas for expansion.Early and continuous public involvement must be carried out when establishing, expanding, or adjustingUGAs.• Centers for Growth. Identifies a hierarchy of areas of the county within which population and employmentshould be concentrated consistent with VISION 2040.• Rural Land Uses and Development Patterns. Seeks to preserve and enhance the rural character of areasoutside of the UGAs, by protecting the natural environment, open space and recreation, scenic and historicareas, and supporting small scale farming, low density residential living and cluster development at anappropriate scale, and with appropriate rural levels of service.• Countywide Strategies for Open Space Preservation, Resource Protection and Critical Areas, Air Quality, andWater Quality/Quantity. Defines these areas and establishes the importance of maintaining, protecting andenhancing these areas.<strong>Draft</strong> | June 2013 3-244
GORST PLANNED ACTION EIS | AFFECTED ENVIRONMENT, SIGNIFICANT IMPACTS, AND MITIGATION MEASURES• Contiguous, Compatible, and Orderly Development. Provides policies for cooperative inter-jurisdictionalplanning, and coordination of land use, transportation, environmental and infrastructure planning. Promotesfiscal equity such as revenue sharing due to changes in municipal boundaries. Provides policies on communitydesign and development that promote the unique character of a community, encourage healthy lifestyles, andsupport sustainable economic and environmental development techniques.• Siting Public Capital Facilities. Establishes a process for the siting of regional facilities, which would mitigatethe potential adverse impacts from the location and development of these facilities.• Transportation. Seeks to promote a transportation system, which would serve the designated centers,preserve the natural environment and provide for a balanced system for the efficient and safe movement ofpeople, goods and services among the centers of Kitsap County and the larger Puget Sound Region. Promotesmeasures to reduce single occupancy vehicles, and complete streets for all modes.• Housing. Establishes a framework for the provision of housing with in Kitsap County to all income levels at avariety of housing densities. Promotes a jobs/housing balance.• Countywide Economic Development. Encourages coordinated economic growth among all jurisdictions inKitsap County, a healthy economy with a spectrum of jobs, and diversification. Seeks to add predictability andcertainty to private development decisions.• Analysis of the Fiscal <strong>Impact</strong>. Identifies opportunities for jurisdictions to plan for infrastructure and servicessuch as through comprehensive plans, CFP, at the time of UGA expansions, and UGA ManagementAgreements. Special districts should be involved in the planning for UGAs.• Coordination with Tribal Governments and the Federal Government. Seeks to involve and inform thesegovernments in regional and local planning efforts in the county.• Coordination with Federal Government including Navy. Promotes coordination with the federal governmenton land use and other activities.• Roles and Responsibilities. Establishes the roles and Responsibilities for the various governments andagencies within the county including the KRCC, Kitsap County, the Cities, and Special Districts.The CPPs contain appendices with population allocations, described earlier in this section, and UGA managementagreements (UGAMAs). UGAMAs are intended to facilitate and encourage annexation and/or incorporation ofurban areas over the 20 year planning period and to ensure compatibility of development within theunincorporated UGA.UGAMAs are intended to:• Describe the goals and procedures of the joint planning process including roles and responsibilities for theunincorporated UGA, with the goal of having compatible City of Bremerton and County plans.• Identify responsibility and mechanisms for comprehensive plan amendments, zoning changes anddevelopment applications within unincorporated UGAs. Significant weight should be given to City ofBremerton preferences.• Identify services to be provided in the UGA, the responsible service purveyors, and the terms under which theservices shall be provided. All service providers, including special districts, and adjacent jurisdictions should beincluded in UGA planning.• Develop pre-annexation plans, which shall include:oConditioning City of Bremerton service extensions upon actual annexation for properties contiguous tothe City of Bremerton boundary or to agreements of no protest to future annexation for properties notcontiguous.<strong>Draft</strong> | June 2013 3-245
GORST PLANNED ACTION EIS | AFFECTED ENVIRONMENT, SIGNIFICANT IMPACTS, AND MITIGATION MEASURESoooOffering pre-annexation agreements to property owners interested in annexation and needing assurancesfrom the City of Bremerton about services, planning, or other issues.Plans for tiering and/or phasing of infrastructure development, appropriate to the individual UGA.City of Bremerton priorities for City of Bremerton-led annexation efforts as appropriate.• Describe the development and implementation of a public involvement program that identifies roles andresponsibilities for respective jurisdictions, including actions and timeline.• Be reflected in County and City of Bremerton Comprehensive plans.UGAMAs elsewhere in the county are to reflect revenue sharing agreements, but this does not apply to the Citiesof Bremerton and Port Orchard, which does not participate in that agreement.Kitsap County Comprehensive PlanThe Kitsap County Comprehensive Plan provides policies and goals primarily for the unincorporated portions of thecounty. The Comprehensive Plan is intended to comply with the GMA and other state laws that require localgovernments to plan comprehensively, as well as comply with the CPPs. It was adopted in 2006 and amended in2012 to comply with a remand of the Growth Management Hearings Board.The Plan itself contains several chapters or elements, including those required by the GMA as well as a number ofsubarea plans addressing particular UGAs or rural communities. Highlights of the County’s vision are listed below.• County Government. County government that is accountable and accessible; encourages citizen participation;seeks to operate as efficiently as possible; and works with citizens, governmental entities and tribalgovernments to meet collective needs fairly while respecting individual and property rights.• Natural Environment. Natural ecosystems—including inter-connected wetlands, streams, wildlife habitat, andwater quality—that are rehabilitated, protected and enhanced and that allow for flexible and innovativedevelopment to meet environmental and growth goals. In developed areas, the growth pattern supportsconservation of non-renewable energy and minimizes impacts on air quality and climate.• Housing. Residential communities that are attractive, affordable, diverse, and livable supported byappropriate urban or rural services. A variety of housing choices are available, meeting a full range of residentincome levels and preferences. Residents are able to walk between neighborhoods and to communitydestinations.• Open Space. An open space network—including greenbelts, wildlife habitat, forested areas, and active andpassive parks—that is accessible, inter-connected, provides opportunities for recreation and defines anddistinguishes urban and rural areas.• Urban Areas. Healthy urban areas that are the region's centers for diverse employment and housingopportunities, all levels of education, and civic and cultural activities.• Rural Areas. Rural areas and communities where unique historical characters, appearances, functions, andpioneering spirits are retained and enhanced. Natural resource activities, such as forestry, agriculture, andmining continue to contribute to the rural character and economy. Rural recreation opportunities areenhanced, including equestrian facilities, trails, and others.• Cultural Resources. Historical and archaeological resources that are recognized and preserved for futuregenerations.• Economic Development. A stable, prosperous and diversified economy that provides living wage jobs forresidents, supported by adequate land for a range of employment uses and that encourages accomplishmentof local economic development goals.<strong>Draft</strong> | June 2013 3-246
GORST PLANNED ACTION EIS | AFFECTED ENVIRONMENT, SIGNIFICANT IMPACTS, AND MITIGATION MEASURES• Public Services and Facilities. Public services and facilities—including, but not limited to, parks and recreation,law enforcement, fire protection, emergency preparedness, water/sewer, roads, transit, non-motorizedfacilities, ferries, stormwater management, education, library services, health and human services, energy,telecommunications, etc.—are provided in an efficient, high-quality and timely manner by the County and itspartner agencies. Public services and facilities are monitored, maintained and enhanced to meet qualityservice standards.• Transportation. An efficient, flexible, and coordinated multi-modal transportation system—including roads,bridges and highways, ferries, transit, and non-motorized travel—that provides interconnectivity and mobilityfor county residents and supports our urban and rural land use pattern.Relevant to the <strong>Gorst</strong> Creek Watershed Framework & Characterization Planning efforts, Kitsap County a policysupporting coordinated cross-jurisdictional watershed and habitat protection efforts:Policy NS-52 Work with other government jurisdictions to coordinate watershedmanagement and habitat protection efforts for watersheds and corridors that cross jurisdictionalboundaries.The County’s land use element describes <strong>Gorst</strong> as follows:The <strong>Gorst</strong> UGA is located at the western end of Sinclair Inlet at the junction of State Route (SR) 16with SR 3. The UGA includes approximately 281 gross acres. The <strong>Gorst</strong> UGA is a relatively smallhighway-oriented commercial and industrial center. It was associated with the City of Bremertonin 2008. Due to significant public health concerns regarding failing septic systems in the area, theCity of Bremerton has invested resources to address this issue.Concurrently, the City and County should pursue a UGAMA [Urban Growth Area ManagementAgreement] for this area, which should include the aspects included in policies LU-26 through LU-30. 6The referenced land use policies regarding County-City of Bremerton coordination of UGAMA are listed below:Policy LU-32 address the issues related to the association of unincorporated UGAs with theircorresponding incorporated cities, consistent with CPP. The following unincorporated UGAs arecurrently associated: Poulsbo (City of Poulsbo), East Bremerton (City of Bremerton), WestBremerton (City of Bremerton), <strong>Gorst</strong> UGA (City of Bremerton), SKIA UGA (City of Bremerton),ULID #6/McCormick UGA (City of Port Orchard) and South Kitsap/Port Orchard (City of PortOrchard).Policy LU-33 establish a planning process, concurrent with the determination of UGA association,within each unincorporated UGA that abuts an incorporated area, with the goal of improvingconsistency between city and county plans, zoning and development regulations, as well asproviding efficient delivery of urban services. The goals and procedures of the process should bedescribed in an UGAMA between the county and the city associated with the UGA.Policy LU- 34 includes the following components in each UGAMA:• Specification that the city’s zoning code; densities; development, subdivision,environmental and construction standards; and levels of service shall apply to the entireUGA unless mutually agreed otherwise by the city and the County.6 It appears that in the Remand effort some policies were amended but cross references were not updated. Thelisted policies appear to be the ones intended though numbered differently.<strong>Draft</strong> | June 2013 3-247
GORST PLANNED ACTION EIS | AFFECTED ENVIRONMENT, SIGNIFICANT IMPACTS, AND MITIGATION MEASURES• Confirmation that the city’s comprehensive plan should reflect land use and capitalfacility planning for the entire UGA. This should include agreement regarding theoperation and maintenance of County-owned public facilities such as parks and othercommunity buildings.• Identification of the responsibility and mechanisms for comprehensive planamendments, zoning changes and development applications within the UGA.• Identification of the services to be provided, the service provider and the terms ofservices. All service providers should be included in UGA planning.• Provisions on revenue sharing.• Description of the city’s pre-annexation planning to ensure logical and coordinatedboundaries which shall include: conditioning city service extensions upon annexation forproperties contiguous to the city boundary; agreements of no protest to futureannexation for properties that are not contiguous; offering pre-annexation agreementsto property owners interested in annexation and needing assurances for the city aboutservices, planning or other issues; and other mechanisms.• Other issues as appropriate for specific UGAMAs.County policies also support potential population reallocation that may be appropriate for <strong>Gorst</strong>:Policy LU-14, Reallocate and resolve any significant population growth target not accommodatedby a UGA boundary or zoning within the UGA, when a UGA is in close proximity to anincorporated jurisdiction and logical upzoning or UGA expansions are not available…City of Bremerton Comprehensive PlanThe City of Bremerton adopted its first Comprehensive Plan under GMA in April 1995. The City of Bremertonadopted a major update to the Plan in December 2004, and its most recent plan is dated 2010. The City ofBremerton’s Comprehensive Plan contains Land Use, Transportation, Housing, Utilities, Economic Development,Capital Facilities, Environment, and Community Character elements.The City of Bremerton’s plan is based on a concept of neighborhood, district, and regional “centers” – areas ofconcentrated and planned mixed-use development areas, serving various roles to meet needs of communities andwell-connected to each other by various transportation modes. The City of Bremerton recognizes the uniquecharacter of each center by creating subarea plans with goals, policies, and regulations unique to eachneighborhood. For example, the City of Bremerton adopted a subarea plan for SKIA recognizing it as a regionalmanufacturing industrial center.The City of Bremerton has identified its future associated UGAs as including Central Kitsap, East Bremerton, WestBremerton, and <strong>Gorst</strong>. The City of Bremerton’s plan introduction notes the following about <strong>Gorst</strong>:“At <strong>Gorst</strong>, where two State highways meet, Port Orchard is behind the traveler and the focus isahead to Bremerton. <strong>Gorst</strong> is the real entry to Bremerton.”The City of Bremerton’s future land use map for <strong>Gorst</strong> reflects the Kitsap County designations described in Section3.7 Land Use Patterns of this <strong>Draft</strong> EIS. However, the City of Bremerton has pre-designated the <strong>Gorst</strong> UGA withzones that are the closest match to the Kitsap County zones.Some relevant policies for the present planning efforts include:LU20B “Associated” UGAs. Promote the association with Bremerton of those UGAs that can bemost efficiently served by Bremerton as the primary provider of urban services.<strong>Draft</strong> | June 2013 3-248
GORST PLANNED ACTION EIS | AFFECTED ENVIRONMENT, SIGNIFICANT IMPACTS, AND MITIGATION MEASURESLU20C. UGA-Wide Growth Strategy. Apply the adopted City-wide growth strategy consistently toall of the City UGAs as a basis for more localized planning.LU3B Pre-qualify key areas and sites for environmental permitting through such devises as subareaplans and related programmatic EIS’s.Though the plan focuses on the urban centers in the community, the plan also addresses CUL that make up a largeamount of the watershed as an area of protection, recreation, and limited development:Cleanup Levels:General development parametersThe City’s management objectives for these lands shall be resource-related and structured toprotect the watersheds and timberlands. These lands are vital to protect water quality andquantity in Bremerton, ensure a healthy forest cover, dispose of biosolids created fromwastewater treatment, protect fish (including salmon), and provide essential habitat for wildlife.While resource management is the primary objective, there are some commercial activities thatare allowed on utility lands such as the location of antenna sites.Policy direction:Maintain the primary character of this land as resource-related. All development should belimited, and demonstrate no significant environmental impact.Discussion: While the primary use of this land shall continue to be used for the protection ofnatural resources, there will continue to be a limited amount of commercial and recreationdevelopment within the lands designated as “utility.” Wherever possible, colocation should beutilized for commercial structures such as antennas. Minimal footprints shall be required. Anyfuture development that associates with current adjacent recreational uses (such as the GoldMountain Golf Course or Jarstad Park) should be limited to that portion of the designation southof Old Belfair Highway and adjacent to existing similar development. Moreover, any developmentwithin this fairly pristine environment shall conform to shoreline and critical lands ordinances andbe designed in an environmentally sensitive way. All developments should go through rigorousenvironmental review. Where development can be allowed should conform to therecommendations made by other regional watershed planning efforts such as the ChicoWatershed Alternative Futures Project.Shoreline Master Programs and Critical AreasShorelines subject to the Shoreline Management Act of 1971 include the marine waters of Puget Sound as well asrivers and streams with a mean annual flow over 20 cubic feet per second (cfs). Shorelines include uplands within200 feet of the ordinary high water mark and associated wetlands, and floodways. In the study area, the SinclairInlet marine shoreline and <strong>Gorst</strong> Creek are subject to the Shoreline Management Act (RCW 90.58).Consistent with the Shoreline Management Act, both the County and City of Bremerton have adopted ShorelineMaster Programs for lower <strong>Gorst</strong> Creek and the Sinclair Inlet, and are awaiting Ecology approval.City of Bremerton proposed shoreline designations include• Urban Conservancy in the inner marine shoreline along the water• Commercial or Isolated in the outer marine shoreline area in largely developed areas• Aquatic Conservancy applied to the Marine waters (not mapped below)• Single Family, Recreation, and Urban Conservancy along <strong>Gorst</strong> Creek<strong>Draft</strong> | June 2013 3-249
GORST PLANNED ACTION EIS | AFFECTED ENVIRONMENT, SIGNIFICANT IMPACTS, AND MITIGATION MEASURESKitsap County proposes a similar shoreline environment approach as the City of Bremerton, except that the fullmarine shoreline north of the SR 3 and SR 16 interchange is shown as High Intensity. South of the interchange, themarine shoreline would be classified as Urban Conservancy in the inner jurisdiction along the water and HighIntensity in the outer jurisdictional area. <strong>Gorst</strong> Creek would be classified as High Intensity and Urban Conservancy.Figure 3.14-1 <strong>Gorst</strong>: Comparison of Shoreline Designations compares the two sets of shoreline environments.Kitsap County’s shoreline regulations would apply until such time as the <strong>Gorst</strong> UGA is annexed. The City ofBremerton’s shoreline buffer standards for the Sinclair inlet are greater than the County’s, and the County’s bufferstandards for <strong>Gorst</strong> Creek are greater than the City of Bremerton’s. See Table 3.14-3 Bremerton and Kitsap CountyShoreline, Stream, and Wetland Buffer Comparison.Table 3.14-3Bremerton and Kitsap County Shoreline, Stream, and Wetland Buffer ComparisonStandard Reduced SetbackStandard Reduced SetbackCity of Bremerton Buffer (ft) Buffer (ft) (ft) Kitsap County Buffer (ft) Buffer (ft) (ft)Bremerton Shorelines: ProposedKitsap County Shorelines: ProposedFreshwaterFreshwaterCommercial 50 15Can reduce20-30% ofAdmnistrativeif lot depthSF Residentiallot depth 5-15Streams 200 Reductionsis less thanRecreation 100 15with Criteria150 ft.Urban Conservancy 175 15or Variance.15MarineMarineIsolated 0 15Same asCommercial 50 15 High Intensity 50 Variance 15FreshwaterUrban Conservancy 175 15 Urban Conservancy 100 85 15Bremerton Critical Areas Regulations: ExistingKitsap County Critical Areas Regulations: ExistingStreamsF 150 15 F 150 25-50% with a 15Allowed ifNp 50 15 Np 50 habitat mgmt 15enhanced.Ns 35 15 Ns 50 plan. 15WetlandsCategory I 200 0 Category I 200 Averaging or 15Category II 100 0 Category II 100 admin 15AveragingCategory III 75 0 Category III 50 reduction with 15Category IV 50 0 Category IV 30 criteria. 15Note: With the City proposed Shoreline Master Program, when there are parallel shoreline designations, the buffer ismeasured from the ordinary high water mark to the width of the buffer requirement or the edge of the environmentdesignation, whichever is less.Source: BMC and City of Bremerton Council Review <strong>Draft</strong> Shoreline Master Program; KCC and Kitsap County PlanningCommission Review <strong>Draft</strong> Shoreline Master Program; BERK 2012.<strong>Draft</strong> | June 2013 3-250
FIGURE 3.14-1 GORST: COMPARISON OF SHORELINE MASTER PROGRAM DESIGNATIONSCity of Bremerton Shoreline DesignationsCommercialIsolatedHeins CreekRecreationSingle Family ResidentialUrban Conservancy<strong>Gorst</strong> UGA<strong>Gorst</strong> CreekParish CreekCity of BremertonAnderson CreekKitsap County Shoreline DesignationsHigh IntensityHeins CreekUrban Conservancy<strong>Gorst</strong> UGA<strong>Gorst</strong> CreekParish CreekCity of BremertonAnderson CreekUGA BoundaryCity LimitsWaterStreamsDate: March 2013Source: Department of Natural Resources, City of Bremerton, Kitsap County, BERK0 0.25 0.5Miles
THIS PAGE INTENTIONALLY BLANK
GORST PLANNED ACTION EIS | AFFECTED ENVIRONMENT, SIGNIFICANT IMPACTS, AND MITIGATION MEASURESAccording to the GMA, "critical areas" include the following areas and ecosystems:A. WetlandsB. Areas with a critical recharging effect on aquifers used for potable waterC. Fish and wildlife habitat conservation areasD. Frequently flooded areasE. Geologically hazardous areas.(RCW 306.70A.030) Counties and cities must regulate and protect these critical areas. Both the County and City ofBremerton have adopted critical area regulations (see Section 3.4 Plants and Animals). The study area includes allof these critical areas. The City of Bremerton and County buffers are similar for smaller streams (less than 20 cfs)and wetlands. See Table 3.14-3 Bremerton and Kitsap County Shoreline, Stream, and Wetland Buffer Comparison.City of Port OrchardThe City of Port Orchard boundaries in the watershed reflect the McCormick Woods master planned communitydeveloped based on a development agreement with Kitsap County. The <strong>Gorst</strong> Creek Watershed Framework &Characterization Planning efforts are not going to influence this already approved and annexed development.Therefore, the City of Port Orchard plans are not further considered in this policy analysis.The Suquamish TribeThe Suquamish Tribe has control over developments that occurs on their reservation lands and are responsible fordeveloping plans to guide that growth. The Suquamish Tribe has usual and accustom fishing and hunting areasthroughout the county including <strong>Gorst</strong>. Together with Washington State, the Suquamish Tribe co-manages ahatchery on <strong>Gorst</strong> Creek and takes an active role in managing the natural resources within the watershed.<strong>Impact</strong>sIMPACTS COMMON TO ALL ALTERNATIVESAll alternatives would maintain adopted land use plans in the watershed, which maintains consistency with currentKitsap County and City of Bremerton plans. All alternatives also maintain present UGA boundaries, allowing forconsistency with GMA provisions regarding UGA sizing. Last each alternative has been developed and reviewedduring public outreach opportunities as identified in Section 2 Alternatives. Comparisons of alternatives’consistency with state, regional, and local plans follows.GMA Planning GoalsAll alternatives meet GMA goals for economic and housing growth in urban areas, supported by transportation andpublic facility improvements. All would apply shoreline and critical area regulations. Alternatives 2 and 3 wouldfurther meet the intent of GMA goals for open space and environmental protection. See Table 3.14-4 GMA GoalConsistency 4.<strong>Draft</strong> | June 2013 3-253
GORST PLANNED ACTION EIS | AFFECTED ENVIRONMENT, SIGNIFICANT IMPACTS, AND MITIGATION MEASURESGMA Goal1) Urban growth. Encourage development in urban areaswhere adequate public facilities and services exist orcan be provided in an efficient manner.2) Reduce sprawl. Reduce the inappropriate conversionof undeveloped land into sprawling, low-densitydevelopment.3) Transportation. Encourage efficient multimodaltransportation systems that are based on regionalpriorities and coordinated with county and City ofBremerton comprehensive plans.4) Housing. Encourage the availability of affordablehousing to all economic segments of the population ofthis state, promote a variety of residential densitiesand housing types, and encourage preservation ofexisting housing stock.5) Economic development. Encourage economicdevelopment throughout the state that is consistentwith adopted comprehensive plans, promoteeconomic opportunity for all citizens of this state,especially for unemployed and for disadvantagedpersons, promote the retention and expansion ofexisting businesses and recruitment of newbusinesses, recognize regional differences impactingeconomic development opportunities, and encouragegrowth in areas experiencing insufficient economicgrowth, all within the capacities of the state's naturalresources, public services, and public facilities.6) Property rights. Private property shall not be taken forpublic use without just compensation having beenmade. The property rights of landowners shall beprotected from arbitrary and discriminatory actions.7) Permits. Applications for both state and localgovernment permits should be processed in a timelyand fair manner to ensure predictability.Table 3.14-4GMA Goal ConsistencyDiscussionAll alternatives encourage development in urban areas,particularly the <strong>Gorst</strong> UGA, where added commercial andresidential growth is anticipated. Public facilities and services willbe provided consistent with analysis in Section 3.12 PublicServices of this <strong>Draft</strong> EIS. The recent installation of sewers willmake urban growth more possible. No changes are proposed tothe SKIA UGA which was the subject of its own plan in 2012.Under all alternatives, densities in the rural area will remain atone units per five 10a acres, a rural density that avoids sprawl.The Watershed Characterization & Framework Plan proposedunder Alternatives 2 and 3 will help the County and cities makeinformed choices about the best locations for development andavoid inappropriate conversion of land.Through proposed subarea plan policies, Alternatives 2 and 3promote added transit and non-motorized systems in <strong>Gorst</strong> (e.g.transit service at a park and ride). The mixed use pattern andlower commercial growth in Alternative 3 provides lesscongestion and may in the future provide more support to transituse. Alternative 2 does not worsen congestion beyond thatalready anticipated in Alternative 1 No <strong>Action</strong>.While all alternatives allow for housing, Alternatives 2 and 3provide significant new opportunities for housing on the minesite. Further, Alternative 3 would promote a horizontal or verticalmixed use pattern, and would provide a new live-work housingchoice.All alternatives support economic development in <strong>Gorst</strong>.Alternative 1 would promote highway-oriented commercial andsome industrial uses. Alternative 2 focuses on a well-designedcommercial corridor. Alternatives 1 and 2 would convert somepresent residential areas to more commercial uses, and assumethe highest employment growth levels. Alternative 3 provides formixed use economic opportunities with regional commercial usesas well as local serving commercial uses combined with mixeduses, such as in a horizontal format. With allowances for mixedresidential uses, the job growth under Alternative 3 would not beas high as Alternatives 1 and 2.Under all alternatives, all properties are given a reasonable use ofland, with at least a single family residence allowed. Incentivesare offered to achieve greater density and heights andenvironmental enhancement under Alternatives 2 and 3.All alternatives would ensure development applications areprocessed under rules that are transparent. Alternatives 2 and 3would implement a planned action for the <strong>Gorst</strong> UGA, whichwould streamline environmental review. Alternative 2 would havea planned action boundary west of the highways on Sinclair Inletwhile Alternative 3 would have a planned action boundaryincluding the whole <strong>Gorst</strong> UGA.<strong>Draft</strong> | June 2013 3-254
GORST PLANNED ACTION EIS | AFFECTED ENVIRONMENT, SIGNIFICANT IMPACTS, AND MITIGATION MEASURESGMA Goal8) Natural resource industries. Maintain and enhancenatural resource-based industries, includingproductive timber, agricultural, and fisheriesindustries. Encourage the conservation of productiveforest lands and productive agricultural lands, anddiscourage incompatible uses.9) Open space and recreation. Retain open space,enhance recreational opportunities, conserve fish andwildlife habitat, increase access to natural resourcelands and water, and develop parks and recreationfacilities.10) Environment. Protect the environment and enhancethe state's high quality of life, including air and waterquality, and the availability of water.11) Citizen participation and coordination. Encourage theinvolvement of citizens in the planning process andensure coordination between communities andjurisdictions to reconcile conflicts.12) Public facilities and services. Ensure that those publicfacilities and services necessary to supportdevelopment shall be adequate to serve thedevelopment at the time the development is availablefor occupancy and use without decreasing currentservice levels below locally established minimumstandards.13) Historic preservation. Identify and encourage thepreservation of lands, sites, and structures that havehistorical or archaeological significance.DiscussionAlternative 1 applies a mineral resources designation to thecurrent mine site. Alternatives 2 and 3 assume mineral extractionwill continue in the near term until the property owner completesmining and reclamation.All Alternatives presume CUL will be maintained for forest andhabitat management. Alternatives 2 and 3 would establish aWatershed Characterization & Framework Plan that identifies notonly CUL protection but also other areas important for protectionor restoration for fish and wildlife habitat. Alternatives 2 and 3highlight County-owned property that is to be set aside for openspace and recreation.All alternatives would implement shoreline and critical arearegulations. Alternatives 2 and 3 use a science-based andlandscape level approach to identifying areas of protection,restoration, and development with BMPs to protect waterprocesses and habitat.All alternatives are undergoing public review as part of thewatershed and subarea planning effort. Chapter 2 of this <strong>Draft</strong> EISdescribes the public participation efforts to dateAll alternatives increase the demand for public facilities andservices, particularly Alternatives 2 and 3 that add greaterpopulation. Alternative 1 would continue implementation of theKitsap County CFP. Alternatives 2 and 3 due to greater growth,would require mitigation measures to ensure adequate facilitiesand services. Alternatives 2 and 3 also assume transition to Citygovernance with City levels of service. See Section 3.13 Utilities,Waster, Wastewater, and Stormwater.All alternatives would be subject to Comprehensive Plan policiesand federal and state laws that promote the protection andpreservation of historic and cultural features. Alternatives 2 and 3would adopt the Watershed Characterization & Framework Planthat includes additional policies to protect cultural resources in<strong>Gorst</strong> (also analyzed in Section 3.10 Cultural Resources).GMA Comprehensive Plans and City of Bremerton and County Plan ConsistencyUnder Alternative 1, the watershed would be protected through standard natural environment policies of theCounty and City of Bremerton Comprehensive Plans. CUL use and zoning designations would continue the intentfor minimal land disturbance on CUL. Alternatives 2 and 3 would coordinate activities in the watershed among theCity of Bremerton and County and would further advance County and City of Bremerton goals and policies thatpromote coordinated habitat and watershed planning.For the <strong>Gorst</strong> UGA, Alternatives 2 and 3 propose adoption of a subarea plan, which is an optional element underGMA. Alternative 1 would continue the current approach of planning for <strong>Gorst</strong> as part of its standard elements.Alternative 1 (No <strong>Action</strong>) would continue current plans and regulations which are consistent with each other. Forexample, the City of Bremerton shows Kitsap County land use designations in its assigned UGAs and has predesignatedzones that most closely match County zones. <strong>Action</strong> Alternatives would be consistent with County andCity of Bremerton plans in that both the County and the City of Bremerton are anticipated to integrate theWatershed Characterization & Framework Plan and <strong>Gorst</strong> Subarea Plan into their Comprehensive Plans.<strong>Draft</strong> | June 2013 3-255
GORST PLANNED ACTION EIS | AFFECTED ENVIRONMENT, SIGNIFICANT IMPACTS, AND MITIGATION MEASURESAdditionally, <strong>Action</strong> Alternatives 2 and 3 would meet County land use policies that assign the <strong>Gorst</strong> UGA toBremerton and that promote joint planning with UGAMAs. <strong>Action</strong> Alternatives 2 and 3 would meet City ofBremerton policies that support subarea planning for different types of centers in the community; the subareaplanning concept allows the City of Bremerton to apply community specific land use and zoning designations.Alternatives 2 and 3 also promote as <strong>Gorst</strong> as the southern gateway to the City of Bremerton, a concept in the Cityof Bremerton’s Comprehensive Plan. Alternatives 2 and 3 also plan for capital improvements and services to meetcurrent and projected needs of the population, as well as governance transition to Bremerton.Urban Growth AreasAs noted above, all alternatives would meet GMA goals for compact growth in the current UGA boundaries. Byincreasing housing choices and densities on the mine site, Alternatives 2 and 3 would exhibit reasonable measuresto increase growth in current boundaries.Population and Employment EstimatesAlternatives 2 and 3 assume greater population allocations than found in the CPPs. Consistent with County policiesthat would allow for exchanges of population, a portion of the excess population in East and West Bremertoncould be reallocated to <strong>Gorst</strong>. However, growth allocation modifications may be possible in the upcoming 2014-2016 Comprehensive Plan Update cycle through a regional process with the KRCC.Job growth estimates can be locally determined since there is no formal jobs target, and studying 310 to 1,100jobs, including the “No <strong>Action</strong>” level of 742 jobs, appears appropriate.SEPAAll alternatives are undergoing review in this <strong>Draft</strong> EIS as part of the watershed and subarea planning effort. Asallowed in SEPA, Alternatives 2 and 3 would implement a planned action for the <strong>Gorst</strong> UGA, which wouldstreamline environmental review. Alternative 2 would have a planned action boundary west of the highways onSinclair Inlet while Alternative 3 would have a planned action boundary including the whole <strong>Gorst</strong> UGA. A draft ofthe planned action ordinance is found in Appendix B <strong>Draft</strong> <strong>Planned</strong> <strong>Action</strong> Ordinance. For more information on theplanned action process, please also see Section 2.5 Study Alternatives: <strong>Planned</strong> <strong>Action</strong>.VISION 2040 and Transportation 2040VISION 2040 Framework PoliciesUnder all alternatives, Bremerton would remain a Metropolitan city, and SKIA as a Manufacturing Industrial Centeras designated in VISION 2040. The consistency of the alternatives with VISION 2040’s overarching goals isdescribed below.• Environment: All alternatives would implement shoreline and critical area regulations. Alternatives 2 and 3use a science-based and landscape level approach to identifying areas of protection, restoration, anddevelopment with BMPs to protect water processes and habitat.• Development Patterns: All alternatives encourage development in urban areas, particularly the <strong>Gorst</strong> UGA,where added commercial and residential growth is anticipated. Public facilities and services will be providedconsistent with analysis in Section 3.12 Public Services of this <strong>Draft</strong> EIS. The recent installation of sewers willmake urban growth more possible. No changes are proposed to the SKIA UGA which was the subject of itsown plan in 2012. Under all alternatives, densities in the rural area will remain at one unit per five or 10 acres,a rural density that avoids sprawl. The Watershed Characterization & Framework Plan proposed underAlternatives 2 and 3 will help the County and cities make informed choices about the best locations fordevelopment and avoid inappropriate conversion of land.<strong>Draft</strong> | June 2013 3-256
GORST PLANNED ACTION EIS | AFFECTED ENVIRONMENT, SIGNIFICANT IMPACTS, AND MITIGATION MEASURES• Housing: While all alternatives allow for housing, Alternatives 2 and 3 provide significant new opportunitiesfor housing on the mine site. Further, Alternative 3 would promote a horizontal or vertical mixed use pattern,and would provide a new live-work housing choice.• Economy: All alternatives support economic development in <strong>Gorst</strong>. Alternative 1 would promote highwayorientedcommercial and some industrial uses. Alternative 2 focuses on a well-designed commercial corridor.Alternatives 1 and 2 would convert some present residential areas to more commercial uses, and assume thehighest employment growth levels. Alternative 3 provides for mixed use economic opportunities with regionalcommercial uses as well as local serving commercial uses combined with mixed uses, such as in a horizontalformat. With allowances for mixed residential uses, the job growth under Alternative 3 would not be as highas Alternatives 1 and 2.• Transportation: Through proposed subarea plan policies, Alternatives 2 and 3 promote added transit and nonmotorizedsystems in <strong>Gorst</strong> (e.g. transit service at a park and ride). The mixed use pattern and lowercommercial growth in Alternative 3 provides less congestion and may in the future provide more support totransit use. Alternative 2 does not worsen congestion beyond that already anticipated in Alternative 1 No<strong>Action</strong>.• Public Services: All alternatives increase the demand for public facilities and services, particularly Alternatives2 and 3 that add greater population. Alternative 1 would continue implementation of the Kitsap County CFP.Alternatives 2 and 3, due to greater growth, would require mitigation measures to ensure adequate facilitiesand services. Alternatives 2 and 3 also assume transition to City governance with City levels of service. SeeSection 3.12 Public Services.Transportation 2040A review of the alternatives programmatically in relation to the key principles of Transportation 2040 is providedbelow:• Congestion and Mobility. The mixed use pattern and lower commercial growth in Alternative 3 provides lesscongestion and may in the future provide more support to transit use. Alternative 2 does not worsencongestion beyond that already anticipated in Alternative 1 No <strong>Action</strong>. Alternatives 2 and 3 also promoteadded transit and non-motorized systems in <strong>Gorst</strong> (e.g. transit service at a park and ride).• Environment. All alternatives add VMT to the network; however, more compact growth and a greater share ofmixed use growth along with other GHG reduction measures addressed in Section 3.11 Transportation canhelp reduce VMT.• Funding. The No <strong>Action</strong> Alternative would retain the recent Kitsap County 2012 CFP that includes fundingprojections for transportation facilities under County responsibility. More specific capital improvements andfunding are identified for stormwater improvements, fish passage barrier removals, and transportationimprovements are proposed for <strong>Action</strong> Alternatives. The County and City of Bremerton will continue topartner with the PSRC on transportation planning and funding opportunities.<strong>Draft</strong> | June 2013 3-257
GORST PLANNED ACTION EIS | AFFECTED ENVIRONMENT, SIGNIFICANT IMPACTS, AND MITIGATION MEASURESKitsap County CPPAll alternatives would be consistent with CPPs by focusing growth in UGAs and offering employment and housingopportunities. Alternatives 2 and 3 would promote joint City-County planning for an assigned UGA consistent withCPPs. All facilities and services are addressed in this <strong>Draft</strong> EIS consistent with CPP guidance for joint planning andservice transition. See Table 3.14-5 Kitsap County CPP Evaluation.One area of inconsistency for Alternatives 2 and 3 includes population allocations; Alternatives 2 and 3 wouldsubstantially increase the capacity for population on the mine site compared to Alternative 1. Kitsap County andthe City of Bremerton could work with KRCC to reallocate population from undersized UGAs to <strong>Gorst</strong> to matchAlternatives 2 or 3 population levels. This could be accomplished prior to the County and City of Bremerton’s GMArequired 2016 Comprehensive Plan Update. Until that time, the mineral resources designation could remain whilethe mine is still in active operation, thus not allowing residential growth until population targets are reallocated.<strong>Draft</strong> | June 2013 3-258
GORST PLANNED ACTION EIS | AFFECTED ENVIRONMENT, SIGNIFICANT IMPACTS, AND MITIGATION MEASURESCPP Concept SummaryTable 3.14-5Kitsap County CPP EvaluationDiscussionCountywide Growth Pattern: Establishes the countywide vision which includes livable urbancommunities and neighborhoods, centers for employment, civic activities and housing; a vitaldiversified economy; efficient multi-modal transportation system; natural systems protection;maintaining the character of rural areas; and responsive government.The primary role of Kitsap’s urban communities is to encourage growth, through newdevelopment, re-development and in-fill. Population growth should be directed to Cities,UGAs and centers with a transportation system that connects people with jobs and housing.Each of Kitsap’s urban communities should foster its unique vision as a high quality place to liveand work, through urban design, historic preservation, and arts that improve the natural andhuman-made environments; promote healthy lifestyles; contribute to a prosperous economy;and, increase the region’s resiliency in adapting to changes or adverse events.In Kitsap, urban communities are closely linked to water and natural amenities and provideopen space links to the natural environment.The role of Kitsap County in the countywide growth pattern is to:Keep regional vision in mind when making local decisionsPromote stewardship of unincorporated urban areas and promote annexation into citiesor incorporationMaintain/enhance natural systems and rural characterInclude a variety of low density rural communities, densities, and usesUGAs. Includes the outline of the land capacity analysis program, which serves as the basis forUGA expansion, establishes policies on population increments, and establishes process andcriteria for expanding and adjusting UGAs. These criteria include:UGAs are areas within which urban growth shall be encouraged and outside of whichgrowth can occur only if it is not urban in nature per GMA.Unincorporated UGAs shall be associated with an existing or future city.All UGAs shall be reflected in County and respective city comprehensive plans.Sufficient area must be included in the UGAs to accommodate the adopted 20-yearpopulation distribution in the CPPs developed by the KRCC.A jurisdiction may define growth tiers within its UGA or phase utility development.The County, city, or interested citizens may initiate an amendment to an existing UGA.Any jurisdiction seeking to expand its UGA shall achieve densities consistent with the GMAand the City’s adopted Comprehensive Plan and any interlocal agreement between theAll alternative promote growth in compact urban patterns, with Alternatives 2 and 3improving the aesthetic qualities of growth through urban design concepts, andpromoting greater linkages to the Sinclair Inlet and <strong>Gorst</strong> Creek shorelines.The County continues to promote stewardship of the UGA until annexation orincorporation and is jointly planning with the City of Bremerton.See a discussion of environmental and rural policies elsewhere on this chart.All alternatives encourage development in urban areas, particularly the <strong>Gorst</strong> UGA,where added commercial and residential growth is anticipated. The recentinstallation of sewers will make urban growth more possible. No changes areproposed to the SKIA UGA which was the subject of its own plan in 2012.The <strong>Gorst</strong> UGA is currently associated with Bremerton for future annexation, and<strong>Action</strong> Alternatives will help plan for the transition of governance. <strong>Action</strong> Alternativesinclude capital facility and service plans and policies to support the land use patternsand growth.The land capacity analysis program has been applied to the alternatives for acomparison of growth projections.The County and City will reflect the <strong>Gorst</strong> planning efforts in their plans through theadoption of the Watershed Characterization & Framework Plan and <strong>Gorst</strong> SubareaPlan.All alternatives are undergoing public review as part of the watershed and subarea<strong>Draft</strong> | June 2013 3-259
GORST PLANNED ACTION EIS | AFFECTED ENVIRONMENT, SIGNIFICANT IMPACTS, AND MITIGATION MEASURESCity and the County.CPP Concept SummaryIf an adopted or proposed 20-year projected population distribution may requireexpansion of its UGA, the respective jurisdiction shall conduct planning and analysis,including a land capacity analysis, assessment of present zoning; consideration ofreasonable measures; and ability to provide services.A jurisdiction, as part of its Comprehensive Plan amendment or sub-area plan process thatproposes an expansion of the UGA, shall prepare or update a comparison of potentialareas for expansion.Conduct early and continuous public involvement when establishing, expanding, oradjusting UGAs.Centers for Growth. Identifies a hierarchy of areas of the county within which population andemployment should be concentrated consistent with VISION 2040.Rural Land Uses and Development Patterns. Seeks to preserve and enhance the ruralcharacter of areas outside of the UGAs, by protecting the natural environment, open spaceand recreation, scenic and historic areas, and supporting small scale farming, low densityresidential living and cluster development at an appropriate scale, and with appropriate rurallevels of service.Countywide Strategies for Open Space Preservation, Resource Protection and Critical Areas,Air Quality, and Water Quality/Quantity. Defines these areas and establishes the importanceof maintaining, protecting and enhancing these areas.Contiguous, Compatible, and Orderly Development. Provides policies for cooperative interjurisdictionalplanning, and coordination of land use, transportation, environmental andinfrastructure planning. Promotes fiscal equity such as revenue sharing due to changes inmunicipal boundaries. Provides policies on community design and development that promotethe unique character of a community, encourage healthy lifestyles, and support sustainableeconomic and environmental development techniques.Siting Public Capital Facilities. Establishes a process for the siting of regional facilities, whichwould mitigate the potential adverse impacts from the location and development of thesefacilities.Transportation. Seeks to promote a transportation system, which would serve the designatedcenters, preserve the natural environment and provide for a balanced system for the efficientand safe movement of people, goods and services among the centers of Kitsap County and thelarger Puget Sound Region. Promotes measures to reduce SOVs, and complete streets for allmodes.Discussionplanning effort. Chapter 2 of this <strong>Draft</strong> EIS describes the public participation efforts todateThe City of Bremerton has annexed SKIA and no change to center status isanticipated there, as is also the case with Downtown Bremerton.Under all alternatives, densities in the rural area will remain at one unit per five or10a acres, a rural density that avoids sprawl. The Watershed Characterization &Framework Plan proposed under Alternatives 2 and 3 will help the County and citiesmake informed choices about the best locations for development and avoidinappropriate conversion of land.All Alternatives presume CUL will be maintained for forest and habitat management.Alternatives 2 and 3 would establish a Watershed Characterization & Framework Planthat identifies not only CUL protection but also other areas important for protectionor restoration for fish and wildlife habitat. Alternatives 2 and 3 highlight Countyownedproperty that is to be set aside for open space and recreation.The County and City are jointly planning in the watershed and in the <strong>Gorst</strong> UGA, andintend to both adopt the associated plans.Essential public facilities are not proposed in <strong>Gorst</strong>. However, there are proposals tomitigate the effect of past facilities (e.g. landfill on <strong>Gorst</strong> Creek in watershed).The mixed use pattern and lower commercial growth in Alternative 3 provides lesscongestion and may in the future provide more support to transit use. Alternative 2does not worsen congestion beyond that already anticipated in Alternative 1 No<strong>Action</strong>. Alternatives 2 and 3 also promote added transit and non-motorized systemsin <strong>Gorst</strong> (e.g. transit service at a park and ride).<strong>Draft</strong> | June 2013 3-260
GORST PLANNED ACTION EIS | AFFECTED ENVIRONMENT, SIGNIFICANT IMPACTS, AND MITIGATION MEASURESCPP Concept SummaryHousing. Establishes a framework for the provision of housing with in Kitsap County to allincome levels at a variety of housing densities. Promotes a jobs/housing balance.Countywide Economic Development. Encourages coordinated economic growth among alljurisdictions in Kitsap County, a healthy economy with a spectrum of jobs, and diversification.Seeks to add predictability and certainty to private development decisions.Analysis of the Fiscal <strong>Impact</strong>. Identifies opportunities for jurisdictions to plan for infrastructureand services such as through comprehensive plans, CFP, at the time of UGA expansions, andUGA Management Agreements. Special districts should be involved in the planning for UGAs.Coordination with Tribal Governments and the Federal Government. Seeks to involve andinform these governments in regional and local planning efforts in the county.Coordination with Federal Government including Navy. Promotes coordination with thefederal government on land use and other activities.Roles and Responsibilities. Establishes the roles and Responsibilities for the variousgovernments and agencies within the county including the KRCC, Kitsap County, the Cities, andSpecial Districts.DiscussionWhile all alternatives allow for housing, Alternatives 2 and 3 provide significant newopportunities for housing on the mine site. Further, Alternative 3 would promote ahorizontal or vertical mixed use pattern, and would provide a new live-work housingchoice.All alternatives support economic development in <strong>Gorst</strong>. Alternative 1 wouldpromote highway-oriented commercial and some industrial uses. Alternative 2focuses on a well-designed commercial corridor. Alternatives 1 and 2 would convertsome present residential areas to more commercial uses, and assume the highestemployment growth levels. Alternative 3 provides for mixed use economicopportunities with regional commercial uses as well as local serving commercial usescombined with mixed uses, such as in a horizontal format. With allowances for mixedresidential uses, the job growth under Alternative 3 would not be as high asAlternatives 1 and 2.The City is conducting an annexation fiscal analysis. The Subarea Plan associated withAlternatives 2 and 3 incudes policies towards transition of governance as indicated inCPP policies regarding UGAMAs.The Suquamish Tribe has been a project partner and a member of the AdvisoryCommittee for the <strong>Gorst</strong> Creek Watershed Characterization & Framework Plan and<strong>Gorst</strong> Subarea Plan.The EPA is directing the grant under which the <strong>Gorst</strong> planning efforts are occurring.The Navy has attended project partner meetings. The City has notified federalagencies about this planning process as part of public outreach methods includingnotices and similar means.The County serves unincorporated Kitsap County and has assigned the <strong>Gorst</strong> UGA tothe City of Bremerton. The County and Cities are jointly planning consistent with theirroles.<strong>Draft</strong> | June 2013 3-261
GORST PLANNED ACTION EIS | AFFECTED ENVIRONMENT, SIGNIFICANT IMPACTS, AND MITIGATION MEASURESShoreline Master Programs and Critical AreasBoth the County and City have locally adopted new Shoreline Master Programs that require Ecology approval priorto their being effective. These pending Shoreline Master Programs differ with respect to shoreline buffers on <strong>Gorst</strong>Creek. Kitsap County’s proposed Shoreline Master Program and Critical Areas Regulations will apply in the <strong>Gorst</strong>UGA until such time as the area is annexed by the City when Bremerton’s proposed regulations will apply. The Cityof Bremerton’s shoreline buffer standards for the Sinclair inlet are greater than the County’s, and the County’sbuffer standards for <strong>Gorst</strong> Creek are greater than the City of Bremerton’s. Apart from these more prominentshorelines, the City of Bremerton and County regulate smaller streams and wetlands similarly.The adoption of the <strong>Gorst</strong> Subarea Plan is an opportunity to develop joint standards for stream and shorelineprotection. This is particularly important with the new analysis included in the watershed characterization and therecent list of steelhead (see Section 3.4 Plants and Animals). This <strong>Draft</strong> EIS Appendix D Shoreline Buffer Comparison& Options provides options for common shorelines standards along <strong>Gorst</strong> Creek to achieve some of the WatershedCharacterization Study BMPs. These options could be considered as the final Subarea Plan is developed around apreferred alternative.The Suquamish TribeThe study area includes the Suquamish Tribes usual and accustomed fishing and hunting areas, as well as the <strong>Gorst</strong>Creek Hatchery. There are also cultural resources important to the tribe in the <strong>Gorst</strong> UGA and elsewhere.Alternative 1, No <strong>Action</strong>, would continue current plans in the watershed. There would be less coordinationregarding areas of protection and restoration, such as removal of fish passage barriers.<strong>Action</strong> alternatives would implement a Watershed Characterization & Framework Plan that could better promotehabitat restoration and protection and remove fish passage barriers. The <strong>Gorst</strong> Subarea Plan would include policiesand plans also intended to operationalize BMPs of the watershed characterization.Mitigation MeasuresIncorporated Plan FeaturesThe Watershed Characterization & Framework Plan and <strong>Gorst</strong> Subarea Plan provide a common set of plans andpolicies to ensure consistent and coordinated planning between the City of Bremerton, Kitsap County, and theSuquamish Tribe.Applicable Regulations and Commitments• In order to ensure consistency with GMA requirements, the City of Bremerton and Kitsap County will submitthe <strong>Gorst</strong> plans to the Washington Department of Commerce or review and comment prior to adoption.• As a preferred plan is prepared, the City of Bremerton and County will prepare a land capacity analysis prior tolegislative adoption.Other Potential Mitigation Measures• The County and City of Bremerton could work with KRCC to reallocate population from undersized UGAs to<strong>Gorst</strong> to match Alternatives 2 or 3 population levels. This could be accomplished prior to the County and Cityof Bremerton’s GMA required 2016 Comprehensive Plan Update. Until that time, the mineral resourcesdesignation could remain while the mine is still in active operation, thus not allowing residential growth untilpopulation targets are reallocated.• The final Subarea Plan prepared for the preferred alternative could include coordinated shoreline and criticalarea standards. See <strong>Draft</strong> EIS Appendix D Shoreline Buffer Comparison & Options for a description of options.Significant Unavoidable Adverse <strong>Impact</strong>sWith implementation of mitigation measures, no significant unavoidable adverse impacts are anticipated withregards to future plan consistency under any of the alternatives.<strong>Draft</strong> | June 2013 3-262
4.0 REFERENCES4.1 Personal CommunicationNone.4.2 Printed ReferencesAmes, K.M. and H.D.G. Maschner 1999 Peoples of the Northwest Coast: Their Archaeology and Prehistory. Thamesand Hudson, London.Avey, M.1991Fluted Point Occurrences in Washington State. Manuscript on file at the Washington State DAHP,Olympia, Washington.Bash, J., C. Berman, and S. Bolton. 2001. Effects of Turbidity and Suspended Solids on Salmonids. Center forStreamside Studies, University of Washington, Seattle, WA.Blukis Onat, A.R., M.E. Morgenstein, P.D. LeTourneau, R.P. Stone, J. Kosta, and P. Johnson. 2001 ArchaeologicalInvestigations at stuwe’yuq – Site 45KI464, Tolt River, King County, WA. Report on file at the WashingtonState DAHP, Olympia, Washington.Bonnichsen, R. and K.L. Turnmire 1991Clovis: Origins and Adaptations. Peopling of the Americas Publications.Center for the Study of the First Americans, Oregon State University, Corvallis.BPA (Bonneville Power Administration). 2011. Transmission Projects. Olympic Peninsula Reinforcement Project.Available at: http://transmission.bpa.gov/PlanProj/Transmission_Projects/default.cfm?page=OPRP.Brobst, Thomas, M. 2012. Personal communication with Thomas Brobst, Municipal Liaison Manager at PugetSound Energy on March 27, 2012.Bruton, M.N. 1985. The effects of suspendoids on fish. Hydrobiologia, 125:221-241.Butler, V. and S. Campbell 2004 Resource Intensification and Resource Depression in the Pacific Northwest ofNorth America: A Zooarchaeological Review. Journal of World Prehistory 18 (4): 327-405.Caltrans (California Department of Transportation). 2009. Technical Noise Supplement. November.Cavanaugh, W. J. and G.C. Tocci. 1998. <strong>Environmental</strong> Noise. Published in E.S.C., USC Journal of Public Affairs, Vol.1 Num. 1., Los Angeles, California.Cereghino, P., J. Toft, S. Simensted, E. Iverson, S. Campbell, C. Behrens, and J. Burke. 2012. Strategies forNearshore Protection and Restoration in Puget Sound. Puget Sound Nearshore Report No. 2012-01.Published by Washington Department of Fish and Wildlife, Olympia, Washington, and the U.S. Army Corpsof Engineers, Seattle, Washington.City of Bremerton. 2009. <strong>Gorst</strong> Sewer Project Factsheet. (Available athttp://www.ci.bremerton.wa.us/forms/publicworks/Factsheet_<strong>Gorst</strong>Sewerage.pdf).City of Bremerton. 2009. <strong>Gorst</strong> Sewer Project Factsheet. (Available athttp://www.ci.bremerton.wa.us/forms/publicworks/Factsheet_<strong>Gorst</strong>Sewerage.pdf).City of Bremerton. 2010. City Services Element of the Comprehensive Plan. Bremerton, Washington.City of Bremerton. 2011. <strong>Gorst</strong> Creek Watershed Comprehensive Plan Existing Conditions Technical Memorandum.Prepared by Parametrix. Bremerton, Washington.City of Bremerton. 2011. <strong>Gorst</strong> Creek Watershed Inventory and Characterization Technical Memorandum.Prepared by Parametrix. Bremerton, Washington. August 4, 2011.<strong>Draft</strong> | June 2013 4-1
GORST PLANNED ACTION EIS | REFERENCESCity of Bremerton. 2012. <strong>Gorst</strong> Creek Watershed Characterization Report. Washington Department of Ecology andthe Washington Department of Fish and Wildlife in collaboration with Parametrix, Bellevue, Washington.May 2012.CNG (Cascade Natural Gas). 2012. Cascade Natural Gas Fact Sheet. Cascade Natural Gas, Kennewick, Washington.Available at: http://www.cngc.com/_docs/cngc_fact_sheet.pdf.CSES. 2007. Preparing for Climate Change: A Guidebook for Local, Regional, and State Governments. Center forScience in the Earth Systems (The Climate <strong>Impact</strong>s Group). September.Crocker, Malcom J. (Editor). 2007. Handbook of Noise and Vibration Control. John Willey and Sons, Hoboken, NewJersey.Collins, B.D. and A.J. Sheikh 2005 Historical Reconstruction, Classification and Change Analysis of Puget Sound TidalMarshes. Puget Sound River History Project, University of Washington, Seattle, WA.Cullinan, T. 2001 Important Bird Areas of Washington. Audubon Washington, Olympia, WA.Deur, D. 2005 Tending the Garden, Making the Soil: Northwest Gardens as Engineered Environments. In, Keeping itLiving: Traditions of Plant Use and Cultivation on the Northwest Coast of North America, ed. D. Deur andN. J. Turner. University of Washington Press, Seattle, WA.Desimone, S.M., and D.W. Hayes. 2003. Northern Goshawk. In E. Larsen, J. M. Azerrad, N. Nordstrom, editors.Management Recommendations for Washington’s Priority Species, <strong>Volume</strong> IV: Birds. WashingtonDepartment of Fish and Wildlife, Olympia, Washington.Ecology (Washington Department of Ecology). 2008. Integrated Report 4b Analysis for <strong>Gorst</strong> Creek. (Available athttp://www.ecy.wa.gov/programs/wq/303d/2008/4b<strong>Gorst</strong>.pdf).Ecology. 2008. State <strong>Environmental</strong> Policy Act (SEPA) Implementation Working Group: Report to the Climate <strong>Action</strong>Team. Appendix G. SEPA Mitigation Strategies for Climate Change <strong>Impact</strong>s. Washington State Departmentof Ecology.Ecology. 2010b. Washington State Greenhouse Gas Emissions Inventory 990-2008, Publication No. 10-02-046.Washington State Department of Ecology. December.Ecology. 2012. Washington State's Water Quality Assessment. EPA Approves WA 303(d) Impaired Waters List,December 21, 2012. (Available at http://www.ecy.wa.gov/programs/wq/303d/currentassessmt.html).Ecology and Environment, Inc. 2012. Final <strong>Draft</strong> Engineering Evaluation/Cost Analysis for Bremerton Auto WreckingLandfill – <strong>Gorst</strong> Creek Site. Prepared for U.S. <strong>Environmental</strong> Protection Agency, Region 10. Seattle,Washington.Ecology. 2013a. Guidance: SEPA and GHG Emissions. Washington State Department of Ecology.http://www.ecy.wa.gov/climatechange/sepa_actions.htm. Accessed April 11.Ecology. 2013b. Guidance for Ecology Including Greenhouse Gas Emissions in SEPA Reviews. Washington StateDepartment of Ecology.http://www.ecy.wa.gov/climatechange/docs/sepa/20110603_SEPA_GHGinternalguidance.pdf. AccessedApril 11.<strong>Environmental</strong> Data Resources Inc. 2013. <strong>Gorst</strong> UGA Land Use Highway 3 and Highway 16, Bremerton, WA 98312.Inquiry Number 03503302.1r. January 24, 2013. Milford, Connecticut.EPA (US <strong>Environmental</strong> Protection Agency). 1978. Noise: A Health Problem. Office of Noise Abatement andControl, Washington, DC. August 1978.<strong>Draft</strong> | June 2013 4-2
GORST PLANNED ACTION EIS | REFERENCESFalcone, E., J. Calambokidis, G. Steiger, M. Malleson, and J. Ford. 2005. Humpback Whales in the PugetSound/Georgia Strait Region. Proceedings of the 2005 Puget Sound Georgia Basin Research Conference.Seattle, Washington.Finlayson, D. 2006 The Geomorphology of Puget Sound Beaches, Technical Report 2006-02. Prepared in Support ofthe Puget Sound Nearshore Partnership. Washington Sea Grant Program, University of Washington,Seattle, WA.Flemming, K., P. Johnston, D. Zwarte, Y. Yokoyama, K. Lambeck, and J. Chappell 1998Refining the Eustatic Sea-LevelCurve since the Last Glacial Maximum using Far- and Intermediate-Field Sites. Earth and Planetary ScienceLetters 163: 327-342.Franklin, J.F., and C.T. Dyrness 1988 Natural Vegetation of Oregon and Washington. Oregon State University Press.Corvallis.Ford, J.K.B., G.M. Ellis, and K.C. Balcomb. 2000. Killer Whales: The Natural History and Genealogy of Orcinus orca inBritish Columbia and Washington State. 2nd Edition. University of British Columbia Press, Vancouver,British Columbia.FTA (Federal Transit Administration). 2006. Transit Noise and Vibration <strong>Impact</strong> Assessment Guidance FTA-VA-90-1003-06. April 1995 (or newer version when available).Geoarchaeology and Archaeostratigraphy: View from a Northwest Coast Shell Midden. In, Case Studies in<strong>Environmental</strong> Archaeology, by E. J. Reitz, C.M. Scarry, and S.J. Scudder. Springer Science + Business 2007Media, LLC, New York, NY.Goldstein, B. 1994 Drumlins of the Puget Lowland, Washington State, USA. In, Subglacial processes, Sediments, andLandforms, Vol. 91. Elsevier, Amsterdam.Greengo, R.E. and R. Houston 1970 Excavations at the Marymoor site (45KI9). University of Washington,Department of Anthropology. Seattle, Washington.Gregory, R.S. 1993. Effects of turbidity on predator avoidance behavior of juvenile Chinook salmon (Oncorhynchustshawytscha). Canadian Journal of Fisheries and Aquatic Sciences 50:241-246.Gunther, E. 003 Ethnobotany of Western Washington: The Knowledge and Use of Indigenous Plants by NativeAmericans. University of Washington Press, Seattle, WA.Haeberlin, H and E. Gunther 1930 The Indians of Puget Sound. University of Washington Press, Seattle, WA.Harbo, R.M. 2004 Whelks to Whales: Coastal Marine Life of Oregon, Washington, British Columbia, and Alaska.Harbour Publishing, Madeira Park, British Columbia, Canada.Haugerud, R.A. 2004Cascadia – Physiography. Geologic Investigations Series I-2689. U.S. Department of theInterior, U.S. Geological Survey.Hayes, G.E., and J.B. Buchanan. 2002. Washington State Status Report for the Peregrine Falcon. WashingtonDepartment of Fish and Wildlife. Olympia, Washington.Henderson, W.G., L. C. Anderson, and C. R. McGimsey, 2002 Distinguishing Natural and Archaeological Deposits:Stratigraphy, Taxonomy, and Taphonomy of Holocene Shell-Rich Accumulations from the LouisianaChenier Plain. Palaios: 17, pp. 192 – 204.Hill, Kristina, Erik Botsford, and Derek B. Booth. 2003. A Rapid Land Cover Classification Method for Use in UrbanWatershed Analysis. Water Resources Series Technical Report No. 173. March 2003.Hilbert, V., J. Miller, Z. Zahir 2001 Puget Sound Geography. Zahir Consulting Services, Federal Way, WA.<strong>Draft</strong> | June 2013 4-3
GORST PLANNED ACTION EIS | REFERENCESHomer, C., Dewitz, J., Fry, J., Coan, M., Hossain, N., Larson, C., Herold, N., McKerrow, A., VanDriel, J.N., andWickham, J. 2007. Completion of the 2001 National Land Cover Database for the Conterminous UnitedStates. Photogrammetric Engineering and Remote Sensing 73(4):337-341.Kidd, R. 1964 A Synthesis of Western Washington Prehistory from the Perspective of Three Occupation Sites.Unpublished Master’s Thesis. Department of Anthropology, University of Washington. Seattle,Washington.Kiers, R. and Blukis Onat, A. 2008 Results of Archaeological Survey and Testing for the Jim Creek Bridge # 41Replacement Project, Snohomish County, Washington. Report on file at DAHP, Olympia, Washington.Kitsap County. 2007. Kitsap County Washington Geologically Hazardous Areas. Kitsap County Department ofCommunity Development. Map Accessed Online athttp://www.kitsapgov.com/dcd/gis/maps/Standard_Maps/<strong>Environmental</strong>/Geohazards_June2007.pdf.Kitsap County 2011. 2011 Kitsap County Energy Efficiency and Conservation Plan.http://www.kitsapgreen.org/Kitsap%20County%20Energy%20Plan%20October%202011.pdf AccessedApril 9.King County. 2011. King County Greenhouse Gas Spreadsheet.http://www.kingcounty.gov/property/permits/info/SiteSpecific/ClimateChange.aspx#SEPA. AccessedApril 11.Kitsap County. 2011. Ordinance 476-2011 relating to Growth Management Amending Countywide Policies withattached amendments. Available at:http://www.kitsapregionalcouncil.org/countywide_planning.php.Kitsap County. 2011. Waste Wise Communities: The Future of Solid and Hazardous Waste Management in KitsapCounty. Kitsap County Department of Public Works, Solid Waste Division, Port Orchard, Washington.Available at: http://www.kitsapgov.com/sw/pdf/cswmp_final_draft.pdf.Kitsap County. 2012. 2012 Kitsap County Parks, Recreation, and Open Space Plan. Kitsap County Parks andRecreation Department, Port Orchard, Washington.Kitsap County. 2012. Kitsap County’s 2013-2025 Capital Facilities Plan. Port Orchard, Washington.Kitsap County 2013b. Kitsap County-Wide Travel Demand Model Daily Vehicle Miles of Travel (VMT).Krahn. M.M., P.R. Wade, S.T. Kalinowski, M.E. Dahlheim, B.L. Taylor, M.B. Hanson, G.M. Ylitalo, R.P. Angliss, J.E.Stein, and R.S. Waples. 2002. Status Review of Southern Resident Killer Whales (Orcinus orca) Under theEndangered Species Act. NOAA Technical Memorandum NMFS-NWFSC-54, U.S. Department ofCommerce, Seattle, Washington.Kirk, Ruth and Carmella Alexandra 1990 Exploring Washington’s Past. University of Washington Press, Seattle,Washington.Lance, M.M, S.A. Richardson, and H.L. Allen. 2004. State of Washington Sea Otter Recovery Plan. Olympia,Washington.Lewarch, D.E. and L.L. Larson 2003 Historic Context <strong>Statement</strong> Hunter-Fisher-Gatherer Resources, King CountyCultural Resource Protection Project. <strong>Draft</strong>. Submitted to the King County Department of Transportation,Seattle, Washington.Mass, C. 2008 The Weather of the Pacific Northwest. University of Washington Press, Seattle, WA.Matson, R.G. and G. Coupland 1995 The Prehistory of the Northwest Coast. Academic Press. San Diego, California.McMurphy, Carol J. 1980 Soil Survey of Kitsap County Area, Washington. U.S. Department of Agriculture.<strong>Draft</strong> | June 2013 4-4
GORST PLANNED ACTION EIS | REFERENCESMay, C.W., and G. Peterson. 2003. 2003 Kitsap Salmonid Refugia Report: Landscape Assessment and ConservationPrioritization of Freshwater and Nearshore Salmonid Habitat in Kitsap County. Prepared for Kitsap County.Port Orchard, Washington. October 31, 2003.Sceva, J.E. 1957. Geology and ground-water resources ofKitsap County, Washington.National Marine Fisheries Service. 2008. Recovery Plan for the Steller Sea Lion Eastern and Western DistinctPopulation Segments (Eumetopias jubatus), Revision. National Marine Fisheries Service, Silver Spring,Maryland.National Marine Fisheries Service. 2009. Proposed Endangered, Threatened, and Not Warranted Status for DistinctPopulation Segments of Rockfish in Puget Sound. Federal Register 74: 18516-18542.National Oceanic and Atmospheric Administration (NOAA) Fisheries. 2013. Northwest Regional Office, ProtectedSpecies. Available on-line at http://www.nwr.noaa.gov/.National Oceanic and Atmospheric Administration (NOAA) Fisheries Office of Protected Resources. 2013. SteelheadTrout (Oncorhyncus mykiss). Available on-line athttp://www.nmfs.noaa.gov/pr/species/fish/steelheadtrout.htm.National Park Service. 2011. Sinclair Inlet Development Concept Plan. Public Review <strong>Draft</strong>. Ashford, Washington.Nelson, C.M. 1990 Prehistory of the Puget Sound Region in Northwest Coast. In Handbook of North AmericanIndians, Vol. 7, edited by Wayne Suttles, pp. 481‐484. Smithsonian Institution, Washington D.C.OFM (Washington Office of Financial Management). 2012. Housing Units for Cities, Towns, and Counties, April 1,2010 to April 1, 2011. Available at: http://www.ofm.wa.gov/pop/april1/housing.pdfParametrix 2011. <strong>Gorst</strong> Creek Watershed Inventory and Characterization Technical Memorandum. Bremerton,Washington. August 4, 2011.Penttila, D.E. 2000 Critical Spawning Habitat for Herring, Surf Smelt, Sand Lance, and Rock Sole in Puget Sound,Washington. Washington Department of fish and Wildlife, Olympia, WA.Pojar, J. and A. Mackinnon 2004 Plants of the Pacific Northwest Coast: Washington, Oregon, British Columbia andAlaska. Lone Pine Publishing, Auburn, WA.Porter, S.C. and T.W. Swanson 1998 Radiocarbon Age Constraints on Rates of Advance and Retreat of the PugetLobe of the Cordilleran Ice Sheet during the Last Glaciation. Quaternary Research 50: 205-213.Puget Sound Clean Air Agency. 2004. Roadmap for Climate Protection: Reducing Greenhouse Gas Emissions inPuget Sound. Puget Sound Clean Air Agency. December.Puget Sound Clean Air Agency. 2012. 2010 Air Quality Data Summary. Seattle, Washington.Puget Sound Regional Council. 2007. Destination 2030 <strong>Environmental</strong> <strong>Impact</strong> <strong>Statement</strong> Addendum. Seattle, WA.Puget Sound Regional Council. March.Puget Sound Regional Council. 2013. 2013-2016 TIP Documentation: Overview of the 2013-2016 Regional TIPDocument. Puget Sound Regional Council. http://www.psrc.org/transportation/tip/current/1316tip.Accessed April 8.Rigg, G.B. 1958 Peat Resources of Washington, Bulletin No. 44. Division of Mines and Geology, Olympia, WA.Ruby, R.H. and J.A. Brown 1992 A Guide to the Indian Tribes of the Pacific Northwest. University of OklahomaPress, Norman, Oklahoma.Seattle Audubon Society. 2013. BirdWeb: Seattle Audubon Society’s Guide to the Birds of Washington State.Available on-line at http://www.birdweb.org/birdweb/.<strong>Draft</strong> | June 2013 4-5
GORST PLANNED ACTION EIS | REFERENCESSceva, J.E. 1957. Geology and Ground-water Resources of Kitsap County, Washington. U.S. Geological SurveyWater-Supply Paper 1413.Schuster, E. 2009 Geologic Map of Washington. Washington State Department of Natural Resources, Division ofGeology and Earth Resources, Olympia, WA.Shong, M.V., C.J. Miss, M.E. Parvey, A.E. Stevenson, S. Tallman 2007 Results of Archaeological Testing at 45KI11 forthe Woodinville Village Development, King County, Washington. Report prepared for Woodinville VillageAssociates and MJR Development, Inc. Kirkland, WA. Report on file at DAHP, Olympia, Washington.Shipman, H. 2004 Coastal Bluffs and Sea Cliffs on Puget Sound, Washington. In Formation, Evolution, and Stabilityof Coastal Cliffs – Status and Trends, U.S. Geological Survey Professional Paper 1693, Ed. M.A. Hamptonand G. B. Griggs. U.S. Department of the Interior, U.S. Geological Survey. National Academy Press,Washington D.C.SKSD (South Kitsap School District). 2011. South Kitsap School District, Capital Facilities Plan. South Kitsap SchoolDistrict, Port Orchard, Washington. Available at: http://www.skitsap.wednet.edu/page/190.SKFR (South Kitsap Fire and Rescue). 2012. 2011 Service Level Objectives and Evaluation. South Kitsap Fire andRescue, Port Orchard, Washington. Available at: http://skfr.org/wpcontent/uploads/2011ServiceLevelReport.pdf.SMAQMD. 2010. Recommended Guidance for Land Use Emission Reductions Version 2.5. SacramentoMetropolitan Air Quality Management District. January 12.Smith, M.W. 1940 The Puyallup-Nisqually. Columbia University Contributions to Anthropology 32, New York, NY.Stein, J. 1992 (ed.) Deciphering a Shell Midden. Academic Press, San Diego, CA.Stein, J., R, Kiers, and L. Phillips 2004 Site Form 45KP139. Site form on file at DAHP, Olympia, Washington.Stanley, S., S. Grigsby, T. Hruby, and P. Olson. 2010. Version 2, Puget Sound Watershed Characterization Project:Description of Methods, Models, and Analysis. Washington State Department of Ecology Publication #10-06-005 (in review). March 2010. Olympia, WA.Suttles, W., and B. Lane 1990 Southern Coast Salish. In Handbook of North American Indians vol. 7 NorthwestCoast, edited by Wayne Suttles, pp. 485-502. Smithsonian Institution, Washington DC.Thorson, R.M. 1989 Glacio-isostatic Response of the Puget Sound Area, Washington. Geological Society of AmericaBulletin 101:1163-1174.The Project: An Archaeologist’s Perspective. In, Vashon Island Archaeology: A View from Burton Acres ShellMidden, ed. J.K. Stein and L.S. Phillips, 2002 University of Washington Press, Seattle, WA.Troost, K.G. and D.B. Booth 2008 Geology of Seattle and the Seattle Area, Washington. Reviews in EngineeringGeology 20:1-36.USEPA. 2013. Technology Transfer Network Air Toxics 2005 National-Scale Air Toxics Assessment: 2005 Tract-levelModeled Ambient Concentrations, Exposures, and Risks. U.S. <strong>Environmental</strong> Protection Agency.http://www.epa.gov/ttn/atw/nata2005/tables.html. Accessed April 8.U.S. Geological Survey Water-Supply Paper 1413. 178 pp., 3 plates. Build Carbon Neutral. 2013.http://buildcarbonneutral.org/. Accessed April 10.U.S. Department of Agriculture Soil Conservation Service. 1980. Soil Survey of Kitsap County Area, Washington. InCooperation with Washington State Department of Natural Resources and Washington State UniversityAgricultural Research Center. Washington, D.C.<strong>Draft</strong> | June 2013 4-6
GORST PLANNED ACTION EIS | REFERENCESU.S. Department of Agriculture Natural Resources Conservation Service. 2013a. Custom Soil Resource Report forKitsap County Area, Washington, <strong>Gorst</strong> Creek Watershed. Generated from the U.S. Web Soil Survey(http://websoilsurvey.nrcs.usda.gov/app/WebSoilSurvey.aspx) on March 5, 2013.U.S. Department of Agriculture Natural Resource Conservation Service. 2013b. Custom Soil Resource Report forKitsap County, Area, Washington, <strong>Gorst</strong> Urban Growth Area. Generated from the U.S. Web Soil Survey(http://websoilsurvey.nrcs.usda.gov/app/WebSoilSurvey.aspx) on March 5, 2013.U.S. Fish and Wildlife Service. 2009. Marbled Murrelet (Brachyramphus marmoratus) 5-Year Review. WashingtonFish and Wildlife Office. Lacey, WA.U.S. Fish and Wildlife Service. 2012. Listed Proposed Endangered and Threatened Species and Critical Habitat;Candidate Species; and Species of Concern. Accessed on-line athttp://www.fws.gov/wafwo/speciesmap/KitsapCounty0312.pdf. Accessed on March 5, 2013.U.S. Fish and Wildlife Service. 2013. On-line Fact Sheets for Federally Listed, Proposed, Candidate, Delisted, andSpecies of Concern by Taxonomic Group. http://www.fws.gov/wafwo/specieslist.html. Fact Sheets forPacific Lamprey and River Lamprey Accessed on April 10, 2013.UWCIG and Ecology. 2008. Sea Level Rise in the Coastal Waters of Washington State. University of WashingtonClimate <strong>Impact</strong>s Group and Washington State Department of Ecology. January.UWCIG. 2012. Forecasts and Planning Tools. University of Washington Climate <strong>Impact</strong>s Group.http://cses.washington.edu/cig/fpt/fpt.shtml. Accessed April 11.Waguespack, N.M. and T.A. Surovell 2003 Clovis Hunting Strategies, or how to make out on plentiful resources.American Antiquity 68(2):333–352Waters, M.R. and T.M. Stafford 2007 Redefining the Age of Clovis: Implications for the Peopling of the Americas.Science 315 (5815):1122-1126.Waterman, T.T. 1922 The Geographical Names Used by the Indians of the Pacific Coast. Geographical Review 12(2):175-194. 2001 Puget Sound Geography. Lushootseed Press, Zahir Consulting Services, Federal Way,Washington.Washington State Department of Commerce. 2013. 2012 Washington State Energy Strategy.http://www.commerce.wa.gov/Documents/2012WAStateEnergyStrategy.pdf. Accessed April 11.Washington Department of Fish and Wildlife. 2000. Atlas of Seal and Sea Lion Haulout Sites in Washington.Olympia, Washington.Washington Department of Fish and Wildlife. 2013. SalmonScape Web Application Version 4.0. Available on-line athttp://fortress.wa.gov/dfw/gispublic/apps/salmonscape/default.htm. Site accessed on March 5, 2012.Washington Department of Fish and Wildlife. 2013a. SalmonScape Web Application Version 4.0. Available on-lineat http://fortress.wa.gov/dfw/gispublic/apps/salmonscape/default.htm. Site accessed on March 15, 2013.Washington Department of Fish and Wildlife. 2013b. Digital Data for AECOM, Project: <strong>Gorst</strong> Creek WatershedComprehensive Plan, <strong>Planned</strong> <strong>Action</strong> EIS, March 7, 2013. Olympia, Washington.Washington Natural Heritage Program. 2009. Washington Herp Atlas. Washington Department of Fish and Wildlife,USDI Bureau of Land Management, and U.S. Forest Service. Available on-line athttp://www1.dnr.wa.gov/nhp/refdesk/herp/.Washington Natural Heritage Program. 2013. Geographic Information System WNHP Data Set, February 2013.Olympia, Washington.<strong>Draft</strong> | June 2013 4-7
GORST PLANNED ACTION EIS | REFERENCESWhitlock, K. 1992 Vegitational and Climatic History of the Pacific Northwest during the Last 20,000 Years:Implications for Understanding Present-Day Biodiversity. The Northwest <strong>Environmental</strong> Journal, 8:5-28.Williams, S., K.E. Callum, and R. A. Sloma 2008 “Predictive Modeling” of Paleo-Incian Sites around Puget Sound:You Can’t Find what You’re not Looking For. Presented at the 73rd Annual Society of AmericanAnthropologists Conference.Woodruff, K., and H. Ferguson. 2005. Townsend’s Big-Eared Bat. In Management Recommendations forWashington’s Priority Species, <strong>Volume</strong> 5 (In Progress). Washington Department of Fish and Wildlife,Olympia, Washington<strong>Draft</strong> | June 2013 4-8
5.0 DISTRIBUTION LISTThe following agencies and individuals were sent a notice of availability, or a compact disk, or a copy of the <strong>Draft</strong>EIS.5.1 Federal AgenciesFederal Aviation AdministrationNaval Base KitsapUS <strong>Environmental</strong> Protection Agency5.2 TribesPort Gamble/S'Klallam TribeSkokomish TribeSquaxin Island TribeSuquamish Tribe5.3 State and Regional AgenciesPuget Sound PartnershipPuget Sound Regional CouncilKitsap Regional Coordinating CouncilWashington State Department of Arcaheology and Historic PreservationWashington State Department of CommerceWashington Department of CorrectionsWashington State Department of EcologyWashington State Department of Fish and WildlifeWashington State Department of HealthWashington State Department of Natural ResourcesWashington State Department of Social and Health ServicesWashington State Department of Transportation5.4 Local GovernmentsCity of Bremerton City CouncilCity of Bremerton Planning CommissionCity of Port OrchardKitsap County AssessorKitsap County Board of County CommissionersKitsap County Community DevelopmentKitsap County Parks and Recreation<strong>Draft</strong> | June 2013 5-1
GORST PLANNED ACTION EIS | DISTRIBUTION LISTKitsap County Planning CommissionKitsap County Public WorksKitsap County SherrifKitsap Public Health District5.5 Services, Utilities, Special Districts, and TransitPort of BremertonPuget Sound EnergySouth Kitsap Fire and RescueSouth Kitsap School DistrictSunnyslope Water District No. 155.6 Community OrganizationsKitsap Economic Development AllianceSustainable BremertonWest Sound Watersheds Council5.7 NewspapersBremerton PatriotKitsap Sun5.8 Interested Persons and Stakeholders<strong>Gorst</strong> UGA Property Owners<strong>Gorst</strong> Community Workshop Participants (October 2012 Scoping and February 2013 Preliminary Alternatives)Persons interested in planning – City and County email listservs<strong>Draft</strong> | June 2013 5-2
GORST PLANNED ACTION EIS | APPENDICESAppendix A<strong>Gorst</strong> Watershed Public Scoping Summary
THIS PAGE INTENTIONALLY BLANK
GORST CREEK WATERSHED PLAN, GORST SUBAREA PLAN& PLANNED ACTION EISPublic Scoping Summary: October and November 2012PURPOSE AND INTRODUCTIONAs partof the<strong>Gorst</strong>planningprocess, the City of Bremertonsolicited public and agency inputon thefuture visionfor <strong>Gorst</strong> aswell as the key environmental issues that should be evaluated in an environmental impact statement(EIS) under the State <strong>Environmental</strong> Policy Act (SEPA). This public scoping summary describes the commentsreceived through a written comment period and a public scoping meeting. This summary also describes otherrelatedoutreachsuchdiscussionswiththeSuquamishTribeandbusinessownerinterviews.ProposalsThe City of Bremerton, in partnership with Kitsap County and other state, federal, and tribal agencies, is in theprocess of preparing a proposed <strong>Gorst</strong> Creek Watershed Plan, including a framework plan for the watershed as awhole and a subarea plan for the <strong>Gorst</strong> UrbanGrowth Area (UGA).Also under preparation are implementing landuse and environmental regulations. It is also anticipated that a capital facilities plan (CFP) will be prepared tosupport the plan and to implement infrastructure. The plan and regulations will undergo public review andrefinement through late 2013. The planning efforts in the <strong>Gorst</strong> Creek Watershed and <strong>Gorst</strong> Urban Growth Area(UGA)areintendedto:Toplanthefutureofthe<strong>Gorst</strong>areaoverthenext20 30yearsbydefiningthelanduseoptions,Toprotectwaterquality,habitatandfishwhilefosteringeconomicdevelopment,Toestablishareasfordevelopment,restorationandprotectionbasedonscience,Todevelopalong rangecapitalimprovementplantoprovideforfutureutilityservices,publicservicesandtransportationneeds,andTomake<strong>Gorst</strong>aplacewherepeoplewanttolive,shopandrecreate.Part of the process entails the preparation of a SEPA EIS to evaluate natural and built environment topics andalternativelanduse patterns,particularly inthe<strong>Gorst</strong>UGA.Tofacilitatedevelopment andrestoration inthe <strong>Gorst</strong>UGA, the City anticipates adopting a planned action ordinance as part of the EIS. Future development proposalsconsistent with the planned action ordinance would not have to undergo a new environmental thresholddetermination, and would not be subject to SEPA appeals when consistent with the planned action ordinanceincludingspecifiedmitigationmeasures.Scoping Activities and AdvertisementsPublic and agency comment was solicited in a 21 day written scoping period from October 15 to November 5,2012.The City also held a publicmeeting on October 29, 2012 to askabout the visionfor<strong>Gorst</strong> andabout the EISscope.Scoping noticesandameetingannouncement weresentby mailtoeachproperty ownerinthe <strong>Gorst</strong>UGA, andtoa list of federal, state, and local agencies and tribes. The City and County also sent these documents by email tolists of persons interested in planning issues in the City and County. The City’s website, located at:http://www.ci.bremerton.wa.us/gorstwatershed/, includedacomment form. Thescoping notice waspublished inNovember2012 ScopingSummary 1
the Kitsap Sun on October 15, 2012 to notify any other persons having an interest in the project. A copy of thescopingnoticeandmeetingflyerareattached.WRITTEN SCOPING COMMENTSDuring the 21 day comment period, written comments were received from citizens and agencies as follows inExhibit1.Copies ofwrittencomments by agenciesareprovided intheattachment andshould bereviewedforthefull statements;copies of citizencomments areavailable at City Hall. Also, itshould be notedthat a questionnairedistributed at the public meeting was returned by four persons, and those are described further below in thisdocumentandalsoavailableforreviewatCityHall.Exhibit 1. List of Commenters and Key TopicsDate Name/Agency SummaryWebsiteCommentFormOctober15,2012 PatWaters StormwaterrunoffthatisunderminingmanyoftheroadsinthevicinityofFeigleyandthefrontageroadalongwithHwy16submersionduringstorms.October29,2012TinaLondon,NavyCityMetalsWouldlikescopingmeetingnotesasshecouldnotattend.Also,mainobjectiveishowprojectcouldaffectthebusinessandproperty.Alsowillingtohelpoutandassist.October30,2012 JulieLarson Enjoyedpublicmeeting.Providedexamples(links)oflow impactdevelopment,andalsodevelopmentexamplestoavoid.PerhapsaDollarstorewoulddo well.November2,2012 JulieLarson Residencewasrobbed.Nowconcernedbysigninginatmeetingshemayhaveprovidedpersonalinformationavailableforotherstoviewwhowerealsosigningin.WrittenComments[ConsultantResponse:ThemeetingSign InSheetaskedforaname,emailaddress,andaffiliation.Nostreetaddresseswererequested.]October29,2012November4,2012YvonneSadtler,MattressRanchHarryGilger,memberWestSoundCycleClubWouldliketoseetherightlaneof16westbecomea"BusinessRoute"thatisa25mphzonethatrunsfromjustbeforeElandonGardensandendsrightbeforeVikingFence.Wouldlikewaterpipeunderroadfixed.UnderstandpotentialrezoningtomixeduseandannexationtoCity.Appreciatedcontact.EncouragetheCitytoactivelypursuetheproposedBikeTrailfromtheWestsideofBremertonthrough<strong>Gorst</strong>toPortOrchardNovember4,2012 AnnRichey Support<strong>Gorst</strong>trail.November5,2012 WilliamAbbey SupportproposedSinclairTrail.November5,2012 DanKronyak Supportthedevelopmentofahardsurfacepedestrian/bicycleNovember2012 ScopingSummary 2
Date Name/Agency SummarysharedpaththatprovidesasafetransportationlinkbetweenPortOrchardandBremerton.November5,2012 DavidMiller SupportfortheproposedSinclairTrail.November5,2012 JaySpady Provideaninterconnectedhardsurfacesharedusepath/trail(recommendedroutessuggested);expediteaParkandRide;provideparkareastomaximizeaccesstoSinclairInlet; providerulesforadequatestreambuffers;providezoningtoresultin<strong>Gorst</strong>beingmorefamilyfriendly;addresstransportation –freearterialsfromservingaslocalfrontageroads;providingzoningforshoppingareasandnicemultifamilydwellings.November5,2012 RonLandon,WSDOT RequestthatplanningteamseekinputfromWSDOT.<strong>Gorst</strong>asadestinationcouldexacerbatecongestion.WouldliketoreviewtrafficanalysisandpotentialimpactstostateroutesforthcominginplanandEIS.WSDOTidentifiespendingstudyatSR3/SR304andwouldliketoreview<strong>Gorst</strong>studymethodsandassumptions.Addresstransitandmodeshare.Veryinterestedinmitigationmeasures.InplannedactionordinanceincludeaprocesswhereWSDOTcanbenotifiedofdevelopmentapplicationsandcanreviewproposals.Howwillmitigationberequiredonacase by caseevaluation?AlsoWSDOTisinterestedinthestormwaterandwatershedplanningcomponentsandhowtheycanprovidemitigationandtreatmentoptionsthatmaybenefitWSDOT.Post –ScopingCommentsNovember7,2012 FredGrimm SupportforproposedSinclairTrail.November7,2012November7,2012TimBaker,President,WestSoundCyclingClubBrianE.Watson,memberWestSoundCycleClubUrgeCitysupporttheproposedSinclairTrailProjectalongtheNavy'srailroadtracksbetweenPSNSand<strong>Gorst</strong>SupporttheconstructionoftheSinclairTrailtoconnecttheshipyardareato<strong>Gorst</strong>.November2012 ScopingSummary 3
SCOPING OPEN HOUSE AND WORKSHOPWorkshop ActivitiesTheCityofBremertonheldapublicscopingmeetingtosolicitcommentsonthe<strong>Gorst</strong>CreekWatershedPlan,<strong>Gorst</strong>Subarea Plan, and <strong>Planned</strong> <strong>Action</strong> EIS. The meeting was held on October 29, 2012 from 5 to 7 p.m. and featuredperiodsofopenhouseandanactiveworkshop.Approximately37personsparticipated.Theagendawasasfollows:5:00 5:30 OpenHouse5:30 5:50 Presentation5:50 6:20 VisioningExercise –SWOTAnalysis6:20 6:30 GroupReporting6:30 7:00 OpenHouseHeather Kauer, City of Bremerton, provided a welcome at the beginning of the presentation. Members of theconsulting team, Bill Webb, AECOM, and Lisa Grueter, BERK, gave a presentation regarding the purpose of the<strong>Gorst</strong> planning efforts, EIS topics, and draft guiding principles. Heather Kauer provided an overview of theannexation process. A general question and answer period was held. Questions from audience related to codeenforcement,creeksandstormwater,andtraffic.Following the presentation, meeting participants were asked to participate in a small group exercise to identifystrengths, weaknesses, opportunities, and threats/challenges in <strong>Gorst</strong>. The groups were facilitated by City andCountystaffand Consultants. Small groupswere asked to haveacitizen report resultsto thelarger group.ResultsareshowninExhibit2below.CitizenscouldalsoaskquestionsofCity andCountystaffandconsultantsfollowingthepresentationinaninformalone on onemanner.Kitsap County staff available included Eric Baker, Special Projects Division Manager, Katrina Knutson, SeniorPlanner,and JimRogers,Transportation Planner. Citystaff inattendanceincluded Heather Kauer,DeputyDirectorof Community Development, Doug McIntyre, City Planner, and Dave Tanner, Stormwater Engineer. Consultantstaff included Bill Webb, Bill Kreager, and Dennis Struecker with AECOM, and Lisa Grueter and Erik Rundell withBERK.November2012 ScopingSummary 4
Exhibit 2. SWOT AnalysisStrengths – Group 1 Strengths – Group 2 Strengths – Group 3 Opportunities – Group 1 Opportunities – Group 2 Opportunities – Group 3Quality oflifeStrongsenseofcommunityCentralaccessPoggieClub(children’sfishing)ViewsofthemountainsandSoundAccessibilitytohighway(butdangerous)Newsewer(adduplands?)ShorelineaccessLocationimageasSoundandsalmonWoodedandforested,“green”Blue >water,creek,inletRuralandlowdensitySafeandquietConnectedtorestoftheCounty,Bremerton,Port OrchardCentrallocationShoreline >ExtensiveWildlife,Eagles,deer,seals,etc.Waterfrontaccess/trail/park<strong>Gorst</strong>SalmonDaysSoundbarriersWithnewsewers,Parkisnowpossible?BrownfieldNamechange “Sinclair”Sidewalks,trails,localtrailsandintra countyLittercleanupMoreinvitingbusinesses,local serving,placespeoplestopBusto BremertonferrydockFrontageroad(increaseflow,spreadofthroughtraffic)TreepreservationBeach/wateraccessandsignageKayaklaunchingpointMorepublicland/parkspaceWeaknesses – Group 1 Weaknesses – Group 2 Weaknesses – Group 3 Threats – Group 1 Threats – Group 2 Threats – Group 3ConfusingaccessStoppingnotpossible,safelyLackofsnowplowingNotattractiveVehiclenoiseTrafficdangers –72,000cars/dayAccesstobusinessescreatesbottleneckLandscapedNorthhighwayisoverplanted,notmaintainedOvergrownAcrosshighwayfromKitsapMufflerSawmillsiteStormrunoffonbackroadsNeedforqualityshopping?Seedybusinesses >toplesscoffeeshopsRundownbusinessesandpropertiesDifficultaccesstogetoffhighwayTrafficcollisionsLitter,litteronbeachNoaccesstowaterorbeachHighwaylocalaccessvs.controlledaccessTraffic highwayandlocalroadsarebacked upNowaytowalk –illegaltowalkalongthehighwayTrafficGroup1(DennisandJim,Facilitators),Group2(Bill,Facilitator),Group3(ErikandKatrina,Facilitators)Flooding –creek,highwayrunoffTaxchangesinCityPropertyvaluesareupordown<strong>Environmental</strong>remediationContinuedusabilityCompetinguses –commercialvs.parks“seedy”businessesaresuccessful,profitableChangeintransportationseenasnegativetobusinessesHighertaxeswithannexationTopographyNovember2012 ScopingSummary 5
Written InputQuestionnairesAquestionnairewasdistributedatthemeetingasking aboutdraftguidingprinciples,keyenvironmentaltopicsandotherquestions.Fourwerereturnedandarepartoftheattachments.Asummaryofinputfollows.Whatdoyouthinkwouldmake<strong>Gorst</strong>aplacetostop?EliminateshadyplaceslikeToysToplessandtoplesscoffeeshops.Regularlittercleanup.Beautifulpublicplaces –trails.Cleanupthebeach.Gentrification –cutestores,Starbucksplacesthatarepleasanttobeatandstayawhile.Cleanitup.Community –renameittoSinclairInlet(theCommunityofSinclairon<strong>Gorst</strong>Creek). Legacy –farmer<strong>Gorst</strong>hashis “<strong>Gorst</strong>Creek”.Takeadvantageofwaterview1)Apark;2)Shopping,grocery;3)<strong>Environmental</strong>lyfriendly.Townhomes?BusstopfortransitGetridofthejunkyard.Adecentgrocerystore.Abusstop/publictransportation.What are the top 3 issues you think the <strong>Gorst</strong> Creek Watershed Plan and <strong>Gorst</strong> Subarea Plan shouldaddress?Aesthetics,economicdevelopment,naturalenvironment.Aesthetics,culturalresources,landuse,naturalenvironment,ecofriendlypark.WhatdoyoulikeabouttheGuidingPrinciples?<strong>Environmental</strong>concern.Don’tworryaboutlandvalue,perse.WhatwouldyouchangeabouttheGuidingPrinciples?SortofwiththeBremertonBoardwalktoPortOrchardwasstillplanned.IsanythingMissingfromtheGuidingPrinciples?Wereallyhopetherewillbetrailsforhiking.Cleanupjunkyproperties.Isthereanythingelseyou’dliketoshare?Welikethename<strong>Gorst</strong>,fortherecord.Whenbuilding –pleasePRESERVETHETREES!Developmentisgreat,butdon’tletitbecomejustlikeCalifornia –pavement+stripmallsandanonymousSimCity likestreets.Treesmakeallthedifference.PleasepreservethemuralatthePackiat’sToybox.Weareveryconcernedabouttheeagles,herons,salmon+Trees+wildlife.Theyare#1 importantmost.Deer,wildbirds,etc.PRESERVETHEGORSTMISSILE!WewishShermanHeightsRoadhadasidewalk!?ParkandRidetotheFerry!Agrocerystore?November2012 ScopingSummary 6
IhaverentalpropertiesthatarezonedHTC.Adjacent,Ihavelotsthatcurrentlyarenotallowedtohavearesidenceputinbecauseofthecommercialzoning.Iwouldliketoseemixed usezoning,soIcouldexploitthepropertytoitshighestandbestuse,whetheritberesidential(rentalinmycase)orcommercial.Ihaveenclosedamaptoclarifymyareaofconcern.Theimpactofcommercialzoningonbothsidesof<strong>Gorst</strong>Creekistooprofound.Whyencourageitinanareathatismainlyanestuaryandshouldbeprotectedassuch.Bytheway,pleasenotetheplannedexpansionoftheLockhartQuarrythatwasfacilitatedbythe2003zoningdecision—thisdoesn’tlooklikeaplanforhousingdevelopmenttome.Cover Story PosterAnother means of attracting input was an opportunity to write a headline for a future cover story on <strong>Gorst</strong> – 20yearsfromnow.Twopersonsprovidedsomefeedbackasfollows.How wouldpeoplenowdescribe<strong>Gorst</strong>(in20years)?DrivingfromthenorthinBremerton –gatewayhasshorelinevegetationthatallowsviewstothewaterandaboardwalkPutallthethroughtrafficoverheadonaviaduct(cheaperthanbridge) –betterforbusinessesPRE SCOPING COORDINATION AND OUTREACHTribal CoordinationThe primary agency partners in the <strong>Gorst</strong> project are the City of Bremerton (lead), Kitsap County, and theSuquamish Tribe. Each has assigned elected and appointed officials to serve in an advisory capacity. The City andCounty willultimately adopt the <strong>Gorst</strong>Watershed Plan and <strong>Gorst</strong>SubareaPlan and associated EIS and regulationsinconsultationwiththeTribe.To assist with project coordination and obtain early input, the Mayor of Bremerton and Suquamish Tribe met toshare information and discuss key topics of mutual concern regarding planning and the EIS. Key issues includedensuring restorationis consideredasaneconomicdevelopmentactivity,addressingfishpassage, addressingtrails,andensuringculturalresourcesareevaluated.Business InterviewsThe City and consultant staff mailed correspondence and walked around to businesses to promote the scopingprocess, discuss the land use plan and annexation, and hear about business owner plans for the future. Meetingswere heldinformallyinlateSeptemberandearlyOctober. Some businessesprovided writtencomments asshowninExhibit1above.NEXT STEPSThe City and project partners will consider the scoping comments as draft land use alternatives and plans aredeveloped.TheEISwilladdressalargevarietyofnaturalandbuiltenvironment topicsandthetopicsidentifiedwillbe covered,e.g. transportation,stormwater, naturalenvironment, landuse,and others. A draftplanand <strong>Draft</strong> EISwillbeissuedinspring2013,andwillallowforadditionalpubliccomment.November2012 ScopingSummary 7
THIS PAGE INTENTIONALLY BLANK
ATTACHMENTSA. Scoping AdvertisementsB. Scoping Meeting MaterialsC. Agency CommentsNovember2012 ScopingSummary 8
THIS PAGE INTENTIONALLY BLANK
THIS PAGE INTENTIONALLY BLANK
Project Fact SheetWhat is the purpose of the <strong>Gorst</strong> planning effort?The planning efforts in the <strong>Gorst</strong> Creek Watershed and <strong>Gorst</strong> Urban Growth Area (UGA) are intended to:To plan the future of the <strong>Gorst</strong> area over the next 20-30 years by defining the land use options,To protect water quality, habitat and fish while fostering economic development,To establish areas for development, restoration and protection based on science,To develop a long-range capital improvement plan to provide for future utility services, public services andtransportation needs, andTo make <strong>Gorst</strong> a place where people want to live, shop and recreate.What is the study area?The <strong>Gorst</strong> Creek Watershed and <strong>Gorst</strong> UGA together comprise the study area, and encompass over 6,000 acres in thesouthwestern portion of Kitsap County.About 3,597 acres comprise Bremerton city limits.The unincorporated <strong>Gorst</strong> UGA is approximately 335 gross acres in area (about half of which are in the watershed).Approximately 178 acres are in the McCormick Woods area of the City of Port Orchard.The balance of the watershed, about 1,941 acres, consists of Rural unincorporated land.Who is planning for the area? What plans will be prepared?The City of Bremerton, in partnership with Kitsap County and other state, federal, and tribal agencies, is in the process ofpreparing a proposed <strong>Gorst</strong> Creek Watershed Plan, including a framework plan for the watershed as a whole and a subareaplan for the <strong>Gorst</strong> UGA. Also under preparation are implementing land use and environmental regulations. It is alsoanticipated that a capital facilities plan (CFP) will be prepared to support the plan and to implement infrastructure. The planand regulations will undergo public review and refinement through late 2013.How is the plan funded?The planning effort is funded through the USWatershed Management AssistanceProgram Grant and from the participation of <strong>Gorst</strong> government agencies, regional stakeholders, and property owners.Is annexation under consideration?Under the Growth Management Act (GMA), the preferred urban service providers in UGAs are cities. Kitsap County hasassociated the <strong>Gorst</strong> UGA with the City of Bremerton, meaning the City is the designated future service provider for theUGA and may annex it. The subarea plan and implementing zoning are anticipated to serve as pre-annexation planning andzoning pursuant to RCW 35.13.177. The subarea plan will also address the transition from County to City services. The Cityproposes to annex the <strong>Gorst</strong> UGA following the completion of the subarea plan. The City intends to work closely with the<strong>Gorst</strong> community now during the planning process and following annexation.October 2012 Fact Sheet Page 1 of 2
What is an <strong>Environmental</strong> <strong>Impact</strong> <strong>Statement</strong> (EIS)?Generally an EIS is an informational document that provides the City, public, and other agencies with environmentalinformation to be considered in the decision-making process for new development. It also allows residents, businesses, andother government agencies to comment on proposals and alternatives. An EIS describes: proposed actions and alternatives;existing conditions of the study area; impacts that may occur if an alternative were implemented; mitigation measures toreduce or eliminate impacts; and potential significant, unavoidable, and adverse impacts.What is scoping?Scoping is a process intended to narrow the scope of every EIS to the probable significant adverse impacts and reasonablealternatives, including mitigation measures. Interested parties, agencies, and tribes may comment on EIS alternatives,issues the EIS should evaluate, probable significant adverse impacts, and licenses or other approvals that may be required.The City has identified the following areas for discussion in the EIS: Natural Environment (geology/soils, water resourcesincluding surface water, groundwater, and stormwater, air quality, plants and animals), Noise, Hazardous Materials, LandUse Patterns/Plans and Policies, Socioeconomics, Aesthetics, Cultural Resources, Transportation, and Public Services andUtilities.The EIS will analyze the No <strong>Action</strong> Alternativedevelopment regulations applicable to the UGA and watershed without amendment. It is also anticipated that the EIS willaddress two <strong>Action</strong> Alternatives that may review various land use patterns such as an increase residential developmentoptions and enhancement of commercial options while promoting environmental restoration and protection.What is a <strong>Planned</strong> <strong>Action</strong>?A planned action provides more detailed environmental analysis during formulation of planning proposals rather than atthe project permit review stage. The basic steps in designating a planned action are to prepare an EIS, designate theplanned action area and projects by ordinance, and review permit applications for consistency with the ordinance (see WAC197-11-164 to 172). Future development proposals consistent with the planned action ordinance do not have to undergoan environmental threshold determination, and are not subject to SEPA appeals when consistent with the planned actionordinance including specified mitigation measures. This tool has been used elsewhere by local governments in WashingtonState, including Bremerton. The City is considering designating a planned action for the <strong>Gorst</strong> UGA.How do I comment?Public comment is being solicited in a scoping process from October 15 to November 5, 2012. Mail written comments at theaddress below or email comments to Heather.Kauer@ci.bremerton.wa.us. The City must receive the comments by 5:00pm November 5, 2012. Additional comment opportunities will be available following the preparation of the draft plans anddraft EIS.For More Information:Visit the project web site at: http://www.ci.bremerton.wa.us/gorstwatershed/Heather Kauer, Assistant DirectorCommunity Development DepartmentCity of Bremerton |345 6th Street |Bremerton, WA 98337Phone: 360-473-5297 - Fax: 360- 473-5278Heather.Kauer@ci.bremerton.wa.usOctober 2012 Fact Sheet Page 2 of 2
challenges/threats in the <strong>Gorst</strong> Watershed & UGA.StrengthsWhat are the positive attributes currently present in <strong>Gorst</strong>?OpportunitiesWhat can be done in <strong>Gorst</strong> to address its weaknesses? (e.g. targetedinvestment)WeaknessesWhat local issues or characteristics limit opportunities in <strong>Gorst</strong>?Challenges/ThreatsWhat challenges and trends must be overcome in ?
THIS PAGE INTENTIONALLY BLANK
THIS PAGE INTENTIONALLY BLANK
GORST PLANNED ACTION EIS | APPENDICESAppendix B<strong>Draft</strong> <strong>Planned</strong> <strong>Action</strong> Ordinance
THIS PAGE INTENTIONALLY BLANK
ORDINANCE NO.________AN ORDINANCE OF [THE CITY COUNCIL OF THE CITY OF BREMERTON/THEKITSAP COUNTY BOARD OF COUNTY COMMISSIONERS] WASHINGTON,ESTABLISHING A PLANNED ACTION FOR THE GORST URBAN GROWTH AREAPURSUANT TO THE STATE ENVIRONMENTAL POLICY ACTWHEREAS, the State <strong>Environmental</strong> Policy Act (SEPA) and implementing rules provide for theintegration of environmental review with land use planning and project review through designation of“<strong>Planned</strong> <strong>Action</strong>s” by jurisdictions planning under the Growth Management Act (GMA); andWHEREAS, the City of Bremerton (City) and Kitsap County (County) have each adopted aComprehensive Plan complying with the GMA; and,WHEREAS, to guide <strong>Gorst</strong>’s growth and redevelopment, the City and Country have engaged inextensive watershed characterization and subarea planning for <strong>Gorst</strong> and have adopted amendments totheir Comprehensive Plan including the <strong>Gorst</strong> Subarea Plan; andWHEREAS, the City has received a grant from the USEPA’s Watershed Management AssistanceProgram Grant and also received support from the participation of <strong>Gorst</strong> property owners, regionalstakeholders, and government agencies including Kitsap County; andWHEREAS, the City approved a planned action ordinance for part of the <strong>Gorst</strong> Creek Watershedfor the South Kitsap Industrial Area, which was separately approved for a planned action in 2012; andWHEREAS, the [City] [County] desires to designate a separate <strong>Planned</strong> <strong>Action</strong> for [a portion of]the <strong>Gorst</strong> Urban Growth Area (UGA); andWHEREAS, designation of a <strong>Planned</strong> <strong>Action</strong> expedites the permitting process for subsequent,implementing projects whose impacts have been previously addressed in a <strong>Planned</strong> <strong>Action</strong>environmental impact statement (EIS), and thereby encourages desired growth and economicdevelopment; andWHEREAS, the <strong>Gorst</strong> <strong>Planned</strong> <strong>Action</strong> EIS identifies impacts and mitigation measures associatedwith planned development in the <strong>Gorst</strong> UGA; andWHEREAS, the [City] [County] has adopted development regulations and ordinances which willhelp protect the environment, and is adopting regulations specific to the <strong>Gorst</strong> UGA which will guide theallocation, form and quality of desired development; andWHEREAS, the [City’s SEPA Rules, Bremerton Municipal Code 20.04.205] [County’s SEPA Rules,Kitsap County Code 18.04.020] provide for <strong>Planned</strong> <strong>Action</strong>s within the [City] [County]; andWHEREAS, the City as lead agency and County as a project partner provided public commentopportunities through an EIS scoping period in October and November 2012, and for the <strong>Gorst</strong> SubareaPlan and <strong>Draft</strong> <strong>Planned</strong> <strong>Action</strong> EIS during June and July 2013, and held public meetings and hearings aspart of a coordinated <strong>Gorst</strong> public participation program throughout 2013.NOW, THEREFORE, the [City Council of the City of Bremerton] [Board of County Commissionersof Kitsap County], Washington ordains as follows:Section 1. Recitals. The recitals set forth above are incorporated herein by reference.November 2012 1
PLANNED ACTION ORDINANCESection 2. Purpose. The [City Council] [Board of County Commissioners] declares that the purpose ofthis ordinance is to:A. Combine environmental analysis, land use plans, development regulations, [City] [County] codes andordinances together with the mitigation measures in the <strong>Gorst</strong> <strong>Planned</strong> <strong>Action</strong> EIS to mitigateenvironmental impacts and process planned action development applications in the <strong>Planned</strong> <strong>Action</strong>Area;B. Designate the <strong>Gorst</strong> UGA [define final boundaries – all or a portion of the <strong>Gorst</strong> UGA] as a <strong>Planned</strong><strong>Action</strong> Area for purposes of environmental review and permitting of subsequent, implementing projectspursuant to SEPA, RCW 43.21C.031;C. Determine that the EIS prepared for the <strong>Gorst</strong> Subarea Plan meets the requirements of a <strong>Planned</strong><strong>Action</strong> EIS pursuant to SEPA;D. Establish criteria and procedures, consistent with state law, that will determine whether subsequentprojects within the <strong>Planned</strong> <strong>Action</strong> Area qualify as <strong>Planned</strong> <strong>Action</strong>s;E. Provide the public with information about <strong>Planned</strong> <strong>Action</strong>s and how the [City] [County] will processimplementing projects within the <strong>Planned</strong> <strong>Action</strong> Area;F. Streamline and expedite the land use permit review process by relying on the EIS completed for the<strong>Planned</strong> <strong>Action</strong>;G. Apply the [City’s] [County’s] development regulations together with the mitigation measuresdescribed in the EIS and this Ordinance to address the impacts of future development contemplated bythis Ordinance.Section 3. Findings. The [City Council] [Board of County Commissioners] finds as follows:A. The [City] [County] is subject to the requirements of the GMA (RCW 36.70A), and is applying the<strong>Planned</strong> <strong>Action</strong> to a UGA [Urban Growth Area]; andB. The [City] [County] has adopted a Comprehensive Plan complying with the GMA, and is amending theComprehensive Plan to incorporate a subarea element specific to the <strong>Gorst</strong> UGA; andC. The [City] [County] is adopting development regulations concurrent with the <strong>Gorst</strong> Subarea Plan toimplement said Plan, including this ordinance; andD. An EIS has been prepared for the <strong>Planned</strong> <strong>Action</strong> Area, and the [City Council] [Board of CountyCommissioners] finds that the EIS adequately identifies and addresses the probable significantenvironmental impacts associated with the type and amount of development planned to occur in thedesignated <strong>Planned</strong> <strong>Action</strong> Area; andE. The mitigation measures identified in the <strong>Gorst</strong> <strong>Planned</strong> <strong>Action</strong> EIS and attached to this ordinance asExhibit B, incorporated herein by reference, together with adopted [City] [County] developmentregulations, will adequately mitigate significant impacts from development within the <strong>Planned</strong> <strong>Action</strong>Area; andF. The <strong>Gorst</strong> Subarea Plan and <strong>Planned</strong> <strong>Action</strong> EIS identify the location, type and amount of developmentthat is contemplated by the <strong>Planned</strong> <strong>Action</strong>; andG. Future projects that are implemented consistent with the <strong>Planned</strong> <strong>Action</strong> will protect theenvironment, benefit the public and enhance economic development; andH. The City and County provided several opportunities for meaningful public involvement in the <strong>Gorst</strong>Subarea Plan and <strong>Planned</strong> <strong>Action</strong> EIS, including a community meeting prior to the publication of noticeJune 2013 2
PLANNED ACTION ORDINANCEfor the planned action ordinance; have considered all comments received; and, as appropriate, havemodified the proposal or mitigation measures in response to comments;I. Essential public facilities defined in RCW 47.06.140 are excluded from the <strong>Planned</strong> <strong>Action</strong> and noteligible for review or permitting as <strong>Planned</strong> <strong>Action</strong>s unless they are accessory to or part of a project thatotherwise qualifies as a planned action; andJ. The <strong>Planned</strong> <strong>Action</strong> applies to a defined area that is smaller than the overall City boundaries andsmaller than overall County designated UGAs; andK. Public services and facilities are adequate to serve the proposed <strong>Planned</strong> <strong>Action</strong>, with implementationof mitigation measures identified in the EIS.Section 4. Procedures and Criteria for Evaluating and Determining <strong>Planned</strong> <strong>Action</strong> Projects within<strong>Planned</strong> <strong>Action</strong> Area.A. <strong>Planned</strong> <strong>Action</strong> Area. This <strong>Planned</strong> <strong>Action</strong> designation shall apply to the area shown in Exhibit A,incorporated herein by reference.B. <strong>Environmental</strong> Document. A <strong>Planned</strong> <strong>Action</strong> determination for a site-specific project applicationwithin the <strong>Planned</strong> <strong>Action</strong> Area shall be based on the environmental analysis contained in the <strong>Draft</strong> EISissued by the City on XXX 2013 and the Final EIS published on XXX 2013 [and adopted by Kitsap Countyon XXX 2013]. The <strong>Draft</strong> and Final EIS documents shall comprise the <strong>Planned</strong> <strong>Action</strong> EIS for the <strong>Planned</strong><strong>Action</strong> Area. The mitigation measures contained in Exhibit B and attached to this Ordinance are basedupon the findings of the <strong>Planned</strong> <strong>Action</strong> EIS and shall, along with adopted [City] [County] regulations,provide the framework that the [City] [County] will use to apply appropriate conditions on qualifying<strong>Planned</strong> <strong>Action</strong> projects within the <strong>Planned</strong> <strong>Action</strong> Area.C. <strong>Planned</strong> <strong>Action</strong> Designated. Land uses and activities described in the <strong>Planned</strong> <strong>Action</strong> EIS, subject tothe thresholds described in subsection 4.D and the mitigation measures contained in Exhibit B, aredesignated <strong>Planned</strong> <strong>Action</strong>s or <strong>Planned</strong> <strong>Action</strong> Projects pursuant to RCW 43.21C.031. A developmentapplication for a site-specific <strong>Planned</strong> <strong>Action</strong> project located within <strong>Planned</strong> <strong>Action</strong> Area shall bedesignated a <strong>Planned</strong> <strong>Action</strong> if it completes the modified SEPA Checklist in Exhibit C and meets thecriteria set forth in Subsection 4.D of this Ordinance and all other applicable laws, codes, developmentregulations and standards of the [City] [County] are met.D. <strong>Planned</strong> <strong>Action</strong> Qualifications. The following thresholds shall be used to determine if a site-specificdevelopment proposed within the <strong>Planned</strong> <strong>Action</strong> Area was contemplated as a <strong>Planned</strong> <strong>Action</strong> and hashad its environmental impacts evaluated in the <strong>Planned</strong> <strong>Action</strong> EIS: [Note: this list is a placeholder andwill be revised, as appropriate, based on the preferred subarea plan land uses.](1) Qualifying Land Uses.(a) <strong>Planned</strong> <strong>Action</strong> Categories: The following general categories/types of land uses are definedthe <strong>Gorst</strong> Subarea Plan and are considered <strong>Planned</strong> <strong>Action</strong>s:i. XXXii. XXX[To be based on the Preferred Alternative – see <strong>Draft</strong> EIS Chapter 2 for example land uses inthe alternative land use and zoning designations, e.g. commercial, single family, multifamily,mixed use, recreation, open space, etc.](b) <strong>Planned</strong> <strong>Action</strong> Uses: A land use shall be considered a <strong>Planned</strong> <strong>Action</strong> Land Use when:i. it is within the <strong>Planned</strong> <strong>Action</strong> Area as shown in Exhibit A;June 2013 3
PLANNED ACTION ORDINANCEii. it is within the one or more of the land use categories described in subsection 1(a)above; andiii. it is listed in development regulations applicable to the zoning classifications applied toproperties within the <strong>Planned</strong> <strong>Action</strong> Area.A <strong>Planned</strong> <strong>Action</strong> may be a single <strong>Planned</strong> <strong>Action</strong> use or a combination of <strong>Planned</strong> <strong>Action</strong>uses together in a mixed use development. <strong>Planned</strong> <strong>Action</strong> uses include accessory uses.(c) Public Services: The following public services, infrastructure and utilities are also <strong>Planned</strong><strong>Action</strong>s: XXX [Consistent with Preferred Alternative].(2) Development Thresholds:(a) Land Use: The following amounts of various new land uses are contemplated by the <strong>Planned</strong><strong>Action</strong>:FeatureResidential Dwellings (units)Commercial Square FeetJobs<strong>Planned</strong> <strong>Action</strong> AreaXXXXXXXXX(b) Shifting development amounts between land uses in D(2)(a) may be permitted when thetotal build-out is less than the aggregate amount of development reviewed in the EIS; thetraffic trips for the preferred alternative are not exceeded; and, the development impactsidentified in the <strong>Planned</strong> <strong>Action</strong> EIS and are mitigated consistent with Exhibit B.(c) Further environmental review may be required pursuant to WAC 197-11-172, if anyindividual <strong>Planned</strong> <strong>Action</strong> or combination of <strong>Planned</strong> <strong>Action</strong>s exceed the developmentthresholds specified in this Ordinance and/or alter the assumptions and analysis in the<strong>Planned</strong> <strong>Action</strong> EIS.(3) Transportation Thresholds:(a) Trip Ranges & Thresholds. The number of new PM peak hour trips anticipated in the <strong>Planned</strong><strong>Action</strong> Area and reviewed in the EIS is as follows:TOTALPM PEAK HOUR TRIPSTotalXXX PM Peak Hour Trips(b) Concurrency. All <strong>Planned</strong> <strong>Action</strong>s shall meet the transportation concurrency requirementsand the LOS thresholds established in [BMC XXX/KCC XXX].(c) Traffic <strong>Impact</strong> Mitigation. [To be determined based on Preferred Alternative; for exampleeach project could be required to mitigate based on proportional share of trips determinedby a traffic generation study.](d) Discretion. The SEPA Responsible Official or his/her designee shall have discretion todetermine incremental and total trip generation, consistent with the Institute of TrafficEngineers (ITE) Trip Generation Manual (latest edition) or an alternative manual accepted bythe SEPA Responsible Official at his or her sole discretion, for each project permitapplication proposed under this <strong>Planned</strong> <strong>Action</strong>.June 2013 4
PLANNED ACTION ORDINANCE(4) Elements of the Environment and Degree of <strong>Impact</strong>s. A proposed project that would result in asignificant change in the type or degree of adverse impacts to any element(s) of the environmentanalyzed in the <strong>Planned</strong> <strong>Action</strong> EIS, would not qualify as a <strong>Planned</strong> <strong>Action</strong>.(5) Changed Conditions. Should environmental conditions change significantly from those analyzed inthe <strong>Planned</strong> <strong>Action</strong> EIS, the [City’s] [County’s] SEPA Responsible Official may determine that the<strong>Planned</strong> <strong>Action</strong> designation is no longer applicable until supplemental environmental review isconducted.(6) Substantive Authority. Pursuant to SEPA Substantive Authority at [BMC XXX/KCC XXX], andComprehensive Plan Policies, impacts shall be mitigated through the measures included in ExhibitB.E. <strong>Planned</strong> <strong>Action</strong> Review Criteria.(1) The City’s SEPA Responsible Official may designate as “planned actions”, pursuant to RCW43.21C.030, applications that meet all of the following conditions:(a) the proposal is located within the <strong>Planned</strong> <strong>Action</strong> area identified in Exhibit A of thisordinance;(b) the proposed uses and activities are consistent with those described in the <strong>Planned</strong> <strong>Action</strong>EIS and Section 4.D of this ordinance;(c) the proposal is within the <strong>Planned</strong> <strong>Action</strong> thresholds and other criteria of Section 4.D of thisordinance;(d) the proposal is consistent with the [City of Bremerton] [Kitsap County] Comprehensive Planand the <strong>Gorst</strong> Subarea Plan;(e) the proposal’s significant adverse environmental impacts have been identified in the <strong>Planned</strong><strong>Action</strong> EIS;(f) the proposal’s significant impacts have been mitigated by application of the measuresidentified in Exhibit B, and other applicable [City] [County] regulations, together with anymodifications or variances or special permits that may be required;(g) the proposal complies with all applicable local, state and/or federal laws and regulations, andthe SEPA Responsible Official determines that these constitute adequate mitigation; and(h) the proposal is not an essential public facility as defined by RCW 36.70A.200(1), unless theessential public facility is accessory to or part of a development that is designated as aplanned action under this ordinance.(2) The [City] [County] shall base its decision on review of a <strong>Planned</strong> <strong>Action</strong> SEPA checklist (Exhibit C),or an alternative form approved by state law, and review of the application and supportingdocumentation.(3) A proposal that meets the criteria of this section shall be considered to qualify and be designated asa planned action, consistent with the requirements of RCW 43.21C.030, WAC 197-11-164 et seq,and this ordinance.F. Effect of <strong>Planned</strong> <strong>Action</strong>.(1) Designation as a <strong>Planned</strong> <strong>Action</strong> Project by the SEPA Responsible Official means that a qualifyingproposal has been reviewed in accordance with this Ordinance and found to be consistent with theJune 2013 5
PLANNED ACTION ORDINANCEdevelopment parameters and thresholds established herein, and with the environmental analysiscontained in the <strong>Planned</strong> <strong>Action</strong> EIS.(2) Upon determination by the [City’s] [County’s] SEPA Responsible Official that the proposal meets thecriteria of Section 4.D and qualifies as a planned action, the proposal shall not require a SEPAthreshold determination, preparation of an EIS, or be subject to further review pursuant to SEPA.G. <strong>Planned</strong> <strong>Action</strong> Permit Process. Applications for planned actions shall be reviewed pursuant to thefollowing process:(1) Development applications shall meet all applicable requirements of the [Bremerton Municipal Code(BMC)] [Kitsap County Code (KCC)]. Applications for planned actions shall be made on formsprovided by the [City] [County] and shall include the <strong>Planned</strong> <strong>Action</strong> SEPA checklist (Exhibit C).(2) The [City’s] [County’s] SEPA Responsible Official shall determine whether the application iscomplete as provided in [BMC XXX/KCC XXX].(3) If the application is for a project within the <strong>Planned</strong> <strong>Action</strong> Area defined in Exhibit A, the applicationwill be reviewed to determine if it is consistent with the criteria of this ordinance and therebyqualifies as a <strong>Planned</strong> <strong>Action</strong> project.(a) The decision of the [City’s] [County’s] SEPA Responsible Official regarding qualification of aproject as a <strong>Planned</strong> <strong>Action</strong> is a Type 1 decision. The SEPA Responsible Official shall notifythe applicant of his/her decision. Notice of the determination shall also be mailed orotherwise verifiably delivered to federal recognized tribal governments and to agencies withjurisdiction over the planned action project, pursuant to Chapter 1, Laws of 2012 (EngrossedSubstitute Senate Bill (ESSB) 6406).(b) If the project is determined to qualify as a <strong>Planned</strong> <strong>Action</strong>, it shall proceed in accordancewith the applicable permit review procedures specified in [BMC XXX/KCC XXX], except thatno SEPA threshold determination, EIS or additional SEPA review shall be required.(c) Notice of the application for a planned action project shall be consistent with [BMC XXX/KCCXXX].(4) If notice is otherwise required for the underlying permit, the notice shall state that the project hasqualified as a <strong>Planned</strong> <strong>Action</strong>. If notice is not otherwise required for the underlying permit, nospecial notice is required by this ordinance.(5) To provide additional certainty about applicable requirements, the [City] [County] or applicant mayrequest consideration and execution of a development agreement for a <strong>Planned</strong> <strong>Action</strong> project,consistent with RCW 36.70B.170 et seq.(6) If a project is determined to not qualify as a <strong>Planned</strong> <strong>Action</strong>, the SEPA Responsible Official shall sonotify the applicant and prescribe a SEPA review procedure consistent with the [City’s] [County’s]SEPA regulations and the requirements of state law. The notice shall describe the elements of theapplication that result in failure to qualify as a <strong>Planned</strong> <strong>Action</strong>.(7) Projects that fail to qualify as <strong>Planned</strong> <strong>Action</strong>s may incorporate or otherwise use relevant elementsof the <strong>Planned</strong> <strong>Action</strong> EIS, as well as other relevant SEPA documents, to meet their SEPArequirements. The SEPA Responsible Official may limit the scope of SEPA review for the nonqualifyingproject to those issues and environmental impacts not previously addressed in the<strong>Planned</strong> <strong>Action</strong> EIS.June 2013 6
PLANNED ACTION ORDINANCESection 5. Monitoring and Review.A. The [City] [County] should monitor the progress of development in the designated <strong>Planned</strong> <strong>Action</strong>area as deemed appropriate to ensure that it is consistent with the assumptions of this ordinance andthe <strong>Planned</strong> <strong>Action</strong> EIS regarding the type and amount of development and associated impacts, and withthe mitigation measures and improvements planned for the <strong>Planned</strong> <strong>Action</strong> Area.B. This <strong>Planned</strong> <strong>Action</strong> Ordinance shall be reviewed by the SEPA Responsible Official no later than fiveyears from its effective date. The review shall determine the continuing relevance of the <strong>Planned</strong> <strong>Action</strong>assumptions and findings with respect to environmental conditions in the <strong>Planned</strong> <strong>Action</strong> area, theimpacts of development, and required mitigation measures. Based upon this review, the [City] [County]may propose amendments to this ordinance and/or may supplement or revise the <strong>Planned</strong> <strong>Action</strong> EIS.Section 6. Conflict. In the event of a conflict between this Ordinance or any mitigation measuresimposed thereto, and any Ordinance or regulation of the [City] [County], the provisions of thisOrdinance shall control, except that the provision of any International Building Code shall supersede.Section 7 Severability. If any one or more sections, subsections, or sentences of this Ordinance are heldto be unconstitutional or invalid such decision shall not affect the validity of the remaining portions ofthis Ordinance and the same shall remain in full force and effect.Section 8. Effective Date. This ordinance shall take effect and be in force ten (10) days after publicationas provided by law.Passed by the [City Council] [Board of County Commissioners], the ___ day of XXX, 2013.[Signatures]June 2013 7
PLANNED ACTION ORDINANCEEXHIBIT APLANNED ACTION AREAJune 2013 8
PLANNED ACTION ORDINANCEEXHIBIT BPLANNED ACTION EIS MITIGATION MEASURESJune 2013 9
PLANNED ACTION ORDINANCEEXHIBIT CPLANNED ACTION MODIFIED SEPA CHECKLISTJune 2013 10
GORST PLANNED ACTION EIS | APPENDICESAppendix CAir Quality GHG Development Reduction Procedures & Sea Level Rise Information
THIS PAGE INTENTIONALLY BLANK
<strong>Gorst</strong> <strong>Planned</strong> <strong>Action</strong> EIS | AppendicesAppendix CDerivation of Development Emission Reduction FactorsVMT and greenhouse gas emission rates generated by vehicle travel associated with the <strong>Gorst</strong> UGA area wereadjusted downward to account for development that will encourage residents and workers to commute optionsother than single-occupancy vehicles. The development reduction factor for each alternative was derived using thescoring system described in the Sacramento Metropolitan Air Quality Management District (SMAQMD) document“Recommended Guidance for Land Use Emission Reductions”, Version 2.5, updated August 15, 2007. Thatdocument presents a wide variety of design features that are typically available for the land use design of anygiven development, and scores the percent reduction in VMT and vehicle emissions by assigning ‘mitigationpoints” to each selected development feature. The numerical value of each “mitigation point” is equivalent to thepercent reduction in VMT and vehicle emissions compared to the base-case land use design. For example, if adeveloper selects a set of development-related features with a cumulative mitigation point total of 10, then it isassumed the VMT and vehicle emissions would be reduced by 10 percent.Note, the development-related mitigation is applied only to emissions generated by vehicle travel. This methoddoes not attempt to evaluate GHG emission reductions from construction materials, electricity usage, spaceheating, or waste reduction.Development Reduction Factor Derivation for AlternativesTable C-1 shows the list of development-related land use features that appear to be inherent in the land use designof the <strong>Gorst</strong> UGA, and shows the mitigation points assigned to each of those land use features. The key featuresthat are believed to be inherent to the <strong>Gorst</strong> UGA are as follows:Bicycle paths within ½ mile, with connection to transit.High mixed-use density close to transit.Residential densityThe combined mitigation points for the above features is 4, so the base-case VMT and transportation-related GHGemissions factors for the action alternatives were reduced by four percent, as applied to the per-dwelling factorsand the per-square-foot factors.Note, for this analysis mitigation points were assigned only to the above land use features that are inherent to theoverall programmatic configuration of the <strong>Gorst</strong> UGA. This analysis did not attempt to predict what other projectspecificdesign features the future developers might build into their facilities, to respond either to encouragementby the City and County or to comply with potential <strong>Gorst</strong>-specific design standards. It is possible the futuredevelopers could incorporate more of SMAQMD’s listed design features into their facilities, in which case theactual overall development-related reductions might be higher than the four percent value derived for this study.C-1
<strong>Gorst</strong> <strong>Planned</strong> <strong>Action</strong> EIS | AppendicesTable C-1Derivation of Development Reduction FactorMitigation Number Description MaximumAchievableReduction Percent4 Bicycle paths within 1/2 mile, withconnection dwellings, business andtransit corridors.Considerations for Assigning Mitigation Values forProposed <strong>Action</strong>1 Alternatives would provide multi-family and mixed usenear bus routes and pedestrian corridors. Bike pathswould likely be provided.AssignedMitigationPercent115 High mixed use density close to transit 2 Alternatives would provide multi-family and mixed usenear bus routes and pedestrian corridors.118 Residential density 12 Alternatives would provide multi-family and mixed usenear bus routes and pedestrian corridors.2Total Assigned Mitigation 4Source: The Sacramento Metropolitan Air Quality Management District (SMAQMD),“Recommended Guidance for Land Use Emission Reductions”, Version 2.5, updatedJanuary 12, 2010C-2
<strong>Gorst</strong> <strong>Planned</strong> <strong>Action</strong> EIS | AppendicesSea Level Rise ImagesAs noted in Section 3.3 Air Quality analysis of the <strong>Draft</strong> EIS, by themselves, none of the <strong>Gorst</strong> alternatives studiedwould cause discernible changes to global climate change. However, increased worldwide GHG emissions areexpected to cause global climate change, and the effects will likely impact the <strong>Gorst</strong> study area and the PacificNorthwest region. Local impacts are expected to include changes in seasonal temperatures, seasonal precipitationpatterns, or local seawater rise (UW CIG 2012). Based on research conducted by the University of WashingtonClimate <strong>Impact</strong>s Group and the Washington Department of Ecology sea level is expected to rise within the PugetSound between 3 and 22 inches by 2050 and between 6 and 50 inches by 2100 (UWCIG, et al 2008).The images below show sea level rise extent at 12-inch intervals at high tide in Sinclair Inlet based upon the SeaLevel Rise and Coastal Flooding <strong>Impact</strong>s Viewer, available at the following link:http://www.csc.noaa.gov/digitalcoast/tools/slrviewer/. As described on the website it is considered a planninglevel screening tool and not an exact analysis:“The purpose of this data viewer is to provide coastal managers and scientists with a preliminarylook at sea level rise and coastal flooding impacts. The viewer is a screening-level tool that usesnationally consistent data sets and analyses. Data and maps provided can be used at severalscales to help gauge trends and prioritize actions for different scenarios.Disclaimer: The data and maps in this tool illustrate the scale of potential flooding, not the exactlocation, and do not account for erosion, subsidence, or future construction. Water levels areshown as they would appear during the highest high tides (excludes wind driven tides). The data,maps, and information provided should be used only as a screening-level tool for managementdecisions. As with all remotely sensed data, all features should be verified with a site visit. Thedata and maps in this tool are provided “as is,” without warranty to their performance,merchantable state, or fitness for any particular purpose. The entire risk associated with theresults and performance of these data is assumed by the user. This tool should be used strictly asa planning reference tool and not for navigation, permitting, or other legal purposes.”The images can be compared to the range of sea level rise in Puget Sound estimated by the University ofWashington, though it should be noted the University’s study was not specific to Sinclair Inlet. Images 1 and 2 show 1 and 2 foot rises, closer to the University’s low range estimate of 3 and 22 inches by2050. Images 3 and 4 show rises of 3 and 4 feet, similar to the middle and upper end of the University’s higher rangeestimate of 6 and 50 inches by 2100. Image 5 shows 5 feet (or 60 inches) of rise and would be higher than the University’s most extreme range of50 inches by 2100.If such levels of rise were experienced at the Sinclair inlet, at the low end of the range, the effects appear to beabsorbed by tidal wetlands. As levels increase, sea level rise could begin to affect developed areas of Sinclair Inlet.In addition, flooding in low lying areas would increase further upstream on <strong>Gorst</strong> Creek on the northern (uphill)side of Highway 3..C-3
<strong>Gorst</strong> <strong>Planned</strong> <strong>Action</strong> EIS | AppendicesImage 0. Current Conditions – High Tidehttp://www.csc.noaa.gov/slr/viewer/index.html?ll=-13658169.196796;6028798.776015&level=11&basemap=null&CurTab=0&CurSLR=0Image 1. 12-inch (1 foot) Rise at High Tidehttp://www.csc.noaa.gov/slr/viewer/index.html?ll=-13658169.196796;6028798.776016&level=11&basemap=null&CurTab=0&CurSLR=1C-4
<strong>Gorst</strong> <strong>Planned</strong> <strong>Action</strong> EIS | AppendicesImage 2. 24-inch (2 feet) Rise at High Tidehttp://www.csc.noaa.gov/slr/viewer/index.html?ll=-13658169.196796;6028798.776015&level=11&basemap=null&CurTab=0&CurSLR=2Image 3. 36-inch (3 feet) Rise at High Tidehttp://www.csc.noaa.gov/slr/viewer/index.html?ll=-13658169.196796;6028798.776015&level=11&basemap=null&CurTab=0&CurSLR=3C-5
<strong>Gorst</strong> <strong>Planned</strong> <strong>Action</strong> EIS | AppendicesImage 4. 48-inch (4 foot) Rise at High Tidehttp://www.csc.noaa.gov/slr/viewer/index.html?ll=-13658169.196796;6028798.776015&level=11&basemap=null&CurTab=0&CurSLR=4Image 5. 60-inch (5 foot) Rise at High Tidehttp://www.csc.noaa.gov/slr/viewer/index.html?ll=-13658169.196796;6028798.776015&level=11&basemap=null&CurTab=0&CurSLR=5C-6
GORST PLANNED ACTION EIS | APPENDICESAppendix DShoreline Buffer Comparison and Options
THIS PAGE INTENTIONALLY BLANK
GORST PLANNED ACTION EIS | APPENDICESAppendix D.Shoreline Buffer Comparison and OptionsIntroductionKitsap County and the City of Bremerton regulate shorelines such as Sinclair Inlet and <strong>Gorst</strong> Creek. The County andCity also regulate critical areas such as wetlands, fish and wildlife conservation areas, aquifer recharge areas,geologic hazard areas, and flood hazard areas. Generally, the County and City regulations are similar except along<strong>Gorst</strong> Creek and Sinclair Inlet. County buffer regulations are greater along <strong>Gorst</strong> Creek while City buffer regulationsare greater along Sinclair Inlet.The <strong>Draft</strong> Watershed Characterization & Framework Plan and <strong>Draft</strong> <strong>Gorst</strong> Subarea Plan include a proposed policyrecommending compatible and equivalent environmental standards:Policy WS-2. Coordinate County and City shoreline and critical area regulations in the <strong>Gorst</strong>Creek Watershed to provide adequate and equivalent protection.Policy UGA-3. Coordinate County and City shoreline regulations and restoration plans along<strong>Gorst</strong> Creek and Sinclair Inlet to provide adequate and equivalent protection.Following a comparison of standards and background information, options to standardize regulations areevaluated in this appendix.Shoreline Environment and Buffer ComparisonsShorelines subject to the Shoreline Management Act of 1971 include the marine waters of Puget Sound as well asrivers and streams with a mean annual flow over 20 cubic feet per second (cfs). Shorelines include uplands within200 feet of the ordinary high water mark and associated wetlands, and floodways. In the study area, the SinclairInlet marine shoreline and <strong>Gorst</strong> Creek are subject to the Shoreline Management Act (RCW 90.58).Consistent with the Shoreline Management Act, both the County and City of Bremerton have adopted ShorelineMaster Programs for lower <strong>Gorst</strong> Creek and the Sinclair Inlet, and are awaiting Ecology approval.City of Bremerton proposed shoreline designations include Urban Conservancy in the inner marine shoreline along the water Commercial or Isolated in the outer marine shoreline area in largely developed areas Aquatic Conservancy applied to the Marine waters (not mapped below) Single Family, Recreation, and Urban Conservancy along <strong>Gorst</strong> CreekKitsap County proposes a similar shoreline environment approach as the City of Bremerton, except that the fullmarine shoreline north of the SR 3 and SR 16 interchange is shown as High Intensity. South of the interchange, themarine shoreline would be classified as Urban Conservancy in the inner jurisdiction along the water and HighIntensity in the outer jurisdictional area. <strong>Gorst</strong> Creek would be classified as High Intensity and Urban Conservancy.Figure D--1 Comparison of Shoreline Designations compares the two sets of shoreline environment designations.D-1
GORST PLANNED ACTION EIS | APPENDICESFigure D-1. Comparison of Shoreline DesignationsD-2
GORST PLANNED ACTION EIS | APPENDICESKitsap County’s shoreline regulations would apply until such time as the <strong>Gorst</strong> UGA is annexed. The City ofBremerton’s shoreline buffer standards for the Sinclair inlet are greater than the County’s, and the County’s bufferstandards for <strong>Gorst</strong> Creek are greater than the City of Bremerton’s. See Table D-1 Bremerton and Kitsap CountyShoreline, Stream, and Wetland Buffer Comparison.Note:Table D-1Bremerton and Kitsap County Shoreline, Stream, and Wetland Buffer ComparisonCity of BremertonStandardBuffer (ft)ReducedBuffer (ft)Setback(ft) Kitsap CountyStandardBuffer (ft)ReducedBuffer (ft)Setback(ft)Bremerton Shorelines: ProposedKitsap County Shorelines: ProposedFreshwaterFreshwaterCommercial 50 15Can reduce20-30% ofAdmnistrativeif lot depthSF Residentiallot depth 5-15Streams 200 Reductionsis less thanRecreation 100 15with Criteria150 ft.Urban Conservancy 175 15or Variance.15MarineMarineIsolated 0 15Same asCommercial 50 15 High Intensity 50 Variance 15FreshwaterUrban Conservancy 175 15 Urban Conservancy 100 85 15Bremerton Critical Areas Regulations: ExistingKitsap County Critical Areas Regulations: ExistingStreamsF 150 15 F 150 25-50% with a 15Allowed ifNp 50 15 Np 50 habitat mgmt 15enhanced.Ns 35 15 Ns 50 plan. 15WetlandsCategory I 200 0 Category I 200 Averaging or 15Category II 100 0 Category II 100 admin 15AveragingCategory III 75 0 Category III 50 reduction with 15Category IV 50 0 Category IV 30 criteria. 15With the City proposed Shoreline Master Program, when there are parallel shoreline designations, the buffer ismeasured from the ordinary high water mark to the width of the buffer requirement or the edge of the environmentdesignation, whichever is less.The estimated depth of lots in Bremerton’s Single Family Residential Environment Designation ranges from 100 to 500feet. The minimum buffer depth by percentage is 20% where lot depth is less than 200 feet, and 30% for lot depthsgreater than 200 feet. The maximum buffer is 100 feet,Source: BMC and City of Bremerton Council Review <strong>Draft</strong> Shoreline Master Program; Kitsap County Code and Kitsap CountyPlanning Commission Review <strong>Draft</strong> Shoreline Master Program; BERK 2012.Shoreline Master Program Cumulative <strong>Impact</strong>s AnalysisBoth the City and County proposed Shoreline Master Programs were developed with a cumulative impactsanalysis. In both cases, the <strong>Gorst</strong> shorelines were found to be degraded though the estuary was found to bevaluable habitat. The City and County cumulative impacts analyses both found that application of each set ofShoreline Master Program regulations would achieve no-net-loss of ecological function.Kitsap County’s conclusions regarding <strong>Gorst</strong> marine and freshwater shorelines included:Kitsap County Cumulative <strong>Impact</strong>s Analysis, January 2013, page 93, High Intensity Environment:Development of underutilized or undeveloped commercial parcels on the shoreline in <strong>Gorst</strong> isgenerally encumbered by wetland buffers. Where existing commercial structures are relocated orexpanded, restoration or mitigation would be required under the proposed SMP. Furtherdevelopment potential exists away from the shoreline and west of Highway 3. In this case,D-3
GORST PLANNED ACTION EIS | APPENDICESdevelopment would have little impact on shoreline hydrologic or vegetative functions. Waterquality functions would further be maintained though stormwater standards that require onsiteinfiltration for any development with new impervious surfaces over 2,000 square feet or clearingof areas greater than 7,000 square feet. In summary, no loss of ecosystem functions is anticipatedin the <strong>Gorst</strong> UGA.Kitsap County Cumulative <strong>Impact</strong>s Analysis, January 2013, pages 76 and 77, Urban Conservancy:In the <strong>Gorst</strong> UGA, development along the marine shoreline is limited to commercial developmentof vacant and underdeveloped parcels. In addition to standard shoreline vegetation conservationbuffers, buffers associated with salt marsh wetland areas in the <strong>Gorst</strong> UGA limit potentialcommercial development along Sinclair Inlet. If commercial structures are expanded or relocatedduring redevelopment, the SMP will require mitigation. Furthermore, any development with newimpervious surfaces over 2,000 square feet or clearing of areas greater than 7,000 square feetwill need to employ best management practices to infiltrate groundwater onsite. This will helpensure that existing water quality is not further degraded in the area.Streams and Rivers, page 104: The proposed standard buffer of 200 feet for all shorelinefreshwater streams and rivers will ensure that existing stream functions are maintained, and thebuffer will limit most development along streams to the area outside of shoreline jurisdiction.Where future development of residential units along streams is indicated in Section 4 (Table 4-1),these figures are indicative of potential development outside of jurisdiction on lots that partiallyextend within jurisdiction. Significant restoration is planned and underway in the streams andrivers of Kitsap County. Near-term restoration efforts will be focused on restoring fish passageand improving stream habitat on Chico Creek and Burley Creek. Additionally, efforts to reduceagricultural impacts on water quality in Burley Creek are ongoing. In the longer term, efforts willfocus on a balance of protecting intact functions and restoring functions and processes wherethey are impaired. Long-term restoration will include floodplain restoration, enhancing channelcomplexity, improving water quality, and restoring fish passage.The City of Bremerton’s Cumulative <strong>Impact</strong>s Analysis (February 2012) included a reach by reach analysis thatindicated:Page 2-14: <strong>Gorst</strong> Estuary is the largest estuary in the planning area and provides significantshoreline functions to Sinclair Inlet and Puget Sound. The estuary receives freshwater flows from<strong>Gorst</strong> Creek, as well as several small independent drainages nearby. Tributary streams support avariety of species including coho, chum, cutthroat, and steelhead. <strong>Gorst</strong> Estuary itself is shallow,with fringing marshes and mud flats that provide excellent production of prey for salmonids.Biological resources in the estuary include waterfowl concentrations at the mouth and along thenorth and south shorelines of Sinclair Inlet, as well as shorebird concentrations along the northshore. The majority of the north side of the inlet is bounded by State Route (SR) 2 and the U.S.Navy railroad and is not expected to change. There are extensive areas of commercialdevelopment generally south of <strong>Gorst</strong> Creek that are subject to redevelopment in the future.Because non–water–dependent development is likely, and such development requires shorelinerestoration and public access, buffer areas are likely to be augmented. On <strong>Gorst</strong> Creek, thecommercially zoned area between the inlet and Sam Christopherson Road are low intensity and islikely to be redeveloped in the future. This area could provide stream buffers and incorporateshoreline restoration as a non–water–dependent use. Between Sam Christopherson Road andWest Belfair Valley Road, the residential and urban restricted area can be expected to experiencemore intensive future development and provide standard stream buffers.D-4
GORST PLANNED ACTION EIS | APPENDICESFurther in Bremerton’s Cumulative <strong>Impact</strong>s Analysis, for each reach, the application of the proposed standards(buffers, vegetation conservation, mitigation sequencing, and more) found either “no change or positive change inecological functions.”Watershed Characterization AssessmentThe <strong>Gorst</strong> Creek Watershed Characterization Study completed in 2012 analyzes existing conditions of thewatershed with respect to water flow and habitat. Watershed characterization, an analytical framework developedby Ecology, provides the basis for understanding the relative value of assessment units for water flow processes,water quality, and habitat within the <strong>Gorst</strong> Creek Watershed (Puget Sound Characterization, Stanley et al, inpreparation, Ecology Publication #11-06-016 April 16, 2012).Based on assessment results for individual water flow components (delivery, storage, recharge, and discharge) andsediment process, as well as habit functions, assessment units (AUs) were grouped into patterns that identifyzones for restoration, protection, and development.Figure D-2 provides a close up view of the watershed AUs in the <strong>Gorst</strong> UGA. The <strong>Gorst</strong> UGA is generallyrecommended for “Development” in Assessment Unit (AU) 15, though to the west is area of “Restoration” in AU 9.Also a small area to the southwest is recommended for “Development and Restoration” in AU 3.The recommendations of the Watershed Characterization Study relevant to the <strong>Gorst</strong> UGA include: Area of Development (AU 15): Relatively high level of degradation and low habitat score; more appropriatearea for higher density development provided measures are applied to reduce potential sediment export. Area of Restoration (AU 9): Though this area has a low score for habitat and salmon refugia, it is a higherpriority for restoration due to generally intact upstream processes (northern half of watershed).Channelization, culverts, and reduced riparian cover have degraded stream corridor and discharge processes.A comprehensive program to restore creek corridor should be developed. Effective Impervious surface shouldbe reduced through a stormwater retrofit program. Area of Development & Restoration (AU 3): Relatively high level of degradation. Not rated by salmon refugiastudy. More appropriate area for moderate density development provided measures are implemented toreduce erosion and sediment export (adequate stream buffers, setbacks, reduced overland flow throughinfiltration and vegetation cover).Measures to reduce sediment export including buffers, setbacks, infiltration and vegetation cover are generallyrecommended in each AU, and areas in the western UGA along <strong>Gorst</strong> Creek are recommended for restoration.D-5
GORST PLANNED ACTION EIS | APPENDICESFigure D-2. Watershed Characterization Results – <strong>Gorst</strong> UGA<strong>Gorst</strong> Creek – Development Adjacent to ShorelineBased on the Shoreline Master Program Cumulative <strong>Impact</strong>s Analysis, and the Watershed Characterization Study,<strong>Gorst</strong> Creek possesses some important ecological functions but is also degraded. As seen in Figure D-3, there areexisting structures in the buffer areas particularly in the area along SR-3.D-6
GORST PLANNED ACTION EIS | APPENDICESFigure D-3. <strong>Gorst</strong> UGA: Creek and Shoreline Buffers in IncrementsBuffer Standardization OptionsThe <strong>Draft</strong> Watershed Characterization & Framework Plan and <strong>Draft</strong> <strong>Gorst</strong> Subarea Plan include a proposed policyrecommending compatible and equivalent environmental standards, particularly regarding <strong>Gorst</strong> Creek:Policy WS-2. Coordinate County and City shoreline and critical area regulations in the <strong>Gorst</strong>Creek Watershed to provide adequate and equivalent protection.Policy UGA-3. Coordinate County and City shoreline regulations and restoration plans along<strong>Gorst</strong> Creek and Sinclair Inlet to provide adequate and equivalent protection.Options to standardize regulations are evaluated in this appendix and include:A. Apply City shoreline regulations in locally adopted Shoreline Master ProgramB. Apply County shoreline regulations in locally adopted Shoreline Master ProgramC. Apply modified County shoreline regulations (would require Ecology review)D. Apply a series of management zones addressing vegetation conservation, impervious surface allowances andstructure allowances that are an overlay “on top of” either the City or the County shoreline regulationsA description of each option is provided in Table D-2.D-7
GORST PLANNED ACTION EIS | APPENDICESTable D-2. Potential Options to Standardize <strong>Gorst</strong> Creek Buffers in <strong>Gorst</strong> UGAOption / DescriptionDiscussionA. City SMP buffers50 foot buffer would apply in areasdesignated as Commercial.Areas designated as Single FamilyResidential would have a buffer based ontheir lot depth at either 20% or 30%,B. County SMP buffers200 foot buffer standard along all streamreachesC. Modified County SMP buffersApply buffers based on shorelineenvironment50 feet High Intensity100 feet Urban ConservancyD. Management Zone OverlaySee Table D-30-50 feet: focus on habitat retention andenhancement with limited trails50-85 feet: Allow small percentage ofimpervious or semi-pervious materials ifgreater enhancement in 0-50 foot area or ifstream restoration occurs.85-100 feet: Allow more impervious area ifgreater enhancement in 0-50 foot area or ifstream restoration occursFor the areas east of Sam Christopherson Road, this 50-foot buffer wouldrecognize the current development patterns where much area along thecreek is devoted to impervious area and structures.For the areas west of Sam Christopherson Road, designated for Single FamilyResidential, the buffers would be based on depth of the lot, to both protectthe immediate riparian area and allow use of the parcel for development;vegetation conservation and water quality standards would also apply.This appears to be an area identified for Restoration in the WatershedCharacterization Study.This buffer standard would treat all areas of the creek the same, regardlessof current conditions.Areas within the 200 foot buffer area (see Figure D-3) would need to applyspecial criteria for buffer reductions in Proposed SMP Section 5.5.3Constrained Lot and Infill Provisions. In some cases a variance may berequired and in other cases administrative approval is required. However,this overall approach could spur enhancement where some bufferreductions are granted with criteria; also, growth could occur more slowlygiven combination of regulations and site constraints.This buffer standard would recognize <strong>Gorst</strong> Creek as a different stream thanother shoreline streams in the County which tend to be in rural areas.The modified buffers would match Kitsap County’s buffers applied to specificshoreline environments rather than a single number.The modified buffers are similar to the City’s Commercial buffer and greaterthan (though more comparable to) the City’s Single Family ResidentialBuffer.The proposal would apply a series of management zones that have variablelevels of vegetation conservation, impervious allowances and structureallowances.The standards to retain vegetation and reduce erosion, minimize imperviousareas and structures, and incentivize restoration are based on theWatershed Characterization Study, and some of the buffer mitigationstandards in Kitsap County’s proposed Shoreline Master Program AppendixB.The distances of the management zones are related to the mean setback forshoreline streams and rivers (~78 feet) documented in the Kitsap CountyCumulative <strong>Impact</strong>s Analysis developed January 2013. The distances are alsobased on the buffer science and average distances in the “TechnicalMemorandum for Proposed Kitsap County SMP Buffers” prepared by KitsapCounty, January 2012 (which focuses on marine shorelines but providesscientific literature for both freshwater and marine shorelines).Table D-3, <strong>Gorst</strong> Creek Management Zones, provides more information on Option D. With this option, morealteration could occur in outer management zones than in inner management zones provided there isenhancement or stream restoration in inner management zones. These management zones could overlay on topof SMP buffers; the management zone approach would be most compatible in combination with Options A and C,but could work with Option B if administrative flexibility is offered to apply the standards.D-8
GORST PLANNED ACTION EIS | APPENDICESTable D-3. <strong>Gorst</strong> Creek Management Zones – Preliminary ApproachManagement Zone Habitat Standards Impervious SurfaceAllowancesStructure AllowancesA: 0-50 feet upland ofOHWMA-1: Retain significant native trees,shrubs, and ground cover consistentwith shoreline master program,critical area, and landscaperegulations.A-2: In exchange for impervioussurface allowances, enhancedegraded areas of ManagementZone A, as follows: Enhance at a 2:1ratio the equivalent of the clearedarea with native vegetation orremove man-made structures instream.1A-3: If existing impervious area of anequivalent or greater area isremoved from Management Zone A,enhance degraded areas ofManagement Zone A, as follows:Enhance at a 1:1 ratio theequivalent of the cleared area withnative vegetation, or remove manmadestructures in stream at aminimum of 50% of property’s linealfeet of shoreline frontage based onan approved habitat managementplan.1Installation of pervious or semipervioussurfaces such as non-solidsurface decks or greeninfrastructure in place of existinglawn or other non-nativevegetation. The area of suchsurfaces shall not be greater than25% of Management Zone A area,and shall meet Type A-2 or A-3habitat standards.Perpendicular trails constructed ofpermeable materials and nogreater in travel way width than 6feet subject to Type A-2 or A-3habitat standards.No new structures withpermanent foundations areallowed.B: 50-85 feet upland ofOHWMB-1: Same as A-1.B-2: In exchange for impervioussurface allowances, enhancedegraded areas in ManagementZone A, as follows: Enhance at a 1:1ratio the equivalent of the clearedarea with native vegetation orremove man-made structures instream. 1B-3: In exchange for structureallowances, achieve both of thefollowing:i. Plant significant native trees toachieve 65% coverage ofManagement Zone A Area. 1ii. Enhance Management Zone B:Enhance at a 2:1 ratio theequivalent of the cleared area withnative vegetation or remove manmadestructures in stream orremove man-made structures instream at a minimum of 50% ofproperty’s lineal feet of shorelinefrontage based on an approvedhabitat management plan.1Installation of pervious or semipervioussurfaces such as non-solidsurface decks or greeninfrastructure in place of existinglawn or other non-nativevegetation, and when meeting B-2habitat standards. Or placement ofimpervious surfaces that complywith all storm water standards andHabitat Standards B-3. Themaximum impervious surfaceallowance by itself shall notexceed 25% of Management ZoneB area. In combination, imperviousand structural allowances shall notexceed 35% of Management ZoneB area.Trails, parallel or perpendicular,constructed of permeablematerials and no greater in travelway width than 6 feet subject toHabitat Standard B-2.None with Type B-1vegetation standards.Structures allowed in up to25% of Management Zone Bif meeting Type B-3 habitatstandards. Except that themaximum impervioussurface allowance andstructural allowance shallnot exceed 35% incombination.D-9
GORST PLANNED ACTION EIS | APPENDICESManagement Zone Habitat Standards Impervious SurfaceAllowancesStructure AllowancesC: 85-100 feet uplandof OHWMC-1: Same as A-1.C-2: Same as B-2. 1C-3: Same as B-3. 1Installation of impervious surfacesor infrastructure. The maximumimpervious surface allowance byitself shall not exceed 50% ofManagement Zone C area andshall meet Habitat Standard C-2. Incombination, impervious andstructural allowances shall notexceed 65% of Management ZoneC area.Trails improved or unimproved.None with Type C-1vegetation standards.Structures allowed in up to50% of Management Zone Bif meeting Type C-3vegetation standards. Incombination, imperviousand structural allowancesshall not exceed 65% ofManagement Zone C area.1 Vegetation shall be planted in this order of preference: 1) native coniferous trees; 2) native deciduous trees; 3) other nativevegetation; 4) non-native trees; and 5) other non-native vegetation. Trees and shrubs may be placed in natural groups to allowfor view preservation and trails.D-10