
Create successful ePaper yourself
Turn your PDF publications into a flip-book with our unique Google optimized e-Paper software.
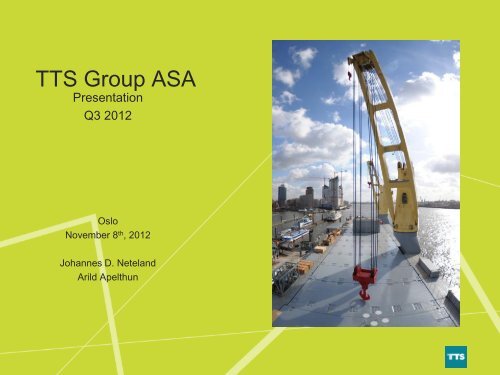
<strong>TTS</strong> <strong>Group</strong> <strong>ASA</strong><br />
Presentation<br />
Q3 2012<br />
Oslo<br />
November 8 th , 2012<br />
Johannes D. Neteland<br />
Arild Apelthun
Agenda<br />
• 3 rd quarter headlines<br />
• Order intake and order backlog<br />
• Business segments<br />
• Market development<br />
• 3 rd quarter consolidated accounts<br />
• Shareholder structure<br />
• Summary<br />
2
Agenda<br />
• 3 rd quarter headlines<br />
3
<strong>TTS</strong> <strong>Group</strong> <strong>ASA</strong><br />
3 rd quarter 2012 Summary<br />
• <strong>TTS</strong> finalized the sale of the Drilling Equipment unit and recorded an additional MNOK 120 gain, ending<br />
at a total gain of MNOK 420. The finalization had a limited cash effect.<br />
• All numbers and comments presented are related to continuing business unless otherwise stated.<br />
• Earnings per share in the 3 rd quarter was NOK 1.46. For continued business EPS was NOK 0.12.<br />
• <strong>Turnover</strong> is MNOK 481 in the 3 rd quarter, part of the decline is due to restructuring of Joint Ventures.<br />
• <strong>EBITDA</strong> for 3 rd quarter was MNOK 39, slightly down from the same period in 2011 due to lower activity<br />
in Service and Deck Equipment. Improved margins because of improved earnings in Cargo Access and<br />
Joint Ventures.<br />
• Order intake during the quarter was MNOK 501 reflecting lower activity in the market for Deck<br />
equipment. However, high contracting activity relating to car carriers and other specialized vessels<br />
represents the majority of the order intake.<br />
• Order backlog at end of 3 rd quarter was MNOK 3 179, in line with 3 rd quarter 2011, but included the<br />
order backlog from NMF.<br />
• The General Assembly resolved to pay a dividend of NOK 1.56 per share and repayment of share<br />
capital of NOK 4.21 per share. The dividends were paid during 3 rd quarter while the repayment was<br />
done November 6 th .<br />
• <strong>TTS</strong> finalized the acquisition of Neuenfelder Machinenfabrik GmbH (NMF) on the 20 th of August 2012.<br />
NMF figures have been included in Marine division from this date and had a minor positive effect on the<br />
<strong>EBITDA</strong> in 3 rd quarter.<br />
4
Agenda<br />
• 3 rd quarter headlines<br />
• Order intake and order backlog<br />
5
<strong>TTS</strong> <strong>Group</strong> <strong>ASA</strong><br />
<strong>Turnover</strong> and <strong>EBITDA</strong> – 3 rd quarter<br />
6<br />
<strong>Turnover</strong><br />
800<br />
700<br />
600<br />
500<br />
400<br />
300<br />
200<br />
100<br />
0<br />
481<br />
603<br />
Q3 2012 Q3 2011<br />
<strong>EBITDA</strong><br />
MNOK MNOK<br />
45<br />
40<br />
35<br />
30<br />
25<br />
20<br />
15<br />
10<br />
5<br />
0<br />
38,9<br />
40,2<br />
Q2 2012 Q2 2011<br />
<strong>EBITDA</strong> margin 8,1% 6,7%
<strong>TTS</strong> <strong>Group</strong> <strong>ASA</strong><br />
Historical turnover development 2000 - 2011<br />
MNOK<br />
7<br />
3 500<br />
3 000<br />
2 500<br />
2 000<br />
1 500<br />
1 000<br />
500<br />
0<br />
00 01 02 03 04 05 06 07 08 09 10 11<br />
Offshore Handling<br />
Equipment<br />
Marine<br />
Port & Logistics
<strong>TTS</strong> <strong>Group</strong> <strong>ASA</strong><br />
Order intake<br />
MNOK<br />
8<br />
1 000<br />
MNOK<br />
800<br />
600<br />
400<br />
200<br />
0<br />
646<br />
839<br />
664<br />
Q3 2011 Q4 2011 Q1 2012 Q2 2012 Q3 2012<br />
485<br />
501
<strong>TTS</strong> <strong>Group</strong> <strong>ASA</strong><br />
Order Backlog Q3 2012<br />
Order intake<br />
and backlog<br />
Q3 2012<br />
Following the uncertain market outlook in<br />
Deck Equipment, <strong>TTS</strong> has reviewed its<br />
backlog. The MNOK 225 cancellation<br />
represents postponed orders recorded in<br />
2008/2009. The cancellation does not have<br />
financial effects for <strong>TTS</strong>.<br />
Order<br />
backlog per<br />
Q3 2012<br />
By year of<br />
delivery<br />
9<br />
MNOK<br />
MNOK<br />
MNOK Q3 2012 Backlog*<br />
2 400<br />
1 600<br />
800<br />
0<br />
Order-<br />
intake<br />
898<br />
Cancelled Q3 2012 Q2 2012<br />
Marine 417 225 2 774 2 437<br />
P&L 71 204 175<br />
OHE 13 202 257<br />
Total 501 225 3 179 2 869<br />
*Order reserve includes 50% of Joint Ventures.<br />
2 017<br />
264<br />
2012 2013 2014+
<strong>TTS</strong> <strong>Group</strong> <strong>ASA</strong><br />
Order cancellation Q1 2010 – Q3 2012<br />
MNOK<br />
10<br />
250<br />
200<br />
150<br />
100<br />
50<br />
0<br />
68<br />
73<br />
125<br />
178<br />
11<br />
19<br />
0<br />
64<br />
8,5 5,7<br />
Q1 10 Q2 10 Q3 10 Q4 10 Q1 11 Q2 11 Q3 11 Q4 11 Q1 12 Q2 12 Q3 12<br />
225
<strong>TTS</strong> <strong>Group</strong> <strong>ASA</strong><br />
Order backlog* – per 30.09.2012<br />
11<br />
MNOK<br />
3 500<br />
3 000<br />
2 500<br />
2 000<br />
1 500<br />
1 000<br />
500<br />
0<br />
2 774 2 723<br />
202<br />
204<br />
3 179<br />
279<br />
119<br />
3 121<br />
30.09.2012 30.09.2011<br />
Marine<br />
Offshore Handling Equipment<br />
Port & Logistics<br />
<strong>TTS</strong> <strong>Group</strong><br />
*Order reserve includes 50% of JV<br />
*NMF included 3Q 2012
<strong>TTS</strong> <strong>Group</strong> <strong>ASA</strong><br />
Order backlog* by division Q3 2008 – Q3 2012<br />
MNOK<br />
12<br />
9 000<br />
7 500<br />
6 000<br />
4 500<br />
3 000<br />
1 500<br />
0<br />
Marine<br />
Port and Logistics<br />
Offshore Handling<br />
Euqipment<br />
Total<br />
*Order reserve includes<br />
50% of Joint Ventures.
Agenda<br />
• 3 rd quarter headlines<br />
• Order intake and order backlog<br />
• Business segments<br />
13
Marine<br />
RoRo equipment, Hatch Covers, Side Doors, Cruise and Mega Yachts.<br />
Winches and Deck Equipment, Cranes and Davits for ships.<br />
• High contracting activity relating to car carriers and<br />
other specialized vessels represents the majority of<br />
the order intake this quarter.<br />
• The backlog is up from last quarter and last year<br />
mainly due to the inclusion of NMF. Due to the<br />
prevailing market conditions for Deck Equipment,<br />
<strong>TTS</strong> has reduced the order backlog with MNOK 225<br />
for the Marine Division in the 3rd quarter.<br />
• Low activity and difficult market for Services and<br />
Deck Equipment are partly offset by improved activity<br />
within Cargo Access.<br />
• The market for equipment to Reefer vessels is<br />
showing signs of improvement and <strong>TTS</strong> secured a<br />
contract for equipment to 4 vessels in early<br />
November.<br />
• Change in Joint Ventures structure affecting reported<br />
turnover but not activity level. Activity and earnings in<br />
Joint Ventures in China remain high.<br />
• Inclusion of NMF was finalized on August 20 th , and<br />
expands <strong>TTS</strong> product offering and position in the<br />
Marine crane market.<br />
14
<strong>TTS</strong> Joint Venture operations in China<br />
• Joint Ventures are recognized in the financial<br />
statements according to the equity method. <strong>TTS</strong><br />
<strong>Group</strong> includes only its share (50%) of profit after<br />
tax in financial reports.<br />
• <strong>Turnover</strong> in Joint Ventures in 2011 exceeded NOK<br />
1 Billion.<br />
• Increased turnover also in Q3 2012.<br />
• A weak market for bulkers lead to lower order<br />
intake and some cancellations in the quarter.<br />
• Still solid order backlog.<br />
15<br />
Numbers are on a 100% basis and in MNOK.
Port and Logistics<br />
Equipment for Shipyards, Terminals and Industry.<br />
• Low activity and low backlog at the start of the<br />
year still affects earnings.<br />
• Backlog for the period has increased<br />
significantly from 3 rd quarter 2011 and<br />
previous quarters. The main reason for the<br />
improvement relate to ship lift contracts<br />
secured in the quarter.<br />
• Revenue is in line with the same period last<br />
year. The loss in 3 rd quarter relates to low<br />
activity within the port division in 2012.<br />
• Due to weak market conditions, development<br />
cost of approx. MNOK 22 related to<br />
automation of port equipment written off in the<br />
3 rd quarter.<br />
• While investment activity in North Europe<br />
remains at a relatively low level for port<br />
business, there are still opportunities in this<br />
market.<br />
16
Offshore Handling Equipment<br />
Drillship, rig, cranes, winches, gripper, AHTS and OSV segments<br />
• Well positioned to take advantage of the<br />
active offshore market.<br />
• Improved order intake in the quarter relates<br />
17<br />
to offshore cranes.<br />
• Higher activity compared to 2011 explains<br />
the improved earnings. The change relate<br />
to better margins on ongoing projects.<br />
• Several major projects ongoing.<br />
• Positive market outlook due to a strong rig<br />
and drill ships market, with a continuous<br />
trend of more sophisticated vessels,<br />
requiring heavier and larger equipment in<br />
deeper waters.
Agenda<br />
• 3 rd quarter headlines<br />
• Order intake and order backlog<br />
• Business segments<br />
• Market development<br />
18
World fleet outlook<br />
Number of new ship orders<br />
19
World fleet outlook<br />
Orders, deliveries and removals of ships<br />
20
Outlook Offshore Vessels<br />
Global demand 2010 - 2016<br />
21
Agenda<br />
• 3 rd quarter headlines<br />
• Order intake and order backlog<br />
• Business segments<br />
• Market development<br />
• 3 rd quarter consolidated accounts<br />
22
<strong>TTS</strong> <strong>Group</strong> <strong>ASA</strong><br />
Profit and loss statement<br />
23<br />
Year<br />
MNOK 2012 2011 2012 2011 2011<br />
<strong>Turnover</strong><br />
<strong>EBITDA</strong><br />
Operating profit<br />
Net financial items<br />
Profit/loss before tax<br />
3. quarter Per 3. quarter<br />
481 603 1 560 1 993 2 594<br />
39 40 122 93 171<br />
10 32 82 74 144<br />
-8 -12 -54 -43 -74<br />
2 21 28 30 71<br />
Net result continued business 10 15 36 8 38<br />
Net result divested business 112 3 418 0 -15
<strong>TTS</strong> <strong>Group</strong> <strong>ASA</strong><br />
<strong>Turnover</strong> as per 30.09.2012<br />
24<br />
MNOK<br />
2 200<br />
2 000<br />
1 800<br />
1 600<br />
1 400<br />
1 200<br />
1 000<br />
800<br />
600<br />
400<br />
200<br />
0<br />
1 260<br />
1 560<br />
1 685<br />
204 187<br />
96 131<br />
Q3 2012 Q3 2011<br />
1 993<br />
Marine<br />
Offshore Handling<br />
Equipment<br />
Port & Logistics<br />
<strong>TTS</strong> <strong>Group</strong>
<strong>TTS</strong> <strong>Group</strong> <strong>ASA</strong><br />
<strong>EBITDA</strong> as per 30.09.2012<br />
25<br />
175 Marine<br />
155<br />
135<br />
115<br />
95<br />
75<br />
55<br />
35<br />
15<br />
-5<br />
-25<br />
136,2<br />
7,0<br />
Q2 2012<br />
-8,5<br />
122,0<br />
126,5<br />
-25,0<br />
4,8<br />
Q2 2011<br />
92,8<br />
Offshore Handling<br />
Equipment<br />
Port & Logistics<br />
<strong>TTS</strong> <strong>Group</strong>
<strong>TTS</strong> <strong>Group</strong> <strong>ASA</strong><br />
Balance Sheet<br />
MNOK 30.09.12 30.09.11 31.12.11<br />
Fixed assets 897 1 512 1 544<br />
Current assets 1 754 2 019 1 984<br />
TOTAL ASSETS 2 650 3 532 3 529<br />
Equity 1 233 831 840<br />
Long term liabilities 138 276 188<br />
Current liabilities 1 280 2 425 2 500<br />
TOTAL EQUITY AND LIABILITIES 2 650 3 532 3 529<br />
• Total assets substantially down due to sale of Drilling Equipment unit.<br />
• During the quarter a total of MNOK 16.5 of the convertible bond has been converted.<br />
• Equity ratio at end of 3 rd quarter 2012 is 46.5%.<br />
• The main changes from previous quarter relate to payment of dividends and additional gain from<br />
sale of the Drilling Equipment unit.<br />
26
<strong>TTS</strong> <strong>Group</strong> <strong>ASA</strong><br />
Equity share development<br />
27<br />
Percent<br />
50<br />
45<br />
40<br />
35<br />
30<br />
25<br />
20<br />
15<br />
10<br />
5<br />
0<br />
25,2 24,8<br />
23,5 23,3<br />
28,3<br />
27,4<br />
28,4 28,7 29,0<br />
46,6 46,5<br />
Q1 2010 Q2 2010 Q3 2010 Q4 2010 Q1 2011 Q2 2011 Q3 2011 Q4 2011 Q1 2012 Q2 2012 Q3 2012<br />
* includes convertible bond<br />
* * * *
<strong>TTS</strong> <strong>Group</strong> net working capital development<br />
28<br />
Working capital<br />
increased significantly<br />
during 3 rd quarter from<br />
negative 330 to negative<br />
47.<br />
The main reason for the<br />
increase in 3 rd quarter<br />
relate to provisions for<br />
the sale of Energy ,<br />
acquisition of NMF and<br />
remainder increase<br />
working capital in other<br />
operations.
<strong>TTS</strong> <strong>Group</strong> <strong>ASA</strong><br />
Consolidated cash flow and net interest bearing debt<br />
MNOK<br />
• Net interest bearing assets reduced with<br />
MNOK 419 in the quarter. The reduction<br />
from last quarter mainly relate to payment<br />
of dividends, acquisition of NMF and<br />
increased working capital.<br />
• Convertible bond was MNOK 95.3 at end of<br />
September. A total of MNOK 16.5 of the<br />
convertible bond has been converted in the<br />
quarter.<br />
29<br />
YTD<br />
2012 2011 2011<br />
Net cash flow from operations 58 305 409<br />
Net cash flow from investments 940 -32 -57<br />
Net cash flow from financial activities -868 -54 -190<br />
Net change in cash (incl. translation adjustments) 130 220 162<br />
Cash and bank deposits at the start of the period 435 272 272<br />
Cash and bank deposits at the end of the period 565 492 434<br />
• Cash flow influenced by payment<br />
of an extraordinary dividend of<br />
NOK1.56 per share, totaling<br />
approx. MNOK 135. Net change<br />
in cash in the period of MNOK<br />
130.<br />
MNOK Q3 12 Q2 12 Q1 12 Q4 11 Q3 11<br />
Short term interest b. debt 45 21 577 755 793<br />
Long term int. bearing<br />
debt 29 37 313 35 96<br />
Convertible Bond(*) 95 112 188 193 195<br />
Total 169 170 1 078 983 1 084<br />
Cash 565 985 567 435 492<br />
Net interest b. debt(*) -396 -815 511 548 592<br />
(*) Convertible loan included at nominal value<br />
(*) Negative indicates asset position
Agenda<br />
• 3 rd quarter headlines<br />
• Order intake and order backlog<br />
• Business segments<br />
• Market development<br />
• 3rd quarter consolidated accounts<br />
• Shareholder structure<br />
30
<strong>TTS</strong> <strong>Group</strong> <strong>ASA</strong><br />
10 largest shareholders at 31st of October 2012<br />
Rasmussengruppen AS 13.29%<br />
Skeie Technology AS 10.31%<br />
Lesk AS 6.13%<br />
Stisk AS 6.13%<br />
Skandinaviska Enskilda 6.11%<br />
Barrus Capital AS 3.99%<br />
Skagen Vekst 3.72%<br />
SHB Stockholm 3.01%<br />
Skeie Capital Invest 2.92%<br />
Tamafe Holding AS 2.49%<br />
Total 58.10%<br />
31
Agenda<br />
• 3 rd quarter headlines<br />
• Order intake and order backlog<br />
• Business segments<br />
• Market development<br />
• 3rd quarter consolidated accounts<br />
• Shareholder structure<br />
• Summary<br />
32
Summary<br />
• <strong>TTS</strong> finalized the sale of the Drilling Equipment unit and recorded an additional MNOK<br />
120 gain. Total gain from sale of the Drilling Equipment unit was MNOK 420. The<br />
finalization had a limited cash effect.<br />
• General assembly in <strong>TTS</strong> resolved to pay dividends and repayment of MNOK 500. The<br />
dividends were paid during 3rd quarter while the repayment is scheduled in November.<br />
• Inclusion of NMF was finalized on August 20 th , and improved <strong>TTS</strong> position in the marine<br />
crane market and complements <strong>TTS</strong> product offering.<br />
• <strong>EBITDA</strong> slightly lower than same quarter last year due to lower activity in Services and<br />
Deck Equipment. Better margins due to strong margins from Cargo Access and Joint<br />
Ventures.<br />
• Order intake is down from the same period last year, mainly due to weaker intake within<br />
Deck Equipment. High contracting activity relating to car carriers and other specialized<br />
vessels represents the majority of the order intake in the quarter.<br />
33
34<br />
www.ttsgroup.com


![2012.MasterPresentation_final [Compatibility Mode] - TTS Group ASA](https://img.yumpu.com/4612021/1/190x146/2012masterpresentation-final-compatibility-mode-tts-group-asa.jpg?quality=85)