Food Stamp Program Corrective Action Plan - DPAweb - Alaska ...
Food Stamp Program Corrective Action Plan - DPAweb - Alaska ...
Food Stamp Program Corrective Action Plan - DPAweb - Alaska ...

Create successful ePaper yourself
Turn your PDF publications into a flip-book with our unique Google optimized e-Paper software.
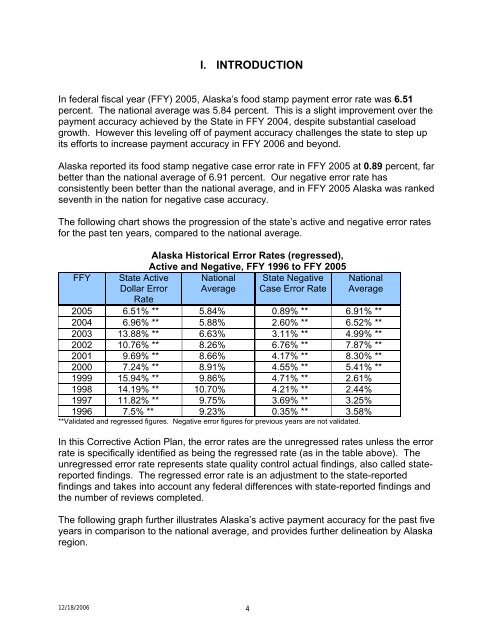
I. INTRODUCTIONIn federal fiscal year (FFY) 2005, <strong>Alaska</strong>’s food stamp payment error rate was 6.51percent. The national average was 5.84 percent. This is a slight improvement over thepayment accuracy achieved by the State in FFY 2004, despite substantial caseloadgrowth. However this leveling off of payment accuracy challenges the state to step upits efforts to increase payment accuracy in FFY 2006 and beyond.<strong>Alaska</strong> reported its food stamp negative case error rate in FFY 2005 at 0.89 percent, farbetter than the national average of 6.91 percent. Our negative error rate hasconsistently been better than the national average, and in FFY 2005 <strong>Alaska</strong> was rankedseventh in the nation for negative case accuracy.The following chart shows the progression of the state’s active and negative error ratesfor the past ten years, compared to the national average.FFYState ActiveDollar ErrorRate<strong>Alaska</strong> Historical Error Rates (regressed),Active and Negative, FFY 1996 to FFY 2005National State NegativeAverage Case Error RateNationalAverage2005 6.51% ** 5.84% 0.89% ** 6.91% **2004 6.96% ** 5.88% 2.60% ** 6.52% **2003 13.88% ** 6.63% 3.11% ** 4.99% **2002 10.76% ** 8.26% 6.76% ** 7.87% **2001 9.69% ** 8.66% 4.17% ** 8.30% **2000 7.24% ** 8.91% 4.55% ** 5.41% **1999 15.94% ** 9.86% 4.71% ** 2.61%1998 14.19% ** 10.70% 4.21% ** 2.44%1997 11.82% ** 9.75% 3.69% ** 3.25%1996 7.5% ** 9.23% 0.35% ** 3.58%**Validated and regressed figures. Negative error figures for previous years are not validated.In this <strong>Corrective</strong> <strong>Action</strong> <strong>Plan</strong>, the error rates are the unregressed rates unless the errorrate is specifically identified as being the regressed rate (as in the table above). Theunregressed error rate represents state quality control actual findings, also called statereportedfindings. The regressed error rate is an adjustment to the state-reportedfindings and takes into account any federal differences with state-reported findings andthe number of reviews completed.The following graph further illustrates <strong>Alaska</strong>’s active payment accuracy for the past fiveyears in comparison to the national average, and provides further delineation by <strong>Alaska</strong>region.12/18/2006 4