Lode's Computer Graphics Tutorial Fourier Transform
Lode's Computer Graphics Tutorial Fourier Transform
Lode's Computer Graphics Tutorial Fourier Transform

You also want an ePaper? Increase the reach of your titles
YUMPU automatically turns print PDFs into web optimized ePapers that Google loves.
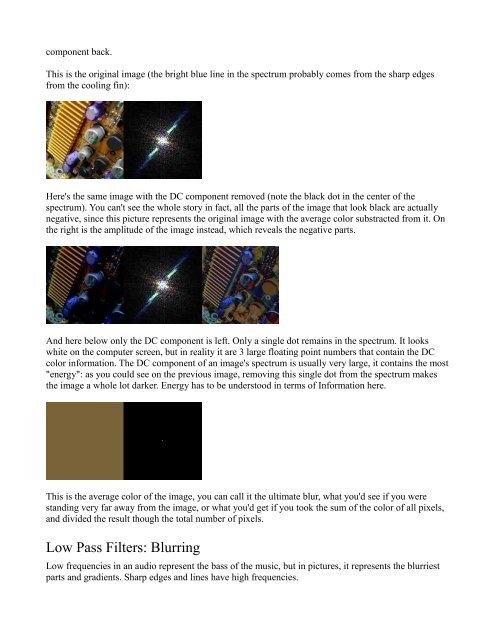
component back.This is the original image (the bright blue line in the spectrum probably comes from the sharp edgesfrom the cooling fin):Here's the same image with the DC component removed (note the black dot in the center of thespectrum). You can't see the whole story in fact, all the parts of the image that look black are actuallynegative, since this picture represents the original image with the average color substracted from it. Onthe right is the amplitude of the image instead, which reveals the negative parts.And here below only the DC component is left. Only a single dot remains in the spectrum. It lookswhite on the computer screen, but in reality it are 3 large floating point numbers that contain the DCcolor information. The DC component of an image's spectrum is usually very large, it contains the most"energy": as you could see on the previous image, removing this single dot from the spectrum makesthe image a whole lot darker. Energy has to be understood in terms of Information here.This is the average color of the image, you can call it the ultimate blur, what you'd see if you werestanding very far away from the image, or what you'd get if you took the sum of the color of all pixels,and divided the result though the total number of pixels.Low Pass Filters: BlurringLow frequencies in an audio represent the bass of the music, but in pictures, it represents the blurriestparts and gradients. Sharp edges and lines have high frequencies.