Optical Coherence Tomography - Thorlabs
Optical Coherence Tomography - Thorlabs
Optical Coherence Tomography - Thorlabs

You also want an ePaper? Increase the reach of your titles
YUMPU automatically turns print PDFs into web optimized ePapers that Google loves.
WEBDWG<strong>Optical</strong> <strong>Coherence</strong> <strong>Tomography</strong>Microscope OCTHardware Signal ProcessingAn OCT signal processing board is developed to accelerate the calibration of fringe signals from time to frequency. The clock boardprocesses the MZI clock signal to generate pulses equally spaced in frequency. The digitizer is configured in external clock mode and usesthe clock pulses as time base to sample OCT fringe signals with data points linear in frequency.Swept Source OCTSpectral Radar OCT1.0Relative Intensity0.5FWHM=12.3µm0.0500 550Depth (µm)Forward scan point spread function showing the resolutionof the system in air.1.0Relative Intensity0.5FWHM=12.0µm0.0450 500 550Depth (µm)Backward scan point spread function showing the resolution of thesystem in air.Sales: 973-579-72275
<strong>Optical</strong> <strong>Coherence</strong> <strong>Tomography</strong>WEBDWGMicroscope OCTSwept Source OCTSoftwareSpectral Radar OCTOCT interferencefringes point spreadfunction diagnosis(1D mode).3D volume imagingmode (500 x 500 x 500pixels) with en-faceimaging capability.CCDChannelOCT Channel2D cross-sectional imaging mode (500 x 500 pixels)Real time video-rate imagingReal-time video-rate imaging speed with 17-30 frames/second based on 500 axial scans per frame and 1024 points Fast Fourier Transform(FFT) can be achieved in the swept source OCT system.Results2D tomographic images of in-vivo human skin(a) finger pad (b) finger waist (c) nail folder(d) palm(e) back of handOCT images of in-vivo humanskin OCT recorded images and of displayed in-vivo human at 17frames recorded per second: and displayed (a) finger at pad; 17 f(b) second: finger (a) waist; finger (c) nail pad; folder; (b) fing(d) (c) palm; nail folder; (e) back (d) of hand. palm; Image (e) bsizes Image are sizes 5mm are x 2.5mm. 5 mm x 2.5 mm6
WEBDWGSerial en-face images of the onion skinA 3 mm x 3 mm x 3mm volume containing 500 x 500 x 500 pixels<strong>Optical</strong> <strong>Coherence</strong> <strong>Tomography</strong>Microscope OCTSwept Source OCTSpectral Radar OCT3D imaging of the sample (top to bottom: IR card, screw, leaf, skin )Potential Applications1 Biology and medical imaging2. 3D optical profilometry3. Material inspection and product quality control4. Thin film test and measurement5. Other non-invasive laser imaging applicationsReferencesR. Huber, M. Wojtkowski, J. G. Fujimoto, J. Y. Jiang, and A. E. Cable, “Three-dimensional and C-mode OCT imaging with a compact, frequency swept laser source at 1300 nm”, submitted to Opt.Exp. 2005.AcknowledgementsWe acknowledge scientific discussions and helpful advice from Dr. Robert Huber and Prof. James G.Fujimoto at Research Laboratory of Electronic of Massachusetts Institute of Technology.Sales: 973-579-72277
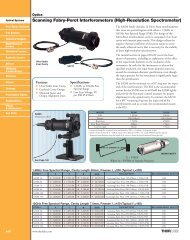
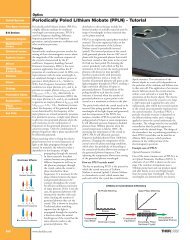
OCT MicroscopeSwept Source OCTSpectral Radar OCT<strong>Optical</strong> Coherance <strong>Coherence</strong> <strong>Tomography</strong>Rapidly Swept Tunable LaserWEBDWGSS-OCTSwept Source <strong>Optical</strong><strong>Coherence</strong><strong>Tomography</strong>SL1325-P16Swept Source <strong>Optical</strong> <strong>Coherence</strong><strong>Tomography</strong> (SS-OCT) applicationsrequire a laser that can be swept overa wide wavelength interval with veryhigh speed. The wide wavelengthrange is required for obtaining highimage resolution, and the hightuning frequency is needed forobtaining video image rates.<strong>Thorlabs</strong> is pleased to offer a fast sweeping, continuous wavelength, external cavity laser source specifically designed for SS-OCTapplications. The standard system sweeps at least 100nm at a 16kHz repetition rate, offers a coherence length of 6mm and deliversmore than 12mW of average optical power out of an SMF28 single mode fiber.The laser is available with the following fixed scanning frequency, coherence length and tuning range:■ SL1325-P16-16KHz scanning frequency, 6mm coherence length, 120nm tuning rangeThe SL1325 comes with a Mach-Zender interferometer (MZI) with an adjustable free spectral range of 50 to 100 GHz. The MZIis used to digitally resample the raw <strong>Optical</strong> <strong>Coherence</strong> <strong>Tomography</strong> (OCT) signal into equally spaced points in frequency. BNCconnectors are available to monitor the wavelength sweep direction and laser intensity signals. The SL1325 comes in a 19 inch rackunit configured for 115VAC or 220/240 VAC.OCT is a relatively recent and fundamentally new way of obtaining high-resolution images in turbid media. Various OCTtechniques are employed in dermatology, surgery (surgical guidance), and in ophthalmology. One of the driving forces of thedevelopment of the various OCT techniques is to find methods for in-vivo histology. However, the OCT techniques can be used forother types of characterization and visualizing of structures in turbid media, for example, materials research. The development ofOCT started in the 1990’s and is a continuously growing field of research and usage.Shown below are two raw OCT images acquired from the OCT microscope without any additional image processing. Thesampled tissues are from an in-vivo human finger and palm. The sample area sizes are 5.0mm (width) x 2.5mm (depth). Thelayered structures of human skin as well as the blood vessels can be clearly identified from these images.OCT image of in-vivo finger tissueOCT image of in-vivo palm tissue8Sales: 973-579-7227
WEBDWG<strong>Optical</strong> <strong>Coherence</strong> Coherance <strong>Tomography</strong>OCT MicroscopeSwept Source OCTSpectral Radar OCTMZI Clock: The frequency clock of the swept laser isfrom a build-in Mach-Zehnder interferometer withbalanced detector output. The zero-crossings, as well asmaxima and minima, of the interference fringe signals,are equally spaced in frequency and can be used asfrequency clock to synchronize other measurements.Spectrum of the OCT swept laser showing an active wavelengthtuning range of 155nm centered around 1325nm.PARAMETER MIN TYPICAL MAX COMMENTSWavelength Range (nm) 1265 – 1385Center Wavelength (nm) 1315 1325 1340Tuning Range (nm) (-10dB cut off point) 100 – 140 See models aboveRepetition Rate 15 – 17 See models aboveTuning Speed Continuous (nm/ms) – 2000 – Mean tuning speed around centerwavelengthAverage <strong>Optical</strong> Output Power (mW) 10 12 15 Averaged over 1 second<strong>Optical</strong> Power Stability (dB) – – ± 0.5 Forward to forward scan or backwardbackward scan during 1 hour usageSignal Source Spontaneous Emission Ratio (SSE) (dB) – 25 –<strong>Optical</strong> Isolation (dB) 50 – –Operating Temperature + 10° C – + 40° CStorage Temperature 0° C – + 70°CDiff. <strong>Optical</strong> Power at Forward and Back Scan(%) – 20 –<strong>Coherence</strong> Length (mm) 6 – 8 See models aboveLinear Polarization – >80 : 1 – Measured at laser output facetRepetition Rate (kHz) 10 16 20 Other rates on requestReturn Loss (dB) – 45 –Physical Size 600 x 450 x 300 Width x Depth x HeightITEM# $ £ € ¥ DESCRIPTIONSL1325-P16 $ 30,000.00 £ 18,270.00 € 26.100,00 ¥ 5,100,000 SL1325-P16, 16kHz scanning frequencyAn OCT cross-section of a human fingernailFor Details on Our Full Lineof OCT ProductsVisit us at www.thorlabs.comSales: 973-579-72279
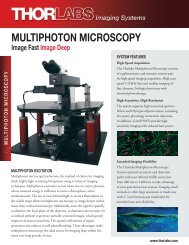
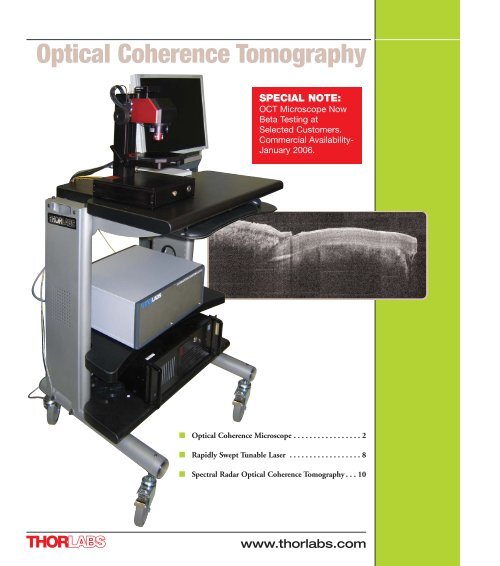
WEBDWG<strong>Optical</strong> <strong>Coherence</strong> Coherance <strong>Tomography</strong>OCT Microscopesimply make a few connections, and power up thepre-configured PC (included, photograph Ashows the complete system), and then begintaking images of your samples with the handheldscanner probe that is included. The system hasbeen developed through a collaboration between<strong>Thorlabs</strong> Lübeck AG, and the University ofLübeck both located in Germany, as well as<strong>Thorlabs</strong>, Inc. located in Newton NJ.Simplified Operating Principle ofSpectral OCTA light source with a broad range of wavelengthsis split between two paths. A portion is deliveredto the sample via the handheld probe shown inFigure I, the same optical path used to deliver theillumination light is also used to collect the signallight that is backscattered or reflected by thesample. And a portion is delivered to a referencearm which is subsequently mixed with the lightcollected from the sample.In a classic Michelson interferometer theinterference pattern is produced by varying thelength of one of the interferometer arms; in aFourier Domain interferometer a variation of thewavelength of the light field is what gives rise tothe interference pattern. Consider aninterferometer with a fixed path length differencebetween the two arms. For some particularSLDSpectrometerImageSensorLightHigh SpeedDAQ BoardFiber OpticCouplerAnalog Front End andDigital Logic & ClockingSignal &DatalinesLightHigh Speed Signal Processing SoftwareHigh Level Application SoftwareMultichannelI/O boardwavelength this fixed path length difference will give rise to totally destructiveinterference of the mixed light field, assuming the two arms of the interferometerare balanced. Now allow this wavelength to change with the path lengths still fixed;the change in wavelength will produce a sinusoidal variation in the signal that is theresult of mixing the light from the two arms of the interferometer.With our system in mind, for a fixed position of the reference mirror, and a fixedpoint on the sample, thebroadband light that isreflected from a given pointPersonnalComputerSLD 930nm100nm FWHMGalvanometerDriverBase UnitHandheldScanning ProbeSampleReferenceArmFigure II – Schematic Diagram showing all the major component parts of theSpectral-OCT system.FFTFigure I -Schematic DeviceSpectrometerLightLightGratingFiberCouplerBeamsplitterSampleArmwithin the sample willproduce a sinusoidal patternwithin the spectrometer whenit is mixed with light from thereference arm. The frequencyof the sinusoidal spectrometersignal will encode the depth,and amplitude will encodethe reflection coefficient ofthe point being considered.Thus light that is backreflectedalong the path ofillumination will have at eachpoint a characteristicfrequency and amplitudewithin the spectrometer.Applying a discrete fastFourier transform to thespectrometer signal willprovide a complete A-scan ofthe sample as shown inFigure I.System DescriptionThe <strong>Thorlabs</strong> spectral-OCTdevice is a fully operationalimaging system and isdepicted schematically to theSales: 973-579-7227Swept Source OCTSpectral Radar OCTReferenceArmProbeMirror11
OCT Microscope<strong>Optical</strong> Coherance <strong>Coherence</strong> <strong>Tomography</strong>WEBDWGSwept Source OCTSpectral Radar OCTright in Figure II. The base unit contains the super luminescent diode(SLD) light source. A fiber optic coupler is used to introduce thebroadband SLD source into the system as well as to deliver the returnsignal to the spectrometer (the Michelson interferometer is built withinthe handheld scanning probe). A spectrometer with 0.140 nm resolution,and high speed linear image sensor form the next two major blocks of thebase unit. Additionally the analog as well as the digital timing circuitry,and the drive electronics for the galvanometer scanner (which is located inthe handheld probe) are also found in the base unit.The wavelength of the SLD inour standard configuration iscentered at 930 nm (othercenter wavelengths available,please call for details), the useof a near-IR broadband sourcebalances the desire for low scatteringlosses within biological samples with theneed for operating inside the wavelengthrange of commercial silicon based linearsensor arrays. Many biological samplesprovide sufficient transparency at thiswavelength to provide for maximal useof the imaging depth set by the systemhardware, which in our standardconfiguration is set to 1.6 mm.Figure III – Solid Model ofBase Unit showing the majorcomponents of the system.In principal spectral-OCT can beapplied to a wide range of possibleapplications, the samples need not bebiological in nature, the technology canbe applied to industrial imaging problems ranging from laminated packaging filmsto 3-D visualization of mechanical parts. The robust design as well as the compactsize of the main housing (210 mm x 270 mm x 60 mm) allows the system to beeasily deployed within industrial settings.The solid-model provides a view of the mechanical design of the system, note thatthe main housing is machined from a single block and provides a mechanicallyrugged package for the high performance spectrometer. The base unit is segregatedinto a number of sections, the spectrometer and linear sensor array is seen in thefront area of the solid model with the laser beam depicted as red, it emerges fromthe optical fiber and is expanded to fill the grating which is mounted on the orangecolored tip/tilt mount. The diffracted beam is then imaged onto thesensor array. The upper right portion of the package has room for twoSLD light sources which is an optional feature available if higher axialresolution is required.A single cable connects the main housing to the personal computer(PC) which is included, within the PC resides a high performance dataacquisition card that has been optimized for the spectral-OCTapplication. All the required data acquisition and analysis is performedwith the software package that is provided. The resulting 2-D imagesare displayed on the PC at up to 5 frames per second. <strong>Thorlabs</strong> isplanning to release a 3-D enabled version of this technology in thesecond half of 2006.The communication between the base unit and the handheldapplication system is reduced to one optical fiber and an electronicconnection to control the scanning module. Included in theelectrical connection is a feedback signal to control and verify theposition of the scan mirror. The design architecture assumes thatthe interferometer itself is integrated into the applicator; includedFigure IV – Photograph of thehandheld scanning probe in useimaging a volunteers arm.with our standard system is the handheldapplication system depicted in Photograph B.Locating the interferometer within the handheldprobe avoids all the problems usually arising fromchromatic and polarization mode dispersionintroduced by lengths of optical fiber in thesample and reference arms of the interferometer.The standard handheld application system hasoriginally been designed for in vivo investigationsof the human skin, however the same handheldapplicator has been used on many other biologicaland industrial samples. The handheld probe uses atelecentric optical design, this provides a nearlyconstant illumination spot size on the sample overa broad range of working distances. The handheldapplication system is shown in Photograph B aswell as in the solid model depicted in Figure III.The software package contains a complete set offunctions for controlling the measurement, dataacquisition and processing as well as the storingand displaying of the OCT images.Figure V – Solid model, cross sectional view of thehandheld scanner probe that contains the freespaceinterferometer and telecentric imaging optics.12Sales: 973-579-7227
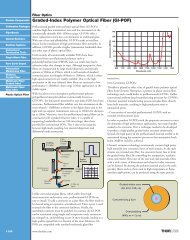
WEBDWG<strong>Optical</strong> <strong>Coherence</strong> Coherance <strong>Tomography</strong>OCT MicroscopeUtilizing a library of functions this system offers a high degree of flexibility which allows the user to modify the operation of the system to suit Swept Source OCTtheir particular needs. With the standard system the lateral scanning range as well as the step width is freely controlled. Several images can besampled at a time and saved separately with individual comments. The 16 bit data sets are accessible for offline image processing and data Spectral Radar OCTanalysis.Also included is a library of sample applications which often serve as a foundation from whichcustom applications can be developed.Measurement options:■ Creating 2D Images and Datasets ofTransparent or Scattering Samples Like SoftSpectral-OCT Image GalleryTissue or Structured Semiconductors with aResolution up to Some Microns■ Measurements of the Absolute Position ofthe Sample■ Determination of Layer Thickness With aPrecision Up to Some Hundred Pico Meter.Screen Shot from the Spectral OCT System Software Package.Fingernail Fold.SR-OCT Image of a thumb.In vitro images from porcine retina andnerve head.Fig. VIV – SR-OCT Surface Measurement of aSinusoidal Survace.Sales: 973-579-722713