June 2007 - Nordea Bank Lietuva
June 2007 - Nordea Bank Lietuva
June 2007 - Nordea Bank Lietuva
- No tags were found...

You also want an ePaper? Increase the reach of your titles
YUMPU automatically turns print PDFs into web optimized ePapers that Google loves.
<strong>Nordea</strong> 1, SICAVMonthly Report<strong>June</strong> <strong>2007</strong>
<strong>Nordea</strong> 1, SICAV<strong>Nordea</strong> Investment Funds offers a range of funds with a choiceof unique investment styles that are highly competitive andinternationally acclaimed.The SICAV distinguishes itself through its diversified range ofproducts with a strong presence in all the major world markets.But it also stands out with its focus on products that arespecifically geared to capitalise on <strong>Nordea</strong>’s recognised keystrengths and proven expertise.By effectively and consistently applying these diverse investmentstyles to produce superior fund performance, its fund managershave ensured that <strong>Nordea</strong> 1 has achieved pan-Europeanrecognition and acclaim.Countries authorised for sales and marketing
OverviewFund codes<strong>Nordea</strong> 1, SICAV Base Ccy ISIN SEDOL WKN Valoren Launch dateEuropean Value FundFar Eastern Value FundGlobal Value FundJapanese Value FundNorth American Value FundCentral & Eastern European EquityDanish Equity FundEuropean Equity FundFinnish Equity FundGlobal Core Equity FundGlobal Equity FundJapanese Equity FundNordic Equity FundNordic Equity Small CapNorth American Equity FundNorwegian Equity FundSwedish Equity FundBiotech FundIT FundAbsolute Return FundAbsolute Return High Yield FundGlobal Stable EquityDanish Bond FundDanish Long Bond FundDanish Mortgage Bond FundDollar Bond FundEuro Bond FundEuropean High Yield Bond FdGlobal Bond Fund (DKK)Global Bond Fund (EUR)Norwegian Bond FundSterling Bond FundSwedish Bond FundDanish Kroner ReserveEURO ReserveNorwegian Kroner ReserveSwedish Kroner ReserveUS-Dollar ReserveEUR LU0064319337 4703350 973347 119555 15/09/1989USD LU0064675985 4394226 973349 601301 07/01/1994EUR LU0160643358 7720408 358643 1523197 01/10/2003JPY LU0160643192 7720419 358509 1523195 01/10/2003USD LU0076314649 5229093 973348 601300 14/03/1997EUR LU0227385340 A0HF3D 2298792 02/11/2005DKK LU0081951880 5370474 987573 789513 21/11/1997EUR LU0081952268 5370463 987576 789519 21/11/1997EUR LU0095739925 5702505 989816 580518 06/04/1999EUR LU0112467450 591135 1103589 02/01/2006EUR LU0109904242 5950940 935932 1067686 17/04/2000JPY LU0097863921 5702538 989818 804734 21/05/1999EUR LU0064675639 4919867 973346 120735 04/05/1992EUR LU0278527428 B1LCPG2 A0LGUG 2850171 15/01/<strong>2007</strong>USD LU0095740188 5702497 989817 580515 06/04/1999NOK LU0081952003 5370452 987575 789518 21/11/1997SEK LU0081951963 5370441 987574 789514 21/11/1997USD LU0109905058 5950928 935934 1067692 17/04/2000USD LU0109904754 5950951 935933 1067690 17/04/2000EUR LU0227384020 A0HF3W 2298852 02/11/2005EUR LU0278533582 B1LCQ25 A0LGUM 2850947 15/03/<strong>2007</strong>EUR LU0278529986 B1LCPM8 A0LGS7 2850590 05/03/<strong>2007</strong>DKK LU0064319766 4919856 973350 601298 15/06/1990DKK LU0077910890 5271146 987079 659216 06/06/1997DKK LU0076315968 5206847 986766 581196 21/02/1997USD LU0076316008 5350142 986882 610812 14/03/1997EUR LU0076315455 5096004 986135 500451 05/07/1996EUR LU0141799501 529937 1365459 02/01/2006DKK LU0064320772 4703361 973353 601304 20/10/1989EUR LU0064321150 4703372 973354 601303 20/10/1989NOK LU0087209911 5466124 988130 902396 15/05/1998GBP LU0064320699 4703383 973351 601302 20/10/1989SEK LU0064320186 4747563 974521 401704 04/08/1995DKK LU0064321317 4339700 974177 343883 27/01/1995EUR LU0064322471 4339647 974180 343886 27/01/1995NOK LU0078812822 5297454 987173 678719 11/07/1997SEK LU0064321663 4339722 974178 343884 27/01/1995USD LU0076316180 5229071 986883 610814 14/03/1997
OverviewPrices and performance in % (in base currency) 29 <strong>June</strong> <strong>2007</strong><strong>Nordea</strong> 1, SICAV Price 1 year 3 years 5 years Since launch <strong>2007</strong> 2006 2005 2004 2003European Value Fund 44.63 22.74 73.63 91.99 346.30 5.61 27.00 22.13 15.23 23.03Far Eastern Value Fund 21.21 41.31 73.77 112.91 112.10 23.24 22.69 5.63 2.53 53.39Global Value Fund 14.01 14.46 30.45 - 40.10 3.55 6.87 18.43 8.09 -Japanese Value Fund 1 311.00 -5.68 13.31 - 31.10 -5.14 -7.37 37.89 9.40 -North American Value Fund 46.31 22.55 28.52 66.12 363.10 5.71 13.03 -2.88 15.66 32.23Central & Eastern European Equity Fund 14.05 27.96 - - 40.50 8.75 22.70 - - -Danish Equity Fund 238.08 18.71 87.45 114.54 138.08 -3.14 23.25 44.25 25.62 28.07European Equity Fund 18.65 26.53 61.98 41.26 86.50 13.58 14.68 23.45 3.55 9.40Finnish Equity Fund 24.16 28.99 80.31 113.86 141.60 13.80 17.62 22.73 16.75 24.02Global Core Equity Fund 12.46 8.54 - - 4.18 5.86 -1.59 - - -Global Equity Fund 5.84 7.95 31.95 22.64 -41.60 5.61 -1.04 32.10 0.45 9.86Japanese Equity Fund 1 271.00 10.04 43.78 53.42 27.10 4.95 1.42 36.30 12.89 15.78Nordic Equity Fund 69.05 44.09 125.88 161.84 590.50 18.52 35.37 30.82 17.85 24.42Nordic Equity Small Cap 10.61 - - - 6.10 6.10 - - - -North American Equity Fund 10.50 12.90 28.47 47.45 5.00 7.25 6.39 8.54 5.61 25.54Norwegian Equity Fund 180.05 23.65 130.24 188.22 80.05 9.59 26.71 44.28 28.28 46.97Swedish Equity Fund 221.43 29.68 70.83 94.53 121.43 10.91 20.10 25.04 11.75 28.23Biotech Fund 11.18 9.61 30.27 101.37 11.80 3.90 4.91 15.52 15.16 56.21IT Fund 39.39 18.22 10.55 29.02 -60.61 7.56 6.21 -2.68 -2.34 46.59Absolute Return Fund 11.00 8.59 - - 10.00 1.10 7.40 - - -Absolute Return High Yield Fund 10.14 - - - 1.40 1.40 - - - -Global Stable Equity 10.16 - - - 1.60 1.60 - - - -Danish Bond Fund 266.66 1.04 6.24 17.52 166.66 -1.88 -0.33 4.32 5.37 3.62Danish Long Bond Fund 174.54 0.86 6.19 22.27 74.54 -3.19 -1.51 5.09 7.79 4.81Danish Mortgage Bond Fund 155.93 1.92 6.13 18.03 55.93 -1.40 0.26 3.44 5.36 4.04Dollar Bond Fund 15.36 4.63 8.62 14.50 53.60 0.33 1.37 2.80 2.58 4.16Euro Bond Fund 7.57 0.13 5.64 16.34 48.05 -1.94 -1.01 3.97 6.07 2.54European High Yield Bond Fd 16.79 8.81 - - 10.99 3.01 7.75 - - -Global Bond Fund (DKK) 226.91 -3.88 -4.18 -0.90 126.91 -3.70 -6.67 6.96 0.34 -1.84Global Bond Fund (EUR) 10.16 -4.06 -4.41 -1.25 98.71 -3.88 -6.64 6.84 0.76 -2.27Norwegian Bond Fund 139.78 -0.84 4.06 23.40 39.78 -1.44 -0.90 2.14 5.70 10.00Sterling Bond Fund 30.20 -2.01 7.59 14.63 202.00 -4.04 -0.86 6.84 5.32 1.65Swedish Bond Fund 201.75 -0.40 7.92 18.80 101.75 -1.92 -0.38 4.68 7.54 2.61Danish Kroner Reserve 149.76 2.56 6.46 11.81 49.76 1.32 2.22 1.82 1.87 2.30EURO Reserve 14.58 3.04 6.84 11.82 45.80 1.60 2.32 1.95 1.66 2.07Norwegian Kroner Reserve 151.29 3.14 7.21 18.72 51.29 1.79 2.38 1.84 2.08 5.53Swedish Kroner Reserve 162.32 2.68 6.13 14.51 62.32 1.49 2.04 1.38 2.79 3.77US-Dollar Reserve 15.00 5.04 10.71 15.07 50.00 2.46 4.58 2.86 0.69 2.31Performance yields are available on the <strong>Nordea</strong> internet sites in various currencies (see back cover for internet addresses).
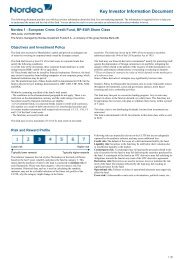
<strong>Nordea</strong> 1 – European Value FundPerformance in %TimeframeEUR* Index**Current year1 month1 year3 years5 years20065.61-1.9322.7473.6391.9927.009.83-0.3925.3973.9472.4919.62Since launch346.30 425.23*Base currency **Index in base currencyKey figures - 3 years30/06/2004 - 29/06/<strong>2007</strong>Annualised return in %Annualised standard deviationCorrelationSharpe ratioJensen's AlphaBetaTracking errorInformation ratioRisk free rate used in %*MSCI Europe - Net ReturnFund dataManagerBase currencyLast NAVShare classFund categoryAUM (Million EUR)Minimum investment (EUR)Front end fee in %Annual management fee in %Security Number (ISIN)Launch dateManager profileFund20.198.590.881.80-0.031.034.01-0.024.76Index*20.267.58–2.04–––––Tom Stubbe OlsenEUR44.63BPAccumulating3 362.79505.001.500LU006431933715/09/1989Tom Stubbe Olsen was born in Frederiksberg,Denmark, in 1962. He studied at the CopenhagenBusiness School, graduating with a Masters inEconomics and Business Administration. In 1986 hejoined Sparinvest, a large mutual fund company inDenmark. He worked as junior portfolio manager onthe American and European markets for 4 years untiltaking charge of the Pacific fund in 1991. He joinedUnibank Luxembourg in 1993 to start up the <strong>Nordea</strong>1 - Far Eastern Value Fund and subsequently changedthe investment style of the Fund to the currentapproach employed by the <strong>Nordea</strong> 1 Value Funds. Hehas managed the <strong>Nordea</strong> 1 - European Value Fundsince November 1998. He was appointed Head of<strong>Nordea</strong> Value Management in 2002.Léon Kirch was born in Luxembourg in 1972. Hestudied at the Ecole de Commerce Solvay and theUniversité Libre de Bruxelles, graduating with aMasters in Sciences Management. Following a 5 yearstint in the Asset Management Department of Banquede Luxembourg, where his main functions includedmanaging in-house investment funds and buy-sideanalysis, he attained Holder of the Chartered FinancialAnalyst status in 2001. He joined <strong>Nordea</strong> 1 -European Value Fund as Co-Manager in 2002.CommentThe rally in European stock markets lost some steam in <strong>June</strong> after a very impressive first five months.Once again, our investment philosophy has kept us out of the segments of the market that performedbest in <strong>June</strong>: oil & gas, basic resources and chemicals. We are not overly concerned by this as mostof the companies in these sectors do not offer the necessary sustainable earnings power that is thebasis of our investment philosophy. Following a period when investors appeared to show someambivalence towards risk as evidenced in the generally complacent reaction to the Chinese equitybubble, rising bond yields, the excessive use of derivatives, the meltdown in subprime mortgages,and liquidity issues with some hedge funds, we consider the current setback in the stock market astep in a normalisation process where risk is assessed in a more sober manner. As such we are notunhappy with recent events. While we find ideas at a 20 to 30% discount to fair value, we find only afew companies fulfilling the necessary margin of safety of 50%. At the same time we multiplied thecontacts with the managements of our existing holdings in order to ensure the underlying investmentcases are intact. We believe that this is the best way to protect the client’s investment and to exploitnew investment opportunities that meet our investment criteria.Performance (in base currency, indexed at 100)1801701601501401301201101009030/06/2004 30/06/2005 30/06/2006 29/06/<strong>2007</strong>European Value FundMSCI Europe - Net ReturnGeographical allocation in % Sector allocation in %United Kingdom 18.20Netherlands 10.61Ireland 10.03Denmark 9.13Germany 8.28Switzerland 8.22Belgium 6.18Finland 5.84Sweden 5.57Austria 2.85France 1.41Italy 0.93Net Liquid Assets 12.74Top Holdings in %FLS Industries B 6.23Shire PLC 4.70Credit Suisse Group 3.78UCB SA 3.24Anglo Irish <strong>Bank</strong> Corp Plc 3.13Swedish Match 3.09Agfa Gevaert NV 2.95Deutsche Postbank AG 2.94DSV - De Sammensl.Vognm.Af 1976 2.90Oesterreichische Post 2.85Industrials 25.79Health Care 15.52Financials 15.41Consumer Discretionary 13.88Information Technology 6.90Consumer Staples 5.90Not Classified 2.00Materials 1.85Net Liquid Assets 12.74Empty 20.00Empty 20.00Empty 20.00Empty 20.00
<strong>Nordea</strong> 1 – Far Eastern Value FundPerformance in %TimeframeUSD* EUR Index**Current year1 month1 year3 years5 years200623.243.5141.3173.77112.9122.6920.193.1233.0256.4057.269.9017.065.4843.71122.06172.6731.74Since launch112.10 75.00 52.20*Base currency **Index in base currencyCommentThe strength of Asian stock markets extended by yet another month during <strong>June</strong> with leadership heldby the Greater China markets. While China continues to defy threats of tightening measures to reinin the frenzy of the A-share market, Hong Kong has had a boost from regulatory changes allowingMainland flows into the Hong Kong stock market among others. Notably, Taiwan, whose stockmarket has garnered strength over the quarter, has registered record buying by foreigners, pushingup daily stock turnover substantially. It is no wonder that within our portfolio, Taiwanese stocks havestarted to feature within the month’s top 10 performers. Johnson Health Technology, a Taiwanesefitness equipment producer, posted the second best price gain over the month for the portfolio. Withits niche market position underpinned by competitive pricing and quality, the stock has easilycaptured investor attention on renewed interest in the Taiwan stock market.Key figures - 3 years30/06/2004 - 29/06/<strong>2007</strong>Annualised return in %Annualised standard deviationCorrelationSharpe ratioJensen's AlphaBetaTracking errorInformation ratioRisk free rate used in %*MSCI AC Far East ex. Japan - Net ReturnFund dataManagerBase currencyLast NAVShare classFund categoryAUM (Million USD)Minimum investment (EUR)Front end fee in %Annual management fee in %Security Number (ISIN)Launch dateManager profileFund20.2212.000.861.31-0.230.766.91-1.484.45Index*30.4613.35–1.95–––––Jacqueline ChenUSD21.21BPAccumulating460.19505.001.500LU006467598507/01/1994Jacqueline Chen was born in Malaysia and studied inLondon, England, where she achieved her Master ofBusiness Administration and later a Master of Scienceat the London School of Economics. She has beenmanaging Far East investments since 1984, when shereturned to Malaysia to join Rothschild Malaysia´sBumiputra Merchant <strong>Bank</strong>ers. In 1989, she left to joinWorld Invest Ltd in London to start up the Far Eastdivision. In the nine years she spent at World Invest,she managed and grew Far East investments from aninitial figure of around USD 100m to a peak of USD800m, comprising pension and retail funds. She wasappointed manager of the <strong>Nordea</strong> 1 - Far EasternValue Fund in 1999.Performance (in base currency, indexed at 100)2402202001801601401201008030/06/2004 30/06/2005 30/06/2006 29/06/<strong>2007</strong>Far Eastern Value FundMSCI AC Far East ex. Japan - Net ReturnGeographical allocation in % Sector allocation in %Korea, Republic of 24.96Thailand 15.46Hong Kong 13.47Cayman Islands 6.97Singapore 6.85Taiwan 5.94Malaysia 5.59India 2.76China 1.82Bermuda 1.66Indonesia 0.91Dutch Antilles 0.27Net Liquid Assets 13.35Industrials 19.61Top Holdings in %Financials 14.64Consumer Discretionary 13.49Samsung Engineering 3.39 Not Classified 9.48Golden Meditech Co Ltd 3.32 Consumer Staples 6.92PTT Public Company (NVDR) 2.74 Information Technology 6.02Aeon Co (M) Berhad 1.97 Energy 4.85Hang Lung Properties Ltd 101 1.96 Health Care 4.76Samsung Corp 1.90 Utilities 3.61Posco 1.89 Materials 1.89Aeon Thana Sinsap Thai-NVDR 1.84 Telecommunication Services 1.38Hankook Tire Manufactory 1.81 Net Liquid Assets 13.35Hyundai Mipo Dockyard 1.78 Empty 20.00
<strong>Nordea</strong> 1 – Global Value FundPerformance in %TimeframeEUR* Index**Current year1 month1 year3 years5 years20063.55-0.8514.4630.45–6.877.05-1.0818.0047.64–8.51Since launch40.10 66.21*Base currency **Index in base currencyKey figures - 3 years30/06/2004 - 29/06/<strong>2007</strong>Annualised return in %Annualised standard deviationCorrelationSharpe ratioJensen's AlphaBetaTracking errorInformation ratioRisk free rate used in %*MSCI World - 50% GDP WeightedFund dataManagerBase currencyLast NAVShare classFund categoryAUM (Million EUR)Minimum investment (EUR)Front end fee in %Annual management fee in %Security Number (ISIN)Launch dateFund9.268.900.940.51-0.371.043.09-1.494.76Index*13.878.05–1.13–––––Value Management TeamEUR14.01BPAccumulating45.83505.001.500LU016064335801/10/2003Managing the Global Value Fund is the <strong>Nordea</strong> ValueManagement team. Members of the team numberJacqueline Chen, Paul Danes, Tom Stubbe Olsen,Léon Kirch, Bruce Sherman and Gregg Powers. (Forbackground details of the team members, please seeunder the respective <strong>Nordea</strong> 1 Value Funds theymanage.)CommentThe fund portfolio’s North American portion enjoyed a positive performance in <strong>June</strong>, finishing wellahead of the broad US equity market, which experienced negative returns. The North American partof the fund’s holdings also outperformed the broader market over the past 12 months, despite a lackof energy exposure. The largest contributors to performance included core holdings in gaming andtechnology, continuing the positive trend from May. Negative contributors to the return includedholdings in financial services, principally in the capital markets industry, where concerns aboutinflation, interest rates and continuing problems in the mortgage market weighed on returns. The rallyin European stock markets lost some steam after a very impressive first five months. Once again, ourinvestment philosophy has kept us out of the segments of the market that performed best in <strong>June</strong>: oil& gas, basic resources and chemicals. We are not overly concerned by this, as most of thecompanies in these sectors do not offer the necessary sustainable earnings power that is the basisof our investment philosophy. We consider the recent setback in the stock market a step in anormalisation process, where risk is assessed in a more sober manner. The month proved dull forreturns in Japan as the market needs more incentives to push into higher ground and we believe thiswill come with earnings upgrades later in the year. Longer term we expect that increased shareholderactivism in Japan and improved corporate governance at Japanese companies could lead to higherreturns. The strength of Asian stock markets continued lead by the Greater China markets. WhileChina continues to defy threats of tightening measures to rein in the frenzy of the A-share market,Hong Kong has had a boost from regulatory changes allowing flows from the Chinese mainland intothe Hong Kong stock market, among others. Notably, Taiwan, whose stock market has garneredstrength over the quarter, has registered record buying by foreigners, pushing up daily stock turnoversubstantially.Performance (in base currency, indexed at 100)1501401301201101009030/06/2004 30/06/2005 30/06/2006 29/06/<strong>2007</strong>Global Value FundMSCI World - 50% GDP WeightedGeographical allocation in % Sector allocation in %United States of America 40.18Japan 10.12United Kingdom 8.29Netherlands 5.02Germany 4.41Ireland 3.90Switzerland 3.77Finland 3.17Denmark 3.05Sweden 2.91Thailand 2.52Belgium 2.36Hong Kong 2.02Top Holdings in %CA INC 3.34MGM Mirage Inc 2.67Wiley (John) & Sons - Cl A 2.44Eastman Kodak Co 2.09Alltel Corporation 1.94Symantec Corp 1.88Bear Stearns Companies Inc 1.86FLS Industries B 1.72Hewlett Packard USD 1.71Northern Trust Corp 1.57Consumer Discretionary 24.38Financials 21.39Information Technology 18.72Industrials 12.94Health Care 10.48Consumer Staples 3.94Telecommunication Services 3.41Not Classified 2.66Materials 1.44Utilities 0.41Net Liquid Assets 0.24Empty 20.00Empty 20.00
<strong>Nordea</strong> 1 – Japanese Value FundPerformance in %TimeframeJPY* EUR Index**Current year1 month1 year3 years5 years-5.140.46-5.6813.31–-10.66-1.39-17.50-9.97–6.261.1413.1354.35–2006 -7.37 -18.01 3.02Since launch31.10 2.00 79.46*Base currency **Index in base currencyComment<strong>June</strong> proved another dull month for returns in Japan. Clearly the market needs more incentives topush into higher ground and we believe this will come with earnings upgrades later in the year.However, another hope is always through greater shareholder activism in Japan. We have oftentalked about the prospects for improved corporate governance at Japanese companies andparticularly the prospect that over time more efficient financial management could lead to higherreturns on equity and more shareholder returns via dividends or buybacks. Against this background,<strong>June</strong> saw the AGMs of many companies where shareholder activists were either asking for higherdividends or trying to prevent the implementation of poison pills which are popping up throughoutcorporate Japan. In the vast majority of cases, however, the votes went against what would normallybe considered the interests of shareholders. Again this shows that a co-operative management is animportant criterion in choosing Japanese companies, where achieving change against their wishesremains fraught with difficulty.Key figures - 3 years30/06/2004 - 29/06/<strong>2007</strong>Annualised return in %Fund4.25Index*15.57Annualised standard deviation12.1112.56Correlation0.95–Sharpe ratioJensen's Alpha-0.08-0.820.82–Performance (in base currency, indexed at 100)Beta0.95–160Tracking errorInformation ratioRisk free rate used in %*TOPIX - Total ReturnFund data3.97-2.855.25–––150140130120ManagerBase currencyLast NAVShare classFund categoryAUM (Million JPY)Minimum investment (EUR)Front end fee in %Annual management fee in %Security Number (ISIN)Launch datePaul DanesJPY1,311.00BPAccumulating5 981.08505.001.500LU016064319201/10/20031101009030/06/2004 30/06/2005 30/06/2006 29/06/<strong>2007</strong>Japanese Value FundTOPIX - Total ReturnCurrency breakdown in % Sector allocation in %JPY 97.63Net Liquid Assets 2.37Manager profileAfter graduating from Cambridge University with anM.A. in Economics, Paul joined the asset managementdivision of Deutsche <strong>Bank</strong> where he worked for 10years in their London, New York and Tokyo offices.Seven of those years were spent as a Japanese FundManager, mostly living and working in Tokyo. He hasextensive knowledge of all market ranges within theJapanese market, having most recently managed smalland mid-cap funds. During his time with DeutscheAsset Management, Paul developed and used aresearch and valuation-based investment style and inhis six years in Japan made over 700 company visits.Paul joined <strong>Nordea</strong> in August 2003 to run the <strong>Nordea</strong>1 – Japanese Value Fund.Top Holdings in %Sumitomo Mitsui Fin Group - JPY 4.96Mitsubishi Tokyo Financial 8306 4.62Nissan Motor Co Ltd 7201 - JPY 4.25Nishimatsuya Chain 3.63Nippon System Development 3.59Musashi Seimitsu 3.56Mizuho Financial Group 3.28Nomura Research Institute 3.03Japan General Estate Co 2.87Daiwa House Industry Co 2.71Consumer Discretionary 38.64Financials 21.25Information Technology 17.06Industrials 10.69Health Care 4.01Consumer Staples 2.51Materials 1.98Telecommunication Services 1.50Net Liquid Assets 2.37Empty 20.00Empty 20.00Empty 20.00Empty 20.00
<strong>Nordea</strong> 1 – North American Value FundPerformance in %TimeframeUSD* EUR Index**Current year1 month1 year3 years5 years5.710.1922.5528.5266.123.08-0.1915.3615.6822.706.96-1.6620.5939.2866.312006 13.03 1.25 15.80Since launch363.10 290.44 123.31*Base currency **Index in base currencyCommentThe fund enjoyed a positive performance in <strong>June</strong>, finishing well ahead of the broad US equity marketwhich experienced negative returns. The fund has also outperformed the broader market over thepast 12 months, despite a lack of energy exposure. The largest contributors to fund performance forthe month included core holdings in gaming and technology, continuing the positive trend from May.Negative contributors to the fund’s return during the month included holdings in financial services,principally in the capital markets industry, where concerns about inflation, interest rates andcontinuing problems in the mortgage market weighed on returns. As we navigate this period ofincreased volatility in the market, it is important to note that the fund has a history of holding up wellin difficult markets and remains committed to the same highly disciplined approach to value investingimplemented since the fund’s inception in 1997. We continue to believe the fund’s current holdingsare trading at significant discounts to their intrinsic value and are well positioned to perform over thelong-term.Key figures - 3 years30/06/2004 - 29/06/<strong>2007</strong>Annualised return in %Fund8.72Index*11.68Annualised standard deviation10.187.29Correlation0.86–Sharpe ratioJensen's Alpha0.34-0.290.88–Performance (in base currency, indexed at 100)Beta1.17–150Tracking errorInformation ratio5.42-0.54––140Risk free rate used in %5.26–130*S&P 500 Composite - Total ReturnFund data120ManagerBase currencyLast NAVShare classFund categoryAUM (Million USD)Minimum investment (EUR)Front end fee in %Annual management fee in %Security Number (ISIN)Launch dateGregg PowersUSD46.31BPAccumulating2 471.83505.001.500LU007631464914/03/19971101009030/06/2004 30/06/2005 30/06/2006 29/06/<strong>2007</strong>North American Value FundS&P 500 Composite - Total ReturnCurrency breakdown in % Sector allocation in %USD 99.22Net Liquid Assets 0.78Manager profileGregg J. Powers was born in 1963, obtaining aBachelor of Science in Finance from the University ofFlorida. Beginning his career in Raymond JamesFinancial, where he developed the company’scomputer-based asset allocation model, he spentmuch of the 1990s working for Private CapitalManagement (PCM) Inc. as fund manager. In 1999,he was appointed President of the company, whichadvises the Fund and is based in Florida. Active inasset management since 1987, the company isacclaimed as a very successful value investor.Bruce S. Sherman, who has served as ChiefExecutive Officer and Chief Investment Officer ofPCM since its creation in 1986, earned a Bachelor ofScience degree in Accounting from the University ofRhode Island and a Master of Business Administrationin Finance from Bernhard Baruch College. Working asa principal with accounting firm Arthur Young & Co. inNew York City from 1969 to 1979, Sherman is aCertified Public Accountant and holds the Series 7,24 and 65 securities licences.Top Holdings in %MGM Mirage Inc 9.66CA INC 8.44Eastman Kodak Co 5.40Bea Systems Inc 5.06Bear Stearns Companies Inc 4.89Alltel Corporation 4.72Symantec Corp 4.60Hewlett Packard USD 4.34Health Management Assoc Inc A 3.69Motorola Inc - USD 3.58Information Technology 35.49Consumer Discretionary 28.88Financials 20.18Health Care 7.46Telecommunication Services 7.22Net Liquid Assets 0.78Empty 20.00Empty 20.00Empty 20.00Empty 20.00Empty 20.00Empty 20.00Empty 20.00
<strong>Nordea</strong> 1 – Central & Eastern European Equity FundPerformance in %TimeframeEUR* Index**Current year8.75 0.871 month7.50 8.181 year27.96 17.833 years– –5 years– –2006 22.70 30.88Since launch40.50 43.57*Base currency **Index in base currencyKey figures - 3 years30/06/2004 - 29/06/<strong>2007</strong>Annualised return in %Annualised standard deviationCorrelationSharpe ratioJensen's AlphaBetaTracking errorInformation ratioRisk free rate used in %*MSCI EM Eastern Europe - Net returnFund dataManagement teamBase currencyLast NAVShare classFund categoryAUM (Million EUR)Minimum investment (EUR)Front end fee in %Annual management fee in %Security Number (ISIN)Launch dateFund–––––––––Index*–––––––––European EquitiesEUR14.05BPAccumulating19.97505.001.500LU022738534002/11/2005CommentMost central and east European equities were slightly positive or flat in <strong>June</strong>. Increasing worries overrising interest rates globally and the sustainability of easy credit conditions kept many investors onthe sidelines. The Russian market rebounded after a weak performance in May despite persistentproblems for the important oil industry. The problems for the industry are related to currencymovements. The Telecommunication sector is still doing very well. The number of subscribers is stillgrowing and more importantly, it now seems that the customer is using mobile phones more andmore. During the month we increased our exposure to the Russian oil industry as we regard thecurrent problems as temporary. Other than that we only made minor adjustments to the portfolio. Theoutlook for slower growth beyond the ongoing mini-cycle recovery and the lack of inflationarypressures in goods and services in both Europe and the US are likely to prevent the EuropeanCentral <strong>Bank</strong> (ECB) and US Federal Reserve from moving from a neutral to restrictive monetarypolicy stance and therefore support equity investment. Heavy M&A activity also seems to continuesupporting the equity market. On the other hand, fading earnings growth will also kick in and weighon stock price momentum.Performance (in base currency, indexed at 100)14013513012512011511010510030/11/2005 30/11/2006Central & Eastern European Equity FundMSCI EM Eastern Europe - Net returnCurrency breakdown in % Sector allocation in %USD 69.46CZK 8.96PLN 8.54HUF 6.87GBP 2.66EUR 2.08Net Liquid Assets 1.43Top Holdings in %Deutsche-CW08 SBERBANK RF19.06 8.46Gazprom ADR - USD 8.46Lukoil Holding ADR -USD 7.62OTP <strong>Bank</strong> Reg S GDR 5.33Norilsk Nickel JSC ADR - USD 5.22Cez Csk 4.83Mol Rt HUF 4.58Mobile Telesystems ADR - USD 4.43Surgutneftegas ADR - USD 4.27Unified Energy Systems GDR 4.03Not Classified 37.54Energy 28.27Telecommunication Services 12.39Materials 6.48Financials 5.30Utilities 4.83Health Care 1.81Consumer Staples 1.05Consumer Discretionary 0.91Net Liquid Assets 1.43Empty 20.00Empty 20.00Empty 20.00
<strong>Nordea</strong> 1 – Danish Equity FundPerformance in %TimeframeDKK* EUR Index**Current year1 month1 year3 years-3.14-3.9318.7187.45-2.96-3.8518.9887.2112.43-1.9036.1797.685 years114.54 114.17 138.672006 23.25 23.32 15.22Since launch138.08 141.55 174.90*Base currency **Index in base currencyCommentThe Danish equity market performed in line with other European markets in <strong>June</strong> with most stocks innegative territory. The sudden rise in interest rates was the main driver for the negative performance.Danisco published a positive result, but the company’s forecast disappointed investors and sent thestock price down by5%. Vestas Wind Systems was also weaker than the average market due totechnical problems with gearboxes in the offshore segment. In late <strong>June</strong> A.P. Møller-Maerskannounced a big reshuffle of management and a new CEO was appointed. The stock market reactednegatively for a brief spell. The stocks in the portfolio continue to lag the broader market, butnevertheless we are satisfied with the quarterly results, while the underlying business developmentwe are witnessing at the companies remains solid and strong.Key figures - 3 years30/06/2004 - 29/06/<strong>2007</strong>Annualised return in %Fund23.30Index*25.50Annualised standard deviation12.4310.79Correlation0.79–Sharpe ratioJensen's Alpha1.46-0.041.88–Performance (in base currency, indexed at 100)Beta0.94–220Tracking errorInformation ratioRisk free rate used in %*OMX Copenhagen - Price IndexFund data7.64-0.295.18–––200180160140Management teamBase currencyLast NAVShare classFund categoryAUM (Million DKK)Minimum investment (EUR)Front end fee in %Annual management fee in %Security Number (ISIN)Launch dateNordic EquitiesDKK238.08BPAccumulating130.08505.001.500LU008195188021/11/19971201008030/06/2004 30/06/2005 30/06/2006 29/06/<strong>2007</strong>Danish Equity FundOMX Copenhagen - Price IndexCurrency breakdown in % Sector allocation in %DKK 99.37Net Liquid Assets 0.63Top Holdings in %GN Store Nord 8.34Coloplast B 7.71Simcorp A/S 7.14Alk-Abello A/S Ord B 6.98OMX Ab - DKK 5.26IC Companys 4.91Novo Nordisk A/S B - DKK 4.88DSV - De Sammensl.Vognm.Af 1976 4.85William Demant Holding 4.76Danske <strong>Bank</strong> A/S 4.71Health Care 32.66Financials 21.19Industrials 20.16Consumer Staples 9.89Consumer Discretionary 8.33Information Technology 7.14Net Liquid Assets 0.63Empty 20.00Empty 20.00Empty 20.00Empty 20.00Empty 20.00Empty 20.00
<strong>Nordea</strong> 1 – European Equity FundPerformance in %TimeframeEUR* Index**Current year13.58 10.981 month-0.43 -0.491 year26.53 24.293 years61.98 68.795 years41.26 67.382006 14.68 16.90Since launch86.50 110.91*Base currency **Index in base currencyKey figures - 3 years30/06/2004 - 29/06/<strong>2007</strong>Annualised return in %Annualised standard deviationCorrelationSharpe ratioJensen's AlphaBetaTracking errorInformation ratioRisk free rate used in %*MSCI Europe Growth - Net ReturnFund dataManagement teamBase currencyLast NAVShare classFund categoryAUM (Million EUR)Minimum investment (EUR)Front end fee in %Annual management fee in %Security Number (ISIN)Launch dateFund17.449.940.941.28-0.331.223.97-0.414.76Index*19.077.36–1.94–––––European EquitiesEUR18.65BPAccumulating37.65505.001.500LU008195226821/11/1997CommentAfter climbing to record peaks during the previous month, European equity markets were mostlylower in <strong>June</strong>. Stronger-than-expected US data trimmed expectations of a US Federal Reserve ratecut later this year and sent interest rates to their highest levels seen in a long time. In late <strong>June</strong> a UShedge fund encountered troubles and reinforced the cautious sentiment in the market. The Materialssector was one of the strongest performers due to the robust economy and M&A activity and was amajor contributor to performance in the fund. Also contributing positively to performance was anunderweight in the Utilities sector. The sector was affected negatively by rising interest rates. During<strong>June</strong> we increased exposure to companies related to the mobile telecommunication industry as wesee the industry continue growing. The outlook for slower growth beyond the ongoing mini-cyclerecovery and the lack of inflationary pressures in goods and services in both Europe and the US arelikely to prevent the European Central <strong>Bank</strong> (ECB) and US Federal Reserve from moving from aneutral to restrictive monetary policy stance and therefore support equity investment. Heavy M&Aactivity also seems to continue supporting the equity market. On the other hand, fading earningsgrowth will also kick in and weigh on stock price momentum.Performance (in base currency, indexed at 100)1701601501401301201101009030/06/2004 30/06/2005 30/06/2006 29/06/<strong>2007</strong>European Equity FundFrance 18.23United Kingdom 15.86Switzerland 13.51Germany 12.22Netherlands 6.85Sweden 5.70Norway 4.76Italy 4.31Denmark 4.01Greece 2.76Spain 2.61Belgium 2.39Ireland 2.14Top Holdings in %Total (Paris) 4.97Reed Elsevier Ord GBP 0.125 3.75Siemens Ag Namens Aktien 3.56Pernod Ricard (Paris listing) 3.54Novartis AG Reg - CHF 3.45Linde AG 3.32Deutsche Postbank AG 3.13Swatch Group Ag B (CHF) 3.01Statoil Asa 2.90UBS AG Registered 2.88MSCI Europe Growth - Net ReturnGeographical allocation in % Sector allocation in %Financials 19.28Consumer Discretionary 15.46Industrials 14.55Health Care 11.64Materials 9.78Information Technology 8.63Energy 7.88Consumer Staples 7.43Utilities 2.50Telecommunication Services 1.87Not Classified 0.27Net Liquid Assets 0.72Empty 20.00
<strong>Nordea</strong> 1 – Finnish Equity FundPerformance in %TimeframeCurrent year1 month1 year3 years5 yearsSince launch*Base currency **Index in base currencyKey figures - 3 years30/06/2004 - 29/06/<strong>2007</strong>Annualised return in %Annualised standard deviationCorrelationSharpe ratioJensen's AlphaBetaTracking errorInformation ratioRisk free rate used in %*OMX Helsinki Cap - Total Return IndexFund dataManagement teamBase currencyLast NAVShare classFund categoryAUM (Million EUR)Minimum investment (EUR)Front end fee in %Annual management fee in %Security Number (ISIN)Launch dateEUR*13.80-0.9828.9980.31113.86Fund21.7110.410.951.63-0.370.843.92-2.594.76Index**18.03-1.8139.13129.21176.362006 17.62 29.94141.60176.79Index*31.8512.04–2.25–––––Nordic EquitiesEUR24.16BPAccumulating6.80505.001.500LU009573992506/04/1999Comment<strong>June</strong> saw markets pausing to catch their breath. The Finnish equity market was down and slightlyworse off than the European market. This was hardly surprising as interest rates continued to risemoderately, creating a less cheap climate for equity markets. Our admittedly premature defensivestance paid off and the fund’s performance stabilised around that of the benchmark. Presently inrelation to investors the economic climate is very much in balance with the positive impulses from asurprisingly strong economy being more than offset by the negative impulses emanating from risinginterest rates. In this kind of environment, the trick is often to be defensive without being too interestorcommodity-price sensitive. As an effect of strong demand and the start of the US motoring seasoncombined with low refinery capacity, the oil price has continued to rise; clocking in at double-digitssince the turn of the year. It therefore now seems less clear than a month ago what the direction willbe for interest rates as determined by the European Central <strong>Bank</strong> and US Federal Reserve.Compared to the situation at end-May, we have moved to a more focused portfolio by selling offTietoenator and Stora Enso, both of which enjoyed splendid runs in the last months. The biggestwinners in terms of exposure have been Huhtamäki and Teleste, both of which have suffered from adreadful performance and which accordingly have proved to become very attractive in terms ofvaluation.Performance (in base currency, indexed at 100)2402202001801601401201008030/06/2004 30/06/2005 30/06/2006 29/06/<strong>2007</strong>Finnish Equity FundEUR 92.13GBP 1.51Net Liquid Assets 6.36OMX Helsinki Cap - Total Return IndexCurrency breakdown in % Sector allocation in %Top Holdings in %Fortum Oyj 9.84Nokia (Finland Listing) 9.75Neste Oil Oyj 8.62<strong>Nordea</strong> Ab (EUR) Finland 7.02Sampo Plc 4.51Teliasonera Ab (EUR) 4.15Alma Media Corp. 4.07Wartsila Corporation B 4.04Talentum Oy B 4.01Jaakko Poyry Group B 3.59Information Technology 18.07Financials 14.05Industrials 13.57Utilities 9.84Energy 8.62Consumer Discretionary 8.30Materials 6.46Not Classified 5.58Telecommunication Services 4.15Consumer Staples 2.51Health Care 2.48Net Liquid Assets 6.36Empty 20.00
<strong>Nordea</strong> 1 – Global Core Equity FundPerformance in %TimeframeEUR* Index**Current year5.86 6.581 month-1.11 -1.141 year8.54 17.013 years– –5 years– –2006 -1.59 7.40Since launch4.18 14.48*Base currency **Index in base currencyKey figures - 3 years30/06/2004 - 29/06/<strong>2007</strong>Annualised return in %Annualised standard deviationCorrelationSharpe ratioJensen's AlphaBetaTracking errorInformation ratioRisk free rate used in %*MSCI World - Net ReturnFund dataFund–––––––––Index*–––––––––CommentGlobal equity markets were mostly lower in <strong>June</strong>. Stronger-than-expected US data trimmedexpectations of a US Federal Reserve rate cut later this year and sent interest rates to their highestlevels seen in a long time. In late <strong>June</strong> a US hedge fund encountered troubles and reinforced thecautious sentiment in the market. The Materials sector was one of the strongest performers due tothe robust economy and M&A activity and was a major contributor to performance in the fund. Alsocontributing positively to performance was an underweight in the Utilities sector. The sector wasaffected negatively by rising interest rates. During <strong>June</strong> we increased exposure to companies relatedto the mobile telecommunication industry as we see the industry continue growing. The outlook forslower growth beyond the ongoing mini-cycle recovery and the lack of inflationary pressures ingoods and services in both Europe and the US are likely to prevent the European Central <strong>Bank</strong>(ECB) and US Federal Reserve from moving from a neutral to restrictive monetary policy stance andtherefore support equity investment. Heavy M&A activity also seems to continue supporting theequity market. On the other hand, fading earnings growth will also kick in and weigh on stock pricemomentum.Performance (in base currency, indexed at 100)116112108104Management teamBase currencyLast NAVShare classFund categoryAUM (Million EUR)Minimum investment (EUR)Front end fee in %Annual management fee in %Security Number (ISIN)Launch dateGlobal EquitiesEUR12.46BPAccumulating12.85505.001.500LU011246745002/01/2006100969230/12/2005 29/12/2006Global Core Equity FundMSCI World - Net ReturnCurrency breakdown in % Sector allocation in %USD 39.27EUR 27.39JPY 13.89GBP 5.21CHF 4.34CAD 2.80HKD 2.12SEK 1.51NOK 0.52Net Liquid Assets 2.95Top Holdings in %Electronic Arts Inc 3.28Linde AG 3.21Genzyme Corp 3.10Siemens Ag Namens Aktien 2.82Archer Daniels Midland Co 2.62Pernod Ricard (Paris listing) 2.52Novartis AG Reg - CHF 2.36Sanofi-Aventis (Paris listing) 2.35Nokia (Finland Listing) 2.32Celgene Corp 2.26Industrials 15.98Consumer Discretionary 15.93Health Care 13.82Financials 13.49Information Technology 12.77Consumer Staples 9.74Materials 5.47Energy 4.77Telecommunication Services 2.59Not Classified 2.49Net Liquid Assets 2.95Empty 20.00Empty 20.00
<strong>Nordea</strong> 1 – Global Equity FundPerformance in %TimeframeEUR* Index**Current year5.61 7.471 month-1.18 -0.781 year7.95 15.143 years31.95 38.445 years22.64 36.072006 -1.04 3.01Since launch-41.60 -14.25*Base currency **Index in base currencyKey figures - 3 years30/06/2004 - 29/06/<strong>2007</strong>Annualised return in %Annualised standard deviationCorrelationSharpe ratioJensen's AlphaBetaTracking errorInformation ratioRisk free rate used in %*MSCI World Growth - Net ReturnFund dataManagement teamBase currencyLast NAVShare classFund categoryAUM (Million EUR)Minimum investment (EUR)Front end fee in %Annual management fee in %Security Number (ISIN)Launch dateFund9.6810.630.930.46-0.301.264.16-0.424.76Index*11.458.28–0.81–––––Global EquitiesEUR5.84BPAccumulating16.86505.001.500LU010990424217/04/2000CommentGlobal equity markets were mostly lower in <strong>June</strong>. Stronger-than-expected US data trimmedexpectations of a US Federal Reserve rate cut later this year and sent interest rates to their highestlevels seen in a long time. In late <strong>June</strong> a US hedge fund encountered troubles and reinforced thecautious sentiment in the market. The Materials sector was one of the strongest performers due tothe robust economy and M&A activity and was a major contributor to performance in the fund. Alsocontributing positively to performance was an underweight in the Utilities sector. The sector wasaffected negatively by rising interest rates. During <strong>June</strong> we increased exposure to companies relatedto the mobile telecommunication industry as we see the industry continue growing. The outlook forslower growth beyond the ongoing mini-cycle recovery and the lack of inflationary pressures ingoods and services in both Europe and the US are likely to prevent the European Central <strong>Bank</strong>(ECB) and US Federal Reserve from moving from a neutral to restrictive monetary policy stance andtherefore support equity investment. Heavy M&A activity also seems to continue supporting theequity market. On the other hand, fading earnings growth will also kick in and weigh on stock pricemomentum.Performance (in base currency, indexed at 100)140135130125120115110105100959030/06/2004 30/06/2005 30/06/2006 29/06/<strong>2007</strong>Global Equity FundUnited States of America 38.10Japan 15.06France 8.59Germany 7.01United Kingdom 5.04Switzerland 4.31Italy 3.91Hong Kong 3.25Canada 2.80Finland 2.26Taiwan 2.01Greece 1.76Spain 1.15Top Holdings in %Electronic Arts Inc 5.02Esprit Holdings Ltd 330 3.25Adidas-Salomon Ag 3.19Genzyme Corp 3.11Unicredito Italiano 2.91Lamar Advertising Co A 2.65Archer Daniels Midland Co 2.63Aflac Inc 2.58ITT Industries 2.55Mitsubishi Tokyo Financial 8306 2.52MSCI World Growth - Net ReturnGeographical allocation in % Sector allocation in %Consumer Discretionary 17.70Industrials 16.68Information Technology 16.53Health Care 13.57Financials 13.04Consumer Staples 9.45Materials 4.16Energy 3.95Telecommunication Services 2.50Not Classified 0.87Net Liquid Assets 1.55Empty 20.00Empty 20.00
<strong>Nordea</strong> 1 – Japanese Equity FundPerformance in %TimeframeJPY* EUR Index**Current year1 month1 year3 years5 years4.951.2710.0443.7853.42-1.16-0.59-3.7514.248.836.111.2310.3554.1475.162006 1.42 -10.23 0.10Since launch27.10 0.04 33.36*Base currency **Index in base currencyCommentThe Japanese market was more or less flat during <strong>June</strong>, shrugging off most of the positive economicindicators published during the month. The only exception was retail sales, which have not picked updespite Japan’s steady economic recovery, mainly driven as it has been by the corporate sector. Thebest performing sectors were Energy and Industrials. The weak Japanese currency supported the bigexport companies. No major changes were made to the fund, but a number of existing holdings havebeen increased, mainly in companies related to the domestic market. The outlook for slower growthbeyond the ongoing mini-cycle recovery and the lack of inflationary pressures in goods and servicesin both Europe and the US are likely to prevent the European Central <strong>Bank</strong> (ECB) and US FederalReserve from moving from a neutral to restrictive monetary policy stance and therefore supportequity investment. Also affecting the domestic market in coming months will be the way the Japanesecurrency will move.Key figures - 3 years30/06/2004 - 29/06/<strong>2007</strong>Annualised return in %Fund12.87Index*15.51Annualised standard deviation13.4814.00Correlation0.96–Sharpe ratioJensen's Alpha0.57-0.210.73–Performance (in base currency, indexed at 100)Beta0.94–160Tracking errorInformation ratioRisk free rate used in %*MSCI Japan Growth - Net ReturnFund data3.69-0.725.25–––150140130120Management teamBase currencyLast NAVShare classFund categoryAUM (Million JPY)Minimum investment (EUR)Front end fee in %Annual management fee in %Security Number (ISIN)Launch dateGlobal EquitiesJPY1,271.00BPAccumulating2 229.22505.001.500LU009786392121/05/19991101009030/06/2004 30/06/2005 30/06/2006 29/06/<strong>2007</strong>Japanese Equity FundMSCI Japan Growth - Net ReturnCurrency breakdown in % Sector allocation in %JPY 96.63Net Liquid Assets 3.37Top Holdings in %Toyota Motor Corp 7203 7.03Mitsubishi Tokyo Financial 8306 3.78Mizuho Financial Group 3.33Mitsubishi Corp 8058 2.39Takeda Pharmaceutical - JPY 2.00Shin-Etsu Chemical Co Ltd 4063 1.98East Japan Railway Co 9020 1.88Matsushita Electric Ind 6752 - JPY 1.86Nomura Holdings 8604 - JPY 1.75Tokyo Electric Power Co. 9501 1.72Consumer Discretionary 20.38Financials 18.86Industrials 18.37Information Technology 11.92Materials 9.70Consumer Staples 5.97Health Care 4.13Utilities 3.35Telecommunication Services 2.91Energy 1.03Net Liquid Assets 3.37Empty 20.00Empty 20.00
<strong>Nordea</strong> 1 – Nordic Equity FundPerformance in %TimeframeCurrent year1 month1 year3 years5 yearsSince launch*Base currency **Index in base currencyKey figures - 3 years30/06/2004 - 29/06/<strong>2007</strong>Annualised return in %Annualised standard deviationCorrelationSharpe ratioJensen's AlphaBetaTracking errorInformation ratioRisk free rate used in %*MSCI Nordic - Net ReturnFund dataManagement teamBase currencyLast NAVShare classFund categoryAUM (Million EUR)Minimum investment (EUR)Front end fee in %Annual management fee in %Security Number (ISIN)Launch dateEUR*18.520.3544.09125.88161.84Fund31.2113.110.952.020.151.024.070.964.76Index**15.58-0.3836.57106.32129.932006 35.37 24.58590.50788.62Index*27.3112.12–1.86–––––Nordic EquitiesEUR69.05BPAccumulating815.20505.001.500LU006467563904/05/1992CommentWith higher bond yields very much in evidence, the Nordic equity markets also ceded some groundin <strong>June</strong>. The downturn was broadly based, with financials and in particular real estate companiesamong the main losers as a consequence of higher bond yield spreads and a general flight to qualityon the debt markets. Meanwhile, the underlying inflation data has remained in line with or even belowexpectations. Except for a few engineerings such as Outotec, Metso and Sandvik, the lion’s share ofthe portfolio was subject to some profit-taking during the month. Meanwhile, the underlyingperformance of both these and most of the other export-oriented Nordic companies remains solid,with both eastern Europe and Asia driving growth. But more domestically oriented companies, suchas financials, were more visibly hit by the interest-rate worries. Metso and Rautaruukki were furtherincreased as new orders continue to boost projected sales and margins for the forthcoming years.We also took part in the IPO of SRV, a Finnish property development company with activities inFinland and Russia. The holding in Topdanmark was increased at attractive levels. Meanwhile, wetook some profits in A.P. Möller-Maersk. Outotec and Karo Bio. JM was sold out after its spectacularperformance. Long term, we still view Nordic equities in general as an attractive asset class, as theirearnings yield still comfortably exceeds those of bonds plus risk premium.Performance (in base currency, indexed at 100)2402202001801601401201008030/06/2004 30/06/2005 30/06/2006 29/06/<strong>2007</strong>Nordic Equity FundSweden 34.87Finland 31.00Norway 21.15Denmark 7.71United Kingdom 1.51Switzerland 1.13Net Liquid Assets 2.64MSCI Nordic - Net ReturnGeographical allocation in % Sector allocation in %Top Holdings in %Nokia (Finland Listing) 9.55Aker ASA 5.10Ericsson LM Tel B - SEK 5.05SKF B 4.20Orkla A 3.77Sampo Plc 3.64Hennes & Mauritz B Shs - SEK 3.36Norsk Hydro NOK 3.29<strong>Nordea</strong> Ab (SEK) 3.12Volvo B 2.92Industrials 32.30Financials 15.57Information Technology 14.70Energy 11.11Consumer Discretionary 7.87Materials 6.65Health Care 4.76Telecommunication Services 2.30Not Classified 1.15Utilities 0.95Net Liquid Assets 2.64Empty 20.00Empty 20.00
<strong>Nordea</strong> 1 – Nordic Equity Small CapPerformance in %TimeframeEUR* Index**Current year– –1 month0.38 -1.841 year– –3 years– –5 years– –2006 – –Since launch6.10 8.53*Base currency **Index in base currencyKey figures - 3 years30/06/2004 - 29/06/<strong>2007</strong>Annualised return in %Annualised standard deviationCorrelationSharpe ratioJensen's AlphaBetaTracking errorInformation ratioRisk free rate used in %*Carnegie Nordic Small Cap IndexFund dataFund–––––––––Index*–––––––––CommentHigher interest rates and worries over a weaker housing market in the US soured the mood forNordic small cap stocks during <strong>June</strong>. Interest-rate sensitive stocks such as financials and particularlyreal estate companies suffered the most. Best performers were our new holdings Betsson andBouvet, both up over 20% after our investment at the start of <strong>June</strong>. Betsson is a fast-growing onlinegaming company. The client base in mainly in the Nordic region and the company has been profitablemore or less since start. We also find the valuation low and like that the management are long-termshareholders in the company. Bouvet is a Norwegian IT service company. The management and theemployees are major shareholders and the company has an impressive track record. Also in this casethe company valuation is low. Our big holding in Norwegian e-retailer Komplett gained over 20%after presenting a bid for a domestic competitor. On the negative side Meda lost over 10% afternews that the CEO sold a fraction of his big holding. Also Topdanmark suffered from a negativeperformance as higher bond yields could have a negative impact on the financial result short term. Inaddition to Bettson and Bouvet, another new holding was Sydbank. After a recent drop in the shareprice we find the valuation for this Danish retail bank low. We reduced our holding in Swedishretailer Hemtex as we see the company posting weaker profits in the coming years. The valuation ofthe Nordic small cap market remains low compared to interest rates even if the gap narrowed in <strong>June</strong>following a sharp rise in long-term interest rates. Balance sheets remain robust and earningsmomentum is still going strong, leaving further upside potential going forward. However, lookingahead to 2008, some Nordic small caps may find it tough to keep up the momentum as higher costscould reduce their margins.Performance (in base currency, indexed at 100)101100.510099.59998.5Management teamBase currencyLast NAVShare classFund categoryAUM (Million EUR)Minimum investment (EUR)Front end fee in %Annual management fee in %Security Number (ISIN)Launch dateNordic EquitiesEUR10.61BPAccumulating5.28505.001.500LU027852742815/01/<strong>2007</strong>9897.59796.505/06/<strong>2007</strong>Nordic Equity Small CapCarnegie Nordic Small Cap IndexGeographical allocation in % Sector allocation in %Sweden 41.14Finland 20.50Norway 13.29Denmark 9.83Luxembourg 0.98Net Liquid Assets 14.26Top Holdings in %Meda Ab A 6.11Komplett 4.76Schibsted-Gruppen A/S 3.97Topdanmark 3.22Rella Holding A 3.10Saab B 3.05Oriola-KD B 2.99HK Ruokatalo OYJ -A- 2.98Lundbergfortagen B 2.58BE Group AB 2.47Consumer Discretionary 18.81Industrials 18.25Financials 13.33Health Care 11.38Not Classified 10.49Information Technology 7.08Consumer Staples 4.36Materials 1.33Energy 0.71Net Liquid Assets 14.26Empty 20.00Empty 20.00Empty 20.00
<strong>Nordea</strong> 1 – North American Equity FundPerformance in %TimeframeUSD* EUR Index**Current year1 month1 year3 years5 years20067.25-1.5012.9028.4747.456.394.59-1.886.2815.638.91-4.708.36-1.0318.3235.8461.929.27Since launch5.00 -16.54 24.78*Base currency **Index in base currencyCommentGlobal equity markets were lower in <strong>June</strong>. Stronger-than-expected US data trimmed expectations ofa US Federal Reserve rate cut later this year and sent interest rates to their highest levels seen in along time. In late <strong>June</strong> a US hedge fund encountered troubles and reinforced the cautious sentimentin the market. The Energy sector was one of the strongest performers due to continuing tensionsbetween Iran and the USA. The Telecommunication sector also performed strongly after a privateequity fund placed a bid for Alltel. During <strong>June</strong> we increased exposure to companies related to themobile telecommunication industry as we see the industry continue growing. The outlook for slowergrowth beyond the ongoing mini-cycle recovery and the lack of inflationary pressures in goods andservices in both Europe and the US are likely to prevent the European Central <strong>Bank</strong> (ECB) and USFederal Reserve from moving from a neutral to restrictive monetary policy stance and thereforesupport equity investment. Heavy M&A activity also seems to continue supporting the equity market.On the other hand, fading earnings growth will also kick in and weigh on stock price momentum.Key figures - 3 years30/06/2004 - 29/06/<strong>2007</strong>Annualised return in %Annualised standard deviationCorrelationSharpe ratioJensen's AlphaBetaTracking errorInformation ratioRisk free rate used in %*MSCI North America Growth - Net ReturnFund dataManagement teamBase currencyLast NAVShare classFund categoryAUM (Million USD)Minimum investment (EUR)Front end fee in %Annual management fee in %Security Number (ISIN)Launch dateFund Index*8.71 10.7510.02 8.240.91 –0.34 0.67-0.26 –1.13 –4.30 –-0.47 –5.26 –Global EquitiesUSD10.50BPAccumulating17.60505.001.500LU009574018806/04/1999Performance (in base currency, indexed at 100)140135130125120115110105100959030/06/2004 30/06/2005 30/06/2006 29/06/<strong>2007</strong>North American Equity FundMSCI North America Growth - Net ReturnCurrency breakdown in % Sector allocation in %USD 97.10Net Liquid Assets 2.90Top Holdings in %Exxon Mobil Corp 3.94Altria Group Inc 2.83Citigroup Inc - USD 2.65Gen Electric Co - USD 2.64<strong>Bank</strong> of America Corp 2.49SBC Communications Com 2.17Chevron Corp - USD 1.82Microsoft Corp Com - USD 1.57Kraft Foods Inc 1.48CSX Corp 1.40Financials 22.72Industrials 16.27Energy 12.62Health Care 11.62Information Technology 11.34Consumer Staples 8.97Consumer Discretionary 4.18Telecommunication Services 4.14Materials 2.91Utilities 2.17Not Classified 0.14Net Liquid Assets 2.90Empty 20.00
<strong>Nordea</strong> 1 – Norwegian Equity FundPerformance in %TimeframeNOK* EUR Index**Current year9.59 13.24 14.151 month4.27 6.19 1.771 year23.65 23.09 35.113 years130.24 143.64 150.185 years188.22 168.63 249.822006 26.71 22.82 32.98Since launch80.05 82.01 187.55*Base currency **Index in base currencyKey figures - 3 years30/06/2004 - 29/06/<strong>2007</strong>Annualised return in %Annualised standard deviationCorrelationSharpe ratioJensen's AlphaBetaTracking errorInformation ratioRisk free rate used in %*Oslo Exchange Mutual Fund Index - Total ReturnFund dataFund32.0516.070.961.55-0.341.064.35-0.857.13Index*35.7515.01–1.91–––––CommentThe Norwegian equity market continued to make headway in <strong>June</strong>. The OSE set an all-time high 20<strong>June</strong>, only to drop back slightly. The main reason for the receding equity markets globally has been arekindling of inflationary fears and subsequent rising interest rates, especially in the USA. Offsettingthe negative mood, however, are strong M&A activity, ample liquidity and robust global economicgrowth. The positive Norwegian equity market can mainly be explained by high oil prices, with thespot Brent oil price trading at around USD 72.50 per barrel, and the unmitigated bright globalprospects. In <strong>June</strong> Technology ranked among the sector winners (up 9%), while Financials was thesector loser (down 5%). Big cap shares underperformed small cap shares during the month. Thelargest positive contributions to fund performance were our overweights in Komplett and Blom andour underweight in DnB NOR. The best performing sector was Industrials. On the negative side wasEnergy, with the most negative contributions from Statoil. During <strong>June</strong> we increased the exposure inConsumer Stables by buying Orkla, while reducing Financials by selling DnB NOR, ConsumerDiscretionary (selling Expert) and Energy (selling Aker Kvaerner). Our oil outlook remains unchanged,as we expect oil prices to stay high throughout the summer months. Valuation of and earningsestimates in the Norwegian equity market still look a bit stretched, but the global macro outlookremains positive, giving support to Norwegian equities. Thus, excluding M&A activity and theupcoming Q2 earnings reporting season, our stance towards OSE trends in July is neutral.Performance (in base currency, indexed at 100)260240220200180160Management teamBase currencyLast NAVShare classFund categoryAUM (Million NOK)Minimum investment (EUR)Front end fee in %Annual management fee in %Security Number (ISIN)Launch dateNordic EquitiesNOK180.05BPAccumulating467.21505.001.500LU008195200321/11/19971401201008030/06/2004 30/06/2005 30/06/2006 29/06/<strong>2007</strong>Norwegian Equity FundOslo Exchange Mutual Fund Index - Total ReturnCurrency breakdown in % Sector allocation in %NOK 98.86Net Liquid Assets 1.14Top Holdings in %Seadrill Ltd - NOK 6.15Q-Free Asa 5.44Geo ASA 5.22Orkla A 5.04Petroleum Geo Services 4.69Norsk Hydro NOK 4.35Statoil Asa 4.23Komplett 4.21Wilhelmsen A 4.16Telenor Asa 3.70Energy 40.58Industrials 25.08Information Technology 10.49Not Classified 8.39Consumer Discretionary 7.87Telecommunication Services 3.70Materials 2.76Net Liquid Assets 1.14Empty 20.00Empty 20.00Empty 20.00Empty 20.00Empty 20.00
<strong>Nordea</strong> 1 – Swedish Equity FundPerformance in %TimeframeSEK* EUR Index**Current year10.91 8.37 8.501 month-2.13 -1.69 -2.231 year29.68 29.48 31.863 years70.83 68.85 93.375 years94.53 91.34 124.412006 20.10 24.72 24.87Since launch121.43 106.71 150.70*Base currency **Index in base currencyKey figures - 3 years30/06/2004 - 29/06/<strong>2007</strong>Annualised return in %Annualised standard deviationCorrelationSharpe ratioJensen's AlphaBetaTracking errorInformation ratioRisk free rate used in %*SIX Portfolio Return IndexFund dataFund19.5412.110.971.02-0.300.972.95-1.717.21Index*24.5811.95–1.45–––––CommentThe market was subject to a sharp correction at the start of <strong>June</strong> and volatility continued to be highthroughout the remainder of the month. The main reason for the fall was fears of higher inflation andthe sharp rise in long-term interest rates in the USA. The negative trend was strengthened towardsthe end of the month when two large hedge funds needed capital injections after speculation in thesubprime mortgage market. In the Swedish stock market the IT sector managed to stay on thepositive side but Consumer Discretionary and Healthcare both fell around 5%. An accelerating trendtowards higher interest rates put Real Estate and Construction under severe pressure. Consequentlythe holding in JM hurt performance during the month. The fund benefited from the overweight inIndustrials where Sandvik and Scania are the largest contributors. Performance was held back by anoverweight in retail company Hennes & Mauritz, which reported slightly weaker numbers thanexpected for the second quarter. During the month we sold all our holding in airline operator SAS. Inthe Consumer Discretionary sector we sold all shares in Retail and Brands and took a new positionin media company MTG which disclosed that it was sharpening its financial targets. In the IT sectorwe increased the weight in Ericsson and decreased Nokia. We also increased our position inTelecom operators, mainly in Tele 2.Performance (in base currency, indexed at 100)200180160140Management teamBase currencyLast NAVShare classFund categoryAUM (Million SEK)Minimum investment (EUR)Front end fee in %Annual management fee in %Security Number (ISIN)Launch dateNordic EquitiesSEK221.43BPAccumulating159.15505.001.500LU008195196321/11/19971201008030/06/2004 30/06/2005 30/06/2006 29/06/<strong>2007</strong>Swedish Equity FundSIX Portfolio Return IndexCurrency breakdown in % Sector allocation in %SEK 98.07Net Liquid Assets 1.93Top Holdings in %Ericsson LM Tel B - SEK 9.72Hennes & Mauritz B Shs - SEK 8.68Volvo B 7.36Sandvik Ab 5.66Teliasonera Ab (SEK) 5.14<strong>Nordea</strong> Ab (SEK) 4.53Skandinaviska Enskilda <strong>Bank</strong> A 4.50Foreningssparbanken A 4.28Atlas Copco B 4.20Astrazeneca Ord - SEK 4.17Industrials 33.07Financials 16.20Information Technology 13.52Consumer Discretionary 13.42Telecommunication Services 8.91Health Care 4.92Materials 4.04Not Classified 3.51Energy 0.47Net Liquid Assets 1.93Empty 20.00Empty 20.00Empty 20.00
<strong>Nordea</strong> 1 – Biotech FundPerformance in %TimeframeUSD* EUR Index**Current year1 month1 year3 years5 years20063.90-2.369.6130.27101.374.911.33-2.733.1817.2548.73-6.020.54-3.898.055.7157.381.02Since launch11.80 -20.46 -5.46*Base currency **Index in base currencyComment<strong>June</strong> was a negative month for stocks overall. Biotech stocks underperformed the market butperformed in-line with other health care stocks. As far as our portfolio is concerned, a great deal ofpositive events occurred in <strong>June</strong>. Qiagen bought US company Digene and will become a dominantplayer in the fast growing market for molecular diagnostics. Digene’s leading product is a genetictest for HPV, the virus that causes cervical cancer. This product segment is expected to show rapidgrowth in the coming year and Qiagen’s global marketing platform will increase this opportunity.Zymogenetics entered into a global collaboration with Bayer to co-promote rhThrombin. The productis expected to be approved later this year and will be Zymogenetics’ first marketed product. And,finally, Gilead received US approval for Letairis for the treatment of pulmonary arterial hypertension.Key figures - 3 years30/06/2004 - 29/06/<strong>2007</strong>Annualised return in %Fund9.22Index*1.87Annualised standard deviation14.1315.81Correlation0.96–Sharpe ratioJensen's Alpha0.180.53-0.31–Performance (in base currency, indexed at 100)Beta0.89–140Tracking errorInformation ratio4.381.68––130Risk free rate used in %6.69–120*Nasdaq BiotechnologyFund data110Management teamBase currencyLast NAVShare classFund categoryAUM (Million USD)Minimum investment (EUR)Front end fee in %Annual management fee in %Security Number (ISIN)Launch dateGlobal EquitiesUSD11.18BPAccumulating91.05505.001.500LU010990505817/04/2000100908030/06/2004 30/06/2005 30/06/2006 29/06/<strong>2007</strong>Biotech FundNasdaq BiotechnologyGeographical allocation in % Sector allocation in %United States of America 80.50Netherlands 3.99United Kingdom 3.24Denmark 3.21Germany 2.46Canada 1.52Belgium 1.20France 0.85Net Liquid Assets 3.03Top Holdings in %Genzyme Corp 9.65Gilead Sciences Inc Com 8.54Celgene Corp 8.07Amgen Inc - USD 6.84Zymogenetics Inc 4.08Radiation Therapy 3.65Genentech Inc 3.57Gen-Probe Inc 3.47Biomarin Pharmaceutical Inc 3.14Applera Corp- Applied Biosys 2.97Health Care 94.51Not Classified 2.46Net Liquid Assets 3.03Empty 20.00Empty 20.00Empty 20.00Empty 20.00Empty 20.00Empty 20.00Empty 20.00Empty 20.00Empty 20.00Empty 20.00
<strong>Nordea</strong> 1 – IT FundPerformance in %TimeframeUSD* EUR Index**Current year1 month1 year3 years5 years20067.561.7818.2210.5529.026.214.901.3911.28-0.50-4.70-4.879.571.4424.8427.6267.419.31Since launch-60.61 -71.98 -56.25*Base currency **Index in base currencyCommentTechnology was more or less unchanged during <strong>June</strong> after a strong rebound since the beginning ofMarch. Positively contributing to the fund’s performance were two Asian brand names, namelySamsung Electronics and AU Optronics, both companies gaining approximately 10%. SamsungElectronics benefited from a strong rebound in memory-chip prices, which were up more than 20%on the month. The reason for this price spike stemmed from expectations that production capacity ofmemory-chips would be scaled back, thereby significantly limiting supply. AU Optronics benefitedfrom positive forecasts regarding panel prices going into the second half of <strong>2007</strong>. Negativelycontributing to performance were Sony Corp and Logica CMG. Logica continued to suffer from itsearlier issued disappointing guidance due to slower business trends in the UK andhigher-than-expected costs. Sony has enjoyed a very strong run since the beginning of <strong>2007</strong> and wesee the recent price correction as profit-taking. We made no major changes to the fund during <strong>June</strong>.Key figures - 3 years30/06/2004 - 29/06/<strong>2007</strong>Annualised return in %Annualised standard deviationCorrelationSharpe ratioJensen's AlphaBetaTracking errorInformation ratioRisk free rate used in %*MSCI World IT - Net ReturnFund dataManagement teamBase currencyLast NAVShare classFund categoryAUM (Million USD)Minimum investment (EUR)Front end fee in %Annual management fee in %Security Number (ISIN)Launch dateFund Index*3.40 8.4715.50 13.330.94 –-0.21 0.13-0.40 –1.14 –5.44 –-0.93 –6.69 –Global EquitiesUSD39.39BPAccumulating4.61505.001.500LU010990475417/04/2000Performance (in base currency, indexed at 100)1301251201151101051009590858030/06/2004 30/06/2005 30/06/2006 29/06/<strong>2007</strong>IT FundMSCI World IT - Net ReturnGeographical allocation in % Sector allocation in %United States of America 56.24Finland 8.44United Kingdom 8.40Japan 6.41Taiwan 4.85Germany 4.64Sweden 4.33Korea, Republic of 3.33Netherlands 2.41Net Liquid Assets 0.94Top Holdings in %Microsoft Corp Com - USD 8.55Nokia (Finland Listing) 8.44Dell Computer Corp - USD 6.90Cisco Systems Inc Com - USD 5.32AU Optronics Corp ADS 4.85Citrix Systems Inc 4.74SAP Ag 4.64Arm Holdings 4.55Ericsson LM Tel B - SEK 4.33Kla Tencor Corp Com 4.21Information Technology 91.61Consumer Discretionary 4.11Not Classified 3.33Net Liquid Assets 0.94Empty 20.00Empty 20.00Empty 20.00Empty 20.00Empty 20.00Empty 20.00Empty 20.00Empty 20.00Empty 20.00
<strong>Nordea</strong> 1 – Absolute Return FundPerformance in %TimeframeEUR* Index**Current year1.10 –1 month-1.08 –1 year8.59 –3 years– –5 years– –2006 7.40 –Since launch10.00 –*Base currency **Index in base currencyKey figures - 3 years30/06/2004 - 29/06/<strong>2007</strong> Fund Index*Annualised return in %Annualised standard deviationCorrelationSharpe ratioJensen's AlphaBetaTracking errorInformation ratioRisk free rate used in %Fund data––––––––––––––––––CommentGlobal equity markets were mostly lower in <strong>June</strong>. Stronger-than-expected US data trimmedexpectations of a US Federal Reserve rate cut later this year and sent interest rates to their highestlevels seen in a long time. In late <strong>June</strong> a US hedge fund encountered troubles and reinforced thecautious sentiment in the market. Long bond yields continued higher during <strong>June</strong> to stand at acurrent level of 4.61% versus 4.42% at the end of May. The driver is still expectations for improvedeconomic growth and the risk of higher inflation. Credit spreads were slightly wider followingrenewed concerns over the US mortgage market and a heavy pipeline of new issues coming to themarket. We expect new issuance to slow down during the summer break, and will watch the USmortgage market for further deterioration. The outlook for slower growth beyond the ongoingmini-cycle recovery and the lack of inflationary pressures in goods and services in both Europe andthe US are likely to prevent the European Central <strong>Bank</strong> (ECB) and US Federal Reserve from movingfrom a neutral to restrictive monetary policy stance and therefore support equity investment. HeavyM&A activity also seems to continue supporting the equity market. On the other hand, fadingearnings growth will also kick in and weigh on stock price momentum.Performance (in base currency, indexed at 100)112110108106104Management teamBase currencyLast NAVShare classFund categoryAUM (Million EUR)Minimum investment (EUR)Front end fee in %Annual management fee in %Security Number (ISIN)Launch dateMulti AssetEUR11.00BPAccumulating92.32505.001.500LU022738402002/11/20051021009830/11/2005 30/11/2006Absolute Return FundCurrency breakdown in % Asset type breakdown in %EUR 51.25USD 22.90GBP 6.44AUD 3.39CAD 1.62CHF 1.50JPY 1.03HKD 0.83NZD 0.31SEK 0.13SGD 0.10Net Liquid Assets 10.49Shares 41.71Top Holdings in %Government Bonds 41.44Corporate Bonds 5.39Germany 4.5% 04.07.09 12.14 Other 0.96Germany 4.25% 15.02.08 11.53 Net Liquid Assets 10.49Germany 3.25% 09.04.10 8.18 Empty 20.00Austria 5.5% 20.10.07 5.98 Empty 20.00Municipality Finance 3.75% 10.03.08 3.61 Empty 20.00Eksportfinans ASA 3.5% 20.12.07 3.56 Empty 20.00HNG 3.75% 1 Year Swap-Bond 06.02 1.84 Empty 20.00Chevron Corp - USD 0.81 Empty 20.00Gen Electric Co - USD 0.78 Empty 20.00ENI SPA 0.77 Empty 20.00
<strong>Nordea</strong> 1 – Absolute Return High Yield FundPerformance in %TimeframeEUR* Index**Current year– –1 month-0.10 –1 year– –3 years– –5 years– –2006 – –Since launch1.40 –*Base currency **Index in base currencyKey figures - 3 years30/06/2004 - 29/06/<strong>2007</strong>Annualised return in %Annualised standard deviationCorrelationSharpe ratioJensen's AlphaBetaTracking errorInformation ratioRisk free rate used in %Fund dataManagement teamBase currencyLast NAVShare classFund categoryAUM (Million EUR)Minimum investment (EUR)Front end fee in %Annual management fee in %Security Number (ISIN)Launch dateFund–––––––––Index*–––––––––High Yield Fixed IncomeEUR10.14BPAccumulating52.41503.001.200LU027853358215/03/<strong>2007</strong>CommentThe fund yielded a negative return in <strong>June</strong> that nevertheless was far less than that of the benchmark.The European high-yield market finally showed some weakness during <strong>June</strong>, when investors’ riskawareness increased after reports emerged of problems in certain hedge funds and issues regardingpricing of CLOs. The portfolio showed significant resistance to the market downturn due toconservative positioning and a high cash level. The fund has low interest sensitivity with duration ofaround 1.9 years and a high percentage of the fund is invested in senior secured bonds that are notthat sensitive to credit events. As at end-<strong>June</strong>, the fund had a net exposure of 64%, comprising 72%long and 8% short. Fundamentals are still quite good, and the European default rate for May is2.14%. Euro HY spreads increased from 214 basis points (bp) to 225 bp, according to CSFB indexdata. Preliminary benchmark data show the least negative return in Non-Cyclical Consumer Goods,Technology and Cyclical Service. The worst performing sectors were Media, Energy and BasicIndustry. Trading activity in the fund was fairly high in <strong>June</strong>, with the main focus on deployment ofcash due to inflows. We invested in new issues from Clondalkin, Versatel and SIG. The currentspread versus government bonds is below the historical average, but the default rate is expected tostay approximately at the current level. We think that the market is priced a bit tight at the currentlevel, and we continue to see some downside risk in the coming months.Performance (in base currency, indexed at 100)100.0099.9699.9299.8899.8499.8099.7699.7299.6806/06/<strong>2007</strong>Absolute Return High Yield FundCurrency breakdown in % Asset type breakdown in %EUR 51.94USD 3.67GBP 1.70Net Liquid Assets 42.69Top Holdings in %Breeze Finance 6.708% 19.04.27 3.81Polypore Inc 8.75% 15.05.12 3.66Lighthouse Intl Co 8% 30.04.14 3.64Signum Luxembourg 0% 18.06.15 3.58Petrojack As FRN 30.05.12 2.95Clondalkin Acquisition FRN 15.12.13 2.89Cognis FRN 15.09.13 2.84Beverage Packanging 8% 15.12.16 2.77Versatel AG FRN 15.06.14 2.66Boats Invest Netherlands 11% 310317 2.31Corporate Bonds 53.67Other 3.64Net Liquid Assets 42.69Empty 20.00Empty 20.00Empty 20.00Empty 20.00Empty 20.00Empty 20.00Empty 20.00Empty 20.00Empty 20.00Empty 20.00
<strong>Nordea</strong> 1 – Global Stable EquityPerformance in %TimeframeEUR* Index**Current year1 month1 year3 years5 years2006–-2.87––––––––––Since launch1.60 –*Base currency **Index in base currencyCommentGlobal equity markets were mostly lower in <strong>June</strong>. Stronger-than-expected US data trimmedexpectations of a US Federal Reserve rate cut later this year and sent interest rates to their highestlevels seen in a long time. In late <strong>June</strong> a US hedge fund encountered troubles and reinforced thecautious sentiment in the market. The fact that real rates are rising on expectations of a solid growthrebound has meant that some parts of the equity market are in fact doing well (i.e. yielding positivereturns), despite rising real rates in general and falling equity markets. Our Stable equity portfolioshave a large exposure to Utilities and Financials as these companies in the long run have a verystable earnings and price development. But short term these sectors are under pressure as themarket tends to focus on those companies that in its view stand to benefit from the growth rebound.This is hurting the performance of stable equities. We still hold stocks that are attractively valued inrelation to the market and selected on stable earnings, cash flows, dividends and prices; as such weexpect stability to return to the portfolio both on an absolute and relative level.Key figures - 3 years30/06/2004 - 29/06/<strong>2007</strong>Annualised return in %Fund–Index*–Annualised standard deviation––Correlation––Sharpe ratioJensen's Alpha––––Performance (in base currency, indexed at 100)Beta––100.0Tracking error––99.6Information ratio––99.2Risk free rate used in %––98.8Fund dataManagement teamBase currencyLast NAVShare classFund categoryAUM (Million EUR)Minimum investment (EUR)Front end fee in %Annual management fee in %Security Number (ISIN)Launch dateGlobal EquitiesEUR10.16BPAccumulating194.25505.001.500LU027852998605/03/<strong>2007</strong>98.498.097.697.296.806/06/<strong>2007</strong>Global Stable EquityCurrency breakdown in % Sector allocation in %USD 52.47GBP 14.60EUR 10.03AUD 7.80CAD 3.68CHF 3.36JPY 2.32HKD 1.88NZD 0.70SGD 0.32SEK 0.29Net Liquid Assets 2.55Financials 25.98Top Holdings in %Industrials 14.54Utilities 13.89Chevron Corp - USD 1.81 Consumer Staples 11.92Gen Electric Co - USD 1.78 Health Care 7.63ENI SPA 1.74 Consumer Discretionary 7.29United Technologies Com (USD) 1.64 Telecommunication Services 6.14Telefonica SA 1.63 Energy 4.61Westpac <strong>Bank</strong>ing Corp Ord 1.61 Materials 2.40Johnson & Johnson Com (USD) 1.60 Information Technology 2.17Public Service Enterprise Group 1.54 Not Classified 0.90Southern Co. Com 1.53 Net Liquid Assets 2.55Ameren Corporation 1.48 Empty 20.00
<strong>Nordea</strong> 1 – Danish Bond FundPerformance in %TimeframeDKK* EUR Index**Current year-1.88 -1.70 -1.341 month-0.86 -0.77 -0.401 year1.04 1.27 0.893 years6.24 6.11 9.245 years17.52 17.32 24.382006 -0.33 -0.27 0.01Since launch 166.66 181.49 250.35*Base currency **Index in base currencyKey figures - 3 years30/06/2004 - 29/06/<strong>2007</strong> Fund Index*Annualised return in %Annualised standard deviationCorrelationBetaTracking errorAverage maturity2.042.520.940.970.8814.602.992.59––––Duration in years0.00 –Risk free rate used in %*JPM Denmark Govt. Bond - Total ReturnFund data5.18 –Management teamBase currencyLast NAVShare classFund categoryNordic Fixed IncomeDKK266.66BPAccumulatingAUM (Million DKK)125.99Minimum investment (EUR)Front end fee in %503.00Annual management fee in %0.600Security Number (ISIN)Launch dateLU006431976615/06/1990CommentThe yield on the Danish 30-year 4% benchmark mortgage bond increased by 20 basis points (bp)to 5.27% in <strong>June</strong> compared with the end of the previous reporting month. During the same period,the yield curve in the 2-10 year segment steepened 15 bp to a spread of 0.14%. The fundunderperformed during the month compared to benchmark. The underperformance was mainly dueto higher yields (overweight duration), a steeper yield curve and increased volatility. In the comingmonth we believe interest rates will start to move lower so we retain our overweight in duration(currently +0.5) compared to benchmark. We continue to have a positive view on mortgage bondsand believe they will outperform government bonds in the medium term. The fund’s current exposureto mortgage bonds and capped floaters is 40%.Performance (in base currency, indexed at 100)11211010810610410210030/06/2004 30/06/2005 30/06/2006 29/06/<strong>2007</strong>Danish Bond FundAsset type breakdown in %Mortgage Institutions 58.77Government Bonds 38.98Net Liquid Assets 2.25JPM Denmark Govt. Bond - Total ReturnCredit rating breakdown in %Aaa 94.55Top Holdings in %<strong>Nordea</strong> Kredit INK 4% 01.01.08 Stl 18.69Denmark INK St Lån 6% 15.11.11 11.72Germany 3.25% 04.07.15 11.33Realkredit DK 5% 43D OA 01.01.38 9.99Nykredit 43D 500CF60A FRN 01.10.3 7.46Denmark INK St Lån 4% 15.11.17 6.04Germany 4.25% 04.01.14 5.80Nykredit 3D 5% 01.10.35 5.76Realkredit DK 53d FRN 01.10.38 4.36Denmark INK St Lån 7% 10.11.24 4.02Aa1 3.00NA 0.19Net Liquid Assets 2.25Empty 20.00Empty 20.00Empty 20.00Empty 20.00Empty 20.00Empty 20.00Empty 20.00Empty 20.00
<strong>Nordea</strong> 1 – Danish Long Bond FundPerformance in %TimeframeDKK* EUR Index**Current year-3.19 -3.02 -1.341 month-1.27 -1.19 -0.401 year0.86 1.09 0.893 years6.19 6.06 9.245 years22.27 22.06 24.382006 -1.51 -1.45 0.01Since launch74.54 74.21 67.65*Base currency **Index in base currencyKey figures - 3 years30/06/2004 - 29/06/<strong>2007</strong> Fund Index*Annualised return in %Annualised standard deviationCorrelationBetaTracking errorAverage maturity2.023.710.901.131.8026.512.992.59––––Duration in years0.00 –Risk free rate used in %*JPM Denmark Govt. Bond - Total ReturnFund data5.18 –Management teamBase currencyLast NAVShare classFund categoryNordic Fixed IncomeDKK174.54BPAccumulatingAUM (Million DKK)82.83Minimum investment (EUR)Front end fee in %503.00Annual management fee in %0.250Security Number (ISIN)Launch dateLU007791089006/06/1997CommentThe yield on the Danish 30-year 4% benchmark mortgage bond increased by 20 basis points (bp)to 5.27% in <strong>June</strong> and the yield on the Danish 7% government bond expiring 2024 increased by 25bp to 4.80% compared with the end of the previous reporting month. The significantly higher yieldswere negative for performance and the fund underperformed compared to benchmark. Duration islong and will remain long, with the fund currently running an overweight in duration of 4.7 years.Performance (in base currency, indexed at 100)11211010810610410210030/06/2004 30/06/2005 30/06/2006 29/06/<strong>2007</strong>Danish Long Bond FundAsset type breakdown in %Mortgage Institutions 80.60Government Bonds 17.28Net Liquid Assets 2.12JPM Denmark Govt. Bond - Total ReturnCredit rating breakdown in %Aaa 75.13Top Holdings in %Denmark INK St Lån 7% 10.11.24 17.28Nykredit 03SD 4% 01.10.35 12.90Realkredit DK 23D s. 4% 01.10.38 12.32<strong>Nordea</strong> Kredit 4% 01.10.38 11.75Dansk Landbrug 4% 01.10.35 9.77Nykredit 4% 01.10 38 9.31<strong>Nordea</strong> Kredit Ann 4% 01.10.35 9.04Realkredit DK 4% 01.10.35 8.86BRFkredit A/S 4% 01.10.35 4.12Totalkredit A/S 111 4% 01.07.35 2.53Aa1 13.90NA 8.86Net Liquid Assets 2.12Empty 20.00Empty 20.00Empty 20.00Empty 20.00Empty 20.00Empty 20.00Empty 20.00Empty 20.00
<strong>Nordea</strong> 1 – Danish Mortgage Bond FundPerformance in %TimeframeDKK* EUR Index**Current year-1.40 -1.22 -1.341 month-1.16 -1.07 -0.401 year1.92 2.15 0.893 years6.13 5.99 9.245 years18.03 17.82 24.382006 0.26 0.32 0.01Since launch55.93 55.14 69.93*Base currency **Index in base currencyKey figures - 3 years30/06/2004 - 29/06/<strong>2007</strong> Fund Index*Annualised return in %Annualised standard deviationCorrelationBetaTracking errorAverage maturity2.002.260.840.881.4022.232.992.59––––Duration in years0.00 –Risk free rate used in %*JPM Denmark Govt. Bond - Total ReturnFund data5.18 –Management teamBase currencyLast NAVShare classFund categoryNordic Fixed IncomeDKK155.93BPAccumulatingAUM (Million DKK)1 056.35Minimum investment (EUR)Front end fee in %503.00Annual management fee in %0.600Security Number (ISIN)Launch dateLU007631596821/02/1997CommentThe yield on the 4% 30-year benchmark mortgage bond increased by 20 basis points (bp) to5.27% in <strong>June</strong> compared with the end of the previous reporting month. Over the same period, theyield curve in the 2-10 year segment steepened 15 bp to a spread of 0.14%. The Swap OASposted a decrease of 9 bp to a spread of 2 during the month. The fund performed negatively duringthe month compared to benchmark. The negative performance contribution derived from higheryields (due to an overweight in duration), a steeper yield curve and increase in volatility. Within themortgage segments the month’s best performers took the form of 4% 30-year callable bonds.Performance (in base currency, indexed at 100)11211010810610410210030/06/2004 30/06/2005 30/06/2006 29/06/<strong>2007</strong>Danish Mortgage Bond FundAsset type breakdown in %Mortgage Institutions 88.89Government Bonds 9.30Net Liquid Assets 1.81JPM Denmark Govt. Bond - Total ReturnCredit rating breakdown in %Aaa 57.35Top Holdings in %Realkredit DK 5% 43D OA 01.01.38 10.87Denmark T-Bill 0% 03.12.07 9.30BRFkredit 111B 5% 01.10.35 8.27BRFkredit A/S 111B 5% 01.10.38 8.18Nykredit 3D 5% 01.10.35 7.28Nykredit FRN 01.10.38 6.09<strong>Nordea</strong> Kredit INK 4% 01.01.08 Stl 4.64<strong>Nordea</strong> Kredit FRN 01.10.38 3.74Nykredit 73D OA 5% 01.10.38 3.72Nykredit 43D 500CF60A FRN 01.10.3 3.56Aa1 20.72NA 17.04Aa3 2.53Aa2 0.54Net Liquid Assets 1.81Empty 20.00Empty 20.00Empty 20.00Empty 20.00Empty 20.00Empty 20.00
<strong>Nordea</strong> 1 – Dollar Bond FundPerformance in %TimeframeUSD* EUR Index**Current year0.331 month-0.321 year4.633 years8.625 years14.50-2.16 0.95-0.71 -0.06-1.50 5.56-2.24 11.38-15.43 23.192006 1.37 -9.20 3.09Since launch53.60 29.50 82.81*Base currency **Index in base currencyKey figures - 3 years30/06/2004 - 29/06/<strong>2007</strong> Fund Index*Annualised return in %Annualised standard deviationCorrelationBetaTracking errorAverage maturity2.793.380.940.971.126.913.663.33––––Duration in years**5.04 –Risk free rate used in %*JP Morgan US Gov. Bond Index - Total Return**Duration figures are not option-adjusted4.91 –Fund dataManagement teamBase currencyLast NAVShare classFund categoryGlobal Fixed IncomeUSD15.36BPAccumulatingAUM (Million USD)6.94Minimum investment (EUR)Front end fee in %503.00Annual management fee in %0.600Security Number (ISIN)Launch dateLU007631600814/03/1997CommentWhen US 10-year yields reached a technical level of 5.30%, marking the highest level in 5 years,buyers pushed yields down, leaving the US 10-year yield range-bound between 5.05% and 5.20%.Yields rose during <strong>June</strong> on the back of stronger economic data and the return of risk aversion on theyield curve, translating into higher yields for longer bonds. Comments from the US Federal Reservestill suggest that they are on hold. Fresh concerns about subprime loans have re-entered the marketand developments on the US housing market remain the biggest risk for the economy. The yieldcurve on 2-10 year paper, which slightly inverted at the start of <strong>June</strong>, steepened sharply to around+20 basis points (bp) at the end of the month. We remain neutral versus the benchmark. At the endof the month, the fund’s duration stretched to 5.34 years and it was yielding 4.87%.Performance (in base currency, indexed at 100)11411211010810610410210030/06/2004 30/06/2005 30/06/2006 29/06/<strong>2007</strong>Dollar Bond FundAsset type breakdown in %Government Bonds 96.37Net Liquid Assets 3.63JP Morgan US Gov. Bond Index - Total ReturnCredit rating breakdown in %Aaa 96.37Top Holdings in %Us Treasury 5% 15.08.11 26.03US Treasury 4.5% 15.11.15 22.89US Treasury 4% 15.06.09 21.25US Treasury 8.125% 15.08.21 8.71US Treasury 4.5% 30.04.12 8.48US Treasury 5.25% 15.11.28 8.10US Treasury 4.5% 15.02.36 0.91Net Liquid Assets 3.63Empty 20.00Empty 20.00Empty 20.00Empty 20.00Empty 20.00Empty 20.00Empty 20.00Empty 20.00Empty 20.00Empty 20.00
<strong>Nordea</strong> 1 – Euro Bond FundPerformance in %TimeframeEUR* Index**Current year-1.94 -1.751 month-0.53 -0.641 year0.13 0.733 years5.64 9.015 years16.34 23.792006 -1.01 -0.25Since launch48.05 79.93*Base currency **Index in base currencyKey figures - 3 years30/06/2004 - 29/06/<strong>2007</strong> Fund Index*Annualised return in %Annualised standard deviationCorrelationBetaTracking errorAverage maturity1.842.660.980.940.639.132.922.92––––Duration in years**5.83 –Risk free rate used in % 4.76 –*JP Morgan EMU Aggregate All Mats. - Total Return**Duration figures are not option-adjustedFund dataManagement teamBase currencyLast NAVShare classFund categoryGlobal Fixed IncomeEUR7.57BPAccumulatingAUM (Million EUR)18.18Minimum investment (EUR)Front end fee in %503.00Annual management fee in %0.600Security Number (ISIN)Launch dateLU007631545505/07/1996CommentLong bond yields continued higher during <strong>June</strong> to stand at a current level of 4.61% versus 4.42% atthe end of May. The driver is still expectations for improved economic growth and the risk of higherinflation. Credit spreads were slightly wider following renewed concerns over the US mortgagemarket and a heavy pipeline of new issues coming to the market. We expect new issuance to slowdown during the summer break, and will watch the US mortgage market for further deterioration.Performance (in base currency, indexed at 100)11411211010810610410210030/06/2004 30/06/2005 30/06/2006 29/06/<strong>2007</strong>Euro Bond FundGeographical allocation in %Germany 59.62Spain 12.76United Kingdom 8.14United States of America 4.38Sweden 2.68Netherlands 2.45Belgium 2.42Italy 1.36Cayman Islands 1.07Denmark 0.74Australia 0.53Top Holdings in %Germany 5% 04.01.12 20.73Germany 4.75% 04.07.34 16.23Germany 4.75% 04.07.08 11.59Banco Esp de Cred 4% 12.05.10 8.10Germany 3.25% 04.07.15 5.54Bradford & Bingley 3.75% 26.05.09 5.42Germany 5.25% 04.07.10 3.37Belgium 5.5%.28.03.28 2.42Spain 4.75% 30.07.14 2.39Santander Intl 3.375% 17.02.10 2.26JP Morgan EMU Aggregate All Mats. - Total RetuCredit rating breakdown in %Aaa 66.76Aa1 12.78A3 3.53Aa2 3.17A1 2.52NA 2.13A2 1.69Aa3 1.63Baa1 1.62Baa2 0.59Net Liquid Assets 3.58Empty 20.00
<strong>Nordea</strong> 1 – European High Yield Bond FdPerformance in %TimeframeEUR* Index**Current year3.01 1.871 month-0.89 -1.301 year8.81 8.033 years– –5 years– –2006 7.75 8.64Since launch10.99 10.67*Base currency **Index in base currencyKey figures - 3 years30/06/2004 - 29/06/<strong>2007</strong> Fund Index*Annualised return in %Annualised standard deviationCorrelationBetaTracking errorAverage maturity–––––5.76––––––Duration in years**1.75 –Risk free rate used in %– –*Merill Lynch Europ. Cur. High Yield Constrained In**Duration figures are not option-adjustedFund dataManagement teamBase currencyLast NAVShare classFund categoryAUM (Million EUR)Minimum investment (EUR)Front end fee in %Annual management fee in %Security Number (ISIN)Launch dateHigh Yield Fixed IncomeEUR16.79BPAccumulating454.24503.000.850LU014179950102/01/2006CommentThe fund yielded a negative return in <strong>June</strong> that nevertheless was far less than that of the benchmark.The European high-yield market finally showed some weakness during <strong>June</strong>, when investors’ riskawareness increased after reports emerged of problems in certain hedge funds and issuesregarding pricing of CLOs. The portfolio significantly outperformed the benchmark due toconservative positioning and a high cash level. The fund has low interest sensitivity with a durationaround 2.3 and a fairly high percentage of the fund is invested in senior secured bonds that are notthat sensitive to credit events. Fundamentals are still quite good, and the European default rate forMay is 2.14%. Euro HY spreads increased from 214 basis points (bp) to 225 bp, according toCSFB index data. Preliminary benchmark data show the least negative return in Non-CyclicalConsumer Goods, Technology and Cyclical Service. The worst performing sectors were Media,Energy and Basic Industry. Trading activity in the fund was fairly high in <strong>June</strong>, with the main focus ondeployment of cash due to inflows. We invested in new issues from Clondalkin, Versatel, SIG andArdagh. The current spread versus government bonds is below the historical average, but thedefault rate is expected to stay approximately at the current level. We think that the market is priceda bit tight at the current level, and we continue to see some downside risk in the coming months.Performance (in base currency, indexed at 100)11411211010810610410210030/12/2005 29/12/2006European High Yield Bond FdCurrency breakdown in %EUR 82.82USD 1.98GBP 1.41Net Liquid Assets 13.79Merill Lynch Europ. Cur. High Yield ConstrainedAsset type breakdown in %Corporate Bonds 79.56Top Holdings in %Lighthouse Intl Co 8% 30.04.14 3.79Eco Bat Fin Plc 10.125% 31.01.13 3.44FS Funding 8.875% 15.05.16 3.30WDAC Subsidiary Corp 8.5% 01.12.1 3.21Versatel AG FRN 15.06.14 2.94Kronos Inc 6.5% 15.04.13 2.76TDS Investor Corp 10.875% 01.09.16 2.46Beverage Packanging 8% 15.12.16 2.30Codere Finance 8.25% 15.06.15 2.21Grohe Holding FRN 19.01.14 2.12Other 5.51Government Bonds 1.14Net Liquid Assets 13.79Empty 20.00Empty 20.00Empty 20.00Empty 20.00Empty 20.00Empty 20.00Empty 20.00Empty 20.00
<strong>Nordea</strong> 1 – Global Bond Fund (DKK)Performance in %TimeframeDKK* EUR Index**Current year-3.70 -3.52 -3.061 month-1.40 -1.31 -1.101 year-3.88 -3.66 -2.993 years-4.18 -4.31 -0.715 years-0.90 -1.07 -0.972006 -6.67 -6.62 -5.29Since launch 126.91 143.76 148.63*Base currency **Index in base currencyKey figures - 3 years30/06/2004 - 29/06/<strong>2007</strong> Fund Index*Annualised return in %Annualised standard deviationCorrelationBetaTracking errorAverage maturity-1.414.450.980.980.838.34-0.244.48––––Duration in years**6.27 –Risk free rate used in %*JP Morgan Global (DKK) - Total Return**Duration figures are not option-adjusted5.18 –Fund dataManagement teamBase currencyLast NAVShare classFund categoryGlobal Fixed IncomeDKK226.91BPAccumulatingAUM (Million DKK)23.19Minimum investment (EUR)Front end fee in %503.00Annual management fee in %0.600Security Number (ISIN)Launch dateLU006432077220/10/1989CommentGlobal bond yields continued rising during the first half of <strong>June</strong> on the back of stronger economicdata and the return of risk aversion on the yield curve, translating into higher yields for longer bonds.When US 10-year yields reached a technical level of 5.30%, marking the highest level in 5 years,buyers pushed yields down, leaving the US 10-year yield range-bound between 5.05% and 5.20%.Euro-area 10-year yields rose accordingly. The spread versus US has been volatile, currently ataround 50 basis points (bp). At the end of the month, fresh concerns about subprime loans havere-entered the market. In the Euro area, growth data is still strong. The European Central <strong>Bank</strong>(ECB) hiked rates to 4.00% in <strong>June</strong> and the market continues to price in further hikes in <strong>2007</strong>. Weclosed most of our long duration positions at the start of <strong>June</strong>, and the rest of it in the middle of themonth. At the start of <strong>June</strong> we took a FX position on the SEK to strengthen against the EUR andclosed the position mind-month. We are neutral versus the benchmark on duration and FX. At theend of the month, the fund’s duration stretched to 6.21 years and it was yielding 3.47%.Performance (in base currency, indexed at 100)11010810610410210098969430/06/2004 30/06/2005 30/06/2006 29/06/<strong>2007</strong>Global Bond Fund (DKK)Geographical allocation in %United States of America 25.20Germany 22.23Japan 11.89International Institutions 11.65United Kingdom 7.67Canada 2.15Sweden 0.69Net Liquid Assets 18.50JP Morgan Global (DKK) - Total ReturnCredit rating breakdown in %Aaa 76.62Top Holdings in %US Treasury 4.625% 29.02.12 10.55US Treasury 4% 15.06.09 10.52UK Treasury 4% 07.09.16 7.67IADB 1.9% 08.07.09 7.25Japan Fin Corp 1.35% 26.11.13 7.01Germany 4% 04.01.37 6.58Germany 4.75% 04.07.28 6.45Germany 3.25% 04.07.15 5.88Development Bk Japan 1.05% 20.06.2 4.88European Inv.Bk 1.40% 20.06.17 4.40NA 4.88Net Liquid Assets 18.50Empty 20.00Empty 20.00Empty 20.00Empty 20.00Empty 20.00Empty 20.00Empty 20.00Empty 20.00Empty 20.00
<strong>Nordea</strong> 1 – Global Bond Fund (EUR)Performance in %TimeframeEUR* Index**Current year-3.88 -2.901 month-1.36 -1.011 year-4.06 -2.763 years-4.41 -0.845 years-1.25 -1.142006 -6.64 -5.23Since launch98.71 167.77*Base currency **Index in base currencyKey figures - 3 years30/06/2004 - 29/06/<strong>2007</strong> Fund Index*Annualised return in %Annualised standard deviationCorrelationBetaTracking errorAverage maturity-1.494.520.980.990.858.19-0.284.48––––Duration in years**6.46 –Risk free rate used in %*JP Morgan Global (EUR) - Total Return**Duration figures are not option-adjusted4.76 –Fund dataManagement teamBase currencyLast NAVShare classFund categoryGlobal Fixed IncomeEUR10.16BPAccumulatingAUM (Million EUR)28.97Minimum investment (EUR)Front end fee in %503.00Annual management fee in %0.600Security Number (ISIN)Launch dateLU006432115020/10/1989CommentGlobal bond yields continued rising during the first half of <strong>June</strong> on the back of stronger economicdata and the return of risk aversion on the yield curve, translating into higher yields for longer bonds.When US 10-year yields reached a technical level of 5.30%, marking the highest level in 5 years,buyers pushed yields down, leaving the US 10-year yield range-bound between 5.05% and 5.20%.Euro-area 10-year yields rose accordingly. The spread versus US has been volatile, currently ataround 50 basis points (bp). At the end of the month, fresh concerns about subprime loans havere-entered the market. In the Euro area, growth data is still strong. The European Central <strong>Bank</strong>(ECB) hiked rates to 4.00% in <strong>June</strong> and the market continues to price in further hikes in <strong>2007</strong>. Weclosed most of our long duration positions at the start of <strong>June</strong>, and the rest of it in the middle of themonth. At the start of <strong>June</strong> we took a FX position on the SEK to strengthen against the EUR andclosed the position mind-month. We are neutral versus the benchmark on duration and FX. At theend of the month, the fund’s duration stretched to 6.31 years and it was yielding 3.76%.Performance (in base currency, indexed at 100)11010810610410210098969430/06/2004 30/06/2005 30/06/2006 29/06/<strong>2007</strong>Global Bond Fund (EUR)Geographical allocation in %Germany 31.04United States of America 23.16Japan 17.21International Institutions 9.40United Kingdom 7.28Canada 2.29Sweden 1.20Net Liquid Assets 8.42JP Morgan Global (EUR) - Total ReturnCredit rating breakdown in %Aaa 77.84Top Holdings in %US Treasury 4.625% 29.02.12 18.91Germany 5% 04.07.12 12.69Japan 234 1.4% 20.09.11 10.15Germany 4.75% 04.07.28 6.21European Inv.Bk 1.40% 20.06.17 5.52Germany 3.25% 04.07.15 5.06UK Treasury 4% 07.09.16 4.81Germany 4% 04.01.37 3.94Development Bk Japan 1.05% 20.06.2 3.59IADB 1.9% 08.07.09 3.58A2 10.15NA 3.59Net Liquid Assets 8.42Empty 20.00Empty 20.00Empty 20.00Empty 20.00Empty 20.00Empty 20.00Empty 20.00Empty 20.00
<strong>Nordea</strong> 1 – Norwegian Bond FundPerformance in %TimeframeNOK* EUR Index**Current year-1.44 1.84 -1.241 month-0.54 1.29 -0.321 year-0.84 -1.30 0.043 years4.06 10.12 7.385 years23.40 15.02 31.532006 -0.90 -3.94 -0.01Since launch39.78 44.68 57.98*Base currency **Index in base currencyKey figures - 3 years30/06/2004 - 29/06/<strong>2007</strong> Fund Index*Annualised return in %Annualised standard deviationCorrelationBetaTracking errorAverage maturity1.342.070.970.970.615.632.402.34––––Duration in years**4.04 –Risk free rate used in % 7.13 –*CGBI WGBI NW ALL MATS (NOK) - Total Return**Duration figures are not option-adjustedFund dataManagement teamBase currencyLast NAVShare classFund categoryNordic Fixed IncomeNOK139.78BPAccumulatingAUM (Million NOK)239.23Minimum investment (EUR)Front end fee in %503.00Annual management fee in %0.600Security Number (ISIN)Launch dateLU008720991115/05/1998CommentAs in Europe and the US, Norwegian bond yields rose markedly in <strong>June</strong>. As expected, Norges <strong>Bank</strong>raised key rates by 25 basis points (bp) to 4.50% at its central bank council meeting 27 <strong>June</strong>.Moreover, the strategy interval for interest rates by the end of October was set at 4.50-5.50 %,indicating a key policy rate of 5.00% in October. However, the upward adjustment of theinterest-rate projection for end-<strong>2007</strong> and beyond was much larger than both we and the market hadexpected. The projections for 2008 were revised up around 50 bp, and Norges <strong>Bank</strong> sees the keyrate peaking at 5.75% by mid-2008. The main reasons put forward for this hawkish move arestronger-than-expected non-oil GDP growth in Norway. The central bank’s forecasts for oilinvestments have been revised up, providing more boost to economic growth. Last but not least,interest rates among Norway’s trading partners are much higher than in the prior strategy period,whereas NOK has remained virtually unchanged. Interest rates at the front end of the yield curverose significantly, while long-term interest rates were up just a few basis points. We are stillunderweight in the belly of the yield curve, and the fund has currently the same duration as thebenchmark. The average rating of the issuers making up the fund was AA-, according toMorningstar. At the end of the month, the fund was composed of 21 issues divided among 16different issuers.Performance (in base currency, indexed at 100)11010810610410210030/06/2004 30/06/2005 30/06/2006 29/06/<strong>2007</strong>Norwegian Bond FundAsset type breakdown in %Government Bonds 52.14Corporate Bonds 44.51Net Liquid Assets 3.34CGBI WGBI NW ALL MATS (NOK) - Total ReturnCredit rating breakdown in %NA 48.55Top Holdings in %Norway 6.5% 15.05.13 17.36Norway 5% 15.05.15 15.29Norway 4.25% 19.05.17 11.64Statkraft 5.35% 16.06.11 6.15Sparebanken More 4% 15.03.12 5.80Sparebanken Sør 4.25% 29.02.16 5.58Den Norske <strong>Bank</strong> 7.15% 16.05.11 4.37Norway T-Bill 0% 18.06.08 4.04Olav Thon Eiend. 3.75% 01.12.09 3.98Sparebanken Midt 3.8% 01.03.12 3.83Aaa 48.11Net Liquid Assets 3.34Empty 20.00Empty 20.00Empty 20.00Empty 20.00Empty 20.00Empty 20.00Empty 20.00Empty 20.00Empty 20.00
<strong>Nordea</strong> 1 – Sterling Bond FundPerformance in %TimeframeGBP* EUR Index**Current year-4.04 -4.39 -3.171 month-1.34 -0.45 -1.321 year-2.01 0.62 -1.183 years7.59 7.07 11.005 years14.63 10.52 21.372006 -0.86 1.18 0.16Since launch 202.00 212.23 318.99*Base currency **Index in base currencyKey figures - 3 years30/06/2004 - 29/06/<strong>2007</strong> Fund Index*Annualised return in %Annualised standard deviationCorrelationBetaTracking errorAverage maturity2.473.660.960.991.0315.123.543.58––––Duration in years**9.49 –Risk free rate used in %*JP Morgan United Kingdom - Total Return**Duration figures are not option-adjusted5.88 –Fund dataManagement teamBase currencyLast NAVShare classFund categoryGlobal Fixed IncomeGBP30.20BPAccumulatingAUM (Million GBP)8.93Minimum investment (EUR)Front end fee in %503.00Annual management fee in %0.600Security Number (ISIN)Launch dateLU006432069920/10/1989CommentUK bond yields rose in line with European bond markets in <strong>June</strong>, with 10-year gilt yields up 22 basispoints (bp) at 5.47%. The bond market is pricing in a high probability of further rate hikes. Economicdata has been more balanced. UK inflation numbers have moved below 3%. The <strong>Bank</strong> of England’smonetary policy statement showed 5-4 votes in favour of staying on hold with rates, indicating thatthe board was divided over the decision and that the next move might be a hike from the centralbank. Other macro indicators have been strong. House price inflation remains high and is helpingconsumer confidence and private consumption. We are neutral duration vs. the benchmark. At theend of the month, the fund’s duration stretched to 9.32 years and it was yielding 5.32%.Performance (in base currency, indexed at 100)11811611411211010810610410210030/06/2004 30/06/2005 30/06/2006 29/06/<strong>2007</strong>Sterling Bond FundAsset type breakdown in %Government Bonds 98.65Net Liquid Assets 1.35JP Morgan United Kingdom - Total ReturnCredit rating breakdown in %Aaa 86.81Top Holdings in %UK Treasury 4.75% 07.06.10 16.34UK Treasury 4.75% 07.09.15 14.88UK Treasury 5% 07.03.25 14.08UK Treasury 4.25% 07.03.36 10.03UK Treasury 4.25% 07.06.32 9.63UK Treasury 8% 07.06.21 9.47UK Treasury 5% 07.03.12 7.07UK Treasury 8.75% 25.08.17 6.18UK Treasury 4.25% 07.12.55 4.77UK Treasury 5% 07.09.14 4.43NA 11.84Net Liquid Assets 1.35Empty 20.00Empty 20.00Empty 20.00Empty 20.00Empty 20.00Empty 20.00Empty 20.00Empty 20.00Empty 20.00
<strong>Nordea</strong> 1 – Swedish Bond FundPerformance in %TimeframeSEK* EUR Index**Current year-1.92 -4.17 -1.451 month-0.90 -0.45 -0.821 year-0.40 -0.55 0.733 years7.92 6.67 11.005 years18.80 16.86 27.662006 -0.38 3.46 1.06Since launch 101.75 106.05 131.61*Base currency **Index in base currencyKey figures - 3 years30/06/2004 - 29/06/<strong>2007</strong> Fund Index*Annualised return in %Annualised standard deviationCorrelationBetaTracking errorAverage maturity2.572.730.980.990.546.843.542.69––––Duration in years**4.22 –Risk free rate used in %*JP Morgan Sweden - Total Return**Duration figures are not option-adjusted7.21 –Fund dataManagement teamBase currencyLast NAVShare classFund categoryNordic Fixed IncomeSEK201.75BPAccumulatingAUM (Million SEK)420.82Minimum investment (EUR)Front end fee in %503.00Annual management fee in %0.600Security Number (ISIN)Launch dateLU006432018604/08/1995CommentThe market reassessed its stance towards the US Federal Reserve’s monetary policy during <strong>June</strong>.There are no longer any expectations of monetary easing during <strong>2007</strong> and early 2008. Both theEuropean Central <strong>Bank</strong> (ECB) and the Riksbank hiked their respective key policy rates during <strong>June</strong>.The Riksbank was substantially more hawkish than the market expected and moved the repo ratepath upwards by 0.7 percentage points. Bond yields rose and the curve turned flatter. We reducedthe fund’s duration. The yield stands at a current 4.5%.Performance (in base currency, indexed at 100)11411211010810610410210030/06/2004 30/06/2005 30/06/2006 29/06/<strong>2007</strong>Swedish Bond FundAsset type breakdown in %Government Bonds 66.55Corporate Bonds 18.14Mortgage Institutions 11.69Net Liquid Assets 3.63JP Morgan Sweden - Total ReturnCredit rating breakdown in %Aaa 78.54Top Holdings in %Sweden 1051 3.75% 12.08.17 18.60Sweden 1041 6.75% 05.05.14 13.98Sweden 1046 5.5% 08.10.12 9.95Swedish Covered Bond 5.5% 17.12.08 8.93Sweden 1045 5.25% 15.03.11 7.32Sweden 1047 5% 01.12.20 6.52Stadshypotek 6% 15.06.11 6.20SEB Bolan 4% 564 15.06.11 5.78Spintab 168 6% 20.04.09 - Domestic 5.49Sweden 0% 15.08.07 4.73NA 8.91Aa1 5.49Aa3 3.43Net Liquid Assets 3.63Empty 20.00Empty 20.00Empty 20.00Empty 20.00Empty 20.00Empty 20.00Empty 20.00
<strong>Nordea</strong> 1 – Danish Kroner ReservePerformance in %TimeframeDKK* EUR Index**Current year1.32 1.51 2.081 month0.25 0.34 0.351 year2.56 2.80 3.883 years6.46 6.32 8.935 years11.81 11.62 14.812006 2.22 2.28 3.22Since launch49.76 50.14 59.19*Base currency **Index in base currencyKey figures - 3 years30/06/2004 - 29/06/<strong>2007</strong> Fund Index*Annualised return in %Annualised standard deviationCorrelationBetaTracking errorAverage maturity2.110.320.211.050.350.802.890.22––––Duration in years**0.35 –Risk free rate used in %*Denmark Interbank 3 Month - Total Return**Duration figures are not option-adjusted5.18 –Fund dataManagement teamBase currencyLast NAVShare classFund categoryNordic Fixed IncomeDKK149.76BPAccumulatingAUM (Million DKK)47.62Minimum investment (EUR)Front end fee in %501.00Annual management fee in %0.125Security Number (ISIN)Launch dateLU006432131727/01/1995CommentThe yield on the 3-month CIBOR benchmark rose by 6 basis points (bp) to 4.38% during <strong>June</strong>. Thefund underperformed compared to benchmark. The underperformance was mainly due to higheryields since the fund has been overweighted in duration. The European Central <strong>Bank</strong> (ECB) hikedrates to 4% in <strong>June</strong> and left the door open for another hike in the autumn. The ECB is clearly gettingclose to the neutralising level for rates, taking into consideration past, present and foreseen growthand inflation figures. The market is pricing in an additional hike by the second quarter of next year.So over the next months we see the possibility of good performance in short bonds. We thereforeintend to keep the current overweight of 0.25 in fund duration.Performance (in base currency, indexed at 100)11010810610410210030/06/2004 30/06/2005 30/06/2006 29/06/<strong>2007</strong>Danish Kroner ReserveCurrency breakdown in %DKK 96.74Net Liquid Assets 3.26Denmark Interbank 3 Month - Total ReturnAsset type breakdown in %Mortgage Institutions 80.24Top Holdings in %Realkredit DK 10D INK 4% 01.01.08 21.99<strong>Nordea</strong> Kredit INK 4% 01.01.08 Stl 20.61Nykredit INK 90D Stl 4% 01.01.08 18.85Denmark T-Bill 0% 03.12.07 16.50BRFkredit A/S 321B RTL 3% 01.01.0814.61Dansk Landsbrugs 4% INK 01.01.08 4.19Government Bonds 16.50Net Liquid Assets 3.26Empty 20.00Empty 20.00Empty 20.00Empty 20.00Empty 20.00Empty 20.00Empty 20.00Empty 20.00Empty 20.00
<strong>Nordea</strong> 1 – EURO ReservePerformance in %TimeframeEUR* Index**Current year1.60 1.971 month0.28 0.331 year3.04 3.703 years6.84 8.585 years11.82 14.112006 2.32 3.09Since launch45.80 49.97*Base currency **Index in base currencyKey figures - 3 years30/06/2004 - 29/06/<strong>2007</strong> Fund Index*Annualised return in %Annualised standard deviationCorrelationBetaTracking errorAverage maturity2.230.200.601.000.204.492.780.24––––Duration in years**0.42 –Risk free rate used in %*Germany Euro - 3 Month - Total Return**Duration figures are not option-adjusted4.76 –Fund dataManagement teamBase currencyLast NAVShare classFund categoryGlobal Fixed IncomeEUR14.58BPAccumulatingAUM (Million EUR)80.74Minimum investment (EUR)Front end fee in %501.00Annual management fee in %0.125Security Number (ISIN)Launch dateLU006432247127/01/1995CommentThe fund’s duration was 0.15 years longer than that of its reference index during <strong>June</strong>. EURIBORrates continued to rise during the month. For example, six-month EURIBOR is trading around thecurrent 4.30% level compared to 4.25% at the end of May. The European Central <strong>Bank</strong> (ECB) hikedrates to 4% in <strong>June</strong> and left the door open for another hike in the autumn. The ECB is clearly gettingclose to the neutralising level for rates, taking into consideration past, present and foreseen growthand inflation figures. The market is pricing in an additional hike by the second quarter of next year.This would take the ECB’s refinancing rate to 4.50% by then. We still find money marketinvestments attractive in the present market environment especially taking into consideration thevery flat interest-rate curve. No major changes were made to the portfolio in <strong>June</strong>. The fund’s newinvestments were placed in bank FRNs. Most of the holdings remain in FRNs.Performance (in base currency, indexed at 100)11010810610410210030/06/2004 30/06/2005 30/06/2006 29/06/<strong>2007</strong>EURO ReserveCurrency breakdown in %EUR 92.43Net Liquid Assets 7.57Germany Euro - 3 Month - Total ReturnAsset type breakdown in %Corporate Bonds 52.46Top Holdings in %Austria (Rep.of) 5.0% 15.01.08 6.22Germany 3.25% 13.06.08 6.13Portugal 3.25% 15.07.08 6.12France BTAN 3% 12.07.08 6.11Italy 2.5% 15.06.08 6.09Soc Gen FRN 15.03.16 3.74Erste Bk Der Oest Spar FRN 19.07.17 3.74Unicredito Italiano FRN 23.07.14 3.72Natixis FRN 26.01.17 3.72ABN Amro FRN 31.05.18 3.72Government Bonds 33.77Other 3.71Mortgage Institutions 2.49Net Liquid Assets 7.57Empty 20.00Empty 20.00Empty 20.00Empty 20.00Empty 20.00Empty 20.00Empty 20.00
<strong>Nordea</strong> 1 – Norwegian Kroner ReservePerformance in %TimeframeNOK* EUR Index**Current year1.79 5.18 2.261 month0.42 2.28 0.391 year3.14 2.66 4.073 years7.21 13.45 9.245 years18.72 10.66 19.632006 2.38 -0.76 3.24Since launch51.29 56.99 65.44*Base currency **Index in base currencyKey figures - 3 years30/06/2004 - 29/06/<strong>2007</strong> Fund Index*Annualised return in %Annualised standard deviationCorrelationBetaTracking errorAverage maturity2.350.24-0.010.842.302.182.992.29––––Duration in years**0.04 –Risk free rate used in %*Norway Deposit 3 Month - Total Return**Duration figures are not option-adjusted7.13 –Fund dataManagement teamBase currencyLast NAVShare classFund categoryNordic Fixed IncomeNOK151.29BPAccumulatingAUM (Million NOK)379.70Minimum investment (EUR)Front end fee in %501.00Annual management fee in %0.125Security Number (ISIN)Launch dateLU007881282211/07/1997CommentNorwegian money market rates rose approximately 15 basis points (bp) in <strong>June</strong>. As expected,Norges <strong>Bank</strong> raised key rates by 25 basis points (bp) to 4.50% at its central bank council meeting27 <strong>June</strong>. Moreover, the strategy interval for interest rates by the end of October was set at4.50-5.50 %, indicating a key policy rate of 5.00% in October. However, the upward adjustment ofthe interest-rate projection for end-<strong>2007</strong> and beyond was much larger than both we and the markethad expected. The projections for 2008 were revised up around 50 bp, and Norges <strong>Bank</strong> sees thekey rate peaking at 5.75% by mid-2008. The main reasons put forward for this hawkish move arestronger-than-expected non-oil GDP growth in Norway. The central bank’s forecasts for oilinvestments have been revised up, providing more boost to economic growth. Last but not least,interest rates among Norway’s trading partners are much higher than in the prior strategy period,whereas NOK has remained virtually unchanged. The fund’s duration is still slightly underweightagainst the benchmark, and a large portion of the fund is invested in floating rate notes (FRNs),which makes the fund less sensitive to higher money market rates. The average rating of the issuersmaking up the fund was A-, according to Morningstar. At the end of the month, the fund wascomposed of 35 issues divided among 26 issuers.Performance (in base currency, indexed at 100)11010810610410210030/06/2004 30/06/2005 30/06/2006 29/06/<strong>2007</strong>Norwegian Kroner ReserveCurrency breakdown in %NOK 95.16Net Liquid Assets 4.84Norway Deposit 3 Month - Total ReturnAsset type breakdown in %Corporate Bonds 93.07Top Holdings in %Statkraft FRN 17.06.09 5.30Norwegian Property FRN 22.03.10 5.27Sparebanken Vest FRN 02.02.09 5.26Bergenshalvoens K.K FRN 21.01.08 4.89Storebrand <strong>Bank</strong> 4.15% 05.12.08 3.98Den Norske <strong>Bank</strong> 6.15% 21.12.07 3.97Sparebanken Sogn Og Fj FRN 10.11.1 3.96Sparebanken Pluss FRN 17.06.09 3.96E-Co Energy AS FRN 27.04.10 3.96Sparebanken Rogaland FRN 15.07.10 3.95Government Bonds 2.09Net Liquid Assets 4.84Empty 20.00Empty 20.00Empty 20.00Empty 20.00Empty 20.00Empty 20.00Empty 20.00Empty 20.00Empty 20.00
<strong>Nordea</strong> 1 – Swedish Kroner ReservePerformance in %TimeframeSEK* EUR Index**Current year1.49 -0.84 1.751 month0.23 0.68 0.291 year2.68 2.53 3.233 years6.13 4.90 7.555 years14.51 12.64 14.942006 2.04 5.97 2.58Since launch62.32 63.40 65.73*Base currency **Index in base currencyKey figures - 3 years30/06/2004 - 29/06/<strong>2007</strong> Fund Index*Annualised return in %Annualised standard deviationCorrelationBetaTracking errorAverage maturity2.000.230.691.000.171.872.460.17––––Duration in years**0.19 –Risk free rate used in %*Sweden Interbank 3 Month - Total Return**Duration figures are not option-adjusted7.21 –Fund dataManagement teamBase currencyLast NAVShare classFund categoryNordic Fixed IncomeSEK162.32BPAccumulatingAUM (Million SEK)456.99Minimum investment (EUR)Front end fee in %501.00Annual management fee in %0.125Security Number (ISIN)Launch dateLU006432166327/01/1995CommentThe market reappraised its view of US Federal Reserve monetary policy moves during <strong>June</strong>. Thereare no longer any expectations of monetary easing during <strong>2007</strong> and early 2008. Both Sweden’sRiksbank and the European Central <strong>Bank</strong> (ECB) hiked their respective key lending rates during<strong>June</strong>. The Riksbank was substantially more hawkish than the market had expected and drove therepo rate path upwards by 0.7 percentage points to 4.4% for second quarter 2009. The yield curveturned flatter and during <strong>June</strong> the 10Y bond rose by 20 basis points (bp) and the 2Y bond by 10bp. Credit spreads widened. We have been investing in Scania FRNs maturing 2009. The fund’sduration currently runs to 85 days.Performance (in base currency, indexed at 100)10810710610510410310210110030/06/2004 30/06/2005 30/06/2006 29/06/<strong>2007</strong>Swedish Kroner ReserveCurrency breakdown in %SEK 99.59Net Liquid Assets 0.41Sweden Interbank 3 Month - Total ReturnAsset type breakdown in %Corporate Bonds 91.90Top Holdings in %Sparebanken Rogaland FRN 18.01.10 9.19Swedish Match AB FRN 16.03.09 7.67OM Group FRN 11.03.08 7.22Spintab AB 5% 18.06.08 5.51Telenor Asa FRN 08.03.10 4.82E.ON Sweden FRN 24.11.08 4.82Sandvik AB Series 107 FRN 17.06.09 4.82Sveaskog FRN 18.08.09 4.40Skanska FRN 178 19.09.07 4.38<strong>Nordea</strong> <strong>Bank</strong> Sweden FRN 19.02.14 4.17Other 7.68Net Liquid Assets 0.41Empty 20.00Empty 20.00Empty 20.00Empty 20.00Empty 20.00Empty 20.00Empty 20.00Empty 20.00Empty 20.00
<strong>Nordea</strong> 1 – US-Dollar ReservePerformance in %TimeframeUSD* EUR Index**Current year2.461 month0.401 year5.043 years10.715 years15.07-0.08 2.490.02 0.37-1.12 5.06-0.36 11.95-15.00 14.552006 4.58 -6.32 4.89Since launch50.00 26.46 45.41*Base currency **Index in base currencyKey figures - 3 years30/06/2004 - 29/06/<strong>2007</strong> Fund Index*Annualised return in %Annualised standard deviationCorrelationBetaTracking errorAverage maturity3.450.440.960.990.144.003.830.35––––Duration in years**0.12 –Risk free rate used in % 4.91 –*US Treasury Bill Second Market 3 Month - Total Ret**Duration figures are not option-adjustedFund dataManagement teamBase currencyLast NAVShare classFund categoryGlobal Fixed IncomeUSD15.00BPAccumulatingAUM (Million USD)30.14Minimum investment (EUR)Front end fee in %501.00Annual management fee in %0.125Security Number (ISIN)Launch dateLU007631618014/03/1997CommentThe 3M LIBOR was flat at 5.36% for the entire month of <strong>June</strong>. The FOMC meeting in May revisedits customary statement to the effect that US economic growth had slowed during Q1 and that coreinflation remained somewhat elevated. The 3M LIBOR rate is 5.36%, still indicating that marketperceptions towards the US Federal Reserve’s monetary policy remain unchanged. The 3M LIBORhas been within the 5.33% to 5.36% range for the past nine months.Performance (in base currency, indexed at 100)11211010810610410210030/06/2004 30/06/2005 30/06/2006 29/06/<strong>2007</strong>US-Dollar ReserveCurrency breakdown in %USD 97.11Net Liquid Assets 2.89US Treasury Bill Second Market 3 Month - TotalAsset type breakdown in %Corporate Bonds 90.47Top Holdings in %Allied Irish <strong>Bank</strong>s PLC FRN 30.07.10 3.33ING <strong>Bank</strong> FRN 14.10.14 3.33Standard Chartered FRN 03.02.15 3.33Barclays <strong>Bank</strong> Plc FRN 11.09.13 3.32DaimlerChrysler FRN 13.03.09 3.32ANZ <strong>Bank</strong>ing Group FRN 28.04.15 3.32Anglo Irish <strong>Bank</strong> FRN 27.07.10 3.32American General Fin FRN 17.08.11 3.32Northern Rock Plc FRN 21.10.10 3.32Bancaja US Debt FRN 10.07.09 3.32Other 6.64Net Liquid Assets 2.89Empty 20.00Empty 20.00Empty 20.00Empty 20.00Empty 20.00Empty 20.00Empty 20.00Empty 20.00Empty 20.00
Administrative detailsOrdersOrders received at the registered address of the custodian bank, <strong>Nordea</strong> <strong>Bank</strong> S.A. before 15.30 p.m. Luxembourg time on abanking business day in Luxembourg will be effected the same day if cleared funds are available. For details please see backcover.Minimum subscriptionEUR 50 or its equivalentTransfersPayments should preferably be made by bank transfer. If payment is made by cheque, the subscription and allotment ofshares shall only be effected once funds are cleared in the base currency of the relevant Sub-fund. Cash payments into theSub-fund can be made at <strong>Nordea</strong> <strong>Bank</strong> S.A., Luxembourg, by investors personally.Share classesPlease consult the Prospectus for which share classes are available in your country. B shares are available in base currency,EUR, NOK, SEK sub-classes.Paying agents Ccy Paying agents Account SWIFT/BICCHF Credit Suisse, ZürichCHF0404835095967033000 CRESCHZZ80ADKK <strong>Nordea</strong> <strong>Bank</strong> Danmark A/S, KopenhagenDK3620005000409107 NDEADKKKEUR <strong>Nordea</strong> <strong>Bank</strong> Finland Plc, Niederlassung Deutschl., Ff.M. DE79514303001509790002 NDEADEFFEUR Erste <strong>Bank</strong> der Österreichischen Sparkassen AG, Wien AT122011100050540149 GIBAATWWGBP <strong>Nordea</strong> <strong>Bank</strong> Finland Plc, London BranchGB10NDEA40487806904250 NDEAGB2LJPY Tokyo <strong>Bank</strong> of Tokyo-Mitsubishi LTD, Tokyo653-0435732BOTKJPJTNOK <strong>Nordea</strong> <strong>Bank</strong> Norge ASA, OsloNO3960010209458 NDEANOKKSEK <strong>Nordea</strong> <strong>Bank</strong> Sweden AB (publ), Stockholm3952-7701120NDEASESSUSD JP Morgan Chase Manhattan <strong>Bank</strong>, New York400949997CHASUS33PricingThe sub-funds are priced on every business day in Luxembourg. Prices become available after 18.00.Pricing PublicationAustriaFranceGermanyInternetItalyLuxembourgPan-EuropeanReutersSpainSwitzerlandDer Standard, Die Presse, WirtschaftsblattLa TribuneBörsen Zeitung, Die Welt, FAZ, Handelsblatt, Süddeutsche ZeitungSee back coverIl Sole 24 Ore, Milano FinanzaLuxemburger WortFinancial Times, The Wall Street Journal EuropeFUNDGE32/33Expansionl'Agefi Suisse, Neue Züricher ZeitungConfirmationsAll shares are held in non-certified form. Confirmation advice is issued as a record of entry on the shareregister.
www.nordea.luThe sub-funds mentioned are part of the <strong>Nordea</strong> 1, SICAV, an open-ended Luxembourg-based investment company (Société d'Investissementà Capital Variable), validly formed and existing in accordance with the laws of Luxembourg and with the European Community Directive 85/611/CEEof 20th December 1985. Investments in the <strong>Nordea</strong> funds should be made on the basis of the current prospectus, which is available, along withthe simplified prospectus, current annual and semi-annual reports, free of charge upon request from <strong>Nordea</strong> Investment Funds S.A., 562, ruede Neudorf, P.O. Box 782, L-2017 Luxembourg, from the local representatives or information agents, or from our distributors.Past performance is not necessarily a guide to the future and investors may not recover the full amount invested. The minimum subscription amountis EUR 50 or the currency equivalent thereof. A transaction involving a foreign exchange transaction may be subject to fluctuations of currencyvalues which may affect the value of an investment. The value of shares can fluctuate and is not guaranteed. Investments in Emerging Marketsinvolve a higher element of risk.<strong>Nordea</strong> Investment Funds S.A. only publishes product-related information and does not make any investment recommendations.Further information can be obtained from your financial advisor. He/she can advise you independently of <strong>Nordea</strong> Investment Funds S.A.Published by <strong>Nordea</strong> Investment Funds S.A., 562, rue de Neudorf, P.O. Box 782, L-2017 Luxembourg.Additional information for investors in Germany:Information and Paying Agent in Germany is <strong>Nordea</strong> <strong>Bank</strong> Finland Plc, Niederlassung Deutschland, Grüneburgweg 119, D-60323 Frankfurt amMain. The above-mentioned fund documentation is also available on paper from here.Additional information for investors in the United Kingdom:Approved by <strong>Nordea</strong> <strong>Bank</strong> Finland Plc, London Branch, which is regulated by the FSA in the United Kingdom.Additional information for investors in Austria:Sub-paying Agent and Representative in Austria is the Erste <strong>Bank</strong> der Österreichischen Sparkassen AG, Graben 21, A-1010 Vienna.Additional information for investors in Switzerland:The Swiss Federal <strong>Bank</strong>ing Commission (SFBC) has granted authorisation for the <strong>Nordea</strong> 1, SICAV to be publically distributed in and fromSwitzerland. The documents listed above, as well as the Articles of Association, are available free of charge from the Swiss Representative andPaying Agent, <strong>Nordea</strong> <strong>Bank</strong> S.A. Luxemburg, Zweigniederlassung Zürich, Mainaustrasse 21-23, CH-8008 Zürich. Telephone (+41) 44 421 4242, Telefax (+41) 44 421 42 82.Additional information for investors in Estonia:Representative and Paying Agent in Estonia is <strong>Nordea</strong> <strong>Bank</strong> Finland Plc, Estonia Branch, Hobujaama 4, 15068 Tallinn.Performance calculated NAV to NAV gross income reinvested, in the respective sub-funds‘ base currencies,, excluding initial and exit chargesas per end of this report.Source: unless otherwise stated, <strong>Nordea</strong>.MR_N1_INT_eng