Uganda Bureau of Statistics
Uganda Bureau of Statistics
Uganda Bureau of Statistics
You also want an ePaper? Increase the reach of your titles
YUMPU automatically turns print PDFs into web optimized ePapers that Google loves.
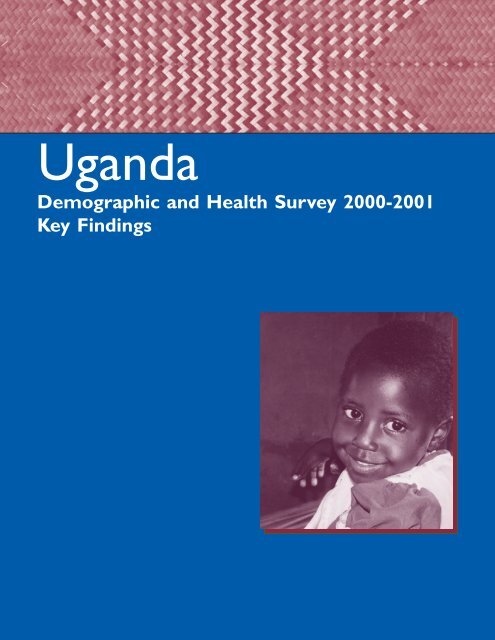
<strong>Uganda</strong>Demographic and Health Survey 2000-2001Key Findings
This report highlights the findings <strong>of</strong> the 2000-2001 <strong>Uganda</strong> Demographic and Health Survey (UDHS), anationally representative survey <strong>of</strong> households and <strong>of</strong> women age 15-49 and men age 15-54. Interviewswere successfully conducted with 7,246 women age 15-49 and 1,962 men age 15-54. Information wasalso collected about children born to the women surveyed. Detailed questions about vaccination,breastfeeding, food supplementation, and illnesses were asked about children born in the 5 years beforethe survey.The primary objective <strong>of</strong> the survey is to provide policymakers and programme managers with detailedinformation on fertility, family planning, childhood and adult mortality, maternal and child health, andnutrition, as well as knowledge and attitudes about HIV/AIDS.The survey was fielded between September 28, 2000, and March 3, 2001. Survey results are presented atthe national level; by urban and rural residence, and for each <strong>of</strong> four regions <strong>of</strong> the country. Results <strong>of</strong>this survey can be compared with those <strong>of</strong> the two previous <strong>Uganda</strong> DHS surveys, the 1988-89 UDHSand the 1995 UDHS. However, caution needs to be exercised in analysing trends on the basis <strong>of</strong> the threedata sets, because <strong>of</strong> differences in their geographic coverage. In the 2000-2001 UDHS, all but four <strong>of</strong><strong>Uganda</strong>’s 45 districts 1 were included in the survey. The excluded districts were Bundibugyo, Gulu,Kasese and Kitgum.The 2000-2001 <strong>Uganda</strong> Demographic and Health Survey (UDHS) was conducted by the <strong>Uganda</strong> <strong>Bureau</strong><strong>of</strong> <strong>Statistics</strong>. Funding for the survey was provided by the U.S. Agency for International Development(USAID), the Department for International Development (DFID/<strong>Uganda</strong>), UNICEF/<strong>Uganda</strong>, andUNFPA/<strong>Uganda</strong>. The UDHS is part <strong>of</strong> the world wide Demographic and Health Surveys (DHS) project,which was designed to collect, analyse, and disseminate data on fertility, family planning, maternal andchild health and HIV/AIDS.Additional information about the survey may be obtained from the <strong>Uganda</strong> <strong>Bureau</strong> <strong>of</strong> <strong>Statistics</strong> (UBOS),P.O. Box 13, Entebbe, <strong>Uganda</strong>; telephone (256-41) 320-741; fax (256-41) 320-147; e-mailubos@infocom.co.ug. Additional information about the DHS programme may be obtained by writing toMEASURE DHS+, ORC Macro, 11785 Beltsville Drive, Suite 300, Calverton, MD 20705, USA; telephone301-572-0200; fax 301-572-0999; e-mail: reports@macroint.com.1The number <strong>of</strong> districts has since increased to 56. The newly formed districts are Kayunga and Wakiso in the Central Region; Kaberamaido,Mayuge, and Sironko in the Eastern Region; Pader, Nakapiripirit, and Yumbe in the Northern Region; and Kanungu, Kamwenge, and Kyenjojoin the Western Region.Cover photo: S. Poedjastoeti
2000-2001 DEMOGRAPHIC AND HEALTH SURVEYKEY FINDINGSFertilityLevels and trends .................................................................................................... 2Fertility by background characteristics .......................................................... 2Adolescent fertility ................................................................................................. 2Factors influencing fertility level ...................................................................... 3Polygnous unions .................................................................................................... 3Fertility regulationLevels and trends ................................................................................................... 4Family planning use by background characteristics ................................. 4Source <strong>of</strong> family planning services ................................................................. 5Unmet need for family planning ..................................................................... 5Maternal and child healthAntenatal care .......................................................................................................... 6Delivery characteristics ........................................................................................ 6Postnatal care ........................................................................................................... 6Immunisation <strong>of</strong> children .................................................................................... 7Treatment <strong>of</strong> childhood diseases ..................................................................... 7S. PoedjastoetiNutritional statusInfant feeding practices ....................................................................................... 8Micronutrients .......................................................................................................... 8Children’s nutritional status ................................................................................ 8Women’s nutritional status ................................................................................. 9Prevalence <strong>of</strong> anaemia ........................................................................................ 9MortalityInfant and child mortality .................................................................................. 10Adult mortality ...................................................................................................... 10Maternal mortality ............................................................................................... 10HIV/AIDS awareness and practicesHIV/AIDS awareness and practices ............................................................... 11Prevalence <strong>of</strong> sexually transmitted diseases ........................................... 11HIV/AIDS testing ................................................................................................... 11Fact sheet.................................................................................................12
Page 2How does fertility in<strong>Uganda</strong> compare tothat in other countries?According to findings from the2000-2001 UDHS and data availablefrom other DHS surveys, <strong>Uganda</strong> hasthe highest TFR <strong>of</strong> any nation ineastern and southern Africa.Country/YearTFR<strong>Uganda</strong> 2000-2001 6.9Malawi 2000 6.3Zambia 1996 6.1Eritrea1995 6.1Ethiopia 2000 5.9Rwanda 2000 5.8Tanzania 1999 5.6Zimbabwe 1999 4.0South Africa 1998 2.9FERTILITYThe 2000-2001 UDHS collected information on various fertility measures, which arepresented to show the levels, patterns, and trends <strong>of</strong> current and completed fertility.Data were also collected on birth intervals and on the age at which women initiatemarriage and childbearing. Information on current and completed fertility is usefulin monitoring and evaluating the impact <strong>of</strong> the population programme in <strong>Uganda</strong>.Levels and trendsOn average, a <strong>Uganda</strong>n woman would have 6.9 children by theend <strong>of</strong> her reproductive years if the current fertility pattern prevailed.The UDHS results show that fertility in <strong>Uganda</strong> has remainedstable over the past decade. Although the total fertility rate(TFR) declined from 7.3 births per woman in 1986-88 to 6.9 birthsin 1993-1995, the TFR has remained at the same level since then.Fertility by background characteristicsFertility levels vary according to residence and education. Ruralwomen have much higher fertility than urban women (7.4 childrencompared with 4.0 children per woman). Total fertility rates arelowest in the Central Region (5.7 children per woman) and highestin the Northern Region (7.9 children per woman). Women whohave received some secondary education have about four childrenfewer than women with no education (3.9 children compared with7.8 children per woman). Sharper variations in the total fertilityrate are shown by women’s wealth. Whereas total fertility rate forwomen in the lowest quintile is 8.5 births per woman, for thehighest quintile it is only 4.1 births per woman.Adolescent fertilityTeenage pregnancy and motherhood have constituted a majorhealth and social concern in <strong>Uganda</strong>, both because they are associ-In comparison to countries outsidethis region for which comparabledata are available, <strong>Uganda</strong>’s level <strong>of</strong>fertility found in the recent survey isonly lower than that <strong>of</strong> Niger 1998(7.5 births per woman) and slightlyhigher than that <strong>of</strong> Burkina Faso1999 (6.8), Mali 1996 (6.7), Chad(6.6), and Yemen 1997 (6.5).
Page 3ated with higher morbidity and mortality for both the mother andthe child and because teenage pregnancy <strong>of</strong>ten ends the education<strong>of</strong> the mother. Overall, 31 percent <strong>of</strong> teenagers have begun childbearing,with 26 percent being mothers and 6 percent beingpregnant with their first child. That represents a notable declinefrom the 43 percent <strong>of</strong> teenagers who had begun childbearingobserved in the 1995 UDHS.Factors influencing fertility levelBesides the use <strong>of</strong> contraception, the fertility level is influenced bymarriage, sexual activity, return <strong>of</strong> menstruation after childbirth,and sexual abstinence. Although the median age at first marriagefor women age 25-49 is 17.8, the median age at first sexual intercoursefor these women is 16.6, indicating that women generallystart having sex about 1 year before they marry. Data from the2000-2001 UDHS indicate no change in the pattern <strong>of</strong> initiation <strong>of</strong>sexual activity in the recent past.In the absence <strong>of</strong> contraception, the exposure to the risk <strong>of</strong> pregnancyin the period after birth is determined by two major factors:the length <strong>of</strong> absence <strong>of</strong> menstruation after childbirth (postpartumamenorrhoea) which is highly dependent upon the extent <strong>of</strong>breastfeeding, and sexual abstinence. The 2000-2001 UDHSresults show that the median duration <strong>of</strong> postpartum insusceptibilityto pregnancy is 12 months, the same level as shown in the1995 UDHS.Polygynous unionsOverall, 32 percent <strong>of</strong> married women in <strong>Uganda</strong> are in a polygynousrelationship. The percentage is slightly higher than thatrecorded in the 1995 UDHS (30 percent). In the 2000-2001UDHS, two out <strong>of</strong> three women in polygamous unions had onlyone cowife (22 percent). As expected, older women are more likelyto be in a polygynous marriage than younger women.Fertility PreferencesThe desire to stop childbearing hasdoubled since 1988; the percentage<strong>of</strong> women saying that they wantedno more children or have beensterilised rose from 19 percent in1988-1989 to 38 percent in 2000-2001. The total wanted fertility rate(a rate representing the level <strong>of</strong>fertility that would have prevailed inthe three years preceding thesurvey if all unwanted births hadbeen prevented) is 5.3 births perwoman, a slight decline from 5.6births in 1995. That finding meansthat if the desired fertility levelwere realised, the total fertility ratein <strong>Uganda</strong> would be 5.3 births perwoman, 1.6 fewer births than theobserved level. Yet another measureindicates a smaller desired familysize in <strong>Uganda</strong>: the ideal family sizeamong women declined from 5.3children in 1995 to 4.8 children in2000-2001. However, the continuinghigh level <strong>of</strong> fertility shows thatmany couples are not havingsuccess in achieving their desiredfamily size.S. Poedjastoeti
Page 4How does family planninguse in <strong>Uganda</strong> compare tothat in other countries?Comparing <strong>Uganda</strong>’s CPR to therates in selected countries in eastand southern Africa for which DHSdata are available shows <strong>Uganda</strong>’srate is only higher than that <strong>of</strong>Eritrea 1995 (8 percent), Ethiopia2000 (8 percent) and Rwanda 2000(13 percent) The CPR in <strong>Uganda</strong> isalso higher than that found inGhana 1998 (22 percent), Yemen1997 (21 percent), the ComorosIslands 1996 (21 percent),Cameroon 1998 (19 percent), andMadagascar 1997 (19 percent).Country/YearCPRFERTILITY REGULATIONData on various aspects <strong>of</strong> contraceptive knowledge, attitudes and behaviour <strong>of</strong> womenand men are essential in assessing the progress <strong>of</strong> national policies on family planning.Finding out what steps couples have taken to control fertility wull provide insights intohow successful couples are in realising their reproductive goals.Levels and trendsKnowledge <strong>of</strong> contraceptive methods in <strong>Uganda</strong> is nearly universal.The findings show that 96 percent <strong>of</strong> women age 15-49 and98 percent <strong>of</strong> men age 15-54 knowing <strong>of</strong> at least one method <strong>of</strong>contraception.The contraceptive prevalence rate (CPR) among currently marriedwomen age 15-49 has increased steadily from 5 percent in 1988-1989 to 15 percent in 1995 and 23 percent in 2000-2001. In 2000-2001, the majority <strong>of</strong> users (18 percent <strong>of</strong> currently marriedwomen) were using a modern method. There has been a shift inthe contraceptive method mix since 1995: whereas in 1995 themost widely used methods were periodic abstinence, the pill, andinjectables, in 2000-2001 the most commonly used methods wereinjectables (6 percent), lactational amenorrhoea (4 percent), andthe pill (3 percent).South Africa 1998 56Zimbabwe 1999 54Tanzania 1999 25Malawi 2000 31Zambia 1996 26<strong>Uganda</strong> 2000-2001 23Rwanda 2000 13Eritrea1995 8Ethiopia 2000 8Family planning use by background characteristicsThe survey found large differentials in contraceptive use byurban/rural residence and by region. Currently married urbanwomen are much more likely to be using a contraceptive methodthan rural women (46 percent compared to 19 percent). Whereas37 percent <strong>of</strong> currently married women in the Central Region usecontraception, the percentage in the other regions ranges between15 percent and 21 percent.K. StewartUse <strong>of</strong> family planning increases with a woman’s education—from13 percent among women with no formal education to 21 percent
Page 5among women with primary education to 49 percentamong women with some secondary education.The wealth index is created using factor analysisto identify the most important variables to dividehouseholds in quintiles by socioeconomic status.Contraceptive use is positively associated witha woman’s socioeconomic status; the rate <strong>of</strong> use isbetween 14 percent and 17 percent among womenin the three lowest quintiles and 46 percent amongwomen in the highest quintile.Source <strong>of</strong> family planning servicesThirty-six percent <strong>of</strong> modern method users obtaintheir methods from a public (government) source,S. Poedjastoetiwhereas private medical sources are reported by almost half <strong>of</strong> current users (46 percent). Other privatesources supply 16 percent <strong>of</strong> modern contraceptive users. Within the public sector, hospitals and healthcentres are the most common sources (15 percent and 13 percent, respectively).There has been a significant shift in sources <strong>of</strong> family planning supplies from those recorded in the 1995UDHS; public sources declined from 47 percent to 36 percent, while private medical sources increasedfrom 42 percent to 46 percent. Based on the 2000-2001 UDHS, more than half <strong>of</strong> condom users obtaintheir supply from a non-medical source such as a shop and friends or relatives, an increase from the40 percent recorded in 1995. On the other hand, whereas 24 percent <strong>of</strong> condom users obtained condomsfrom the public sector in 1995, the corresponding proportion in 2000-2001 is only 9 percent.Unmet need for family planningAmong currently married women, 35 percent have an unmet need for family planning services(21 percent for spacing births and 14 percentfor limiting them). If all the unmet need weresatisfied, the contraceptive prevalence ratewould rise from 23 percent to 57 percent <strong>of</strong>married women.Younger women are more likely to needfamily planning services for spacing thanlimiting children. On the other hand, olderwomen are in need <strong>of</strong> family planning morefor limiting than for spacing purposes. Thelevel <strong>of</strong> unmet need for family planning ismuch higher in rural areas than in urbanareas (36 percent and 23 percent, respectively).The unmet need for family planningservices is highest in the Eastern Region(46 percent) and lowest in the NorthernRegion (29 percent). Better-educated womenhave the lowest level <strong>of</strong> unmet need.
Page 6MATERNAL AND CHILD HEALTHFindings from the UDHS provide the basis for evaluating the utilisation <strong>of</strong> services and the implementation <strong>of</strong> appropriate strategies inimproving the health <strong>of</strong> mothers and children. In particular, the UDHS provides information for gauging the success <strong>of</strong> the Ministry <strong>of</strong>Health’s recommendations on antenatal care and postnatal care practices.Antenatal careAntenatal care is nearly universal in <strong>Uganda</strong>.Most women receive care from a medical pr<strong>of</strong>essional:83 percent from a nurse or a midwifeand 9 percent from a doctor. The role <strong>of</strong> thetraditional birth attendant in providing antenatalcare is negligible (1 percent). The coverage <strong>of</strong>antenatal care from a trained provider(91 percent) has hardly changed since 1995.Mothers in urban areas are three and a halftimes more likely than rural mothers to receiveantenatal care from a doctor (26 percent and7 percent, respectively). On the other hand,UNICEFrural women are more likely than urban womento receive antenatal care from a nurse or a midwife (85 percent and 71 percent, respectively). Seven out<strong>of</strong> 10 mothers used a public facility for antenatal care. The most commonly used facilities are governmenthealth centres (38 percent) and government hospitals (28 percent).Delivery characteristicsThe majority <strong>of</strong> births in <strong>Uganda</strong> were delivered at home (62 percent). Births to younger women andlow-order births are more likely to be delivered in a health facility than births to older women andhigher-order births. Delivery in a health facility is more common in urban than in rural areas (79 percentcompared to 32 percent). Mothers with secondary education are more than three times as likely todeliver at a health facility than women with no education (72 percent 21 percent, respectively).Seven out <strong>of</strong> 10 babies are not weighed at the time <strong>of</strong> birth. Among the babies weighed, 89 percent hada normal birth weight (2.5 kilograms or more).Postnatal carePostnatal care is important to the health <strong>of</strong> both the mother and her infant, particularly in the first 6 weeksafter delivery (puerperium). The Ministry <strong>of</strong> Healthrecommends that mothers receive postnatal care whenthey bring their infants for immunisation. AlthoughThe UDHS data shows that postnatalthe Sexual and Reproductive Health Minimum Packagerecommends that mothers attend postnatal care care for births which were deliveredduring the first 6 weeks after delivery, the UDHS data outside a health facility in <strong>Uganda</strong> isshow that postnatal care in <strong>Uganda</strong> for births whichwere delivered outside <strong>of</strong> a health facility is poor, withpoor, with more than nine in tenmore than nine out <strong>of</strong> 10 women not receiving postnatalcare. Among the mothers who do receive post-women not receiving postnatal care.natal care, the majority receive care within 2 days <strong>of</strong>delivery.
Page 7Urban women, better-educated women, and women living in the Central and Eastern regions are morelikely to receive postnatal care than other women.Immunisation <strong>of</strong> childrenThe 2000-2001 UDHS data show only 37 percent<strong>of</strong> children age 12-23 months as having been fullyimmunised at any time before the survey. That representsa decline from the 47 percent recorded in1995. The current survey shows that 29 percent <strong>of</strong>children are fully immunised by 12 months <strong>of</strong> age,as recommended.Immunisation coverage is highest in the Westernregion; children in the Central region have the lowestcoverage. Mother’s education is associated withthe chances <strong>of</strong> children being fully immunised.More than half (51 percent) <strong>of</strong> the children <strong>of</strong> motherswith secondary education have been fullyimmunised, compared to only 28 percent <strong>of</strong> thechildren <strong>of</strong> mothers with no education.UNICEF/G. PirozziTreatment <strong>of</strong> childhood diseasesTwenty-three percent <strong>of</strong> children under the age <strong>of</strong> 5 are reported to have had symptoms <strong>of</strong> acute respiratoryinfection (ARI) in the 2 weeks preceding the survey. The highest prevalence <strong>of</strong> ARI was found amongchildren age 6–11 months (33 percent). The prevalence <strong>of</strong> ARI decreases with age to 14 percent amongchildren age 48–59 months. Two out <strong>of</strong> three <strong>of</strong> children with symptoms <strong>of</strong> ARI were taken to a healthfacility for treatment.Twenty percent <strong>of</strong> children less than 5 years old had had diarrhoea in the 2 weeks preceding the survey.The prevalence <strong>of</strong> diarrhoea was highest among children age 6–11 months (38 percent). The risk <strong>of</strong> diarrhoeadecreases as a child grows— diarrhoea prevalence is lowest among children 48–59 months(8 percent). Fewer than half <strong>of</strong> children who had had diarrhoea in the 2 weeks preceding the survey weretaken to a health facility for treatment (45 percent). More than half <strong>of</strong> children with diarrhoea (53 percent)were treated with either oral rehydration solution (ORS), recommended home fluid, or increasedfluid in general.The 2000-2001 UDHS data show that feeding practices <strong>of</strong> children with diarrhoea in <strong>Uganda</strong> are inconsistentwith recommended interventions. Only 28 percent <strong>of</strong> children with diarrhoea were given morefluid than usual, whereas 31 percent were given the same amount <strong>of</strong> fluid as usual. Furthermore, four out<strong>of</strong> 10 children with diarrhoea were given either a lower amount <strong>of</strong> fluids or none at all.
Page 8NUTRITIONAL STATUSThe 2000-2001 UDHS looks at several key indicators <strong>of</strong> the nutritional status <strong>of</strong> children, women, and men, including patterns <strong>of</strong>infant feeding practices, anthropometric measurements, prevalence <strong>of</strong> anaemia, vitamin-A deficiency and supplementation, andiodisation <strong>of</strong> salt.Infant feeding practicesBreastfeeding in <strong>Uganda</strong> is almost universal, with 98 percent <strong>of</strong> children having been breastfed atsome time. The proportion is high across all residential areas, and it varies little by subgroups <strong>of</strong> children.In <strong>Uganda</strong>, infant feeding supplementation starts late, which is consistent with World HealthOrganisation (WHO) recommendations. Only one out <strong>of</strong> four children age 2-3 months receives anythingother than breast milk and water-based liquids, and two out <strong>of</strong> three children younger than6 months <strong>of</strong> age are exclusively breastfed.MicronutrientsThe government <strong>of</strong> <strong>Uganda</strong> set a goal <strong>of</strong> reaching 90 percent coverage <strong>of</strong> households having iodisedsalt by the year 2000. To evaluate this program, UDHS interviewers tested salt from each householdfor its iodine content. The tests indicate that the goal has been met and passed, with 95 percent <strong>of</strong>households for which the salt test was performed using adequately iodised salt (15 or more parts permillion).Overall, 58 percent <strong>of</strong> children under 3 years <strong>of</strong> age were reported to have received vitamin-A-richfoods in the 7 days preceding the survey. Consumption <strong>of</strong> vitamin-A-rich foods is highest in the EasternRegion and lowest in the Western Region.Children’s nutritional statusIn the UDHS, two kinds <strong>of</strong> anthropometric measurements were taken for children under 5 years <strong>of</strong> age.They are weight and height (for children age 24 months and older) or recumbent length (for childrenunder 24 months <strong>of</strong> age). Physical growth indices, height-forage,weight-for-height and weight-for-age, are calculated to describechildren’s nutritional status in comparison to a standardschedule developed by the U.S. National Center for Health <strong>Statistics</strong>(NCHS). Children whose height-for-age is more than twostandard deviations below (-2 SD) the median <strong>of</strong> the NCHS referencepopulation are considered short for their age, or “stunted.”Children whose weight-for-age is below (–2 SD) the median <strong>of</strong>the reference population are considered “wasted” or too thinfor their height. Children whose weight-for-age is below(–2SD) the median <strong>of</strong> the reference population are classified as“underweight.”In <strong>Uganda</strong>, four out <strong>of</strong> 10 children below 5 years <strong>of</strong> age arestunted. Stunting is higher among children in the rural areas, inthe Western Region, and among children whose mothers havehad no education. Wasting affects 4 percent <strong>of</strong> children under5 years <strong>of</strong> age. Twenty-three percent <strong>of</strong> children under the age<strong>of</strong> 5 are underweight, which reflects either stunting or wastingor a combination <strong>of</strong> the two. The figures show that there hasbeen little reduction in the levels <strong>of</strong> malnutrition since 1995.S. Poedjastoeti
Page 9Women’s nutritional statusIn the 2000-2001 UDHS, mother’s nutritional status is measuredusing two indices, height and body mass index (BMI). The meanheight <strong>of</strong> mothers measured in the 2000-2001 UDHS was 158centimetres, with only 2 percent <strong>of</strong> women shorter than 145centimetres.BMI is derived by dividing the weight in kilograms (kg) by a person’ssquared height in metres (m 2 ). A cut-<strong>of</strong>f point <strong>of</strong> 18.5 kg/m 2 has beenrecommended for defining chronic undernutrition. The mean BMIamong nonpregnant mothers in <strong>Uganda</strong> is 21.9, which lies within thenormal range (18.5 to 24.9). One out <strong>of</strong> 10 women in <strong>Uganda</strong> has aBMI below the recommended level <strong>of</strong> 18.5 and may be regarded ashaving a chronic nutritional deficit.Prevalence <strong>of</strong> anaemiaThe level <strong>of</strong> haemoglobin concentration in the blood is used as anindicator <strong>of</strong> the prevalence <strong>of</strong> anaemia. Levels <strong>of</strong> anaemia can beclassified as severe, moderate, or mild, depending on the haemoglobinconcentration in the blood and according to criteria developed by theWHO. Severe anaemia is diagnosed when the haemoglobin concentrationis less than 7.0 grams per decilitre (g/dl); moderate anaemia isdiagnosed when the haemoglobin concentration is 7.0-9.9 g/dl; mildanaemia is diagnosed when the haemoglobin concentration is 10.0-11.9 g/dl (10.0-10.9 g/dl for pregnant women).In the 2000-2001 UDHS, the level <strong>of</strong> haemoglobin was measured bymeans <strong>of</strong> the HemoCue photometer machine. The test results showthat 64 percent <strong>of</strong> children all under age 5 are anaemic and 7 percentare severely anaemic. Anaemia is common among children 6-15months old, rural children, children in the Eastern and Northernregions, children <strong>of</strong> women with no education, and children in thelowest quintile in terms <strong>of</strong> wealth status.Vitamin-A DeficiencyFor the 2000-2001UDHS, bloodsamples were taken from women15-49 and from children under 5years <strong>of</strong> age to be tested for level <strong>of</strong>vitamin A level. The data show that28 percent <strong>of</strong> <strong>Uganda</strong>n children age6-59 months suffer from vitamin-Adeficiency (VAD). At this level <strong>of</strong>VAD, <strong>Uganda</strong> can be said to have asevere public health problem.VAD is lower among children 6-11months <strong>of</strong> age, who are stillbenefiting from the positive effect<strong>of</strong> breastfeeding. The highest VAD isfound among children 12-23months (32 percent). VAD is morelikely to be found among highorderbirths, people living in ruralareas, and residents <strong>of</strong> the NorthernRegion.More than half <strong>of</strong> the women in<strong>Uganda</strong> suffer from VAD. Thedeficiency level varies according towomen’s characteristics, but not asmuch as it does among youngchildren.Three out <strong>of</strong> 10 women age 15-49 are anaemic. Twenty-two percenthave mild anaemia, 8 percent have moderate anaemia, and less thanone percent are severely anaemic. Anaemia is more prevalent amongwomen living in rural areas, women who have given birth, womenwith no education, and women living in the Eastern Region.The criterion used to classify the prevalence <strong>of</strong> anaemia in men isdifferent from that used to classify women and children. A man isconsidered to be anaemic if the haemoglobin level in his blood is lessthan 13 grams per decilitre. In general, men are much less likely tosuffer from anaemia than women or children. The overall level <strong>of</strong>anaemia among men is 18 percent. As is the case with women andchildren, urban men and better-educated men are less likely to beanaemic than other men. Variations across regions are slight.S. Poedjastoeti
Page 10MORTALITYIdentifying subgroups <strong>of</strong> children most vulnerable to mortality risks is necessary for improving their chances <strong>of</strong> survival andlowering young children’s exposure to risks. Information on adult mortality risks over time is helpful for assessing the healthcondition <strong>of</strong> the population as a whole.Infant and child mortalityFor the period between 1996 and 2000, the under-5mortality rate is estimated at 152 deaths per 1,000 livebirths; the infant mortality rate was 88 deaths per1,000 live births.The mortality level <strong>of</strong> children in urban areas is considerablylower than that <strong>of</strong> rural children; under-5mortality was 101 deaths per 1,000 live births in theurban areas but 163 in the rural areas. Children inthe Central and Eastern regions have a lower mortalitylevel than those in the other regions—135 to 147deaths per 1,000 live births compared to 176 or moredeaths per 1,000 live births. Children born to motherswith secondary education have the lowest mortality.Children whose mothers have had no education havetwice as high a risk <strong>of</strong> dying before age 5 as those whosemothers have secondary education (187 and 93deaths per 1,000 live births, respectively).Adult mortalityDuring the period 0 to 9 years before thesurvey, females had the same mortality riskas males (nine deaths per 1,000 population,for both). Comparison with the estimatefrom the 1995 UDHS reveals that the situationhas not improved in the past 5 years.Maternal mortalityMaternal mortality represents a fraction <strong>of</strong>adult female mortality and was defined inthe survey as female deaths either duringpregnancy, during childbirth, or within2 months <strong>of</strong> giving birth. The overall maternalmortality rate for the period 0 to 9 yearsS. Poedjastoetibefore the survey was found to be 120 per100,000 woman-years <strong>of</strong> exposure. The maternal mortality ratio (MMR) estimated from the 2000-2001UDHS is 505 deaths per 100,000 live births. There has been no improvement since the 1995 UDHS.
HIV/AIDS AWARENESS AND PRACTICEIn <strong>Uganda</strong>, HIV/AIDS has been termed a “household disease,” because nearly every household has lost a relative or friend to thedisease. In response to the epidemic, a network <strong>of</strong> collaboration among governmental agencies, development partners, non-governmentorganisations (NGOs), religious groups, individuals, cultural groups, community groups, research institutions, and networks <strong>of</strong>persons infected and affected by HIV/AIDS has been developed.HIV/AIDS awareness and practicesAlthough knowledge <strong>of</strong> AIDS is universal in <strong>Uganda</strong>, the level <strong>of</strong> awareness about the disease is notmatched by knowledge <strong>of</strong> ways to avoid contracting the virus. About half <strong>of</strong> the female respondentscited the use <strong>of</strong> condoms, abstaining from sexual relations, and having only one sexual partner. Men aremore likely to cite using condom and abstaining from sexual relations but less likely to mention limitingthe number <strong>of</strong> sexual partners.Most men and women in <strong>Uganda</strong> know that HIV can be transmitted from mother to child. However,only 58 percent <strong>of</strong> women know that HIV can be transmitted during pregnancy, 69 percent know abouttransmission during delivery, and 46 percent know about transmission during breastfeeding.Prevalence <strong>of</strong> sexually transmitted infectionsEight percent <strong>of</strong> women and 3 percent <strong>of</strong> men report having had a sexually transmitted infection (STI)in the 12 months preceding the survey. However, 17 percent <strong>of</strong> women and 6 percent <strong>of</strong> men reporthaving had either an STI and/or symptoms <strong>of</strong> STIs such as an abnormal discharge and genital sore orulcer. Given the low level <strong>of</strong> knowledge about symptoms <strong>of</strong> STIs, many people may have STIs withoutknowing it. Therefore, the true level <strong>of</strong> prevalence <strong>of</strong> STIs may be higher than the reported one. The ratefor women in 2000-2001 is higher than in 1995 (4 percent), but the rate for men is lower than in 1995(6 percent).HIV/AIDS testingEight percent <strong>of</strong> women and 12 percent <strong>of</strong> men reported hvingbeen tested for HIV. Women in their 20s and men age 25-39are the most likely to have had the test. Respondents living inurban areas, in the Central Region, and in Kampala district,and respondents with secondary education, are much morelikely to have undergone HIV testing.A desire to be tested is high among both women and men in<strong>Uganda</strong>. One-quarter <strong>of</strong> women and one-fifth <strong>of</strong> men say theywould like an HIV test. With small differences across subgroups<strong>of</strong> women and men, nine out <strong>of</strong> 10 <strong>of</strong> people who were testedknew their HIV status.Page 11S. Poedjastoeti
Page 12FACT SHEET2000 Population Data (Projection)Total population (thousands) 2,210Urban population (percent) 16Annual natural increase (percent) 2.5Population doubling time (years) 27.6Crude birth rate (per 1,000 population) 52Crude death rate (per 1,000 population) 17Life expectancy at birth male (years) 45.7Life expectancy at birth female (years) 50.52000-2001 <strong>Uganda</strong> Demographic andHealth SurveySample PopulationWomen age 15-49 7,246Men age 15-54 1,962Background Characteristics <strong>of</strong> WomenPercent urban 17Percent with no education 22Percent attended secondary or higher 18FertilityTotal fertility rate 1 6.9Mean number <strong>of</strong> children ever bornto women age 40-49 7.1Use <strong>of</strong> Family PlanningPercent <strong>of</strong> currently married women using:- Any method 23- Any modern method 18- Traditional and folk methods 5MortalityInfant mortality rate 2 88Under-five mortality rate 2 152Adult mortality 2Male 9Female 8Maternal mortality ratio 3 505HealthPercent <strong>of</strong> last births 4 whose mothers:- Received antenatal carefrom a medical pr<strong>of</strong>essional 92- Received 2 or more tetanus toxoidinjections 42Percent <strong>of</strong> births whose mothers were assistedat delivery by:- medical provider 39- non-medical provider 46- no one 15Percent <strong>of</strong> children 0-5 months who areexclusively breastfed 63Percent <strong>of</strong> children 12-23 months who received 5- BCG 79- DPT (three doses) 46- Polio (three doses) 54- Measles 57- All vaccinations 37Percent <strong>of</strong> children under 5 years who in the twoweeks preceding the survey:- had diarrhoea 20- had a cough accompaniedby rapid breathing 23- had fever 44NutritionPercent <strong>of</strong> children under 5 years who:- are stunted 39- are wasted 4- are anaemic 64Percent <strong>of</strong> women 15-49 who:- are shorter than 145 cm 2- have a BMI 6 less than 18.5 10- are anaemic 30Vitamin A deficiency among:- children 6-59 months 28- women 15-49 52_________________1Based on births to women 15-49 years during the period 0-2 yearspreceding the survey2Rates are per 1,000 live births, and for the period 0-4 years precedingthe survey (1996 to 2000)3Rate is per 100,000 live births, and for the period 0-9 preceding thesurvey (1990 to 2000)4Figure includes births in the period 1-59 months preceding thesurvey5Based on information from vaccination records and mothers’ reports6BMI is derived by dividing the weight in kilograms (kg) by thesquare height in metres (m 2 )


