Financial Statements - The United Basalt Products Ltd
Financial Statements - The United Basalt Products Ltd
Financial Statements - The United Basalt Products Ltd

Create successful ePaper yourself
Turn your PDF publications into a flip-book with our unique Google optimized e-Paper software.
<strong>Financial</strong> <strong>Statements</strong><br />
Year ended June 30, 2009 (cont’d...)<br />
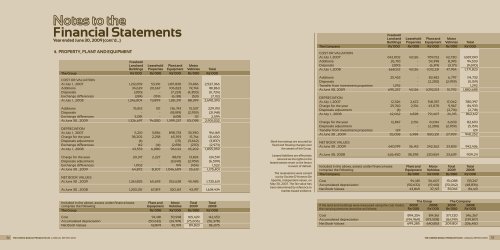
4. PROPERTY, PLANT AND EQUIPMENT<br />
Freehold<br />
Land and Leasehold Plant and Motor<br />
Buildings Properties Equipment Vehicles Total<br />
<strong>The</strong> Group Rs’000 Rs’000 Rs’000 Rs’000 Rs’000<br />
COST OR VALUATION<br />
At July 1 , 2007 1,212,659 53,391 1,187,830 73,486 2,527,366<br />
Additions 34,629 20,667 106,823 19,744 181,863<br />
Disposals (200) - (7,224) (4,300) (11,724)<br />
Exchange differences (284) (159) (6,138) (531) (7,112)<br />
At July 1 , 2008 1,246,804 73,899 1,281,291 88,399 2,690,393<br />
Additions 76,812 101 136,743 15,537 229,193<br />
Disposals - - (18,189) (2,959) (21,148)<br />
Exchange differences 3,081 - (608) 121 2,594<br />
At June 30 , 2009 1,326,697 74,000 1,399,237 101,098 2,901,032<br />
DEPRECIATION<br />
At July 1 , 2007 5,210 3,836 898,733 33,390 941,169<br />
Charge for the year 38,205 2,258 65,393 15,744 121,600<br />
Disposals adjustment (4) - (171) (3,662) (3,837)<br />
Exchange differences 142 (14) (2,831) (270) (2,973)<br />
At July 1 , 2008 43,553 6,080 961,124 45,202 1,055,959<br />
Charge for the year 20,317 2,227 88,151 13,824 124,519<br />
Disposals adjustment - - (3,640) (2,959) (6,599)<br />
Exchange differences 1,002 - 974 (454) 1,522<br />
At June 30 , 2009 64,872 8,307 1,046,609 55,613 1,175,401<br />
NET BOOK VALUES<br />
At June 30 , 2009 1,261,825 65,693 352,628 45,485 1,725,631<br />
At June 30 , 2008 1,203,251 67,819 320,167 43,197 1,634,434<br />
Included in the above, assets under finance lease Plant and Motor Total Total<br />
comprise the following: Equipment Vehicles 2009 2008<br />
<strong>The</strong> Group Rs’000 Rs’000 Rs’000 Rs’000<br />
Cost 94,481 70,948 165,429 142,453<br />
Accumulated depreciation (50,632) (24,974) (75,606) (56,378)<br />
Net Book Values 43,849 45,974 89,823 86,075<br />
Bank borrowings are secured by<br />
fixed and floating charges over<br />
the assets of the Group.<br />
Leased liabilities are effectively<br />
secured as the rights to the<br />
leased assets revert to the lessor<br />
in event of default.<br />
<strong>The</strong> revaluations were carried<br />
out by Societe D’Hotman De<br />
Speville, independent valuer, on<br />
May 30, 2007. <strong>The</strong> fair value has<br />
been determined by reference to<br />
market-based evidence.<br />
Freehold<br />
Land and Leasehold Plant and Motor<br />
Buildings Properties Equipment Vehicles Total<br />
<strong>The</strong> Company Rs’000 Rs’000 Rs’000 Rs’000 Rs’000<br />
COST OR VALUATION<br />
At July 1, 2007 642,002 43,126 959,152 42,730 1,687,010<br />
Additions 26,710 - 59,398 8,395 94,503<br />
Disposals (200) - (6,319) (3,171) (9,690)<br />
At July 1, 2008 668,512 43,126 1,012,231 47,954 1,771,823<br />
Additions 25,453 - 82,482 6,797 114,732<br />
Disposals - - (2,200) (2,959) (5,159)<br />
Transfer from investment properties 1,292 - - - 1,292<br />
At June 30, 2009 695,257 43,126 1,092,513 51,792 1,882,688<br />
DEPRECIATION<br />
At July 1, 2007 12,326 2,672 748,337 17,062 780,397<br />
Charge for the year 29,740 2,156 43,070 9,967 84,933<br />
Disposals adjustment (4) - - (2,714) (2,718)<br />
At July 1 , 2008 42,062 4,828 791,407 24,315 862,612<br />
Charge for the year 12,867 2,156 61,044 6,603 82,670<br />
Disposals adjustment - - (2,200) (2,959) (5,159)<br />
Transfer from investment properties 129 - - - 129<br />
At June 30 , 2009 55,058 6,984 850,251 27,959 940,252<br />
NET BOOK VALUES<br />
At June 30 , 2009 640,199 36,142 242,262 23,833 942,436<br />
At June 30, 2008 626,450 38,298 220,824 23,639 909,211<br />
Included in the above, assets under finance lease Plant and Motor Total Total<br />
comprise the following: Equipment Vehicles 2009 2008<br />
<strong>The</strong> Company Rs’000 Rs’000 Rs’000 Rs’000<br />
Cost 94,481 56,607 151,088 133,247<br />
Accumulated depreciation (50,632) (19,410) (70,042) (48,834)<br />
Net Book Values 43,849 37,197 81,046 84,413<br />
<strong>The</strong> Group <strong>The</strong> Company<br />
If the land and buildings were measured using the cost model, 2009 2008 2009 2008<br />
the carrying amounts would be as follows: Rs’000 Rs’000 Rs’000 Rs’000<br />
Cost 894,254 814,361 371,720 346,267<br />
Accumulated depreciation (194,969) (173,508) (161,919) (139,817)<br />
Net Book Values 699,285 640,853 209,801 206,450<br />
56 THE UNITED BASALT PRODUCTS LTD | ANNUAL REPORT 2009 THE UNITED BASALT PRODUCTS LTD | ANNUAL REPORT 2009 57