Financial Statements - The United Basalt Products Ltd
Financial Statements - The United Basalt Products Ltd
Financial Statements - The United Basalt Products Ltd

You also want an ePaper? Increase the reach of your titles
YUMPU automatically turns print PDFs into web optimized ePapers that Google loves.
All associates are incorporated in<br />
the Republic of Mauritius except<br />
for Prochimad Mines et Carrières<br />
SARL which is incorporated in<br />
the Republic of Madagascar.<br />
<strong>Financial</strong> <strong>Statements</strong><br />
Year ended June 30, 2009 (cont’d...)<br />
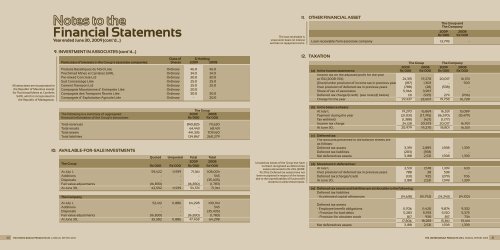
9. INVESTMENT IN ASSOCIATES (cont’d...)<br />
Class of % Holding<br />
Particulars of interests in the Group’s associate companies: Shares 2009 2008<br />
Produits <strong>Basalt</strong>iques du Nord Ltée Ordinary 46.0 46.0<br />
Prochimad Mines et Carrières SARL Ordinary 34.0 34.0<br />
Pre-mixed Concrete <strong>Ltd</strong> Ordinary 30.0 30.0<br />
Sud Concassage Ltée Ordinary 25.0 25.0<br />
Cement Transport <strong>Ltd</strong> Ordinary 25.0 25.0<br />
Compagnie Mauricienne d’ Entreprise Ltée Ordinary 20.0 -<br />
Compagnie des Transports Reunis Ltée Ordinary 30.0 30.0<br />
Compagnie d’ Exploitation Agricole Ltée Ordinary - 20.0<br />
<strong>The</strong> Group<br />
<strong>The</strong> following is a summary of aggregated 2009 2008<br />
financial information of the Group’s associates: Rs’000 Rs’000<br />
Total revenues 840,825 711,630<br />
Total results 64,443 68,431<br />
Total assets 441,335 709,160<br />
Total liabilities 124,867 260,279<br />
10. AVAILABLE-FOR-SALE INVESTMENTS<br />
<strong>The</strong> Group<br />
Quoted Unquoted Total Total<br />
2009 2008<br />
Rs’000 Rs’000 Rs’000 Rs’000<br />
At July 1, 59,422 11,939 71,361 108,004<br />
Additions - - - 545<br />
Disposals - - - (35,405)<br />
Fair value adjustments (16,830) - (16,830) (1,783)<br />
At June 30, 42,592 11,939 54,531 71,361<br />
<strong>The</strong> Company<br />
At July 1, 52,412 11,886 64,298 100,941<br />
Additions - - - 545<br />
Disposals - - - (35,405)<br />
Fair value adjustments (16,830) - (16,830) (1,783)<br />
At June 30, 35,582 11,886 47,468 64,298<br />
<strong>The</strong> loan receivable is<br />
unsecured, bears no interest<br />
and has no repayment terms.<br />
Unused tax losses of the Group that have<br />
not been recognised as deferred tax<br />
assets amounted to Rs 23m (2008:<br />
Rs 37m). Deferred tax assets have not<br />
been recognised in respect of the losses<br />
due to the unpredictability of future profit<br />
streams to utilise these losses.<br />
11. OTHER FINANCIAL ASSET<br />
12. TAXATION<br />
60 THE UNITED BASALT PRODUCTS LTD | ANNUAL REPORT 2009 THE UNITED BASALT PRODUCTS LTD | ANNUAL REPORT 2009 61<br />
<strong>The</strong> Group and<br />
<strong>The</strong> Company<br />
2009 2008<br />
Rs’000 Rs’000<br />
Loan receivable from associate company 13,795 -<br />
<strong>The</strong> Group <strong>The</strong> Company<br />
2009 2008 2009 2008<br />
(a) In the income statements: Rs’000 Rs’000 Rs’000 Rs’000<br />
Income tax on the adjusted profit for the year<br />
at 15% (2008: 15%) 24,315 19,270 20,017 16,531<br />
(Over)/under provision of income tax in previous year (187) 1,303 - 903<br />
Over provision of deferred tax in previous years (788) (28) (538) -<br />
Share of tax of associates 5,966 3,987 - -<br />
Deferred tax charge/(credit) (see note (d) below) 131 (925) 279 (706)<br />
Charge for the year 29,437 23,607 19,758 16,728<br />
(b) In the balance sheets:<br />
At July 1, 19,270 16,869 16,531 15,089<br />
Payment during the year (21,031) (17,745) (16,570) (15,479)<br />
Tax withheld (1,388) (427) (1,177) -<br />
Income tax charge 24,128 20,573 20,017 16,921<br />
At June 30, 20,979 19,270 18,801 16,531<br />
(c) Deferred tax:<br />
<strong>The</strong> amounts presented in the balance sheets are<br />
as follows:<br />
Deferred tax assets 3,391 2,889 1,598 1,339<br />
Deferred tax liabilities (203) (358) - -<br />
Net deferred tax assets 3,188 2,531 1,598 1,339<br />
(d) Movement in deferred tax:<br />
At July 1, 2,531 1,578 1,339 633<br />
Over provision of deferred tax in previous years 788 28 538 -<br />
Deferred tax (charge)/credit (131) 925 (279) 706<br />
At June 30, 3,188 2,531 1,598 1,339<br />
(e) Deferred tax assets and liabilities are attributable to the following:<br />
Deferred tax liabilities<br />
- Accelerated capital allowances (14,618) (15,752) (14,243) (14,102)<br />
Deferred tax assets<br />
- Employee benefit obligations 11,706 11,420 9,874 9,332<br />
- Provision for bad debts 5,283 5,933 5,150 5,375<br />
- Provision for obsolete stock 817 930 817 734<br />
17,806 18,283 15,841 15,441<br />
Net deferred tax assets 3,188 2,531 1,598 1,339