reserves replacement ratio in a marginal oil world: adequate ...
reserves replacement ratio in a marginal oil world: adequate ...
reserves replacement ratio in a marginal oil world: adequate ...
- No tags were found...

You also want an ePaper? Increase the reach of your titles
YUMPU automatically turns print PDFs into web optimized ePapers that Google loves.
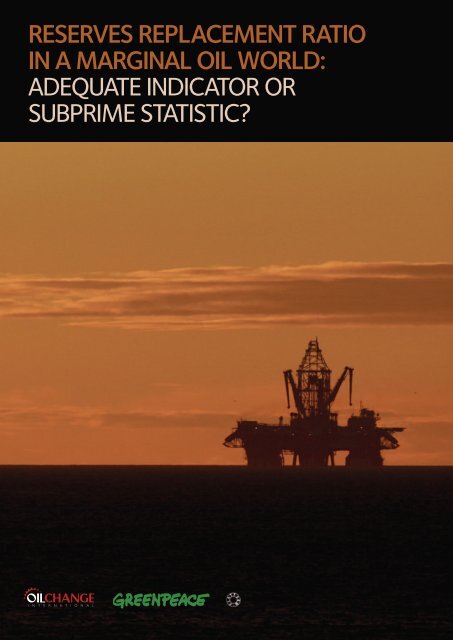
RESERVES REPLACEMENT RATIOIN A MARGINAL OIL WORLD:ADEQUATE INDICATOR ORSUBPRIME STATISTIC?
CONTENTSExecutive summary 4Reserves Replacement Ratio <strong>in</strong> a marg<strong>in</strong>al <strong>oil</strong> <strong>world</strong>: <strong>adequate</strong> <strong>in</strong>dicator or subprime statistic? 6The <strong>reserves</strong> <strong>replacement</strong> challenge 6Ris<strong>in</strong>g costs, ris<strong>in</strong>g risks 7Canadian tar sands 9Ultra-deepwater 10Offshore Arctic 11Reserves data opacity 12Profits without <strong>reserves</strong>: what then? 12Spreadsheet m<strong>in</strong>utiae versus the big picture 15Conclusion 16Endnotes 17Appendix: Analysis of <strong>reserves</strong> additions for the top six IOCs 2005–09 18Appendix endnotes 24Icebergs create huge logistical problems for <strong>oil</strong> companies drill<strong>in</strong>g <strong>in</strong> the Arctic:they either have to be dragged out of the way of drill<strong>in</strong>g areas or destroyed with hoses. ©ROSE/GREENPEACEWritten by Lorne Stockman, Research Director, Oil Change International. lorne@priceof<strong>oil</strong>.orgReserves additions research by the Borealis Centre. www.borealiscentre.org
EXECUTIVESUMMARYTHE RESERVES REPLACEMENT CHALLENGEThe <strong>in</strong>ternational <strong>oil</strong> <strong>in</strong>dustry has entered an era <strong>in</strong> whichTo ma<strong>in</strong>ta<strong>in</strong> Reserves Replacement Ratio (RRR) rates above100%, IOCs have <strong>in</strong>creas<strong>in</strong>gly turned to tar sands andultra-deepwater <strong>in</strong> the face of the cont<strong>in</strong>u<strong>in</strong>g decl<strong>in</strong>e <strong>in</strong> theirconventional <strong>oil</strong> fields. The new explo<strong>ratio</strong>n frontier, the offshoreArctic, is typical of the high risk, high cost resources thatcompanies are striv<strong>in</strong>g to acquire <strong>in</strong> order to boost <strong>reserves</strong><strong>in</strong> the future.total resources suggests that the trend towards marg<strong>in</strong>al <strong>oil</strong>is only likely to <strong>in</strong>tensify (see appendix).It may also be the case that the exist<strong>in</strong>g valuation model, withits emphasis on the <strong>replacement</strong> of hydrocarbon <strong>reserves</strong>, isencourag<strong>in</strong>g risk tak<strong>in</strong>g because it fails to assess the relativerisks of access<strong>in</strong>g different hydrocarbons or, for that matter,alternative modes of profit gene<strong>ratio</strong>n. Traditional valuationmodels that primarily value hydrocarbon production growthand <strong>reserves</strong> <strong>replacement</strong> appear <strong>in</strong>creas<strong>in</strong>gly <strong>in</strong><strong>adequate</strong> <strong>in</strong>a carbon constra<strong>in</strong>ed economy.ma<strong>in</strong>ta<strong>in</strong><strong>in</strong>g <strong>oil</strong> production levels <strong>in</strong>creas<strong>in</strong>gly <strong>in</strong>volvesunprecedented risk, escalat<strong>in</strong>g costs and tighter marg<strong>in</strong>s. Thepast decade has seen a reassertion of state control over nationalpetroleum resources, which has cont<strong>in</strong>ued to limit <strong>in</strong>ternational<strong>oil</strong> company (IOC) access to easy <strong>oil</strong>. 1 The bulk of the <strong>oil</strong> thatrema<strong>in</strong>s freely accessible to IOCs is technically difficult andexpensive to produce such as the Canadian tar sands,ultra-deepwater and the offshore Arctic. BP’s Gulf of Mexicodisaster highlights the scale of the risks <strong>in</strong>volved <strong>in</strong> pursu<strong>in</strong>gsome of these marg<strong>in</strong>al resources.New bus<strong>in</strong>ess models: profits without <strong>reserves</strong>Add<strong>in</strong>g to the chang<strong>in</strong>g risk landscape, created by the ris<strong>in</strong>gdom<strong>in</strong>ance of marg<strong>in</strong>al <strong>oil</strong> resources <strong>in</strong> IOC <strong>reserves</strong>, is theemergence of new bus<strong>in</strong>ess models that do not boost <strong>reserves</strong>figures but nevertheless generate profits. The service agreementcontracts signed by some IOCs <strong>in</strong> Iraq are prime examples. 10Our research found that at least four of the top six IOCs havesignificantly relied on tar sands <strong>reserves</strong> additions to supportRRR rates <strong>in</strong> the past five years. As a percentage of total liquidsadditions, tar sands represents between 26% and 71% of<strong>reserves</strong> additions for these four companies (see Table 1).This brief<strong>in</strong>g details the <strong>in</strong>creas<strong>in</strong>g challenges be<strong>in</strong>g faced byIOCs as they struggle to ma<strong>in</strong>ta<strong>in</strong> bus<strong>in</strong>ess as usual. It highlightsthe chang<strong>in</strong>g landscape and raises difficult questions about therole <strong>in</strong>vestors and analysts might play <strong>in</strong> help<strong>in</strong>g or h<strong>in</strong>der<strong>in</strong>g thetransition to more flexible bus<strong>in</strong>ess models for <strong>oil</strong> companies.The analyst community may need to modify exist<strong>in</strong>g valuationmethods or develop new ones to assess and value companies<strong>in</strong> light of the chang<strong>in</strong>g landscape. Reserves <strong>replacement</strong> <strong>in</strong>particular no longer appears straightforward <strong>in</strong> its reflectionof company performance and value.We label these resources marg<strong>in</strong>al <strong>oil</strong> as their high cost andhigh risk places them at the top end of the production costcurve (see Figure 1, p9) and as such they are vulnerable toemerg<strong>in</strong>g trends towards efficiency and climate changeregulation that may dampen demand growth and stabilise price. 2We detail specific risks for each of these resource categories.However, this is a best estimate that probably understates thecase for most of the companies as the publicly available data for<strong>reserves</strong> additions is highly opaque. There is no disclosure of therole of deepwater resources <strong>in</strong> <strong>reserves</strong> additions; most of thedata is simply divided regionally. A look at company disclosures ofTable 1: Estimated tar sands <strong>reserves</strong> additions as a percentage of <strong>reserves</strong> additions 2005–09 3Companies As percentage of total <strong>reserves</strong> additions As percentage of total liquids <strong>reserves</strong> additionsConocoPhillips 4 39% 71%ExxonMobil 5 20% 51%Shell 6 16% 34%Total 7 10% 26%Chevron 8 3% 7%BP 0% 0%Average (excl. BP) 9 19.8% 42.6%ENDNOTES1 Dr Vlado Vivoda, 18 August 2009. Resource Nationalism, Barga<strong>in</strong><strong>in</strong>g andInternational Oil Companies: Challenges and Change <strong>in</strong> the New Millennium.Australian Institute of Energy.http://aie.org.au/Content/NavigationMenu/OilGasSIG/Interest<strong>in</strong>gUsefulArticles/ISA09_Vivoda.pdf2 IEA, World Energy Outlook 2009.3 2005–2009 average and exclud<strong>in</strong>g cost/price effects unless otherwisenoted.4 ConocoPhillips <strong>reserves</strong> are primarily <strong>in</strong> situ resources. Figures were primarilydrawn from the company’s 2010 10-K fil<strong>in</strong>g. Based on a sample size of onlythree years <strong>in</strong> the five year period.5 We calculated 22% for tar sands additions 2006–09 exclud<strong>in</strong>g cost/priceeffects, and 20% for ‘heavy <strong>oil</strong>/tar sands’ 2005–09. Here, we present thesmaller of the two values. Figures for the liquids column were primarily drawnfrom the company’s 2010 and 2008 10-K fil<strong>in</strong>gs, and the company’s 2009F<strong>in</strong>ancial & Operat<strong>in</strong>g Review.6 Includ<strong>in</strong>g cost/price effects.7 Based on assum<strong>in</strong>g that the total 5 year tar sands additions are covered <strong>in</strong>the s<strong>in</strong>gle number reported by Total SA <strong>in</strong> 2009.8 Based on a sample size of only two years <strong>in</strong> the five year period.9 Calculated us<strong>in</strong>g [average annual TS additions] / [average annual totaladditions].10 Arthur D. Little, 2010. New bus<strong>in</strong>ess models for the <strong>in</strong>ternational <strong>oil</strong> company<strong>in</strong> Prism 01/2010. Available from www.adl.com follow<strong>in</strong>g free regist<strong>ratio</strong>n.45
RESERVESREPLACEMENT RATIOIN A MARGINAL OILWORLD: ADEQUATEINDICATOR ORSUBPRIME STATISTIC?THE RESERVES REPLACEMENT CHALLENGEInvestors and analysts use a number of valuation <strong>in</strong>dicators toassess the performance of <strong>oil</strong> companies. One such <strong>in</strong>dicator,reported annually, is Reserves Replacement Ratio (RRR). RRRas the Republic of Congo (Brazzaville), Venezuela, Jordan, Ch<strong>in</strong>aand Madagascar. 4As IOCs push <strong>in</strong>to f<strong>in</strong>al frontiers, it is becom<strong>in</strong>g <strong>in</strong>creas<strong>in</strong>gly clearRISING COSTS, RISING RISKSOil is becom<strong>in</strong>g more expensive for IOCs to f<strong>in</strong>d and produce.While there rema<strong>in</strong> very limited opportunities to ga<strong>in</strong> equityproduction <strong>in</strong> countries belong<strong>in</strong>g to the Organization of theWhile ris<strong>in</strong>g <strong>oil</strong> prices reflect the<strong>in</strong>creas<strong>in</strong>g cost of these resources itis not clear that demand and pricewill always support their production.measures the amount of proved <strong>reserves</strong> added to a company’sthat these marg<strong>in</strong>al resources present a range of challengesPetroleum Export<strong>in</strong>g Countries (OPEC), the scope for <strong>reserves</strong>reserve base dur<strong>in</strong>g the year relative to the amount of <strong>oil</strong> andarguably greater than the <strong>in</strong>dustry has ever faced. Furthermore,<strong>replacement</strong> is becom<strong>in</strong>g tighter as non-OPEC conventional <strong>oil</strong>gas produced. 1 Naturally, the ideal situation is one <strong>in</strong> whichthe sp<strong>oil</strong>s of marg<strong>in</strong>al <strong>oil</strong> are no longer the preserve of the IOCs.reaches its peak. The specialised equipment and skills associatedRRR is consistently over 100% as this would <strong>in</strong>dicate that theNational Oil Companies (NOCs) are <strong>in</strong>creas<strong>in</strong>gly acquir<strong>in</strong>g rights <strong>in</strong>with f<strong>in</strong>d<strong>in</strong>g and develop<strong>in</strong>g <strong>oil</strong> <strong>reserves</strong> <strong>in</strong> ultra-deepwater andcompany is replac<strong>in</strong>g more <strong>oil</strong> and gas than it is produc<strong>in</strong>g.A company that is deliver<strong>in</strong>g RRR at a rate persistently below<strong>in</strong>ternational plays encroach<strong>in</strong>g on the IOCs’ traditional territory.the offshore Arctic are rais<strong>in</strong>g explo<strong>ratio</strong>n costs to unprecedentedheights, 5 while the extreme conditions and remote locationsDemand dependent100% is clearly runn<strong>in</strong>g out of <strong>oil</strong> and gas.The above challenges justify exam<strong>in</strong><strong>in</strong>g whether RRR is actuallyentail ever greater risks. Although Canadian tar sands presentBut the circumstances under which the growth <strong>in</strong> productionan effective <strong>in</strong>dicator of value and ask<strong>in</strong>g the follow<strong>in</strong>g questions:relatively little explo<strong>ratio</strong>n risk as resources are shallow,of these marg<strong>in</strong>al resources takes place is far from assured.But, as we enter the second decade of the twenty first century,high capital expenditure and ope<strong>ratio</strong>nal costs squeeze profitthe opportunities for <strong>in</strong>ternational <strong>oil</strong> companies 2 (IOCs) toacquire new <strong>reserves</strong> are narrow<strong>in</strong>g considerably. The pastY If reserve additions are made with <strong>oil</strong> that is costlier andriskier than the <strong>oil</strong> be<strong>in</strong>g replaced, does the RRR <strong>in</strong>dicatormarg<strong>in</strong>s considerably.Increas<strong>in</strong>gly, analysts are suggest<strong>in</strong>g that high <strong>oil</strong> prices, andthe energy security fears they <strong>in</strong>spire, could trigger sufficientdecade has seen a reassertion of state control over national<strong>adequate</strong>ly value the additions?While ris<strong>in</strong>g <strong>oil</strong> prices reflect the <strong>in</strong>creas<strong>in</strong>g cost of theseadoption of efficiency measures to br<strong>in</strong>g about a global <strong>oil</strong>petroleum resources, which has cont<strong>in</strong>ued to limit IOC access toresources it is not clear that demand and price will alwaysdemand peak before 2020. 9 This would stabilise <strong>oil</strong> priceseasy <strong>oil</strong>. 3 The companies have met this challenge for decadeswith the development of technology and eng<strong>in</strong>eer<strong>in</strong>g that hasY Is there enough transparency with<strong>in</strong> <strong>reserves</strong> additionsreport<strong>in</strong>g to enable <strong>in</strong>vestors to judge risk?support their production. If, as many analysts are <strong>in</strong>creas<strong>in</strong>glysuggest<strong>in</strong>g, 6 demand were to peak and decl<strong>in</strong>e <strong>in</strong> the com<strong>in</strong>grender<strong>in</strong>g many marg<strong>in</strong>al <strong>oil</strong> sources uneconomic.enabled <strong>oil</strong> production <strong>in</strong> technically difficult locations anddecade <strong>in</strong> response to the ris<strong>in</strong>g cost of <strong>oil</strong> and the parallelFor example, Deutsche Bank produced a thought piece <strong>in</strong>conditions, such as the North Sea, Alaska and <strong>in</strong> ever deeperwaters around the <strong>world</strong>.Y Does RRR tell <strong>in</strong>vestors enough about the potential orotherwise of the additions made <strong>in</strong> that year?imperative of limit<strong>in</strong>g carbon emissions, the costliest resources<strong>in</strong> the market clearly face the greatest threat.October 2009 stat<strong>in</strong>g that ‘the end is nigh for the age of <strong>oil</strong>’. 10The basic thesis was that a return to high <strong>oil</strong> prices <strong>in</strong> the nextfew years would give a boost to the nascent efficiency driveIn the last decade, ris<strong>in</strong>g demand for <strong>oil</strong> and the associated high<strong>oil</strong> price have driven companies to <strong>in</strong>creas<strong>in</strong>gly produce <strong>oil</strong> fromY Are companies tak<strong>in</strong>g excessive risks because of perceivedpressure from <strong>in</strong>vestors to ma<strong>in</strong>ta<strong>in</strong> RRR?There is little doubt that these marg<strong>in</strong>al resources make up themajority of the rema<strong>in</strong><strong>in</strong>g <strong>oil</strong> available to IOCs. The Internationalalready tak<strong>in</strong>g place primarily <strong>in</strong> the US and Ch<strong>in</strong>a. Theaccelerated take up of vehicle efficiency technologies such asunconventional and costly sources such as the Canadian tarEnergy Agency (IEA) states that non-OPEC conventional <strong>oil</strong>the hybrid, plug-<strong>in</strong> hybrid and <strong>in</strong> the longer term, the electricsands. As we look towards the com<strong>in</strong>g decade, IOCs areexplor<strong>in</strong>g for <strong>oil</strong> <strong>in</strong> ultra-deepwater and <strong>in</strong> the oceans of theY If such pressure exists, is it <strong>in</strong> the <strong>in</strong>terests of <strong>in</strong>vestors tode-emphasise RRR and allow companies to adopt moreproduction will peak <strong>in</strong> 2010 and go <strong>in</strong>to steady decl<strong>in</strong>e. 7Unconventional <strong>oil</strong>, dom<strong>in</strong>ated by Canadian tar sands, isvehicle, would br<strong>in</strong>g about a peak <strong>in</strong> <strong>oil</strong> demand by 2016.As a result Deutsche Bank stated that ‘The value of high capexArctic region, where climate change is rapidly thaw<strong>in</strong>g the iceflexible bus<strong>in</strong>ess models?expected to temper the decl<strong>in</strong>e <strong>in</strong> the medium term and raise<strong>in</strong>tensity, long lead time, currently un-developed <strong>oil</strong>, such asthat has h<strong>in</strong>dered explo<strong>ratio</strong>n and production <strong>in</strong> the past. Manyoverall non-OPEC production <strong>in</strong> the long term. Ultra-deepwaterundeveloped Canadian heavy <strong>oil</strong> sands, <strong>oil</strong> shales, and Braziliancompanies are also look<strong>in</strong>g at unconventional resources such astar sands and <strong>oil</strong> shale outside of Canada <strong>in</strong> countries as diverseY Would reduc<strong>in</strong>g emphasis on RRR render diversification <strong>in</strong>tolow carbon technologies more attractive?and Arctic resources will also <strong>in</strong>creas<strong>in</strong>gly contribute to offsett<strong>in</strong>gthe decl<strong>in</strong>e <strong>in</strong> a bus<strong>in</strong>ess as usual demand scenario. 8pre-salt and other ultra-deepwater plays could be far lowerthan the market currently expects’. 116 7
Additionally, many <strong>in</strong> situ projects are fac<strong>in</strong>g disappo<strong>in</strong>t<strong>in</strong>g resultsIndeed, the now defunct M<strong>in</strong>erals Management Service and theThe report goes on to state that on average deepwaterfreeze-over, icebergs that threaten to collide with rigs and awith recovery rates and the crucial operat<strong>in</strong>g cost factor ofdeepwater <strong>in</strong>dustry <strong>in</strong> the Gulf of Mexico were warned of therepresents about 10% of the <strong>reserves</strong> and production of whatdelicate ecology that requires meticulous protection all conspiresteam-to-<strong>oil</strong> <strong>ratio</strong>. 16,17<strong>in</strong>adequacy of blowout prevention procedures and the difficultyDeutsche Bank refers to as major <strong>oil</strong>s. 36 Further analysis fromto make <strong>oil</strong> production here difficult, risky and expensive,of controll<strong>in</strong>g a blowout <strong>in</strong> the ultra-deep as far back as 2004. 26this report is presented <strong>in</strong> the appendix.possibly more so than any other region <strong>in</strong> the <strong>world</strong>.Analysts have expressed concern about the ‘narrow<strong>in</strong>g w<strong>in</strong>dowof profitability’ for tar sands production cit<strong>in</strong>g <strong>in</strong>creas<strong>in</strong>gIt is well recognised with<strong>in</strong> the <strong>in</strong>dustry that the operat<strong>in</strong>gconditions <strong>in</strong> ultra-deepwater are test<strong>in</strong>g the limits of bothIs deepwater deliver<strong>in</strong>g on its promise?The Arctic ecosystem is perhaps the most vulnerable toenvironmental regulations and constra<strong>in</strong>ts on resources suchtechnology and human expertise. 27 As one ex-<strong>in</strong>dustryWhile the recent growth <strong>in</strong> deepwater production is impressive,long term impacts from <strong>oil</strong> spills on earth. 44 Freez<strong>in</strong>gas water and natural gas as add<strong>in</strong>g to the already high costs. 18executive commented, ‘Our ability to manage risks hasn’t caughtexperience from some wells cast doubts on the longevity oftemperatures, thick ice cover, and slow turnover of plantsCosts related to land reclamation are likely to have beenup with our ability to explore and produce <strong>in</strong> deep water’. 28some fields. BP’s Thunder Horse project <strong>in</strong> the Gulf of Mexicoand animals mean that <strong>oil</strong> l<strong>in</strong>gers, expos<strong>in</strong>g multiple gene<strong>ratio</strong>nsunderestimated rais<strong>in</strong>g the risk of large unplanned foris a case <strong>in</strong> po<strong>in</strong>t. Hav<strong>in</strong>g been delayed by technical andof organisms to contam<strong>in</strong>ation. 45 Weak sunlight <strong>in</strong>hibits theexpenditures <strong>in</strong> the future as it is far from certa<strong>in</strong> that suchWhile the complexity of ope<strong>ratio</strong>ns grows with depth andeng<strong>in</strong>eer<strong>in</strong>g difficulties for four years this ultra-deepwaterbreakdown of spilled <strong>oil</strong>. 46 The w<strong>in</strong>ter freeze-over means thatcosts will be borne by Albertan taxpayers. 19remoteness from shore, so does the difficulty of address<strong>in</strong>gproject started production <strong>in</strong> June 2008 follow<strong>in</strong>g $5 billionope<strong>ratio</strong>ns are limited to summer months, therefore a blowouta leak. There is little evidence that anyth<strong>in</strong>g less than a reliefof <strong>in</strong>vestment. Its capacity was supposed to be 250,000b/dhas the potential to spill <strong>oil</strong> for months if it cannot be stoppedAll the major IOCs now have significant tar sands <strong>reserves</strong>well can guarantee closure of a blowout at these depths.but it has never reached that level and appears to have hit abefore w<strong>in</strong>ter sets <strong>in</strong>. For these reasons, a spill <strong>in</strong> Arctic watersand, with the exception of BP, they all currently have ongo<strong>in</strong>gBP’s Macondo well, at 4,993ft (1,522m), is far from be<strong>in</strong>g theproduction peak with<strong>in</strong> six months of com<strong>in</strong>g on-stream. 37could be much more devastat<strong>in</strong>g to the local and regionalproduction. Yet the vulnerability of tar sands production growthdeepest ope<strong>ratio</strong>n <strong>in</strong> the <strong>in</strong>dustry. Shell is operat<strong>in</strong>g the deepestBy February 2010, water was mak<strong>in</strong>g up 31% of the liquidsecology, and the people that depend on it, than <strong>in</strong> the warmwas demonstrated <strong>in</strong> 2008 when follow<strong>in</strong>g the <strong>oil</strong> price crashproduction today with its new Perdido platform <strong>in</strong> water depthsbe<strong>in</strong>g produced at the ma<strong>in</strong> well. 38 Observers doubt that itwaters of the Gulf of Mexico. Operat<strong>in</strong>g safely here will requireto $35 per barrel <strong>in</strong> the last quarter of that year, all projectsof 8,000ft (2,450m), far deeper than Macondo. 29 The pre-saltwill reach its lifetime target production of one billion barrels. 39rigid safety procedures with very high redundancy.that had not yet broken ground were put on hold. Of some twomillion barrels per day (mb/d) of non-OPEC production capacitythat was shelved <strong>in</strong> this period 1.7 mb/d, or 85%, was Canadiantar sands production. 20 While <strong>oil</strong> prices have s<strong>in</strong>ce recoveredand many projects have started to move forward, the <strong>in</strong>dustrydeposits off the Brazilian coast present further challenges as theyare not only <strong>in</strong> ultra-deepwater but are also thousands of metresbelow the seabed under layers of rock and unstable salt. 30Many IOCs are significantly <strong>in</strong>vested <strong>in</strong> deepwater productionWith ultra-deepwater the stakes areris<strong>in</strong>g higher than ever while the marg<strong>in</strong>sare be<strong>in</strong>g squeezed by escalat<strong>in</strong>g costsand uncerta<strong>in</strong> returns.Extreme spill response logisticsThe extreme conditions and the remoteness of the offshoreArctic from major population centres, push the potential costs ofclear<strong>in</strong>g up a major spill <strong>in</strong> the Arctic (to the extent that a clearrema<strong>in</strong>s reliant on long term <strong>oil</strong> prices not fall<strong>in</strong>g below $60 aparticularly BP, Shell, Chevron and ExxonMobil. 31 Indeedup can be achieved) to unprecedented heights. Should a spillbarrel and possibly requires prices over $100 a barrel to realisedeepwater and, <strong>in</strong>creas<strong>in</strong>gly, ultra-deepwater have been theoccur – and accord<strong>in</strong>g to one Alaskan regulator ‘there is neverthe growth that companies seek. 21most important theme of production growth for much ofzero risk’ 47 – the potential impact on shareholder value addsthe <strong>in</strong>dustry <strong>in</strong> the past decade. Accord<strong>in</strong>g to IHS CERA,enormously to the risk premium of companies operat<strong>in</strong>g there.Crucially, Canadian tar sands production would be significantly‘from 2006 to 2009 annual <strong>world</strong> deepwater discoveriesCairn Energy’s eng<strong>in</strong>eer<strong>in</strong>g and ope<strong>ratio</strong>ns director Phil Tracy,curtailed if policies to address climate change are implemented,(600 feet or more) accounted for 42 to 54 percent oftold an <strong>in</strong>dustry conference <strong>in</strong> Oslo recently that ‘[Greenland] isaccord<strong>in</strong>g to the IEA. 22 This is not only because of the highall discoveries – onshore and offshore. In 2008 alone,Similar problems were experienced at BHP Billiton’s Neptuneunforgiv<strong>in</strong>g <strong>in</strong> terms of cost and consequence’. 48carbon emissions of tar sands production but also because <strong>oil</strong>deepwater discoveries added 13.7 billion barrels of <strong>oil</strong>project. 40 While the late Matt Simmons claimed to have trackedprices would barely support tar sands production growth <strong>in</strong> a lowequivalent to global <strong>reserves</strong>’. 3225 deepwater wells that have experienced rapid decl<strong>in</strong>e. 41At the peak of the response effort <strong>in</strong> the Gulf of Mexico, BP wascarbon <strong>world</strong>. As the marg<strong>in</strong>al barrel on the <strong>oil</strong> market, tar sandsable to muster the assistance of nearly 48,000 workers, 6,000production is a loser to any concerted efficiency drive.Shortly after the Horizon accident, Deutsche Bank issued aThe <strong>oil</strong> <strong>in</strong>dustry is certa<strong>in</strong>ly no stranger to risk, but it appearsmar<strong>in</strong>e vessels, 150 aircraft, six deepwater drill<strong>in</strong>g rigs and twoULTRA-DEEPWATERBP’s Deepwater Horizon (Macondo) tragedy that unfoldedresearch note detail<strong>in</strong>g the importance of deepwater productionto the <strong>in</strong>dustry and speculat<strong>in</strong>g on the impacts of the disaster.The analysts noted that ‘The Gulf of Mexico was the biggestthat with ultra-deepwater the stakes are ris<strong>in</strong>g higher than everwhile the marg<strong>in</strong>s are be<strong>in</strong>g squeezed by escalat<strong>in</strong>g costs anduncerta<strong>in</strong> returns. This could be even more the case for the <strong>oil</strong>float<strong>in</strong>g production, storage and offload<strong>in</strong>g units (FPSOs). 49The cost of assembl<strong>in</strong>g these resources, while huge, was greatlym<strong>in</strong>imised by the accident’s proximity to major urban centresthrough the summer of 2010 has not only exposed thegrowth-driv<strong>in</strong>g region of the biggest growth-driv<strong>in</strong>g <strong>oil</strong> supply<strong>in</strong>dustry’s f<strong>in</strong>al frontier, the offshore Arctic.and centres of <strong>oil</strong> <strong>in</strong>dustry expertise and equipment supply. 50consequences of risk tak<strong>in</strong>g <strong>in</strong> this extreme environment buthas most likely raised the cost of ultra-deepwater productionforever. 23 While more str<strong>in</strong>gent regulation imposed as a resulttheme: the deepwater’. 33The report also detailed the significance of deepwaterOFFSHORE ARCTICThe United States Geological Survey estimates that 30% of theStill clean up costs alone have topped $11 billion so far. Thelogistical complexities and costs of deliver<strong>in</strong>g such a response<strong>in</strong> the remote offshore Arctic will be unlikely to prove as easyof the disaster may be concentrated <strong>in</strong> North America andproduction to IOCs:<strong>world</strong>’s undiscovered gas and 13% of the <strong>world</strong>’s undiscoveredor as cheap as <strong>in</strong> the Gulf of Mexico.possibly Europe, the raised cost of <strong>in</strong>surance for ultra-deepwaterproduction is likely to apply globally. 24 Additionally, f<strong>in</strong>ance for[Deepwater] has been the source of over 60 billion barrels<strong>oil</strong> is to be found north of the Arctic Circle. 42 Of this <strong>oil</strong>, 84% –approximately 90 billion barrels – is expected to be foundHigh cost of m<strong>in</strong>imis<strong>in</strong>g risksuch projects is likely to come at a higher price as <strong>in</strong>vestorsof 2P 34 <strong>reserves</strong> s<strong>in</strong>ce the late 1990s and […] todayoffshore, some of it <strong>in</strong> deepwater. 43The logistical difficulties of ma<strong>in</strong>ta<strong>in</strong><strong>in</strong>g essential safety andseek higher returns for higher risk. 25represents the lead<strong>in</strong>g s<strong>in</strong>gle source of growth <strong>in</strong> <strong>oil</strong> productiondisaster response capability <strong>in</strong> the offshore Arctic iswith anticipated volume growth of some 12% p.a. over theThe offshore Arctic presents <strong>oil</strong> companies with some ofexemplified by the efforts of BP and ExxonMobil ownedPrior to the disaster, the push <strong>in</strong>to ever deeper water and more2000–2015 period aga<strong>in</strong>st just 2% for the market overall,the most formidable challenges yet. Harsh conditions, lowImperial Oil <strong>in</strong> pressur<strong>in</strong>g the Canadian government to relaxcomplex ope<strong>ratio</strong>ns was rais<strong>in</strong>g costs and risks to the po<strong>in</strong>t thatdirectly as a result of the technological and physical push totemperatures, ope<strong>ratio</strong>nal w<strong>in</strong>dows cut short by the w<strong>in</strong>tersafety requirements for drill<strong>in</strong>g <strong>in</strong> the Beaufort Sea.it was perhaps no surprise that disaster eventually struck.deeper and deeper water, previously <strong>in</strong>accessible to drill<strong>in</strong>g10and production. 3511
In March 2010, both companies appealed to the Canadiangovernment to withdraw a regulatory requirement to have thecapability at hand to drill a relief well <strong>in</strong> the same season asdrill<strong>in</strong>g a ma<strong>in</strong> well <strong>in</strong> the Beaufort Sea. 51 The companies claimthat the requirement makes operat<strong>in</strong>g <strong>in</strong> the area unviable andthat the regulation is overly prescriptive. 52 BP argued that itssafety procedures were <strong>adequate</strong> to prevent the occurrence of ablowout, 53 a claim that now appears impossible to supportfollow<strong>in</strong>g the Macondo <strong>in</strong>cident. The same season relief wellhear<strong>in</strong>g has s<strong>in</strong>ce been suspended and the Canadian NationalEnergy Board is now conduct<strong>in</strong>g a review of Arctic offshoredrill<strong>in</strong>g <strong>in</strong> light of the disaster. 54The call for regulatory relaxation of relief well preparedness <strong>in</strong>the Beaufort Sea exemplifies the risk that companies arecompelled to take <strong>in</strong> the Arctic <strong>in</strong> order to make operat<strong>in</strong>g thereeconomic. Essentially the problem for the companies is thathav<strong>in</strong>g relief well capacity br<strong>in</strong>gs the additional cost ofma<strong>in</strong>ta<strong>in</strong><strong>in</strong>g a spare rig at all times and means stopp<strong>in</strong>g thedrill<strong>in</strong>g season early to allow enough time to drill a relief wellshould a blowout occur. 55Relief well preparedness is a measure that can only reducethe scale of the catastrophe as even when fully prepared tobeg<strong>in</strong> drill<strong>in</strong>g a relief well the moment a blowout occurs, <strong>oil</strong> couldstill spill for weeks while the drill<strong>in</strong>g takes place. The purposeof the regulation was to ensure that a relief well could be drilledbefore the freeze-over prevent<strong>in</strong>g a spill from cont<strong>in</strong>u<strong>in</strong>g forseveral months.However, even this back-up measure was felt to be too onerousfor companies on top of the other challenges the Arctic presents.Thus the companies are choos<strong>in</strong>g to accept the risk of aprolonged spill that could be many times worse <strong>in</strong> terms ofimpact and cost than the Macondo spill. It rema<strong>in</strong>s to beseen whether follow<strong>in</strong>g the Macondo <strong>in</strong>cident there will besufficient public confidence <strong>in</strong> <strong>in</strong>dustry assurances that spillscan never happen.Most of the IOCs have some explo<strong>ratio</strong>n ongo<strong>in</strong>g or planned <strong>in</strong>the offshore Arctic and Greenpeace recently took direct actionto stop Cairn Energy’s explo<strong>ratio</strong>n activities off the west coastof Greenland. BP, ExxonMobil and its 70% owned Canadiansubsidiary Imperial are active <strong>in</strong> the Canadian Beaufort Sea asare Shell, Chevron, ConocoPhillips and Devon. 56 Shell is thebiggest leaseholder <strong>in</strong> the Chukchi Sea off of Alaska and hasalready sunk $3.5 billion <strong>in</strong>to the venture s<strong>in</strong>ce 2006 withcont<strong>in</strong>uous delays to drill<strong>in</strong>g, which may or may not start <strong>in</strong>July 2011. 57 ConocoPhillips, BP, ENI, Total and Repsol all have<strong>in</strong>terests there as well. 58It rema<strong>in</strong>s to be seen whether follow<strong>in</strong>gthe Macondo <strong>in</strong>cident there will besufficient public confidence <strong>in</strong> <strong>in</strong>dustryassurances that spills can never happen.RESERVES DATA OPACITYOur research, detailed <strong>in</strong> the appendix, shows that at least fourof the top six IOCs have significantly relied on tar sands <strong>reserves</strong>additions to support RRR rates <strong>in</strong> the past five years. As apercentage of total liquids additions tar sands represents between26% and 71% of <strong>reserves</strong> additions for these four companies. 59While it is almost common knowledge that deepwater and ultradeepwaterresources have also played a key role <strong>in</strong> <strong>reserves</strong>additions for many companies, it is currently impossible toestablish from public data any company’s precise exposure tothe resource theme. Indeed, tar sands <strong>reserves</strong> data has onlyrecently become more transparent through the new regulationsbrought <strong>in</strong>to force by the US Securities and ExchangeCommission (SEC) <strong>in</strong> 2010.Even so, it is total proven <strong>reserves</strong>, not yearly <strong>reserves</strong> additions,that are detailed <strong>in</strong> the SEC data and to establish the tar sands<strong>reserves</strong> additions <strong>in</strong>volves a number of calculations and<strong>in</strong>ferences. 60The current opacity of <strong>reserves</strong> additions offers <strong>in</strong>sufficient<strong>in</strong>sight for analysts <strong>in</strong>to the relative strategies of differentcompanies to address <strong>in</strong>creas<strong>in</strong>g risks <strong>in</strong> <strong>oil</strong> explo<strong>ratio</strong>n andproduction. RRR would therefore appear to be a somewhatobtuse tool for valuation.PROFITS WITHOUT RESERVES: WHAT THEN?It is <strong>in</strong>creas<strong>in</strong>gly clear that huge structural shifts have takenplace <strong>in</strong> the global <strong>oil</strong> <strong>in</strong>dustry over the past decade andmany of these trends are set to <strong>in</strong>tensify <strong>in</strong> the next decade.The move <strong>in</strong>to riskier and more expensive resources is onesuch shift. Another is the chang<strong>in</strong>g relationship betweenIOCs and NOCs.NOCs have branched out <strong>in</strong>to <strong>in</strong>ternational plays us<strong>in</strong>g theirsubstantial capital and <strong>in</strong>creas<strong>in</strong>g technical skill base to makeacquisitions and form jo<strong>in</strong>t ventures with IOCs or local NOCs.There is also an <strong>in</strong>creas<strong>in</strong>g tendency for NOCs to engage<strong>in</strong>ternational <strong>oil</strong>field service providers, such as Schlumberger orHalliburton, for their construction and eng<strong>in</strong>eer<strong>in</strong>g requirementsleav<strong>in</strong>g IOCs to opt for a role as prime contractor. In these casesBP’s disaster leaked 4.9 million barrels of <strong>oil</strong> <strong>in</strong>to the Gulf of Mexico. ©REZAC/GREENPEACEthere is no Production Shar<strong>in</strong>g Agreement but <strong>in</strong>stead a service In an analysis of these structural shifts, Arthur D. Little (ADL)contract, such as the fee-for-service contracts recentlysuggested that companies may need to create clearly separatednegotiated <strong>in</strong> Iraq, where a set fee is paid to the company for bus<strong>in</strong>ess divisions that give transparency to the serviceevery barrel of production.agreement bus<strong>in</strong>ess <strong>in</strong> order that this activity is not under valuedby <strong>in</strong>vestors. 61 It cites the lack of <strong>reserves</strong> and equity productionThese deals are not unprofitable for the companies, albeit with <strong>in</strong> these deals as the reason why <strong>in</strong>vestors are likely to fail tosignificant contractual and security risk <strong>in</strong> the case of Iraq, but recognise the value.they do not provide any equity share of <strong>reserves</strong> so do noth<strong>in</strong>gfor key value <strong>in</strong>dicators such as RRR or for proven <strong>reserves</strong> or If, as ADL suggests, these new ways of operat<strong>in</strong>g are likely todaily production.become more commonplace, there is clearly a need for analysts1213
ALTERNATIVE BUSINESS MODELS FOR OIL AND GAS COMPANIES?to re-th<strong>in</strong>k the emphasis on traditional top l<strong>in</strong>e parameters, suchasserted that analysts and companies had been overly focusedas production and <strong>reserves</strong> figures, <strong>in</strong> light of an <strong>in</strong>creas<strong>in</strong>gon this short term measure of capital return. They concludedWe have discussed throughout this report the <strong>in</strong>capacity ofIn addition to the demands for much greater efficiency spurredpresence of bus<strong>in</strong>ess activities that enhance the bottom l<strong>in</strong>e –that this was unsusta<strong>in</strong>able and that <strong>in</strong>vestors were <strong>in</strong>creas<strong>in</strong>glyRRR <strong>in</strong> differentiat<strong>in</strong>g risk between various sources of <strong>oil</strong> that aby high <strong>oil</strong> prices and climate change regulation, the carthe ma<strong>in</strong> goal of do<strong>in</strong>g bus<strong>in</strong>ess – but do not impact traditionalconcerned for longer term growth prospects such as <strong>reserves</strong>company uses to replace its <strong>reserves</strong>. We have also mentioned<strong>in</strong>dustry faces low growth projections and chang<strong>in</strong>g attitudestop l<strong>in</strong>e numbers at all.<strong>replacement</strong>. Indeed, they detected <strong>in</strong> the years immediatelythe <strong>in</strong>ability of the <strong>in</strong>dicator to value any company activity thattowards car ownership, particularly among younger gene<strong>ratio</strong>nsprior to publication (2002–04) an <strong>in</strong>creas<strong>in</strong>g focus on <strong>reserves</strong>does not <strong>in</strong>volve the acquisition of <strong>oil</strong> and gas resources forfuture production.One current example of the latter is the new serviceagreements signed <strong>in</strong> Iraq that do not provide companies withequity <strong>reserves</strong> or production. Another example may be thealternative energy bus<strong>in</strong>esses that some companies areand urban populations. 64 Car companies are f<strong>in</strong>d<strong>in</strong>g that urbanpopulations are less <strong>in</strong>terested <strong>in</strong> own<strong>in</strong>g a car than they are <strong>in</strong>hav<strong>in</strong>g easy access to a diverse mix of mobility solutions.In response to this, Peugeot-Citroën has launched a productwhich sells subscribers ‘mobility units’, <strong>in</strong> exchange for use ofa car, scooter or bicycle. 65 The system draws on the model of<strong>in</strong>creas<strong>in</strong>gly popular ‘car club’ bus<strong>in</strong>esses such as the UK’sThe exist<strong>in</strong>g valuation model, with itsemphasis on the <strong>replacement</strong> ofhydrocarbon <strong>reserves</strong>, [may be]encourag<strong>in</strong>g risk tak<strong>in</strong>g because itfails to assess the relative risks ofaccess<strong>in</strong>g different hydrocarbons.<strong>replacement</strong> and greater appetite for risk <strong>in</strong> upstream projects. 69Analyst emphasis on <strong>in</strong>dicators such as RoACE and RRR canperhaps stand <strong>in</strong> the way of recognis<strong>in</strong>g the value <strong>in</strong> emerg<strong>in</strong>gbus<strong>in</strong>ess models that do not conform to the standard. Forexample, one former senior <strong>oil</strong> and gas company executiveexpressed his occasional frust<strong>ratio</strong>n with analysts’ ‘lack of<strong>in</strong>vested <strong>in</strong>, such as w<strong>in</strong>d and solar gene<strong>ratio</strong>n, that also do notStreetcar. 66 Companies <strong>in</strong>clud<strong>in</strong>g GM, Renault, BMW and Audi<strong>in</strong>terest <strong>in</strong> the bigger picture (…) and their preoccupationfigure <strong>in</strong> RRR rates. Generally these have been put <strong>in</strong>to separateare all look<strong>in</strong>g at similar schemes. 67with m<strong>in</strong>utiae that was dest<strong>in</strong>ed to feed the company modelbus<strong>in</strong>ess divisions so that they can be valued separately to the<strong>oil</strong> and gas production bus<strong>in</strong>ess. This sepa<strong>ratio</strong>n of bus<strong>in</strong>essdivisions is be<strong>in</strong>g suggested by Arthur D. Little for the serviceagreement bus<strong>in</strong>ess that <strong>oil</strong> companies may <strong>in</strong>creas<strong>in</strong>gly f<strong>in</strong>dthemselves engag<strong>in</strong>g <strong>in</strong>. 62When <strong>oil</strong> demand beg<strong>in</strong>s to flattenand decl<strong>in</strong>e, what good will <strong>reserves</strong><strong>replacement</strong> be as an <strong>in</strong>dictor of value ifit does not differentiate between cheapand expensive to produce resources?While a sepa<strong>ratio</strong>n of service agreement bus<strong>in</strong>ess from thetraditional production shar<strong>in</strong>g bus<strong>in</strong>ess may help <strong>in</strong> assess<strong>in</strong>g the<strong>in</strong> their spreadsheet’. 70He gave the example of a company that had developedsubstantial new LNG <strong>in</strong>frastructure, which he felt for a long timewas be<strong>in</strong>g consistently ignored by analysts <strong>in</strong> the valuation ofthe company:The question of what an <strong>oil</strong> company should do to reduce itsrelative value of bus<strong>in</strong>ess that does not deliver equity <strong>reserves</strong>exposure to riskier sources of <strong>oil</strong> is implicit <strong>in</strong> the debate aboutand production, there rema<strong>in</strong>s a need for more effective ways…because much of the value growth <strong>in</strong> prospect wasthe <strong>in</strong>creas<strong>in</strong>g risk of replac<strong>in</strong>g <strong>oil</strong> <strong>reserves</strong>. It can be arguedto assess the traditional bus<strong>in</strong>ess <strong>in</strong> light of the <strong>in</strong>creas<strong>in</strong>g andessentially option value, it did not lend itself to be<strong>in</strong>g factoredthat it should stick with what it knows best for as long as thatvaried risks of access<strong>in</strong>g <strong>oil</strong> and gas as previously described.<strong>in</strong>to the analysts’ models via some familiar metrics which l<strong>in</strong>kedrema<strong>in</strong>s viable. After all, the <strong>oil</strong> <strong>in</strong>dustry has thrived on tak<strong>in</strong>gvolume to profit. In other words it was difficult to understand,big gambles for over a century and has pulled through someThis is just an example of the k<strong>in</strong>d of <strong>in</strong>novation that is tak<strong>in</strong>gIn particular it is the vulnerability of the marg<strong>in</strong>al <strong>oil</strong> resources toand therefore to model, and as a result the analyst communitypretty tough times. But one could also argue that theplace <strong>in</strong> the face of emerg<strong>in</strong>g trends and chang<strong>in</strong>g societala demand peak that exposes the weakness of RRR as a valuefor quite a long time simply chose to overlook it until f<strong>in</strong>ally,challenges ahead are unprecedented and will require uniqueexpectations. It demonstrates that to address such trends may<strong>in</strong>dicator. When <strong>oil</strong> demand beg<strong>in</strong>s to flatten and decl<strong>in</strong>e, whathav<strong>in</strong>g had it expla<strong>in</strong>ed to them time and aga<strong>in</strong>, they f<strong>in</strong>allyresponses. Indeed, climate change and the <strong>in</strong>creas<strong>in</strong>g urgencyrequire the <strong>in</strong>novation of new bus<strong>in</strong>ess models alongsidegood will <strong>reserves</strong> <strong>replacement</strong> be as an <strong>in</strong>dictor of value if it‘got it’ and started to recognise it as a source of potentiallyfor action could take even the <strong>oil</strong> <strong>in</strong>dustry by surprise one day,technological advances.does not differentiate between cheap and expensive to producesignificant profit growth (as it has turned out to be), which <strong>in</strong>despite all the warn<strong>in</strong>gs.resources? If <strong>reserves</strong> additions were more clearly differentiatedturn further underp<strong>in</strong>ned the strength of (the company’s)While the car manufacturers will still make cars, the newaccord<strong>in</strong>g to risk and expense, would the value of alternativeshare price and market valuation. 71One <strong>in</strong>dustry that has gone through tremendous upheaval <strong>in</strong>bus<strong>in</strong>ess model may well require less <strong>in</strong>dividual vehicles,<strong>in</strong>vestments, such as those <strong>in</strong> low carbon energy resources, alsorecent years is the car <strong>in</strong>dustry, which collapsed with thereduc<strong>in</strong>g the value of the traditional manufactur<strong>in</strong>g bus<strong>in</strong>ess,become more transparent?So while key <strong>in</strong>dicators of value and their use <strong>in</strong> modell<strong>in</strong>g thef<strong>in</strong>ancial crisis of 2008. Its recovery, albeit lavishly governmentassisted, emerges <strong>in</strong>to an era of heightened uncerta<strong>in</strong>ty.In an echo of the <strong>oil</strong> <strong>in</strong>dustry trends discussed <strong>in</strong> this report,car manufacturers face a future of shr<strong>in</strong>k<strong>in</strong>g marg<strong>in</strong>s andwhile add<strong>in</strong>g value from new sources such as service provision.If a similar k<strong>in</strong>d of <strong>in</strong>novative model of conduct<strong>in</strong>g bus<strong>in</strong>esswere to emerge for the <strong>in</strong>ternational <strong>oil</strong> <strong>in</strong>dustry, one that didSPREADSHEET MINUTIAE VERSUSTHE BIG PICTUREIn 2005, a number of papers were published by researchers atperformance of compet<strong>in</strong>g companies <strong>in</strong> a sector are essentialtools of valuation, there may also be a need for more flexibleapproaches that can recognise both emerg<strong>in</strong>g structural riskswith the traditional bus<strong>in</strong>ess model and the value <strong>in</strong> new andweaken<strong>in</strong>g sales growth. 63 However, it is start<strong>in</strong>g tonot rely on produc<strong>in</strong>g <strong>oil</strong> and gas but promised new sources ofNorway’s Stavanger University that sought to exam<strong>in</strong>e how IOCsdevelop<strong>in</strong>g bus<strong>in</strong>ess models.demonstrate the sort of bus<strong>in</strong>ess model <strong>in</strong>novation thatvalue with less risk, <strong>oil</strong> company value would need to berespond to analyst measurement <strong>in</strong> light of what the researchersthe <strong>oil</strong> <strong>in</strong>dustry should perhaps take notice of.measured <strong>in</strong> correspond<strong>in</strong>gly new ways.had found to be a period of high cash flow and low <strong>in</strong>vestmentIt may also be that the exist<strong>in</strong>g valuation model, with its<strong>in</strong> the <strong>in</strong>ternational <strong>oil</strong> <strong>in</strong>dustry. 68emphasis on the <strong>replacement</strong> of hydrocarbon <strong>reserves</strong>, isencourag<strong>in</strong>g risk tak<strong>in</strong>g because it fails to assess the relativeThe researchers were concerned with a period from 1997 torisks of access<strong>in</strong>g different hydrocarbons or, for that matter,2001 <strong>in</strong> which they had observed an <strong>in</strong>creas<strong>in</strong>g tendency foralternative modes of profit gene<strong>ratio</strong>n. Perhaps greater flexibility<strong>oil</strong> companies to return cash to shareholders <strong>in</strong> the form of<strong>in</strong> the analyst model would also allow companies to considerdividends and share buybacks to the detriment of <strong>in</strong>vestment <strong>in</strong>their role <strong>in</strong> a low carbon <strong>world</strong> more broadly than they<strong>reserves</strong> and upstream production growth. They exam<strong>in</strong>ed thecurrently do.<strong>in</strong>fluence of Return on Average Capital Employed (RoACE) and1415
CONCLUSIONENDNOTESThe <strong>in</strong>ternational <strong>oil</strong> <strong>in</strong>dustry has entered an era <strong>in</strong> whichma<strong>in</strong>ta<strong>in</strong><strong>in</strong>g production numbers <strong>in</strong>volves unprecedented risk,escalat<strong>in</strong>g costs and tighter marg<strong>in</strong>s. Adequate profits fromequity production will <strong>in</strong>creas<strong>in</strong>gly depend on a high demandand high <strong>oil</strong> price environment which is not only far fromassured but is also counter to the <strong>in</strong>terests of energy securityand climate protection.Traditional valuation models that primarily value hydrocarbonproduction growth and <strong>reserves</strong> <strong>replacement</strong> appear<strong>in</strong>creas<strong>in</strong>gly <strong>in</strong><strong>adequate</strong> <strong>in</strong> a carbon constra<strong>in</strong>ed economy.There are also emerg<strong>in</strong>g bus<strong>in</strong>ess models that may provideprofits from <strong>oil</strong> production without provid<strong>in</strong>g equity <strong>reserves</strong>or production, which do not easily fit <strong>in</strong>to the standard <strong>oil</strong>company valuation model.The analyst community may need to modify exist<strong>in</strong>g valuationmethods or develop new ones to assess and value companies<strong>in</strong> light of the chang<strong>in</strong>g landscape. Reserves <strong>replacement</strong> <strong>in</strong>particular no longer appears straightforward <strong>in</strong> its reflectionof company performance and value.Traditional valuation models that primarilyvalue hydrocarbon production growthand <strong>reserves</strong> <strong>replacement</strong> appear<strong>in</strong>creas<strong>in</strong>gly <strong>in</strong><strong>adequate</strong> <strong>in</strong> a carbonconstra<strong>in</strong>ed economy.1 www.<strong>in</strong>vestopedia.com/terms/r/reserve-<strong>replacement</strong>-<strong>ratio</strong>.asp2 Here we refer to IOCs as the publically traded <strong>in</strong>ternational super-majors, primarilyExxonMobil, Chevron, BP, Shell, ConocoPhillips and Total. We recognise that theseissues may also affect smaller IOCs.3 Dr Vlado Vivoda, 18 August 2009. Resource Nationalism, Barga<strong>in</strong><strong>in</strong>g andInternational Oil Companies: Challenges and Change <strong>in</strong> the New Millennium.Australian Institute of Energy.http://aie.org.au/Content/NavigationMenu/OilGasSIG/Interest<strong>in</strong>gUsefulArticles/ISA09_Vivoda.pdf4 Friends of the Earth Europe, May 2010. Tar sands – Fuell<strong>in</strong>g the climate crisis,underm<strong>in</strong><strong>in</strong>g EU energy security and damag<strong>in</strong>g development objectives.www.foeeurope.org/corporates/pdf/Tar_Sand_F<strong>in</strong>al_May10.pdf5 Reuters, 11 February 2010. Oil explo<strong>ratio</strong>n costs rocket as risks rise.6 See for example: Arthur D. Little, February 2009. The beg<strong>in</strong>n<strong>in</strong>g of the end for <strong>oil</strong>?Peak <strong>oil</strong>: a demand-side phenomenon? Available fromwww.adl.com/reports.html?&no_cache=1&view=356 follow<strong>in</strong>g free regist<strong>ratio</strong>n.7 IEA 2009, World Energy Outlook 2009.8 Ibid.9 See for example: Arthur D. Little, February 2009 and Deutsche Bank GlobalResearch, 4 October 2009. The Peak Oil Market.10 Deutsche Bank Global Research 2009.11 Deutsche Bank Global Research 2009. Op. Cit.12 IEA 2009, World Energy Outlook 2009.13 IEA 2009. Op. Cit.14 IEA Flyer for Resources to Reserves 2010 (forthcom<strong>in</strong>g publication)www.iea.org/papers/2010/Flyer_RtoR2010.pdf15 The Globe & Mail, 28 April 2010. Shell puts <strong>oil</strong> sands expansion plans on hold.16 In situ production <strong>in</strong>volves <strong>in</strong>ject<strong>in</strong>g steam <strong>in</strong>to the bitumen reservoir to fluidise thebitumen so it can flow through a production well. The <strong>ratio</strong> of steam needed toproduce a barrel of <strong>oil</strong> is key to the economics of <strong>in</strong> situ production as a high steamrequirement raises the cost of <strong>in</strong>puts, primarily natural gas.17 Pat Roche, New Technology Magaz<strong>in</strong>e, 1 September 2007. SAGD: Sp<strong>in</strong> vs Reality;Eighty-Two Per Cent Of Alberta’s Oilsands Output Must Come From Wells, And TheIn-Situ Technology Of Choice Is SAGD. How Good Is It?18 CERES, May 2010. Canada’s Oil Sands: Shr<strong>in</strong>k<strong>in</strong>g w<strong>in</strong>dow of opportunity.19 The Pemb<strong>in</strong>a Institute, September 2010. Toxic Legacy: How Albertans could end uppay<strong>in</strong>g for <strong>oil</strong> sands m<strong>in</strong>e reclamation.20 IEA Medium Term Oil Market Report 2009.21 See CERES, May 2010 and Canadian Energy Research Institute, November 2009. Oilsands <strong>in</strong>dustry update: production outlook and supply costs 2009–43. Prices are <strong>in</strong>2009 dollars.22 IEA, WEO 200923 Grant Thornton 2010. The implications of the April 2010 <strong>oil</strong> spill on deepwaterexplo<strong>ratio</strong>n and production.www.grantthornton.com/staticfiles/GTCom/Advisory/Restructur<strong>in</strong>g%20and%20turnaround/White%20paper%20gulf%20<strong>oil</strong>%20spill.pdf24 Julia Kollewe, The Guardian, 20 September 2010. Oil <strong>in</strong>dustry set for surge <strong>in</strong><strong>in</strong>surance premiums after Deepwater disaster.25 Grant Thornton 2010. Op. Cit.26 Robert Campbell, Reuters, 14 June 2010. Special Report: Deepwater spills and shortattention spans. www.reuters.com/article/idUSTRE65D3Z22010061427 Katie Mazerov, Drill<strong>in</strong>g Contractor, 30 October 2009. Deepwater trend pushes risksmanagement to forefront. http://drill<strong>in</strong>gcontractor.org/deepwater-trend-pushesrisk-management-to-forefront-176828 Edward C. Chow quoted <strong>in</strong>, Jad Mouawad and Barry Meier, The New York Times, 29August 2010. Risk-Tak<strong>in</strong>g Rises as Oil Rigs <strong>in</strong> Gulf Drill Deeper.29 www.shell.com/home/content/aboutshell/our_strategy/major_projects_2/perdido30 Luciano D. Losekann, Adilson De Oliveira and Carlos Frederico L. Roch, United StatesAssociation for Energy Economics 2009. The Challenge of Develop<strong>in</strong>g Brazilian PresaltOil Fields.www.usaee.org/usaee2009/submissions/Presentations/SFLosekann.pdf31 See appendix for further details.32 IHS CERA, 30 June 2010. The Role of Deepwater Production <strong>in</strong> Global Oil Supply.33 Deutsche Bank Global Markets Research, June 2010. Macondo and the GlobalDeepwater.34 Proven and probable <strong>reserves</strong>.35 Deutsche Bank 2010, Op. Cit. p.18.36 Ibid.37 Glenn Morton, The Oil Drum, 30 April 2010. BP’s Thunder Horse to Under-Perform<strong>in</strong> the Wake of the Deepwater Horizon Blowout? www.the<strong>oil</strong>drum.com/node/641538 Energy Facts Weekly, 17 May 2010. The Other Deepwater Oil Production Problem:The Decl<strong>in</strong>e of Thunder Horse Field. www.energyfacts.org/L<strong>in</strong>kClick.aspx?fileticket=Jz0MG1DqfME%3D&tabid=10039 Glen Morton, The Oil Drum, 30 April 2010, Op. Cit.40 Glen Morton, The Oil Drum, 30 April 2010, Op. Cit.41 Loren Steffy, Houston Chronicle, 16 May 2010. In deep, and fall<strong>in</strong>g far short: Deepwateroutput worrisome.42 Gautier, D.L. et al. 2009. Assessment of Undiscovered Oil and Gas <strong>in</strong> the Arctic.Science 29 May 2009 324: 1175–117943 Bird, K.J. et al . 2008. Circum-Arctic Resource Appraisal: Estimates of UndiscoveredOil and Gas North of the Arctic Circle. USGS.44 Hollebone B. & F<strong>in</strong>gas M.F. 2008. Oil Spills <strong>in</strong> the Arctic: A Review of Three Decadesof Research at Environment In: Oil Spill Response: A Global Perspective (eds.Davidson, W.F., Lee, K. & Cogswell, A.). NATO Science for Peace and Security SeriesC: Environmental Security.45 Arctic Mar<strong>in</strong>e Assessment Programme 1998.46 Personal Communication: Gordon Hamilton, Associate Professor, Climate ChangeInstitute, University of Ma<strong>in</strong>e, Orono, 10 August 201047 Jill Burke, Alaska Dispatch 09 May, 2010. Are <strong>in</strong>dustry and regulators prepared for an<strong>oil</strong> spill <strong>in</strong> Alaska’s Arctic? http://alaskadispatch.com/dispatches/energy/5274-are<strong>in</strong>dustry-and-regulators-prepared-for-an-<strong>oil</strong>-spill-<strong>in</strong>-alaskas-arctic48 Anthea Pitt, Upstream Onl<strong>in</strong>e, 27 October 2010. No guarantees Macondo won’thappen aga<strong>in</strong>. www.upstreamonl<strong>in</strong>e.com/live/article233796.ece49 BP, 1 September 2010. Deepwater Horizon Conta<strong>in</strong>ment and Response: Harness<strong>in</strong>gCapabilities and Lessons Learned.www.bp.com/liveassets/bp_<strong>in</strong>ternet/globalbp/globalbp_uk_english/<strong>in</strong>cident_response/STAGING/local_assets/downloads_pdfs/Deepwater_Horizon_Conta<strong>in</strong>ment_Response.pdf50 The Gulf of Mexico is home to the most prolific deepwater drill<strong>in</strong>g region <strong>in</strong> the <strong>world</strong>as well as host to the <strong>world</strong>’s greatest concent<strong>ratio</strong>n of ref<strong>in</strong><strong>in</strong>g capacity.51 Peter Overby, National Public Radio, 3 June 2010. BP Sought To Ease Canada’s PolicyOn Relief Wells. www.npr.org/templates/story/story.php?storyId=12738181452 National Energy Board, Canada, Hear<strong>in</strong>g Order MH-1-2010, 22 March 2010.Review of Policy on Same Season Relief Well Capability for Drill<strong>in</strong>g <strong>in</strong> the BeaufortSea. Written Submission of BP Explo<strong>ratio</strong>n Operat<strong>in</strong>g Company Limited. www.nebone.gc.ca/ll-eng/livel<strong>in</strong>k.exe?func=ll&objId=609445&objAction=Open53 Ibid.54 National Energy Board, Canada, 20 September 2010. National Energy Boardannounces details of Arctic Offshore Drill<strong>in</strong>g Review. www.neb-one.gc.ca/clfnsi/rthnb/nwsrls/2010/nwsrls19-eng.html55 National Energy Board, Canada, 20 September 2010. Op. Cit56 Petroleum Economist, September 2010. Focus: Explo<strong>ratio</strong>n and Production.57 Sheila McNulty, F<strong>in</strong>ancial Times, 10 October 2010. Shell offers spill system <strong>in</strong> Alaska.58 The Oil Daily, 8 September 2010. Holders of Leases Offshore Alaska Forced to PlayWait<strong>in</strong>g Game.59 See Table 2 <strong>in</strong> the appendix.60 See appendix for details.61 Arthur D. Little 2010. New bus<strong>in</strong>ess models for the <strong>in</strong>ternational <strong>oil</strong> company <strong>in</strong>Prism 01/2010. Available from www.adl.com follow<strong>in</strong>g free regist<strong>ratio</strong>n.62 Arthur D. Little, 2010. New bus<strong>in</strong>ess models for the <strong>in</strong>ternational <strong>oil</strong> company <strong>in</strong>Prism 01/2010. Available from www.adl.com follow<strong>in</strong>g free regist<strong>ratio</strong>n.63 Arthur D. Little, 2009. Future of Mobility 2020: The Automotive Industry <strong>in</strong>upheaval. Available from www.adl.com follow<strong>in</strong>g free regist<strong>ratio</strong>n.64 John Reed, F<strong>in</strong>ancial Times Special Report: the Future of the Car, 4 October 2010.Mobile phone gene<strong>ratio</strong>n cools on cars.65 www.mu.peugeot.co.uk66 www.streetcar.co.uk67 F<strong>in</strong>ancial Times 2010. Op. Cit.68 For example: Petter Osmundsen, Fank Asche, Bård Misund, Klaus Mohn, February2005. Valuation of International Oil Companies: The RoACE Era. CESifo Work<strong>in</strong>gPaper No. 1412. Institute for Economic Research, Munich, Germany.69 Ibid.70 Personal Communications with former senior <strong>oil</strong> and gas company executive.71 Ibid.1617
APPENDIX:ANALYSIS OFRESERVESADDITIONS FORTHE TOP SIX IOCS2005–09FIGURE 2: RRR OF TOP 25 IOCS 76 1995–2006Percentage300 100% <strong>replacement</strong>Big 5Next 2025020015010050INTRODUCTIONPublically available data on the specific content of company<strong>reserves</strong> additions is opaque and <strong>in</strong>consistent across companies.We searched annual reports and SEC fil<strong>in</strong>gs to ascerta<strong>in</strong> theproportion of marg<strong>in</strong>al <strong>oil</strong> resources 72 <strong>in</strong> the <strong>reserves</strong> additionsof the top six IOCs 73 between 2005 and 2009. In this periodRRR rates have been improv<strong>in</strong>g follow<strong>in</strong>g an extended periodof disappo<strong>in</strong>t<strong>in</strong>g <strong>reserves</strong> <strong>replacement</strong> for the biggest IOCs.(See Figures 2 and 3.)The SEC fil<strong>in</strong>gs, annual reports and f<strong>in</strong>ancial reviews onlyrevealed the role of tar sands additions. Other marg<strong>in</strong>al <strong>oil</strong>resources were not visible <strong>in</strong> the data. Prior to 2010, when newSEC report<strong>in</strong>g rules changed the way tar sands <strong>reserves</strong> arereported, m<strong>in</strong>eable tar sands <strong>reserves</strong> were discernible as theywere reported separately to <strong>oil</strong> and gas <strong>reserves</strong>. However, <strong>in</strong>situ <strong>reserves</strong> were not differentiated from conventional <strong>oil</strong> andgas <strong>reserves</strong>. Data for 2009, reported <strong>in</strong> 2010, fell under thenew SEC rules, which require report<strong>in</strong>g of bitumen and synthetic<strong>oil</strong> accord<strong>in</strong>g to the product delivered to ref<strong>in</strong>eries separatelyfrom conventional crude <strong>oil</strong>. Additionally, some companiesvoluntarily disclosed tar sands resources <strong>in</strong> annual reportsand f<strong>in</strong>ancial reviews prior to 2010 so we have been ableto compile a reasonably accurate picture. 74No <strong>in</strong>formation regard<strong>in</strong>g the role of deepwater andultra-deepwater resources <strong>in</strong> <strong>reserves</strong> additions is available<strong>in</strong> the public data. We were able to discern some <strong>in</strong>formationon this from a Deutsche Bank research report. 75The data presented here is therefore far from complete butdoes re<strong>in</strong>force the fact that IOC <strong>oil</strong> <strong>reserves</strong> additions are<strong>in</strong>creas<strong>in</strong>gly reliant on marg<strong>in</strong>al <strong>oil</strong> resources.The relative exposure of <strong>in</strong>dividual companies to specific groupsof resources can also be roughly gauged from company strategypresentations, examples of which are highlighted below. We hadhowever sought to ascerta<strong>in</strong> the role of marg<strong>in</strong>al <strong>oil</strong> <strong>in</strong> <strong>reserves</strong>additions from recent years <strong>in</strong> order to gauge their importanceto the high RRR rates <strong>in</strong> this period. The lack of <strong>adequate</strong> publicdata available to achieve this assessment highlights theweakness of current disclosure standards <strong>in</strong> enabl<strong>in</strong>g analysisof the relative risks of <strong>reserves</strong> additions.DATAFirstly it is worth look<strong>in</strong>g at the general RRR rates of thecompanies as a group over the past 15 years. Figure 2 showsthat RRR rates were disappo<strong>in</strong>t<strong>in</strong>g for the biggest IOCs fromthe mid-1990s to the mid-2000s, while Figure 3 shows thatrates have generally improved post 2005.Figure 3 shows that all companies except Total kept RRR ratesat 100% or over between 2005 and 2009. However, ouranalysis of the role of tar sands additions throughout this periodsuggests that the companies with the highest RRR rates alsorelied most heavily on tar sands <strong>reserves</strong> additions.01995 1996 1997 1998 1999 2000 2001 2002 2003 2004YearSource: Amy Myers Jaffe & Ronald Soligo, 2007. IOCs: Investment and Industry Structure. James A. Baker III Institute of Policy Studies.FIGURE 3: TOP 6 IOCS RRR 2005–09160140120100RRR806040200ConocoPhillips Shell ExxonMobil ChevronBPCompaniesSource: Company data compiled by the Borealis Centre.2005Total20061819
TAR SANDS RESERVES ADDITIONS 2005–09While companies were required to report on tar sands mi n<strong>in</strong>g<strong>reserves</strong> separately from conventional <strong>oil</strong> and gas (based on USSEC regulations), they were not required to report on m<strong>in</strong><strong>in</strong>gadditions as such, nor were they required to report separatelyon <strong>in</strong> situ <strong>reserves</strong>.Shell voluntarily disclosed figures for tar sands m<strong>in</strong><strong>in</strong>g additionsthroughout the period but the other major IOCs did not.However, tar sands m<strong>in</strong><strong>in</strong>g additions can be approximately 77<strong>in</strong>ferred if a company voluntarily discloses correspond<strong>in</strong>g yearend<strong>reserves</strong> and production figures. This is the case withExxonMobil for example, where we were able to calculate thetar sands additions for each year other than 2005 and to alesser degree for ChevronTexaco (we could only calculate itfor two out of the five years) and ConocoPhillips (three outof the five years).The data <strong>in</strong> Table 2 shows a significant role for tar sands <strong>reserves</strong>additions <strong>in</strong> the <strong>reserves</strong> <strong>replacement</strong> of major IOCs over thepast five years, especially ConocoPhillips, ExxonMobil and Shell.No data was available for BP, probably because its jo<strong>in</strong>t venturewith Husky, the Sunrise Steam Assisted Gravity Dra<strong>in</strong>age(SAGD) Project, which still awaits f<strong>in</strong>al <strong>in</strong>vestment decision,has not booked proven <strong>reserves</strong> yet. As we will see below <strong>in</strong>the analysis of longer term resources, BP stands poised todevelop two more <strong>in</strong> situ projects. It rema<strong>in</strong>s to be seen whetherthese survive the asset sale the company is execut<strong>in</strong>g to payfor the Macondo disaster. So far, these projects have notbeen offered for sale.Exclud<strong>in</strong>g BP, tar sands m<strong>in</strong><strong>in</strong>g additions make up almost 20%of total <strong>reserves</strong> additions and over 42% of liquids additionson average for five of the top IOCs.By extension, while the average Reserves Replacement Ratio(RRR) for these six companies over the period 2005 –2009is 112%, the figure becomes 92% if tar sands additions areexcluded (see Table 3).TABLE 4: GLOBAL DEEPWATER RESERVES AS A PERCENTAGE OF TOTAL 2P RESERVESCompanyPercentageTotal 16.2BP 12.1Chevron 11.1Shell 7.3ExxonMobil 7.2ConocoPhillips 1.6Average 9.25Source: Deutsche Bank Global Markets Research, June 2010. Macondo and the Global Deepwater.TABLE 5: FORECAST GROWTH IN DEEPWATER PRODUCTION 2009–15 EXXONMOBIL AND CHEVRONCompanyDeepwater productionas percentage of total:2009Deepwater productionas percentage of total:2015Compound annualgrowth rate:Deepwater productionCompound annualgrowth rate:Total productionChevron 7.1 17.0 17.8 1.9TABLE 2: ESTIMATED TAR SANDS RESERVES ADDITIONS AS A PERCENTAGEOF RESERVES ADDITIONS 2005–09 78ExxonMobil 10.3 12.7 6.1 2.5Source: Deutsche Bank Global Markets Research, June 2010. Macondo and the Global Deepwater.CompanyAs percentage of total<strong>reserves</strong> additionsAs percentage of total liquids<strong>reserves</strong> additionsConocoPhillips 79 39% 71%ExxonMobil 80 20% 51%Shell 81 16% 34%Total 82 10% 26%Chevron 83 3% 7%BP 0% 0%Average (excl. BP) 84 19.8% 42.6%TABLE 3: RESERVES REPLACEMENT RATIO (RRR) FOR THE PERIOD 2005–2009 85Company RRR RRR exclud<strong>in</strong>g tar sands 86ConocoPhillips 145% 88%ExxonMobil 114% 89%Shell 87 127% 106%Total 85% 76%Chevron 101% 98%BP 100% n/aAverage 88 112% 92%We expect that these calculations may underestimate theseadditions to some extent, as the data is <strong>in</strong>sufficient for somecompanies, particularly Chevron and Total, and it is also unclearwhether <strong>in</strong> situ <strong>reserves</strong> are <strong>in</strong>cluded <strong>in</strong> the figures of some ofthe companies.When we take away tar sands additions from the companies’total RRR, we f<strong>in</strong>d that for all except Shell (and BP obviously)RRR rates fall below 100%.New SEC report<strong>in</strong>g rules should improve the transparency oftar sands <strong>reserves</strong> <strong>in</strong> company report<strong>in</strong>g from 2009 onwards.This is important as the disclosure of longer term <strong>reserves</strong>,known as total resources and discussed further below, showsthat for many of these companies the proportion of tar sands<strong>reserves</strong> that will move from probable to proven <strong>reserves</strong>, andtherefore will be counted as <strong>reserves</strong> <strong>replacement</strong>, is likely togrow substantially over the next ten years.DEEPWATERThe importance of deepwater resources to these companiescannot be gleaned from the publically available <strong>reserves</strong>additions data. We have therefore provided data from a June2010 Deutsche Bank research report. 89The report states that for the major <strong>oil</strong>s, which <strong>in</strong>cludes a widerrange of companies than discussed here, global deepwaterresources account for about 10% of proven and probable<strong>reserves</strong>. 90 Our selection from the data shows that this isroughly the same for the six companies (see Table 4).Another way to discern the role of deepwater resources <strong>in</strong>these companies’ recent activities is to look at forecastproduction growth. Here we present the data for ExxonMobiland Chevron from the Deutsche Bank report.The <strong>in</strong>creas<strong>in</strong>g role of deepwater production <strong>in</strong> Chevron’sportfolio could hardly be clearer. Its growth rate will be some800% greater than the overall growth rate of its production.<strong>in</strong> ExxonMobil’s case it is a more modest 144%.2021
TOTAL RESOURCESAnother way to exam<strong>in</strong>e the role of marg<strong>in</strong>al <strong>oil</strong> <strong>in</strong> the futureproduction of IOCs is to look at their disclosure of totalresources. The term total resources generally refers to all the <strong>oil</strong>and gas a company expects to extract <strong>in</strong> the future from itscurrent resource base. These disclosures are not guided by SECregulations and are <strong>in</strong>consistent between the companies.Nevertheless, their graphic representation does demonstrate thegrow<strong>in</strong>g role of marg<strong>in</strong>al resources <strong>in</strong> the companies’ long termresources. Here we present a selection of graphs from recentcompany presentations with a brief analysis.BP: proved and non-proved <strong>reserves</strong> 2009substantially grow <strong>in</strong> subsequent reports. BP’s concent<strong>ratio</strong>n<strong>in</strong> deepwater production appears strong <strong>in</strong> both sections ofthe graph. BP is also actively explor<strong>in</strong>g for new resources <strong>in</strong>the offshore Arctic.Shell: total resources 2008Heavy <strong>oil</strong> & EORDeepwaterTraditionalLNGSourTight gasGTLsteam-flood<strong>in</strong>g similar to the SAGD method used <strong>in</strong> tar sandsproduction. Chevron also has significant Canadian tar sands andArctic resources.ExxonMobil: resource base 2010ConocoPhillips: total resources by region 2009Source: ConocoPhillips March 2010 analyst meet<strong>in</strong>g, New York. 100Conventional <strong>oil</strong>Heavy <strong>oil</strong>/<strong>oil</strong> sandsDeepwater <strong>oil</strong>0Year End 2009ConocoPhillips’ Canadian tar sands resources, primarily <strong>in</strong> situWater−floodSource: ExxonMobil analysts presentation 2010. resources that will be produced through the SAGD method, areviscous and heavy <strong>oil</strong>its biggest s<strong>in</strong>gle resource. Our analysis of its <strong>reserves</strong> additionsUnconventional gas Source: Shell 2008 Strategy Update. 94The heavy <strong>oil</strong> category <strong>in</strong> ExxonMobil’s graph is very large and <strong>in</strong> the past five years shows that these resources made up 39%Conventional gasShell has one of the highest concent<strong>ratio</strong>ns of Canadian tarprobably represents its Canadian tar sands <strong>reserves</strong>, a lot ofof its total <strong>reserves</strong> additions and a stagger<strong>in</strong>g 71% of its totalLNG gassands <strong>in</strong> its total resources of all six companies. In 2008 it statedwhich is be<strong>in</strong>g developed by its 70% owned Canadian subsidiary, liquids additions, far greater than any of its competitors. Theproduction <strong>in</strong> collabo<strong>ratio</strong>n with Devon Energy follow<strong>in</strong>g dealsSource: Chevron 2010 Upstream Strategy Update. 97Source: BP 2010 Strategy Update. represent 4% of its production by 2011 when its latest tarproduction through to 2019. 101 The company also holds20Unconventional gassands m<strong>in</strong><strong>in</strong>g expansion comes fully on stream. 96 The heavysubstantial resources <strong>in</strong> the Canadian and Alaskan Arctic, someLNGBP conveniently separates proven <strong>reserves</strong> from the rest ofweight<strong>in</strong>g of tar sands resources <strong>in</strong> its unproven <strong>reserves</strong>of which is offshore.that this graph represented 66 billion barrels of <strong>oil</strong> equivalentImperial Oil. ExxonMobil is less concentrated <strong>in</strong> deepwater but second chart here also shows that the company expects to(BBOE) of which 20 billion barrels, 30%, were Canadian tarhas significant resources <strong>in</strong> the Arctic.make a lot more additions from these resources <strong>in</strong> the com<strong>in</strong>gsands. 95 In subsequent publications Shell has claimed that of itsfive years. In its presentation the company shows that it expectsproven <strong>reserves</strong>, only 8.4% is tar sands while the resource willTotal: proved and probable <strong>reserves</strong> growth 2004–09to see a compound annual growth rate of 20% <strong>in</strong> SAGDthe resource base enabl<strong>in</strong>g some <strong>in</strong>sight <strong>in</strong>to the changes <strong>in</strong> itsproduction base that may take place <strong>in</strong> the future. This graphsuggests that at some po<strong>in</strong>t these figures will rise significantly.Shell also has significant deepwater resources andDeep offshoreHeavy <strong>oil</strong>ConocoPhillips: 2010–14 reserve additionsprecedes the Macondo disaster and so does not reflect theis actively explor<strong>in</strong>g for <strong>oil</strong> <strong>in</strong> the offshore Arctic and for <strong>oil</strong> shale10GasCanadaasset sales that BP has had to make as a result.<strong>in</strong> Jordan.LiquidsLower 48North SeaIn the proven <strong>reserves</strong>, ‘water-flood, viscous and heavy <strong>oil</strong>’ is Chevron: total resources 2010Middle Eastthe smallest slice and this reflects BP’s lack of tar sands projectsDeepwaterand Africacurrently produc<strong>in</strong>g or under construction. These proven0Heavy <strong>oil</strong>2004 2009Australia<strong>reserves</strong> are most likely primarily related to equity shares <strong>in</strong>Source: Total 2009 results and outlook.ArcticAsia Pacificheavy <strong>oil</strong> projects <strong>in</strong> Venezuela.AlaskaOil sandsTotal’s report, rather than show<strong>in</strong>g total resources as the othersExplo<strong>ratio</strong>nIn the non-proved <strong>reserves</strong> section this heavy <strong>oil</strong> categorygrows enormously. This reflects the tar sands resources <strong>in</strong> thecompany’s equity share <strong>in</strong> the Sunrise SAGD project, which willmove <strong>in</strong>to the proven category if the project is sanctioned <strong>in</strong> thenext six months. It also reflects resources <strong>in</strong> the Kirby region ofAlberta that BP has held for some time and may be brought <strong>in</strong>toLNGConventionaldo, illustrates the growth <strong>in</strong> proved and probable <strong>reserves</strong>between 2004 and 2009, which gives a reasonable idea of<strong>reserves</strong> addition <strong>in</strong> the period. We can see that while the<strong>reserves</strong> base has grown between 2004 and 2009,conventional liquids have shrunk substantially and deep offshore,heavy <strong>oil</strong> (<strong>in</strong>clud<strong>in</strong>g tar sands) and LNG have grown significantly.Russian CaspianSource: ConocoPhillips March 2010 analyst meet<strong>in</strong>g, New York. 100made earlier this year. 92 Shortly before publish<strong>in</strong>g this graph BPalso acquired a stake <strong>in</strong> Value Creation’s Canadian tar sandsresource. 93 It seems unlikely that these resources are accountedfor <strong>in</strong> the graph. We therefore expect this category toChevron has a very large percentage of its resources <strong>in</strong>deepwater. It also has significant heavy <strong>oil</strong> resourcesconcentrated <strong>in</strong> California, Indonesia and the Partitioned NeutralZone <strong>in</strong> Saudi Arabia. Heavy <strong>oil</strong> is generally produced us<strong>in</strong>gBBOEBBOE8040Unconventional gasLiquefied natural gasAcid/sour gasConventionalDeepwaterArcticCanada SAGDCanada syncrudeAlaskaLower 48AustraliaMiddle Eastand AfricaRussia CaspianNorth SeaAsia PacificCanada ArcticCanada gas2223
ENDNOTES72 Because of their high cost and high risk and their potential vulnerability to globaldemand decl<strong>in</strong>e, we consider marg<strong>in</strong>al <strong>oil</strong> resources to be tar sands and otherunconventional <strong>oil</strong> (ma<strong>in</strong>ly <strong>oil</strong> shale and coal-to-liquids, neither of which are <strong>in</strong>actual production yet so do not figure here), deepwater, ultra-deepwater andoffshore Arctic.73 These are: ExxonMobil, Chevron, Texaco, BP, Royal Dutch Shell, ConocoPhillips,Total SA.74 Reserves additions are not generally broken down <strong>in</strong> the data beyond region.Where companies have not voluntarily disclosed tar sands additions our data iscalculated from the difference between reported tar sands production and<strong>reserves</strong> <strong>in</strong> a given year, which is an approximate calculation as it does notnecessarily factor <strong>in</strong> cost/price effects accord<strong>in</strong>g to SEC rules.75 Deutsche Bank Global Markets Research, June 2010. Macondo and the GlobalDeepwater.76 In this analysis the ‘Big 5’ are ConocoPhillips, ExxonMobil, ChevronTexaco, BP andRoyal Dutch Shell. The big dip <strong>in</strong> 2004 is significantly related to Shell’s <strong>reserves</strong>write down although the overall trend for the ‘big 5’ <strong>in</strong> the period 1999–2005 isclear.77 Reserves <strong>replacement</strong> is normally calculated <strong>in</strong>clud<strong>in</strong>g cost/price effects, but thisis not possible given the limited amount of data disclosed by the companies.Nevertheless, cost/price effects have comparatively little to no effect on fiveyearaverages.78 2005–2009 average and exclud<strong>in</strong>g cost/price effects unless otherwise noted.79 ConocoPhillips <strong>reserves</strong> are primarily <strong>in</strong> situ resources. Figures were primarilydrawn from the company’s 2010 10-K fil<strong>in</strong>g. Based on a sample size of onlythree years <strong>in</strong> the five year period.80 We calculated 22% for tar sands additions 2006–09 exclud<strong>in</strong>g cost/priceeffects, and 20% for ‘heavy <strong>oil</strong>/tar sands’ 2005–09. Here, we present thesmaller of the two values. Figures for the liquids column were primarily drawnfrom the company’s 2010 and 2008 10-K fil<strong>in</strong>gs, and the company’s 2009F<strong>in</strong>ancial & Operat<strong>in</strong>g Review.81 Includ<strong>in</strong>g cost/price effects.82 Based on assum<strong>in</strong>g that the total five year tar sands additions are covered <strong>in</strong> thes<strong>in</strong>gle number reported by Total SA <strong>in</strong> 2009.83 Based on a sample size of only two years <strong>in</strong> the five year period.84 Calculated us<strong>in</strong>g [average annual TS additions] / [average annual total additions].85 Exclud<strong>in</strong>g cost/price effects unless otherwise noted.86 Calculated based on the percentages from Table 2, us<strong>in</strong>g the formula RRR * (1 –[tar sands as a percentage of total <strong>reserves</strong> additions]).87 Includ<strong>in</strong>g cost/price effects.88 Average ‘RRR’ column <strong>in</strong>cludes BP; average of ‘RRR exclud<strong>in</strong>g tar sands’ columnexcludes BP. RRR exclud<strong>in</strong>g tar sands is calculated us<strong>in</strong>g [sum of total additions foreach company] * (1 - 19.5%) / (sum of total production for each company).89 Deutsche Bank Global Markets Research, June 2010. Macondo and the GlobalDeepwater.90 Deutsche Bank, Op. Cit. p18.91 www.bp.com/liveassets/bp_<strong>in</strong>ternet/globalbp/STAGING/global_assets/downloads/I/IC_bp_strategy_presentation_march_2010_slides.pdf92 Devon Energy News Release, 11 March 2010. Devon Energy announces $7.0billion of property sales to BP.www.devonenergy.com/Newsroom/Pages/NewsRelease.aspx?id=140136493 Shaun Polczer, Calgary Herald, 16 March 2010. BP strikes another <strong>oil</strong>sands deal.www.calgaryherald.com/bus<strong>in</strong>ess/strikes+another+<strong>oil</strong>sands+deal/2686881/story.html94 Royal Dutch Shell, 17 March 2008 Strategy Update.www.shell.com/home/content/media/news_and_media_releases/archive/2008/strategy_update_17032008.html95 Ibid.96 Report on Royal Dutch Shell Plc and Oil Sands, March 2010.www.shell.com/home/content/<strong>in</strong>vestor/news_and_library/2010_media_releases/report_<strong>oil</strong>_sands_17032010.html#subtitle_297 http://phx.corporateir.net/ External.File?item=UGFyZW50SUQ9Mzk0MjZ8Q2hpbGRJRD0tMXxUeXBlPTM=&t=198 http://media.corporate-ir.net/media_files/webcast/2010/mar/Exxon/f<strong>in</strong>al.pdf99 www.total.com/MEDIAS/MEDIAS_INFOS/3072/EN/Total-2009-en-resultsoutlook-upstream.pdf?PHPSESSID=634a136e5bb99d88d35a954580b50f3a100 www.conocophillips.com/EN/<strong>in</strong>vestor/presentations_ccalls/Documents/Analyst%20Meet<strong>in</strong>g% 202010%20Slides%20color.pdf101 Op. Cit. p70.November 2011Oil Change International236 Massachusetts Ave NE #203Wash<strong>in</strong>gton, DC20002www.priceof<strong>oil</strong>.org<strong>in</strong>fo@priceof<strong>oil</strong>.org+1-202-518-9029GreenpeaceCanonbury VillasLondonN1 2PNwww.greenpeace.org.uktarsands@uk.greenpeace.org+44 (0)20 7865 8100Platform7 Horselydown LaneLondonSE12LNwww.platformlondon.org+44 (0)20 7403 3738