CropSyst User Manual - sipeaa
CropSyst User Manual - sipeaa
CropSyst User Manual - sipeaa
- No tags were found...

You also want an ePaper? Increase the reach of your titles
YUMPU automatically turns print PDFs into web optimized ePapers that Google loves.
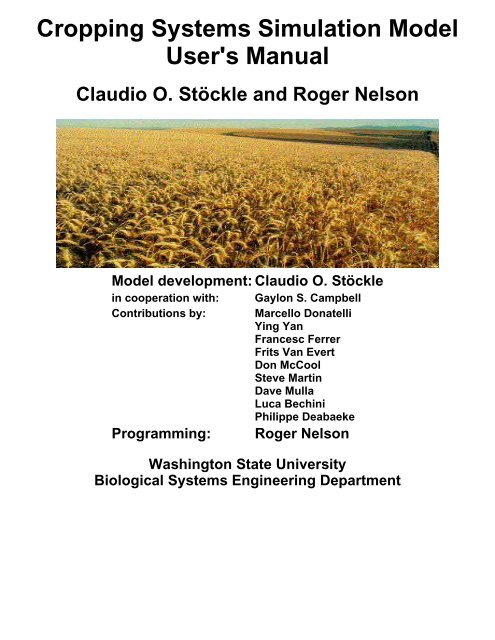
Cropping Systems Simulation Model<strong>User</strong>'s <strong>Manual</strong>Claudio O. Stöckle and Roger NelsonModel development: Claudio O. Stöcklein cooperation with:Contributions by:Programming:Gaylon S. CampbellMarcello DonatelliYing YanFrancesc FerrerFrits Van EvertDon McCoolSteve MartinDave MullaLuca BechiniPhilippe DeabaekeRoger NelsonWashington State UniversityBiological Systems Engineering Department
<strong>CropSyst</strong>●●●AbstractPrefaceParameter editor❍❍Main menu■Simulation menuSimulation control■■■■■■■RotationSoil profileResidueNitrogenRunoffCO 2Validation❍Management■■■■■■HarvestIrrigationClippingNitrogenConservationTillage❍Crop■■■■■ClassificationPlantingGrowthMorphologyPhenology
❍■■■■■■■■Soil■■■■■■VernalizationPhotoperiodHarvestResidueNitrogenSalinityCO 2DormancyLeachingRunoffRUSLEVolatilizationTextureHydraulics❍❍Location■■■■StormsEvapotranspirationFreezing climatesWindWeather files●●●●●Report format editorBatch run editorArc/<strong>CropSyst</strong> CoöperatorWatershed wizardUtilities❍ Graphics viewer❍ Report viewer
●Troubleshooting● Simulation model● What now?● Bibliography
Abstract<strong>CropSyst</strong> is a is a user-friendly, conceptually simple but sound multi-year multi-crop daily time stepsimulation model. The model has been developed to serve as an analytic tool to study the effect ofcropping systems management on productivity and the environment. The model simulates the soil waterbudget, soil-plant nitrogen budget, crop canopy and root growth, dry matter production, yield, residueproduction and decomposition, and erosion. Management options include: cultivar selection, croprotation (including fallow years), irrigation, nitrogen fertilization, tillage operations (over 80 options),and residue management. The model is currently written in Turbo Pascal 6.0 for MS-DOS using anobject oriented programming approach.For more information about this model, comments or help in using the material presented here or thesoftware package, contact Claudio O. Stöckle or Roger L. Nelson at the Biological Systems EngineeringDept., Washington State University, Pullman WA 99164-6120. Phone: (509)335-1578, FAX:(509)335-2722.
PrefaceThis release of <strong>CropSyst</strong> is made available for testing purposes. Although a reasonable amount of model testing has beendone through work with several scientists possessing relevant data, we feel that a period of model use by independent userswill provide us with valuable feedback. <strong>CropSyst</strong> is made available at no cost to you. In return, we would sincerely hopethat you will provide us with any suggestions that you may have on either the technical aspects of the simulation, or theusability of the software package. Our mail and Email addresses, and phone and FAX numbers, are listed in the manualand in the software. If you are utilizing the international language capabilities of <strong>CropSyst</strong>, comments regarding thecorrectness of the translations would be highly appreciated. We will endeavor to provide expeditious replies torecommended modifications to the model or user interface.We are convinced that great progress for both model developers and users can be obtained by working together in specificprojects. To this end, <strong>CropSyst</strong> was designed to function as module which can be integrated with other software packages(such as the Geographic Information System Arc/Info). We we would like to know of your efforts in using <strong>CropSyst</strong> forspecific applications.When using simulation models, it is important to understand how the model represents the physical, chemical, andbiological processes involved in cropping system response to the environment and management. We suggest that you tryexperimenting with different input parameter values to get a feeling for which parameters are sensitive to your specificapplication (whether it be crop production, soil physics or management practices). Discrepancies between observed dataand values estimated by the model can only be corrected by identifying which results are not being satisfactorilyrepresented by the model.As a general rule, if simulation outputs do not seem to conform to the observed data, the technical structure of the modelshould be the last factor to suspect. Discrepancies often result from incorrectly chosen parameter values. Make sure that allyour input data is correct. Watch for typing errors or errors in the units of the parameters. Do not analyze the output interms of the final yield predicted; rather, check the crop growth in terms of phenology, leaf and root development, wateruse, nitrogen use, etc.. These elements should conform to empirical observations; if they don't, check the input parameterswhich are sensitive to your application in order to obtain better representations. Also be very critical of the field data youare using to calibrate or verify the model. It has been our experience that it is not unusual to find errors in tabulating orgraphing data, or reducing raw data to a publishable form. We have encountered a number of situations where <strong>CropSyst</strong>has helped to identify problems with field data. If you find that input parameters need to be assigned unrealistic values toobtain expected results, let us know of your problems.Model validation is a necessary requirement before model application. In addition, to represent cultivar specificcharacteristics, fine tuning of selected crop input parameters via calibration is desirable, provided that suitableexperimental data is available. This is done by adjusting these parameters within a narrow range of fluctuation of typicalvalues given in the users' manual. There is no such thing as a universal model that will work with an unaltered set ofparameters for all conditions: The curious and patient researcher should be able to successfully calibrate the model tospecific species and cultivars and obtain satisfactory results. An individual with less background in crop growth mayexperience more difficulty.We would like to reiterate that we are interested in your comments and in working with you. Let us know of yourproblems and successes with <strong>CropSyst</strong> as we are always interested in improving the model.Claudio StöckleRoger Nelson
This will save the currently edited parameter file. This is similar to pressing thebutton but will save the file without closing the parameter window.Save asThis will first display a file requestor giving the user the opportunity save the file with adifferent name and/or in a different directory.PrintThis will dump the current parameter editor window to the printer.Text editPrint previewThis will dump the current parameter editor window to the printer.UndoAlt+BksSpThis menu provides operations available to edit fields and text editorsused in the parameter editor. These functions are the same as in otherwindows applications.CutCopyPasteShift+DelCtrl+InsShift+InsClear All Ctrl+DelDelete DelWindowThis menu provides operations for arranging windows. These functions are thesame as in other windows applications.CascadeTileArrange IconsClose allSimulation
This menu allows selection of simulation environment options,running simulations, creating batch simulation runs, report formats,and advanced simulation modules.OptionsRun simulationRerun simulationOpen output directoryDefine report formatSelect graph variablesEdit batch fileBatch runClimgenArc <strong>CropSyst</strong> coöperatorParameter filesThese menu operations edit the parameter files:Simulation controlManagementSoilCropSimulation controlManagementSoilCropLocationBatch runHelpLocationBatch runThe help menu provides access to the online <strong>Manual</strong>, the <strong>CropSyst</strong> Wizard and versioninformation in the about option.Note that the DOS version has a completely different menu organization.Simulation directory<strong>CropSyst</strong> places no constraint on the organization of parameter files. Indeed the user may find differentdirectory and files organizations may be suitable for the creation of different simulation scenarios.The directory which contains a simulation control (.SIM) file is referred to as a simulation directory.Generally it is best to create a separate simulation directory for each simulation scenario; however youmay find it convenient to have a single directory for a group of related simulation scenarios.
The simulation will create a subdirectory in the simulation directory containing files output by thesimulation. This subdirectory will have the same name as the simulation control file (without thefilename extension). This subdirectory may also contain some input parameter files for certain <strong>CropSyst</strong>simulation modes (I.e. specific annual management files ).Simulation support filesAdditional input and output files may be associated with a simulation. These files will have the samename as the simulation file but with the following extensions:Extension InputOutput Description.RCL Input Recalibration file.XLH Output Harvest report Excel spreadsheet.XLD Output Daily report Excel spreadsheet.XLY Output Yearly report Excel spreadsheet.XLS Output Soil profile Excel spreadsheet.WKH Output (obsolete)Harvest report Lotus 1-2-3 spreadsheet.WKD Output (obsolete)Daily report Lotus 1-2-3 spreadsheet.WKY Output (obsolete)Yearly report Lotus 1-2-3 spreadsheet.WKS Output (obsolete)Soil profile Lotus 1-2-3 spreadsheet.HRV Output Harvest report text.DLY Output Daily report text.YLY Output Yearly report text.PRF Output Soil profile textSimulation environment preferences initialization fileAn initialization file (CROPSYST.INI) is kept in the simulation directory. The current preferences andmemory of the last modified files worked is updated when a simulation file is saved.When a simulation file is opened, the initialization file is the corresponding simulation directory will beloaded, effectively loading a simulation environment customized for the simulation directory.
Simulation menuOptionsThis dialog box allows selection of the simulation model, and language translation.Simulation modelRun simulationThe 'Run simulation' option allows the user to select a simulation and a report format to run. In the DOSparameter editor, the option is located in the 'File' menu. To run DOS <strong>CropSyst</strong> without generating anyoutput reports, select the [Cancel] button when prompted for the report format.Rerun simulationThe Rerun simulation' option invokes the currently selected simulation model program. The lastsimulation control parameter input file, and the last report format file edited or selected will be used forthe simulation run.In the DOS parameter editor, the option is located in the 'File' menu. Also, if a DOS batch run wascreated, selected or edited with the batch run generator, the batch run will be executed instead.Report formatThe Report format editor option allows the user to develop custom formats for output.Batch editorThe Batch file editor option allows the user to construct a set of simulations to be run in sequence. Bothindividual crop system simulations and advanced simulation modules may be selected.In the DOS parameter editor, the option is located in the 'File' menu.Arc/<strong>CropSyst</strong> CooperatorSimulation output directory<strong>CropSyst</strong> uses Windows Explorer to display the simulation output directory. Most <strong>CropSyst</strong> reports areavailable either as Excel spreadsheet files and some as text files. Normally double clicking on these fileswill open the file using Excel or a text editor.
DOS parameter editorTo run <strong>CropSyst</strong> enter the command CS from the DOS command line. When <strong>CropSyst</strong> is initially started,the title screen is displayed with the menu of operations across the top of the screen.Windowing user interface<strong>CropSyst</strong> uses the Borland Turbo Pascal TurboVision library for windows, pull-down menus, filerequesters and data entry. All options are accessible with the use of either the keyboard or a mouse.Input screens consists of a menu strip, a status line and an area in which input windows are displayed.Windows and Dialog boxes<strong>CropSyst</strong> data entry screens consist of one or more dialog boxes. The input dialog boxes use input fields,list selectors and push buttons to simplify data entry.Input fields, selectors, buttons and boxes are called gadgets. When using a mouse, a gadget is activatedby pressing the left mouse button while the mouse cursor is over the gadget. If no mouse is available, thegadget is activated by pressing the [Tab] or [Shift] [Tab] key until the gadget is highlighted.Text input fields allow the user to enter text strings. The mouse and editing function keys can be used toposition the cursor and insert, delete and edit text in the input field.Numeric input fields allow the user to enter numeric values (integer or float). The value entered will bechecked for range violation warnings or error.Use the [Del] key to clear the value to 0.List selectors allow the user to select an item from a list of options. An option is selected by highlightingthe item using the mouse or cursor keys and pressing the appropriate accept push button.Check boxes and radio buttons are used to select parameter options. Check boxes are used when multipleoptions can be selected, and radio buttons are used when only one option can be selected. An option isselected with the mouse, or by using the cursor keys and pressing [Space] or [Return].Window ManagementUnder <strong>CropSyst</strong>, multiple windows may be displayed on the screen. Generally windows are opened whena menu option is selected. A window may be closed by selecting the [.] box located in the upper leftcorner of the window frame, or by selecting the appropriate close button usually labelled [Close][Accept] [Exit] etc. using the mouse. If a mouse is not used, the window may be closed using the Closeoption in the Windows menu (Pressing [Esc] may also close a window). Windows that don't have the [.]box in the upper left corner can only be closed by selecting the appropriate button in the dialog box.Windows can be moved around the screen by selecting the window with the mouse on the top border ofthe window and dragging it while holding down the left mouse button. If no mouse is available, thewindow can be move by selecting the "Size/Move" Window menu option and the cursor keys.
The user interface allows multiple input windows to be displayed on the screen simultaneously andwindows may cover other windows. When more than one window is on the screen, the top window is theactive one. To make another window active, select it by double clicking on the window with the mouse,or press [F6] or [Shift] [F6] to cycle through the windows displayed on the screen.2.4 HelpThe <strong>CropSyst</strong> help is provided for all input parameters and most menus. To get help on a parameter,highlight the parameter and press [F1]. A window will be displayed on the screen showing the respectivesection of the manual.2.4.1 How to Use <strong>CropSyst</strong> Without a MouseAll active areas on the input screen (input fields, buttons and other gadgets) should be available viakeyboard control. Most active areas in the data entry form window can be reached by pressing the [Tab]key on the keyboard (also [Shift] [Tab]). The [Tab] moves the cursor to the next active area whichbecomes highlighted.For numbers and text input areas, simply enter the number/text using the alpha-numeric keys. These textfields can be edited using the normal text editing functions key ([Insert],[Delete] etc..). For button activeareas, pressing [Space] or [Enter] on a highlighted button will correspond to clicking on the button withthe mouse.A few active areas on the screen have been bound to either a function key or an [Alt] key sequence.These active areas are denoted by having a highlighted character in the input area label (either yellow orred). For example, pressing [Alt][F] will activate the File menu, [Alt][S] will activate the Soil menu.Main MenuA menu strip is displayed across the top of the screen. Menu and submenu options may be selected withthe mouse, or by pressing the [Alt] key followed by the highlighted character in the menu option.Additional functions displayed in the status line at the bottom of the screen are often available bypressing the respective function key or key sequence or by selection with the mouse.Several menu options can be activated directly from the keyboard. The menu option will show what keysequence can be pressed to activate the option. Additional operations which can be activated from thekeyboard may be displayed in the status line.The main menu gives the following options:● File● Window● Control● Management● Soil● Crop
●LocationThe remaining main menu options: Control, Management, Soil, Crop, and Location, allow the user tocreate and edit the database of crops, soils, locations and management practices.Viewing outputOutput from <strong>CropSyst</strong> can be viewed, or printed in report form using the View report' menu option. Reports generated by <strong>CropSyst</strong> can also be imported into databases and spreadsheets.Output may also be viewed with the included graphing utility accessed via the Graph report' menuoption.The Window main menu option provides facilites for moving <strong>CropSyst</strong> parameter windows if thecomputer has no mouse.
Simulation parameter editorSimulation files contain information allowing the user to build simulation conditions from a database ofexisting location, soil, crop, and management files. Simulation files also contain information regardingthe period of simulation and initial values for model variables that require initialization.Simulation files are created and modified using the simulation control parameter editor. This editorallows the user to combine component parameter files (e.g., location, soils, crops, management) to buildthe simulation run and to edit initialization parameters.Simulation control parameter windowThe primary elements to build a simulation control file consist of the period of the simulation (startingand ending dates), and specification of soil, location, crop rotation and management practices.Component files are selected by pressing the filename button and using the file requestor to choose therespective files. The [Edit] buttons next to the filename button will allow the currently selected file to be
edited.Simulation descriptionA description of the simulation (limited to 80 characters in the DOS version) may be entered in theinput field at the top of the dialog box. This description will be printed at the top the reports whenthe report header option is selected in the report format . The description will also be used tocompose simulation labels when using the Arc/<strong>CropSyst</strong> Coöperator or the Rural Watershedmodelling modules.Simulation periodThe starting and ending dates specify the period of the simulation. The simulation starts and stopson these dates. Therefore:1. The starting date must be less than the ending date.2. The starting date should be before the anticipated planting date of the crop.3. The ending date should be after any anticipated harvest date.The year must have four digits, and the day of the month (DOM) must be a valid date for theselected month (<strong>CropSyst</strong> does handle leap year). To select the month, activate the date buttonusing the mouse (or press return when the date button is highlighted). A date requester is displayedwhere the year, month and DOM may be selected.In previous version of <strong>CropSyst</strong> detail lines in the annual report were produced on January first,so inorder to output all years, it was often necessary to select January 1 of an additional year toget a complete annual report . This is no longer the case, annual report detail lines are nowproduced on December 31.Soil and location filesThese files are selected from a database of previously created soil and location files.The user must select a soil and a location in order to run the simulation.Simulation optionsThe following simulation options may be selected for the simulation run. Some of the options areselected under the corresponding tab.
Infiltration modelThere are currently two infiltration models water transport. Cascading method is a simpletransport model which only moves water downward. The finite difference method is moredetailed and can transport both up and down. Using the finite diffence method oftenincreases the simulation time. With the finite difference model, additional options areavailable for the numerical runoff model as well as simulation at 30 precipitation intervalsand storms.Runtime graphIt may be desirable to disable the runtime graphic display when running <strong>CropSyst</strong> in anon-interactive mode, or for running under some other application, or for long simulationperiods (the simulation can run significantly faster without the display).Note that some of the <strong>CropSyst</strong> simulation modules will always disable the runtime graphicsin order to allow the intensive simulations to run as fast as possible.Salinity simulationThe user can selection the simulation of salinity. When enabled, both salt movement andsalinity effects on crop growth are enabled.Nitrogen simulationWhen nitrogen is turned off, the nitrogen components of are totally deactivated: nitrogencrop limitations are disabled, nitrogen application events are not used, and all nitrogenoutput reports and variables will have null values.Erosion simulationWhen enabled, erosion is simulated using the Revised Universal Soil Loss Equation . Whenerosion is turned off, the erosion model is completely deactivated. All erosion outputvariables will have null values.Note that soil erosion is an annual computation, and erosion output is available only in theannual report.Remove eroded soilThis option will removed the computed soil erosion from the soil profile. Because erosion isonly computed annually, you will observed a reduction in the soil profile only on January1st.
Chemical simulationWhen enabled, chemical fate (such as pesticides) is simulated. This does not includenitrogenValidating the simulationThe [Validation] button will perform a validation check of the parameters in the parameter filesselected for the simulation. These will be output to a text file that will be displayed in a window.Running the simulationThe [Simulation] button will run the simulation using the currently editted simulation file. Theparameters will be saved before the simulation is run, so it is not necessary to use the File/Savemenu or close the simulation before pressing the running the [Simulation] button.Initial valuesInitial values and parameters for optional submodel specific to each simulation are entered on thedialog box page under the corresponding tab. They are:Soil profileThe initial soil profile always needs to be set. Nitrogen, organic matter and salinity may beignored if not running those simulation submodels.RotationA rotation will be need if you intend to run <strong>CropSyst</strong> with any cropping system. Therotation can be omitted to simulate fallow conditions. If you want to run fallow conditionswith management events, you can create the optional Annual management with specificevents and/or a corresponding simulation management fileResidueIt is often the case that there will be some biomass residue at the time the simulation starts.A existing residue pool can be created by enter the residue parameters. If no exisitingresidue pool is to be created, enter 0.0 for the residue biomass parameters.NitrogenWhen nitrogen simulation is enabled nitrogen transformation rates can be adjusted for localconditions. These parameters may be omitted when nitrogen simulation is not enabled.Remember to enter intial nitrogen contents on the soil profile page when nitrogen simulationis enabled.CO 2The long term atmospheric Carbon Dioxide concentration simulation is a special global
atmospheric change simulation scenario.ProjectsThese are special simulation generation and analysis methods.Additional simulation specific parameter filesFor some special simulation situations, it may be convenient to reset some select state variables.To accomoplish this, a recalibration file can be created. This file should be placed in the samedirectory as the simulation file and must have the same filename with the extension .RCL.The file may consist of records of the following format:year doy keyword amount1 ... amountn Year and DOY is the date (Day Of Year) the recalibrationis to occur. This may often be the date of a field data measurement. The year may be 0 indicatingthat the recalibration values are to be used every year on the specified day. amount1...amountn arethe values to be used in the first n soil layers.The following variables can be recalibrated:WT - Water table depth (m)The recalibration file with water table entries will be used by the finite difference infiltrationmodel to implement water table boundary conditions. In the case of WT, only one value isprovided for the depth.The water table is not used by the Cascade infiltration model and will be ignored when thesimulation is run with the Cascade infiltration mode .WC - Water content (m³/m³)Occasionally, for certain abnormal soil conditions, <strong>CropSyst</strong> may not be able to simulatecertain physical phenomena such as water tables that rise into the root zone, or very deapmud cracks causing deeper evaporation, etc.. This water content can be reset to measuredvalues. This could also be used to specify periods of inundation or the effects of unnaturalphenomena outside the scope of <strong>CropSyst</strong>.SNOW - Snow depth (m )add the new SNOW depth in snow pack depth <strong>CropSyst</strong> current converts this to meltedliquid water equivelent by dividing this depth by 5.You need not include dates for 0 depths, 0 depth will be used for dates with no specifieddepth.
NH4 - Ammonium (kg N/ha initial N)Not yet implementedNO3 - Nitrate (kg N/ha initial N)Not yet implemented%OM - Percent organic matter ( 0-10 in a scale of 0-100)Not yet implementedAuxillary parametersIn addition to the parameters that can be edited with the parameter editor. There are a fewadditional parameters that may be useful in certain simulation situations. These parameters can bemodified using a text editor.Hydrologic curve number overrideIDIn the soil file, under the section [soil], the entry: hydrologic_curve_number=99 If specified(a value between 1 and 100) will override any curve number selection based on crop type,land treatment, hydrologic condition and hydrologic curve.This parameter is often used in simulating soil conditions (usually outside the United States)where experience has shown that the curve number look up tables are not useful for the soiltype.This is used by simulation modules to identify GIS polygons or cells.
Runoff models<strong>CropSyst</strong> provides three options for determining runoff.● No runoff simulation●●SCS curve number methodNumerical solutionNo runoff simulationIn this mode, <strong>CropSyst</strong> will try to infiltrate all non intercepted precipitation and irrigation.SCS curve number methodRunoff will be determined as a function of current soil moisture content, static soil conditions, andmanagement practices.Runoff is deducted from the water available to enter the soil prior to infiltration.This method requires selection of land management practices and soil hydrologic characteristicsand management, crop and soil parameter files:❍ Land treatment in the management file (xxx is assumed default in fallow conditions).❍ Land use in the crop file.❍ Hydrologic group and hydrologic condition in the soil file.Numerical solutionThis method is available only with the Finite Difference infiltration model.Runoff will be determined as a result of the Finite Difference infiltration model and is deductedafter infiltration. The numerical solution method requires the soil surface storage parameter to bespecified in the corresponding soil file.
Soil profile initialization<strong>CropSyst</strong> requires only minimal initialization parameters to provide initial soil water, nitrogen, andorganic matter profiles.Simulation initialization parameter windowSoil water profile initializationThe initial water content of each soil layer at the beginning of the simulation is specified here.This value is expressed in m3 water/m3 soil as shown in the Soil profile initialization parameterstable.Information Source:■ Experimental data■ Local experience.
Uses:■■■■■■■■Thermal conductivity in soil layers .Soil air volume.Soil ice content.Soil water potential.Leaf water potential (equation 14.8 ).Soil water loss and water content.Automatic irrigationPlant available water (PAW) .Soil nitrogen and organic matter profileinitializationThe initial nitrogen content, in the form of nitrate and ammonium, and the organic matter contentof each soil layer at the beginning of the simulation is specified here. These values are parametersare used only when nitrogen simulation is enabled.Soil profile initializationparameters.Parameter UnitsVolumetric water content m³/m³Nitrate content kg N/haAmmonium content kg N/haOrganic matter (0-100)%
Crop and management rotation table<strong>CropSyst</strong> incorporates a new versatile crop rotation table which allows simulation of multiple year croprotations.Simulation rotation windowEntering a crop in the rotation1.2.3.Click on the [Planting] date button and select the year, month and day of planting. For computedplanting date crops, this date specifies the date to start looking for good planting conditions.Click on the [Crop] button and select the crop file to be planted. The [Edit] button can be used toedit the currently selected crop file.Click on the [Management] button and select the management file to be used with the crop. The[Edit] button can be used to edit the currently management crop file. Click on [
4.Click on [Insert] to enter the selected planting date/crop/management (displayed in the line belowthe rotation table) into the rotation table. The table is sorted by planting date. If the word 'crop' isdisplayed in an entry, then the entry should be deleted, and a new entry with a crop and(optionally) a management selection must be made.Deleting an entry in the rotation1.2.Click on one or more entries in the table to be removed. The scroll bar on the left side of the tablecan be used to view long tables.Click on the [Delete] button.Two crops with the same planting date cannot appear in the table simultaneously.Repeating a rotation for the simulation period1.2.3.4.5.Make sure the simulation run starting and ending dates are set for the correct period.Enter the number of years in the rotation.In the DOS version, the years in the rotation is specified after pressing the [Build] button.Create entries for the first rotation cycle. Highlight the entries to be repeated These entries will beused as the template for the remainder of the simulation period.In the DOS version, multiple entries cannot be selected. Make sure that there are only theentries to be repeated in the rotation list.Click on the [Build] button.The table will be filled in using the template entries. Fallow periods specified by skipping yearnumbers in table entries will be preserved.Additional notes about fallow periodsIf the simulation is to be run on fallow conditions only, the rotation table can be left blank.Since <strong>CropSyst</strong> runs fallow conditions between harvest and the planting of the next crop, one or moreyears of fallow growth can be accounted for in the rotation by simply skipping years when enteringplanting dates and/or increasing the number of years in the rotation.If you need to run fallow with some management operations, Click on the [Fallow] button to clear thecrop entry to fallow and select the management file.Additional notes about management filesSome times it is desirable to perform management operations irregardless of the crop specified or inaddition to the scheduled managements. In order to perform this type of operation, create a subdirectoryin the same directory as the simulation file with the same name as the simulation file (Without the .SIM
extension). Create the management file having the same name as the year the management events are tooccur in. <strong>CropSyst</strong> will load management files in this subdirectory when the corresponding year comes topass.
Residue initializationThe user should provide initial residue cover conditions for the simulation of residue decomposition ofresidues that may be existing at the time of the start of the simulation.Surface residue (kg/m²)Simulation residue windowrefers to the amount of initial surface residue matter on the ground.Incorporated residue (kg/m²)refers to the amount of initial plant residue incorporated into the first 5 to 8 centimeters of soil.
Residue water content (m³/kg)refers to the amount of water initially stored in the residue matter on the ground.Residue decomposition time constant (1-300 days)The approximate number of days required for the residue to decompose 63% of the initial residuemass under ideal moisture and temperature conditions.Information source:❍ Field study data.❍ Output from another simulation run (<strong>CropSyst</strong> or another) such as the residue conditions onthe last day of the simulation run.❍ Some residue decompostion time coefficients are given in the crop residue constants table .❍ Any reasonable values may be used when actual data is not known.Usage:The residue values are used to create a residue pool which is maintained throughout the simulationuntil fully decomposed. The residue pool (as well as residue pools create as a result ofmanagement, harvest events and crop failure) affects the following:❍ water storage and infiltration.❍ potential soil evaporation .❍ potential residue evaporation .❍ soil residue incorporation .❍ residue decomposition .❍ runoff .Residue initialization parameters.Parameter Usual range UnitsSurface residue 0.0-1.5 kg/m²Shallow residue 0.0-0.1 kg/m²Residue water content 0.0-0.004 m³/kgResidue decomp. coef. 1-300 days
Nitrogen simulation optionsConstant organic matterWhen this option is selected, organic matter is reset to initial soil profile values at the beginning of eachyear.The initial organic constant is the same year after year of a long sequence of simulation years. Organicmatter does change daily during the year. Thus, organic matter does not significantly build up or getreduced with time (in the long runs).This option would be used for situations where a large number of simulations with different weather filesare wanted using the same initial conditions.This is useful to determine the probability (risk) of obtaining given simulation results for a specifiedmanagement scenario under a variety of possible weather conditions, but under a constant (today's) soilcondition.
This is different than long term scenarios where we simulate change as a function of time for a period of30 or more years. In this case we allow organic matter to continuously fluctuate as estimated by themodel throughout the simulation period.
Atmospheric CO 2This checkbox enables atmospheric CO 2 modelling.Initial CO 2 concentrationdescription needed parts per million (ppm)Annual rate of CO 2 concentration increasedescription needed
Additional requirementsIn order for CO 2 modelling to show the crop response to increasing CO 2 levels, CO 2 parameters inthe corresponding crop files should to be specified.You will also need use a long simulation period (on the order or 30 years) to observe the long timeresults.
ValidationParameters for a simulation may be validated either by clicking of the [Validation] button in thesimulation control screen of the parameter editor.Input parameters will be checked to insure that they either fall within valid ranges, or are otherwisereasonable. In addition to range validation, the following errors and warnings will be checked:● Simulation control and initialization❍ Weather files are checked for valid format.❍ Initial water contents must be provided for all soil layers present in the soil profile.● Management❍ A number of days after maturity for harvest must be provided.● Crop parameters❍ Growing degree days at maturity must not equal growing degree days at emergence.❍ Growing degree days must be in assending order: Emergence, Flowering, Grain filling,Senescence, Maturity.❍ Soil horizon sublayer division must not exceed memory limitation imposed by MS-DOS.● Soil parameters❍ 0 < PWP < Init WC < FC❍ FC < 1 - BulkDensity/2.65. If false, then decrease FC or bulk density.❍ Value must be given for all residue parameters (both in the crop and simulationinitialization).❍ The combination of soil hydrologic group and condition and the crop land use and treatmentmust exist in the runoff curve number table of the USDA/SCS National EngineeringHandbook ( USDA-SCS, 1988a ).
Running <strong>CropSyst</strong> from the DOS command lineIn addition to running <strong>CropSyst</strong> from the Windows parameter editor, there are several options forrunning <strong>CropSyst</strong> from the DOS command shell. This may be useful for creating batch runs: forexample, to create new simulation models that use <strong>CropSyst</strong> to prepare data for further analysis.From the DOS command line, <strong>CropSyst</strong> may be run in either an interactive or non-interactive mode. Inthe interactive mode, <strong>CropSyst</strong> will prompt for the name of the simulation parameter file and, if theruntime graphics are selected in the parameter file, the user may select the graphs to be displayed as thesimulation runs. In the non-interactive mode, the user supplies the names of the simulation parameter fileand the report format file on the command line, i.e. the command line:CROPSYST PARAMA.SIM REPORTQ.FMT NOGRAPHThis will run <strong>CropSyst</strong> using parameter file PARAMA.SIM and generate output files as specified in thefile REPORTQ.FMT.NOGRAPH is an optional keyword that will disable any runtime graphic option selected in thesimulation control file allowing <strong>CropSyst</strong> to run in the faster text only mode.The DOS <strong>CropSyst</strong> has several runtime display options:1. Runtime graphic display (Color EGA or VGA monitor recommended)2. Text display showing date, crop and growth stage and some harvest totals.3. Text display which also shows the daily soil profileThe runtime display can be changed with the simulation is running by pressing [Return].Runtime soil profile text displayThe soil profile text display shows daily values for key variables by soil horizon sublayers.During the growing season, a bar is displayed next to the soil depth column which represents therespective root depth for the day.To accomodate soil profiles with many sublayers, the screen will be placed in 80x50 (VGA) or 80x43(EGA) text display mode if supported by your video graphics card.Runtime graphic displayThe runtime graphics display will graph specified daily computed variables. The graphs displayed hereare intended to be used only for general evaluation of the simulation run. Daily variables may be selectedfor output to a file in a format suitable for importation to a spreadsheet or charting program using thereport generator.While the simulation is running, the graphed variables can be turned on or off by pressing the respectivekeys on the keyboard as shown on the screen. A check mark indicates the active graphs. The followingkeys are also active during the simulation run:
Return Toggle the graphics display on/off.Esc Abort the simulation run and exit the program.Pause Pause the simulation display.Space Pause the simulation run.While the simulation is paused, graphs may be toggled on/off.The current graph selections are saved and automatically loaded the next time the simulation is run.The graphed variables are displayed on three viewport graphs on the screen: one for atmosphericconditions, one for biophysics, and a special graph showing plant available water distribution throughoutthe soil layer. Each pixel along the horizontal axis marks a daily time step. Between the atmospheric andcrop status graphs is a bar with alternating shades of gray indicating the months of the year. The start ofphenologic growth stages will be marked in the month bar with colored vertical lines that will appear inthe following order:● [P] Planting● [E] Emergence● [F] Flowering● [S] Senescence● [M] MaturityAtmospheric conditions graphThe atmospheric conditions graph is located at the top of the screen.● Average daily temperature● Actual evapotranspiration● Potential evapotranspiration● Precipitation● Runoff● Actual transpiration● Potential transpirationThe legend for the atmospheric conditions graph is located in the upper right corner of the screen. Thelegend shows the key to be pressed to toggle the graph display on/off, the name of the variable, and thescale of the variable. The scale of a variable is not adjusted to that of the other variables in the graph,however similar variables are scaled the same (potential and actual evapotranspiration, for example).Crop status graphThe status graph is located in the center of the screen.● Plant height● Biomass● Leaf area index
●●●●●●Green area indexTotal stressNitrogen stressLight stressWater stressTemperature stressThe legend for the crop status graph is located in the lower right hand corner of the screen.Plant Available Water graphThe plant available water graph is a novel way of presenting information on the water content of the soil.A horizontal bar is displayed for each layer of the soil with respect to the thickness of the soil layer Forinternal computation processes, soil layers which are greater than 10 cm are subdivided into sublayerswhich are less than or equal to 10 cm. These sublayers will be displayed in the graph. and in graduatedcolor scale. White horizontal lines delineate 10cm intervals. The scale is located above the crop statusgraph legend. The soil layers are displayed from top to bottom, with the top layer being the layer ofevaporation. Under typical climatic conditions the evaporative layer will vary dramatically in color,where as the other soil layers will tend to dry out gradually during the growing season, and graduallyrecharge between cropping cycles.Plant Available Nitrogen graphThe plant available nitrogen graph is similar to the plant available water graph; it shows the relativequantity of nitrogen (both in the form of ammonium and nitrate).As with the water graph, a horizontal bar is displayed for each layer of the soil with respect to thethickness of the soil layer. White horizontal lines delineate 10cm intervals.Only one soil profile graph can be displayed at a time. To switch between drawing the water and thenitrogen graph, press the next letter greater than the last letter displayed in the crop status graph (Q).Under typical conditions, the amount of nitrogen will decrease as the plant grows, and will increase asorganic matter in the soil profile denatures. Nitrogen will also gradually move into deeper soil layers aswater from rain and irrigation flushed through the soil profile.Growth stageFor each day, the date, the crop rotation, the growing degree days, the current crop name, and the growthstage are displayed at the right side of the screen. During fallow periods, the crop name is replaced by a(-) marker. Fallow periods may either be Post-Harvest' or Preplanting'. Preplanting fallow indicates thatthe simulation is ready to plant a crop, but is waiting for adequate planting conditions. (Crop computedplanting day mode forecasts the weather for the next five days.)Harvest totalsOn harvest dates, the year of the harvest, the crop name, the yield, the biomass at harvest, soil leaching
and erosion are displayed on the right side of the screen. Only the last seven years remain on the screen.These values are all recorded in yearly and/or harvest output files in a format suitable for importationinto a spreadsheet or graph program.32 bit console modeA 32bit console mode version of <strong>CropSyst</strong> may also be provided in the <strong>CropSyst</strong> Suite distribution. Thisis the same version as the 16bit version but compiled using Delphi as a Windows or Windows NTconsole mode application. This version does not provide run time graphics or soil profile display modes,only the simple text with harvest summary mode. Since the program is a 32bit mode with the slowerdisplay modes removed, this version of the simulation can run much faster than the 16bit version.This program can be run in and DOS mode window using the following command lineCS_D_32 PARAMA.SIM REPORTQ.FMTYou can also select the CS_D_32.EXE program as the default simulation model to be run by theWindows <strong>CropSyst</strong> parameter editor by selecting the program in the Simulation/Options menu.CaveatsNote that the CROPSYST.EXE and CS_D_32.EXE versions of <strong>CropSyst</strong> written in Pascal/Delphi are nolonger being maintained with the new features which are being added to the new C++ version of themodel and may produce slightly different results.
Management parameter editor<strong>CropSyst</strong> provides facilities for specifying the following management practices: tillage, residue,irrigation, nitrogen, clipping and soil conservation. The user may specify automatic and/or specificmanagement events.The management entry forms consist of several sections for each type of management.HarvestIrrigationNitrogenClippingConservationTillageActual calendar date, relative date or phenologicsynchronizationA number of management events or automatic selections allow date scheduling to be specified withactual dates, relative dates, or dates computed by the model with respect to phenologic stage of plantdevelopment. (the last option is available in most, but not all options)For actual dates, enter the year and day the event is to occur. Actual events are applied only once duringthe simulation. Actual dates are used when running <strong>CropSyst</strong> to compare against actual field experimentsor real data.In relative date mode, the year value corresponds to the year relative to planting. The relative year isadded to the crop planting year to derive the actual date the event is to occur. Since the relative year isadded to the planting date year to derive the actual year, use a value of 0 for the relative year to indicatethe day is in the same year as the planting date, -1 etc. to indicate the year(s) before planting and 1 ect. toindicate years after planting. Relative dates are often used when running crop and management rotationsthat are repeated.For dates computed relative to plant development mile stones; the user can specify the number of daysbefore planting , after planting, after emergence, after flowering, after the start of senescence, after thepoint of maturity, or after harvest. This mode is usually used when running <strong>CropSyst</strong> for predictionscenarios.Note that for relative dates or days before the planting date, the date refers to the expected date ofplanting, not the actual date if the planting date is computed or postponed by <strong>CropSyst</strong>.
Automatic managementWith automatic management, the simulation will apply management practices whenever appropriate(based on the current conditions). Automatic management options should be used when the user is notconcerned with the effects of management on the simulation run, but still wants reasonable managementpractices to be applied; or, if the user wishes <strong>CropSyst</strong> to apply water or nitrogen.Specific managementIn addition to or in lieu of automatic management, the user may create tables of specific managementevents. The specific events tables allows the user to create a customized event schedule of irrigation,tillage, fertilization, clipping and residue stubble management practices.To add a new event, click on the button corresponding to the event to be added. A dialog will open inwhich the user may specify when the event is to be applied. Additional windows may be presentedallowing the user to choose the specific operation to be performed and any additional parameters for theoperation. The management event schedule table is then updated with these practice parameters.
To delete an entry in the table, select the entry to be removed and click on the [Delete] button.To edit an entry, double click on the entry. A date/phenologic syncronization button is provided in eachof the event parameter editors to allow the date to be changed.Annual managementManagement events with specific dates are loaded when the simulation starts. In some simulationscenarios such as daily center pivot irrigation, there may be dozens or hundereds of dated events. If thesimulation rotation runs for many years, all these events can slow down the program which continuouslyscans the event lists for the next event to process. In the DOS version of the program all these events canpossibly exceed the memory capacity. Additionally, the large event files can be difficult to keeporganized. To help eliviate these problems, the specific management events can be stored in separatefiles organized by year.● create a subdirectory in the same directory as the simulation the mangement file will be used in,having the same name as the simulation file, without the extension.● Put the separate management files in this directory.● Name these management files will the year the specific managements event occur in. (I.e.1999.MGT).● <strong>CropSyst</strong> will load these management events in these files when the simulation reaches each year.Note that only the specific management events with actual dates will be loaded in the manner, all otherparameters (I.e. automatic management) are ignored. Some <strong>CropSyst</strong> scenario building utilities createthese management files. (I.e. the center pivot irrigation optimizer).These annual managements are loaded in addition to any other specific management events that may beapplied with the crop in a rotation; so this is also a convenient way to supplement relative dated events ina repeated rotation with events specific for certain years.
Harvest managementNumber of days to wait for harvest afterphysiological maturityThe user may specify the number of days after physiological maturity that the crop will beharvested.Latest date to harvestUnder certain conditions, particularly with perennial crops, a crop might not achieve thermal timeto reach full maturity which triggers harvest. This date will force the crop to be harvested on thisdate if not already done.The year of the date specifies the year of the crop. For (spring) crops that complete between
January and December the year will usually be 0. For crops that grow past December, and harvestin the following year, the harvest date year will be 1. For perennial crops, this can be used toperform a final harvest at the end of the growing season, before leaf drop.Fraction (percentage) of straw remaining afterharvestThis is the portion of non-grain or non-harvested biomass that is to remain in the field afterharvest.This biomass will later be incorporated into the soil by tillage operations etc..Note that this used to be a crop parameter "Fraction of non-grain biomass -> surface residue(0-1)"These harvest parameters are not used by perennial crops.
IrrigationAutomatic irrigationThe Automatic irrigation check box enables automatic irrigation.Automatic irrigation will apply sufficient water to bring the water content of the soil to a levelsuch that the plant available water (PAW) is refilled to the specified amount (usually around100%) whenever the plant available water falls below a specified amount (usually around 40%) .Currently, the water is applied directly to the soil. It does not affect canopy or residue storage orrunoff or ponding.The user must specify the 'Minimum allowable plant available water' before irrigation is triggered,and the plant available water refill point (expressed as decimal numbers between 0 and 1). Theminimum PAW must be less than the refill PAW. The minimum PAW does not need to be
specified if automatic irrigation is not used, however the refill PAW may be used in a special caseof specified irrigation events and should always be specified if irrigation events are used.The automatic irrigation during fallow periods option allows the simulation to irrigation evenwhen to crop is growing. The default behaviour is to irrigate only during the growing season.Maximum allowable depletionThis is the plant available water computed to the depletion observation depth that willtrigger an irrigation event.Depletion observation depthThis is the depth to which the plant available water will be computed for the depletionconstraint.Net irrigation multiplierThis value will be multiplied by the irrigation amount determined. A non-zero value can canbe used to specify the efficiency.Maximum irrigation applicationThis will limit the actual irrigation that can be applied. This can be used to simulate thephysical mechanical hydraulic limitations of the irrigation equipment.Irritation period (starting and ending dates)This is the period to limit the irrigation to. Actual or relative dates or plant developmenttimes can be used to specify the irrigation period.In the case of perennial crops, the year part of the date is used to limit the years irrigationoccurs. The month/day is used to indicate the day in each year irrigation starts and stopsrespectively.Specific irrigation eventsFor an irrigation event, the user supplies an amount of water (in millimeters) that is to be applied.If a value of zero is entered, the simulation will determine the amount of water that would rechargethe soil to the refill PAW point .The specific irrigation events which have selected "Use general automatic irrigation constraints"option will use the parameters specified on this screen to determine the amount of irrigation toapply.
Automatic Clipping/Trimming/PruningmanagementAutomatic clipping is used to allow the simulation to determine when and how much biomass tobe removed from the crop.Events specified in the clipping events table are not affected by any of the automatic clippingmodes. Any specific clipping events will always be processed.Three options are available for automatic clipping simulation.Disabled (default)This option disables automatic clipping.
Based on biomassIn this mode, clipping events will be performed when the biomass reaches the specifiedlevel. This mode is usually used for perennial crops such as alfalfa. A clipping event willoccur if either of the following conditions are met:■ If the current crop biomass reached the maximum biomass that forces clipping, thecrop will always be harvested.■ The simulation will count the number of days of consecutive low growth. If at anytime the crop resumes normal growth, this counter is reset. Low Green Area Index(GAI) growth is characterized by the following condition:■ The daily GAI < low GAI rate * Clipping relative growth rate adjustment■If the count of consecutive days of low growth reachs 14 days, the crop will beharvested.An additional special case will force clipping to occur if the crop has not reached thespecified biomass but it is the end of the growing season. This case applies toperennial crops such as alfalfa.The following parameters are required for this option:Clipping relative growth rate adjustment (0-2)This parameter is used to adjust what is considered a low green area index growth rate(start of with a value of 1). Increasing this number will increase clipping frequency.Minimum biomass required for clipping (kg/ha)This specifies the amount of biomass that must be produced before clipping willoccur (in normal growing conditions).Maximum biomass that forces clipping (kg/ha)This specifies the amount of biomass that will always trigger a clipping event.Percent biomass to remove (0-100%)This is the amount of biomass to remove. See clipping fate to specify what to do withthe clipped biomass.Latest date to clipFor perenial crops, towards the end of the growing season, biomass and leaf/greenarea production diminishes and might not reach a levels sufficient to trigger a clippingevent; however, farmers will typically perform one last harvest of available material
Periodicbefore the onset of dormancy and leaf drop. This date is used to simulate this specialcase. This event will occur only if the minimum amount of biomass required to ciphas been reached.In this option, clipping will be performed with a specified interval.The percentage of biomass to remove is specified by the user as a harvest index cropparameter.This mode is usually used for perennial crops such as tea.A clipping event will occur if the following conditions are met:■ The perennial crop will count the number of days since the last clipping event.Clipping will not be performed until this count reaches the clipping frequency days.■ The LAI must be is greater than the minimum LAI required for clipping.■ The current date is within the clipping period .The following parameters are required for this option:Frequency (days)This is the number of days this simulation should wait after a clipping event beforethe next clipping event can occur.Minimum LAI required for clippingDuring early growth (I.e. after a crop is planted or after any period of dormancy,leaf-drop or die-off) the simulation will allow the crop to reach this specified leaf areaindex before clipping will be started.Clipping periodA limit of the period of the year where clipping events will be possible may bespecified. This can be used to indicate a harvesting season.If the ending date is a month prior to the starting date, <strong>CropSyst</strong> will take the periodas a growing season for the southern hemisphere.Use January 1, and December 31 to allow clipping to occur uninterrupted.
Clipping fateFor either the Based on biomass and the Periodic clipping modes, the following options areavailable for disposing of the clipped biomass:RemoveThis removes the clipped biomass from the system. These clipping events will only bereported in the schedule output file; however biomass reduction can be observed in the dailyreport.Harvest litter to the surfaceHarvestThis will collect the clipped biomass and add it as residue. These clipping events will onlybe reported in the schedule output file; however biomass decrease and residue increase canbe observed in the daily report.This creates a yield of the clipped biomass. These clipping events will be reported both inthe schedule and as harvest events in the harvest report.Note that some of the phenologic growth stages are typically not applicable to clipped cropsso some of the reported phenologic growth stage dates may be constant or have no value inthe harvest report.Specific clipping eventsClipping events for specific dates can be made. The percent of biomass to be removed is specified.
Soil conservation managementSoil conservation practice factorThe erosion control practice factor (0-1) is similar to that used by the Universal Soil Loss Equationor the revised version RUSLE. When no management is specified in a rotation, <strong>CropSyst</strong> uses 1.0.A value of 0.0 will prevent erosion. A value of 1.0 will obviate the soil conservation practicefactor.It can be determined as follows ( Schwab et al., 1993 ):P = P c · P s · P twherePcis the contouring factor based on slope .
Contouring factorLand Slope Pc value1-2 0.63-5 0.56-8 0.59-12 0.613-16 0.717-20 0.821-25 0.9PsPtis the strip cropping factor for crop strip widths.1.0 for contouring only or for alternating strips of corn and small grain.0.75 for 4-year rotation with 2 year of row crop.0.50 for 1 year of row crop.is the terrace sedimentation factor.1.0 for no terraces.0.2 for terraces with graded channel sod outlets.0.1 for terraces with underground outlets.Land treatmentFor runoff computation, land treatment must be selected as specified in the USDA/SCS NationalEngineering Handbook ( USDA-SCS, 1988a ).
Nitrogen fertilizationAutomatic nitrogen fertilizationThere are three modes for automatic nitrogen application:Optimal N allocated directly to crop tissuesWith this option, the simulation will continuously supply N to the crop to optimize plantgrowth. The total N supplied is reported in the output report. This mode can be use to helpdetermine crop nitrogen requirements for optimal growth.
Based on nitrogen balanceNeed descriptionBased on local calibrationNeed descriptionCrop N uptake for target yieldThis parameter is used for the mode based on nitrogen balance.Need description (kg/ha)Critical soil NO3 - N at planting for no responseThis parameter is used for the mode based on local calibrationNeed description (kg/ha)Soil sampling depthThis parameter is used for both the the mode based on nitrogen balance and the mode basedon local calibration.Need descriptionFertilizer use efficiencyThis parameter is used for both the the mode based on nitrogen balance and the mode basedon local calibration.Need descriptionSpecific nitrogen applicationEither organic or inorganic nitrogen applications can be made.Inorganic nitrogen applicationFor an inorganic nitrogen application event, an amount of nitrate and/or ammonium (inkg/ha of Nitrogen) is specified.
An optional percentage of ammonium volatilization loss at the time of application can bespecified, or the volatilization loss can be calculated by <strong>CropSyst</strong> by specifying theammonium source and method of application.Organic nitrogen applicationFor an organic nitrogen application event, the amount of ammonium in the form of organicmanure check: (in kg/ha of Nitrogen) is specified.Each organic N application creates a residue pool which decomposes over time very similarto straw and root biomass residue pools which are created when harvest litter is applied tothe surface. To simulate the decomposition of the organic matter pool, a decomposition timeconstant is specified, or this value can be calculated by <strong>CropSyst</strong> by selecting the source orthe organic N.Organic matter from animal wastes may have an associated amount of ammonia (NH 3 )which may additionally be entered. The volatilization loss of this ammonia at applicationtime can be specified, or this value can be calculated by <strong>CropSyst</strong> by selecting theapplication method and form of the matter.
Tillage and residue stubble operationsFor a tillage or residue stubble operation, over eighty tillage practices are available. Tillage and residueoperation lists are grouped by 'Primary tillage', 'Secondary tillage', 'Conventional tillage', 'No till', and'Residue operations'. Tillage affects residue incorporation . The extent of these effects were taken fromthe Tillage operation table provided by the USDA Soil Conservation Service (Spokane, WA office).If a tillage practice is not listed in the tillage practices table, select a practice that has similar residueincorporation characteristics.Additionally, tillage affects surface roughness for surface water storage.
Tillage operationsSCSCode DescriptionPrimary tillage operationsSurfaceresidueShallowresidue Group10 Combination chisel-disc 65 20 1011 Chisel-straight 70 20 7101 Chisel 24" spacing 75 0 3125 Chisel-straight 18" spacing w/legume 35 55 7126 Chisel-straight 24" spacing w/legume 40 50 3127 Chisel-twisted 18" spacing w/legume 25 65 8128 Chisel-twisted 24" spacing w/legume 30 60 412 Chisel-twisted 18" spacing 50 40 8102 Chisel-twisted 24" spacing 55 0 413 Chisel-following stubble 35 55 614 Disc plow-deep 40 30 715 Disc plow-shallow 60 35 816 Moldboard uphill furrow slice 40 30 117 Moldboard plow early slow or shallow 25 40 218 Moldboard plow-mod. depth & speed 10 20 419 Moldboard plow-late fast, deep 5 10 528 Moldboard any plow (follow flail) 5 20 521 Subsoil 48" spacing 85 5 9106 Subsoil 36"spacing 85 0 422 Heavy disk with legume any depth 15 80 923 Regular sweep 80 10 1024 Wide blade-sweep (towner or noble) 90 5 9107 Landlord 30" spacing 70 0 19108 Landlord 40" spacing 75 0 19109 Paraplow 95 0 1320 Regular offset disc 55 30 927 Regular offset with legume 15 80 11103 Irrigated soil moist 25 - -104 Irrigated soil optimum 10 - -
105 Irrigated soil dry 5 -SCSCode DescriptionSecondary tillage operations(first operation after moldboard)SurfaceresidueShallowresidue Group33 Disc harrow-light 1-10cm 60 35 1126 Disc harrow w/legume 30 65 1032 Field cultivator 85 15 1025 Field cultivator * 95 5 18130 Field cultivator w/legume 45 55 1036 Rod weeder with sweeps or chisel 85 15 1146 Rod weeder with sweeps or chisel * 95 5 1837 Rod weeder plain 90 10 1347 Rod weeder plain * 100 0 1834 Rotary hoe or cultivator 75 20 1431 Rotary tiller 30 50 1738 Spike harrow-10 bar 80 20 1348 Spike harrow-10 bar * 90 10 1829 Skew treader backward 80 20 1430 Skew treader foreward 70 30 1643 Spike harrow-5 bar 90 10 1456 Spike harrow-5 bar * 100 0 1835 Spring tooth cultivator 85 10 1245 Spring tooth cultivator * 95 0 18110 Swedish harrow 90 0 1449 Tandem-any spike or tine-3 bar 95 5 1844 Tine harrow-5 bar 90 10 1458 Tine harrow-5 bar * 100 0 1839 Tine harrow-10 bar 85 15 1457 Tine harrow-10 bar * 95 5 1887 Seedbed marker 85 - -Planting operations (dry)
SCSSurface ShallowDescriptionCoderesidue residue Group50 Semi-deep furrow drill 85 10 1051 Deep furrow drill 80 15 952 Hoe drill 80 15 953 Double disc drill-7 inch 90 5 1154 Air seeder-chisel type 70 30 1055 Air duck foot 60 40 1059 Heavy double disc-legume 30 70 1185 Aerial seeding 100 0 -86 Brillion seeder 100 0 -Planting operations (irrigated)(* Following strip tillage)SCSCode DescriptionSurface Shallowresidue residue Group112 Corn planter 95 - -132 Corn planter * 90 - -113 Onion planter 75 - -133 Onion planter * 70 - -114 Potato planter 60 - -134 Potato planter * 55 - -115 Vegetable seed planter 90 - -135 Vegetable seed planter * 85 - -Planting no-till drill operationsSCSCode DescriptionSurface Shallowresidue residue Group63 Chisel point or hoe opener 65 35 960 Light double disc drill 75 25 10116 Light double disc irrig.33" 90 - -117 Light double disc 36" sp 95 0 1861 Heavy double disc drill 60 40 1159 Heavy double disc w/legume residue 30 - -64 Heavy double disc w/grain residue 45 55 11118 Heavy double disc irrig. 33" 80 - -
119 Heavy double disc irrig. 36" 85 0 18120 Heavy double disc w/corn residue 36" 75 0 1862 Heavy double disc w/scuffer 50 50 1265 Heavy double disc w/grain residue 45 55 1266 Heavy double disc w/legume residue 30 70 1277 No till drill 1 90 10 1878 No till drill 2 75 15 10Residue manipulation operationsSCSCode DescriptionSurfaceresidueShallowresidue Group80 Stubble flail,chop,bust 100 0 1881 Stubble grazing 65 0 1882 Stubble baling 35 0 1883 Stubble burning 10 0 18100 Corn stubble grazing 50 0 18
Crop parameter editorThe crop parameters are probably the most sensitive set of parameters the simulation responds to. It ismost important to carefully select these parameters. Do not rely too heavily on the default values.The crop parameter editor consist contains several pages of parameters grouped by function.● Description and classification● Planting● Growth● Morphology● Phenology● Vernalization● Photoperiod● Harvest● Residue● Nitrogen● Salinity●●CO 2DormancyClick on the the name of the parameter group in the list box to display the corresponding page ofparameters.Some parameters apply only to certain types of crops. For example, dormancy parameters apply only toperennial crops. Parameters such as those for Nitrogen , Salinity and CO 2 may be left to default values ifthey are not to be simulated. (For example, if nitrogen simulation will be disabled in the simulationcontrol ).Whenever applicable, crop parameter values refer to a crop without stress.When first entering parameters for a new crop, each page of parameters should be entered in sequencebecause some selections may enable or disable parameters in following pages.In DOS version of <strong>CropSyst</strong>, when creating a new crop parameter file, the user was first prompted toselect one of several crop classes which set up the parameters available to the specified crop class.In the Windows version, the selection of parameters optional for various types of crops are selectedwith check boxes on the parameter pages. For example, for crops that respond to vernalization, acheckbox on the vernalization page will enable the vernalization parameters. This allows a convenientway to quickly change general simulated crop characteristics.
Crop classificationThe first parameter page allows selection of some basic classification and simulation options for the Crop.DescriptionThe description is usually only informational.When using advanced simulation options and analysis tools such as the Arc Coöperator, thedescription is used to separate different crop harvest data. It is therefore necessary that an entry bethe description field unique for the crop.Default valuesA small database of default values for a number of common crops are provided. Click on the combobox and select a crop. Click on the [Load defaults] button to load the default values. This will replayall current parameters with default values, so this button should only be used when initially creatinga new crop.Land useFor runoff simulation using the SCS curve number method , land use must be selected. Duringfallow periods, the simulation automatically reverts to fallow land use runoff curve numbers asspecified in the USDA/SCS National Engineering Handbook ( USDA-SCS, 1988a )
Photosynthetic pathwayThis parameter affects.....Table xxx identifies photosynthetic species of several common crops.PerennialPerennial should be selected for crops such as alfalfa and tea. Dormancy parameters should beprovided for perennial crops.This selection will enable perennial crop simulation .
Crop planting parametersPlanting modeCrop planting parameter windowCrop planting may either be in a fixed planting date mode or a computed planting date mode.With the fixed planting date mode, the crop will be planted based on the date specified in the crop rotationcycle in the simulation control rotation table.With the computed planting date mode, the crop will be planted based on two input parameters: thetemperature for a 5-day window and the soil water content specified as plant available water required forplanting. The model will search for suitable planting conditions from the date specified in the crop rotationtable.Information source:● The temperature threshold is found by correlating air temperature and the time when farmers actuallyplant their crops.● Information from the literature can also be used.● The required water content of the top soil layer is found by determining the minimum water contentthat farmers will tolerate when planting .
Crop growthCrop growth parameters define the crop sensitivity to environmental conditions.Biomass-transpiration coefficientThis value represents the above ground biomass production per meter of transpiration under givenconditions of atmospheric vapor density deficit (3.0-9.0 ((kg/m²) . kPa)/m).Information Source :❍ Experimental data.❍ Literature.❍ Suggested values for C 3 and C 4 crop species are given in the following table.Biomass transpirationcoefficient for several cropspecies.BiomassC 3 species croptranspirationcoefficient((kg/m²)kPa)/mBarleyBeans (dry)LentilsOatsPeas (dry)3.5 - 6.0
SoybeanSunflowerWheatGrass (cropped)C 4 species cropBiomasstranspirationcoefficient((kg/m²)kPa)/mMaize (corn)Sorghum6.0 - 8.5Uses :❍ Calculation of transpiration-based above ground biomass production.Light to biomass conversionThis value represents the above ground biomass production per unit of light intercepted by the cropcanopy (1-5 g/MJ).Information Source :❍ Experimental data.❍ Literature.❍ Some suggested values for a few common crops are listed in the following table .Light to biomassconversionLight toC 3 species cropbiomassconversion(g/MJ)Barley 2.3 - 2.7Lentils 2.0 - 2.5Oats 2.3 - 2.7Peas 2.0 - 2.5Rye 2.3 - 2.7Soybean 2.0 - 2.5Wheat 2.0 - 3.0Grass (cropped) 2.5
C 4 species cropLight tobiomassconversion(g/MJ)Maize (corn) 3.5 - 4.0Sorghum 3.5 - 4.0Sunflower 3.0 - 4.0Uses :❍ Calculation of radiation/light-based above ground biomass production .AT/PT ratio where leaf area growth ceasesThe ratio of actual transpiration to potential transpiration at which leaf elongation is expected to stop.The ratio is represented by a number between 0 and 1.Information Source:❍ Experimental data.❍ Literature.Uses:❍Stress threshold affecting the above ground biomass-leaf area index relation.AT/PT ratio where root growth ceasesThe ratio of actual to potential transpiration at which root proliferation is expected to stop. The ratiois represented by a number between 0 and 1.Information Source:❍ Experimental data.❍ Literature.Uses:❍Stress threshold determining actual root penetration.Temperature below which growth rate is reducedTemperature effects are usually included in the empirical determination of the light to biomassconversion input parameter , which is normally estimated during the linear phase of crop growth.However, during early growth (before or at the beginning of the linear growth phase), cool weathermay affect growth which is not accounted for. The optimum temperature for growth is thetemperature above which growth (as accounted for by the light to biomass conversion inputparameter) will not be affected.This parameter used to be called "Optimum temperature for growth"
Thermal time to cease temperature limitationThe growing degree days thermal time ( C-days) at which temperature limitation is no longer appliedin the computation of radiation-dependent growth . A value of 0.0 may be entered to disabletemperature limitation.This parameter used to be called "Thermal time at which temperature limitation ceases"Maximum water uptakeThis is the maximum water uptake (7-13 mm/day) for a fully developed green crop, completelycovering the ground, unstressed, fully watered, with unrestricted root growth, and underenvironmental conditions providing large atmospheric evaporative demand.Information source:❍ Experimental data.❍ Literature.❍ If typical evapotranspiration (ET) rates during full canopy are known for the region, this valuecan be obtained from the maximum water uptake tables. Under most circumstances, typicalpeak ET rates can be sustained when plant available water in the soil are above a specifiedthreshold which is crop dependent according to the Limiting PAW table. Lower boundaryvalues in this table correspond to humid climates, while upper boundary values should be usedfor arid climates. Select in the table your estimated typical ET rate, and run to the right of thetable to find the appropriate limiting PAW for your regional cultivar from the Limiting PAWtable , and then record the corresponding value of maximum uptake rate.Limiting PAWWater StressSensitivityLowMediumHighCropsWheatBarleySorghumOatsCornSunflowerPeasSoybeanBeansPotatoesTomatoesPAW0.25-0.350.35-0.450.50-0.65
Critical leaf water potentialThis is the leaf water potential just before the beginning of stomatal closure due to water deficit.(J/kg).Information source:❍ Experimental data.❍ Literature.❍ Typical values of this parameter are given in the Leaf water potentials table .❍Uses:❍Lower and upper boundaries apply to humid and arid environments, respectively.Actual transpiration .Wilting leaf water potentialThis is the leaf (and soil) water potential at the point when the crop can no longer extract water fromthe soil (J/kg).Information source:❍ Experimental data.❍ Literature.❍ Lower and upper boundaries apply to humid and arid environments, respectively.❍ Typical values of this parameter are given in the following Leaf water potentials table .Water StressSensitivityLeaf water potentialsCriticalCropsJ/kgPerm. WiltJ/kgLowMediumHighWheatBarleySorghumOatsCornSunflowerPeasSoybeanBeansPotatoesTomatoes-1,330 to -2,000 -2,000 to -3,000-930 to -1,200 -1,400 to -1,800-670 to -800 -1,000 to -1,200Uses:
❍Actual transpiration.
Crop morphologyCrop morphology windowMaximum root depthThe depth of the roots measured in meters from the soil surface when the plant reaches the end ofvegetative growth (beginning of senescence).Information Source:❍ Empirical measurements.❍ Observed water extraction patterns.❍ Root depths for some common crops are given in the Crop morphology parameters tableMaximum root depth may be higher than values suggested here under very favorableconditions, or lower under restricted conditions. Local experience must be used for properparameter selection.❍ The literature.Uses :❍ Current root depth as a function of plant development.❍ Soil water uptake in soil layers penetrated by the roots (section.❍ Water drainage as any water passing the potential root zone in the Cascade and FiniteDifference inifiltration models.❍ Current root density distribution in soil layers as a linear function of root depth.
Maximum leaf area index (LAI)The leaf area index at the end of vegetative growth (m²/m²).Information Source:❍ Experimental data.❍ Literature.❍ Some values for common crops are given in the Crop morphology parameters table .Uses :❍ Daily leaf area index .❍Light interception by the crop canopy .Fraction of maximum Leaf Area Index at physiological maturityThis corresponds to the total canopy leaf area index (senescent plus green leaves), expressed as afraction of peak leaf area index, that the crop has and which shades the soil at physiological maturity(0-1).Information Source:❍ Based on local experience.Uses :❍ Leaf Area Index at maturity .Specific leaf areaThis corresponds to the leaf area per unit of leaf biomass. It is used to determine the amount of greenarea index produced in a day. Values of SLA usually range between 15 and 25 (m²/kg) but they mustbe determined empirically.See the equation for daily green area index. .Leaf/stem partitionThis parameter adjusts the proportion of cumulative biomass that is partitioned to green leaf areaproduction as the crop accumulates biomass during the active growth stage. It is used to determinethe amount of green area index produced in a day. Values for LeafStemPart may range between 1and 10 (m²/kg).See the equation for daily green area index. .Leaf duration (deg-days)This corresponds to the degree-days elapsed between the appearance and senescence of new greenarea index. Values range from 700 to 1000 C-days.
See the equation for daily green area index. .Leaf duration sensitivity to water stressThis parameter affects the accumulation of thermal time during the life time of green area,accelerating the daily accumulation of degree days as water stress increases. Typical range offluctuation for GAIsensitivity is from 1 (no effect) to about 3.See the equation for daily green area index. .Extinction coefficient for solar radiationThis coefficient depends on the canopy structure and determines the ability of a canopy of a givenLAI to intercept solar radiation. Its value is about 0.35-0.4 for canopies with vertical tendency,0.4-0.5 for canopies with random (spherical) leaf angle distribution, 0.5-0.6 for canopies withhorizontal tendencies, and 0.55-0.65 for heliotropic crops (sunflower).Information Source: Literature.Uses : Computing the fraction of incident solar radiation intercepted by the canopy.ET crop coefficient at full canopyThis value represents the ratio of unstressed crop ET to reference (short grass) ET when the crop hasdeveloped a full canopy.Information Source :❍ Experimental data.❍ Literature.Uses :❍ Determination of crop maximum ET rate in equation .Crop morphology constantsCropMax.root depth(m)Max.LAI(m²/m²)Barley (Spring) 1.2-1.6 4 - 6Beans (Dry) 0.9-1.3 3 - 4Lentils 0.9-1.3 3 - 4Maize 1.5-2.0 4 - 7Oats 1.2-1.6 4 - 6Peas (Dry) 0.9-1.3 3 - 4Sorghum 1.4-1.8 6 - 10
Soybean 1.4-1.8 4 - 7Sunflower 1.7-2.2 4 - 5Wheat (spring) 1.2-1.6 4 - 6Wheat (winter) 1.5-2.0 5 - 8Grass (cropped) 0.8 4.0
Crop phenologyCrop development in <strong>CropSyst</strong> is based on thermal time. ( The computation of thermal time ). The thermaltime (degree days) required for each of the phenologic stages of development must be specified. Degreedays are accumulated from planting. Depending on crop type, certain growth characteristics are relevant :emergence, tuber initiation, beginning of flowering, peak LAI, end of flowering, beginning of grain filling,and physiological maturity.Crop phenology windowPhenologic growth stages thermal timerequirementsPeak LAI occurs near flowering depending on the type of crop:❍ grain crops before beginning flowering❍ grain legumes beginning of grain filling❍ root crops after beginning of floweringCrop classification phenologyPhenologic stageGrains cropsGrain legumes Root crops(non-legumes)emergence X X Xtuber initiation - - Xbeginning of flowering X X Xpeak LAI X X Xend of flowering - X X
eginning of grain filling X X -physiological maturity X X XBase and Cutoff temperaturesThe base and cutoff temperatures for the computation of elapsed degree-days must also be specified.These numbers may vary depending on location and cultivar.Information source:❍ Growing degree days (thermal time) can be empirically determined as follows:1. Identify the dates the plant reaches each phenologic stage.2. From literature, choose a base thermal time temperature and a cutoff temperatureadequate for the crop species. These are temperatures below and above which thermaltime does not accumulate.3. Starting from the planting date, accumulate the daily degree days .4. The thermal time the plant reaches a growth stage is the accumulated daily degree-daysfor the respective date.Uses:❍Growth stage determination .Phenological sensitivity to water stressWater stress tends to increase the crop canopy temperature, which may accelerate the accumulationof degree-days .The parameter "Phenological sensitivity to water stress", which ranges from 0 to 1, allows one todetermine the degree of the effect of water stress. For most applications, this value should be set to1. Note that for some crops, like sorghum, phenology may actually be delayed by water stress. Insuch a case, select 0 for this parameter.Information source:❍ Experimental data.❍ Literature.Uses:❍Calculation of growing degree days.
Maximum crop water uptakeThe following tables show the relation between average crop ET during full green canopy and the maximum attainable cropwater uptake at different values of plant available water for crops with low, medium and high sensitivity to water stress.MaximumweeklyaverageET(mm/day)Maximum Attainable Crop Water Uptake (mm/day)5.0 5.5 6.0 6.5 7.0 7.5 8.0 8.5 9.0 9.5 10.0 10.5 11.0 11.5 12.0 12.5 13.0 13.5 14.0 14.5 15.05.0 1.0 0.47 0.34 0.27 0.22 - - - - - - - - - - - - - - - -5.5 - 1.0 0.49 0.35 0.28 0.24 - - - - - - - - - - - - - - -6.0 - - 1.0 0.50 0.37 0.30 0.25 0.22 - - - - - - - - - - - - -6.5 - - - 1.0 0.52 0.38 0.31 0.26 0.23 - - - - - - - - - - - -7.0 - - - - 1.0 0.53 0.38 0.32 0.28 0.24 - - - - - - - - - - -7.5 - - - - - 1.0 0.53 0.40 0.34 0.29 0.25 0.22 - - - - - - - - -8.0 - - - - - - 1.0 0.55 0.42 0.35 0.30 0.26 0.23 - - - - - - - -8.5 - - - - - - - 1.0 0.56 0.43 0.36 0.37 0.27 0.24 - - - - - - -9.0 - - - - - - - - 1.0 0.58 0.45 0.37 0.32 0.28 0.25 0.23 - - - - -9.5 - - - - - - - - - 1.0 0.59 0.46 0.38 0.33 0.29 0.26 0.24 - - - -10.0 - - - - - - - - - - 1.0 0.60 0.47 0.39 0.34 0.30 0.27 0.24 - - -10.5 - - - - - - - - - - - 1.0 0.61 0.48 0.40 0.34 0.31 0.28 0.25 0.23 -11.0 - - - - - - - - - - - - 1.0 0.62 0.49 0.41 0.35 0.32 0.28 0.26 0.2411.5 - - - - - - - - - - - - - 1.0 0.63 0.49 0.42 0.37 0.32 0.29 0.2612.0 - - - - - - - - - - - - - - 1.0 0.64 0.50 0.43 0.37 0.33 0.3012.5 - - - - - - - - - - - - - - - 1.0 0.64 0.52 0.43 0.38 0.3413.0 - - - - - - - - - - - - - - - - 1.0 0.66 0.52 0.44 0.3813.5 - - - - - - - - - - - - - - - - - 1.0 0.66 0.53 0.4514.0 - - - - - - - - - - - - - - - - - - 1.0 0.67 0.5314.5 - - - - - - - - - - - - - - - - - - - 1.0 0.6715.0 - - - - - - - - - - - - - - - - - - - - 1.0Leaf water potential of -1,600 J/kg for stomatalclosure and -2,500 J/kg for permanent plant wiltMaximumweeklyaverageETMaximum Attainable Crop Water Uptake (mm/day)5.0 5.5 6.0 6.5 7.0 7.5 8.0 8.5 9.0 9.5 10.0 10.5 11.0 11.5 12.0 12.5 13.0 13.5 14.0 14.5 15.05.0 1.0 0.55 0.42 0.35 0.31 0.28 0.25 0.23 - - - - - - - - - - - - -5.5 - 1.0 0.57 0.44 0.37 0.32 0.29 0.26 0.24 - - - - - - - - - - - -6.0 - - 1.0 0.59 0.46 0.39 0.34 0.30 0.28 0.26 0.24 - - - - - - - - - -6.5 - - - 1.0 0.60 0.47 0.40 0.35 0.32 0.29 0.27 0.25 0.23 - - - - - - - -7.0 - - - - 1.0 0.62 0.49 0.41 0.36 0.33 0.30 0.28 0.26 0.24 - - - - - - -7.5 - - - - - 1.0 0.63 0.50 0.42 0.37 0.34 0.31 0.29 0.27 0.25 0.24 - - - - -8.0 - - - - - - 1.0 0.64 0.51 0.44 0.39 0.35 0.32 0.30 0.28 0.26 0.25 0.23 - - -8.5 - - - - - - - 1.0 0.65 0.52 0.45 0.40 0.36 0.33 0.30 0.29 0.27 0.25 0.24 - -9.0 - - - - - - - - 1.0 0.66 0.53 0.46 0.41 0.37 0.34 0.31 0.29 0.28 0.26 0.25 0.249.5 - - - - - - - - - 1.0 0.67 0.54 0.47 0.42 0.38 0.35 0.32 0.30 0.28 0.27 0.26
(mm/day) 10.0 - - - - - - - - - - 1.0 0.68 0.55 0.48 0.42 0.39 0.35 0.33 0.31 0.29 0.2810.5 - - - - - - - - - - - 1.0 0.69 0.56 0.49 0.43 0.39 0.36 0.34 0.32 0.3011.0 - - - - - - - - - - - - 1.0 0.70 0.57 0.50 0.44 0.40 0.37 0.34 0.3211.5 - - - - - - - - - - - - - 1.0 0.71 0.59 0.51 0.45 0.41 0.38 0.3512.0 - - - - - - - - - - - - - - 1.0 0.72 0.59 0.51 0.46 0.42 0.3912.5 - - - - - - - - - - - - - - - 1.0 0.72 0.60 0.52 0.47 0.4213.0 - - - - - - - - - - - - - - - - 1.0 0.73 0.60 0.53 0.4713.5 - - - - - - - - - - - - - - - - - 1.0 0.73 0.61 0.5314.0 - - - - - - - - - - - - - - - - - - 1.0 0.74 0.6214.5 - - - - - - - - - - - - - - - - - - - 1.0 0.7415.0 - - - - - - - - - - - - - - - - - - - - 1.0Leaf water potential of -1,070 J/kg for stomatalclosure and -1,600 J/kg for permanent wiltMaximumweeklyaverageET(mm/day)Maximum Attainable Crop Water Uptake (mm/day)5.0 5.5 6.0 6.5 7.0 7.5 8.0 8.5 9.0 9.5 10.0 10.5 11.0 11.5 12.0 12.5 13.0 13.5 14.0 14.5 15.05.0 1.0 0.63 0.51 0.44 0.39 0.36 0.33 0.31 0.30 0.28 0.27 0.26 0.26 0.23 0.24 - - - - - -5.5 - 1.0 0.65 0.53 0.45 0.41 0.37 0.35 0.33 0.31 0.30 0.28 0.27 0.26 0.26 0.25 0.24 - - - -6.0 - - 1.0 0.67 0.54 0.47 0.42 0.39 0.36 0.34 0.32 0.31 0.29 0.28 0.27 0.27 0.26 0.25 0.25 0.24 -6.5 - - - 1.0 0.68 0.56 0.48 0.43 0.40 0.37 0.35 0.33 0.32 0.30 0.29 0.28 0.27 0.27 0.26 0.25 0.257.0 - - - - 1.0 0.69 0.57 0.50 0.45 0.41 0.38 0.36 0.34 0.33 0.31 0.30 0.29 0.28 0.27 0.27 0.267.5 - - - - - 1.0 0.70 0.58 0.51 0.46 0.42 0.39 0.37 0.35 0.33 0.32 0.31 0.30 0.29 0.28 0.278.0 - - - - - - 1.0 0.71 0.59 0.52 0.47 0.43 0.40 0.38 0.36 0.34 0.33 0.32 0.31 0.30 0.298.5 - - - - - - - 1.0 0.72 0.60 0.53 0.48 0.44 0.41 0.39 0.37 0.35 0.34 0.32 0.31 0.309.0 - - - - - - - - 1.0 0.73 0.61 0.54 0.49 0.45 0.42 0.40 0.38 0.36 0.34 0.33 0.329.5 - - - - - - - - - 1.0 0.74 0.62 0.55 0.50 0.46 0.43 0.41 0.39 0.37 0.35 0.3410.0 - - - - - - - - - - 1.0 0.75 0.63 0.56 0.51 0.47 0.44 0.41 0.39 0.38 0.3610.5 - - - - - - - - - - - 1.0 0.76 0.64 0.57 0.52 0.48 0.45 0.42 0.40 0.3811.0 - - - - - - - - - - - - 1.0 0.76 0.65 0.58 0.53 0.49 0.45 0.43 0.4111.5 - - - - - - - - - - - - - 1.0 0.77 0.66 0.59 0.53 0.49 0.46 0.4412.0 - - - - - - - - - - - - - - 1.0 0.78 0.67 0.59 0.54 0.50 0.4712.5 - - - - - - - - - - - - - - - 1.0 0.78 0.67 0.60 0.55 0.5113.0 - - - - - - - - - - - - - - - - 1.0 0.79 0.68 0.61 0.5613.5 - - - - - - - - - - - - - - - - - 1.0 0.79 0.69 0.6114.0 - - - - - - - - - - - - - - - - - - 1.0 0.80 0.6914.5 - - - - - - - - - - - - - - - - - - - 1.0 0.8015.0 - - - - - - - - - - - - - - - - - - - - 1.0Leaf water potential of -733 J/kg for stomatalclosure and -1,100 J/kg for permanent plant wilt
Crop vernalizationVernalization is defined as the low temperature promotion of flowering. Thermal time accumulation islimited until vernalization requirements are met. A vernalization factor that takes on values from 0-1 toadjust thermal time as calculated based on the following parameters. These parameters are only relevant forwinter crops.Vernalization checkboxCrop vernalization pageThis checkbox enables vernalization. When disabled, the vernalization parameters have no effect.Low temperature threshold for optimum vernalization (°C)The low end threshold temperature above which vernalization accumulation is optimum.High temperature threshold for optimum vernalization (°C)The high end threshold temperature below which vernalization accumulation is optimum.Vernalization requirement to start (days)The sum of vernalization-days at which the vernalization factor is set to a minimum and startsincreasing towards 1.
Vernalization day requirement to complete (days)is the sum of vernalization-days at which the vernalization requirement is completed.Minimum vernalization factor (0-1)The value of the vernalization factor at the beginning of the vernalization process. This parametershould be set to zero if the vernalization-days required to start parameter is set larger than zero;otherwise, it must be set greater than or equal to zero.
Crop Photo-periodSome crops accumulate thermal time when the day length exceeds a threshold (long-day crops); othersaccumulate when the day length is less than a minimum threshold value (short-day crops). Therefore, theinput parameters to calculate photo-period effects on physiological (thermal) time accumulation havedifferent definitions.Photo-period checkboxPhoto-period crop parameter windowThis checkbox enables the photo-period. When disabled, photoperiod parameters have no effect.Day length for insensitivity (hours)For long-day crops, this is the day length threshold above which maximum accumulation of thermaltime occurs.For short-day crops, this is the day length threshold below which maximum accumulation of thermaltime occurs.Day length to inhibit flowering (hours)For long-day crops, this is the day-length threshold below which no accumulation of thermal timeoccurs.For short-day crops, this is the day length threshold above which no accumulation of thermal timeoccurs.
Crop harvestHarvest classificationThe method of biomass collection at harvest is determined by the selection of harvest classification.Harvest index parameters will be enabled or disabled depending on this selection.Harvest indexCrop yield is calculated from total biomass at harvest multiplied by a harvest index (Unstressedharvest index) defined as the ratio of yield to biomass for a crop without stress.Note that some crops (e.g. soybean) drop a sizeable amount of leaves before harvest. Therefore,observed harvest indices that do not include dropped leaves are higher than required by the model,which does not simulate the loss of biomass due to dropped leaves.Information source:❍ Harvest indices for some common crops are given in Unstressed harvest index values table .Uses:❍The harvest index computation.Sensitivity to water stressHarvest indices vary based on crop/cultivar sensitivity to water stress during flowering and grainfilling. The harvest index sensitivity to water stress during flowering, and during grain filling can beadjusted using the respective sensitivity coefficient (0-1). Values of zero may be entered if no water
stress sensitivity is to be simulated.Translocation factorThe fraction of above ground biomass at flowering that can be translocated to the grains during grainfilling (0.0-0.4).This gives a second estimate of yield. <strong>CropSyst</strong> takes the maximum yield resulting from eitherharvest index calculation or biomass translocated to the grains. If severe stress occurs duringflowering, the translocation mechanism is deactivated (poor sink strength).Unstressed harvest indexvaluesCrop Harvest IndexOrzo (Primavera) 0.40 - 0.50Beans (Dry) 0.45 - 0.55Lentils 0.45 - 0.55Maize 0.40 - 0.55Peas (Dry) 0.45 - 0.55Oats 0.40 - 0.55Sorghum 0.40 - 0.55Soybean 0.25 - 0.35Sunflower 0.30 - 0.35Wheat 0.40 - 0.55
Crop residueThe amount of residue present at any given time affects runoff, erosion, soil evaporation and the amount ofwater infiltrating into the soil.Residue parameters define decomposition rate, the fraction of above ground biomass that remains in thesoil as residue after harvest, and the degree of shading of the soil surface by residue.Information source:● Residue parameters for some common crops are given in in the residue constants table .● These parameters are computed from empirical measurement as reported by McCool and Krauss,1981 and Bristow et al., 1986 , for the residue decomposition time constant and Gregory, 1982 andMcCool (personal communication, 1992) for the area to mass ratio of residue cover.Uses:●●Residue decomposition .Residue soil surface cover factors in soil erosion.CropResidue constantsResiduedecomp.time const.(days)Areamassratio(m²/kg)Fract.biomassresidue0-1Sorgo del cereale 0.6German millet 1.2Sudan grass 1.5
Sunflowers 2.0Winter wheat 60 2.7-5.4 0.7Winter wheat (large stem) 60 4.5 0.7Winter wheat (medium stem) 60 5.7 0.7Spring oats 60 2.8-1.4Spring barley 60 4.3-8.0 1.0Corn 60 3.2-4.0 0.7Soybeans 2.1-7.2Soybeans (stems) 1.8Soybeans (leaves) 3.2Cotton (stems) 1.1Small diameter stem 5.7Spring peas 30 5.7Winter barley 60 5.7 1.0very fine stems 10.0fine stems 8.0medium stems 5.7large stems 4.5very large stems 1.0-4.0Residue decomposition time constant (days)The approximate number of days (1-300) required for the residue to decompose 63% of the initialresidue mass under ideal moisture and temperature conditions .Area to mass ratio of residue cover (m²/kg)This value represents the projected area of residue covering the soil surface in relation to the mass ofthe residue (m²/kg). This value determines the degree of soil shading by residue.
Crop nitrogenNitrogen fixationFor legume crops, simulation of nitrogen fixation can be enabled.Nitrogen uptakeThe following crop nitrogen parameters are used in computing nitrogen uptake .Information Source:❍ Experimental data❍ LiteratureNitrogen uptake adjustmentBecause a generic value for maximum nitrogen uptake rate per unit of root length is coded in themodel, this parameter allows calibration for specific crops and cultivars. (0-2).Nitrogen availability adjustmentThis parameter affects the curvature of the relationship between relative availability (0-1) and soillayer nitrogen concentration (kg/ha equivalent). A normal value is 1 (range 0-2). Increase this valueto increase relative availablity and vica-versa.
Amount of residual nitrogenThis is the amount of nitrogen (0-10 kg/ha) equivalent for each 0.1m soil sublayer that remainsunavailable for crop uptake. Choose a value of zero to indicate that all nitrogen in the soil solutioncan be exhausted if required by the crop.Maximum nitrogen concentration during early growthNitrogen concentration, during early linear growth, of a crop well-supplied with nitrogen (kgN/kgbiomass).Typical maximum nitrogen concentration of grasses is 0.02 to 0.04. Non-leguminous dicotyledonshave a value 10% higher than grasses, and legumes about 30% higher than grasses.Maximum and minimum nitrogen concentration at maturityMaximum/minimum nitrogen concentration at maturity (combining grain and vegetative portions ofthe plant) for a crop well supplied with nitrogen (kgN/kg biomass).Minimum nitrogen concentration at harvestMinimum nitrogen concentration at harvest (combining grain and vegetative portions of the plant)for a crop well supplied with nitrogen (kgN/kg biomass).Maximum nitrogen concentration of the stubbleMaximum nitrogen concentration of the stubble at harvest (kgN/kg biomass).
Crop salinityOsmotic potential for 50% yield (kPa)Needs descriptionVan-Genuchten salinity tolerance exp (2-9)Needs description
Crop CO 2Elevated reference atmospheric CO 2 concentration(ppm)Needs descriptionRatio of growth at elevated reference and 350 ppmatmospheric CO 2 concentration (1-1.5)Needs description
Crop dormancyAverage temperature for 7 consecutive days to induce dormancyFirst date to start looking for dormancyFirst date to start looking for restart after dormancy
Thickness Several < 0.3 meterVolumetric Perm. Wilt. Pt.Cascadeinfiltration0.03-0.20 m³/m³Volumetric Field Cap.Cascadeinfiltration0.06-0.42 m³/m³Bulk Density Soil porosity 0.9-1.8 g/cm³Vol. WC at -1500Finite diff.Infiltration0.03-0.20 m³/m³Vol. WC at -33Finite diff.Infiltration0.06-0.42 m³/m³Bypass Coefficient Infiltration 0-1 -Saturated hydraulic conductivity Variousm/dayAir entry potential Infiltration J/kgCampbell bInfiltration
Soil parameter editorThe soil entry form consists of a page for the general characteristics of the soil, a page for the soil textureprofile, and a page for the soil hydraulic properties.The parameters listed in soil parameters table must be provided.DescriptionSoil parameters windowsFor the soil description, we recommend that the user provide a full name for the soil and the soilID. The soil description is printed on the second line of report headers if the report header option isenabled.
Soil characteristicsVolatilization in the top horizonRunoffRUSLELeaching observationSoil textureHydraulic propertiesSoil parametersParameter Use Usual range UnitsDescription Informative 80 chars -Hydrologic Condition Runoff Poor-Good -Hydrologic Group Runoff A-D -Steepness Runoff 0-100 %Number of soil layers Several 1-11 -Thickness Several < 0.3 meterVolumetric Perm. Wilt. Pt.Cascadeinfiltration0.03-0.20 m³/m³Volumetric Field Cap.Cascadeinfiltration0.06-0.42 m³/m³Bulk Density Soil porosity 0.9-1.8 g/cm³Vol. WC at -1500Finite diff.Infiltration0.03-0.20 m³/m³Vol. WC at -33Finite diff.Infiltration0.06-0.42 m³/m³Bypass Coefficient Infiltration 0-1 -Saturated hydraulic conductivity Variousm/dayAir entry potential Infiltration J/kgCampbell bInfiltration
Soil volatilizationVolatilization of chemicals occurs in the the top soil layer.Cation exchange capacitypHdescription needed (millequivelents / 100g)description needed
Soil leaching observationThe depth at which soil water drainage and chemical leaching is observed can be specified. the depth willselect the corresponding layer. Leaching that is reported in the output report files is the leaching at thisdepth. The leaching used to validate the water balance is always from the bottom of the soil profile. Alsothe leaching reported in the water balance report is from the bottom of the soil profile.Soil leaching observation depth is currently only valid when using the cascade infiltration model.
SCS Curve number runoff<strong>CropSyst</strong> uses the curve number approach in computing runoff as desribed the USDA/SCS NationalEngineering Handbook ( USDA-SCS, 1988a ).Hydrologic condition and soil groupNote that the fair hydrologic condition is only valid for pasture, range, or woodland, and runoffnumbers may not exist for certain land uses and land treatments.Numerical solution runoff soil characteristicsSurface storageThe Surface storage parameter allows one to specify possible ponding depth (in mm) for water thatcannot be infiltrated by the F.D. model in a given time step. Ponded water will be held forinfiltration in successive time steps (or held over for the next day). Non infiltrated water thatexceeds this storage ponding depth is taken as runoff.The surface storage parameter is only effective when using the Numerical runoff model.In contrast, in the SCS curve number method the runoff is determined prior to infiltration.
RUSLE parametersSteepness (a percentage 0-100)The steepness parameter specifies the grade of the land measured as the number of meters ofvertical variation per 100 meters of horizontal run.Slope length (m)The horizontal slope length used in determining the RUSLE slope length factor.
Soil texturePercent Sand, Clay, SiltThe sum of these three numbers must equal 100, the parameter editor will enter the third numberafter entering the first two.Enter a new value for any one of these texture values will cause new hydraulic poperties to becalculated. This is necessary because inconsistent hydraulic properties will cause a failure of theFinite Difference infiltration model.Press the [Texture] button to use the Soil Texture Triangle: Hydraulic properties calculator toselect the texture and estimate hydraulic properties.
Uses❍❍She soil texture is used within the parameter editor to estimate hydraulic properties.The soil texture of the first soil layer is used in RUSLE erosion calculations .Soil texture and physical propertiesSoiltextureFieldcapacitym³/m³Permanentwiltingpointm³/m³Bulkdensityg/cm³Sand 0.10-0.20 0.03-0.10 1.55-1.80Loamy Sand 0.11-0.19 0.03-0.10 1.60Sandy Loam 0.15-0.27 0.06-0.12 1.40-1.60Loam 0.20-0.30 0.11-0.17 1.35-1.50Silt Loam 0.22-0.36 0.09-0.21 1.30Clay Loam 0.31-0.42 0.15-0.20 1.30-1.40Silt Clay Loam 0.30-0.37 0.17-0.24 1.35Silty Clay 0.35-0.46 0.17-0.22 1.25-1.35Clay 0.33-0.49 0.19-0.24 1.20-1.30
Soil layersThe number of soil layers (horizons) can be selected by moving the soil layer radio button markerto the respective number. There may be up to 11 soil layers. The soil layers will be subdivided by<strong>CropSyst</strong> into approximately 10cm sublayers.Layer ThicknessSoil layer thickness must be provided in meters. The layers are numbered from top to bottom. Thefirst soil layer is the layer of evaporation. Usually the first soil layer is about 10cm (0.1m).The remaining soil layers may have any thickness, but the total depth should not exceed 3 meters.The user should provide data for soil layers to a depth that the deepest penetrating root system thatwill be used might grow into. Roots will not grow beyond the bottom soil layer. If the maximumrooting depth for an unstressed crop is potentially larger than the available soil depth, then rootingdepth will be limited to soil depth but root density will be properly adjusted.Uses:❍Soil layer thickness is used throughout the program in relation to the soil water balance.
Soil hydraulic propertiesVolumetric permanent wilting point and fieldcapacityThe permanent wilting point is defined as the water content at a matric potential of -1,500 kPa (-15bars). It roughly corresponds to the lower limit of the plant available water.The water content of the soil at field capacity defines the upper limit of the plant available water ordrained upper limit. It roughly corresponds to a matric potential of -30 kPa (-0.3 bars) in most soilsand to -10 kPa (-0.1 bars) in sandy soils. If field capacity is found at a matric potential other than-30 kPa, enter the volumetric water content at -30 kPa .These values are expressed in m³ water/m³ soil.
Information Source:❍ soil properties table .Uses:❍❍❍❍❍❍❍❍Both: Soil water storage in the soil water balance. .Both: Plant available water (PAW) .Both: Irrigation .PWP: Soil water potential .PWP: Soil water loss and water content.FC: Soil layer freezing .FC: Evaporation .FC: Transpiration .Bulk densityBulk density is used in the computation of soil porosity. The value is expressed in grams of soilmass per cubic centimeter of soil volume.Information Source:❍ soil properties table .Uses:❍❍❍Soil freezing .Nitrogen exchange .Nitrogen transformation .Bypass coefficientThe Bypass coefficient (BC) defines the fraction of water in the soil layer (0-1) that is bypassedduring the infiltration process, while (1-BC) represents the fraction of the soil water subject topiston-like displacement. The fraction of soil water bypassed (and its solute content) is not mixedwith new incoming water during infiltration.
Location parameter editorLocation parameters refer to information that is specific to the study site. The primary function of thelocation parameters is to identify the daily weather data files, and the latitude to generate solar radiationwhen real data is not available.DescriptionLocation parameter editor windowsThis commentary parameter may be printed in the header of reports if the report header option isactivated.Weather fileThe weather file must be selected or the simulation will not be able to run. The <strong>CropSyst</strong> text fileformat places weather data for each year in separate files with filenames composed of a prefixcode and a 4 digit year. Use the file selector button to select any one of the weather data files,<strong>CropSyst</strong> will use the selected file to locate and compose the filenames for the other years asneeded.You may find it convenient to create a directory structure for storing your weather data files.In the DOS version, instead of selected a single file, you must select the directory containing the
weather files and specify the prefix code that <strong>CropSyst</strong> will use to construct the weather data filenames.This four character/digit code is used in constructing the weather file name. The weather filenameconsists of these four characters followed by the four digit year with the extension (.DAT or.GEN): I.e. PULL1990.DAT, where PULL is the weather file code.LatitudeThe latitude is used in computing daily radiation values when actual values are not available in theweather files. The latitude is given as the angle of degrees from the equator whether from thenorthern or southern hemisphere. Degrees-minutes must be converted to degrees: Ie. 45° 30' isgiven as 45.5 . A negative value should be used for the southern hemisphere.Refinement parametersAdditional parameters can refine the simulation of weather. These refinements can improve thesimulation provided additional data is available.PrecipitationWinterThe precipitation parameters allow generation of 30 minute precipitation events.These parameters improve simulation of freezing conditionsEvapotranspiration modelWindClimGenThese parameters allow selection of the evapotranspiration model and constants required bythe modelsThese parameters for wind speed are also used by the evapotranspiration model.You will notice that many of the location parameters are also used by ClimGen; indeed, <strong>CropSyst</strong>and ClimGen location files are interchangable. You can use ClimGen to fit several of the locationparameters.
Location preciptationGiven total daily precipitation, <strong>CropSyst</strong> can generate 30 minute storm events. The distribution of thedaily precipitation into 30 minute intervals are used for the following:● To estimate rainfall energy intensity which is used in the RUSLE equation for erosion.● To give a more realistic infiltration pattern in the finite difference model.● The finite difference model also gives a more realistic runoff model (which is used in the Ruralwatershed modeling module).Storm events are produced randomly so you can expect slightly different infiltration patterns and rainfallenergy intensity effects on erosion each time you run the simulation.If you need constant storm events, you can use a storm event file.Mean peak 1/2 hour fraction of total rainfallThe average monthly values of the maximum portion of total rainfall during 1/2 hour intervals duringstorm events (0.0208 - 1.0).Location precipitation windowInformation Source:● These values may be obtained empirically by taking the ratio of the maximum 1/2 hour rainfallamount, to the total rainfall amount for each event for the entire period of record as detailed by
●●Arnold and William, 1989 .For the US, consult U.S. Department of Commerce (U.S.D.C, 1979).Values for selected locations, published by Arnold et al., are shown in the following table.Mean peak 1/2 hour fraction of total rainfall for selected locationsLocationStorm event fileJan Feb Mar Apr May Jun Jul Aug Spt Oct Nov DecIowa City,IA 0.22 0.21 0.30 0.38 0.49 0.59 0.56 0.54 0.47 0.37 0.32 0.22Stillwater,OK 0.30 0.27 0.39 0.56 0.55 0.61 0.61 0.57 0.51 0.42 0.36 0.21Tifton,GA 0.32 0.32 0.36 0.44 0.47 0.66 0.60 0.65 0.58 0.41 0.39 0.39Reynolds,ID 0.22 0.28 0.23 0.39 0.43 0.57 0.64 0.56 0.45 0.26 0.22 0.22Saffor,AZ 0.33 0.32 0.32 0.45 0.50 0.68 0.75 0.72 0.63 0.48 0.35 0.30In lieu of randomly generated 30 minute storm events, actual or generated events data can be provided ina Universal Environmental Database format file.This file must have the same name as the location file with a .UED extension and located in the samedirectory as the location file.Currently this file can only be created using ClimGen. This file can also contain daily real and/orgenerated precip, temperature, radiation, etc. data.Eventually these UED files will replace daily text files.
Location parameters for wintersimulationSoil Freezing conditionsWinter parameters windowsThe following values are relevant to freezing climates only and can be ignored for locations that do nothave freezing climate conditions. These values are used in computing the depth of frozen soil as it affectsrunoff and water available for uptake.Information Source:● These are calibrated parameters which my vary from location to location.● The freezing climate parameters table should help in choosing values for these parameters.Snow insulation factorThis value is a calibrated adjustment parameter which affects the influence of snow insulation withsoil depth (1/cm). Its value ranges from 0.01 to 0.09.Information Source:❍ Known snow insulation factors for sites in the USA are reproduced in the freezing climate
❍parameters tableFor other sites, this value can be estimated by running the simulation using various valuesuntil a freezing depth profile is obtained that matches empirical data for a number of years.Freezing climate parameters forlocations in the USA.LocationInitialcumulativefreezing index°C daysSnowInsulationfactor(1/cm)Aberdeen, Idaho -50 0.025Dubois, Idaho -75 0.073Moscow, Idaho -30 0.020Parma, Idaho -20 0.015Rexburg, Idaho -20 to -60 0.085Sandpoint, Idaho -5 0.015Twin Falls, Idaho -20 to -30 0.010Bozeman, Montana -30 0.095Huntley, Montana -30 0.040Havre, Montana -30 0.040
Evapotranspiration modelThe evapotranspiration model is the predominate component of <strong>CropSyst</strong> crop growth model.<strong>CropSyst</strong> allows the user to choose between reference evapotranspiration simulation models dependingon the available weather data, as show in the Evapotranspiration model data requirements table .Evapotranspiration model windowsReference evapotranspiration model selection<strong>CropSyst</strong> will examine the weather file data for each year that is processed and automatically select theevapotranspiration model to be used for that year. Also, if a particular day has missing data (a value ofzero for solar radiation, Max/Min relative humidity, or wind speed), a model that requires only theavailable data will be used for that one day.Evapotranspiration model data requirementsModel Weather File Data RequirementsSimple ET model Precipitation, Max. temp., Min Temp.Priestley-Taylor Precipitation, Max. Temp., Min Temp.,Solar RadiationPenman-Monteith Precipitation, Max. Temp., Min Temp.,Solar Radiation, Max relative humidity,
Min relative humidity, wind speedFor example, suppose that weather files for a site for 1975, 1977 and 1978 have precipitation,temperature , radiation, humidity and wind speed measurements, but 1976 only has precipitation,temperature and solar radiation measurements; the simulation will simulate ET using thePenman-Monteith model for 1975, 1977 and 1978, and the Priestley-Taylor model for 1976. Furthersuppose that some of the records in these files are missing solar radiation data; then for those dates, thesimulation will use the simple ET model.Information Source:❍ Experimetal data.❍ Literature.Uses:❍❍The Priestley-Taylor ET model .The Penman-Monteith ET model .Priestley-Taylor ConstantEvapotranspiration model parameterParameter Model Usual range UnitsPriestley-Taylor constantSimple ET modelPriestley-Taylor1.2-1.3 -Aridity factor for VPD Priestley-Taylor 0.0-0.1 kPa -1Wind measurement height Penman-Monteith 1.5-10.0 meterThe Priestley-Taylor constant is a proportionality factor that compensates for the elimination of theaerodynamic component of the Penman Monteith model.This constant is required by the Priestley-Taylor and the simple ET models. Priestley and Taylorexperimentally derived an average value of 1.26 for this constant in short grasses and humidconditions. The constant should be increased for arid and semi-arid climates. This is adjusted bythe model during execution depending on the value of the vapor pressure deficit for eachsimulation day.Information Source:❍ <strong>CropSyst</strong> allows the user to experiment with different Priestley-Taylor constant valueswhich tends to depend on local conditions and crop.
Aridity factor for VPDA constant used in the computation of maximum daylight vapor pressure deficit (Dx). The value ofDx is predicted from maximum and minimum temperature with the assumption that the air cools todew point temperature every night. This assumption is not met well in arid areas. The aridityfactor, with values fluctuating between 0 to 0.1 kPa -1 , helps to correct for the deficiency.Information Source:❍ This value can be fit using ClimGenRatio of daily to maximum VPDDaily mean vapor pressure deficit (VPD) is required for daily adjustments of the Priestley-Taylorconstant. Because the Simple and Priestley-Taylor models do not have observed daily mean VPDavailable, this is calculated as a fraction of the VPD maximum for the day which is estimated fromtemperature data. Values of the ratio of daily mean to maximum VPD range from 0.5 to 0.6 ashumidity of the site increases from arid to humid.Information Source:❍ This value can be fit using ClimGenB value for solar generation (summer and winter)This value is required to estimate solar radiation from temperature when using the Simple ETmodel. A value of 0.3 for summer and 0.2 for winter are good values for many locations the rangeof values are a function of latitude.Information Source:❍ This value can be fit using ClimGen
WindWind parameters are used by the evapotranspiration model. When daily windspeed values are notavailable, generalized values can be provided for the ET models.Wind measurement heightThis value is the height (in meters) that the wind speed measurements have been taken. ThePenman-Monteith equation calculates a turbulent transport resistance for vapor exchange which isdependent on wind speed.Values of temperature and humidity should be corrected to the same height of wind measurements.Characteristic wind speedWhen real wind speed data is not available, select the characteristic wind speed for the area, orspecify an average daily value.
Weather files organizationIt is recommended that weather files be organized using a DOS hierarchical subdirectory structure bylocation. MS-DOS has limitations on the number of files that can be stored in subdirectories(particularaly on floppy disks). By proper disk management, problems of files storage can be avoided.For example, subdirectories could be organized by country, state/provence, county, recording site. I.e.:D:\WEATHER\USA\WASHINGTON\WHITMAN\PULLMAN\PALOUSE\COLFAX\YAKIMA\KITTITAS\OREGON\CANADA\BC\PENTICTIN\GRACE
Daily weather FilesWeather files are text files that are created and manipulated by any text editor that the user may haveavailable (such as EDIT.EXE) There is a special integer binary format which uses 10 times less spacethan the text file format. The Universal Environmental Database utilities can be used to convert filesto/from this format.Text file formatThere must be one file for each year of interest following the <strong>CropSyst</strong> daily weather text file namingconvention.The weather text files have the following characteristics:● Each line represents one day of data.● There must be either 365 (or 366 for leap year) lines.● Depending on the format used, all column entries must be provided.● If data for precipitation or max/min temperature is missing from the original data set for a day, itmust be estimated. Missing solar radiation, relative humidity, or wind speed can be representedwith 0.0.● The day of year number must be an integer.● All other numbers may have integer or real number format.● The file must be sorted by day of year.● There must be at lease one space or tab between each number.The weather files may have one of the following formats depending on available data andevapotranspiration model to be used.1. Day of year, precipitation (mm), max temperature (C), min temperature (C); i.e.2.1 0 7.3 4.4 2 0 6 4 3 6 9.6 3 : : : : : : : :Day of year, precipitation (mm), max temperature (C), min temperature (C), Solar radiation((MJ/m²)/day); i.e.1 0 7.3 4.4 2 2 0 6 4 2.1 3 6 9.6 3 2.1 : : : : : : : : : :3. Day of year, precipitation (mm), max temperature (C), min temperature (C), Solar radiation((MJ/m²)/day), Max Relative humidity (%), Max Relative humidity (%), WindSpeed (m/s);i.e.1 0 7.3 4.4 2 96 86 1.4 2 0 6 4 2.1 95 84 0.8 3 6 9.6 3 2.1 98 82 3.1 : : : : : : : : : : : : : : : :
Output report format editor<strong>CropSyst</strong> is designed to support a number of variable output options. The runtime graphs provide quickvisual feedback on the progress of the simulation; however, for more detailed information, <strong>CropSyst</strong> canoutput about 200 different computed variables in a user definable format. There are three types of outputvariables:● Daily variables computed each day.● Yearly or Annual variables provide an annual summary of values accumulated throughout thecalendar year.● Harvest variables provide harvest yield and relevant crop and soil conditions at harvest timeaccumulated throughout the growing season.● The current soil profile can also be printed for selected dates.Output reports are formatted as Excel spreadsheets. The spreadsheet files contain four rows of titleinformation, and five rows of column headers with the remaining rows as data. The soil profile outputshows the soil profile parameters by sublayer followed by the detail lines, one line for each reported datewith the values for each profile variable spread to the right.The Simulation/Options menu provides an option to automatically convert the spreadsheets to text fileversions after the simulation is run. (Not currently implemented)Daily, Harvest and Annual reportsEach report (daily, yearly, and harvest) may have a different format. For example, the daily report maybe formatted without headers while the annual and harvest reports might be formatted for printing withthe headers. Report format selection can be saved and used again for other simulation runs.
General layout optionsCurrently the report header and pagination options are disabled in the Windows version. These will bereenabled in a future versions.Report headerFor the text file output, the user may enable or disable the generation of the title.When the report header option is enabled, four lines will be printed at the top of the report:● An indicator of the report (I.e. daily, yearly, harvest report).● The description line of the simulation parameter file.● The description line of the location parameter file for the simulation.● The description line of the soil parameter file for the simulation.Column headersFor the text file output, the user may enable or disable the generation of the column headers.With the column headers option enabled, the columns of output will be labelled at the top of the reportfollowing the report header (if activated). Four lines of text plus a blank line will be printed. (In thespreadsheet file, the blank line is omitted.)
To reduce waste of space, some column header labels may be abbreviated.PaginateThis option currently is not activated. For the text file output, the user may enable or disablepagination. With the pagination option enabled, the report file will have embedded form feed charactersfor page breaks. If the report header and/or the column header options are activated, the respective headerwill be printed at the top of each page. The user may specify the number of lines that will be printed on apage before the page break is made.Separate yearsThis option currently is not available With the separate year option activated (available only on thedaily report), each year of daily output will be placed in a separate file. In this case, the report files willbe named with the name of the simulation parameter file name, and a 3 digit extension consisting of thelast three digits of the simulation year. The daily report (.XLD) for every day of the simulation will notbe recorded.Output time stepThe user may restrict the amount of information printed in the daily report by specifying a time stepinterval. For example, to print a detail line only every 5 days, enter 5 for the time step. The time step isreset on the first day of each year. For example, with a time step of 5, January 5, will always be the firstdetail line of the year.Variable selectionThe user may select the variables to appear in the output file in any order. For each report, the user ispresented with a list of variables available in the report. The user simply: selects the variable to beprinted, selects the position in the report and presses the [Insert] button in the dialog box. There may bevariables listed that are not yet available in the current version of <strong>CropSyst</strong>. These will be markedaccordingly. If these variables are selected, they will not appear in the report. Variables that have alreadybeen selected for output are check-marked. The user may also edit the format by removing a selectionwith the button [Delete], replacing a selection with the button [Overwrite] or appending the selectedentry with the button [Append].Balance selectionsThe check boxs for balances will provide output of a set of variables related to the balance of variouschemicals:Nitrogenincludes nitrate, ammonium, organic matter and nitrite.Salinityincludes the generalized salt profile.Pesticide
includes a balance for each chemical enabled in the simulation control.The balance variables appear in columns that are to the right of the individually selected variables.Soil profileFor output to the soil profile report, dates to be output must be selected. There are two options forselecting profile dates. Either or both options may be used using either option will enable the soil profileoutput generation.Selected datesOn the soil profile dates window, simply click on the [Add Date] and [Delete Date] buttons to addor remove dates from the list.TimestepA time step number may be entered to print the profile at a daily interval corresponding.If the time step is 0, a soil profile will only be generated for any specifically selected dates. Thistime step is unrelated to the daily report time step.
Output report format editor DOS versionnotesUnlike the Windows version, the DOS version of <strong>CropSyst</strong> places the output files in the current workingsimulation directory. All the output files will have the same name as the simulation file that was run.Both Excel spreadsheets and optionally DOS text files may be generated.The following extensions are distinguish the files:ExtensionExcel Text Description.XLD .DLY Daily report.XLH .HRV Harvest report.XLY .YLY Yearly/Annual report.XLS .PRF Soil profile reportIn the text version of the soil profile, output is the same as the runtime soil profile screen.The soil profile is always output to both a text file and a spreadsheetWater balance accumulationFor accumulated variables from the water balance, the values may either be accumulated for the year orjust for the growing season. Yearly accumulations should be used when checking the water balance.Growth period accumulations should be used for other purposes such as comparing with experimentaldata.Converting report spreadsheets to text filesWhen running the <strong>CropSyst</strong> simulation under the parameter editor environment, the spreadsheet files areconverted to text after the simulation run. When not working within the <strong>CropSyst</strong> parameter editorenvironment, the utility WKS2TXT can be used to produce text files. the format option will be used tocustomize the text file so that it may be suitable for a printed report or imported into another applicationsuch as a database program or some other simulation.
Arc <strong>CropSyst</strong> CoöperatorThe Arc <strong>CropSyst</strong> Coöperator is simulator environment extension in the <strong>CropSyst</strong> Suite of programswhich facilitates GIS based spatially oriented simulation capabilities to the <strong>CropSyst</strong> simulation. TheCoöperator is designed to work with database files generated by Arc/Info or ArcView GIS software. Inparticular it uses the Polygon Attribute Table files produced by either Arc/Info or Arc/View.The Coöperator uses <strong>CropSyst</strong> parameter files which have been associated with polygons in Arc/Info orArcView coverages to generate and run a set of simulations to produce a new Polygon Attribute Table of<strong>CropSyst</strong> output variables which can be used by Arc/Info or ArcView to produce maps of the <strong>CropSyst</strong>outputs.● How do I use the Arc-<strong>CropSyst</strong> Coöperator?● What is Arc/Info?● What is ArcView?● What is a Polygon Attribute Table?● What is a coverage?● How do I organize my parameter files?
How to use the Arc <strong>CropSyst</strong> CoöperatorThere are five main steps to prepare a Coöperator project and performing the analysis.(Watershed simulation projects have additional steps .)1.2.3.4.5.Prepare a combined simulation map polygon attribute table.Prepare a set of <strong>CropSyst</strong> simulation parameter files.Create and run ArcCS simulation project file.Use the ArcCS analysis tools with the results of the ArcCS simulation run.Use the GIS software to display the results.Using GIS software such as Arc/Info or ArcViewUsing <strong>CropSyst</strong>
Using the ArcCS project editorThe project editor is used to setup Arc <strong>CropSyst</strong> Coöperator and Watershed simulation projects.What is needed to prepare a Coöperator/WatershedprojectBefore you can create a Coöperator or Watershed project you first need a combined simulation polygonattribute table prepared using GIS software. You will also need a set of <strong>CropSyst</strong> parameter files and a<strong>CropSyst</strong> report format file.MapsThe maps page of the project editor specified the coverages to be used for the simulation.1. Click on the file name button labelled: "Arc/Info polygon attributes table (PAT.DBF) of combined
2.3.4.5.coverage" and select the the PAT.DBF file of the combined simulation map prepared using theGIS software. In Arc/Info this file is stored in the subdirectory having the same name as thecoverage. In most situations this, should never have to be edited and can be used immediately afterthe overlay operation that creates the combined simulation map.Once the PAT file is selected, a number of additional input fields will be displayed in the projecteditor "Maps" page.In the combobox labelled "Select proper polygon ID attribute from PAT" select the name ofattribute corresponding to the column that uniquely enumerates the combined simulation mappolygons. This attribute will have the same name as the combined simulation map with "_ID"appended to it, and will usually be the fourth entry in the combobox.Click on the filename button labelled "Simulation template file". This simulation control file mustbe a working simulation control file.Mark the check boxes for the various maps that were included in the combined simulation map.Selected maps will display a combobox. In each of the comboboxes, select the polygon attributetable for the columns containing the respective polygon code/filename or value.Output
The output page is used to specify the <strong>CropSyst</strong> report format file that selects the outputs from thesimulation of each polygon. From these selected variables, statistical analysis can be performed and theresults will be output to a new polygon attribute table that can be used to visualize the results using theGIS software.For harvest variables, there is an option to separate tallied variables by crop ("Separate by crops"). Youwill probably always want to check this option when dissimilar crops are used in the rotation. In orderfor the "Separate by crops" option to work properly, it is imperative that the description field in all cropparameter files it filled in and supplied with a unique description.The output files that are produced by the Coöperator are detailed in Coöperator outputs.RunThe run window is not yet fully implemented. Currently you can only select to run all the polygons or asubset of polygons whose ID is between the specified range.In the future it will be possible to select a subset of polygons based on values of the various attributes inthe polygon attribute table. This will be useful to perform analysis on a subset of polygons with out
having to run all the polygons.AnalysisThe analysis tools available in the Analysis page are futher detailed in Using analysis tools.Running the simulationBefore you can start the simulation, you must complete the Maps page and the Output page .To start the simulation, press the [OK] button.Once the simulation is started you can abort the run by pressing the [Cancel] button.
Questions●●What is a "combined simulation map".What is a "polygon attribute table".
Preparing parameter filesThe parameters files used in the Arc <strong>CropSyst</strong> Coöperator and Watershed simulations are normal<strong>CropSyst</strong> parameter files.You will need to have all the parameter files that may be specified in the combined simulation mappolygon attribute table. Any parameter file that is missing will cause the Coöperator or Watershedsimulator to skip the run and tally of that polygon since the simulation will assume the polygon to be an"offsite" area.Simulation control templateA simulation control file must be created which will serve as the template by which the Coöperator andWatershed simulator will generate simulations for all the polygons specified in the combined simulationmap polygon attribute table.You should run the <strong>CropSyst</strong> simulation on this template .SIM file to make sure the simulation will runcorrectly and insure that the paths of the file names (soil, crop, management, location, and daily weatherfiles) are all correct. Indeed you will likely use this template simulation control file when calibrating yourcrop files.The Coöperator and Watershed simulator uses the filenames specified in the simulation control file toconstruct new simulation files for the polygons that are simulated. It preserves the filename paths,replacing the file name part with the respective code/filename from the associated attribute in thecombined simulation polygon attribute table.If a map option in the Coöperator project is not selected (I.e. "Soils mapped" is not selected), thefilename is simply copied from the simulation template file and all the simulations will use the same (I.e.soil) file.Consequently if your template simulation file can be run succesfully under <strong>CropSyst</strong>, it should work finefor the Coöperator project.Report format fileYou will need to create a report format with <strong>CropSyst</strong> output variables selected with which you mightwant the Coöperator or Watershed simulator to perform statistical analysis or advanced analysisfunctions. Because the Coöperator or Watershed simulator could potentially create hundreds ofsimulations runs, it is recommended that your report format not include daily variable selections oroutput soil profiles. The daily reports are not used for the simulator's analysis functions anyway.The yearly format must include the "Year" output variable.If you select harvest variables analysis to be "Separated by crop" you must selected the "Cropname/description", "Planting date (YYYY.JJJ)" and "Maturity date (YYYY.JJJ)" variables the in theharvest report format.
Note that only the numeric fields are available for analysis functions. But there is no restriction on thevariables that may be selected for output, other than the required variables. The required variables maybe positioned in any order the the report format.Note that if you change a report format used in a Coöperator or Watershed project, you will need torerun the simulation project in order for the analysis to correctly locate the new variables in thesimulation output.Questions●Where should I put the parameter files.
Organizing parameter filesAs with any <strong>CropSyst</strong> simulation, their is no restriction on the directory organization. However, in orderfor the Coöperator or Watershed simulator to locate component parameter files, all files of a given typemust be stored in the same directory. I.e. all soils files will need to be in the same directory, all locationsfiles must be together in the same directory. This is because the simulator composes the soil and locationfilenames from the respective filenames specified in the simulation template file.It is recommended that you create a separate directory for each simulation project. The simulator project(.ACS) file will need to be located in this directory.It is recommended that the simulation template be located in the same directory as the project (.ACS)file, but this is not a requirement.Questions:●●What is a Coöperator/Watershed project (.ACS) file?What is a simulation template file?
GIS Coverages/ThemesA GIS Coverage is a Arc/Info parlance for a map or map layer. ArcView refers to these map entities asthemes.In the Context of a Arc <strong>CropSyst</strong> Coöperator project, one or more coverages may be needed. These aredigitized or generated using GIS software.SoilThe polygons in the soil coverage will be associated with <strong>CropSyst</strong> soil parameter files. You willalmost always want to specified at least the soil coverage. The soil coverage might be omitted ifthe simulation is to use a single soil type.Weather regionThe polygons in the weather region coverage will be associated with <strong>CropSyst</strong> location parameterfiles (and their associated daily weather files). This coverage may be desired if the study area hasmore than one different weather pattern (I.e. serviced by multiple weather stations). The weatherregion coverage can be omitted if there are no regional weather variations in the study area.Cropping systemThe polygons in the cropping system coverage will be associated with <strong>CropSyst</strong> rotation files. Thiscoverage will be needed to specify different crop rotation or management practices I.e. differentcrops or management in different fields or study plots represented in the map. This coverage canbe omitted when the same cropping system is applied to entire study area.In addition to these principle coverages you may also want to create a map of soil steepness, initialnitrate, or initial plant available water. Often, these parameters follow the same polygon boundaries asthe soil map,; so instead of redigitizing a map, it may be convenient to simply add a new attribute columnto the soil coverage polygon attribute table.These coverage are combined using the GIS software to produce a single combined simulation mapcoverage/theme which serves as the input to the Coöperator and Watershed project.In the case of Watershed projects, the combined simulation map theme will need to be converted to agrid .Questions●●What is a Polygon Attribute Table?How do I prepare a combined simulation map?
Polygon Attribute TableThe following tables show a portion of a polygon attribute table that was used in an ArcCS project.This table was produced by an Arc/Info overlay operation in which a map of soils and a map of weather locations wereoverlayed to produce a combined simulation map with this respective table. The Arc/Info IDENTITY command was use toproduce a combined simulation map.Polygon attribute tables always have at least four attributes or table column labels.● AREA and PERIMETER are computed by the GIS software. These are not currently used by the Coöperator orWatershed simulations.● There will be an attribute having the same name as the coverage with an underscore "_" concatenated. (For exampleif the name of the coverage is SOIL, the attribute will be named SOIL_). The unique numbers in this columnenumerate each polygon. This number is assigned as polygons are identified by the GIS software.● There will be an attribute having the same name as the coverage with an underscore "_ID" concatenated. Thisnumber is assigned either by the user or by a GIS command that generated the map coverage. This number is notunique. In this example, in the soil map the number is used to identify the type of the soil found in the polygon notnecessarily a unique identifier of the polygon. However, in the COMBSIM coverage which is generated by theIDENTITY command, the COMBSIM_ID will be unique. This column will be used by the Coöperator andWatershed simulations to organize simulations and output files generated by the simulations. (You can also useCOMBSIM_, but we recommend using the COMBSIM_ID field for consistancy).In addition to these four attributes which are always present in the table, there will very likely be other attributes containinguser supplied information. The user can add any number of such attributes. In this example the soil map has the field SOILand the weather region map has the field LOCATION. These fields correspond in this example to codes used to identify<strong>CropSyst</strong> parameter files associated with the respective polygons. You will need to add such attributes to your coveragesand assign the respective code/filename to each polygon.For polygons which are not intended for simulation, any code/filename for which there is no corresponding <strong>CropSyst</strong>parameter file will cause the Coöperator or Watershed simulation to omit the polygon from the simulation (this is not anerror condition, but such polygons will be noted in the simulation log). In this example, the codes UNKNOWN, URBAN,INDUSTRIAL are used in the soil map to identify polygons with no soil data. No soil files are created having these filenames, so any polygons thusly named with be omitted from the simulation. Blank entries will also be excluded.Note that there will be a polygon (Usually the first entry in the table) with a negative area. This is the rectangular polygonbounding the extent of the coverage. This polygon should usually be assigned an UNKNOWN code.Combined simulation map (COMBSIM) polygon attribute table (extract).AREA PERIMETER COMBSIM_ COMBSIM_ID REGION_ID LOCATION SOIL_ID SOIL-1576586000.000000 224853.900000 1 0 0 0 UNKNOWN269391500.000000 245091.500000 2 1 1 paderna 0 UNKNOWN765547.400000 6171.758000 3 2 1 paderna 1 URBAN46941.510000 1028.909000 4 3 1 paderna 2 CAS1517171.300000 4276.688000 5 4 1 paderna 3 CAS19337191.000000 13752.080000 6 5 1 paderna 4 CAS11454818.000000 11556.710000 7 6 1 paderna 5 INDUSTRIAL: : : : : : : :151128800.000000 206153.800000 68 67 2 modena 0 UNKNOWN5603472.000000 11995.560000 69 68 2 modena 64 RSD12689567.000000 9137.461000 70 69 2 modena 65 CAS1
6940745.000000 21426.680000 71 70 2 modena 66 SMB2: : : : : : : :This is only a portion of an actual table which had may hundered polygons. There will also be columns SOIL_ andREGION_ carried from the overlay operation which are not used by the Coöperator or Watershed simulations.Soil map (SOIL) polygon attribute table.AREA PERIMETER SOIL_ SOIL_ID SOIL-1576586000.000000 224853.900000 1 0 UNKNOWN3529891500.000000 245091.500000 2 0 UNKNOWN543447.400000 6171.758000 3 1 URBAN64441.510000 1028.909000 4 2 CAS1134171.300000 4276.688000 5 3 CAS13457191.000000 13752.080000 6 4 CAS15464818.000000 11556.710000 7 5 INDUSTRIAL: : : : :346128800.000000 206153.800000 40 0 UNKNOWN1243472.000000 11995.560000 41 64 RSD11234567.000000 9137.461000 42 65 CAS13452745.000000 21426.680000 43 66 SMB2: : : : :Weather region (REGION) map polygon attribute table.AREA PERIMETER REGION_ REGION_ID LOCATION-1576586000.000000 234224853.900000 1 05245824900.000000 435245091.500000 2 1 paderna634568-908.000000 656406153.800000 3 2 modenaQuestions●●●How do I create combined simulation maps.How can I tell which which polygons were not simulated.How can I view the simulation log.
Creating combined simulation mapsIn this simple example there are three maps to be combined: Location, Cropping system and Soil.The procedure for overlaying component maps to produce the combined simulation map is detailed in the ArcCS manualPolygon attribute tablesTheir polygon attribute tables will look similar to the following:Note that the association of the filename/code can be made as each of the component polygon attributes tables are created. You may find it moreconvenient to create code tables associating _ID fields with the filename/code and join these tables to the final combined simulation polygonattribute table as explained in the ArcCS manual.Location polygon attribute table (LOC\PAT.DBF)AREA PERIMETER LOC_ LOC_ID LOCATION-5.000 12.0 1 0 OFFSITE1.8523 7.8 2 1 LOWTON2.1477 8.1 3 2 MIDTONSoil polygon attribute table (SOIL\PAT.DBF)AREA PERIMETER SOIL_ SOIL_ID SOIL-5.000 12.0 1 0 OFFSITE0.124 2.5 2 1 SOIL12.01 8.5 3 2 SOIL2
1.93 6.7 4 3 SOIL30.87 3.9 5 2 SOIL2Rotation polygon attribute table (ROT\PAT.DBF)AREA PERIMETER ROT_ ROT_ID ROTATION-5.000 12.0 1 0 OFFSITE0.8 16.96 2 1 FALLOW1.0 4.0 3 2 BRLYWWHT1.0 4.0 4 3 SWHTPEAS0.15 1.373 5 4 CORN0.15 1.373 6 5 CORN0.15 1.373 7 6 CORN0.15 1.373 8 7 CORN0.15 1.373 9 8 CORN0.15 1.373 10 9 CORN0.15 1.373 11 10 CORN0.15 1.373 12 11 CORNDuring the overlay operations, the polygon attributes tables from each of the component maps will be joined to produce a polygon attribute tablefor the combined simulation map that resembles the following:Combined simulation polygon attribute table (COMBSIM\PAT.DBF)AREA PERIMETER COMBSIM_ COMBSIM_ID ROT_ ROT_ID ROTATION SOIL_ SOIL_ID SOIL LOC_ LOC_ID LOCATION-5.000 12.0 1 0 0 1 OFFSITE 0 1 OFFSITE 0 0 OFFSITE0.46 12.32 2 1 2 1 FALLOW 3 2 SOIL2 2 1 LOWTON0.06 0.534 3 2 5 4 CORN 3 2 SOIL2 2 1 LOWTON0.11 1.232 4 3 5 4 CORN 2 1 SOIL1 2 1 LOWTON0.02 0.023 5 4 5 4 CORN 2 1 SOIL1 3 2 MIDTON0.01 0.043 6 5 5 4 CORN 3 2 SOIL2 3 2 MIDTON0.17 2.946 7 6 2 1 FALLOW 3 2 SOIL2 3 2 MIDTON0.14 1.32 8 7 2 1 FALLOW 2 1 SOIL1 3 2 MIDTON0.01 0.023 9 8 6 5 CORN 2 1 SOIL1 3 2 MIDTON0.14 1.372 10 9 6 5 CORN 3 2 SOIL2 3 2 MIDTON0.14 1.325 11 10 3 2 BRLYWWHT 3 2 SOIL2 3 2 MIDTON0.73 2.953 12 11 3 2 BRLYWWHT 4 3 SOIL3 3 2 MIDTON0.12 1.126 13 12 2 1 FALLOW 2 1 SOIL1 2 1 LOWTON0.12 1.382 14 13 7 6 RLYWWHT 3 2 SOIL2 2 1 LOWTON0.02 0.008 15 14 8 7 WHTPEAS 2 1 SOIL1 3 2 MIDTON0.13 1.532 16 15 8 7 CORN 3 2 SOIL2 3 2 MIDTON0.37 0.065 17 16 8 7 CORN 4 3 SOIL3 3 2 MIDTON0.21 1.433 18 17 2 1 FALLOW 4 3 SOIL3 3 2 MIDTON0.02 0.042 19 18 2 1 FALLOW 3 2 SOIL2 3 2 MIDTON0.19 2.983 20 19 4 3 SWHTPEAS 4 3 SOIL3 3 2 MIDTON0.01 0.009 21 20 8 7 CORN 3 2 SOIL2 3 2 MIDTON0.15 1.373 22 21 9 8 CORN 3 2 SOIL2 2 1 LOWTON0.10 1.369 23 22 10 9 CORN 3 2 SOIL2 2 1 LOWTON0.05 1.034 24 23 10 9 CORN 4 3 SOIL3 2 1 LOWTON0.06 0.824 25 24 2 1 FALLOW 4 3 SOIL3 2 1 LOWTON0.29 2.132 26 25 4 3 SWHTPEAS 4 3 SOIL3 2 1 LOWTON0.29 2.459 27 26 4 3 SWHTPEAS 5 2 SOIL2 3 2 MIDTON
0.15 1.373 28 27 11 10 CORN 3 2 SOIL2 2 1 LOWTON0.15 1.434 29 28 12 11 CORN 3 2 SOIL2 2 1 LOWTON0.21 1.921 30 29 4 3 SWHTPEAS 3 2 SOIL2 2 1 LOWTON0.13 1.725 31 30 3 2 BRLYWWHT 5 2 SOIL2 3 2 MIDTON0.03 0.063 32 31 7 6 CORN 2 1 SOIL1 2 1 LOWTONThe overlay operation effectively generates all possible simulation scenarios that appear in the map.
ArcCS outputsA number of output files will be produced. The first two dBase tables listed here are compatible withArc/Info and ArcView.● A database file containing the tallied output of the yearly reports named Yxxx.dbf where xxx is thesame of the project. Each record in this database table corresponds to the tallied variable. Theattribute/colume name is an acronym of the full variable name as display in the report formateditor, shorted to conform to dBase attribute naming conventions. The attribute name will beprefixed with AV for the average tally, CV for the coefficient of variation, or the 2 digit percent ofprobability.● A database file containing the tallied output of the harvest reports named Hxxx.dbf where xxx isthe same of the project. If the "Separate by years" option is selected for the harvest report, a dBasetable for each crop will be output instead of the Hxxx.dbf files. These files will be namedaccording to an acronym derived from the respective input crop parameter file description. This iswhy all crop files must be given a description in order to use the "Separate by years" option.● A simulation file will be created for each polygon that was simulated. The same of the simulationfiles will correspond to the polygon ID number from the polygon attribute table. This file can beuse to run an individual simulation if needed. (You will need to copy the respective templaterotation file to a file with the matching simulation name (polygon number) and .ROT extension).● A subdirectory name results will be created in the same directory as the project (.ACS) file. Thiswill contains <strong>CropSyst</strong> (daily, harvest, fallow,annual) report files with variables as selected in thereport format file. Only reports for the first simulation of each unique combination of inputparameter files will be generated since duplicate parameter file combinations would give identicalresults. The simulator optimizes run time by assembling tallies from the from equivelent files.●These files will be useful to check that the simulation ran correctly and are giving correct resultsfor the exemplar locations.A file results\equiv.equ.This file (which you will find in the results directory) is produced by the ArcInfo <strong>CropSyst</strong>Coöperator (in fairly recent versions of <strong>CropSyst</strong>), is used by the Coöperator to optimize thetallying of statistics for polygons with identical simulation conditions. (This file does not apply toWatershed simulations.The Coöperator used to keep copies of all the (often duplicated) output files to be run through thestatistical analysis after all the simulations were run. With this file it now only needs to keep theoutput from the actual polygons that were run. This can save many megabytes of disk space.The file might be useful if you wanted to see the output of the simulation of a particular polygonthat was 'optimized' by the Coöperator.The first number of each entry is the polygon ID, followed by an '=' followed by the equivalentpolygon number. If the equivalent polygon number is -1 a simulation was run for the polygonotherwise the polygon as the equivalent simulation conditions as the specified previously runpolygon ID.
So simply look up the polygon ID, if the equivalent number is -1 then there will be output (report)files stored in the results directory. If it is a positive number then the output files named using thisequivalent polygon number would have the same results as the polygon of interest.
Error log fileA detailed error log file (errors.txt) is generated as the Cooperator project is run.The following information is recorded in this file:● Each generated polygon simulation to be run is validated and any errors are record in this file.● If a parameter file specified in the combined simulation map polygon attribute table is not locatedThe warning "ID:999 Unable to open file:xxxx.xxx" will appear in the log, but this is notspecificially an error.
Using analysis toolsThis window provides some extended analysis the can be performed after the Cooperator project hasbeen run. The results from these analysis will be displayed using MicroSoft Excel spreadsheet program,and stored in the file results\notes.xls.View water holding capacity for all soilsThis operation can be done at any time (Even before the run) once the Maps page has been filledout.This function reports for each soil encountered in the combined simulation Polygon AttributeTable:❍ A polygon which will be run in the simulation representative of the soil.❍ The depth of the lowest horizon (last layer) of soil profile.❍ The water holding capacity at the lowest horizon.❍ The water holding capacity a 1 meter depth.If there is no soil map specified, only the one soil in the simulation control template file will bereported.Perform analysis for probability distributionThis is a special in-house function that is not documented at this time. If you need to createprobability distribution graphs please contact us for further details rnelson@mail.wsu.eduThe output files will be found in the results directory❍ AVG_YLY.XLS❍ AVG_HRVx.XLS (one for each crop in the rotation)
Visualizing Coöperator outputsOnce the simulation runs are completed, several polygon attribute tables will be generated by theCoöperator.These tables are compatible with both Arc/Info and ArcView. While maps showing the simulation resultscan be created using Arc/Info, the process is significantly easier using ArcView.The polygon "_ID" attribute of the combined simulation map will be included in the table which will allowthe table to be joined to the combined simulation map polygon attribute table so the table can be use toproduce maps of the results of the simulation.Visualizing using ArcView1. Start ArcView.2. Open the project that was used to create the combined simulation map.3. Select the Tables icon in the project window.4. Click on the [Add] button.5. Use the file requestor to select the output table files generated by the Coöperator. (You will findthese in the same directory as your .ACS project file.) You can add all the tables at this time.6. In the table you wish to visualize, click on the combined simulation polygon ID field. The button atthe top of the table display will become highlighted.7. Go back to the project window.8. Open the view containing the combined simulation map.9. Select the combined simulation map theme.10. Select the menu Theme/Table.11. The polygon attribute table for the combined simulation map.12. Click on the combined simulation polygon ID field. This will usually have the same name as thepolygon ID fields in each of the generated tables (If you followed the prescribed steps in generatingthe polygon attribute table).13. Select the menu option Table/Join. The attributes from the generated table will be added to thecombined simulation polygon attribute table.14. Click here to see an example of the Join operation in ArcView15. Go to the combined simulation map view window, select the map theme, and use the menu optionTheme/Edit legend.16. Use the legend editor to color the map:❍ Usually the Graduated color option is most suitable for visualizing these kinds of outputvariables.❍ Select the table attribute (Classification field) that corresponds to the variable to bevisualized.❍ You will probably want to reclassify the range of variable values.
17.18.❍ You will probably want to change the symbol colors and legend range texts❍ Use the color ramp button to produce a smooth graduated color scale❍ It is highly recommended that you select a range of values that will be used to displayconsistently in all output maps in a set.❍ You can save your legends and load them into other similar views you may create.❍ When you close the legend editor the map will be colored based on the selected outputvariable.❍ Click here to see an example of the legend editor in ArcViewYou can create new views and/or add the same combined simulation map theme and create a legendfor each variable to be visualized.Use the facilities of ArcView to produce layouts or perform additional spatially oriented analysisusing the attributes joined from the Coöperator output tables.The following is an example of map showingnitrogen leaching
Watershed wizardThe Watershed wizard is a <strong>CropSyst</strong> component to help create watershed simulations projects.The Watershed wizard dialog box consists of a set of pages describing each step in preparing and runninga watershed simulation.For each step there is a brief summary of what needs to be accomplished before proceeding to the nextstep.This button will display additional detailed information and/or further instructions for the step.This button will start the editor or launch a program that can be used to complete the step.Note that there are many ways to setup watershed simulation scenarios. The watershed wizardinstructions describe the most common intended methodology. As you become more familiar with<strong>CropSyst</strong>, the Arc/<strong>CropSyst</strong> Coöperator and the watershed project editors you may find other approachesyour simulations.
Utilities<strong>CropSyst</strong> provides several utilities for handling output.Report viewerThis displays the output files from the last simulation run.Graphics viewerA graphing utility is provided to graph daily variables from simulation runs.Standalone validation programA utility for detailed validation of the simulation and included parameter files.
Graphics viewerThis utility is available in the DOS version only. In the Windows version, <strong>CropSyst</strong> outputs a UniversalEnvironmental Database file. This file can be viewed using the UED graphics viewer utility.Graphics viewer functionsThe 'View graphics' file menu option will display daily report file variables from the last simulation run.This graphics display provides detailed graphics and each curve can be displayed separately.All the graphable output variables that have been generated by <strong>CropSyst</strong> in the daily report are availablefor graphics display. Up to four variables can be selected for simultaneous display.A secondary file may be displayed using a background color, thus two daily report data files can becompared against each other graphically. This feature is useful to compare <strong>CropSyst</strong> simulation runsagainst actual field observations (experimental data), or to compare the results of two simulation runs.(The default file extension for an experimental data file is (.EXP)).To setup the output report files for use with the graphics viewer:1. Create/edit a report format using the report format editor.2. Select the variables to be displayed in the graph. (Only variables that can be graphed will appear inthe display. Variables such as dates, crop name, growth stage and most of the accumulatedvariables cannot be graphed. These variables may still be selected and will still appear in the dailyreport.)3. The variables Year' and Day of Year' must also be selected. If these variables are not selected, agraph cannot be generated. The Year' and Day of Year' may appear any where in the reportvariable selection list.4. The daily time step must be set to 1.5. The header, column headers, pagination, and year separation can be either turned on or off.6. Save the report format and run the simulation.Using the graphics display1.2.3.A file requestor is displayed where the primary report data file may be selected. The primary filedata values are graphed using highlighted colors. The report files must be daily reports.Next, a file requestor is display where the report format of the primary report data file may beselected. The report format may contain titles, column headers and pagination. However, if theseoptions are used, the report report data file must have be generated by <strong>CropSyst</strong>. The reportformat must contain the Year and the Julian day of year variables .Next, file requestors are displayed for a secondary report data and report format files. Thesecondary data is graphed using darker color shades. If you don't wish to display data from asecondary data file, simply [Cancel] the secondary file selection.
4.5.6.7.8.9.A window is presented which up to four variables from the primary report may be selected forgraphing at a time.To select the variables to be graphed, click on the respective [Variable] button and click on thevariable name from the list of available variables, then click on the [Ok] button. If a secondaryreport file is used the selected variable must exist in both files in order for graphics to begenerated.Two types of graphs may be generated:❍ The time series graph will draw a continuous curve. If the data file is missing daily values, amarker will be displayed for dates where values are available.❍ The one-to-one comparison graph can be drawn if a secondary file was selected.A color may be selected to graph the variable in. Click on the [Ok] button to graph the selectedvariables.The graphics will remain displayed until the [Return] key is pressed.The variable graph options window is present for selection of other variables to be graphed.
Report viewerThis utility is available in the DOS version only. In the Windows version, you can use the WindowsExplorer to display available files in the simulation output directory. Simply double click on the file iconto view the output file with the associated application.The report data viewer is provided to quickly display the output files generated by the last <strong>CropSyst</strong>simulation run.For each output file (such as the daily, yearly and harvest reports), a window is displayed on the screen.To move around the file, simply click on the scroll bars on the bottom and side edges of the window orusing the cursor keys. Note that the file view can only display the first 255 column of text.Menu options in the Windows menu allow quick organization of the file windows.Additional text files can be displayed by openning a new file from the File menu. Initially the filenamesearch pattern is set to look for all files associated with the last simulation run.The number of files that can be open at a time is limited by available memory.The <strong>CropSyst</strong> output files from a simulation run which are initially loaded by the report viewer are:*.ROT Crop rotation.*.SCH Event schedule.*.DLY Daily report.*.YLY Yearly report.*.HRV Harvest report.Additional files generated by the simulation run which are not opened are separated years daily reportsand soil profile report (*.PRF).
Parameter validationThe validate program can be run outside the main menu environment from the DOS command line or ina batch file. The command is:VALIDATEorVALIDATE filename .SIM The filename is a simulation control file and the .SIM' extension must beprovided. If no file name is specified, the last simulation control file edited with parameter editor (asspecified in the file LASTSIM) will be validated.The validate utility color codes messages as follows:● Blue shows the status of the validation.● Yellow shows warnings.● Red show errors.Status and warning messages can be ignored.When the validation is performed within the parameter editor only warning and error message aredisplayed. Also, warnings and errors which are detected by the input field gadgets, as numbers are typedin to numeric input fields, are not displayed by the validation. Warning messages generally indicate thatthe value entered for a parameter falls outside of reasonable bounds, and may cause invalid data.Warning messages may also be given if the value for the parameter may affect the general appearance ofthe output files.Error messages are given for values that fall outside constrained bounds. Errors must be fixed or<strong>CropSyst</strong> will not be able to properly process the input parameters. Attempting to run the simulation witherrors will probably cause the simulation to abort or even crash.Validate simply displays the error messages. After a warning or an error message is displayed, press[Return] to continue the validation. Validate does not pause when displaying status and informationalmessages. It also does not pause when displaying missing weather file messages. Use the [Pause] key tostop the scrolling of these messages.
Batch run editorThe batch run editor is an optional utility which runs (unattended) a list of simulations. Simulations mayinclude basic simulations and/or advanced simulation modules such as Arc/<strong>CropSyst</strong> Coöperatorsimulations.That batch run editor is only used for running multiple simulations, it is not needed to run a singlesimulation. To run a single simulation, use the 'Run simulation' menu option.At the top of the screen is a file name button for selecting the simulation model program that will be usedfor running the simulations. This is followed by the simulation run list showing the name of thesimulation and the report format file to be used (advanced modules usually have the report formatselection made within the respective module editor so the report format is not displayed in the list forthese entries).Entering simulation runsInitially the simulation run list is empty. To enter a simulation run in the list:1. Click on the simulation button. This will display a file requestor for selecting simulations.Simulations from other directories can be selected by providing the full file path. When eachsimulation is run, the directory containing the simulation file will be set as the current simulationdirectory.2. Click on the report format button. This will list available report formats that can be selected.3. Click on the word 'Insert' in the status line or press the [Return] key. This will enter the selectedsimulation, report file and options into the simulation run list.4. Repeat these steps for each simulation you want to run in the batch file.Editing simulation runsA simulation run can be deleted from the simulation run list by first clicking on the simulation run lineand then clicking on the word 'Delete' in the status line (or by pressing the [Del] key).DOS version notes:In the DOS version, the batch run editor can only run basic <strong>CropSyst</strong> simulations not the advancedsimulation modules that are available only under Windows.When the batch run editor generator is used, the last batch run that was edited will be executed when the'Simulation Run' menu option is selected. The batch run can be executed outside of the menuenvironment by entering the batch file name at the MS-DOS prompt. Saving a batch run file will set the'Simulation Run' menu option to batch run mode. Saving a simulation control file in the parameter editor
will set the 'Simulation Run' menu option to single run mode.The batch run generator generates MS-DOS batch files with commands for running <strong>CropSyst</strong>, printingreports and deleting printed reports. The report printing feature option is not available in the Windowsversion.
DOS version batch run editorLike the Windows version, the DOS version batch run generator allows the user to run (unattended) anumber of simulations (<strong>CropSyst</strong> simulation only) but also has the option to send the output to a printer.The batch editor generates MS-DOS batch files with commands for running <strong>CropSyst</strong>, printing reportsand deleting printed reports. When the batch run generator is used, the last batch run that was edited willbe executed when the Simulation Run' menu option is selected. The batch run can be executed outside ofthe menu environment by entering the batch file name at the MS-DOS prompt. Saving a batch run filewill set the Simulation Run' menu option to batch run mode. Saving a simulation control file in theparameter editor will set the Simulation Run' menu option to single run mode.At the top of the screen is the simulation run list showing:● Print and cleanup options.● Simulation file.● Report format file.Entering simulation runsCreating the simulation run list is similar to the Windows version. Initially the simulation run list isempty. To enter a simulation run in the list:1. Select the desired print and clean-up options. The selected reports in the print options will be sentto the printer. After a report is printed, it may be optionally deleted by selecting the correspondingclean-up option. These options allow the user to minimized disk space requirements. This ishelpfull in simulations where many large reports may be generated.2. Click on the simulation button. This will display a list of simulations that can be selected from thecurrent directory. Simulations from other directories can be selected by providing the full file path.3. Click on the report format button. This will list available report formats that can be selected.4. Click on a line in the simulation list where the simulation run is to be placed.5. Click on the word Enter' in the status line or press the [Return] key. This will enter the selectedsimulation, report file and options into the simulation run list.Editing simulation runsA simulation run can be deleted from the simulation run list by first clicking on the simulation run lineand then clicking on the word Delete' in the status line (or by pressing the [Del] key).Blank lines can be inserted into the simulation run list by first clicking on the simulation run line to bemoved down and then clicking on the word Insert' in the status line (or by pressing the [Ins] key).To replace a simulation run with another, simply select the new print and clean-up options, simulationfile and report file; click on the simulation run to be replaced, and Click on the Enter' word in the statusline.
Tips to using the batch run editorKeep in mind the following when using the batch run editor.● First select the Print and Clean-up options to be used. In most cases you will want all the print andall the clean-up options to be disabled (no X's in the check boxes). When the print options aredisabled, the batch file will not try to print the reports on your printer. When the cleanup optionsare disabled, the batch file will not delete the reports, instead, the report files will be left in thecurrent working directory.● To make an entry in the batch run table:1. Select the report format to be used (right green button).2. Select the simulation file.3. Click on the first blank line at the end of the list of simulation runs4. And click on the word 'Enter' at the bottom of the screen to insert the selected simulationand format.Repeat 2, 3, 4 for each simulation you want to run in the batch file.
Hints & Trouble Shooting:1.CROPSYST validation says there are missing files: Data files may contain references to files anddirectories that might not have the same directory structure as your harddisk. (This may be the caseif you move data files around, copy them from a different machine, or if you run CROPSYST on afloppy disk.) Before these datafiles can be used, the file names may have to be changed:1. Run the CROPSYST menu: CS2. Select the [E]dit parameter option from the menu.3. Edit the location files and change the weather directory name to match your directorystructure and save the location file:4.5.In the parameter editor:■ Click on Location in the menu bar.■ Click on the XXXX.LOC file to be edited.■ Click on Open.■ Click on the Weather directory bar.■ Select the directory containing the weather files.■ Click on ChDir.■ Click on OK■ This will return you to the Location edit window.■ Click on Exit.■ Click on OK to save the file with the name listed in file requestor.Now you need to register the change so that CROPSYST will validate the simulation control(and the respective location file) for you:■ Select the Control menu bar option.■ Click on the simulation control file to be edited (####.SIM).■ Click on OPEN, the simulation control parameter screen will be displayed.■ Check that the location file is correct (make sure that path is correct, especially thedrive designator). If the location filename is not correct, click on the location filename bar, select (click on) the correct location file and click on OK.■ Click on Exit.■ Click on OK; this tells CROPSYST us validate this simulation file and to use thiscontrol the next time the simulation is run.Now exit the parameter editor from the File/Exit menu option. This will validate thesimulation control file displaying any error mesages. Any errors should be corrected beforethe simulation is run. If an error message says that it can not find weather files, make surethat the weather directory is set correctly in the location file. Also make sure that you havecomplete weather files for each year specified in the simulation control parameters forsimulation period.
2.3.6. Now you need to tell CROPSYST which report file format to use when running thesimulation:■ Select the Report format edit menu option.■ In the report format editor, simply select the File|Save menu option■ and simply save the report format with the same name (or a new name).7. Exit the report format editor with the File/Exit.Avoid storing data files in the CROPSYST program directory: It is strongly recommend that datanot be stored in the CROPSYST program directory. That is, you should not run CS while in theCROPSYST directory. It is also advisable not to store data in subdirectories of the CROPSYSTdirectory.Use separate directories for different simulations: CROPSYST generates many data files, it is bestto create separate directories for your similation runs:❍ It is easier to differentiate the files from different simulation runs.❍ It makes removing old data files easier.❍ It makes copying/moving CROPSYST to other drives/computers easier.❍ It ensures that the installation of CROPSYST uptakes goes smoothly.❍ It allows CROPSYST to run be from or on Floppy disks or RAM disks.❍ It allows for better disk management from MS-DOS and provides for easier icon startupsfrom MS-Windows.
Simulation modelThis model is a daily time step model.Mass balancesThe following are the mass balances maintained by the model.● Water balance●●●●Chemical balance for each pesticideNitrogen balanceOrganic matter poolResidue pools
Water balanceThe amount of water used for crop growth can be determined by modeling the components of the soilwater balance. The water budget components considered are: irrigation, precipitation, rainfall interceptedby the crop and surface residue, surface runoff, soil and residue evaporation, infiltration through soillayers, transpiration, deep percolation and water storage in the soil profile.IrrigationIrrigation amounts and timing are either user selected or automatically assigned if the automaticirrigation option is selected. To simulate dryland conditions, irrigations are not scheduled as part of themanagement and the automatic irrigation is turned off. In the current version of <strong>CropSyst</strong>, no runoff orcanopy/residue interception of applied irrigation water is subtracted and, therefore, all irrigation amountsscheduled or calculated are infiltrated into the soil.Precipitation and snowfallPrecipitation is derived from actual daily weather data (or generated daily data). Additionally, for thefinite difference infiltration, 30 minute precipitation events can be generated. Snowfall is estimated fromthe daily precipitation data and temperature.InterceptionWhen precipitation (and/or snow melt) occurs, interception by the crop canopy and interception by theresidue layer are determined and subtracted from the total precipitation leaving the effective amount ofwater entering the soil. The influence of the residue on the water budget is modelled by adding theresidue to the soil surface as a layer which could store and evaporate water ( Bristow et al., 1986 ).When precipitation occurs, and after canopy interception is deducted, the residue layer is filled to itssaturated water content ((4 kg H2O)/(kg Residue)) and then passes the water on to the soil layers.Runoff<strong>CropSyst</strong> can be run with the following runoff options:● No runoff● USDA-SCS curve number method (occurs only with precipitation events)● Numerical method (under the finite difference model) (occurs daily).
Infiltration and soil water storageThe amount of water available for infiltration is the precipitation minus crop canopy and residueinterception, and the surface runoff plus irrigation. Additional adjustments are made for freezingconditions <strong>CropSyst</strong> provides the option for two infiltation models:Cascade model.In this model, it is assumed that there is no water flow upward in the soil profile, so the source ofevaporated water is precipitation and/or irrigation entering the top soil layer.Finite difference model.In this model, water flow may be up or down. Water moving up out of the first soil layer maycontribute to water ponded on the surface (to be entered in following days) and runoff.Surface storage and pondingIn the finite difference model, surface storage is based on soil surface depressional storage. Water thatcannot be infiltrated is ponded to be infiltrated later. In the numerical runoff model, water depth thatexceeds the depressional storage is runoff.Potential crop evapotranspiration<strong>CropSyst</strong> provides two options for the computation of the daily maximum crop evapotranspiration (ET)(m/day)● Priestley-Taylor model ( Priestley and Taylor, 1972 )● Penman-Monteith model ( Monteith, 1965 ).The potential evapotranspiration is partitioned to crop transpiration, soil evaporation and residueevaporation.Residue evaporationActual residue evaporation is based on the water holding capacity and temperature.Soil evaporationActual soil evaporation is based on the soil water content of the first and second soil layers. It is slightlydifferent for the cascade and finite difference models.
Actual transpiration (Crop water uptake)The calculation of actual transpiration follows closely the approach proposed by Stöckle et al., 1992 .
PrecipitationPreciptation is taken directly from the daily weather files. In the case of freezing conditions, theprecipitation may be temporarily stored in the snow pack. Any water melted from the snow pack and/orprecipitation in the form of rain is referred to as effective precipitation in the model which serves as thewater input to the daily water balance.Snow fall and snow pack accumulation and meltingDuring winter seasons in climates where freezing conditions encourage snowfall, <strong>CropSyst</strong> will storeprecipitation as snowfall thereby inhibiting water from entering the soil water budget until thetemperature is sufficient for melting.When the average temperature for a day is less than -1.5 ºC, then any of the precipitation for that day isaccumulated to snow liquid water equivelent.When the average daily temperature for a day exceeds -1.5 ºC, then the snow liquid water equivelent isdepleted by melting as follows:Melt act =Melt⎧ pot⎨⎩if Melt pot < snowwatersnowwater if Melt pot > snowwater0.0 if snowwater = 0.0wheresnowwater (m) is the liquid water equivelent of the snow pack.Melt act (m) is the actual amount of water melted from the snow pack.Melt pot (m) is the potential amount of water that could be melted with the current conditions if thatamount of snow where available:Melt pot = (T avg - 1.0) · 0.0025whereT avg (ºC) is daily average air temperature.0.0025 ((m/day)/ºC) is a degree day melt factor.The snow liquid water equivelent stored in the snow pack is multiplied by a density factor of 5 todetermine snow pack thickness. The snow pack on the ground also affects soil freezing by serving as aninsulation layer.
Net radiationThe net radiation ((MJ/m²)/day) is calculated as the sum of short-wave net radiation (Rad sw ) and daytimelong-wave isothermal (air temperature = canopy temperature) net radiation (Rad lwi ) :whereRad net = Rad sw + Rad lwiRad sw = (1 - Albedo) · Rad solarRad lwi = - (a · Rad solar Rad solarcloudless + b) · ∆Emiss · σ· [ ( T max + 273.1) 4 + (T min + 273.1) 4 ] /2σ(MJ/m²) is the solar constant (4.903x10 -9 (MJ/m²)/day).Rad solarcloudless (MJ/m²) is expected solar radiation on a cloudless day:Rad solarcloudless = Rad pot · 0.75Rad solar (MJ/m²) is the actual measured solar radiation from the .Rad pot (MJ/m²) is the potential solar radiation ( Campbell and Diaz, 1988 ):Rad pot = 117.5 · (h s sin φ sin δ + cos φ cos δ sin h s ) / Πφ (radians) is the location parameter latitude .δ(radians) is the solar declination, computed from the day of the year using ( Campbell,1985 ):h sa = 1.1b = -0.1Emissδ = sin -1 (0.39785 · sin[4.869 + 0.0172 · day + 0.03345 · sin(6.224 + 0.0172 · day ) ] )(radians) is the half day length , calculated from:h s = cos -1 (- tan φ · tan δ)are fitted constants in a term representing cloud effects on sky emissivity.is the difference in longwave radiation emissivity between the crop and a clear sky givenby:∆Emiss = - 0.02 + 0.261 · e (-7.8x10⁻⁴ · T² avg )
Potential evapotranspirationThe potential evaporanspiration models used are two-step approaches, where the potentialevapotranspiration from a reference crop, defined as a short clipped grass, 0.12m high, completelycovering the ground and with plentiful water supply, is multiplied by a crop coefficient to obtain thepotential crop evapotranspiration.Two potential evapotranspiration models. The selection of the model is done automatically, as dataavailable for each day is determined.The simulation can be forced to always select the Priestly-Taylor model irrespective of the available databy specifying the preferred ET model in the location parameters.Priestly-TaylorThis model only requires max/min temperature and solar radiation.Penman-MontiethThis model requires, additionally, max/min relative humidity or dew point temperature and windspeed.The ET models have been abstracted to compute a potential evapotranspiration for a reference crop (I.e.grass) This value (RefET pot ) is then adjusted to give the potential evapotranspiration the current crop (orfallow) as in the following equation:ET pot = RefET pot · K cλwhereRefETis the potential evapotranspiration for a reference crop computed by either thepotPriestly-Taylor or Penman-Montieth model.K c (0-1) is the ET crop coefficient .λ (MJ/kg) is the latent heat of vaporization.In the case of a CO 2 simulation, ET pot is adjusted by the daily ratio of elevated reference CO 2 to CO 2 at350ppm.
Priestly-Taylor evapotranspiration modelThis model is based on the Priestley-Taylor equation:wherePT c · Slope vpf · (Rad net - SoilHeatFlux)RefET pot =(Slope vpf + γ)PT c (kPa) is the Priestley-Taylor constant location parameter .Rad net ((MJ/m²)/day) is the net radiation .Slope vpf (kPa/°C) is the slope of saturation vapor pressure function of temperatureγ (kPa/C) is the psychometric constantSoilHeatFlux ((MJ/m²)/day) is the soil heat flux.
Penman-Monteith evapotranspirationmodelIf daily air temperature solar radiation, maximum and minimum relative humidity (RHmax and RHmin)(or dew point temperature from which relative humidity can computed) and wind speed are available,then the Penman-Monteith equation may be used to calculate potential evapotranspiration.Slope vpf · (Rad net - SoilHeatFlux) + (DayFract · VPD · C va ) / R aRefET pot =Slope vpf + γ · (1 + r c /r a )whereSoilHeatFlux ((MJ/m²)/day) is the soil heat flux.DayFract (0-1) is the fraction of the day that is in daylight.C va ((MJ/m3)/°C) is the volumetric heat capacity of air taken as 1.2x10 -3 .γ (kPa/°C) is the psychometric constant.Slope vpf (kPa/°C) is the slope of saturation vapor pressure function of temperature.VPD (kPa) is the Vapor pressure deficietRad net ((MJ/m²)/day) is the net radiation .r a , r care the aerodynamic and canopy resistances to vapor transfer of the(day/m)reference crop. For a short clipped grass (0.12m height), theses areln((hs - 0.744 · hp) / (0.026 · hp)) ·ln((hs - 0.640 · hp))/(0.013 · hp)r a =0.16 · wsr c = 0.000787034 (this may be adjusted in the case of CO 2 simulation).wherews (m/s) is the wind speed. (Note that wind speed is stored in daily weather files a m/daybut will be converted to m/s).
Vapor pressure deficit (kPa)Vapor pressure deficit (VPD) is the day time mean vapor pressure deficit. calculated from the aday time maxiumum vapor pressure deficit.VPD = VPD max · 0.66Where 0.66 is the ratio of daily VPD max to daily VPD.Maximum VPDThe model will attempt to provide a day time maxiumum vapor pressure deficit based on availabledata:VPD max =⎧⎨⎩VPD dewptmaxif dew point temperature is providedVPD relhumidmax if relative humidity is providedVPD tempmaxotherwise (estimated from temperature)Maximum VPD based on dew point temperatureVPD dewptmax = VP satTmax - VP satDewptmaxMaximum VPD based on relative humidity(Relhumid min)VPD Relhumidmax = VP satTmax · 1.0 - 100Maximum VPD estimated from temperatureVPD parametersVPD Tempmax =VPSat Tmax - VPsat Tmin1 - a · [ VPsat Tmax - VPsat Tmin ]VPsatTmax (kPa) saturated vapor pressure at maximum temperature.VPsatTmin (kPa) saturated vapor pressure at minimum temperature.VPsatDewptmax (kPa) saturated vapor pressure at maximum dew point temperature.
Relhumid min % Is the minimum relative humidity
Common ET equationsThe following equations are common to both ET models.Ratio of crop to reference potentialevapotranspiration (K c )This is the crop coefficient (ratio of crop to reference potential evapotranspiration)={K 1 + (K c ' - 1) LAI / 3 if Kc' > 1 and LAI < 3cKc'otherwisewhereKc' is the ET crop coefficient input parameter.If Kc' < 1 then Kc = Kc'.3.0 Is maximum LAI (LAI max ) of the reference crop.Slope vpf (kPa/ C)is the slope of saturation vapor pressure function of temperature given by the equation:VP sat · 4098Slope vpf =( T avg + 237.3) 2whereVP sat (kPa) is the saturated vapor pressure at average air temperature.T avg(°C). is the average air temperature.VPsatTmax, VPsatTminare the saturated vapor pressure at maximum and minimum air temperature, respectively. Saturatedvapor pressure at any temperature (T) is given by:VPsat T = 0.611 · e[ 17.27 · T / (T + 237.3) ]
λ (MJ/kg)is the latent heat of vaporization derived from average air temperature (T avg °C).λ = 2.501 - T avg · 0.002361SoilHeatFluxthe soil heat flux is simply derived from net radiation:SoilHeatFlux = Rad net · 0.1γ (kPa/°C)is the psychometric constant given by:C p · Pγ =0.622 · λwhereC p ((MJ/kg)/°C) is the specific heat of air (about about 0.001).Pis the atmospheric pressure (taken as 96 kPa).λ (MJ/kg) is the latent heat of vaporization.
Partitioning potential evapotranspirationThe potential evapotranspiration (ET pot ) determined by any of the three ET models requires partitioninginto potential transpiration (usually of a crop or reference plant type) (Tr pot ), potential soil evaporation(EvapSoil pot ), and potential residue evaporation (EvapResidue pot )Potential transpirationPotential crop transpiration in m/day is calculated from:whereTr pot = fractCover green · ET potfractCover green is the fraction of incident radiation intercepted by the crop green leaf area.Potential residue evaporationPotential residue evaporation (m/day) is a function of residue and canopy cover:whereET pot (m/day)EvapResidue pot = fractCover Residue · (1 - fractcover canopy ) · ET potis the potential crop evapotranspiration.fractCover canopy is the fraction incident radiation intercepted by the crop canopy.fractCover Residue is the fraction incident radiation intercepted by the residue, estimated from themass of residue ( Gregory, 1982 ):whereA m (m²/kg)fractCover Residue = 1 - e (-A m · M)is the area covered by one average straw per mass of one averagestraw crop parameterM (kg/m²) is the total residue mass per unit soil area.Potential soil evaporationPotential soil evaporation in (mm/day) is calculated from:EvapSoil pot = (1 - fractCover Residue ) · (1 - fractCover canopy ) · ET pot
Soil evaporationActual soil evaporation is simulated by postulating two stages of drying. During the first stage, theevaporation proceeds at the potential rate until the water content in the top evaporative soil layer reachesthe permanent wilting point (PWP). For second stage drying, the following equation ( Campbell andDiaz, 1988 ) is used:EvapSoil act = EvapSoil pot ·[WC 1 - ADWCPWP 1 - ADWC] 2where:EvapSoil act (m/day) is the actual soil evaporation.EvapSoil pot (m/day) is the potential soil evaporationWC 1 (m³/m³) is the water content of soil layer 1.PWP 1 (m³/m³) is the permanent wilting point water content of layer 1).ADWC (m³/m³) is the air dry water content soil of the top soil layer, estimated as a third of thepermanent wilting point.
Infiltation with the Cascade modelFor the simulation of soil water storage, the soil is divided into layers 10cm (or less) thick. When waterentering a layer fills the layer to field capacity, any excess water goes to the next layer. Water penetratingpast the root zone is lost as drainage.
Runoff simulationsTwo water runoff models are provided:● SCS Curve number approach●A numerical method available when using the finite difference infiltration model (not yetdocumented)
Runoff, after a precipitation event, is calculated using the USDA-SCS curve number approach (USDA-SCS, 1988a ).Runoff is computed as follows:Q = {(R - 0.2 S)2if R > 0.2 SR + 0.8 S0.0 if R < 0.2 SwhereQ (m) is the daily runoff.R (m) is the daily rainfall .S (m) is the a surface retention factor. Fluctuations in the soil water content affect the surface retentionparameter. Corrections for thisS = s i · [ 1.0 -PAW *PAW*)]PAW * + e (w 1 - W 2 ·effect were adapted from Sharpley and Williams, 1990 : wheres_i (m) are surface retention factors for each antecedent soil moisture condition (1,2,& 3) calculated from:s i = 0.0254 ·[1000- 10CN i]CNi is the curve number, dependent on soil, land use, management and slope. The subscript i representsthe antecedent moisture conditions (1,2 or 3) as defined by ( USDA-SCS, 1988a ). CN values (andtherefore s values) are different for each condition. In freezing climates, when soil layer 1 is frozen, CNiis adjusted as a fraction of water-filled porosity in soil layer 1 to simulate infiltration reduction.WC 1CN i = CN i + (100 - CN i ) ·1 - BD 1 / 2.65whereWC1 (m3/m3) is the water content of layer 1.BD1 (g/cm3) is the bulk density of layer 1.When soil layer 1 is frozen and the fraction of water-filled porosity is 1(I.e. WC1 = 1 - BD1/2.65), the value of S is set equal to zero, and the equation willpredict that all rainfall runs off. However, the current version of <strong>CropSyst</strong> does not allow water contentsto be greater than field capacity, thus this extreme condition is never reached.PAW* is a depth weighted plant available water over the soil profile:
PAW * =nlΣPAW l [ Z l - Z l-1Z l]l=1nlΣPAW l [ Z l - Z l-1Z l]l=1nl is the number of layers.Zl is the depth from the soil surface to the bottom of layer l.w1, w2 are retention curve shaping parameters computed as:for Z l < 1.0w 2 = 2.0 · [ ln | 0.51 - s 2 / s 1| - 0.5 - ln [ 11 - s 3 / s 1- 1]]w 2 = ln [ 1.01 - s 3 / s 1- 1.0 ] + w 214.4.1 Freezing soilBecause runoff is affected by frozen soil conditions, it is important to account for this effect in thoseregions where freezing soil conditions may exist in part of the year.Soil freezing can affect the curve number runoff.When freezing occurs the curve number is adjusted by the following equation: Need the equation fromthe code
Runoff curve numbersRunoff curve numbers for hydrologic soil cover complexesLand useTreatmentor practiceHydrologicconditionHydrologicgroupAMC 1 AMC 2 AMC 3Fallow Straight row N/A A 59 77 89Fallow Straight row N/A A 59 77 89Fallow Straight row N/A B 72 86 94Fallow Straight row N/A C 80 91 97Fallow Straight row N/A D 85 94 98Row crops Straight row Poor A 53 72 86Row crops Straight row Poor B 64 81 92Row crops Straight row Poor C 75 88 95Row crops Straight row Poor D 80 91 97Row crops Straight row Good A 47 67 83Row crops Straight row Good B 60 78 90Row crops Straight row Good C 70 85 94Row crops Straight row Good D 76 89 96Row crops Contoured Poor A 51 70 85Row crops Contoured Poor B 62 79 91Row crops Contoured Poor C 68 84 93Row crops Contoured Poor D 75 88 95Row crops Contoured Good A 45 65 82Row crops Contoured Good B 57 75 88Row crops Contoured Good C 66 82 92Row crops Contoured Good D 72 86 94Row crops Terraced Poor A 46 66 82Row crops Terraced Poor B 55 74 88Row crops Terraced Poor C 63 80 91Row crops Terraced Poor D 66 82 92Row crops Terraced Good A 42 62 79Row crops Terraced Good B 52 71 86Row crops Terraced Good C 60 78 90
Row crops Terraced Good D 64 81 92Runoff curve numbers for hydrologic soil cover complexesLand useTreatmentor practiceHydrologicconditionHydrologicgroupAMC 1 AMC 2 AMC3Small grain Straight row Poor A 45 65 82Small grain Straight row Poor B 58 76 89Small grain Straight row Poor C 70 84 93Small grain Straight row Poor D 75 88 95Small grain Straight row Good A 43 63 80Small grain Straight row Good B 57 75 88Small grain Straight row Good C 67 83 93Small grain Straight row Good D 73 87 95Small grain Contoured Poor A 43 63 80Small grain Contoured Poor B 55 74 88Small grain Contoured Poor C 66 82 92Small grain Contoured Poor D 70 85 94Small grain Contoured Good A 41 61 78Small grain Contoured Good B 54 73 87Small grain Contoured Good C 64 81 92Small grain Contoured Good D 68 84 93Small grain Terraced Poor A 41 61 78Small grain Terraced Poor B 53 72 86Small grain Terraced Poor C 62 79 91Small grain Terraced Poor D 66 82 92Small grain Terraced Good A 39 59 77Small grain Terraced Good B 51 70 85Small grain Terraced Good C 60 78 90Small grain Terraced Good D 64 81 92Runoff curve numbers for hydrologic soil cover complexesLand useTreatmentor practiceHydrologicconditionHydrologicgroupAMC 1 AMC 2 AMC 3close seeded legumes Straight row Poor A 46 66 82close seeded legumes Straight row Poor B 59 77 89
close seeded legumes Straight row Poor C 70 85 94close seeded legumes Straight row Poor D 76 89 96close seeded legumes Straight row Good A 38 58 76close seeded legumes Straight row Good B 53 72 86close seeded legumes Straight row Good C 64 81 92close seeded legumes Straight row Good D 70 85 94close seeded legumes Contoured Poor A 44 64 81close seeded legumes Contoured Poor B 59 75 88close seeded legumes Contoured Poor C 67 83 93close seeded legumes Contoured Poor D 70 85 94close seeded legumes Contoured Good A 35 55 74close seeded legumes Contoured Good B 50 69 84close seeded legumes Contoured Good C 60 78 90close seeded legumes Contoured Good D 67 83 93close seeded legumes Terraced Poor A 43 63 80close seeded legumes Terraced Poor B 54 73 87close seeded legumes Terraced Poor C 63 80 91close seeded legumes Terraced Poor D 67 83 93close seeded legumes Terraced Good A 31 51 70close seeded legumes Terraced Good B 47 67 83close seeded legumes Terraced Good C 58 76 89close seeded legumes Terraced Good D 63 80 91Runoff curve numbers for hydrologic soil cover complexesLand useTreatmentor practiceHydrologicconditionHydrologicGroupAMC 1 AMC 2 AMC 3Pasture or Range Straight row Poor A 48 68 84Pasture or Range Straight row Poor B 62 79 91Pasture or Range Straight row Poor C 48 86 94Pasture or Range Straight row Poor D 76 89 96Pasture or Range Straight row Fair A 30 49 69Pasture or Range Straight row Fair B 50 69 84Pasture or Range Straight row Fair C 62 79 91Pasture or Range Straight row Fair D 68 84 93Pasture or Range Straight row Good A 21 39 59
Pasture or Range Straight row Good B 41 61 78Pasture or Range Straight row Good C 55 74 88Pasture or Range Straight row Good D 63 80 91Pasture or Range Contoured Poor A 28 47 67Pasture or Range Contoured Poor B 47 67 83Pasture or Range Contoured Poor C 64 81 92Pasture or Range Contoured Poor D 75 88 95Pasture or Range Contoured Fair A 12 25 43Pasture or Range Contoured Fair B 39 59 77Pasture or Range Contoured Fair C 57 75 88Pasture or Range Contoured Fair D 67 83 93Pasture or Range Contoured Good A 2 6 15Pasture or Range Contoured Good B 18 35 55Pasture or Range Contoured Good C 51 70 85Pasture or Range Contoured Good D 62 79 91
Erosion simulationSoil loss due to water erosion uses the Revised Universal Soil Loss Equation (RUSLE) which computesthe average annual erosion expected on the field slope as :E = C · R · K · L · S · PwhereE (tonne/ha)is soil erosion.C (unitless dimensionless) is the crop management factor .R (MJ·mm/ha·h)is the average annual rainfall erosivity.K ((tonne·ha·h)/(ha·MJ·mm)) is the soil erodibility factor .L (unitless dimensionless) is the slope length factor .S (unitless dimensionless) is the steepness factor .Pis the erosion control practice factor management input parameter.Rainfall energy intensity factor (R)To estimate R, recording rain-gage records for all the storms in each year for a long number ofyears is required. Mathematically, R is:R = 1/nnΣ[ m k]E · IΣ 30 ·k=1J=1whereE (MJ/ha) is total storm kinetic energy.I 30 (mm/h) is the maximum 30-min rainfall intensity.j is the index of the number of years used to produce the average.k is the index of the number of storms in each year.n is the number of years used to obtain average R.m is the number of storms in each year.The erodibility factor is based on the fractional contribution of rainfall energy intensity for a givenday (REI' day ):REI dayREI' day =Σ REI day
REI' day is 0 if no daily precipitation.REI day is the daily rainfall energy intensity.The rainfall energy intensity factor for each day is calculated as:whereprecip day (mm)r pREI day = precip day · (0.199 + 0.0873 · (log 10 r p - 0.434) · R 0.5is the daily precipitation from weather data.(mm/h) is the peak rainfall rate:R 0.5 (mm) is the maximum ½ hour rainfall amount.r p = 1.20 · precip day · ln(1.0 - α 0.5 )α 0.5R 0.5 = α 0.5 · precip dayexpresses the maximum portion of total rainfall that occurs during an ½ hour (unitless0.0208 - 1.0) It is generated by random sampling from a triangular distribution with abase ranging from 0.0208 to α 0.5uα 0.5u = 1 - e (-125/precip day )with a probability density function peak at α 0.5u· α 0.5m .α 0.5m is the monthly mean maximum portion of total rainfall that occurs during a ½hour period , location input parameter for the month in which day falls.Soil erodibility factor (K)This factor accounts for the influence of soil properties on soil loss during storm events. Soilerodibility factors are best obtained from direct measurements on material or simulated rainfallrunoff plots. Because this type of data is not available for many locations, predictions based on soilproperties are used. A general relationship based on published global data including 225 soils ofmeasured K values obtained from natural and studies of simulated rainfall can be expressed as:whereK = 7.594 [ 0.0034 + 0.0405 · e [ -1/2 [ (log 10 D g + 1.659)/0.7101]²] ]D g is the mean geometric particle diameter (mm).D g = e [ Σ fi · ln mi]wherei is the soil texture component: Sand, Clay, Silt.f i is the primary particle size fraction in percent for sand, clay and silt input parameter .m i is the arithmetic mean of the particle size limits of that size:
Sand 1.025Clay 0.026Silt 0.001The evaluation of the K-factor for soils subjected to freezing and thawing and soils with rockfragments are areas of concern. <strong>User</strong>s should consult the RUSLE documentation for furtherdiscussion on those conditions.Slope length factor (L)This factor can be estimated based on the horizontal slope length as follows:L = [ λ/22.13] mwhereL (unitless) is the slope length factor.λ (m) is the horizontal slope length soil parameter.is an exponent related to the ratio of rill erosion (caused by flow) to interrill erosionm(principally caused by raindrop impact).Slope steepness factor (S)This factor is evaluated from McCool et al., 1987 as follows:where θ is the slope angle.S =⎧10.8 sin θ + 0.03 slope < 9%⎨16.8 sin θ - 0.5 slope > 9 %⎩3.0 sin θ 0.8 + 0.56 slope < 4.5%The relationship between slope percent and slope angle is given by:where slope % is the slope steepness .θ = arctan slope%/100Soil Conservation Practice Factor (P)The P-factor in RUSLE is the ratio of soil loss with a specific support practice to thecorresponding loss with up and downslope tillage. For cultivated land, support practices includecontouring (tillage and planting on or near the contour), strip cropping, terracing, and subsurfacedrainage. On dryland or rangeland areas, use of soil disturbing practices oriented on or near the
contours that store moisture and reduce runoff are also used as support practices.The P-factor does not consider improved tillage practices such as no-till and other conservationtillage systems, sod-based crop rotations, fertility treatments, crop residue management, andsurface roughening. Such erosion control practices are considered in the C-factor.RUSLE recommended values for the P-factor are included in a large number of tables in theRUSLE documentation which are not practical to be reproduced in the brief summary presentedhere. Refer to the soil conservation practice management input parameter of a brief method fordetermining this value.C-FactorThe <strong>CropSyst</strong> determination of the C-factor is similar to that presented by McCool, 1976 andMcCool and Krauss, 1981 for long time steps, but is calculated daily and averaged for each year.nΣSLR τ · RR ττ = 1whereSLR is the daily soil loss ratio.RR is the daily rainfall and runoff erosivity factor.n is the number of days in the year.τ (day) is an index denoting time step.Daily Rainfall and Runoff erosivity factor (RR)nIn regions with predominately winter precipitation, water erosion is much more severeduring the winter period. This corresponds to the time when crops such as winter wheat aretoo small to protect the soil from erosion. In the summer period, crop cover is less importantfor soil erosion. This difference is reflected in the rainfall and runoff erosivity factor.Soil Loss RatioThe soil loss ratio is defined as "the ratio of soil loss from an area with specified cover andmanagement to that from an identical area in tilled continuous fallow" ( C ). It is a productof five components:WhereSR(0-1) is the surface residue cover factor.SLR τ = SR τ · IR τ · CC τ · SDR τ · SM τ
IR(0-1) is the incorporated residue factor.CC (0-1) is the Green crop cover factor.SDR (0-1) is the surface soil detachability and roughness (SDR).SM (0-1) is the Soil moisture factors.Surface residue cover factorThe surface residue cover factor is based on the curve recommended by McCool (personalcommunication, 1991) based on previous work by Wischmeier .whereResidue surface (kg/m²) is surface residue.SR = e (-5 · Residue surface )As Residue surface increases, the cover factor decreases, giving less soil erosion.Incorporated residue factor (IR)Shallow incorporated residue in the soil is assumed to reduce the cover factor 12% for eachton of buried material (or 54% for every kg/m²) ( McCool, 1976 . This is expressed by theequation:whereIR = e (-2.655 · Residue shallow )Residue shallow (kg/m²) is the shallow incorporated residue.Crop Cover factor (CC)The values of crop cover factor are calculated from crop fractional interception(fractCover canopy ). The function relating (CC) to fractCover canopy is provided by McCooland Krauss, 1981 .Linear interpolation between specified values is used for obtaining CC for any crop cover.Seven pairs of data points are used to define the function. In fallow periods, CC is equal to1.Soil Moisture factor (SM)According to McCool and Krauss, 1981 , the soil moisture factor (SM) is unity when thesoil profile is fully charged with water. SM is zero when soil water in the profile is fullydepleted, which is the case when the water content of the surface layer is at air dry and thewater content of the rest of the profile is at permanent wilting point. Relative available wateris used as the moisture factor where available water is defined as the soil water content
greater than air dry water content at the top soil layer and greater than permanent wilt watercontent in the rest of the soil profile within the rooting depth, but less than field capacity:RDΣmaxWC l - ADWCSM =(FC l - PWP l · (RD max - 2 ) + FC l - ADWCl=2whereis the ratio of the available water in the whole rooting depth to theSMpotential available water in that depth.RD max (m) is the maximum rooting depth.WC (m3/m3) is the water content.lis the soil layer.With this equation, SM is equal to 0 when soil evaporation and crop transpiration uses allthe available water from the soil rooting depth, and SM reaches 1 when the soil profile isfully charged with water in the midwinter and spring and decreases naturally with depletingsoil water in the growing season.
Rill/interrill relationshipsValues of m are given in the following table as a function of percent slope and rill/interrill ratio. A lowrill/interrill ratio corresponds to conditions such as rangeland and other consolidated soil conditions withcover. Moderate ratio corresponds to row-cropped agricultural and other moderately consolidated soilconditions with little to moderate cover. High ratio corresponds to freshly prepared construction andother highly disturbed soil conditions with little or no cover.Slope length exponents for rangeof slope and rill/interrill erosionclassesParameter Rill/Interrill ratioslope Low Moderate High0.2 0.02 0.04 0.070.5 0.04 0.08 0.161.0 0.08 0.15 0.262.0 0.14 0.24 0.393.0 0.18 0.31 0.474.0 0.22 0.36 0.535.0 0.25 0.40 0.576.0 0.28 0.43 0.608.0 0.32 0.48 0.6510.0 0.35 0.52 0.6812.0 0.37 0.55 0.7114.0 0.40 0.57 0.7216.0 0.41 0.59 0.7420.0 0.44 0.61 0.7625.0 0.47 0.64 0.7830.0 0.49 0.66 0.7940.0 0.52 0.68 0.8150.0 0.54 0.70 0.8260.0 0.55 0.71 0.83
Original soil freezing modelThe soil freezing model described here is not longer implemented in this original form. It has beenmodified to perform freezing and thawing with freezing lenses.The original soil freezing model was a modified version of a model developed by Jumakis ( van Rooij,1987 ) has been incorporated into <strong>CropSyst</strong>. Daily cumulative freezing index (CFI) for day d (C-days) iscalculated as:whereD (0.97) is the daily decay coefficient.Tavg (C) is the average daily air temperature.S (cm^-1) is the snow reduction coefficient.Dsd (cm) is snow depth on the ground on day d.CFI d = D · CFI d-1 - T avg · e (-0.4 · S · D sd )0.8 if T avg < 0 (freezing periods)0.5 if T avg > 0 (thawing periods)CFI is a measure of the available "climate freezing power". CFI_d is initialized to a certain negativevalue at the beginning of the winter to represent a lag between climatic freezing conditions and thebeginning of actual soil freezing. As freezing temperature prevail, CFI_d becomes less negative first andpositive, indicating potential to freeze the soil.To calculate the frost depth, the freezing index required to freeze each one of the soil layers (RFIl) mustbe calculated and compared with CFI_d. Because the presence of a snow layer on the soil decreases therate of penetration of frost, the thermal conductivity of the snow must be determined. This is doneaccording to the following equation:k sn = (22.7 · ρ sn - 0.46) · 10 5wherek_sn(cal/(cm . s . C)) is the snow thermal conductivity.rho_sn (0.1 g/cm3) is the snow density or one tenth the density of water.The snow thermal resistance is given by:r sn = D s / K sn · SEDFwherer_sn ((cm² . s . C)/cal) is the snow thermal resistance.Ds (cm) is snow depth on the ground.SEDF is a snow effect decrease with depth factor which is calculated daily and multiplied with the snowthermal resistance and the resulting value is added to the total resistance of all layers together. Thisdecrease factor is given by:
SEDF =e -SIF · F dwhereSIF (1/cm) is the snow insulation factor input parameter.F_d cm is the frost depth.The thermal resistance of each soil layer is given by:r l = ∆ Z l / K lwherer_l ((cm² . s . C)/cal) is soil layer thermal resistance.Zl (cm) is soil layer thickness.Kl (cal/(cm . s . C)) is the soil layer thermal conductivity.To freeze the lth layer, the thermal resistance of all previous layers has to be exceeded before the freezefront can reach it, where the snow is treated as a layer with its own snow thermal resistance. The requiredfreezing index is then given by:=[c · CFI]RFI lL l + 2 · fdwhereRFIl ( C-days) is the required freezing index to freeze layer l.Ll (cal/cm3) is the latent heat released when freezing layer l calculated from the layer volumetric watercontent (WCl) and the latent heat of fusion (80 cal/cm3) as:L l = 80 · wc lC (cal/(cm3 . C)) is heat capacity.CFI ( C-days) is the cumulative freezing index.fd (days) is the number of freezing days.Zl (m) is the thickness of the lth soil layer.Rtot ((cm² . s . C)/cal) is the total thermal resistance given by:r_sn is the thermal resistance of the snow layer.r_1, r_2 ... r_nl are the resistances of each soil layer.R tot = r sn + r 1 + r 2 · · · [ r nl / 2 ]A special case for the required freezing index to freeze the first soil layer is calculated according to thefollowing equation:L 1 · ∆ Z 1·[RFI r 1n]1 = + r84,400 2
whereRFI1 (C- days ) is the required freezing index to freeze layer 1.L1 (cal/cm3) is the latent heat released when freezing layer 1.WC1 is the volumetric water content of the first soil layer.r_1 ((cm² . s . C)/cal) is the thermal resistance of the first soil layer.The required freezing index for the entire soil profile (RFIt) is determined as the sum of the requiredfreezing index for each soil layer:nlRFI tΣ= RFI ll=1The value of CFI_d for the current day is compared to RFI accumulated layer by layer. Frost depth isgiven by the layer where cumulative RFI become larger than CFI. The point of the freezing front in thatlayer is determined by linear interpolation.14.4.2 Soil Heat CapacityThe heat capacity must consider the individual components in the soil and thus can becalculated by adding the weighted heat capacity of each of the different soil constituents to the total heatcapacity:C = X s · C s + X w · C w + X a · C awhereC (cal/(cm3 . C)) is the volumetric heat capacity.Xi (-) is the volume fraction of the component i.Ci (cal/(cm3 . C)) is the volumetric heat capacity of component i.s is the solid component.a is the air component.w is the water component.The values of the volumetric specific heat capacity are 0.46, 0.45, 0.0003, 1.0 for mineral solid material,ice, air and water respectively. The air component was neglected in the calculations because of its smallcontribution to the total specific heat.Soil Thermal ConductivityThe thermal conductivity is calculated by:
K =Σ M i · X i · K iΣ M i · X iwhereK (cal/(cm . s . C)) is the thermal conductivity.i is the component in the soil.Xi is the volume fraction of component i.Ki (cal/(cm . s . C)) is the specific thermal conductivity of component i.M_i is the ratio of the average temperature gradient of each minor component and the correspondingquantity in the medium through which most of the heat is transported.The value for M_i can be calculated dependent on the shape and size of the particles and their relativepositions. Under the conditions that the granules are of ellipsoidal shape and that they are so far apart thatthey do not influence each other, the following expression can be used to calculate this parameter:1/3M ia =k i1 +k 0 + 1 · G aM i = M ia + M ib + M icwhereGa is the depolarization factor of the ellipsoid in the direction of the a-axis.Ko (cal/(cm . s . C)) is the specific thermal conductivity of the continuous medium in the soil (mostlywater or ice).Mia is the contribution to the factor M_i of the directiona .When the soil air content is between 0.0 and 0.337 then value for Ga can be calculated from:whereXa is the soil air volume content.G a = 0.333 - X a / 0.427 · (0.333 - 0.35)The specific thermal conductivities values taken were: 20.4, 7.0, 5.2, 1.3 (mcal/(cm . s . C)) for quartz,minerals, ice and water. The value for the Ga factor is also valid for Gb. The value for Gc is calculatedfrom:G a + G b + G c = 1
The use of these equations is explained as follows: when soil consists of only one component, such asquartz, the thermal conductivity would only be that of quartz; if water is also present, the value forthermal conductivity would be between quartz and water. When the conductivity of one substance ismuch smaller than the other, almost all the heat will be transported by the substance with the higherconductivity.
Crop simulationThe crop simulation is modelled using a crop object. The crop object is derived from a heirarchy of cropclasses each providing more sophisicated higher level capabilities:Basic cropThis class provides for basic growth characteristics common to all crop growth simulations.Full cropThis class adds capabilities for responding to management operations such as❍ Waiting for ideal planting conditions.❍ Trimming, clipping and other special harvest operations.Crop nitrogenThis class enhances crop growth simulation for consideration of nitrogen.Complete cropThis class add capabilites specific to the <strong>CropSyst</strong> simulation:❍ Contribution to residue pools❍ Domancy of perennial crops.Crop simulation steps●●●●Crop growth simulation first determines potential transpiration in the evapotranspiration model.Next potential growth based on phenology and morphology is determined.This is followed by the modelling of the soil water operations. This results in the adjustment ofsoil water potentials used by transpiration.> Finally, with soil water potentials updated for the day, actual growth and transpiration applyinglimitiations to crop growth based on current conditions can be simulated.
Crop growth and developmentThe crop growth and development cycle in <strong>CropSyst</strong> consists of several identifiable phenologic stages ofdevelopment based on thermal time.The thermal time accumulation serves as the basis of <strong>CropSyst</strong>'s crop phenology simulation .Development StagesDifferent crops may have all or some of these simulated stages and events.● Planting event❍ Begin accumulation of growing degree days.● Preemergence❍ No canopy or above ground leaf development.❍ No actual transpiration.● Emergence❍ Crop is established.❍ Initial root depth and leaf area index are defined.❍ Canopy biomass is initialized● Active growth❍ Root growth.❍ Canopy development.❍ Leaf area development.❍ Transpiration.❍ Nitrogen uptake.● Flowering❍ Root growth for many crops reaches maximum. (This crop characteristic is user specified)❍ Leaf area reaches maximum. (This crop characteristic is user specified)❍ Harvest index sensitivity to flowering stress accounted.❍ Transpiration.❍ Nitrogen uptake.● Grain filling (for grain crops)❍ Grain filling is started.❍ Harvest index sensitivity to grain filling stress accounted.❍ Transpiration.❍ Nitrogen uptake.● Physiological maturity
●❍ Crop is mature.❍ No further accumulation of biomass (grain filling stops)❍ Green area for most crop is minimal.❍ Transpiration is minimal.Harvest event❍❍❍❍Crop is harvested.Crop biomass removed.A fraction of crop canopy may remain in the field as residue.No transpiration.TranspirationTranspiration or water uptake occurs throughout most of the crop's active development cycle and is usedto derive biomass accumulation , leaf area , and root depth .Stress effectsIn <strong>CropSyst</strong>, an overall stress index is determined as one minus the ratio of actual to overall potentialbiomass growth for each day of the growing season. Overall potential growth is defined as the growthcalculated from potential transpiration (Tr pot ) substituted for Tr act .Actual biomass growth is obtained after growth limitations have been applied. This overall stress index ispartitioned into light, temperature, water, and nitrogen stress indices. These quantities are used asindicators of the plant response to environmental conditions. All these indices range from 0 to 1, where 0is no stress and 1 is maximum stress.
Crop planting<strong>CropSyst</strong> provides two modes for the simulation of crop planting. For the fixed planting mode, thesimulation of crop growth begins on the specified date. For the computed planting mode, a five-dayaverage air temperature above planting temperature requirement and a specified water content of thesecond soil layer are used as check conditions for planting (water contents of the top evaporative layer ishighly fluctuating).Planting (or beginning of the germination process) occurs if the following conditions are satisfied:today+5Σ [ 2](Tmax d + Tmin d ) /d=today> T reqand5WC 2 > WC reqwheretodayis the date in the simulation.Tmin d , Tmax d (°C) are the minimum and maximum temperatures of day d.T req (°C) is the planting date temperature requirement crop parameter.WC 2 (m³/m³) is the water content of the second soil layer.(m³/m³) is the water content required for planting crop input parameter.WC req
Potential growthThe following morphologic calculations are performed to determine potential growth:● Root depth●●●●●●Accumulation of thermal timeFraction of canopy coverPlant heightGrowth limitationsMax pot transpirationDormancy
RootingRoot growth occurs soon after planting and continues while GAI accumulates or until flowering(flowering is a significant phenologic growth stage), or continuously in the case of a perennial.Root depthWhen computing root depth, because stress (water and nitrogen) seems to enhance rootpenetration, the ratio LAI/LAImax is affected to a power given by the minimum of the water ornitrogen stress indices. Root length is an accumulation of daily root length with root depth startingat the planting depth (currently taken as the bottom of the first sublayer). The accumulation of rootlength does not start until the daily RAI exceeds 0.001, The root depth is not allowed to exceed themaximum root depth (crop parameter).The root length added each day is:RD max · (( 0.0083 · LAI max + RAI d ) / LAI max · LAI lagwhereRD max is the maximum root depth crop parameter.LAI lag Is the LAI lag factor(1 - (0.7 · LAI) / LAI max )Which is not allowed to be negativeFor the calculation of root depth, LAI is determined as a function of above ground biomass, but thethreshold to stop growth (biomass accumulation) due to stress is given by the AT/PT ratio whereroot growth ceases input parameter.Root densityRoot density is determined as a root length fraction. Root fraction is a function of rooting depthbecause rooting density is assumed to decrease linearly with depth ( Campbell, 1988 ) with amaximum at the top of the soil profile and a value of zero at the tip of the current root depth.Therefore, if Z l is the depth (m) to the bottom of soil layer l:if Z l < R d thenif Z l - ∆ Z l < R d < Z l thenf l = ∆Z l · (2 · (R d - Z l ) + ∆ Z lR d2
f l =[ R d - Z l - ∆ Z lR d]
PhenologyThe stages of development are determined by the accumulation of thermal time (Growing degree days).Thermal time for the crop is accumulated throughout the growing season (starting with planting untilharvest).A crop enters the next stage of development when the thermal time reaches the thermal time requirementfor the respective stage.Thermal time is computed with the following equation:T avg =⎧⎨⎩GD day = T ave - T GDdaybaseCGD day = CGD day-1 + GD dayT GDdaybase if T avg < T GDdaybaseT cutoff if T avg > T cutoff(T' max + T min ) / 2 otherwisewhereGD day (°C-days) is today's thermal time.CGD day (°C-days) is today's accumulated thermal time since planting.T GDdaybaseT cutoffare crop input parameters that define the range of temperatures for viabledevelopment.T min (°C) is the daily minimum air temperature.T' max (°C) is the daily maximum air temperature.Because many crops accelerate development if subjected to water stress, it is auser's option to activate a corrective mechanism. This is based on the assumptionthat plants will be warmer if transpiration is limited by water stress and willaccelerate development. The correction is implemented by adding temperature tothe T max input to plant temperature equation according to the following equation:T' max = [ 1 + (1.5 - VPD max )] · StressIndex water · PSWSwhereT max (°C) is the daily maximum air temperature.(0-1) ranging from 0 (no stress) to 1 (maximum stress) is theStressIndex waterdaily plant water stress index
VPD max(kPa) is the maximum vapor pressure deficit (for saturated vaporpressure (VP sat ) at T max or T min ) VPD max is limited to arange of 0.0 to 0.6 kPa.aridity is the aridity factor .PSWSVPsat Tmax - VPsat TminVPD max =1 - aridity · (VPsat Tmax - VPsat Tmin )is the phenologic sensitivity to water stress crop inputparameterFor crops whose development is not expected to be affectedby water stress, this correction can be deselected by theuser (PSWS = 0).For some crops like sorghum, water stress may actuallydelay development (PSWS < 0).Vernalization and Photo-period effects on thermaltimeSome crops such as winter wheat undergo the process of vernalization. This requires an adjustment ofthermal time to accomodate the vernalization process (f_ver) that occurs in such crops.Some crop such as oats, sugarbeet, winter barley, soybeans, maize and rice are sensitive to day length.This requires an adjustment of thermal time to accomodate the sensitivity to photo period (f_photo) thatoccurs in such crops.Each day, the thermal time calculated from temperature is multiplied by the minimum of f_ver orf_photo to determine the actual amount of degree-days accumulated for the day.
Above ground biomass accumulationCrop growth occurs during active growth until maturity, (but not after maturity is achieved) and onlywhen potential transpiration has been determined by the evapotranspiration model.Above ground crop growth is represented in terms of above ground biomass accumulation. Aboveground biomass production is dependent on: intercepted radiation (radiation dependent), transpiration(water-dependent), and plant nitrogen uptake (nitrogen-dependent). Each of these factors is capable oflimiting growth.Radiation dependent growthRadiation dependent biomass production (G R ) ((kg/m²)/day) is calculated as:LtBC · Rad estG R =2 · (1 - e (max(-kc · 1.4 - 0.9) · GAI · (clump + (1.0 - clump) · ( 1 - e(-0.25 · GAI) )))) · T limwhereLtBC (kg/MJ) (converted from g/MJ)is a coefficient representing the conversion of photosynthetically active radiation (PAR) to above ground biomassinput parameter.Rad ((MJ/m²)/day)is the total daily solar irradiance above the crop canopy. This is an actual value if available in the weather file ,otherwise it is estimated.fractCover* (0-1)canopy0.5is the fraction of incident PAR intercepted by the canopy .is a constant to represent that PAR corresponds to approximately half of the total solar irradiance.T limis a temperature limitation factor.Temperature limitation is applied if the current thermal time accumulation is less than a user selected threshold(thermal time at which temperature limitation ceases crop input parameter . (If T < 0.01 it is assumed to be thelimmost significant factor (given a value of essentially 0.0)).whereT lim =⎧⎨⎩1.0 if T avg > T opt0.0 if T avg < T base(T avg - T base )(T opt - T base ) otherwise
GD day(growing degree days)T avg(°C)T base(°C)T opt(°C)is thermal time determined for the current day.is the daily average air temperature.is the crop input parameter: thermal time base temperature .is the optimal temperature for growth crop input parameter.It is assumed that temperature effects, after cumulative degree-days is larger than the threshold, are accounted for inthe radiation conversion factor LtBC, which is empirically derived, usually using observations during the linearphase of biomass accumulation when temperatures are warmer.Water dependent growthCrop transpiration dependent biomass production (G Tr) (kg/m²)/day is calculated using ( Tanner and Sinclair, 1983 ):G Tr= Tr act · BTR/VPDwhereBTR ((kg/m² · kPa)/m)is the above ground biomass-transpiration coefficient crop parameter.Tr act(m)is the actual transpiration .VPD (kPa)is the daily mean vapor pressure deficitIf VPD > VPD limit(crop parameter) then G Tris set to G RNitrogen dependent growthNitrogen dependent growth will be applied if nitrogen simulation is enabled.
Crop TranspirationAs a function of actual growth, crop transpiration occurs once the plant emerges and begins activegrowth and continues until the crop reaches maturity, out side of this period of growth, transpiration iszero. Perennial crops often do not reach a maturity; however, they may go into a period of dormancy,during this time, transpiration is shut down.Potential transpirationPotential transpiration serves as a guide line for determining actual transpiration and ultimately cropgrowth. Potential transpiration is a function of the evapotranspiration model.Crop actual transpirationIn <strong>CropSyst</strong>, crop water uptake and actual crop transpiration are considered equal, I.e., crop water storageis assumed negligible.For calculation of crop water uptake, the soil profile is divided into layers, and the water uptake of eachlayer is calculated from the water potential difference between the soil and the plant xylem, multiplied byplant conductance (mainly determined by root conductance).The soil conductance is assumed to be large compared to root conductance so that water uptake is notlimited by water movement towards the roots.The water uptake (WU l , in ((kg/m²)/day), equivalent to 0.001 m/day) from each soil layer (l) is given by:WU l = K · C l /1.5 · (ψ sl - ψ l )In the case of freezing temperatures, there is no water uptake from frozen soil layers. No transpiration isallowed from soil layer one, the evaporative layer.The total water uptake WU is the sum of the uptake from each soil layer.whereWU =nΣWU ll =1ψ sl (J/kg or m²/s²) is the soil water potential of soil layer l.The soil water potential for each layer is calculated using ( Campbell, 1985 ):whereψ sl = -a · WC l-b
WC l (m³/m³) is the water content of the lth soil layer. The values of a and b vary with soil texture.Based on known values of water content at soil water potential of(-30 J/kg) (field capacity for many soil) and(-1,500 J/kg) (permanent wilting point for some soil/crop species), then the parameters aand b can be estimated as:ψ la = e (ln(30) + b · ln(WC -30))b =ln [ -1,500/-30 ]ln [ WC -30 /WC -1500 ]whereWC -1500 (-1,500 J/kg) is the water content at a soil water potential.WC -30 (-30 J/kg) is the water content at a soil water potential.(J/kg is the leaf water potential calculated from:or m²/s²)1.5 · Tr potψ l = avg( ψ s ) - · KC Tcwhereavg(ψ s )is the average of the soil layer water potentials. The value ofavg(ψ s ) depends on the soil water potential and the fraction of totalroot length in each soil layer (f sl ):Tr pot ((kg/m²)/day) is the potential crop transpiration ( equivalent to 0.001 m/day ).C Tcis the current (today's) total root conductance.K (86,400) is the number of seconds per day.1.5is a factor that converts total root conductance to total planthydraulic conductance.When ψ l (from the calculation of leaf water potential ) is less than ψ [l,sc] (the leaf waterpotential (J/kg) just before the beginning of stomatal closure due to water deficit (a cropinput parameter), but larger (less negative) than ψ [x,wilt] wilting plant leaf water potential(a crop input parameter), then ψ l is recalculated as:1.5 · Tr pot · ψ l - ψ l,wiltψ l = ψs -ψ l,sc - ψ l,wiltC tc · KBecause ψ l is in both sides of the equation, its value is calculated by solving for ψ l asfollows:
C Tc · K · (ψ l,sc - ψ l,wilt ) - 1.5 · Tr pot · ψ l,wiltψ l = ψs ·C Tc · K · (ψ l,sc - ψ l,wilt ) · 1.5 - · Tr potIf ψ l from equation is less than ψ [l,wilt] ( wilting leaf water potential input parameter ),then ψ l is set equal to ψ [l,wilt] .C l is the layer root conductance determined from current total root conductance (C Tc ) in (kg ·s/m 4 ) and the fraction of total root length in each layer:wheref lC l = f l · C Tcis the fraction of the total root length present in the l'th soil layer.C Tc is the current total root conductance calculated as:C Tc = C t · FractCover canopywhere C T is maximum total root conductance. This value can be estimated if amaximum uptake rate is assumed for a fully developed green crop, unstressed, fullywatered, with unrestricted root penetration, and under an environment providinglarge atmospheric evaporative demand. Under this set of conditions, any evaporativedemand larger than the maximum uptake rate will only induce stomatal closure.1.5 · WU maxC T =ψ fc - ψ l,sc · KwhereWU max (m/day) is the maximum uptake rate crop input parameter.ψ fc(J/kg) represents the soil water potential at field capacity.ψ [l,sc](J/kg) is the leaf potential just before the beginning of stomatal closuredue to water deficit a crop input parameter.
Leaf area developmentLeaf area development depends on daily biomass production. However, because leaf expansion isreduced and stopped earlier than biomass production under water stress conditions, green area indexcalculations are not directly dependent on above ground biomass production, but rather on an auxiliaryvariable defined as the leaf area expansion-related biomass production (LAERB). This quantity is onlyaccumulated when the ratio of actual to potential transpiration is greater than the crop water stressthreshold defined by the : Tr act / Tr pot ratio where leaf area growth ceases crop parameter.The value of LAERB is identical to cumulative above ground biomass when the ratio remains above thethreshold throughout the growing season.Leaf area index development stagesGrowth StageGrain crops(non=legumes)LegumesRootcropsEmergence Increase Increase IncreaseBegin flowering Plateau Increase IncreaseEnd flowering Plateau Plateau PlateauBegin Grain filling Decrease Decrease -Begin Senescence Decrease Decrease DecreasePhysio. Maturity stop Stop StopThe leaf area expansion-related biomass accumulation (LAERB) is used in determining the green areaindex (GAI) during the active growth stage.Both LAI and GAI generally have the same value during the active growth stage, reach a peak nearflowering (cereal crops), and start declining during senescence (see the Leaf area index developmentstages table). When the crop is at physiological maturity, LAI is set a percentage of the peak LAI. Notethat some crops will not have all the listed growth stages (see the relevant phenology table ).The leaf area expansion-related biomass produced in a given day, and the accumulated quantity until thatday, are used to determine the new green leaf area index produced in the day (GAItoday) as follows:LAERB today · SLAGAI today =(LeafStemPart · LAERB cum + 1) 2whereLAERBtoday (kg/m²) is the daily leaf area expansion-related biomass.LAERBcum (kg/m²) is the accumulation of LAERBtoday.SLA (m²/kg) is the Specific leaf area crop input parameter.LeafStemPart (m²/kg) is the Leaf/stem partitioning coefficient crop parameter.
The fraction of GAI produced in each day is initialized with zero degree-days, and the thermal timeduring the life of this fraction is calculated daily as follows:whereCGD dayGDD green = CGD day · ( 1 + GAI sensitivity · StressIndex Water )is the computed accumulated thermal time.StressIndex water is the computed daily plant water stress index .is the leaf duration sensitivity to water stress crop input parameter.GAI sensitivityWhen the accumulated thermal time of any given fraction of GAI reaches the thermal time threshold setby the leaf duration crop input parameter , this fraction is assumed to senesce and it is subtracted fromthe total GAI.The leaf area index (LAI), which includes total leaf area (green or senescent) is equal to GAI duringactive growth of green area and declines after flowering to reach the value set by the fraction ofmaximum LAI at maturity crop input parameter .
Crop interceptionThe amount of water intercepted by the crop canopy is estimated from the fraction of canopy cover(fractCover_canopy) and the storage capacity of the canopy for water, assumed to be 1mm for fullcanopy cover ( Campbell and Diaz, 1988 ):Interception = 0.001 · fractCover canopy
VernalizationVernalization in crops can be defined as the low temperature promotion of flowering. Winter cropsrequire a period of exposure to temperatures between approximately 0 to 12 °C for a period of time from10 to 60 days from germination to proceed into the reproductive phase. Vernalization requirementsfluctuate significantly among species and cultivars.Vernalization is simulated by defining a vernalization factor , which fluctuates from 0 to 1 depending onthe accumulation of vernalization days. Vernalization is calculated as follows:f ver = f vermin + [ 1 - f vermin ] · [ VD sum - VD start ][ VD end - VD start ]wheref ver (0-1) is the vernalization factor.f ver_min (0-1) is the minimum vernalization factor value at the beginning of the vernalization process.(usually zero) If VD start is set to zero, f ver_min can be specified as zero or greater than zero.For crops insensitive to vernalization, f ver_min must be set equal to 1.VD start is the accumulated vernalization-days at which f ver is set equal to f ver_min .VD end is the required sum to complete vernalization (at which f ver reaches a value of 1.0).VD sumis the sum of the currently accumulated vernalization days. The sum of vernalization day iscalculated by adding the vernalization contribution of each day (V i ). The maximumcontribution is equal to one vernalization day and the minimum contribution is zero.Accumulation continues until VD sum > VD end . V i is calculated from average airtemperature as follows:V i =⎧⎪⎨⎪⎩1 -T avg -T highAif T avg > T high and F ver < 01 - T low - T avg - T avgAif T avgmedia < T low and f ver > 01.0 if T high > T avg > T lowwhereT low (°C) is the low end temperature threshold for optimum vernalization .T high (°C) is the high end temperature threshold for optimum vernalization .A is assigned the value of 7.0.
T avg (°C) is the average air temperature.
Photo-periodPlant development may respond to the relative lengths of days and nights. Some crops (long-day plants)accumulate physiological time towards flowering when the day length exceeds some minimum threshold(i.e. oats, sugarbeet, winter barley, winter wheat). Some crops accumulate physiological time towardsflowering when the day length is shorter than some maximum (i.e. soybeans, maize, rice, etc..). Othercrops are insensitive to day length.The response to photo-period is approximated with a simple linear relation.For long-day crops (when daylength > daylength if ):wheredaylength ins (day length for insensitivity)f photo = daylength - daylength ifdaylength ins - daylength ifis the crop parameter for day length threshold above which maximum physiological timeaccumulation occurs .daylength if (day length to inhibit flowering)is the crop parameter for day length threshold below which no accumulation of physiological timeoccurs.For short-day crops (when daylength < daylength_if):f photo = daylength if - daylengthdaylength if - daylength isIn this case, day length for insensitivity is the day-length threshold below which the maximumaccumulation of physiological time occurs. Day length to inhibit flowering is the day-length thresholdabove which no accumulation of physiological time occurs.As with the vernalization factor, the photoperiod factor takes on values from 0 to 1.
Crop harvestCrop harvest events usually occur at a specified number of days after maturity. In the case, of perennialcrops, harvest events will be periodic based on clipping criteria parameters specified in a managementfile.Harvest index and crop yieldHarvest index is defined as the ratio of yield biomass to the total cumulative biomass at harvest(Biomass_hrv); thus, crop yield can be calculated as:Yield = Biomass hrv · HIThe harvest index is given by the harvest index crop parameter , adjusted to account for sensitivityto water stress during flowering and/or grain filling.HI = HI unstressed · (1 - avgStress f Sf ) · (1 - avgStress gf Sgf )whereavgStress f is the mean water stress index during the period of flowering.avgStress gf is the mean water stress index during the period of grain filling.are the harvest index adjustment parameters for water stress sensitivity duringSf, Sgfflowering and grain filling respectively.In addition, grain yield based on translocation is determined as biomass at flowering, times thetranslocation factor, times the mean flowering stress:biomass flower · translocation · avgStress fThis is compared with the yield obtained from the biomass harvest index equation . The maximumof the two is compared with the unstressed yield from then biomass harvest index equation and theminimum is taken as the predicted yield.Non-yield harvest biomass and surface residueadditionAll or a fraction of the non-yield above ground biomass may remain in the field after harvest andmay be added to any existing surface residue. Residues from each harvest are maintainedseparately since each crop has its own rate of decomposition, area mass ratio and nitrogen pool.whereResidue surface = Residue surface + F BR (Biomass hrv - Yield)
Residue surface (kg/m²) is the amount of residue on the soil surface.F BR (0-1) is the crop parameter Fraction of non-grain biomass -> surface residuewhich selects a fraction of the non-yield above ground biomass to beconverted to residue.Biomass hrv (kg/m²) is the cumulative above ground biomass at harvest.Yield (kg/m²) is the harvestable biomass.A portion of the nitrogen stored in the plant is also maintained in the residue. The nitrogenconcentration in the stubble is determined as:Nconc hrvN stubble = N stubblemax ·Nconc max_maturewhereN stubble (kg/kg) is the concentration of nitrogen in the crop stubble which will go intothe residue nitrogen pool.N stubblemax (kg/kg) is the Check in code if concentration or content parameter label sayscontent. Maximum nitrogen concentration of the stubble at harvestcrop parameter.Nconc max_mature (kg/kg) is the Maximum nitrogen concentration at maturity crop parameter.Nconc hrv kg Nis the crop nitrogen concentration at harvest.kg biomass
Fallow cropping conditionsThe simulation runs in fallow conditions between the harvest of a crop and the planting of the next cropin the rotation cycle.Under fallow conditions, the soil water and nitrogen balances for the bare soil plus residue continue to beupdated on a daily basis.
Nitrogen-dependent growthThe values of G R and G Tr are compared and the minimum is used as "potential growth" todetermine nitrogen-dependent growth. The nitrogen-dependent growth (G N ) (kg/m²)/day is afunction of potential growth after radiation and water limitations have been applied, the criticaland minimum crop nitrogen concentration, and the crop nitrogen concentration expected after newgrowth, modified from Godwin and Jones ( Godwin and Jones, 1991 ):whereG Npot ((kg/m²)/day)NCG N = G Npot ·⎡ crit - NCONC a⎣ 1 - NC crit - NC minis potential growth after radiation and water limitations have been applied.NCcrit (kg/kg)is plant critical nitrogen concentration, which is linearly scaled from its value at emergenceto its value at flowering, and from its value at flowering to its value at maturity, based onthermal time:WARNING: these equations are not current to what is used in <strong>CropSyst</strong>NC crit = NCcrit early - (CGD day - CGD emerge ) · (NCcrit early - NCcrit flower )CGD flower - CGD emergeand similarly for after flowering:WARNING: these equations are not current to what is used in <strong>CropSyst</strong>NC crit = NCcrit flower - (CGD day - CGD flower ) · (NCcrit flower - NCcrit mature )CGD mature - CGD flowerNCmin (kg/kg)is the minimum plant nitrogen concentration at which growth stops, also scaled based onthermal time:NC crit = NCmin early - (CGD day - CGD emerge ) · (NCmin emerge - NCmin flower )CGD flower - CGD emergeNCcrit early (kg/kg)NCcrit floweris plant critical nitrogen concentration during early growth. It is calculated as 0.65 (C 3species) or 0.35 (C 4 species) times the value of plant maximum nitrogen concentration atduring early growth crop parameter.⎤⎦
this isF critNCcrit flower = F crit · Nmax floweris the xxxxx 0.65 for C 3 species and 0.35 for C 4 species.NCmin early (kg/kg)This parameter is obsolete: is the minimum plant nitrogen concentration at which growthstops at emergence crop parameter.NCmin flowerthis isNCmin flower = f min · NCmax flowerF minis the xxxxx 0.5 for C 3 species and 0.25 for C 4 species.NCmax floweris based on the maximum nitrogen concentration at maturity and the crop parameters:translocation factor , and harvest index .NC mature (kg/kg)NCmax flower = Nmax mature · (1 - translocation)1 - HIThis parameter is obsolete: is the critical plant nitrogen concentration at maturity. It iscalculated as NCcrit_early by taking the maximum plant nitrogen concentration at maturitycrop parameter as the base.NCmin matureis the minimum plant nitrogen at which crop growth stops at maturity .NCONCa (kg/kg)is the plant nitrogen concentration after new growth. This is equal to the ratio of cropnitrogen mass to total crop biomass (including new growth). If the plant nitrogenconcentration after new growth,calculated in this manner, is less than the critical nitrogenconcentration, then potential new growth cannot be supported and both growth and nitrogenconcentration after new growth must be corrected according to the following equation:CNUNCONC a =CTM + CRM + G Npot ·[1 - NC crit - NCONC aNC crit - NC min]where
CNU (kg/m²)is cumulative nitrogen uptake.CTM, CRM (kg/m²)are top and root cumulative biomass.The third term in the denominator is the nitrogen-dependent new growth (kg/m²). To solvefor NCONCa, this equation must be arranged into a quadratic:NCONC a = -b + sqrt(-b2 - 4ac)2aa = G Npotb =b (NC crit - NC min ) - ( CTM + CRM + G Npot ) - G Npot · NC critc = - CNU · ( NC crit - NC min )
Crop nitrogen uptakeCrop nitrogen uptake was modeled by modifiying the approach of Godwin and Jones, 1991 . Cropnitrogen uptake is determined as the minimum of crop nitrogen demand and potential nitrogen uptake.Crop nitrogen demand is the amount of nitrogen the crop needs to meet its potential growth, as limited bylight, temperature and water, plus any deficiency demand.The deficiency demand is the difference between the crop maximum and actual nitrogen concentrationbefore new growth.whereND (kg/ha)is the crop nitrogen demand.NC max (kg N/kg biomass)ND = (NC max - NCONC b ) · (TM + RM) + NC max · (RG pot + TG pot )is the crop maximum nitrogen concentration.NCONCb (kg N/kg biomass)is crop nitrogen concentration before new growth.TM (kg/ha)is the cumulative above ground crop biomass.RM (kg/ha)is the cumulative root biomass.RG pot (kg/ha)is the potential new root growth.TG pot (kg/ha)is the potential new top growth.ND represents the deficiency demand, and the second term represents the nitrogen demand for newgrowth. It is possible to have a negative nitrogen deficiency demand when the supply of nitrogen issufficient ( Godwin and Jones, 1991 ). This occurs as the plant matures and its maximum nitrogenconcentration declines faster than the plant grows.If the deficiency demand becomes negative, the plant has a nitrogen reserve.The potential nitrogen uptake is calculated for each soil layer and summed for the soil profile.whereNup l (kg N/ha/day)is the potential nitrogen uptake for layer l.N upl = UP max · RL · N avail · PAW 2
UP max (kg N/day/m)is the maximum nitrogen uptake per unit length of root.RL (m/ha)is the root length.N avail (0-1)is a nitrogen availability factor given by Godwin and Jones, 1991 :N disp = 1.0 e (-a · N s )whereais a constant (0.0275 for nitrate and 0.025 for ammonium).N S (kg/ha)is the soil nitrogen concentration. Because the equilibrium between sorbed and solutionammonium is calculated only once a day, N S for ammonium is taken as total ammoniuminstead of solution ammonium, i.e., it is assumed that the solution is replenished with newammonium from the exchange sites as needed for uptake.PAWis the plant available water .
Nitrogen fixationFor crops such as legumes, <strong>CropSyst</strong> decreases nitrogen demand by supplying additional nitrogenproduced by nitrogen fixing bacteria.whereND pot (kg/ha)is the nitrogen demand .ND act (kg/ha)ND act = ND pot - N fixationis the nitrogen demand accounting for nitrogen fixation for legumes and will replace the normalcrop nitrogen demand (ND).Nfixation (kg/ha)is the fixed nitrogen.The rate of nitrogen fixation follows the development of crop growth. The potential amount of fixednitrogen may be reduced by plant available water, mineral nitrogen content in the root zone and soiltemperature.whereFix r (0-1)N fixation = min [ ND pot · Fix r , 6.0 (kgN/ha)/ day ]Fix r = Fix p · min(Fix w , Fix n , Fix t )is the fraction of daily nitrogen demand supplied by fixation.Fix p (0-1)Fix wis the effect of crop development.Fix p =⎧⎪⎨⎪⎩CGD day⎯⎯⎯⎯⎯⎯⎯⎯CGDflower beginif active growth1.0 if senescence (grain filling)1.0 - [ CGD day - CGDgf begin / CGDfix end - CGDgf begin ] if senescentDuring senescence, fixation is reduced from the start of grain filling to a point halfway betweengrain filling and physiological maturity at which fixation is zero.limits fixation based on plant available water (PAW) in the first 10 to 30 cm of the soil profile.
Fix w is constrained to the range [0,1].Fix w = (PAW - 0.5)/0.5Fix nFix t (ºC)limits fixation based on the mineral nitrogen content in the root zone. The rate of bacterial fixationis reduced when nitrogen is already present.whereFix n =⎧⎨⎩0.0 if N rootzone > 300 kgN/ha1.0 if N rootzone < 100 kgN/ha1.0 - (N rootzone - 100) / 200 otherwiseN rootzone (kg Nl/ha) is the total N content (both as nitrate and ammonium) within the root zone.limits fixation based on the subsurface soil temperature (up to 30cm).Fix t =⎧⎨⎩1.0 if t > 30ºC and T < 36ºC0.7 if t > 36ºC0.0 if t < 0ºCt/30ºC if t > 0ºC and T < 36ºC
Nitrogen SimulationsThe components of the nitrogen budget in <strong>CropSyst</strong> include: transport, transformation, ammoniumsorption, crop nitrogen uptake and residue mineralization.Nitrogen transport in the soilNitrogen transport through the soil profile has been modelled many different ways. Complexmethods using numerical solutions such as the one described by Murali and Aylmore, 1981 , theSHAW model ( Flerchinger, 1987 ), or the LEACHM model ( Wagnet and Hutson, 1989 ) areavailable.However, they are not very practical when used within a cropping systems model which simulatesmany other processes for a large number of crop rotation cycles. Simple approaches are thenpreferable. Examples of simple but sound approaches are found in the literature ( Rose et al.,1982a and Rose et al., 1982b , and Corwin et al., 1991 ). The method included in <strong>CropSyst</strong> isadapted from the concepts of Corwin et al., 1991 and implement to transport nitrogen in the soil inone day time step in days when water infiltrates into the soil.Corwin et al., 1991 proposed a simple mass-balance approach to solute transport. Their approachincluded a bypass coefficient (BC) to describe the fraction of water in a soil layer that is bypassed,while (1-BC) represents the fraction of the soil water subject to piston-type displacement. Thebypass coefficient simplistically accounts for flow through cracks and macropores. The practicaleffect is to produce the flow of a mobile water phase independent of the immobile phase of water.The nitrogen concentration of the water remaining within and leaving a layer can be calculatedthree ways, depending upon the initial water content and the amount of water to reach a layer. Aswater enters a layer, it first fills the layer to field capacity if enough water is available. Once thelayer is at field capacity, the incoming water begins to replace the existing water (excludingbypassed volume) and the existing water is moved out of the layer. The incoming water continuesto replace the existing water until all the existing water is replaced and then the incoming waterbegins to move out of the layer.If the amount of water to reach a layer is enough to fill the layer to field capacity and replace theexisting mobile water, then the nitrogen concentration of the the layer is:C out = W in · C in - ∆Z l · (FC - BC · WC bi ) · C in + (1 - BC) · ∆Z l · WC bi · C biW outand the layer nitrogen concentration after the water input event is:whereC ai = (FC - BC · WC bi ) · C in + BC · WC bi · C biFC
C out (kg N/m³ water) is the nitrogen concentration of the water leaving the layer.C ai (kg N/m³ water) is the nitrogen concentration of the water within the layer after awater input event.C bi (kg N/m³ water) is the nitrogen concentration of the water within the layer before awater input event.C in (kg N/m³ water) is the nitrogen concentration of the water that enters the layer.BC (dimensionless, 0-1) is the bypass coefficient.∆Z l(m) is the layer thickness.WC bi (m³/m³) is the volumetric water content before water input.WC in (m) or (m³ water/m² soil) is the water depth entering the layer.WC out (m)or (m³ water/m² soil) is the water depth leaving the layer.If the amount of water to reach a layer is not enough to completely replace the existing mobilewater but is greater than the amount required to fill the layer to field capacity, then:C out = C biIf the amount of water to reach a layer is less than the amount required to fill the layer to fieldcapacity, then:C out = 0Nitrogen transformations in the soilThe nitrogen transformations developed for <strong>CropSyst</strong> include net mineralization, nitrification anddenitrification , which are simulated using first order kinetics ( Stöckle and Campbell, 1989 ) andassumed to occur in the to 30 to 50 cm of the soil profile. Net mineralization is the transformationof organic matter nitrogen to ammonium, resulting from the opposite process of mineralization andimmobilization. Nitrification is the process that transforms ammonium to nitrate. Denitrificationconverts nitrate to gaseous nitrogen, which is lost to the atmosphere. Because thesetransformations are temperature dependent, soil temperature simulation is included in the modelusing a method similar to that proposed by Sharpley and Williams, 1990 ).MineralizationThe amount of organic matter nitrogen mineralized is calculated by:MIN = MIN pot · (1 - MF · e (-MRATE · ∆t) )whereMIN (kg/ha) is the amount of organic matter nitrogen mineralized to ammonium in timet (one day).MINpot (kg/ha) is the potential amount of organic matter nitrogen available to mineralize.
MRATE (1/day) is mineralization rate constant found by:NitrificationMRATE = 1/7 · e ⎡ ⎣17.753 - 6350.6T s - 273whereT s (ºC) is the soil temperature.-273 converts to degrees Celcius to Kelvin.MF is a soil moisture function dependent on the fraction of pore spacecontaining water.MF =⎤⎦⎧ 1.11 if DS < 0.9⎨10.0 - 10.0 · DS if DS > 0.9⎩where DS is the degree of saturation (0-1) obtained by:WSDS =1 - BD/2.56The daily amount of nitrified ammonium is found using:NIT = NH 4 · (1 - e (-NRATE · ∆t ) ) · MFwhereNIT (kg NH 4 / ha) is the amount of ammonium nitrogen transformed to nitrate in time t(one day).NH 4 (kg / ha) is the amount of ammonium nitrate available for nitrification.NRATE (1 / day) is the nitrification rate constant, and MF is the soil moisture function.The nitrification rate constant is given by the nitrification rate constant at 35 ºC multipliedby a function of soil temperature.whereNRATE =⎧ (0.0105 · Ts + 0.00095 · Ts 2 · NRATE 35 ) if 10ºC > Ts⎨ (0.032 · Ts - 0.12) · NRATE 35 if 35ºC > Ts > 10 ºC⎩(-0.1 · Ts + 4.5) · NRATE 35 if Ts > 35 ºC
NRATE 35 = 0.8 (1/day) is the nitrification rate constant at 35 ºC .T s (ºC) is the soil temperature.DenitrificationThe daily amount of denitrification that occurs is determined by:whereDEN = NO 3 · ( 1 - e -DRATE · ∆t) )DEN (kg N/ha) is the amount of nitrate nitrogen that denitrifies to gaseous nitrogen intime t (one day).NO3 (kg/ha) is the amount of nitrate available for denitrification.DRATE (1/day) is the denitrification rate constant determined from the denitrificationrate value at 15 ºC modified by a soil temperature function and a soilwater function.DRATE =⎧ 0.67 · e (0.43 · (Ts - 10)) · DRATE 15 · WCCF if Ts < 10ºC⎨e⎩(0.08 · (Ts - 15)) · DRATE 15 · WCCF if Ts > 10 ºCwhereT s (ºC) is the soil temperature.DRATE 15 (1/day) is the denitrification rate constant 15 ºC.WCCF is a water content correction function, given by:Ammonium SorptionWCCF = e (0.304 + 2.94 · WC sat - WC) - 47 · (WC sat - WC)²)whereWC sat (m³/m³) is volumetric water content at saturation.WC (m³/m³) is the current volumetric water content.Ammonium in the soil is either sorbed to the soil solid phase or in the solution soil water,and therefore available to move with water.A Langmuir relationship is used to relate ammonium in solution and ammonium in the soilmatrix ( Campbell, 1985 ).NH 4x = C · Q · NH 4s1 + C · NH 4S
whereNH 4X (kg NH 4 /kg soil)is the ammonium held on the exchange sites.C, Q (kg/kg) are constants for different soils and solutes.NH 4S (kg NH 4 / kg H 2 O) is the ammonium in the soil solution.The total amount of ammonium in the soil layer is related to the ammonium in solution andthe ammonium sorbed by:NH 4 = (NH 4XS + WC wt · NH 4S ) · ρ bwhereNH 4 (kg N/m³ soil) is the total amount of ammonium in the soil.NH 4XS (kg N/kg soil) is the amount of sorbed ammonium.WC wt ((kg H2O)/(kg soil)) is the gravimetric water content.NH 4S (kg/m³) is the soil solution ammonium concentration.ρ b (tonne/cm³) Is the soil bulk density.Combining equations for NH 4X and NH 4 , a quadratic equation is obtained to solve for theammonium in soil solution.Crop nitrogen uptakeCrop nitrogen uptake is a function of the crop.Nitrogen Fixation (legumes)Nitrogen fixation is a function of legumes and other crops supporting nitrogen fixationResidue nitrogen net mineralizationResidue nitrogen net mineralization is a function of residue decomposition .
Actual residue evaporationActual residue evaporation is assumed to be proportional to the ratio of residue water content to residuewater holding capacity ((3 kg H 2 O)/(kg Residue)) when residue water content is lower than its waterholding capacity; otherwise it is assumed to be at its potential rate .
Residue redistributionResidue redistribution occurs when management events (such as tillage, residue removal, or othermanagement operations involving machinary) disturb the residue and soil surface.Redistributing the soil surface residueWarning this needs to be updated Surface residue is recomputed as:Residue surface = Residue surface · Tillage surface / 100whereResidue surface (kg/m²) is the surface residue.Tillage surface is the percentage of surface residue remaining on the surface after the(%)tillage operation.Shallow incorporated residue is accumulated when a portion of the surface residue is buried. Thetotal shallow incorporated residue after each tillage operation is estimated by:Residue shallow = Residue shallow + Residue surface · Tillage shallow / 100whereResidue shallow (kg/m²) is the incorporated shallow residue.Tillage shallow is the fraction of surface residue that is buried at 5 to 8 cm by the tillage(0-1)operation.
Residue decompositionThe residue left on the ground is buried by tillage operations and gradually decomposes.The modeling of these processes is important because the residue mulch reduces erosion and helps thesoil retain water. The daily residue loss is simulated in the program.A simple model for simulating residue decomposition is based on the work of Bristow et al., 1986 andStroo et al., 1989 . Soil moisture, temperature and residue endurance factors are taken into account in thecalculation of the rate of residue decomposition.Residue lossIt is assumed that the rate of residue loss is directly proportional to the mass of residue present:where∆R = R d - R d-1 = -R d-1 · ∆t / τ∆R (kg/m²) is the residue loss (decomposed).Rd (kg/m²) is today's residue mass.R (d-1) (kg/m²) is yesterday's residue mass.t (day) is the time step.∆t (day) is the time constant of the residue input parameter .After the residue has decomposed by 90%,this is set to 105 days (for the decomposition of lignins).This equation can be rearranged to give:R d - R d-1 ·[1 -∆t)]τ/f(CN R&SThe time step, t, under ideal laboratory conditions, is related to the time step in the field, t field , by:∆t = f(W,T) · ∆ t fieldso, considering that the time interval for the simulation (which is equivalent to t field ) is one day,then by combining equations for ∆R and ∆t the following expression is obtained:·[R d - R d-1 1 - f(W,T)] τwheret field (daily simulation time step)
corresponds to 1 day.f(W,T) f(W,T) = min[f(W), f(T)]is a residue loss rate factor dependent on the temperature and the soil water content.f(W), F(T)are moisture and temperature factors respectively, and the minimum of the two will bechosen for f(W,T). The range of both f(W) and f(T) is 0.1 to 1.0 ( Stroo et al., 1989 ).f(CN R&S )is a function of the current residue carbon/nitrogen ratio, calculated by including the currentsoil mineral nitrogen as part of the potential residue nitrogen:f(CN R&S ) = e [ -0.693 · (CN R&S- 25) / 25 ]carbon OM · R dCN R&S =(N residue + NasNO 3 + NasNH 4 )wherecarbon OM is the fraction of carbon in organic matter.(kg/m²) is the residue nitrogen content.N residueNasNO 3NasNH 4(kg/m²) are the soil respective soil layer nitrogen contents.The value of f(CN R&S ) is set equal to 1 when the nitrogen simulation option is disabled.Moisture factorThe general algorithm of the moisture factor ( Bristow et al., 1986 ) is:where for surface residues:f(W) =⎧⎨⎩1.0 if WC > WC optWCotherwiseWC optWC (m³ H 2 O/kg Residue) is the residue water content.WC opt (0.003 m³ H 2 O)/kg Residue) is residue water holding capacity.and for subsurface residues:WC (m³/m³) is the water content of the respective soil layer.WC opt (m³/m³) is the field capacity water content of the respective soil layer.
Note: Subsurface residues (shallow, deep, and deeper) are distributed into the first three soilsublayers respectively (up to 30 cm) :Temperature factorThe temperature factor, f(T), is calculated with an empirical equation ( Stroo et al., 1989 ):2 · [(Tmax + Tmin)/2 + a] 2 · (T m + a) 2 - [ (Tmax -Tmin)/2 + a] 4f(T) = 1.32 ·(T m + a) 4whereTmax, Tmin (ºC) are the daily maximum and minimum temperatures respectively.Tm (30 ºC) is the optimal temperature for residue decomposition.a (6.1 ºC) is an empirical constant.
Residue nitrogen net mineralizationDecomposition of residues may release nitrogen (mineralization). Nitrogen is either taken up from orreleased to the soil, depending on Carbon/Nitrogen ratio of the residue.The net residue nitrogen mineralization can be computed using the following expression ( Shaffer et al.,1991 ):whereRNM net = ∆R · carbon OM · ( 1/ CN R - 0.042)∆R ((kg/m²)/day) is the amount of residue decomposed during the day .RNM net ((kg/m²)/day) is the daily net residue nitrogen mineralized.0.042 is the inverse of a carbon/nitrogen ratio equal to 24.CN Ris the carbon/nitrogen ratio of the residue:CN R = carbon OM · R dN residuewherecarbon OM (taken as 0.4) is the fraction of carbon in organic matter.N residue (kg/m²) is the residue nitrogen content.R d (kg/m²) is today's residue mass.The net residue nitrogen mineralization assumes that net mineralization is negative or equal zero at aCarbon/Nitrogen ratio larger or equal to 24 respectively and that the Carbon/Nitrogen value for soilmicrobes is 6 ( Shaffer et al., 1991 ). If RNM net is negative, nitrogen must be subtracted from the soilmineral nitrogen pool, which has the limit given by the actual amount of mineral nitrogen available in thesoil. Negative net residue nitrogen mineralization tends to occur early in the decomposition process offresh residues which are poor in nitrogen content (large carbon/nitrogen ratios). As the residuedecompositon progresses and the growth of microbial population responsible for such decompositionstabilizes, carbon/nitrogen ratios decrease and mineralizable nitrogen starts to be released from theresidues.Each day (t = 1day), the nitrogen content of the residue needs to be updated:N residue = N residue - RNM net80% of the nitrogen released from decomposed residues is distributed to the soil ammonium pool and theremaining 20% goes to the nitrogen pool associated with stable organic matter.
Irrigation management simulationAutomatic irrigation application simulationWhen the simulation applies water in an automatic irrigation event, it uses the following formulato determine the amount of water to be applied:nl( WCΣ new - WC l ) · RD l if PAW l < PAW refilll=1wherenlis the number of soil layers.WC l (m³/m³) is the water content of layer l.is the root depth into layer l (If the root grows through the layer, RDRD l (m)l is equal tothe thickness of the layer).PAW l (0-1) is the current plant available water for layer l calculated as:PAW l = WC l - PWP lFC l - PWP lPAW refill (0-1) is the point of plant available water to refill to.WC new (m³/m³) is the water content when the soil layer is refilled to PAW refill . It is determinedby the equation:WC new = PAW refill · (FC l - PWP l ) + PWP lFC l (m³/m³) is the field capacity of layer l.PWP l (m³/m³) is the permanent wilting point of layer l.Specific irrigation application simulationneed to discuss
Nitrogen fertilizer applicationNitrogen fertilizer may be applied in any combination of the following forms:● organic manure● organic NH3● NH4 preparation● N03 preparationThe application events may occur at times as specified in the management events table or automaticallyas determined by the simulation based on one of three sets of specified criteria:● Based on optimal nitrogen allocation to plant tissues● Based on nitrogen balance● Based on local calibrationSpecific nitrogen applicationThe user may specify any number of nitrogen application events either in the form of organic material orinorganic (commercial) fertilizer.This section needs further developmentAutomatic optimal nitrogen allocationWhen automatic nitrogen fertilization is enabled growth will not be limited by nitrogen.The simulation will maintain the daily additional nitrogen requirements. This information is available inthe daily report, and the accumulated value is available in the harvest report.Automatic based on nitrogen balanceAutomatic based on local calibrationNEED TO DISCUSS ORGANIC, INORGANIC, VOLATILIZATION etc...
Simulation of the affects of tillage operationsTillage, residue, and other management operations affect the redistribution of residues and change thesoil surface characteristics.Residue redistributionResidue redistribution factors are used to estimate the amounts of surface and shallow incorporatedresidues following a tillage operation or other residue treatment practices.On the day when a tillage operation is performed, surface residue is redistributed. A part of it remains onthe surface, a part is buried at 5 to 8 cm soil depth (defined as incorporated residue), and the rest is lost todeeper depths in the soil. The portion of residue buried below 8 cm soil depth is considered to have littleor no contribution to erosion control.A code for each tillage operation as well as the redistribution factors for surface and incorporated residuehas been tabulated by the USDA-SCS Spokane, WA office (personal communication, 1987). When thesimulation day matches the date that a tillage operation is assigned, the code of the operation is invokedand the amount of current surface residue is set. Residue redistribution occurs for each residue pool.Soil surface detachability and roughnessThe surface soil detachability and roughness factor (SDR) is evaluated after each tillage operation.The data relating SDR and tillage operations are from the USDA/SCS National Engineering Handbook (USDA-SCS, 1988a ).Depressional storageNeed description This affects water storage in the finite difference numerical runoff simulation mode.
Bibliography[Arnold and William, 1989]Arnold, J. and William, J. R. (1989). Stochastic generation of internal storm structure at a point.Transactions of the ASAE, 32(1):161--167.[Bristow et al., 1986]Bristow, R. L., Cambell, G. S., Papendick, R. I., and Elliot, L. F. (1986). Simulation of heat andmoisture transfer through a surface residue - soil system. Agriculture and Forestry Meteorology,36:193--214.[Bristow and Campbell, 1984]Bristow, R. L. and Campbell, G. S. (1984). On the relationship between incoming solar radiationand daily maximum and minimum temperature. Agriculture and Forestry Meteorology,31:159--166.[Campbell, 1985]Campbell, G. (1985). Transport Models for Soil-Plant Systems. Elsevier, Amsterdam, Netherlands.[Campbell and Diaz, 1988]Campbell, G. S. and Diaz, R. (1988). Simplified Soil-Water Balance Models to Predict CropTranspiration. ICRISAT, Patancheru, India. Bidinger, F. R. and Johnson, C. (eds.).[Corwin et al., 1991]Corwin, D. L., Waggoner, B. L., and Rhoades, J. D. (1991). A functional model of solute transportthat accounts for bypass. Journal of Evironmental Quality, 20:647--658.[Flerchinger, 1987]Flerchinger, G. N. (1987). Simultaneous Heat and Water Model of a Snow-Residue-Soil System.dissertation, Washington State University.[Godwin and Jones, 1991]Godwin, D. C. and Jones, A. C. (1991). Modeling Plant and Soil Systems. nitrogen dynamics insoil-plant systems. American Society of Agronomy, 31:297--302.[Gregory, 1982]Gregory, J. M. (1982). Soil cover prediction with various amount and types of crop residue.Transactions of the ASAE, 25:1333--1337.[McCool and Krauss, 1981]McCool, D. and Krauss, H. (1981). A system for calculating crop management factors for pacificnorthwest non-irrigated croplands. In Annual meeting, Pacific Northwest Region ASAE, number81 in Paper PNW, page 213, Edmonton, Alberta Canada.[McCool, 1976]McCool, D. K. (1976). Program to calculate crop management factors for the usle. Personalcommunication.[McCool et al., 1987]McCool, D. K., Brown, L. C., Foster, G. R., Mutchler, C. K., and Meyer, D. (1987). Revised slope
steepness factor for the universal soil loss equation. Transactions of the ASAE, 30:1387--1396.[Monteith, 1965]Monteith, J. (1965). Climate and the efficiency of crop production in britain. Phil. Trans. Res. Soc.London, 281:277--329.[Murali and Aylmore, 1981]Murali, V. and Aylmore, L. A. (1981). Model Description and some Simulations.aconvective-dispersive-adsorptive flow model for solute transport in soils. Australian Journal ofSoil Reasearch, 19:32--39.[Priestley and Taylor, 1972]Priestley, C. and Taylor, R. J. (1972). On the assessment of surface heat flux and evaporationusing large scale parameters. Monthly Weather Review, 100:81--92.[Rose et al., 1982a]Rose, C., Chichester, F., Williams, J. R., and Ritchie, J. T. (1982a). Application of an approximateanalytic method of computing solute profiles with dispersion in soils. Journal of EvironmentalQuality, 11(1):151--155.[Rose et al., 1982b]Rose, C., Chichester, F., Williams, J. R., and Ritchie, J. T. (1982b). A contribution to simplifiedmodels of field solute transport. Journal of Evironmental Quality, 11(1):146--150.[Schwab et al., 1993]Schwab, G. O., Fangmeier, D. D., Elliot, W. J., and Frevert, R. K. (1993). Soil and WaterConservation Engineering. John Willey & Sons, Inc., New York, NY USA, 4 edition.[Shaffer et al., 1991]Shaffer, M. J., Halverson, A. D., and Pierce, F. J. (1991). Nitrate leaching and economic analysispackage (NLEAP): Model description and application.managing nitrogen for groundwater qualityand farm profitiblity. Soil Science Society of America.[Sharpley and Williams, 1990]Sharpley, A. and Williams, J. R. (1990). Epic, erosion, productivity impact calculator: 1. modeldocumentation. Technical Bulletin 1768, U.S. Dept. of Agriculture.[Stöckle and Campbell, 1989]Stöckle, C. and Campbell, G. (1989). Simulation of crop response to water and nitrogen: Anexample using spring wheat. Transactions of the ASAE, pages 66--68.[Stöckle et al., 1992]Stöckle, C., Martin, S., and Cambell, G. (1992). A model to assess environmental impact ofcropping systems. Amer. Soc. of Agr. Eng., 92(2041).[Stroo et al., 1989]Stroo, Bristow, R., Elliot, R., and Campbell, G. S. (1989). Predicting rates of wheat residuedecomposition. Soil Science Society of America (Journal), 53:91--99.[Tanner and Sinclair, 1983]Tanner, C. B. and Sinclair, T. R. . (1983). Limitations to Efficient Water Use in Crop Production.efficient water use in crop production: research or research? American Society of Agronomy, Crop
Science Society of America, Soil Science Society of America.[USDA-SCS, 1988a]USDA-SCS (1988a). National Engineering Handbook, chapter Hydrology Section 4:4-10. InUSDA-SCS, 1988b .[USDA-SCS, 1988b]USDA-SCS (1988b). National Engineering Handbook. U.S. Government Printing Office:USDA,Washington D.C.[van Rooij, 1987]van Rooij, C. W. D. M. (1987). Two computer models to predict the maximum frost penetration inthe soil. University of Idaho, Moscow, ID.[Wagnet and Hutson, 1989]Wagnet, R. and Hutson, J. (1989). LEACHM. Water Resources Institute. Cornell University,Ithaca, NY.[Wischmeier and Smith, 1978]Wischmeier, W. H. and Smith, D. D. (1978). Predicting rainfall erosion losses - A guide toconservation planning, page 537. In USDA-SCS, 1988b .