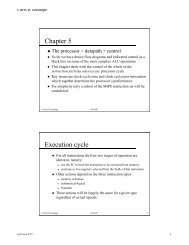
40 BLOK ET AL. / EFFECTIVENESS OF EARLY CHILDHOOD EDUCATIONTable 2Summary <strong>of</strong> characteristics <strong>of</strong> the studies in the meta-analysisVariablesReferences Experimental comparisons 1 2 3 4 5 6 7 8 9 10 11 12 13 14 15 16 17Baker et al., 1998. Cohort I (Hippy vs. Control) 0 0 1 0 90 37 32 58 80 1 1 1 14 2 0 0 1Cohort II (Hippy vs. Control) 0 0 1 0 91 47 66 54 75 1 1 1 20 2 0 0 1Gersten et al., 1988. Direct instruction (K-3) vs.1 1 0 0 70 54 121 64 83 9 1 2 40 9 1 0 1ComparisonGoodson et al., 2000. Comprehensive Child Development 0 0 0 0 90 1640 1560 18 74 1 1 1 33 1 0 1 1Program vs. ControlHowell et al., 1990. Peabody LDK-R vs. Control 1 1 0 0 88 19 19 55 98 1 1 2 6 4 0 0 0Boehm RG vs. Control 1 1 0 0 88 19 19 55 98 1 1 2 6 4 0 0 0Bracken CDP vs. Control 1 1 0 0 88 19 19 55 98 1 1 2 6 4 0 0 0Johnson & Walker, 1987, Houston Parent–Child Development 0 1 1 0 75 51 88 12 100 1 1 3 20 7 0 0 11991; Walker & Johnson,1988.Program vs. ControlKagitcibasi et al., 2001. Education daycare (ED) with m<strong>other</strong> 0 0 0 1 85 27 37 48 0 1 1 1 14 2 0 0 1training (MT) vs. ED without MTCustodial daycare (CD) with m<strong>other</strong> 0 0 0 1 85 40 65 48 0 1 1 1 14 2 0 0 1training (MT) vs. CD without MTHome care (HC) with (MT) vs. HC 0 0 1 1 85 23 63 48 0 1 1 1 14 2 0 0 1without MTLee et al., 1988; 1990. Head Start vs. No preschool 1 1 1 0 69 333 204 50 100 1 1 2 9 20 0 0 0Head Start vs. Other preschool 1 1 0 0 69 333 109 50 100 1 1 2 9 20 0 0 0Olds et al., 1994; Treatment 3 vs. Treatment (1 þ 2) 0 0 1 0 77 78 148 0 0 1 1 1 4 1 0 0 1Olds et al., 1998. Treatment 4 vs. Treatment (1 þ 2) 0 0 1 0 77 88 148 0 0 1 1 1 24 1 0 0 1Slavin et al., 1990;Success for All (SFA) preschool0 1 0 0 87 40 40 49 90 9 1 2 10 15 1 0 1Madden et al., 1993. 1987/1988 vs ControlSFA kindergarten 1987/1988 vs. Control 0 1 0 0 87 60 60 60 90 9 1 2 10 25 1 0 1SFA grade 1 1990/1991 vs. Control 0 1 0 0 90 246 246 49 99 9 1 2 30 12 0 0 1SFA grade 2 1990/1991 vs. Control 0 1 0 0 90 185 185 49 99 9 1 2 30 12 0 0 1Ramey et al., 2000.Abecedarian (preschool þ K-2 transition) 0 1 0 0 72 25 22 4 98 1 1 3 96 13 1 1 1vs. ControlAbecedarian (preschool only) vs. Control 0 1 0 0 72 22 22 4 98 1 1 3 50 20 0 1 1Reynolds, 1994.Chicago CPC <strong>and</strong> EP (full intervention) 1 0 0 0 72 160 191 42 100 9 1 2 50 15 1 0 1vs. Non-CPC comparison groupRiksen-Walraven et al., 1996. Instapje vs. Control 1 0 1 1 94 37 38 13 100 1 1 1 4 2 0 0 1Scarr & McCartney, 1988. M<strong>other</strong> Child Home Program vs. Control 0 0 0 1 78 78 39 27 60 2 2 1 20 2 0 0 1Schweinhart, 2000;Perry Preschool vs. Control 0 0 1 0 62 58 65 36 100 1 1 3 15 14 0 0 1Luster & McAdoo, 1996.Schweinhart et al., 1986. Distar vs. Control 1 1 1 0 67 23 65 36 93 1 1 3 20 13 0 0 1High/Scope vs. Control 1 1 1 0 67 22 65 36 95 1 1 3 20 13 0 0 1Nursery vs. Control 1 1 1 0 67 23 65 36 93 1 1 3 20 13 0 0 1Seitz et al., 1985. Family Support Intervention vs. Control 1 1 1 0 68 18 18 0 83 1 1 3 30 9 0 1 1Tuijl et al., 2001. Hippy vs. Control (Moroccan sample) 1 0 0 1 96 83 55 57 100 1 1 1 15 2 0 0 1Hippy vs. Control (Turkish sample) 1 0 0 1 96 122 59 57 100 1 1 1 15 2 0 0 1Wasik et al., 1990. Care þ Family Education vs. Control 0 1 0 0 78 14 22 2 90 1 1 3 48 25 0 1 1Family Education vs. Control 0 1 0 0 78 25 22 2 90 1 1 1 48 2 0 1 1Whitehurst et al., 1999. Head Start þ Emergent LiteracyIntervention vs. Head Start1 1 0 0 92 140 140 36 67 2 1 3 7 3 0 0 1See Table 1 for explanation <strong>of</strong> variables <strong>and</strong> codes.generally low. On average, 76 <strong>and</strong> 97%, respectively, <strong>of</strong> theparents were classified in the lowest category. Of the 34comparisons, 26 were conducted in the United States, 3 in theNetherl<strong>and</strong>s, 3 in Turkey, <strong>and</strong> 2 in Bermuda.<strong>The</strong> comparisons were more or less uniformly distributedwith regard to the <strong>delivery</strong> <strong>mode</strong>: 13 concerned a home-based<strong>programme</strong>, 11 a centre-based <strong>programme</strong>, <strong>and</strong> 10 a combinedhome- <strong>and</strong> centre-based <strong>programme</strong>. Because <strong>delivery</strong> <strong>mode</strong>was pertinent to our research question, the following sectionprovides a more detailed discussion <strong>of</strong> the <strong>programme</strong>sconcerned. Most comparisons were <strong>of</strong> <strong>programme</strong>s thatincluded the coaching <strong>of</strong> parenting skills (29 out <strong>of</strong> 34). Socialor economic support was much less frequently included in thecomparisons (6 out <strong>of</strong> 34).<strong>The</strong> duration <strong>of</strong> the <strong>programme</strong>s varied greatly, viz. from 4to 96 months (average: 22 months). <strong>The</strong> intensity <strong>of</strong> the<strong>programme</strong>s varied from 1 to 25 hours per week (average: 8.5hours per week). Most <strong>programme</strong>s were discontinued whenstudents entered Grade 1, or earlier. Only five comparisonsconcerned <strong>programme</strong>s that were continued after kindergarten;all these were centre-based or a combination <strong>of</strong> homebased<strong>and</strong> centre-based.
INTERNATIONAL JOURNAL OF BEHAVIORAL DEVELOPMENT, 2005, 29 (1), 35–47 41Description <strong>of</strong> <strong>programme</strong> typesAs mentioned in the Method section, we classified the earlyintervention <strong>programme</strong>s into three different <strong>programme</strong>types, namely home-based, centre-based, <strong>and</strong> a combination<strong>of</strong> home- <strong>and</strong> centre-based. Each <strong>of</strong> these <strong>programme</strong> types isdiscussed below, <strong>and</strong> each <strong>programme</strong> included in the review isbriefly mentioned in order to provide a glimpse <strong>of</strong> the variety <strong>of</strong><strong>programme</strong>s.Home-based <strong>programme</strong>s. Thirteen <strong>of</strong> the comparisons concernedhome-based interventions. Of these, seven concerned a<strong>programme</strong> based on Hippy (Lombard, 1981). Baker, Piotrkowski,<strong>and</strong> Brooks-Gunn (1998) provided two comparisonsbased on a US Hippy <strong>programme</strong>, Kagitcibasi et al. (2001)provided three comparisons based on a Turkish Hippyadaptation, <strong>and</strong> Van Tuijl, Leseman, <strong>and</strong> Rispens (2001)provided two comparisons based on a redesign <strong>of</strong> a formerDutch Hippy adaptation. All Hippy-like <strong>programme</strong>s focusedon parents as the instructors <strong>of</strong> their children, using parapr<strong>of</strong>essionalsrecruited from the parents’ community toinstruct <strong>and</strong> support the parents, <strong>and</strong> pr<strong>of</strong>essional coordinatorsto organise parent group-meetings. Programmes started whenchildren were between 4 <strong>and</strong> 5 years old, <strong>and</strong> lasted for 2 years(effectively 30 weeks per year). Each year, home visits weremade <strong>and</strong> group meetings were held every <strong>other</strong> week. Overthe course <strong>of</strong> the <strong>programme</strong>, parents received a series <strong>of</strong> bookswritten specifically for the Hippy <strong>programme</strong>, along withactivity packets, to which the parents were introduced duringthe home visits <strong>and</strong> group meetings. <strong>The</strong> packages focused onlanguage, problem-solving, <strong>and</strong> sensory skills, <strong>and</strong> were aimedat better preparing the children for school.<strong>The</strong> Comprehensive Child Development Program (CCDP)(Goodson et al., 2000) is a two-generation <strong>programme</strong> thatemployed case management <strong>and</strong> home visiting to providemultirisk, low-income children <strong>and</strong> their parents with a range<strong>of</strong> education, health, <strong>and</strong> social services. <strong>The</strong> <strong>programme</strong>served participating families until the child entered kindergartenor first grade. Most CCDP projects used home visits todeliver early childhood education for children between birth<strong>and</strong> the age <strong>of</strong> 3 years. <strong>The</strong> visits, which were made every 2weeks, were focused on the parents—educating them aboutchild development <strong>and</strong> teaching parenting skills—rather thanon providing services directly to children.Olds et al. (1998; Olds, Henderson, & Kitzman, 1994)evaluated the effects <strong>of</strong> a <strong>programme</strong> <strong>of</strong> prenatal <strong>and</strong> earlychildhood home visitation by nurses. <strong>The</strong> <strong>programme</strong> wasintended to avert preterm <strong>delivery</strong> <strong>and</strong> low birthweight, <strong>and</strong>—in the postpartum phase—developmental delays <strong>and</strong> behaviouralproblems. <strong>The</strong> nurses helped the women to improvetheir health-related behaviours <strong>and</strong> the quality <strong>of</strong> their infantcare-giving. Families in treatment group 3 were provided withhome visiting services during pregnancy only, while families intreatment group 4 received the same services until the child’ssecond birthday.‘‘Instapje’’ was a Dutch, parent-focused home-based <strong>programme</strong>(Riksen-Walraven, Meij, Hubbard & Zevalkink,1996) aimed at improving the quality <strong>of</strong> parental support infamilies from deprived socioeconomic backgrounds. <strong>The</strong><strong>programme</strong> was relatively short, consisting <strong>of</strong> 16 weeklyhome-visits only, starting when the child was 13 months old.Parents were supported on four behavioural dimensions:providing emotional support, respecting the child’s autonomy,structuring <strong>and</strong> limiting the child’s environment, <strong>and</strong> supportinglanguage development. <strong>The</strong> <strong>programme</strong> materials consisted<strong>of</strong> a manual for the m<strong>other</strong>s <strong>and</strong> a set <strong>of</strong> play materials tobe used with the child.<strong>The</strong> M<strong>other</strong> Child Home Program (MCHP), implementedwith Bermudan families, was the subject <strong>of</strong> the study by Scarr<strong>and</strong> McCartney (1988). It was a widely used US earlychildhood <strong>programme</strong> that employed home visitors to demonstrateto m<strong>other</strong>s different ways <strong>of</strong> interacting with theirchildren (2- to 4-year-olds). <strong>The</strong> 2-year <strong>programme</strong> consisted<strong>of</strong> home visits made every <strong>other</strong> week. One <strong>of</strong> the key goals wasto teach m<strong>other</strong>s to be effective teachers.Wasik, Ramey, Bryant, <strong>and</strong> Sparling (1990) reported on theeffectiveness <strong>of</strong> a family education intervention <strong>programme</strong>designed ‘‘. . . to help the parent foster the cognitive <strong>and</strong> socialdevelopment <strong>of</strong> the child’’ (p. 1686). <strong>The</strong> <strong>programme</strong> calledfor regular home visits (weekly for the first 3 years, <strong>and</strong> thenless frequently), starting a month after the child’s birth <strong>and</strong>continuing throughout the preschool years. Home visitorsdiscussed ongoing concerns with parents <strong>and</strong> <strong>of</strong>fered problemsolvingstrategies to cope with difficult situations.Centre-based <strong>programme</strong>s. Eleven <strong>of</strong> our comparisons concernedcentre-based interventions, each <strong>of</strong> which involved amore or less specific school curriculum. Gersten, Darch, <strong>and</strong>Gleason (1988) evaluated a direct instruction curriculum,Howell et al. (1990) evaluated three preschool languagecurricula, Lee et al. (1988, 1990) evaluated generic HeadStart <strong>programme</strong>s, Slavin et al. (1990) <strong>and</strong> Madden et al.(1993) evaluated SFA, <strong>and</strong> Reynolds (1994) evaluated theCPC&EP.Most <strong>of</strong> these curricula were continued into the first threegrades, with the exception <strong>of</strong> the preschool language curriculaevaluated by Howell et al. <strong>and</strong> the Head Start <strong>programme</strong>sevaluated by Lee. <strong>The</strong> sample Lee was concerned withconsisted <strong>of</strong> children who had attended preschool in 1969/1970, which makes their evaluation valid only for Head Start asit existed about 30 years ago. Furthermore, all children in theHowell et al. study (i.e., both those in the experimental groups<strong>and</strong> those in the control group) received Head Start, the maindifference between the groups being the supplementarylanguage curriculum they received.<strong>The</strong> <strong>other</strong> <strong>programme</strong>s in the centre-based category werebased on the idea that early intervention <strong>programme</strong>s shouldbe continued in the early grades. <strong>The</strong> direct instruction<strong>programme</strong> evaluated by Gersten et al.—which focused onintegrating cognitive with social development—started inkindergarten, using specific teaching materials. <strong>The</strong> authorsstressed that most <strong>of</strong> the academic content was taught throughgames <strong>and</strong> <strong>other</strong> forms <strong>of</strong> informal social interaction. However,they were less clear about the direct instruction <strong>programme</strong> inGrades 1 to 3.<strong>The</strong> SFA <strong>programme</strong> has been described in detail by Slavinet al. <strong>and</strong> Madden et al. SFA comprised half-day preschool <strong>and</strong>full-day kindergarten <strong>programme</strong>s, with a heavy emphasis onlanguage <strong>and</strong> reading. Readiness activities included the use <strong>of</strong>the Peabody Language Development Kit, which the Howell etal. study also included. <strong>The</strong> reading <strong>programme</strong> in Grades 1 to3 included regrouping students into homogeneous readinggroups, increasing direct instruction time, <strong>and</strong> using readingtutors to provide one-to-one instruction. Each participatingschool favoured a family support team, providing parentingeducation <strong>and</strong> encouraging parents to support their children’s