PMA Quarterly Printing and Camera Trends Report
PMA Quarterly Printing and Camera Trends Report
PMA Quarterly Printing and Camera Trends Report
- No tags were found...

Create successful ePaper yourself
Turn your PDF publications into a flip-book with our unique Google optimized e-Paper software.
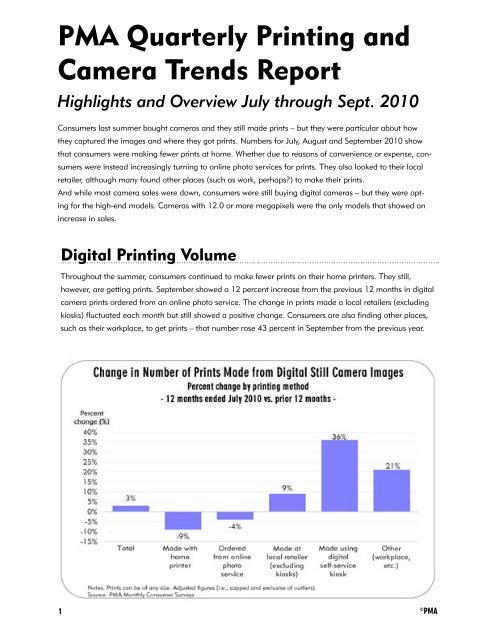
<strong>PMA</strong> Monthly Consumer Survey <strong>and</strong> The NPD Group <strong>Camera</strong> <strong>Report</strong>s<strong>PMA</strong> <strong>Quarterly</strong> <strong>Printing</strong> <strong>and</strong><strong>Camera</strong> <strong>Trends</strong> <strong>Report</strong>Highlights <strong>and</strong> Overview July through Sept. 2010Consumers last summer bought cameras <strong>and</strong> they still made prints – but they were particular about howthey captured the images <strong>and</strong> where they got prints. Numbers for July, August <strong>and</strong> September 2010 showthat consumers were making fewer prints at home. Whether due to reasons of convenience or expense, consumerswere instead increasingly turning to online photo services for prints. They also looked to their localretailer, although many found other places (such as work, perhaps?) to make their prints.And while most camera sales were down, consumers were still buying digital cameras – but they were optingfor the high-end models. <strong>Camera</strong>s with 12.0 or more megapixels were the only models that showed anincrease in sales.Digital <strong>Printing</strong> VolumeThroughout the summer, consumers continued to make fewer prints on their home printers. They still,however, are getting prints. September showed a 12 percent increase from the previous 12 months in digitalcamera prints ordered from an online photo service. The change in prints made a local retailers (excludingkiosks) fluctuated each month but still showed a positive change. Consumers are also finding other places,such as their workplace, to get prints – that number rose 43 percent in September from the previous year.1©<strong>PMA</strong>
<strong>PMA</strong> Monthly Consumer Survey <strong>and</strong> The NPD Group <strong>Camera</strong> <strong>Report</strong>s2©<strong>PMA</strong>
<strong>PMA</strong> Monthly Consumer Survey <strong>and</strong> The NPD Group <strong>Camera</strong> <strong>Report</strong>sDigital <strong>Printing</strong> Share – DetailOne notable trend is consumer are increasingly placing their print orders online <strong>and</strong> then picking them up atretail. In August there was a 2 percent increase in year-over-year figures; that increase was nearly 4 percentin September. In all three months there was a decline in printing from home (29 percent in July, 28 percent inAugust <strong>and</strong> 26.6 percent in September).3©<strong>PMA</strong>
<strong>PMA</strong> Monthly Consumer Survey <strong>and</strong> The NPD Group <strong>Camera</strong> <strong>Report</strong>s4©<strong>PMA</strong>
<strong>PMA</strong> Monthly Consumer Survey <strong>and</strong> The NPD Group <strong>Camera</strong> <strong>Report</strong>sDigital <strong>Printing</strong> Share – Channel <strong>Trends</strong>Including prints ordered online <strong>and</strong> picked up at a store, the retail channel accounted for about 57 percentof the printing volume in all three months. That is an increase across the board – with a 5 percent increasein July <strong>and</strong> a 4 percent increase in September. While online players saw their market share dip in July, itincreased slightly (from 13.6 percent to 14.0 percent) in September. Home printing, as a share of total printing,declined all three months.5©<strong>PMA</strong>
<strong>PMA</strong> Monthly Consumer Survey <strong>and</strong> The NPD Group <strong>Camera</strong> <strong>Report</strong>s<strong>Printing</strong> OverviewThe results are from the <strong>PMA</strong> Monthly Consumer Survey, which is distributed to a panel of U.S. households.Results are sought from 2,500 prospective respondents each monthndents.6©<strong>PMA</strong>
<strong>PMA</strong> Monthly Consumer Survey <strong>and</strong> The NPD Group <strong>Camera</strong> <strong>Report</strong>sNPD <strong>Camera</strong> SalesHighlights <strong>and</strong> OverviewJuly, August <strong>and</strong> September 2010<strong>Camera</strong> salesIn general, overall camera sales are down slightly from the past year, although August 2010 data showed a3 percent increase from the previous year due to a 2 percent spike in digital camera sales. Analog camerasales were up 30 to 40 percent last summer, because of the increase in instant camera sales, particularly indollar-based statistics.Sales of digital cameras are down all three months with one exception – in cameras with 12.0 or moremegapixels. In September, for instance, unit sales of digital cameras with 12.0 to 12.9 megapixels increased35 percent from the previous year, <strong>and</strong> unit sales of cameras with more than 13.0 megapixels were up 798percent. The dollar-based statistics for September showed an 11 percent decrease in cameras with 12.0-12.9 megapixels <strong>and</strong> a 230 percent increase in 13.0 <strong>and</strong> higher megapixel cameras. The fact that the highunit increases don’t directly correlate with dollar statistics reveals that low prices for high megapixels meanconsumers can get more for their money, <strong>and</strong> are either buying new models are simply upgrading from theircurrent model.7©<strong>PMA</strong>
<strong>PMA</strong> Monthly Consumer Survey <strong>and</strong> The NPD Group <strong>Camera</strong> <strong>Report</strong>sAnalog camera salesAnalog <strong>Camera</strong> SalesUnit-based statistics% Change vs. year ago(unit-based sales) Unit-based market share (%)July 2010Year-to-date July 2010 Year-to-date35mm SLR -62% -52% 1% 3%35mm lens shutter -23% -28% 33% 33%Instant 112% 75% 65% 64%Analog (overall) 29% 13% 100% 100%Dollar-based statistics% Change vs. year ago($-based sales) $-based market share (%)July 2010Year-to-date July 2010 Year-to-date35mm SLR -59% -24% 9% 26%35mm lens shutter 5% 8% 21% 23%Instant 216% 175% 70% 51%Analog (overall) 58% 35% 100% 100%Note: Excludes Wal-MartSource: The NPD Group <strong>and</strong> <strong>PMA</strong>Analog <strong>Camera</strong> SalesUnit-based statistics% Change vs. year ago(unit-based sales) Unit-based market share (%)August 2010 Year-to-date August 2010 Year-to-date35mm SLR -31% -50% 3% 3%35mm lens shutter -15% -26% 25% 32%Instant 94% 79% 72% 65%Analog (overall) 40% 16% 100% 100%Dollar-based statistics% Change vs. year ago($-based sales) $-based market share (%)August 2010Year-to-date August 2010 Year-to-date35mm SLR -28% -25% 13% 23%35mm lens shutter 36% 11% 15% 22%Instant 285% 195% 72% 55%Analog (overall) 111% 45% 100% 100%Note: Excludes Wal-MartSource: The NPD Group <strong>and</strong> <strong>PMA</strong>9©<strong>PMA</strong>
<strong>PMA</strong> Monthly Consumer Survey <strong>and</strong> The NPD Group <strong>Camera</strong> <strong>Report</strong>sAnalog <strong>Camera</strong> SalesUnit-based statistics% Change vs. year ago(unit-based sales) Unit-based market share (%)Sept. 2010Year-to-date Sept. 2010 Year-to-date35mm SLR -25% -44% 8% 4%35mm lens shutter -10% -25% 20% 30%Instant 93% 81% 72% 66%Analog (overall) 43% 20% 100% 100%Dollar-based statistics% Change vs. year ago($-based sales) $-based market share (%)Sept. 2010Year-to-date Sept. 2010 Year-to-date35mm SLR -23% -24% 29% 24%35mm lens shutter 13% 11% 10% 20%Instant 190% 194% 61% 56%Analog (overall) 48% 45% 100% 100%Note: Excludes Wal-MartSource: The NPD Group <strong>and</strong> <strong>PMA</strong>One-time-use camera salesOne-Time-Use <strong>Camera</strong> SalesUnit-based statistics% Change vs. year ago(unit-based sales) Unit-based market share (%)July 2010 Year-to-date July 2010 Year-to-date35mm -15% -21% 99% 99%APS -50% -88% 1% 1%35mm panoramic - - 0% 0%OTU (overall) -15% -26% 100% 100%Dollar-based statistics% Change vs. year ago($-based sales) $-based market share (%)July 2010 Year-to-date July 2010 Year-to-date35mm -11% -15% 100% 99%APS -53% -88% 0% 1%35mm panoramic - - 0% 0%OTU (overall) -11% -18% 100% 100%Note: Excludes Wal-MartSource: The NPD Group <strong>and</strong> <strong>PMA</strong>10©<strong>PMA</strong>
<strong>PMA</strong> Monthly Consumer Survey <strong>and</strong> The NPD Group <strong>Camera</strong> <strong>Report</strong>sDigital camera salesDigital <strong>Camera</strong> SalesUnit-based statistics% Change vs. year ago(unit-based sales) Unit-based market share (%)July 2010Year-to-date July 2010 Year-to-dateLess than 8.0 megapixels -40% -65% 4% 4%8.0-8.9 megapixels -87% -94% 1% 1%9.0-9.9 megapixels -84% -77% 1% 1%10.0-10.9 megapixels -66% -43% 18% 27%11.0-11.9 megapixels -88% -91% 0% 0%12.0-12.9 megapixels 69% 178% 49% 48%13.0 or more megapixels 789% 526% 28% 19%Digital (overall) -2% -3% 100% 100%Dollar-based statistics% Change vs. year ago($-based sales) $-based market share (%)July 2010 Year-to-date July 2010 Year-to-dateLess than 8.0 megapixels -77% -83% 1% 1%8.0-8.9 megapixels -90% -96% 0% 0%9.0-9.9 megapixels -76% -77% 1% 1%10.0-10.9 megapixels -58% -44% 17% 22%11.0-11.9 megapixels -95% -95% 0% 0%12.0-12.9 megapixels 7% 72% 41% 44%13.0 or more megapixels 248% 184% 40% 31%Digital (overall) 1% 6% 100% 100%Note: Excludes Wal-MartSource: The NPD Group <strong>and</strong> <strong>PMA</strong>12©<strong>PMA</strong>
<strong>PMA</strong> Monthly Consumer Survey <strong>and</strong> The NPD Group <strong>Camera</strong> <strong>Report</strong>sDigital <strong>Camera</strong> SalesUnit-based statistics% Change vs. year ago(unit-based sales) Unit-based market share (%)August 2010Year-to-date August 2010 Year-to-dateBelow 8.0 megapixels -32% -63% 4% 4%8.0-8.9 megapixels -81% -93% 1% 1%9.0-9.9 megapixels -86% -78% 1% 1%10.0-10.9 megapixels -65% -46% 18% 26%11.0-11.9 megapixels -62% -89% 0% 0%12.0-12.9 megapixels 71% 160% 48% 48%13.0 or more megapixels 773% 556% 29% 20%Digital (overall) 3% -3% 100% 100%Note: Excludes Wal-MartSource: The NPD Group <strong>and</strong> <strong>PMA</strong>Dollar-based statistics% Change vs. year ago($-based sales) $-based market share (%)August 2010 Year-to-date August 2010 Year-to-dateBelow 8.0 megapixels -73% -82% 1% 1%8.0-8.9 megapixels -87% -96% 0% 0%9.0-9.9 megapixels -76% -77% 1% 1%10.0-10.9 megapixels -56% -45% 18% 22%11.0-11.9 megapixels -81% -95% 0% 0%12.0-12.9 megapixels 6% 61% 41% 44%13.0 or more megapixels 226% 189% 40% 32%Digital (overall) 2% 5% 100% 100%Digital <strong>Camera</strong> SalesUnit-based statistics% Change vs. year ago(unit-based sales) Unit-based market share (%)Sept. 2010 Year-to-date Sept. 2010 Year-to-dateBelow 8.0 megapixels -39% -61% 5% 4%8.0-8.9 megapixels -74% -93% 1% 1%9.0-9.9 megapixels -77% -78% 1% 1%10.0-10.9 megapixels -66% -48% 17% 25%11.0-11.9 megapixels -94% -90% 0% 0%12.0 - 12.9 megapixels 35% 135% 48% 48%13.0 or more megapixels 798% 586% 29% 21%Digital (overall) -1.8% -2.7% 100% 100%Note: Excludes Wal-MartSource: The NPD Group <strong>and</strong> <strong>PMA</strong>Dollar-based statistics% Change vs. year ago($-based sales) $-based market share (%)Sept. 2010 Year-to-date Sept. 2010 Year-to-dateBelow 8.0 megapixels -70% -81% 1% 1%8.0-8.9 megapixels -80% -96% 0% 0%9.0-9.9 megapixels -63% -76% 1% 1%10.0-10.9 megapixels -53% -46% 17% 21%11.0-11.9 megapixels -96% -95% 0% 0%12.0 - 12.9 megapixels -11% 49% 39% 43%13.0 or more megapixels 230% 194% 42% 33%Digital (overall) 0.9% 4.7% 100% 100%13©<strong>PMA</strong>
<strong>PMA</strong> Monthly Consumer Survey <strong>and</strong> The NPD Group <strong>Camera</strong> <strong>Report</strong>sOverview of NPD <strong>Camera</strong> SalesThe NPD Group provides <strong>PMA</strong> ® with camera sales statistics on a monthly basis. These statistics reflect pointof-saledata, as well as projections from NPD to ensure completeness, <strong>and</strong> cover various distribution channels.<strong>PMA</strong> translates the data into year-over-year trends on both a monthly <strong>and</strong> year-to-date basis. In addition,<strong>PMA</strong> also provides market share-related information.Additional information regarding NPD <strong>and</strong> its methodology is available from The NPD Group.Prepared by the Marketing Research Department of <strong>PMA</strong>Research <strong>and</strong> Analysis:Yukihiko Matsumoto, Executive, Marketing Research<strong>Report</strong> Commentary:Bonnie Gretzner, Senior EditorEditorial Review:Gary Pageau, PublisherComputer Graphics Design, Page Layout, <strong>and</strong> Production Coordination:Stephanie Beauchamp, Marketing Research Project Coordinator©Copyright <strong>PMA</strong>, 3000 Picture Place, Jackson, Michigan 49201, 517-788-8100, March 2011.All rights reserved. No part of this publication may be reproduced, stored in a retrieval system, or transmitted in any form or by any means electronic,mechanical, photocopied, recorded, <strong>and</strong>/or otherwise reproduced without prior permission.14©<strong>PMA</strong>