Audience Audit 2009 - Audiences NI
Audience Audit 2009 - Audiences NI
Audience Audit 2009 - Audiences NI
- No tags were found...

You also want an ePaper? Increase the reach of your titles
YUMPU automatically turns print PDFs into web optimized ePapers that Google loves.
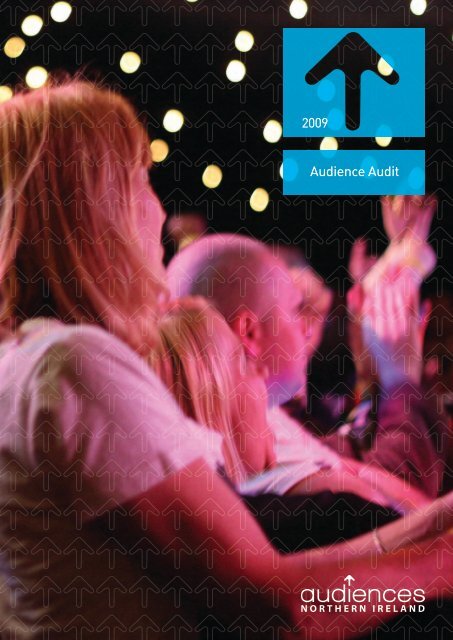
<strong>2009</strong><strong>Audience</strong> <strong>Audit</strong>
Contents2 Introduction3 Contents and Executive Summary4 Methodology5 <strong>2009</strong> in context6-8 Who booked for the arts in <strong>2009</strong>?9 Attendance by Artform & Purchase Patterns10 Seasonality11 Conclusion & GlossaryExecutive SummaryThe <strong>Audience</strong> <strong>Audit</strong> is based on box office data drawn from twenty arts organisations across Northern Ireland.These organisations were included on the basis of their having box office systems connected to Vital Statistics, theanalytics software used by <strong>Audience</strong>s <strong>NI</strong>. Therefore, while the findings from this report represent the most robustpiece of arts marketing intelligence available in Northern Ireland, they do not represent a comprehensiveoverview, rather they represent a minimum level of arts attendance in <strong>2009</strong>. The <strong>Audience</strong> <strong>Audit</strong> covers the period1 January <strong>2009</strong> to 31 December <strong>2009</strong>, a full calendar year of arts attendance.The <strong>Audience</strong> <strong>Audit</strong> findings show that:17% of households in Northern Ireland booked tickets for arts events in <strong>2009</strong>.There were 349,463 visits to 7,905 performances of arts events in Northern Ireland, equating to justover 1.1 million tickets worth just over £16 million.Arts attendance is not exclusive to people on high incomes – 29% of households were likely to haveincomes of less than £13,500 a year.The average price paid for a ticket to the arts in <strong>2009</strong> was £14.70.Visits to arts events peaked in March with 11% of all visits in the year concentrated in this month.July showed the least activity across all four measures (household bookers, visits made, tickets soldand revenue generated).The most tickets sold and the most revenue generated was in December.53% of the tickets sold for an event were sold in the 4 weeks leading up to an event, and primarily within 1 weekof the performance (30%).Theatre continued to be the most popular artform, accounting for 56% of the ticket sales for arts events in <strong>2009</strong>.In real terms, the number of households attending the arts across the sector rose by 7% in <strong>2009</strong> comparedto the year before, the number of tickets sold increased by 8% and the amount of revenue generatedincreased by 11%. However, when venues that were dark in 2008 are excluded, this growth is closer to 2%.3
MethodologyA two tier methodology was used in this report – transactional analysis (e.g. how many tickets were sold)and demographic profiling (e.g. what type of people were attending).Sales were analysed across four key measures: the number of household bookers, the number of visits made,the number of tickets sold and the amount of ticket revenue generated. (See the Glossary on Page 11).About Vital Statistics<strong>Audience</strong>s <strong>NI</strong> is connected to the box office system of twenty arts organisations across Northern Irelandvia its Vital Statistics software, allowing us to collate anonymised data on ticket transactions on a daily basis.The intelligence being gathered on audiences remains robust, as customer name and address data wascaptured on 85% of the visits made, 91% of the tickets sold and 97% of the revenue generated in <strong>2009</strong>.This analysis is based on households rather than the total number of people attending as there is currentlyno standard process for gathering information on who a booker is bringing with them, so the most reliablelevel of data to analyse is the combined purchase history of everyone within each individual NorthernIrish household.About Mosaic <strong>NI</strong>Mosaic <strong>NI</strong> is a classification system which segments consumers into nine demographic groups specific toNorthern Ireland, based on the post code attached to the customer record. It is a useful way of understandingwhat type of person comes to see your show (e.g. likely age range, marital status and social grade) and wherethey come from geographically.About the <strong>Audience</strong> Data UK Artform ClassifiersThe ADUK artform classifications are a set of common artform categories designed to help analyseattendances at arts events, which have been adopted for use by Arts Council <strong>NI</strong> and <strong>Audience</strong>s <strong>NI</strong> forreporting purposes. For the <strong>Audience</strong> <strong>Audit</strong>, the Top Tier (Artform) has been used to analyse events in <strong>2009</strong>.To view the full ADUK classifiers, including the various Genre sub-classifications which comprise eachArtform, visit www.aduk.org.Comparisons with The <strong>Audience</strong> <strong>Audit</strong> 2008Due to different datasets currently available, the arts organisations which have been included in this reportdiffer from those included in the original <strong>Audience</strong> <strong>Audit</strong> from 2008. As any direct comparisons between thetwo published reports would be misleading, all comparisons drawn between 2008 and <strong>2009</strong> in this reportare based on the same venues included in the <strong>2009</strong> report, using a retrospective analysis of their 2008 data.4
Who booked for the arts in <strong>2009</strong>?Ageing Suburbanites: 21%Above average levels of:• people aged 45-64, 65+ & 85+• married couples• social grades A/B and C1• people with O-Levels,A-Levels and Degrees• household incomesof £13.5k+ ,£25k+ and £50k+Better Off Families: 14%Above average levels of:• people aged 45-64and children aged 5- 17• married couples• social grades A/B and C1• people with O-Levels,A-Levels and Degrees• household incomesof £25k+ and £50k+Farming Communities: 14%Above average levels of:• people aged 45-64, 65+ & 85+• married couples• social grades A/B and C1• people with O-Levels,A-Levels and Degrees• household incomesof £25k+ and £50k+Wealth & Wisdom: 13%Housing Exec. Tenants: 10%Younger Nestmakers: 9%Above average levels of:Above average levels of:Above average levels of:6• people aged 45-64, 65+ & 85+• married couples• social grades A/B and C1• people with O-Levels,A-Levels and Degrees• household incomesof £25k+ and £50k+• people aged 18-24 andchildren aged 0-4 and 5-17• single people, cohabitingcouples and divorcees• social grades D and E• people with O-Levels,• household incomes of lessthan £7.5k and £13.5k+• people aged 25 - 44and children aged 0-4• co-habiting or married couples• social grades A/B, C1 and C2• people with O-Levels, A-Levelsand Degrees• household incomes of£13.5k+, £25k+ and £50k+
KEY:• Each coloured dot on the map represents a postcode in Northern Irelandwhich contained an arts booker in <strong>2009</strong>• Each House Unit represents 1% of households in Northern Ireland booking in <strong>2009</strong>Copyright © Experian Ltd 2007,Copyright © NAVTEQ 2007,Based on Crown Copyright materialSmall Town Renters : 8%Students and Singles: 6%Poor Seniors & Solos: 5%Above average levels of:Above average levels of:Above average levels of:• people aged 65+• divorcees, widowersand cohabiting couples• social grades C2, D and E• people with O-Levels• household incomes of less than£7.5k, £75.k + and £13.5+• people aged 18-24,25-44 and 85+• single people, cohabitingcouples and divorcees• social grades A/B, C1 and E• people with A-Levelsand Degrees• household incomes of lessthan £7.5k and £50k+• people aged 45-64, 65+and 85+• single people, cohabiting couples,widowers and divorcees• social grades D and E• no levels of qualification• household incomes of lessthan £7.5k and £13.5k+7
No single Mosaic <strong>NI</strong> group was particularly prominent in <strong>2009</strong>, but a higher percentage were coming fromMosaic <strong>NI</strong> groups which are more likely to contain older married people, with degrees and householdincomes in the higher ranges (£25,000 + or £50,000 +) and in Social Grades A/B, C1 or C2.However, not all arts attenders display these characteristics, e.g. 29% of households were in a Mosaic <strong>NI</strong>group which contains above average levels of households with incomes of less than £13,500 a year.The percentage breakdown of household bookers by their Mosaic <strong>NI</strong> group is almost identical in <strong>2009</strong>compared to the previous year, so while the number of bookers has increased, the number coming from eachgroup has increased in an approximately proportional manner. The only Mosaic <strong>NI</strong> group which didn’t showa numerical increase in the number of households booking was Wealth and Wisdom, and this droppedby less than 100 households.In <strong>2009</strong>, compared to the overall make-up of the population, some groups were more inclined to attend than others.Wealth & Wisdom, Better Off Families and Ageing Suburbanites showed above averagelevels of interestStudents & Singles showed an average level of interestFarming Communities, Small Town Renters, Younger Nestmakers, Poor Seniors and Solosand Housing Exec. Tenants showed lower than average levels of interestWealth & Wisdom, Better Off Families and Ageing Suburbanites can therefore be considered the Mosaic <strong>NI</strong>groups which are most likely to yield arts bookings.PenetrationsThe highest penetration was within the Wealth & Wisdom Mosaic <strong>NI</strong> group, where 32% of the householdsin this group in Northern Ireland booked tickets in <strong>2009</strong>.The lowest penetration was in the Mosaic <strong>NI</strong> group Poor Seniors & Solos, where 9% of the householdsin this group booked tickets in <strong>2009</strong>.There is potential amongst all of these Mosaic <strong>NI</strong> groups to increase audiences, including the four groupswhich have been identified as the most likely to attend arts events.Do some Mosaic <strong>NI</strong> groups spend more than others?A household in the Mosaic <strong>NI</strong> group Wealth & Wisdom was worth the most in average ticket revenue perhousehold at £111.85, while Housing Exec Tentants households were worth the least to the arts on averagein <strong>2009</strong> at £86.70.64% of the spend in <strong>2009</strong> was made by the four most prominent groups, Wealth and Wisdom(15%),Better Off Families (15%), Ageing Suburbanites (20%) and Farming Communities(14%).However, only one Mosaic <strong>NI</strong> group was making more visits, buying more tickets and spending moremoney than you would expect given the number of households attending. 13% of the households in <strong>2009</strong>were Wealth and Wisdom, but this group accounted for 16% of the visits, 14% of the ticket purchasesand 15% of the revenue generated.8
Attendance by Artform and Purchase PatternsAttendance by artformNorthern IrishAverageArtform Housholds 2 Tickets Revenue Visits Performances Ticket YieldTheatre 75,923 614,137 £9,421,707.52 164,464 1,897 £15.34Music 50,036 304,517 £5,035,399.71 100,912 1,120 £16.54Film 3 3,998 88,137 £408,631.94 48,850 1,808 £4.64Museum/Exhibition 4 4,740 28,955 £81,350.00 8,751 2,004 £2.81Participatory Events 2,554 10,865 £144,624.79 6,374 777 £13.31Dance 10,098 46,831 £1,059,959.27 15,192 111 £22.63Literature 2,084 9,517 £80,111.44 4,147 141 £8.42Visual Arts & Crafts 483 2,565 £14,372.00 773 47 £5.60Total 119,548 1,105,524 £16,246,156.67 349,463 7,905 £14.70Theatre (which includes drama, entertainment, children’s theatre, variety, musicals, and comedy amongstothers) was the most popular artform in <strong>2009</strong>, with 64% of Northern Irish households which booked forthe arts attending one or more of the 1,897 theatre performances. Theatre goers made 47% of the visits,accounting for 56% of the tickets bought and 58% of the revenue spent. Every artform generated moreticket revenue in <strong>2009</strong> than in 2008, although for Literature and Dance this was despite a drop in the numberof tickets sold. However, the percentage distribution of sales across the various artforms throughout the yearremained reasonably consistent across all the measures above, varying by only +/- 3% at most across allthe measures.Purchase PatternsPurchase % of Tickets % of RevenueTime Tickets Purchased Revenue GeneratedOn the Day 144,397 13% £1,016,158.24 6%Day Before 41,784 4% £431,071.81 3%2 - 7 Days 140,894 13% £1,673,330.44 10%8 - 14 Days 105,203 10% £1,381,235.15 9%15 - 28 Days 147,237 13% £2,143,990.62 13%Over 4 weeks before 522,083 47% £9,568,941.09 59%Total 1,101,598 100% £16,214,727.35 100%A larger percentage of households were booking more than four weeks in advance (88,518 households, 74%)than were booking in the four weeks leading up to an event (75,197 households, 62%). 59% of ticket revenuewas generated more than four weeks in advance, but only 47% of tickets purchased were sold in the same timeframe. Within the month leading up to an event, the week of the event is more prominent for ticket sales than anyother week in that month (30% of tickets sold and 19% of ticket revenue generated).Overall, patterns of booking times leading up to an event in <strong>2009</strong> were consistent with 2008, with only a +/- 2%variance between the two years. Arts attendances are therefore still planned and booked in advance rather thanbeing a spur of the moment decision to attend, either more than a month in advance or on the week the eventtakes place.2 Household figures apply to only those in Northern Ireland, but sales figures refer to all sales, irrespective of where they originated.3 Data capture on film admissions is traditionally low.4 A large percentage of the sales under Museum/Exhibition are for one event which had multiple daily performances throughout the year.9
SeasonalityA:Ticket SalesB:RevenueC:Number of VisitsD:Number of HousholdsABCDThe graph above shows sales for events in <strong>2009</strong> broken down by the month the eventoccurred in across the four primary measures. In <strong>2009</strong>, all four measures followed asimilar trend, starting high in January, rising to a peak in March, before falling awayto an annual low in July. The indicators then grow to a peak in December aftera slight dip in November.Household bookers peaked in March with 23,339 making a bookingfor an event in that month (19%).Visits also peaked in March at 38,782 visits (11%).Ticket sales peaked in December with 180,630 tickets sold (16%)Revenue also peaked in December with £2.5 million worth of tickets sold (16%).Sales per month only fell below £1 million in 3 months (June, July and August).July attracted the fewest number of bookers (6,353 households, 5%),recorded the lowest number of visits (15,271, 4%), sold the fewest tickets(39156, 4%), and generated the least revenue (£475,652.80, 3%).The average spend per visit to an arts event in <strong>2009</strong> across the year was£49.03, with an average of 3 tickets purchased per visit. However, inDecember the average spend per visit was £71.45 (average of 6 ticketsper visit) while in January it was £56.68 (average of 4 tickets per visit).10Sales increased in seven months of the year across all four measures comparedto the previous year, while they decreased in five months compared to 2008.However, despite these changes, the distribution of sales across the year remainedrelatively consistent, with variations of only +/- 2% per month on average comparedto 2008.The largest variations between 2008 and <strong>2009</strong> were in March (3% increase in ticketssold, 4% increase in household bookers and 5% increase in revenue generatedcompared to the previous year) and in October (3% less visits, 5% less ticketrevenue generated and 7% less household bookers compared to 2008).
ConclusionThe <strong>Audience</strong> <strong>Audit</strong> <strong>2009</strong> cements the conclusions from the 2008 report; the arts are not the exclusivepreserve of any socio-demographic group and are enjoyed by the full spectrum of Northern Irish society,even during one of the longest economic downturns in history.More households are attending the arts year on year, and the amount contributed to the Northern Irisheconomy in <strong>2009</strong> was at least £16.2 million, 11% up on the year before (although this includes venues whichwere dark in <strong>2009</strong>). In real terms, the economic impact goes much further beyond the money spent on ticketsinto secondary spend and wider economic benefits to restaurants, bars and hotels and the vital animationof the towns and cities of Northern Ireland.The unique households which attended the arts varied between 2008 and <strong>2009</strong>, but the type of people livingin those households and how they behave remained consistent across the two years analysed. This consistent,and therefore predictable, behaviour provides a strong basis for developing sound marketing strategiesto increase and deepen existing audiences’ engagement with the arts and attracting new audiences.As we continue to track attendances over time in future years, the <strong>Audience</strong> <strong>Audit</strong> will form an increasinglyrobust benchmark for year on year comparison, strengthening the case for arts funding and enabling artsorganisations to more effectively target new audiences.GlossaryHousehold: A household comprises one person living alone, or a group of people (not necessarily related)living at the same address within common housekeeping – that is, sharing either a living room or sittingroom or at least one meal a day. (<strong>NI</strong> Census)Mosaic <strong>NI</strong>: Mosaic <strong>NI</strong> is a Northern Ireland Specific consumer classification system, which segmentsconsumers into 9 groups based on a mixture of census information and lifestyle surveys. Any data whichincludes a post code can be classified using the profiling software, providing demographic informationspecific for each group, and allowing records to be geographically mapped.Penetration: A comparison of one amount against a total figure to give a percentage. In the case of audiencespecific data, the extent to which a facility is attracting actual users or attenders from within its relevantidentified markets. (An A-Z of Commonly Used Terms and Protocols relating to Box Office and <strong>Audience</strong> Data,Stephen Cashman/<strong>Audience</strong> Data UK, 2005)Performance: An individual show within a run of performances.Post Code: A code used to identify a postal address, made up of a combination of letters and numerals.All Northern Ireland Post Codes begin with BT, followed by a one or two digit number, a space, a onedigit number and two letters. These typically relate to around 15 residential addresses or one large user,such as a business address. (www.royalmail.co.uk)Revenue: The amount (in Pounds £) paid per single ticket to see a performance.Ticket: A ticket is a single seat sold for a single event.Visit: A visit is where a booker attends a venue to see a single performance of a show alongwith any other person they have booked tickets for. Regardless of the size of the party, this constitutes1 visit. However, if the same customer attends an arts event a second time in <strong>2009</strong>, even if it is the sameshow at the same venue on a different date, this constitutes a separate visit.11
About <strong>Audience</strong>s <strong>NI</strong><strong>Audience</strong>s <strong>NI</strong> was established by the ArtsCouncil of Northern Ireland in August 2004to help grow and diversify audiences for thearts and cultural sector in Northern Ireland.The agency is one of 12 audience developmentagencies operating throughout the UK,providing vital audience development supportto organisations through the provision ofmarket intelligence, training, projects,research and forums.Since its inception, <strong>Audience</strong>s <strong>NI</strong> has been carryingout research on audiences for the arts in NorthernIreland, including demographic and geographicprofiling using Mosaic <strong>NI</strong>, trend analyses on boxoffice data and customer focused online surveysfor its members.For more information on Mosaic <strong>NI</strong> andinterpreting the results of this analysis,please email research@audiencesni.comor phone 028 9043 6480.Please note that the contents of this documentmay not be cited, reproduced or distributedwithout express written permission from<strong>Audience</strong>s <strong>NI</strong>.Report compiled by Chris Palmer,Research Officer, <strong>Audience</strong>s <strong>NI</strong>.www.audiencesni.com<strong>Audience</strong>s <strong>NI</strong>20 Mount CharlesBelfastBT7 1NZt. +44 (0) 28 9043 6480f. +44 (0) 28 9023 1429@. info@audiencesni.comW. www.audiencesni.com