great lakes-st. lawrence seaway new cargoes/new vessels market
great lakes-st. lawrence seaway new cargoes/new vessels market
great lakes-st. lawrence seaway new cargoes/new vessels market
- No tags were found...

You also want an ePaper? Increase the reach of your titles
YUMPU automatically turns print PDFs into web optimized ePapers that Google loves.
PREPARED FOR:Maritime Admini<strong>st</strong>ration,U.S. Department of Transportation / Transport CanadaGREAT LAKES-ST. LAWRENCE SEAWAYNEW CARGOES/NEW VESSELSMARKET ASSESSMENT REPORTThis report is available at:http://www.marad.dot.gov/publications.PREPARED BY:TEMS, Inc. / RAND CorporationJANUARY 2007
Great Lakes-St. Lawrence SeawayNew Cargoes/New Vessels - Market AssessmentTABLE OF CONTENTS1 INTRODUCTION ............................................................................................................ 11.1 BACKGROUND......................................................................................................... 11.2 STUDY CONTEXT .................................................................................................... 11.3 STUDY OBJECTIVES ................................................................................................ 21.4 INTENDED USE........................................................................................................ 21.5 REPORT LAYOUT..................................................................................................... 22 ANALYTICAL ISSUES AND THE EVALUATION FRAMEWORK ............................................ 42.1 THE CRITICAL ISSUES AND CONCERNS .................................................................... 42.1.1 GLSLS Sy<strong>st</strong>em............................................................................................. 42.1.2 Geographic Region ...................................................................................... 52.1.3 Cargoes........................................................................................................ 72.1.4 Vessel Operations and Technologies........................................................... 92.1.5 High Speed Technology ............................................................................. 112.2 ANALYTICAL ISSUES .............................................................................................. 122.2.1 Supply Side Issues..................................................................................... 152.2.2 Demand Side Issues .................................................................................. 172.3 EVALUATION FRAMEWORKS................................................................................... 182.3.1 Economic Scenarios and Transportation Strategies .................................. 192.3.2 Demand Side Model Sy<strong>st</strong>ems .................................................................... 202.3.3 Supply Side Model Sy<strong>st</strong>ems....................................................................... 202.4 MAJOR STUDY TASKS AND ACTIVITIES ................................................................... 212.5 KEY STUDY OUTPUTS ........................................................................................... 263 ECONOMIC SIGNIFICANCE OF THE GREAT LAKES AND ST. LAWRENCE SEAWAY.......... 273.1 INTRODUCTION ..................................................................................................... 273.2 THE REGION’S DEVELOPMENT............................................................................... 283.3 THE REGION’S ECONOMY TODAY .......................................................................... 303.4 THE REGION’S HUMAN RESOURCES ...................................................................... 363.5 ECONOMIC FUTURE AND SCENARIOS..................................................................... 424 TECHNOLOGY ASSESSMENT ...................................................................................... 484.1 INTRODUCTION AND METHODOLOGY...................................................................... 484.2 GREAT LAKES-ST. LAWRENCE SEAWAY OPERATING CHARACTERISTICS ................. 484.2.1 Operating Speeds in the Great Lakes-St. Lawrence Seaway .................... 484.2.2 Canals and Locks of the Great Lakes-St. Lawrence Seaway .................... 524.2.3 Ports in the Great Lakes-St. Lawrence Seaway......................................... 534.3 CANDIDATE VESSEL TECHNOLOGIES ..................................................................... 554.3.1 Parameters Used for E<strong>st</strong>imating Vessel Performance ............................... 564.3.2 Container on Barge .................................................................................... 574.3.3 Great Lakes-St. Lawrence Seaway Containership..................................... 604.3.4 A Ro/Ro Fa<strong>st</strong> Freighter .............................................................................. 674.3.5 The Partial Air-Cushion Support Catamaran.............................................. 704.4 COMPARISON OF THE PERFORMANCE OF THE VESSEL TECHNOLOGIES ................... 75TEMS, Inc. / RAND Corporation January 2007 i
Great Lakes-St. Lawrence SeawayNew Cargoes/New Vessels - Market Assessmenttechnologies and the reduced capacity and increased co<strong>st</strong>s of operation of exi<strong>st</strong>ing rail,highway, and ports.Step 5: Conclusions - Present the results and findings of the analysis.TEMS, Inc. / RAND Corporation January 2007 3
Great Lakes-St. Lawrence SeawayNew Cargoes/New Vessels - Market Assessment2 ANALYTICAL ISSUES AND THE EVALUATION FRAMEWORK2.1 THE CRITICAL ISSUES AND CONCERNSIn recent decades, the character of the bi-national GLSLS economy has been changed bythe impact of economic globalization on U.S. and Canadian ea<strong>st</strong>-we<strong>st</strong> trade patterns,particularly with Asia, Europe, and the former Soviet Union. In addition, the North AmericanFree Trade Agreement (NAFTA) has led to an acceleration of growth in north-south trade(extending to Mexico) and a major re<strong>st</strong>ructuring of indu<strong>st</strong>ries in the GLSLS region as well aselsewhere in North America. GLSLS trade has also been dramatically affected by significantincreases in the import of manufactured products and the region has followed the NorthAmerican economy in diversifying into expanding service and high-tech sectors (includingcomputers, telecommunications, and biotech). These changes along with continuedeconomic growth throughout North America, as well as the GLSLS region, have led to atremendous expansion in the movement of indu<strong>st</strong>rial and consumer freight on thecontinent’s highway and rail sy<strong>st</strong>ems. In coming decades, the North Americantransportation network is facing projections of <<strong>st</strong>rong>great</<strong>st</strong>rong>ly increased conge<strong>st</strong>ion in manyhighway, rail, and port facilities. These facilities are already reaching capacity in manymodal segments due to dome<strong>st</strong>ic traffic growth and are encountering difficulty in boo<strong>st</strong>ingcapacity due to high co<strong>st</strong>s, physical con<strong>st</strong>raints, and environmental concerns. They arealready <strong>st</strong>raining to move today’s international and dome<strong>st</strong>ic trade through criticalchokepoints and overburdened corridors.As a result, Canadian and U.S. government concerns have grown about the ability of theexi<strong>st</strong>ing transport sy<strong>st</strong>em to cope with continuing trade as well as vehicular traffic growth.Increases in both travel times and co<strong>st</strong>s can be expected for both freight and passengertravel, as they are increasingly moving on over burdened transportation infra<strong>st</strong>ructure.One option to help deal with the increase is the potential offered by the GLSLS sy<strong>st</strong>em. Ifcompetitive with rail and highway, water can offer considerable capacity to help move bothcontainer and neobulk traffic. This <strong>st</strong>udy is focused on identifying the potential that watermight offer in trying to overcome the limitations of the exi<strong>st</strong>ing sy<strong>st</strong>em.2.1.1 GLSLS SYSTEMThe GLSLS Sy<strong>st</strong>em is over 2,300 miles (3,700 km) long, serves more than 30 ports betweenthe gulf of the St. Lawrence River and Duluth, and moves over 200 million tons of cargo ayear. It provides easy access to the large<strong>st</strong> manufacturing regions of Canada and the U.S.and, with its rail/water connections, the agricultural regions of the Prairies and Great Plains.The GLSLS Sy<strong>st</strong>em has six canals incorporating nineteen major sets of locks. These locks,however, limit the size and speed of <strong>vessels</strong> that can use the GLSLS Sy<strong>st</strong>em. The maximumsize of <strong>vessels</strong> that can use the locks is 740 ft. (225.5 m) long, 78 ft. (23.8 m) wide andwith a draft of 30 ft (9.1 m). A lock typically takes 45 minutes to fill with water and, overthe full length of the sy<strong>st</strong>em, <strong>vessels</strong> are raised a total of 180 meters above sea level.TEMS, Inc. / RAND Corporation January 2007 4
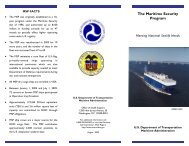
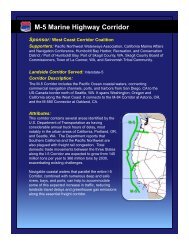
Great Lakes-St. Lawrence SeawayNew Cargoes/New Vessels - Market AssessmentExhibit 2-1: GLSLS Sy<strong>st</strong>emFEET ABOVE SEA LEVEL602' 578.5'572'246' 242'153'69'20'SeaLevelLake Superior: 383 MilesSt. Mary's River: Soo Locks—70 MilesLake Michigan: 345 MilesLake Huron: 223 MilesSt. Clair River-Lake St. Clair-Detroit River: 77 MilesLake Erie: 236 MilesWelland Canal: Eight Locks—28 MilesLake Ontario: 160 MilesThousand Islands Section: 27 Ft. Channel—68 MilesLake St. Lawrence: 44 MilesInternational Rapids Section: Three Locks and Dams, 27 Ft. Channel—44 MilesLake St. LouisLake St. Francis Section: 27 Ft. Channel—30 MilesSoulanges Section: Two Locks, 27 Ft. Channel—16 MilesLachine Section: Two Locks, 27 Ft. Channel—31 MilesTide Water Section: Deep Water from Montreal to Sea—1000 MilesIn terms of performance, there are a number of issues associated with the GLSLS Sy<strong>st</strong>em.Two of the mo<strong>st</strong> critical are the reliability of the locks and the scheduling of <strong>vessels</strong> throughthe locks. In competing for <strong>new</strong> cargo such as container traffic, transit times and thereliability of service are critical to any shipper who uses ju<strong>st</strong>-in-time inventory management.Improvements to lock reliability and scheduling will be important factors in getting shipper<strong>st</strong>o use the GLSLS Sy<strong>st</strong>em. In this regard, the Seaway AIS network is a big <strong>st</strong>ep forward infacilitating the scheduling of <strong>vessels</strong> as well as providing information on trip co<strong>st</strong>s, cargomatching, online transactions and account information and rules and regulation data. Forthe purposes of this <strong>st</strong>udy, it is assumed that the sy<strong>st</strong>ems locks will be reliable and thatvessel scheduling is possible.2.1.2 GEOGRAPHIC REGIONThe New Cargoes/New Vessels <strong>st</strong>udy explores the container <strong>market</strong> potential for the 2,300-mile inland waterway <strong>st</strong>retching from the Gulf of the St. Lawrence River to inland cities suchas Thunder Bay, Duluth-Superior and Chicago and the Port of Indiana-Burns Harbor. TheGLSLS Sy<strong>st</strong>em includes 15 major ports and some 50 regional ports that are connected tomore than 40 provincial and inter<strong>st</strong>ate highways, as well as 30 rail lines.As a result, the GLSLS Sy<strong>st</strong>em connects the manufacturing, agricultural, and mining areasof Central Canada, the Midwe<strong>st</strong>, the Prairies and the Great Plains. See Exhibit 2-2. Eacharea while different is both a producer and consumer of goods and services and therefore acandidate service of container traffic.TEMS, Inc. / RAND Corporation January 2007 5
Great Lakes-St. Lawrence SeawayNew Cargoes/New Vessels - Market AssessmentExhibit 2-2: Study AreaExhibit 2-3: North American Ports and European De<strong>st</strong>inationsNot only does the GLSLS region cover over 20 percent of North America, but it is itself boththe large<strong>st</strong> production and consumer <strong>market</strong> areas of the continent. As will be discussedlater, <strong>vessels</strong> are able to use GLSLS waterways to connect the region’s producers andconsumers via the Atlantic Ocean and through the Suez Canal into the Indian and Pacificoceans to major <strong>market</strong>s and producers worldwide. As a result, the GLSLS economy is, butTEMS, Inc. / RAND Corporation January 2007 6
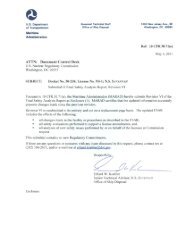
Great Lakes-St. Lawrence SeawayNew Cargoes/New Vessels - Market Assessmentcan be more effectively, linked by trade to traditional as well as emerging trading partnersin Europe, Latin American, Africa, Middle Ea<strong>st</strong> and South and Southea<strong>st</strong> Asia.As shown in Exhibit 2-3 the di<strong>st</strong>ances between the North American ports on the GLSLSSy<strong>st</strong>em to other parts of the world are highly competitive via direct ocean routes. Forexample, Baltimore, Maryland is closer to Liverpool, England via Detroit, Michigan and theGLSLS Sy<strong>st</strong>em at 3,673 miles (5,911 km) than by a direct ocean route, which is 3,936 miles(6,334 km). New York is closer to Rotterdam via Montreal and the GLSLS Sy<strong>st</strong>em at 3,612miles (5,813 km) than by a direct ocean route at 3,824 miles (6,154 km). As a result, theGLSLS Sy<strong>st</strong>em provides an alternative for central Canada and the central U.S. that cancompete with a wide range of rail, road, and port options <strong>st</strong>retching from Halifax, NovaScotia, to northea<strong>st</strong>ern U.S. ports such as Bo<strong>st</strong>on, New York, Baltimore, and Norfolk,Virginia. In each case, the GLSLS Sy<strong>st</strong>em’s capability to compete with rail and highway foraccess to the widespread <strong>market</strong>s of Milwaukee, Chicago, Detroit, Cleveland, Toronto,Montreal and Quebec as well as the U.S. Northea<strong>st</strong> and Mid-Atlantic provide a positive basisfor evaluating the potential for <strong>new</strong> <strong>cargoes</strong> on the GLSLS Sy<strong>st</strong>em. Therefore, the <strong>st</strong>udyarea should encompass the following regions (See Exhibit 2-2)–• Agriculture hinterlands (Prairies, Great Plains)• Mining areas (Prairies, Great Plains)• Manufacturing areas (Midwe<strong>st</strong>, Ohio, Central Canada, Northea<strong>st</strong> and Mid-Atlantic)• Market areas (Midwe<strong>st</strong>, Ohio, Central Canada, Northea<strong>st</strong> and Mid-Atlantic)2.1.3 CARGOESThe GLSLS Sy<strong>st</strong>em has demon<strong>st</strong>rated its ability to attract bulk cargo both in terms ofdome<strong>st</strong>ic and international trade, see Exhibit 2-4.Exhibit 2-4: Products Moved on the GLSLS Sy<strong>st</strong>em – 2004(Millions of Metric Tonnes, Per Year)45.212.181.823.446.8 52.4Iron Ore Coal Stone Grain Other Bulk General Cargo**Includes <strong>st</strong>eel slabs and containerized freight.TEMS, Inc. / RAND Corporation January 2007 7
Great Lakes-St. Lawrence SeawayNew Cargoes/New Vessels - Market AssessmentThere is little doubt that for the long-di<strong>st</strong>ance movement of bulk commodities such as ore,grain and coal, the GLSLS Sy<strong>st</strong>em provides transit times and co<strong>st</strong>s that make it attractive toshippers.It can be seen that grain, iron ore, coal and other bulk commodities account for 95 percentof total cargo on the GLSLS Sy<strong>st</strong>em while container traffic (including the neo-bulk <strong>st</strong>eeltraffic) at 12.1 million metric tonnes, is only 5 percent of total cargo. 1 This cargo profile issimilar to the cargo profiles for the Mississippi and Ohio River sy<strong>st</strong>ems where well over 90percent of the cargo on both sy<strong>st</strong>ems is bulk products. 2The ability of the GLSLS Sy<strong>st</strong>em to attract <strong>new</strong> cargo, however, is determined by its abilityto meet the needs of shippers in terms of the level of service required for each type ofcargo. Where the service profile fits the needs of shippers, the GLSLS Sy<strong>st</strong>em can becompetitive and attract <strong>new</strong> cargo. Two types of cargo should be considered – <strong>new</strong> neo-bulkcommodities, such as wa<strong>st</strong>e, coil and rolled <strong>st</strong>eel, vehicles and assembled engineeringequipment and containerized traffic for typical manufacturing products, food, finished andsemi-finished goods.Neo-bulk cargo <strong>market</strong>s can be developed particularly if its rail and truck competitorscontinue to face higher capacity re<strong>st</strong>rictions, increasing delays due to conge<strong>st</strong>ion andincreasing co<strong>st</strong>s due to higher energy prices and labor co<strong>st</strong>s. Water transportation is capableof moving bulk cargo at the lowe<strong>st</strong> co<strong>st</strong> per ton, lowe<strong>st</strong> labor hours per ton-mile and lowe<strong>st</strong>energy consumption per ton-mile.The lack of rail and truck capacity in critical locations such as the U.S./Canadian bordercrossings on both sides of Lake Erie has also created an opportunity for <strong>new</strong> cargo flowsacross the GLSLS Sy<strong>st</strong>em. An example of this would be <strong>new</strong> ferry services on Lake Erie thatprovide an alternative means for moving hazardous and bulk materials by water rather thanthe conventional rail and truck modes. This hazardous cargo is increasingly barred fromusing tunnels and bridges and thus seeks an alternative mode of transport.Critical features of this type of cargo are its specificity and the potential for watertransportation to provide a direct service when the competition is forced, by regulation orcapacity re<strong>st</strong>rictions, to look for an alternative. In the case of the proposed Lake Erie(Nanticoke, Ontario-Erie and Pennsylvania) and Windsor-Detroit ferries, it is regulation andlack of capacity that have generated both of these opportunities. In the case of the LakeErie ferry, it is truck weight re<strong>st</strong>rictions, while, in the case of the Windsor-Detroit ferry, it issafety regulations.2.1.3.1. CONTAINER CARGO FLOWSThe key development in container traffic transportation since the 1950’s has beencontainerization. Container traffic has emerged from a largely agricultural and raw materialsbase that dominated early transportation to a highly diversified and high value added cargothat reflects the modern consumer goods indu<strong>st</strong>ry. Containers move finished or semifinishedproducts in a “ju<strong>st</strong>-in-time” environment, which has made container traffic a highlytime-sensitive payload that will be attracted to the GLSLS Sy<strong>st</strong>em only if it offerscompetitive rates and transit times.1 “The St Lawrence Seaway 2004 Traffic Report”, http://<<strong>st</strong>rong>great</<strong>st</strong>rong><<strong>st</strong>rong>lakes</<strong>st</strong>rong>-<strong>seaway</strong>.com/en/pdf/TrafficReport2004-EN.pdf and“Waterborne Commerce of the United States”. Calender Year 2004. Part 3 - Waterways and Harbors Great Lakes. In<strong>st</strong>itute for WaterResources, U.S. army Corps of Engineers. http://www.iwr.usace.army.mil/NDC/wcsc/pdf/wcusgl04.pdf2 “Waterborne Commerce of the United States”. Navigation Data Center. 2001. In<strong>st</strong>itute for Water Resources, U.S. Army Corps ofEngineers. 20 Mar. 2005. http://www.iwr.usace.army.mil/ndc/wcsc/pdf/wcusnat101.pdfTEMS, Inc. / RAND Corporation January 2007 8
Great Lakes-St. Lawrence SeawayNew Cargoes/New Vessels - Market AssessmentOne area where container traffic might be able to expand rapidly under the currentconditions of the GLSLS Sy<strong>st</strong>em is where, as in the case of bulk cargo, the capacitylimitations of the exi<strong>st</strong>ing rail and truck networks have become problematic. In thisenvironment, an improved GLSLS Sy<strong>st</strong>em would generate <strong>new</strong> opportunities along theOntario, New York and Michigan borders. These could take the form of short ferry servicescarrying Ro/Ro (Roll on/Roll off) and Lo/Lo (Load on/Load off) cargo and freight ferryservices similar to those proposed for Lake Erie and Lake Ontario. In terms of the current<strong>market</strong>s, the products that might move today by Ro/Ro and Lo/Lo between the U.S. andCanada include ju<strong>st</strong>-in-time, bonded and high-value shipments. This includes, for example,alcoholic beverages, machinery and precision goods via Ro/Ro freight ferry service.2.1.3.2. TRAFFIC AND REVENUE POTENTIALIn terms of long-term growth, container traffic also offers the <<strong>st</strong>rong>great</<strong>st</strong>rong>e<strong>st</strong> opportunity in that itis growing very rapidly while the demand for bulk cargo (except perhaps in periods of rapidexpansion such that recently experienced by China), is much lower. The projected annualgrowth rates for container traffic range between 4 and 6 percent and even higher whereas itis only 1 or 2 percent for bulk cargo. While the movement of bulk cargo grew quite <strong>st</strong>ronglyin the 1980’s, it has been slowing down in recent years. The Mississippi river sy<strong>st</strong>em, forexample, carried in 2001 the same cargo it carried in 1995.While bulk cargo provides the highe<strong>st</strong> volume for the GLSLS Sy<strong>st</strong>em, it generates a muchlower return than container traffic. For example, charges for grain, coal, and ores generatebetween 50 cents and 1 dollar (Canadian) per metric tonne, while containers, <strong>st</strong>eel slab andcontainer traffic generate from 1 to 2 dollars (Canadian) per metric tonne. Given the highergrowth rate and the increased “value added” of container traffic, container traffic clearlyoffers the <<strong>st</strong>rong>great</<strong>st</strong>rong>e<strong>st</strong> opportunity for increasing revenues and improving the economics of theGLSLS Sy<strong>st</strong>em.2.1.4 VESSEL OPERATIONS AND TECHNOLOGIESAs part of the overall analysis, consideration has been given to the potential incorporation of<strong>new</strong> vessel technologies to increase opportunities for <strong>new</strong> <strong>cargoes</strong> on the GLSLS Sy<strong>st</strong>em.Currently, Container on Barge (COB) is being developed on a number of North Americanwaterways following the success of this technology on the Rhine/Danube river sy<strong>st</strong>em. Inaddition, <strong>new</strong> high speed river and coa<strong>st</strong>al vessel technologies capable of speeds <<strong>st</strong>rong>great</<strong>st</strong>rong>erthan barges are currently being researched in Europe.In addition, <strong>new</strong> small and large container ships are being built that are capable of up to 20knots. These <strong>vessels</strong> have relatively low energy co<strong>st</strong>s and large payloads. The potential ofthese modern vessel technologies has been considered in terms of their ability to changethe pricing, service levels, and transit times for container cargo on the GLSLS Sy<strong>st</strong>em. Theissues that were considered include allowable speed limits and the suitability of <strong>new</strong>technologies in relation to the locks and other infra<strong>st</strong>ructure issues of the GLSLS Sy<strong>st</strong>em.Potential <strong>new</strong> <strong>vessels</strong> on the GLSLS Sy<strong>st</strong>em evaluated in this <strong>st</strong>udy include —TEMS, Inc. / RAND Corporation January 2007 9
Great Lakes-St. Lawrence SeawayNew Cargoes/New Vessels - Market Assessment2.1.4.1. EXISTING TECHNOLOGIESCOB SERVICE: TUG/BARGEToday tug/barge <strong>vessels</strong> are providing service ona number of waterways in North America andEurope. This concept was developed for theRhine/Danube river sy<strong>st</strong>em as a way of movingcontainers, as well as bulk cargo, by makingbarge rates competitive with rail and truck. Inmany ways, this was achieved because of theless competitive character of rail and truckservice in Europe. Lower productivity and highfuel and labor co<strong>st</strong>s for trucks and rail in Europehave made barges more attractive to indu<strong>st</strong>ry.Exhibit 2-5: Container on BargeSpecifically, the prohibition of trucks on German roads on weekends significantly improvedbarge competitiveness. Also, much European indu<strong>st</strong>ry is located where barge service andbarge cargo can be easily accessed compared to the indu<strong>st</strong>rial <strong>st</strong>ructure around the GLSLSSy<strong>st</strong>em. Important factors in the success of the Rhine/Danube barge service includescheduled movements, current information sy<strong>st</strong>ems and an ability to provide a wide rangeof options such as Lo/Lo and Ro/Ro.Barges are typically 110 meters long and 11.4 meters wide with a draft of only 2.5 metersand the ability to carry 72 TEU with containers <strong>st</strong>acked three high on a single barge. 3RO/RO AND LO/LO FREIGHT FERRY SERVICEThe development of ferry and short-di<strong>st</strong>anceshipping operations are largely a product ofborder conge<strong>st</strong>ion, regulations and safetyconcerns as evidenced by those ferry service<strong>st</strong>hat are either currently operational or beingplanned on the St. Lawrence River and LakesErie, Ontario and Michigan. However, in thefuture – as shown by the proposed Nanticoke-Erie freight ferry – the economics of Ro/Ro andLo/Lo freight ferries are such that only arelatively small level of dislocation in the logi<strong>st</strong>icsupply chains of the <strong>st</strong>eel, engineering, chemicalor agricultural indu<strong>st</strong>ries will produce conditionsin which short-di<strong>st</strong>ance ferry operations canbecome viable. 4Exhibit 2-6: Loading a Ro/Ro Freight FerryExperience shows that the level of traffic conge<strong>st</strong>ion at the U.S./Canadian border crossings,where delays of 2-12 hours are frequent, is sufficient to make cross-border ferry operationsviable.3 Great Lakes and St. Lawrence Seaway-New Cargoes/New Vessels Scoping Study. Transportation Economics & ManagementSy<strong>st</strong>ems, Inc. 20054 “Lake Erie Freight Ferry Feasibility Study”, Transportation Economics & Management Sy<strong>st</strong>ems, Inc. 2003.TEMS, Inc. / RAND Corporation January 2007 10
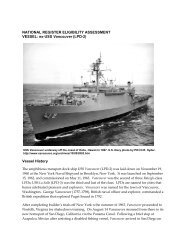
Great Lakes-St. Lawrence SeawayNew Cargoes/New Vessels - Market Assessment2.1.5 HIGH SPEED TECHNOLOGYIn the la<strong>st</strong> twenty years, the character of shortsea operations has changed by theintroduction of high speed technology that has revolutionized the nature of ferry operationsaround the world. This <strong>new</strong> technology offers the capability of running ferry services at 30to 40 knots compared to the 15 to 20 knots of conventional ferries. For example, theintroduction by Stena Lines of the HSS 1500 between Dun Laoghaire in Southern Ireland toHolyhead in Wales, a 70-mile route across the St. Georges Channel with some of theroughe<strong>st</strong> waters around Britain, resulted in a two-hour service rather than the old four-hourservice when the route used conventional ferries. This allowed Stena Lines to use only onevessel rather than two and dramatically improved the economics of operation. The HSS1500 is capable of carrying some 900 meters of cars and trucks (or 350 TEU) as well asaccommodate some 1500 passengers. 5 The major issues with this particular vessel are itswidth, which at 40 meters wide would make it too wide for the GLSLS Sy<strong>st</strong>em locks and itswake, which might be too severe for river and canal operation.However, the European Union has been working on developing this type of technology forriver work and in particular, the Rhine and Danube Rivers.PACSCATThe PACSCAT is a “Partial Air CushionSupport” Catamaran that is currently beingdeveloped as a viable vessel for carryingfreight on inland waters. It is a fa<strong>st</strong>,slender hull catamaran, with a beam of22.8 meters and a length of 135 meters. Itcan carry up to 2,200 metric tonnes with acargo capacity of 240 TEUs for Lo/Lo orRo/Ro configuration. Using the Partial AirCushion Support, the PACSCAT has a draftof 2.7 meters (with cushion) and 4.8meters (off cushion).Exhibit 2-7:Rendering of PACSCAT with Containers OnboardThe PACSCAT is designed to produce aminimal wake while achieving speeds up to 20 knots well in excess of exi<strong>st</strong>ing maximumspeed of 8-12 knots currently permitted on GLSLS sy<strong>st</strong>em.In a river/sea version of the PACSCAT, it is considered that speed can be increased to 40knots in open waters (such as on the Great Lakes) under conditions of up to Sea State 4. 6The PACSCAT, therefore, offers a vessel capable of operating within the exi<strong>st</strong>inginfra<strong>st</strong>ructure of the GLSLS Sy<strong>st</strong>em, at speeds of twice as fa<strong>st</strong> or more as those of exi<strong>st</strong>ing<strong>vessels</strong>.The European Union report in May 2001 concluded, “The technical and <strong>market</strong> feasibility<strong>st</strong>udies (for PACSCAT) have been confirmed to a preliminary level through te<strong>st</strong>ing andanalysis under a European Union Exploratory Project...” This type of vessel can clearlyreduce transit times on the GLSLS Sy<strong>st</strong>em provided wash conditions meet environmentaland engineering requirements. 75“The Rhine-Maine-Danube Waterway.” Deutscher Wasser<strong>st</strong>rassen-und Schiffahrtsverein. 4 Apr. 2005.http://www.schiffahrtsverein.de/waterw.htm6 Sudar, Ann.7“Stena Explorer/Technical Facts.” Our Vessels. Stena Line. 4 Apr 2005.http://www7<strong>st</strong>enaline.co.uk/servlet/se.ementor.econgero.servlet.presentation.Main?data.node.id=20274&data.languate.id=11&data.document.id=13872TEMS, Inc. / RAND Corporation January 2007 11
Great Lakes-St. Lawrence SeawayNew Cargoes/New Vessels - Market AssessmentCONTAINER SHIPAlthough not <strong>st</strong>rictly a high speed technology, incremental improvements in container shipdesign have transformed it from a 10-15 knot vessel to a 22-23Exhibit 2-8: Container Shipknot vessel. These <strong>new</strong> <strong>vessels</strong> are comparable with thePACSCAT river technology, which achieves 22-24 knots, but aremuch more efficient in terms of payload. The modern containership can carry any where from 400-1,400 (TEU) containers andhas a draft of only 7.9 meters, which can easily be used on theGLSLS navigation sy<strong>st</strong>em.2.2 ANALYTICAL ISSUESThe New Cargoes/New Vessels Study requires a comprehensivereview of exi<strong>st</strong>ing and potential <strong>cargoes</strong> and vessel technologie<strong>st</strong>hat might move on the GLSLS Sy<strong>st</strong>em. It identifies thepotential <strong>new</strong> <strong>market</strong>s and assesses their critical thresholds interms of price, service levels, and transit time together with anyother relevant service needs (e.g., seasonality). The analysis reviews the nature of thecompetition in exi<strong>st</strong>ing as well as potential <strong>new</strong> <strong>market</strong>s and considers the role of rail andhighway modes in both the short- and long-term. The analysis also considers the role of thecapacity issues in relation to the GLSLS Sy<strong>st</strong>em and the competitive modes, routes andports. Concern exi<strong>st</strong>s about the ability of exi<strong>st</strong>ing Ea<strong>st</strong> and We<strong>st</strong> Coa<strong>st</strong> ports and theirconnecting railroads and highways to su<strong>st</strong>ain their current levels of efficiency. In thisenvironment, the development of <strong>new</strong> port facilities, <strong>new</strong> <strong>vessels</strong> and <strong>new</strong> uses of inlandwaterways might be possible, particularly in relation to the transport needs of the evolvingGreat Lakes/Seaway region economy, trade growth, and changing <strong>market</strong>s.In evaluating the character of the GLSLS Sy<strong>st</strong>em’s future, the emergence of <strong>new</strong> and niche<strong>market</strong>s and products available for transportation on the GLSLS Sy<strong>st</strong>em, as well as thedevelopment of <strong>new</strong> <strong>vessels</strong> has been explored. These options include inve<strong>st</strong>igating the useof container vessel technology that has not been previously used extensively on the GLSLSSy<strong>st</strong>em. New <strong>vessels</strong> could well revolutionize the inland waterway <strong>market</strong>s by providingimproved performance and more competitive pricing <strong>st</strong>ructures.The evaluation of these issues has been completed within a framework that provides theability to model the interaction of the competitive mode networks along the full length of theGLSLS Sy<strong>st</strong>em. The analysis provides the ability to show how specific transportationinve<strong>st</strong>ment and improvements changes the GLSLS’ competitiveness for exi<strong>st</strong>ing and <strong>new</strong><strong>cargoes</strong>; how changes in vessel technology will change the GLSLS’ competitiveness; andhow changes in capacity will affect price and level of service and, in turn, the competitiveperformance of the GLSLS Sy<strong>st</strong>em. The demand and supply model that has been developedis capable of evaluating –• Competitive environment and issues• Type of cargo• Vessel operations and technologyTEMS, Inc. / RAND Corporation January 2007 12
Great Lakes-St. Lawrence SeawayNew Cargoes/New Vessels - Market AssessmentCOMPETITIVE ENVIRONMENT: THE BACKGROUNDSince the early 16th century when the French explorer Jacques Cartier was turned back bythe Lachine Rapids ju<strong>st</strong> outside Montreal, there has been a desire to develop the GreatLakes and St. Lawrence Seaway as a trade route between the Atlantic and the interior ofNorth America. However, as with the building of the Erie Canal, which in the 19th centuryspurred the development of the Great Lakes and St. Lawrence Seaway Sy<strong>st</strong>em, competitionwith the railroads initially and more recently with trucks, has meant that both waterwayshave had to specialize in slow moving (8-12 knots) bulk traffic and have found it hard tocompete for fa<strong>st</strong>er moving container traffic. Even when the GLSLS Sy<strong>st</strong>em opened in thelate 1950’s, relatively long transit times meant that its traffic was heavily oriented to themovement of bulk commodities. While from the earlie<strong>st</strong> times rail (and more recently truck)co<strong>st</strong>s are higher than those of water, their transit times have typically been significantly les<strong>st</strong>han those of the GLSLS Sy<strong>st</strong>em. As a result container traffic which emerged since the1970’s as the mo<strong>st</strong> co<strong>st</strong> effective way of moving manufactured goods has typically beenunloaded at ea<strong>st</strong> and we<strong>st</strong> coa<strong>st</strong> ports and transferred to rail or truck.Exhibit 2-9: The Evolution of the Container ShipThis emphasis on the use of rail and truck rather than water for inland di<strong>st</strong>ribution has beenreinforced since the 1960’s by the increased integration of container handling sy<strong>st</strong>ems inports and inland transportation centers. Containerization required special port handlingfacilities (i.e., cranes and container tugs) and encouraged the building of larger and larger<strong>vessels</strong> for the major ocean trade routes requiring channel depths <<strong>st</strong>rong>great</<strong>st</strong>rong>er than the 8.2meters provided by the GLSLS Sy<strong>st</strong>em 8 , see Exhibit 2-9.8 Great Lakes St. Lawrence Seaway Sy<strong>st</strong>em. Seaway Facts. 4 Apr. 2005.http://www.<<strong>st</strong>rong>great</<strong>st</strong>rong><<strong>st</strong>rong>lakes</<strong>st</strong>rong><strong>seaway</strong>.com/en/aboutus/<strong>seaway</strong>facts.htmlTEMS, Inc. / RAND Corporation January 2007 13
Great Lakes-St. Lawrence SeawayNew Cargoes/New Vessels - Market AssessmentDown<strong>st</strong>ream ports like Montreal and Halifax inve<strong>st</strong>ed in the <strong>new</strong> container infra<strong>st</strong>ructure a<strong>st</strong>hey had the water depth and offered fa<strong>st</strong> inland access, initially by rail and later by bothrail and truck that attracted container traffic. Ports on the Great Lakes and St. Lawrencelacking these inve<strong>st</strong>ments and the ability to attract ocean vessel calls increasinglyconcentrated on bulk goods.Today, the GLSLS Sy<strong>st</strong>em cargo is over 80 percent bulk traffic, which is attracted by thehighly co<strong>st</strong> effective, if relatively lengthy, transit times. It takes about ten days for a ship togo from one end of the Sy<strong>st</strong>em to the other, while it only takes rail or truck no more thanthree or four days. In addition, rail operators have improved their competitive position inthe la<strong>st</strong> ten years by introducing intermodal double <strong>st</strong>ack train operations.However, the continued expansion of world trade and the increasing globalism of world<strong>market</strong>s have implications for the exi<strong>st</strong>ing port and inland waterway supply chain andlogi<strong>st</strong>ics sy<strong>st</strong>em of the current port and inland di<strong>st</strong>ribution sy<strong>st</strong>ems. Not only are some portsreaching capacity and finding themselves unable to deal with the increasing size ofcontainer ships, but the inland di<strong>st</strong>ribution sy<strong>st</strong>ems feeding from the ports are also reachingcapacity. In this environment, it might well be difficult for the current sy<strong>st</strong>em to provide forall the needs of trade growth. The que<strong>st</strong>ion is raised as to whether the GLSLS Sy<strong>st</strong>em canprovide an effective transportation option that will help maintain and allow for the expansionof trade. To assess this issue, the competitive environment needs to be explored tounder<strong>st</strong>and how demand and supply is affected by changes in the performance of the ports,modes, and routes that make up the supply chain. Additionally, the willingness of <strong>market</strong><strong>st</strong>o adopt the potential price, service levels and shipping times that can be offered by theGLSLS Sy<strong>st</strong>em should be assessed. Exhibit 2-10 shows the range of factors considered inthe <strong>st</strong>udy.Exhibit 2-10: Supply and Demand Side IssuesSupplyPriceTransit TimeDrayage/Access-EgressDwell TimeFrequency of ServiceReliability of ServiceSecurity of ShipmentShipmentCharacteri<strong>st</strong>icsCapacitySeasonalityDemandEconomic GrowthMarket AccessibilityModal CompetitionRoute CompetitionCapacity Con<strong>st</strong>raintsTEMS, Inc. / RAND Corporation January 2007 14
Great Lakes-St. Lawrence SeawayNew Cargoes/New Vessels - Market Assessment2.2.1 SUPPLY SIDE ISSUESTo provide an effective assessment of supply side information, a micro-economic demandmodel was developed that properly represents the <strong>market</strong>’s responses to supply conditions.The supply conditions were formulated as a metric containing all of the critical factors thatmotivate shippers and carriers to use a particular route, mode and shipment type.PRICEA key feature of any supply chain is price. Typically, water transportation has been able tooffer the lowe<strong>st</strong> price. The issue, however, is that while price dominates bulk transportationit is far less important in the movement of container traffic in which transit time and a widerange of other service variables play a major role.In the case of bulk traffic, given the volumes involved, shipper concerns focus on the lowe<strong>st</strong>rate per ton. In the case of container traffic, the focus is on transit times and the ability toreach certain <strong>market</strong>s by a given deadline. Fa<strong>st</strong>er transit times would allow a higher price tobe charged for use on the GLSLS Sy<strong>st</strong>em. Clearly, fa<strong>st</strong>er transit times that are competitivewith rail and truck can attract a price similar to that of rail and truck and dramaticallyincrease the revenues per ton-mile. For water options that offer longer transit times thanrail or truck, the ability to offer lower prices is critical to their success. As a result, forcontainer <strong>vessels</strong> whose transit times are slower than truck and rail, it will be important toobtain the maximum economies of scale possible by boo<strong>st</strong>ing capacity as much as possibleto minimize the average co<strong>st</strong> per container moved by water.TRANSIT TIMEIn a ju<strong>st</strong>-in-time economy, transit time has become the prime factor in shippers’ decisionsfor container traffic. Improved transit time, therefore, has a <strong>st</strong>rong relationship with theability of the GLSLS Sy<strong>st</strong>em to attract container traffic. This can happen in several ways:water transit time can be improved relative to other modes because of the improvedoperation of the GLSLS Sy<strong>st</strong>em itself, by the use of <strong>new</strong> and fa<strong>st</strong>er <strong>vessels</strong> or as a result ofincreased time for other modes as they face conge<strong>st</strong>ion and capacity delays. In each case,the relative difference between water transit times and its competitors’ transit time mu<strong>st</strong> besignificantly reduced for the Sy<strong>st</strong>em to become an effective option. Today it takes about tendays for a ship to go from one end of the GLSLS Sy<strong>st</strong>em to the other. Critical bottlenecksinclude the Montreal-Lake Ontario section, which has a 22- to 24-hour average transit timeand the Welland Canal with an 11-hour transit time. For products such as grain, iron ore,coal and <strong>st</strong>eel, these times are both reasonable and competitive given the volume of cargoinvolved. However, for container or palletized products – the typical way to movemanufactured products – these time scales are generally unacceptable. The gap betweenwater and its competitors is currently three to four days of transit time; it would probablyneed to be improved to within one or two days, at the mo<strong>st</strong>, to become an effectiveshipping option.DRAYAGE/ACCESS/EGRESS/DWELL TIMEThe experience of water transportation providers is that access, egress and dwell time alongwith drayage are very expensive components of total travel time and can rapidly reduce theviability of service. The reason for the development of the Alameda Corridor in Californiawas the need to reduce dwell time, access/egress and drayage times for the San Pedroports. The conge<strong>st</strong>ion and delays associated with getting from the ports across Los Angeleswas such that shippers were willing to pay as much as $17 per box for improved service 9 .9 “Expanded Preliminary Model – Alameda Corridor”. Transportation Economics & Management Sy<strong>st</strong>ems, Inc. March 1993.TEMS, Inc. / RAND Corporation January 2007 15
Great Lakes-St. Lawrence SeawayNew Cargoes/New Vessels - Market AssessmentFREQUENCY OF SERVICEThe frequency of service is often a critical factor in a shipper’s decision to use a particulartransportation sy<strong>st</strong>em. On Europe’s Rhine/Danube River Sy<strong>st</strong>em, container traffic bargesare being scheduled to ensure that required frequencies are being met and their reliability isimproved. It is likely that frequency will be a critical factor on the GLSLS Sy<strong>st</strong>em and aminimum daily service level will be essential to attracting shippers and <strong>new</strong> <strong>cargoes</strong>.SEASONALITYA key issue for any waterway transportation sy<strong>st</strong>em is seasonality. Over the la<strong>st</strong> quartercentury the GLSLS Sy<strong>st</strong>em has typically opened in late March and closed in late December,a period of 274 days, or more than 9 months. While the months of January to March aretypically some of the slowe<strong>st</strong> for manufacturing and, in particular, the retail indu<strong>st</strong>ry, theinability to offer service at this time is a major limitation.The impact of closing the GLSLS Sy<strong>st</strong>em for three months is that shippers and carriers willlook for other alternatives. Once they find those alternatives, build relationships, negotiatecontracts, and develop a dependable logi<strong>st</strong>ics chain it is difficult to see why they wouldreturn to the GLSLS. To evaluate the impact of seasonality, specific shipper and carrier inputis required that shows the “disruptiveness” of the seasonality issue, how it affects co<strong>st</strong>s andthe penalty associated with forcing shippers to use alternative rail and truck options.Shippers and carriers are looking for seamless logi<strong>st</strong>ic sy<strong>st</strong>ems negotiated for a givenbusiness cycle. One possible alternative is for the GLSLS to develop partnershiparrangements to mitigate this issue as will be proposed in this report.RELIABILITYThe <strong>new</strong> economy of the 21<strong>st</strong> century is entirely dependent upon reliable transportationservice to support the ju<strong>st</strong>-in-time manufacturing and processing of modern indu<strong>st</strong>ry.Improving reliability significantly improves the ability of a facility such as the GLSLS tosupport container traffic. Reliability needs, therefore, to be built into the supply model.SECURITY OF SHIPMENTBefore containerization, pilferage from all forms of transportation was a problem. As aresult, of containerization, a much more secure mechanism for moving goods was availableand the level of pilferage diminished. The use of containers has enhanced shipmentsecurity, however, the level of security between different modes might not be the same,and this could be a significant factor to the shipper. Water transportation is regarded byshippers as being a safer mode than rail and truck. This could be an advantage in themovement of, for example, hazardous and wa<strong>st</strong>e material.SHIPMENT CHARACTERISTICSCargoes have special characteri<strong>st</strong>ics that make them more or less subject to transportationre<strong>st</strong>rictions on certain modes. Hazardous materials or cargo requiring refrigeration oftenhave both handling co<strong>st</strong> implications and modal re<strong>st</strong>rictions. Hazardous materials might bebanned from critical bridges and tunnels.CAPACITY CAPABILITIESAn increasingly important factor in shipping decisions in the future will be sy<strong>st</strong>em capacity.It is anticipated that supply side limitations including labor (trucking indu<strong>st</strong>ry) andinfra<strong>st</strong>ructure will make exi<strong>st</strong>ing di<strong>st</strong>ribution sy<strong>st</strong>ems less co<strong>st</strong> effective and physicallylimited in what they can carry. As a result, capacity issues need to be considered for theirTEMS, Inc. / RAND Corporation January 2007 16
Great Lakes-St. Lawrence SeawayNew Cargoes/New Vessels - Market Assessmentimpact on transit times and their effect on shipper usage decisions. The aim is to assessboth types of issues with shippers.CONCLUSION: The supply side model needs to be able to faithfully replicate these factors andto show the impact of changing any one of the factors on the supply chain and overallmodal efficiency.2.2.2 DEMAND SIDE ISSUESOn the demand side, a number of <strong>market</strong> issues need to be assessed in the analysis. Theseinclude –CHANGES IN MARKET SIZE DUE TO ECONOMIC GROWTHOver the next twenty to thirty years, if current trends continue, the freight volumes willincrease by at lea<strong>st</strong> 70 to 100 percent. Recent Stati<strong>st</strong>ics Canada, U.S. Bureau ofCommerce, and OECD data show trade volumes increasing rapidly from the early 1980’sas the level of integration of the world economy increased. For example, U.S. exportsincreased 63 percent in the ten years from 1992-2002, while U.S. imports grew 138percent in the same time period according to the U.S. Bureau of Economic Analysis. 10 Theexi<strong>st</strong>ing infra<strong>st</strong>ructure will find this difficult to handle due to capacity limitations and onceexi<strong>st</strong>ing modes reach full capacity, cargo will seek <strong>new</strong> opportunities to reach <strong>market</strong>s. Atthis point, the GLSLS Sy<strong>st</strong>em will become more competitive and more attractive forcontainer traffic. As a result, the demand model has been made responsive to both thegrowth in demand and the supply side capacity re<strong>st</strong>rictions.IMPACT OF MARKET ACCESSIBILITY ON TOTAL DEMANDAs exi<strong>st</strong>ing freight options reach capacity, <strong>new</strong> routes will open. If these <strong>new</strong> routes provenot to be as competitive as exi<strong>st</strong>ing routes, this will impact (reduce) the size of the overall<strong>market</strong>. Significant di<strong>st</strong>ributional impacts might follow. Conversely, once the minimumvolume threshold required to support a GLSLS vessel service has been attained, shipperswill have additional competitive options for transporting their goods. While the demand fortransportation services is largely a derived demand dependent on the requirements ofagricultural, manufacturing and service indu<strong>st</strong>ries, a less competitive transportation<strong>market</strong> reduces the total demand for products while a more competitive transportation<strong>market</strong> makes the total <strong>market</strong> for products larger. This is due to the impact thecompetition has on the co<strong>st</strong>s of transportation and the overall pricing of products. Thedemand model in conjunction with the supply model mu<strong>st</strong> be capable of determining theappropriate level of demand at equilibrium (i.e., the balance of <strong>market</strong> price and supplyco<strong>st</strong>s).LEVEL OF MODAL AND ROUTE COMPETITIONThe competition between modes and routes is assessed by a comparison of their relativeperformance as measured by transit time, price, frequency, etc. Changes in the relativeperformance of a mode or route will make it more or less competitive. The size of a givenmode’s <strong>market</strong> share is proportional to its relative competitiveness as measured by itsperformance compared to other modes. In evaluating route options the <strong>st</strong>udy hasconsidered the changes in trade with Asia, the increasing role of south and we<strong>st</strong> Asia andthe potential for Asian traffic to the Midwe<strong>st</strong> and central Canada to divert to an Atlanticroute.10 U.S. Bureau of Economic Analysis of Current Business. April 2003.TEMS, Inc. / RAND Corporation January 2007 17
Great Lakes-St. Lawrence SeawayNew Cargoes/New Vessels - Market AssessmentCAPACITY CONSTRAINTS AND TRAFFIC SHIFTSThe impact of mode, route, or port capacity con<strong>st</strong>raints on ports, railroad, and trucks cancause a fundamental shift in the competitive advantage of the GLSLS Sy<strong>st</strong>em. If therelative performance of today’s port and inland transportation di<strong>st</strong>ribution sy<strong>st</strong>emworsens, the GLSLS Sy<strong>st</strong>em could become an overflow option for the truck and railoperations.Conclusion: The analysis of the demand side factors needs to be undertaken using model<strong>st</strong>hat provide a mechanism for evaluating the full supply chain of each mode and set ofmodal service options. This will show the relevance of each component of the supply chainto a shipper or carrier’s decision-making process. This decision making process wasassessed by conducting <strong>st</strong>ated preference surveys that allow the <strong>st</strong>rengths and weaknessesof each service/supply chain option to be evaluated. This analysis showed not only howcompetitive the exi<strong>st</strong>ing GLSLS Sy<strong>st</strong>em is, but also how it needs to change in order toattract <strong>new</strong> cargo. In this way, the thresholds that the GLSLS Sy<strong>st</strong>em needs to reach toachieve <strong>market</strong> share were identified and the actual potential of achieving the thresholddefined.2.3 EVALUATION FRAMEWORKSThe purpose of the micro-economic evaluation framework is to provide a basis for assessingthe “ela<strong>st</strong>icities” associated with providing different levels of service on the GLSLS Sy<strong>st</strong>em.To define ela<strong>st</strong>icities, a supply and demand analysis is required that shows the equilibriumresponse of demand to any given set of supply conditions. It is critical to measureela<strong>st</strong>icities at equilibrium since ela<strong>st</strong>icities can change dramatically for quite small changesin the levels of service provided by any mode. For example, frequency ela<strong>st</strong>icities changedramatically as water service increases from one service per week to eight services perweek (-0.95 to –0.1). As well, different ela<strong>st</strong>icities apply to either increasing or decreasingservices or co<strong>st</strong>s. As a result, the final form of the <strong>st</strong>ructure depended on the final corridorand route definitions, the evaluation framework should provide a basis for comparingalternative logi<strong>st</strong>ic <strong>st</strong>ructures for the GLSLS Sy<strong>st</strong>em and its ability to provide a competitiveservice. To meet this requirement, both the supply side and demand side factors need to beevaluated within a “what-if” framework. The what-if framework contains three majorcomponents –• Economic scenarios and transportation <strong>st</strong>rategies – what-if alternatives• Demand model factors and sy<strong>st</strong>ems• Supply model factors and sy<strong>st</strong>emsTEMS, Inc. / RAND Corporation January 2007 18
Great Lakes-St. Lawrence SeawayNew Cargoes/New Vessels - Market AssessmentExhibit 2-11: Evaluation FrameworksWHAT-IFALTERNATIVESSUPPLY FACTORSCOSTTIMERELIABILITYSERVICE LEVELEVALUATIONFRAMEWORKDEMAND FACTORSECONOMICGROWTHINDUCED DEMANDCOMPETITIVEMODES, PORTSAND ROUTESPOLICY ASSESSMENT2.3.1 ECONOMIC SCENARIOS AND TRANSPORTATION STRATEGIESThe economic scenarios and transportation <strong>st</strong>rategies provide the what-if que<strong>st</strong>ions for themodel framework to evaluate. They include –ECONOMIC GROWTH SCENARIOSThis analysis shows how the economic growth impacts total cargo volumes by SICclass/type and the rates of change in the <strong>market</strong>. The range of options should includecentral, optimi<strong>st</strong>ic, and pessimi<strong>st</strong>ic growth rates.COMPETITIVE MODE ROUTE INVESTMENTSThis analysis shows how inve<strong>st</strong>ments or disinve<strong>st</strong>ments in a mode’s infra<strong>st</strong>ructure willaffect its performance and efficiency. This would include changes in price, transit time,reliability, and capacity.RESOURCE COSTS STRATEGIESThis analysis shows how changes in resource co<strong>st</strong>s (e.g., oil price increases in real terms)will affect the performance of different modes/routes and options.GLSLS INFRASTRUCTURE IMPROVEMENT STRATEGIESThis analysis shows how any planned improvements for the GLSLS Sy<strong>st</strong>em, such as thereliability of locks, will affect its performance and efficiency.NEW VESSEL TECHNOLOGY STRATEGIESThis analysis shows how both exi<strong>st</strong>ing barge and high speed surface technologies willchange the performance of the GLSLS Sy<strong>st</strong>em, its efficiency and its competitive positionrelative to truck and rail.REGULATORY POLICY STRATEGIESThis analysis shows how policies affect a mode’s performance, <strong>market</strong> shares, andcompetitiveness.TEMS, Inc. / RAND Corporation January 2007 19
Great Lakes-St. Lawrence SeawayNew Cargoes/New Vessels - Market Assessment2.3.2 DEMAND SIDE MODEL SYSTEMSIn evaluating the demand and <strong>market</strong> share implications for any economic scenario ortransportation <strong>st</strong>rategy for the GLSLS Sy<strong>st</strong>em, four specific demand model functions wereused. These include –TOTAL DEMAND MODELThis model provides an under<strong>st</strong>anding of how the total <strong>market</strong> will grow in terms of bothbulk and container cargo. It is anticipated that the underlying macro-economic foreca<strong>st</strong>sof trade and growth will be provided by the Policy Analysis Model (PAM).MARKET ACCESSIBILITY MODELThis model shows how the transportation sy<strong>st</strong>em performs in generating economic growthand traffic or discouraging economic growth and traffic. Improved transportation networksexpand overall <strong>market</strong>s, while conge<strong>st</strong>ed transportation networks reduce <strong>market</strong> size.MODE AND ROUTE COMPETITION MODELThe competitive character of each mode is assessed by comparison of their supply chainlogi<strong>st</strong>ics. This includes details of transit times, prices, reliability, seasonality, access, andegress.The hierarchical demand function for evaluating transportation <strong>st</strong>rategies included –Exhibit 2-12: Typical Hierarchical Demand Functions for EvaluatingTransportation StrategiesTotal Trade in CorridorPort 1Port 2Port 3 Port 4Rail Truck WaterRail Truck WaterCAPACITY CONSTRAINTS MODELAn analysis was undertaken to show how the impact of increased conge<strong>st</strong>ion at ports oron the inland access and di<strong>st</strong>ribution networks affected the relative competitive <strong>st</strong>ructureof inland di<strong>st</strong>ribution and how such changes influence the relative <strong>market</strong> shares of eachmode.2.3.3 SUPPLY SIDE MODEL SYSTEMSThe supply side model was developed using a generalized co<strong>st</strong> metric. This provided theability to evaluate changes in any of the supply side factors such as price, transit time,seasonality, frequency, reliability, etc. The importance to shippers of each factor wasTEMS, Inc. / RAND Corporation January 2007 20
Great Lakes-St. Lawrence SeawayNew Cargoes/New Vessels - Market Assessmentidentified in the <strong>st</strong>ated preference survey and included in the generalized co<strong>st</strong> metric as aweight on each factor.Such a metric allows the supply side model to evaluate a wide range of transportation<strong>st</strong>rategies and service options. These might include dome<strong>st</strong>ic services between the entryports of Halifax, Quebec City and Montreal and potential inland di<strong>st</strong>ribution centers such asToronto, Cleveland, Detroit, and Chicago. These services would of course compete withexi<strong>st</strong>ing rail and truck sy<strong>st</strong>ems and become an effective part of an intermodal networksupporting the ports and inland di<strong>st</strong>ribution centers of the GLSLS Sy<strong>st</strong>em. The generalizedco<strong>st</strong> metric also allows con<strong>st</strong>raints on the sy<strong>st</strong>em such as highway or port conge<strong>st</strong>ion andcapacity con<strong>st</strong>raints to be evaluated in the demand model.The generalized co<strong>st</strong> of transportation is typically defined in travel time, i.e., minutes, ratherthan dollars. Co<strong>st</strong>s are converted to time by applying appropriate conversion factors, asshown below. The generalized co<strong>st</strong> (GC) of travel between zones i and j for mode m andcommodity p is calculated as follows:WhereGCijmp= TTijmTC+VOTijmpmpVOF mpOH+VOT mp F ijm Ci jmVOR+mpexp(−OTPVOTmpi jm)TT ijm= Travel time between zones i and j for mode m (in-vehicle time + wait time + connectiontime + access/egress time + interchange penalty), with waiting, connect and access/egres<strong>st</strong>ime increased by an amount to account for the additional disutility associated with theseactivitiesTC ijmp = Travel co<strong>st</strong> between zones i and j for mode m and commodity p (tariff + access/egress co<strong>st</strong>,tolls, port charges, operating co<strong>st</strong>s for each mode)VOT mp = Value of Time for mode m and commodity pVOF mp = Value of Frequency for mode m and commodity pOH = Operating hours per weekF ijm = Frequency in departures per week between zones i and j for mode mC ijm = Convenience factor of schedule times for travel between zones i and j for mode mVOR mp = Value of Reliability for mode m and commodity pOTP ijm = On-time performance for travel between zones i and j for mode m2.4 MAJOR STUDY TASKS AND ACTIVITIESThis section outlines the key work tasks completed during the course of the NewCargoes/New Vessels Study and the <strong>st</strong>udy deliverables to be provided to the GLSLSEconomics Team. This work plan represents TEMS’ and RAND’s approach to the <strong>st</strong>udy. Atthe outset of the <strong>st</strong>udy, there was a detailed discussion of the work plan activities betweenthe GLSLS Economics Team and the <strong>st</strong>udy team to ensure that the work plan exactlyreflected the needs and goals of the GLSLS Economics Team.TRAFFIC DATABASEThe development of the container and neobulk cargo database required a process thatprovided a comprehensive assessment of the <strong>st</strong>udy area, total volumes of traffic moving,and the disaggregation of traffic into bulk, neobulk, and container flows. The traffic flowswere modeled using origin-de<strong>st</strong>ination databases derived from exi<strong>st</strong>ing data sources.Furthermore, <strong>st</strong>ated preference surveys were used to e<strong>st</strong>ablish “preference utilities” andTEMS, Inc. / RAND Corporation January 2007 21
Great Lakes-St. Lawrence SeawayNew Cargoes/New Vessels - Market Assessmenttheir “ela<strong>st</strong>icities,” for shippers. This work was completed by con<strong>st</strong>ructing specific indu<strong>st</strong>rialshipper and carrier surveys.The approach adopted defined an integrated process for neo-bulk and container cargodatabase development –Exhibit 2-13: Database DevelopmentNeo-BulkDatabaseContainerDatabaseAnalysisTASK 1: DEVELOP DATABASESAs a preliminary <strong>st</strong>ep in the development of the <strong>st</strong>udy databank, the consultant reviewedexi<strong>st</strong>ing transportation data, including both Transport Canada and USDOT freight movementinformation in the Northea<strong>st</strong> and Midwe<strong>st</strong> Corridors. This data will include AADT and ADT<strong>st</strong>ati<strong>st</strong>ics and Stati<strong>st</strong>ics Canada and U.S. Bureau of Economic Analysis (BEA) commoditydata. This review identified any <strong>new</strong> survey data that needed to be collected in order toensure that the survey effort had maximum effectiveness.TASK 2: DEFINE SURVEY NEEDSOnce the basic needs for data were e<strong>st</strong>ablished, the sampling frames, design of theque<strong>st</strong>ionnaires, development of survey procedures and actual surveys were completed. Thiswas initiated after a pilot te<strong>st</strong>ing of que<strong>st</strong>ionnaires, survey in<strong>st</strong>ruments, and surveyapproach. A pilot survey was conducted to te<strong>st</strong> the relevance of the proposed que<strong>st</strong>ions foreach mode and trip purpose quota group. The results of this process were reviewed and thesurvey que<strong>st</strong>ionnaires and methods were adju<strong>st</strong>ed as necessary.TASK 3: SHIPPER/CARRIER SURVEYSThe surveys were carried out by a field force specially trained in attitudinal andtransportation profile survey work. The survey framework was e<strong>st</strong>ablished with the supportof the U.S.-based National Indu<strong>st</strong>rial Transportation League and Canadian Indu<strong>st</strong>rialTransportation Association. They provided membership li<strong>st</strong>s, which were adopted as thesurvey framework. The Stated Preference Attitudinal Survey was carried out with shippingand carrier companies by means of a web survey. Where necessary, telephone screeningand sampling were used in the attitudinal survey as an aid to the data collection process.The data collected was coded, edited, and expanded to provide a comprehensive database.This included the development of a seasonal <strong>st</strong>ructure to the database so that foreca<strong>st</strong>scould be made on an annual and seasonal basis.TEMS, Inc. / RAND Corporation January 2007 22
Great Lakes-St. Lawrence SeawayNew Cargoes/New Vessels - Market AssessmentTASK 4: TRANSPORTATION SYSTEM NETWORK DATAIn addition to the development of demand data on traffic movements, an inventory of all<strong>st</strong>udy area sy<strong>st</strong>ems was compiled to include modes, times, tariffs, tolls, frequencies,location of terminals, co<strong>st</strong>s, etc. This information was obtained largely from departments oftransportation and modal authorities (e.g., the St. Lawrence Seaway ManagementCorporation) and discussions with carriers to ensure that the information on service levels,co<strong>st</strong>s and timetables was the mo<strong>st</strong> up-to-date available. The inventory was computerizedand set up as part of the overall <strong>st</strong>udy database.TASK 5: SYSTEM DATABANKA databank was set up containing both demand and transportation sy<strong>st</strong>ems data. Allinformation was filed and subjected to a data verification assessment whereby crosschecksare made on the basic data to confirm its accuracy. The database was based on a 200-zonesy<strong>st</strong>em reflecting Census tract and other <strong>st</strong>ati<strong>st</strong>ical formats. The <strong>st</strong>udy area included a U.S.and Canadian corridor up to 200 miles wide in order to properly include all of thecompetitive transportation network options. The analysis included large cities such asHalifax, Montreal, Toronto, Hamilton, Bo<strong>st</strong>on, New York, Newark, Philadelphia, Baltimoreand Washington, which are the key nexus points in the sy<strong>st</strong>em. This analysis includedevaluating service levels of the alternative rail and highway facilities.TASK 6: TRADE-OFF ANALYSISUsing the results of the Stated Preference Attitudinal Surveys, a trade-off analysis wascarried out to identify the relative ranking and values of both sy<strong>st</strong>em and mode appealvariables for each SIC/commodity type. For sy<strong>st</strong>em variables, the analysis defined ownmode and cross ela<strong>st</strong>icities of demand for transit time, price and frequency for each modeand shipping purpose. The analysis was a two-<strong>st</strong>age process and used algorithms speciallydeveloped to provide preference utilities, own and cross ela<strong>st</strong>icities and modal biase<strong>st</strong>imates. For the mode appeal variables, specific rankings, <strong>market</strong> share, and generalizedco<strong>st</strong> values were derived.TASK 7: MODEL SPECIFICATIONAt the model specification <strong>st</strong>age, a range of possible modeling sy<strong>st</strong>ems included variousforms of the direct demand, induced demand, and modal/route choice and capacity re<strong>st</strong>raintmodels for regional transportation were evaluated. A number of different model <strong>st</strong>ructureswere te<strong>st</strong>ed in calibration. Year 2005 was used as the base year for calibration purposes.The agreed upon models were calibrated and the <strong>st</strong>ati<strong>st</strong>ical validity of each te<strong>st</strong>ed usingrange, logic and consi<strong>st</strong>ency checks. In developing each model sy<strong>st</strong>em, an interactiveassessment was made of the potential role of the variables and the ability of the model torepresent transportation behavior.TASK 8: ECONOMIC SCENARIOSIn order to foreca<strong>st</strong> the impact of regional economic growth on total traffic demand,economic scenarios were prepared on a zonal basis to identify the likely range of GNP,income, population and employment growth over the foreca<strong>st</strong> period. The key input indeveloping the economic scenarios were the <strong>st</strong>ate, federal (Stati<strong>st</strong>ics Canada and the U.S.BEA) and commercial long-term foreca<strong>st</strong>s. The results of each foreca<strong>st</strong> were compared andthree different long-term scenarios reflecting central, optimi<strong>st</strong>ic, and pessimi<strong>st</strong>ic growthrates were determined.TEMS, Inc. / RAND Corporation January 2007 23
Great Lakes-St. Lawrence SeawayNew Cargoes/New Vessels - Market AssessmentTASK 9: GLSLS SYSTEM STRATEGIESA number of different GLSLS Sy<strong>st</strong>em <strong>st</strong>rategies were developed in conjunction with theGLSLS Economics Team for evaluation in the models. The <strong>st</strong>rategies considered a range ofboth sy<strong>st</strong>em and mode appeal factors such as frequencies, speeds, loading times, andquality of service. The analysis considered the use of four vessel technologies. The <strong>st</strong>atedpreference mode appeal analysis included different types of services and reliability levels.By examining the impact of these facilities again<strong>st</strong> tariff levels and transit times, evaluationscan be made that identify the be<strong>st</strong> GLSLS Sy<strong>st</strong>em <strong>st</strong>rategies. Based on these <strong>st</strong>rategies, theGLSLS foreca<strong>st</strong>s were made. Alternative <strong>st</strong>rategies for other transportation modes were alsodeveloped, so that the impact of inve<strong>st</strong>ment (or disinve<strong>st</strong>ment) in other modes such aschanges in transportation time and services of other modes was also incorporated into thetransit time foreca<strong>st</strong>s and sensitivity analyses for the GLSLS foreca<strong>st</strong>s. This task wasundertaken in conjunction with the GLSLS Economics Team.TASK 10: DEMAND FORECASTSUsing the economic scenarios and GLSLS Sy<strong>st</strong>em <strong>st</strong>rategies, foreca<strong>st</strong>s for the base year andten-year intervals between 2005 and 2050 were prepared for <strong>new</strong> <strong>cargoes</strong>. For the GLSLSSy<strong>st</strong>em, e<strong>st</strong>imates were made in terms of freight volumes and revenues on an annual basis;these e<strong>st</strong>imates were made on a route segment and city-pair basis. For other modes,overall cargo movements and <strong>market</strong> shares were e<strong>st</strong>imated. Interpolation was used toderive foreca<strong>st</strong>s for the five-year increments between 2005 and 2050.TASK 11: ELASTICITY COMPARATIVE ANALYSISUsing the ela<strong>st</strong>icities e<strong>st</strong>imated in the Trade-Off Analysis and equilibrium modeling, acomparative analysis was made with the ela<strong>st</strong>icities derived by the consultant in previous<strong>st</strong>udies. These <strong>st</strong>udies provided a range of values again<strong>st</strong> which the <strong>st</strong>udy e<strong>st</strong>imates werecompared and contra<strong>st</strong>ed. There was a marked degree of comparability between ela<strong>st</strong>icityvalues once income, trip length, and generalized co<strong>st</strong> differences are accounted for. Again,close consultation with the GLSLS Economics Team at this <strong>st</strong>age allowed a full discussionand assessment of the ela<strong>st</strong>icity findings. This was particularly important in validating theforeca<strong>st</strong>s and assuring the quality of the results.TASK 12: SENSITIVITY TESTSSensitivity te<strong>st</strong>s were made for a range of what-if economic scenarios and competitive modetransportation <strong>st</strong>rategies and trip characteri<strong>st</strong>ics. Following the completion of the initialforeca<strong>st</strong>ing sensitivities, the consultant, in conjunction with the GLSLS Economics Team,reviewed the results.TASK 13: DRAFT AND FINAL REPORTSA draft report was prepared, describing all aspects of the <strong>st</strong>udy and explained themethodology and findings of each <strong>st</strong>ep in the analysis. The draft report provided acomprehensive description of the <strong>st</strong>udy, its databases, methodologies used, model sy<strong>st</strong>ems,results, and findings. In preparing the report, emphasis was placed on the use of graphic<strong>st</strong>o illu<strong>st</strong>rate complex concepts, ideas, and results. The draft report was submitted to theGLSLS Economics Team for review and approval. Upon notification, the final report will beprepared and submitted.TEMS, Inc. / RAND Corporation January 2007 24
Great Lakes-St. Lawrence SeawayNew Cargoes/New Vessels - Market AssessmentExhibit 2-14: Generic Work Plan for the GLSLS Sy<strong>st</strong>em New Cargoes/New Vessels StudyData PreparationStudy DesignNeo-Bulk/ContainerReviewExi<strong>st</strong>ing DataSampling Framesand Pilot SurveyCarry Out Surveys /Focus GroupsPrepareBase Demand DataModel DevelopmentPrepareInventory of TransportationSy<strong>st</strong>emsSet UpDatabankModelDevelopmentModelCalibrationModel ValidationDefineComparative Ela<strong>st</strong>icitiesCarry OutQualitative AnalysisDefineForeca<strong>st</strong>ing Ela<strong>st</strong>icitiesModelWorkshopForeca<strong>st</strong> DemandPrepareEconomic ScenariosDefineGLSLS Sy<strong>st</strong>em Strategiesfor Service and VesselTechnologyPrepare Demand Foreca<strong>st</strong>sCarry OutSensitivity Te<strong>st</strong>ingCargo and RevenueForeca<strong>st</strong>sReportPrepareDraft ReportPrepareFinal ReportTEMS, Inc. / RAND Corporation January 2007 25
Great Lakes-St. Lawrence SeawayNew Cargoes/New Vessels - Market Assessment2.5 KEY STUDY OUTPUTSThe <strong>st</strong>udy provided a wide range of data including the results of the <strong>st</strong>ated preferencesurveys, the final model calibration e<strong>st</strong>imates of the competitiveness of the GLSLS Sy<strong>st</strong>emfor <strong>new</strong> <strong>cargoes</strong> (<strong>new</strong> neo-bulk and container) under different pricing <strong>st</strong>ructures, vesseltechnologies and infra<strong>st</strong>ructure <strong>st</strong>rategies. The <strong>market</strong> potential for <strong>new</strong> <strong>cargoes</strong> and <strong>new</strong><strong>vessels</strong> was identified, projections of cargo volumes and revenue were developed, cu<strong>st</strong>omerpreferences were identified, and <strong>st</strong>rategies to improve the GLSLS service and measures ofits competitiveness were developed.Study deliverables included –• Cargo composition profiles for the GLSLS Sy<strong>st</strong>em showing variations in use. Theprofile identified volumes, values, and transportation characteri<strong>st</strong>ics of each cargotype by each traffic. This data was collected during the shipper profile analysis thatwas completed as part of the <strong>st</strong>ated preference survey. The data was edited, coded,and <strong>st</strong>ored in the demand model for use in the demand foreca<strong>st</strong>ing process. It wasdirectly output from the model’s databank and e<strong>st</strong>imated <strong>market</strong> shares for theGLSLS Sy<strong>st</strong>em were produced as a result of calibrating the demand model.• Base and foreca<strong>st</strong> year networks specifying generalized times, co<strong>st</strong>s and interchangepenalties for cargo movements. These were suitably weighted by indu<strong>st</strong>rialdi<strong>st</strong>ributions for each zone pair for the whole zone sy<strong>st</strong>em. This is a direct output ofthe edited data files in the demand model.• Base and foreca<strong>st</strong> year equilibrium <strong>st</strong>eady <strong>st</strong>ate <strong>market</strong> shares. These were given onan annual basis over the life of the project, drawn from the demand model. Theforeca<strong>st</strong>s and modal split e<strong>st</strong>imates showed the growth in cargo and how long it willtake to reach equilibrium or <strong>st</strong>eady <strong>st</strong>ate conditions.• E<strong>st</strong>imates of container <strong>market</strong>s in terms of current size, hi<strong>st</strong>oric trends, and longtermannual foreca<strong>st</strong>s through 2050.• An analysis of the trends in movement co<strong>st</strong>s and service levels for the period 2004 to2050. This analysis was an integral part of the <strong>st</strong>rategy formulation process,considered changes, or emerging trends (e.g., capacity limitations) in transportationconditions for each competitive mode of transportation analyzed and the potentialimpact on the GLSLS Sy<strong>st</strong>em.• A composite set of cargo and revenue foreca<strong>st</strong>s for all city-pairs and routes,incorporating sensitivity te<strong>st</strong>s for each economic scenario and transportation <strong>st</strong>rategyand including an analysis of truck and rail service options and a revenue maximizinganalysis. The analysis also considered competitive responses in terms of lower ratesand/or improved facilities. The foreca<strong>st</strong>s were subject to a robu<strong>st</strong>ness analysis thatchecked, by model <strong>st</strong>ructure, weights, coefficients, functions, etc., the sensitivity offoreca<strong>st</strong>s, <strong>market</strong> segments, and origin-de<strong>st</strong>ination movements.• A set of model ela<strong>st</strong>icities that show the likely variation of cargo, service levels,tariffs and other critical input variables was developed.TEMS, Inc. / RAND Corporation January 2007 26
Great Lakes-St. Lawrence SeawayNew Cargoes/New Vessels - Market Assessment3 ECONOMIC SIGNIFICANCE OF THE GREAT LAKES ANDST. LAWRENCE SEAWAY3.1 INTRODUCTIONThe Great Lakes and St. Lawrence Seaway (GLSLS) runs through the heart of one of themo<strong>st</strong> densely populated and leading economic regions of the U.S. and Canada. This 2,300-mile inland waterway <strong>st</strong>retches from the Gulf of St. Lawrence, along the St. Lawrence Riverand across the Great Lakes linking the U.S. and Canadian seaboard cities of the U.S. NorthEa<strong>st</strong>, Atlantic Canada, and Quebec with the Midwe<strong>st</strong> and Central Canada and the Canadianand U.S. Prairies and Great Plains. As such, it links the trade and business oriented Atlanticseaboard cities, with the manufacturing and indu<strong>st</strong>rial heartland of the Midwe<strong>st</strong> and CentralCanada and the primary resource, agricultural and mining areas of the Canadian Prairiesand Great Plains. It includes some of the large<strong>st</strong> cities of the U.S. and Canada such asChicago, Cleveland, Columbus, Detroit and St. Louis, as well as Canada’s two major cities ofMontreal and Toronto.The GLSLS is therefore a major trade corridor providing access to both the Atlantic Oceanand Europe and to the interior of North America. It is at the heart of what has become theworld’s large<strong>st</strong> manufacturing region supported by a transportation nexus that links theAtlantic coa<strong>st</strong> “ports of entrée” with the agricultural, fore<strong>st</strong>ry, minerals and one with theresources of the Great Plains and Prairies. In its development, the Great Lakes and St.Lawrence Seaway region relied heavily on flows of goods, services, and labor from both theold colonial seaboard communities and the resources of the interior. As a result, the region’<strong>st</strong>rade flows have always been both ea<strong>st</strong> and we<strong>st</strong> and with the increasing globalization ofthe world economy these flows have been enhanced and overlaid by <strong>new</strong> flows that reflectthe emerging ‘<strong>new</strong> economy’ of the region, as well as the growth of trade with Asia.To under<strong>st</strong>and the exi<strong>st</strong>ing and future role of the GLSLS, it is essential therefore tounder<strong>st</strong>and the region’s trade relations with the Atlantic Seaboard “ports of entrée” as wellas the resource flows from the interior and the increasing trade with Asia. As shown inExhibit 3-1, in defining the <strong>st</strong>udy area for the New Cargoes and New Vessels Study, it wasnecessary to define a region that includes the major ea<strong>st</strong> coa<strong>st</strong> ports of the U.S. and Canadaand their highway and rail access routes to the Midwe<strong>st</strong> and Central Canada. In addition, itwas necessary to include as the part of the Great Plains and Prairies that provide access byrail and highway to the we<strong>st</strong>ern Great Lakes ports. For comparative purposes, data isprovided for the GLSLS Study Region as a whole, as well as the Atlantic Region, Midwe<strong>st</strong>and Central Canada and the Prairies and Great Plains.TEMS, Inc. / RAND Corporation January 2007 27
Great Lakes-St. Lawrence SeawayNew Cargoes/New Vessels - Market AssessmentExhibit 3-1: Great Lakes and St. Lawrence Seaway Study Area3.2 THE REGION’S DEVELOPMENTExhibit 3-2 shows that the year 2000 population of this region was almo<strong>st</strong> 156 million or 50percent of the U.S. and Canadian population. In terms of the di<strong>st</strong>ribution of populationwithin the <strong>st</strong>udy area, 50% is in the Atlantic Seaboard and 40% is in the Midwe<strong>st</strong> andCentral Canada and 10 percent in the Great Plains.The population is settled on less than 20 percent of the land mass of the U.S. and Canada.With the exception of certain We<strong>st</strong> Coa<strong>st</strong> cities (San Diego-Los Angeles, San Francisco-Oakland, Seattle and Vancouver) and the growing SMSA’s of South Florida and Texas, theGLSLS region has the highe<strong>st</strong> population density containing 60 percent of the urbanpopulation of Canada and U.S.Exhibit 3-2: Population in GLSLS Study Area, 2000 1GLSLS Study Area versus Re<strong>st</strong> ofNorth AmericaGLSLSStudyArea50.1%Re<strong>st</strong> ofNorthAmerica49.9%Atlantic50.1%GLSLS Study AreaGreatPlains10.0%Midwe<strong>st</strong>& CentralCanada39.9%1 US Population is 281.4 million, the Canadian Population is 29.8 million for year 2000.TEMS, Inc. / RAND Corporation January 2007 28
Great Lakes-St. Lawrence SeawayNew Cargoes/New Vessels - Market AssessmentExhibit 3-3 shows that the population density of the GLSLS <strong>st</strong>udy area has an average of nearly140 people per square mile compared with ju<strong>st</strong> under 15 people per square mile for the re<strong>st</strong> ofNorth America.Exhibit 3-3: Population Density in GLSLS Study Area, 2000GLSLS Study Area versus Re<strong>st</strong> of North AmericaRe<strong>st</strong> of NorthAmerica13GLSLS StudyArea1390 50 100 150Average Population per sq. mileThe concentrations in population in the region reflect the fact that the bi-national AtlanticSeaboard areas were the earlie<strong>st</strong> areas developed by the flood of European immigration inthe 18th and 19th Century, but grew as the <<strong>st</strong>rong>great</<strong>st</strong>rong> trade and service centers for the wholecontinent. As a result, cities like New York, Philadelphia, Bo<strong>st</strong>on, and Montreal <strong>st</strong>ill play adominant role in the economy of the region and indeed all of North America. Further we<strong>st</strong> theheartland of Central Canada and the Midwe<strong>st</strong> grew as North America’s premier manufacturingcenters in the 19 th and 20 th Centuries. This development reflected the population’s ingenuity, its<strong>new</strong> transportation nexus, and the resource base (agricultural products, coal, iron, <strong>st</strong>eel, wood,and labor) that were the key to the indu<strong>st</strong>rial revolution in both Europe and North America. Thetransportation nexus of the Midwe<strong>st</strong> reflected the flow of products from both the Atlanticseaboard and the flow of resources (agricultural, ores, coal, and wood) from the Great Plains andPrairies. The Midwe<strong>st</strong> became in Chicago, Detroit, Cleveland, Buffalo, Toronto, and Hamilton anda mass of other smaller water ports a convenient break of bulk point. At these locations, <strong>st</strong>eeland other metal manufacturing lead to vehicle assembly and building. Initially the region builtboats (e.g. the ships for the 1812-14 war between the U.S. and Canada were built in Erie,Pennsylvania and Dover, Ontario) which led to trains and rail cars and finally to automobiles andtrucks. The ready availability of needed raw materials, transportation, and labor spurred thedevelopment of the indu<strong>st</strong>rial complex that even today is the world’s large<strong>st</strong> vehiclemanufacturing center.As its indu<strong>st</strong>rial and engineering base expanded and its work force developed, the region becamea major <strong>market</strong> for products in its own right. While initially, the region’s products were importedfrom Europe gradually they began to be produced locally. The <strong>market</strong> continued to grow,supported by a growing population and the expanding income of the region. This expansion ofthe <strong>market</strong> was accelerated in the early part of the 20 th Century as Europe experienced twoworld wars and looked to North America for support and products. By the mid twentieth Century,the Midwe<strong>st</strong> and Central Canada had become the large<strong>st</strong> manufacturing center in the world witha specialization in fundamental products like iron, <strong>st</strong>eel and chemicals, as well as themanufacturer of every type of equipment, machine and, of course, vehicles.TEMS, Inc. / RAND Corporation January 2007 29
Great Lakes-St. Lawrence SeawayNew Cargoes/New Vessels - Market AssessmentTo meet the needs of the Midwe<strong>st</strong> and Central Canada, speciali<strong>st</strong> transportation sy<strong>st</strong>ems weredeveloped to support the region’s role as a transportation nexus and manufacturing center.Some of the key developments include –• The early development of water, canal, and port sy<strong>st</strong>ems for the movement of bulkcommodities that in particular provided support for the basic indu<strong>st</strong>ries of iron, <strong>st</strong>eeland metal manufacturing, and agricultural processing across the Midwe<strong>st</strong> and CentralCanada.• The development of railroads from the Atlantic Seaboard as well as the Prairies andGreat Plains created critical hubs and yards in Chicago, St. Louis, Cleveland, Detroit,Toronto, and Montreal to interchange products. These transport hubs provided thefocal point at which the needs of the region’s manufacturing indu<strong>st</strong>ry could be metand a location for manufacturing to grow and prosper particularly in the late 19thCentury and early 20th Century.• The development of the Inter<strong>st</strong>ate/expressway highway sy<strong>st</strong>em and in particular thedevelopment of the New York, Pennsylvania, Ohio and Illinois toll roads and Canada’s401 provided the accessibility and co<strong>st</strong> efficiencies that were critical to thedevelopment of the light manufacturing facilities that grew so rapidly with increasingconsumer needs in the second half of the 20th Century.With this support the Midwe<strong>st</strong> and Central Canada grew into one of the mo<strong>st</strong> diverse andcomprehensive manufacturing regions in the world –• The region had a powerful resource base in terms of primary products (agricultural,fore<strong>st</strong>ry and mining) to supply its factories.• It had <strong>st</strong>rong <strong>market</strong> in both the ea<strong>st</strong>ern seaboard communities but also in its owngrowing population.• It had a productive labor force that was not only able to develop products but toreengineer them time and time again to make them even more attractive, efficientlow co<strong>st</strong>, and diverse products.• As a result, by the mid 20th Century the Midwe<strong>st</strong> and Central Canada region came tobe the leading manufacturing area in North America and across the world. Its keyproducts include everything from basic iron, <strong>st</strong>eel, and chemicals, to automobiles andwashing machines, to pharmaceuticals and paints and consumer products of everykind.3.3 THE REGION’S ECONOMY TODAYToday the Great Lakes and St. Lawrence Seaway region has one of the mo<strong>st</strong> diverse and vibranteconomies of the world. It produces nearly 50% of North American Gross Dome<strong>st</strong>ic Product (seeExhibit 3-4). It not only dominates manufacturing and service indu<strong>st</strong>ries of North America, butalso reaches out across the world to the other major economies of the world in Europe and Asia.The economy’s activities are globalized with trade flows ea<strong>st</strong> through the Atlantic ports and we<strong>st</strong>across the continent to we<strong>st</strong> coa<strong>st</strong> Pacific ports.TEMS, Inc. / RAND Corporation January 2007 30
Great Lakes-St. Lawrence SeawayNew Cargoes/New Vessels - Market AssessmentExhibit 3-4: Gross Dome<strong>st</strong>ic Product (GDP) in GLSLS Study Area, 2004. 2GDP of GLSLS Study Area versusRe<strong>st</strong> of North AmericaRe<strong>st</strong> ofNorthAmerica49.7%GDP of GLSLS Study AreaGreatPlains9.9%GLSLSStudyArea50.3%Atlantic54.2%Midwe<strong>st</strong> &CentralCanada35.9%The Region has a highly significant share of international trade. Both imports and exports of theregion account for more than 50% of the corresponding total North American imports andexports, see Exhibit 3-5 3 .Exhibit 3-5: International Trade in GLSLS Study Area vs. Re<strong>st</strong> of North American, 2002 4 .ImportsExportsGLSLSStudyArea49.8%Re<strong>st</strong> ofNorthAmerica50.2%GLSLSStudyArea49.9%Re<strong>st</strong> ofNorthAmerica50.1%The large<strong>st</strong> share (almo<strong>st</strong> 56%) of GLSLS exports is from the Midwe<strong>st</strong> of the U.S. and Ontario inCanada. Atlantic seaboard is the leader in import performance of the region. The major role herebelongs to New York port. It accounts for more than 40% of Atlantic seaboard imports or 20% ofoverall GLSLS imports. Among other ports that play an especially significant role in the importactivity of GLSLS region are the Canadian ports of Ontario and Quebec provinces (having 21%and 5% of the overall regional imports respectively) and the American ports of Detroit, Mi(14%), Chicago, Il (8%), Buffalo, NY and Cleveland, OH (5% each).2 U.S. GDP is 92 percent; Canadian GDP is 8 percent of the US$ 6,294 billion GLSLS region’s GDP.3 These figures include U.S.- Canadian Trade.4 U.S. imports are 74 percent of US$ 688 billion GLSLS region’s imports; U.S. exports are 61 percent of the US$ 471 billion GLSLSregion’s exports.TEMS, Inc. / RAND Corporation January 2007 31
Great Lakes-St. Lawrence SeawayNew Cargoes/New Vessels - Market AssessmentExhibit 3-6: International Trade in GLSLS Study Area, 2002 5ImportsExportsGreatPlains3.9%GreatPlains5.6%Atlantic49.2%Midwe<strong>st</strong>& CentralCanada46.9%Atlantic38.5%Midwe<strong>st</strong>& CentralCanada55.9%As a result of its economic <strong>st</strong>rength, the region is the headquarters of more than half of the topin 2006 Fortune 500 companies in 2006. It has 30 firms in the top fifty Fortune 500 companiesby revenue with combined revenues of more than 2 trillion dollars or 53 percent of the totalrevenue generated by these top firms. The large<strong>st</strong> of the region’s firms are General Motors andFord (ranked 3rd and 5th respectively) which are supported by a ho<strong>st</strong> of competitors andsuppliers. The automotive assembly indu<strong>st</strong>ry is di<strong>st</strong>ributed across the Midwe<strong>st</strong> and CentralCanada spreading out from Detroit and Windsor we<strong>st</strong> to Chicago and Rockford, ea<strong>st</strong> toToronto/Montreal and upper New York State. The region contains about 55 percent of NorthAmerica’s manufacturing and service indu<strong>st</strong>ry.The diversity of the region’s service economy is phenomenal. It encompasses financial servicesand banking in the older Atlantic coa<strong>st</strong> cities (e.g., Citigroup ranked 8th, J.P. Morgan Chase andMorgan Stanley ranked 17th and 30th respectively) to computer equipment, software andinformation services (IBM ranked 10th and AOL Time Warner ranked 40th), and Telecoms(Verizon ranked 18th and Sprint ranked 59th) through Consumer Products (Target and Searsranked 29th and 33rd) to agricultural and resource companies (e.g. Archer Daniel Midland andDuPont ranked 56th and 73rd).The area not only contains the large<strong>st</strong> assembly of manufacturing and service indu<strong>st</strong>ries but alsohas sub<strong>st</strong>antial <strong>market</strong>s. The region is home to seven of the top twelve <strong>market</strong>s in NorthAmerica and the region at a figure of over 1.7 trillion, has about 50 percent of total NorthAmerican retail sales. These <strong>market</strong>s include New York, Philadelphia, Chicago, Detroit, andToronto. Across the region, the urbanized population supports an ever expanding and growing<strong>market</strong> for retail goods and services.In terms of the breakdown of the indu<strong>st</strong>rial <strong>st</strong>ructure, Exhibit 3-6 shows the composition of theregion’s indu<strong>st</strong>ry. Finance, professional, and information services con<strong>st</strong>itute 37% of the region’seconomy, with manufacturing and wholesale trades con<strong>st</strong>ituting another 18 percent of theregion’s activity. Primary indu<strong>st</strong>ry (Agriculture, Fore<strong>st</strong>ry, Fishing, Hunting, and Mining) onlyrepresents 1-5 percent of indu<strong>st</strong>rial activity while transportation and retail trade each representsabout 6%.5 Includes U.S. and Canadian trade.TEMS, Inc. / RAND Corporation January 2007 32
Great Lakes-St. Lawrence SeawayNew Cargoes/New Vessels - Market AssessmentThe indu<strong>st</strong>rial composition of the GLSLS <strong>st</strong>udy area compared to the re<strong>st</strong> of North America show<strong>st</strong>hat it is very much a reflection of the whole North American economy (see Exhibit 3-7).However, it does exhibit lower primary indu<strong>st</strong>ry and more manufacturing, finance andinformation indu<strong>st</strong>ry. It has slightly higher education, health and social services, but slightlylower retail trade and public admini<strong>st</strong>ration services as a percentage of the total. Within thisframework, the Atlantic seaboard is higher in financial, professional and information serviceindu<strong>st</strong>ry with slightly weaker manufacturing and wholesale trades and much weaker primaryindu<strong>st</strong>ry activities (see Exhibit 3-8). The Midwe<strong>st</strong> and Central Canada are much <strong>st</strong>ronger inmanufacturing; slightly <strong>st</strong>ronger in transportation and slightly lower in financial services (seeExhibit 3-9). As might be expected the Great Plains and Prairies are <strong>st</strong>ronger in primary indu<strong>st</strong>ry,con<strong>st</strong>ruction, manufacturing and transportation indu<strong>st</strong>ry, but slightly weaker in all forms ofservices, (see Exhibit 3-10).Exhibit 3-7: Indu<strong>st</strong>rial Composition by 2004 GDP - GLSLS Study AreaIndu<strong>st</strong>rial Composition by 2004 GDP.GLSLS Study Area.Other services(including publicadmini<strong>st</strong>ration)12.5%Agriculture, fore<strong>st</strong>ry,fishing & hunting, andmining1.5%Con<strong>st</strong>ruction6.7%Arts, entertainment,recreation,accommodation andfood services3.6%Manufacturing12.6%Wholesale trade6.1%Educational, health andsocial services8.8%Retail trade5.5%Professional, scientific,management,admini<strong>st</strong>rative, andwa<strong>st</strong>e managementservices10.2%Finance & insurance,real e<strong>st</strong>ate & rental &leasing21.5%Information5.5%Transportation &warehousing, andutilities5.6%TEMS, Inc. / RAND Corporation January 2007 33
Great Lakes-St. Lawrence SeawayNew Cargoes/New Vessels - Market AssessmentExhibit 3-8: Indu<strong>st</strong>rial Composition by 2004 GDP -North America excluding GLSLS Study AreaIndu<strong>st</strong>rial Composition by 2004 GDP.North America excluding GLSLS Study Area.Other services(including publicadmini<strong>st</strong>ration)14.5%Agriculture, fore<strong>st</strong>ry,fishing & hunting, andmining4.1%Con<strong>st</strong>ruction5.0%Arts, entertainment,recreation,accommodation andfood services3.9%Manufacturing11.9%Wholesale trade5.9%Educational, health andsocial services7.2%Retail trade7.1%Professional, scientific,management,admini<strong>st</strong>rative, andwa<strong>st</strong>e managementservices10.6%Finance & insurance,real e<strong>st</strong>ate & rental &leasing19.5%Information4.9%Transportation &warehousing, andutilities5.3%Exhibit 3-9: Indu<strong>st</strong>rial Composition by 2004 GDP - AtlanticIndu<strong>st</strong>rial Composition by 2004 GDP.Atlantic.Other services(including publicadmini<strong>st</strong>ration)13.9%Arts, entertainment,recreation,accommodation andfood services3.2%Agriculture, fore<strong>st</strong>ry,fishing & hunting, andmining0.7%Con<strong>st</strong>ruction4.2%Manufacturing10.7%Wholesale trade5.6%Retail trade6.1%Educational, health andsocial services9.0%Professional, scientific,management,admini<strong>st</strong>rative, andwa<strong>st</strong>e managementservices12.8%Finance & insurance,real e<strong>st</strong>ate & rental &leasing24.2%Information5.0%Transportation &warehousing, andutilities4.5%TEMS, Inc. / RAND Corporation January 2007 34
Great Lakes-St. Lawrence SeawayNew Cargoes/New Vessels - Market AssessmentExhibit 3-10: Indu<strong>st</strong>rial Composition by 2004 GDP - Midwe<strong>st</strong> & Central CanadaIndu<strong>st</strong>rial Composition by 2004 GDP.Midwe<strong>st</strong> & Central Canada.Other services(including publicadmini<strong>st</strong>ration)11.4%Agriculture, fore<strong>st</strong>ry,fishing & hunting, andmining1.3%Con<strong>st</strong>ruction5.5%Arts, entertainment,recreation,accommodation andfood services3.3%Manufacturing18.8%Educational, health andsocial services8.4%Professional, scientific,management,admini<strong>st</strong>rative, andwa<strong>st</strong>e managementservices10.4%Finance & insurance,real e<strong>st</strong>ate & rental &leasing18.8%Information3.8%Retail trade6.3%Transportation &warehousing, andutilities5.9%Wholesale trade6.3%Exhibit 3-11 Indu<strong>st</strong>rial Composition by 2004 GDP - Great PlainsIndu<strong>st</strong>rial Composition by 2004 GDP.Great Plains.Other services(including publicadmini<strong>st</strong>ration)13.8%Agriculture, fore<strong>st</strong>ry,fishing & hunting andmining2.6%Con<strong>st</strong>ruction4.7%Arts, entertainment,recreation,accommodation andfood services3.3%Manufacturing15.4%Wholesale trade6.5%Educational, health andsocial services8.3%Retail trade6.9%Professional, scientific,management,admini<strong>st</strong>rative andwa<strong>st</strong>e managementservices9.9%Finance & insurance,real e<strong>st</strong>ate & rental &leasing18.8%Information4.2%Transportation &warehousing andutilities5.6%TEMS, Inc. / RAND Corporation January 2007 35
Great Lakes-St. Lawrence SeawayNew Cargoes/New Vessels - Market Assessment3.4 THE REGION’S HUMAN RESOURCESA key factor in the success of the <strong>st</strong>udy region is the character of its 156 million population. Aswith the re<strong>st</strong> of North America 60 percent of the GLSLS population or 93 million people are ofworking age, see Exhibit 3-12.Exhibit 3-12: Age Di<strong>st</strong>ribution - GLSLS Study Area vs. Re<strong>st</strong> of North America (2000)Age Di<strong>st</strong>ribution. GLSLS Study Area versusRe<strong>st</strong> of North America (2000)Re<strong>st</strong> of North AmericaGLSLS Study Area65+45-64Age Group20-4415-190-140.0% 5.0% 10.0% 15.0% 20.0% 25.0% 30.0% 35.0% 40.0%Percentage of Total PopulationExhibit 3-13: Age Di<strong>st</strong>ribution in GLSLS Study Area (2000)Age Di<strong>st</strong>ribution in GLSLS Study Area (2000)Great Plains Midwe<strong>st</strong> & Central Canada Atlantic65+45-64Age Group20-4415-190-140.0% 5.0% 10.0% 15.0% 20.0% 25.0% 30.0% 35.0% 40.0%Percentage of Total PopulationTEMS, Inc. / RAND Corporation January 2007 36
Great Lakes-St. Lawrence SeawayNew Cargoes/New Vessels - Market AssessmentThis characteri<strong>st</strong>ic applies across the whole region, although the Atlantic region has slightly olderpopulation than the Midwe<strong>st</strong> & Central Canada, which has slightly older population than theGreat Plains and Prairies (see Exhibit 3-13).In terms of education, more than 50 percent of the population has some form of highereducation (see Exhibit 3-14). The percentage with Bachelors and higher degrees is <<strong>st</strong>rong>great</<strong>st</strong>rong>e<strong>st</strong> onthe Atlantic seaboard, over 25 percent. However, the Midwe<strong>st</strong>, Central Canada and the GreatPlains and Prairies are not far behind at over 20 percent, particularly in Bachelor degrees (seeExhibit 3-15). The region therefore has a work force that is both able and educated.Exhibit 3-14: Educational Attainment - GLSLS Study Area vs. Re<strong>st</strong> of North America (2000)Educational Attainment. GLSLS Study Area versus Re<strong>st</strong> of North America (2000)Re<strong>st</strong> of North AmericaGLSLS Study AreaGraduate or Professional DegreeEducational AttainmentBachelor's DegreePo<strong>st</strong>secondary education, no degree ordegree above Bachelor’sHigh School Graduate9th to 12th grade, no diplomaLess than 9th Grade0.0% 5.0% 10.0% 15.0% 20.0% 25.0% 30.0% 35.0%Percentage of Population 25 years and olderExhibit 3-15: Education Attainment in GLSLS Study Area (2000)Education Attainment in GLSLS Study Area (2000)Great Plains Midwe<strong>st</strong> & Central Canada AtlanticGraduate or Professional DegreeBachelor's DegreeEducational AttainmentPo<strong>st</strong>secondary education, nodegree or degree above Bachelor’sHigh School Graduate9th to 12th grade, no diplomaLess than 9th grade0.0% 5.0% 10.0% 15.0% 20.0% 25.0% 30.0% 35.0%Percentage of Population 25 years and olderTEMS, Inc. / RAND Corporation January 2007 37
Great Lakes-St. Lawrence SeawayNew Cargoes/New Vessels - Market AssessmentWithin the GLSLS region, more than 74 million people (or 80% of the region’s population ofworking age) are employed. 64.4 million are in the U.S. and 9.6 million are in Canada. As canbe seen from Exhibit 3-16, in terms of employment the GLSLS region plays the dominating rolein North American manufacturing (57%), also in finance, insurance, real e<strong>st</strong>ate rental andleasing (55%) and public services such as education, health, social services and publicadmini<strong>st</strong>ration services (54-55%). In comparison with the re<strong>st</strong> of North America, the GLSLS<strong>st</strong>udy area also has a slightly higher share of employment in trade (51%) and transportation &warehousing and utilities (50.2%). Exhibit 3-17 shows that Midwe<strong>st</strong> & Central Canada is aworking place for those occupied in manufacturing its share is more than 27% of thecorresponding number in North America. We can see from the same Exhibit that AtlanticSeaboard has a high share of employed in service indu<strong>st</strong>ries (22%-28% of North Americanemployment in these finance) and in insurance & rental & leasing (almo<strong>st</strong> 30% of thecorresponding North American employment).Exhibit 3-16: Indu<strong>st</strong>rial Employment in GLSLS Study Area (as a % of North America), 2002Indu<strong>st</strong>rial Employment in GLSLS Study Area (as a % of North America), 2002ManufacturingEducational, health and social servicesFinance & insurance, real e<strong>st</strong>ate & rental & leasingPublic Admini<strong>st</strong>rationTradeTransportation & warehousing, and utilitiesInform ationCon<strong>st</strong>ructionAgriculture, fore<strong>st</strong>ry, fishing & hunting, and mining34.1%55.6%54.7%54.7%54.3%51.4%50.2%49.0%46.9%0% 10% 20% 30% 40% 50% 60%If we look at the employment in the specific sub-indu<strong>st</strong>ries of manufacturing, we can examinethe special role of certain types of production in the region. From Exhibit 3-18 we can see thatthe region plays extremely significant role in motor vehicle manufacturing and primary metalmanufacturing. The share of the regional employment in the overall employment in theseindu<strong>st</strong>ries in North America accounts for 74% and 70% correspondently. The highe<strong>st</strong> share herebelongs to iron & <strong>st</strong>eel mills & ferroalloy manufacturing (79%). All these indu<strong>st</strong>ries are locatedmainly in Midwe<strong>st</strong> and Central Canada (see Exhibit 3-19).TEMS, Inc. / RAND Corporation January 2007 38
Great Lakes-St. Lawrence SeawayNew Cargoes/New Vessels - Market AssessmentExhibit 3-17: Indu<strong>st</strong>rial Employment, 2002 - Parts of GLSLS Study Area as a % of North AmericaIndu<strong>st</strong>rial Employment, 2002. Parts of GLSLS Study Area as a % of North AmericaGreat Plains Midwe<strong>st</strong> & Central Canada AtlanticAgriculture, Fore<strong>st</strong>ry, Fishing & Hunting and miningCon<strong>st</strong>ructionManufacturingWholesale tradeRetail tradeTransportation & warehousing and utilitiesInformationFinance & insurance, real e<strong>st</strong>ate & rental & leasingProfessional, scientific, management, admini<strong>st</strong>rative and wa<strong>st</strong>e management servicesEducational, health and social servicesArts, entertainment, recreation, accommodation and food servicesOther services (including public admini<strong>st</strong>ration)0.0% 5.0% 10.0% 15.0% 20.0% 25.0% 30.0%TEMS, Inc. / RAND Corporation January 2007 39
Great Lakes-St. Lawrence SeawayNew Cargoes/New Vessels - Market AssessmentExhibit 3-18: Employment in Manufacturing - GLSLS Study Area vs. North America (2002)Employment in Manufacturing.GLSLS Study Area versus North America (2002)Iron & <strong>st</strong>eel mills & ferroalloy manufacturingMotor vehicle manufacturingPrimary metal manufacturingSteel product manufacturing from purchased <strong>st</strong>eel78.8%74.4%70.6%66.6%All Manufacturing55.6%0% 10% 20% 30% 40% 50% 60% 70% 80%Share (%) of Total North American employment in theindu<strong>st</strong>ryExhibit 3-19: Employment in Selected Manufacturing Indu<strong>st</strong>ries - GLSLS Study Area, 2002Motor Vehicle ManufacturingPrimary Metal ManufacturingAtlantic12%GreatPlains12%Atlantic32%GreatPlains7%Midwe<strong>st</strong>& CentralCanada76%Midwe<strong>st</strong>& CentralCanada61%Iron & Steel Mills & FerroalloyManufacturingAtlantic36%GreatPlains2%Midwe<strong>st</strong>& CentralCanada62%Steel Product Manufacturing fromPurchased SteelAtlantic33%GreatPlains7%Midwe<strong>st</strong>& CentralCanada60%In terms of income and the reward, the region gives its workforce, the region has 50 percent ofits adult population earning over $25,000 per year and 15-20 percent making over $50,000 peryear (see Exhibit 3-20). In Exhibit 3-21, it can be seen that the Atlantic region has a higherpercentage earning over $50,000, but that the Midwe<strong>st</strong> & Central Canada and Great Plains arenot far behind. This creates <strong>st</strong>rong purchasing power and makes this region the world’s <strong>st</strong>ronge<strong>st</strong><strong>market</strong> place.TEMS, Inc. / RAND Corporation January 2007 40
Great Lakes-St. Lawrence SeawayNew Cargoes/New Vessels - Market AssessmentExhibit 3-20: Income Stratification - GLSLS Study Area vs. Re<strong>st</strong> of North America (2000) 6Income Stratification. (US$) GLSLS Study Area versusRe<strong>st</strong> of North America (2000)Re<strong>st</strong> of North AmericaGLSLS Study Area$65,000 or more$50,000-$64,999Income Stratum (US $)$35,000-$49,999$25,000-$34,999$20,000-$24,999$15,000-$19,999$10,000-$14,999Less than $10,0000.0% 5.0% 10.0% 15.0% 20.0% 25.0%Percentage of Population 16 years and olderExhibit 3-21: Income Stratification in GLSLS Study Area (2000) 6Income Stratification in US$ for GLSLS Study Area (2000)Great Plains Midwe<strong>st</strong> & Central Canada Atlantic$65,000 or more$50,000-$64,999Income Stratum (US $)$35,000-$49,999$25,000-$34,999$20,000-$24,999$15,000-$19,999$10,000-$14,999Less than $10,0000.0% 5.0% 10.0% 15.0% 20.0% 25.0%Percentage of population 16 years and older6 US/Canada purchasing power was derived from OECD e<strong>st</strong>imates for year 2000.TEMS, Inc. / RAND Corporation January 2007 41
Great Lakes-St. Lawrence SeawayNew Cargoes/New Vessels - Market Assessment3.5 ECONOMIC FUTURE AND SCENARIOSThe development of long-term traffic foreca<strong>st</strong>s is dependent on the projection of long-termsocioeconomic trends. The mo<strong>st</strong> important of these socioeconomic factors are population,employment, income, gross dome<strong>st</strong>ic product (GDP) and trade factors such as the growth ofimport and export traffic. In order to be able to compare the likely impact of growth in thefuture not only was a central case developed for each of these factors but a high(aggressive) and low (conservative) e<strong>st</strong>imate was also developed. This provides anenvelope of the full range of potential economic change that might occur in the GLSLS <strong>st</strong>udyarea.The high growth case assumes higher than average hi<strong>st</strong>orical growth rates for population,non-farm employment, and productivity and would be accompanied by comparatively lowintere<strong>st</strong> rates and inflation. On the other hand, low growth cases assumed lower growthrates for population, non-farm employment, and productivity, resulting in higher prices andintere<strong>st</strong> rates as well as lower indu<strong>st</strong>rial output growth 7 .In developing the socioeconomic scenarios, a wide range of data was collected andassembled from a variety of sources. A <strong>st</strong>ati<strong>st</strong>ical database on population and employmentwas assembled from U.S. Census 2000 (U.S. Census Bureau) 8 and 2001 Census of Canada(Stati<strong>st</strong>ics Canada) 9 . Data on employment in the selected types of indu<strong>st</strong>ry 10 (such asAgricultural, Fore<strong>st</strong>ry, Fishing and Hunting (NAICS – 11), Con<strong>st</strong>ruction (NAICS – 23) andManufacturing (NAICS – 33)) was obtained by using data from additional sources: CenStatsdatabases for the United States 11 and Canadian Business Patterns (for Canada) 12 . Data forthe base-year 2005 was obtained using <strong>st</strong>ati<strong>st</strong>ical data where available along with e<strong>st</strong>imatesand short-term projections on population and employment for this year.The data was disaggregated to the 200 GLSLS <strong>st</strong>udy zonal sy<strong>st</strong>em (including 12 port zones)as shown in Exhibit 3-22. The data for each zone was derived from country data in the U.S.and census division data in Canada. Projections on population and employment were madefor each of 150 U.S. zones and 38 Canadian zones of the GLSLS region. Socioeconomicprojections were derived by governmental or authoritative research organizationsprojections. For the U.S., Woods & Poole, Inc. 13 and U.S. Census Bureau 14 projections wereused. For each Canadian province in the GLSLS region, population and employmentforeca<strong>st</strong>s were obtained from government and research organizations 15 and adju<strong>st</strong>ed to thezone level of the <strong>st</strong>udy area.7 About three long-term growth scenarios in the U.S. see in more details; Energy Information Admini<strong>st</strong>ration/Annual EnergyOutlook 2006. Trends in Economic Activity. http://www.eia.doe.gov/oiaf/aeo/pdf/0383(2006).pdf8 Census 2000 Summary File 3. http://factfinder.census.gov/9 2001 Census of Canada, Stati<strong>st</strong>ics Canada. http://www.12.<strong>st</strong>atcan.ca/english/census01/home/index.cfm10 Here we selected indu<strong>st</strong>ries producing products that are usually shipped in containers.11 County Business Patterns Data (2000-2004), USA Counties. http://cen<strong>st</strong>ats.census.gov/12 Canadian Indu<strong>st</strong>ry Stati<strong>st</strong>ics. Indu<strong>st</strong>ry Canada. http://<strong>st</strong>rategis.ic.gc.ca/sc_ecnmy/sio/cise<strong>st</strong>e.html13 Woods & Poole Economics, Inc is an independent firm that has been making long-term county economic and demographicprojections since 1983.14 U.S. Census Bureau. State Interim Population Projections by Age and Sex; 2004-2030. Table 6. Total population for region’s,divisions and <strong>st</strong>ates: 2000 to 2030. http://www.census.gov/population/www/projections/projectionsagesex.html15 Long-term foreca<strong>st</strong>s on population for Quebec province, for example were prepared by Quebec In<strong>st</strong>itute de la Stati<strong>st</strong>ique, see:http://www.<strong>st</strong>at.gouv.qc.ca/ . The foreca<strong>st</strong>s on population for Ontario province were obtained from Ontario Mini<strong>st</strong>ry of Financewebsite http://www.fin.gov.on.ca/english/index.html and then adju<strong>st</strong>ed for <strong>st</strong>udy purposes.TEMS, Inc / RAND Corporation January 2007 42
Great Lakes-St. Lawrence SeawayNew Cargoes/New Vessels - Market AssessmentExhibit 3-22: GLSLS Zone Sy<strong>st</strong>emFor developing trade foreca<strong>st</strong>s, projections on Gross Dome<strong>st</strong>ic Product (GDP) play anespecially significant role. According to the recent research on container trade growth madeby UNESCAP 16 there is a very close relationship between GDP growth and trade volumes(including container volumes) 17 . Hi<strong>st</strong>orical data on GDP (for both U.S. and Canada) for1980-2005 was obtained from International Energy Information Admini<strong>st</strong>ration database 18 .Hi<strong>st</strong>orical data on container traffic by each North American port for the same 25-year periodwas taken from American Association of Port Authorities (AAPA) database 19 .In order to e<strong>st</strong>ablish the relationship between GDP and container traffic (for the U.S. andCanada separately) the <strong>st</strong>udy team performed regression analysis using hi<strong>st</strong>oric data for thela<strong>st</strong> 25 years. The results of regression analysis and T-te<strong>st</strong>s, presented in Exhibits 3-23 and3-24 show a very high correlation coefficient (R2) and highly significant ‘t’ values.Application of regression model identified very <strong>st</strong>rong relationship between container trafficand GDP both in the U.S. and Canada. Following UNESCAP methodology and using thederived regression equations, TEMS developed foreca<strong>st</strong>s of trade and container traffic basedon projected data on GDP in accordance with three economic scenarios 20 (upper, central andlower).16 UNRSCAP – United Nations Economic and Social Commission for Asia and the Pacific.17 Regional Shipping and Port Development Strategies (Container Traffic Foreca<strong>st</strong>). United Nations Economic and SocialCommission for Asia and the Pacific. United Nations, New York, 2005, Chapter 3. http://www.unescap.org/18 World Gross Dome<strong>st</strong>ic Product Using Market Exchange Rates (Billions of 2000 U.S. Dollars), 1980-2003. International EnergyAnnual 2003. Energy Information Admini<strong>st</strong>ration. http://www.eia.doe.gov/iea/popgdp.html19 AAPA online Port Indu<strong>st</strong>ry Stati<strong>st</strong>ics.http://www.aapa-ports.org/pdf/CONTAINER_TRAFFIC_CANADA_US.xls20 Projections made by Global Insight, Inc are available in: International Energy Outlook 2006. Energy Information Admini<strong>st</strong>ration.http://www.eia.doe.gov/oiaf/ieo/index.htmlTEMS, Inc / RAND Corporation January 2007 43
Great Lakes-St. Lawrence SeawayNew Cargoes/New Vessels - Market AssessmentExhibit 3-23: Container Traffic as a function of GDP45United States (1980-2005)4Canada (1980-2003)Container Traffic (Million TEUs)4035302520151050y = 5.3316x - 20.896R 2 = 0.98370 2 4 6 8 10 12GDP (Trillion of 2000 USD)Container Traffic (M illion TEUs)3.5 y = 7.6642x - 2.559R 2 = 0.977832.521.510.500 0.2 0.4 0.6 0.8GDP (Trillion of 2000 USD)Exhibit 3-24: Regression Coefficients and Stati<strong>st</strong>icsΒ 0 Β 1 T-value for β 1 T-value for β 0 R 2United States 5.3316 -20.896 -18.7075 38.1121 0.9837Canada 7.6642 -2.559 -18.2857 31.1220 0.9778Foreca<strong>st</strong>s of the port container traffic for the U.S. and Canada were adju<strong>st</strong>ed for the level ofNorth American ports included in the Demand Foreca<strong>st</strong>ing model 21 . Containerized cargohandled in each selected North American port was divided into three groups in accordancewith the region of de<strong>st</strong>ination/origin of this cargo 22 - Asian, European, and other traffic.Different annual growth rates projected in the UNESCAP <strong>st</strong>udy 23 were applied to each part ofcontainer traffic for each port (central scenario). In accordance with UNESCAP, containertraffic foreca<strong>st</strong> annual growth rate for Trans-Atlantic container traffic (i.e., Europe- andAsia-North America) share will be 6.5%. Average annual growth rate of container trafficbetween North America and other regions was assumed at the conservative level of 2%.The results of the TEMS analysis were found to be consi<strong>st</strong>ent with other long-term foreca<strong>st</strong>sof North American containerized trade such as those made by NJTPA 24 . The projectedsocioeconomic factors are shown as Exhibit 3-25 - 3-29.21 We made the selection of North American ports by making use of overall data on container traffic volumes for each port andinformation on origin/de<strong>st</strong>ination of the traffic as well.22 Data used in the calculations were obtained from multiple sources such as: U.S. Waterborne Container Trade by U.S. Cu<strong>st</strong>om Ports,1997-2005 MARAD database, http://www.marad.dot.gov/; Doug O’Keefe The Future for Canada-U.S. Container Port Rivalries.June 2003. Stati<strong>st</strong>ics Canada.http://dsp-psd.pwgsc.gc.ca/Collection.Statcan/54F0001X/54F0001XIE2003.pdf; the Port of Halifax website:http://www.portofhalifax.ca. etc.23 Regional Shipping and Port Development Strategies (Container Traffic Foreca<strong>st</strong>). United Nations Economic and SocialCommission for Asia and the Pacific. United Nations, New York, 2005, Chapter 4. http://www.unescap.org/24 NJTPA – New Jersey Transportation Planning Authorities, Inc. Foreca<strong>st</strong>s of Containerized Trade (1999-up to 2040 was preparedby Moffat & Nichol Engineers bases on adju<strong>st</strong>ed PIERS and other data and presented in: BER-1 Market Analysis Final Report.Chapter 6. Shift Dynamics and Cargo Foreca<strong>st</strong>, 2000-2040. Table 6.1http://njtpa.org/planning/brownfields/documents_brownfields/6-Shift_Dynamics.pdfTEMS, Inc / RAND Corporation January 2007 44
Great Lakes-St. Lawrence SeawayNew Cargoes/New Vessels - Market AssessmentExhibit 3-25: GLSLS Area Employment Foreca<strong>st</strong>120High ScenarioEmployment (in millions)11010090Low ScenarioTems Scenario.80702000 2005 2010 2015 2020 2025 2030 2035 2040 2045 2050 2055Exhibit 3-26: GLSLS Area Gross Dome<strong>st</strong>ic Product Foreca<strong>st</strong>18GDP (in trillion 2000 USD)1614121086High ScenarioLow ScenarioTems Scenario4202000 2005 2010 2015 2020 2025 2030 2035 2040 2045 2050 2055TEMS, Inc / RAND Corporation January 2007 45
Great Lakes-St. Lawrence SeawayNew Cargoes/New Vessels - Market AssessmentExhibit 3-27: GLSLS Population210High Scenario200Low ScenarioTEMS ScenarioPopulation (in millions)1901801701601502000 2005 2010 2015 2020 2025 2030 2035 2040 2045 2050 2055180Exhibit 3-28: United States Container Traffic Foreca<strong>st</strong>Container Traffic (in million TEUs)160140120100806040High ScenarioLow ScenarioTems ScenarioExhibit 2-25: GLSLS Socioeconomic Factors (ctd.)2002000 2005 2010 2015 2020 2025 2030 2035 2040 2045 2050 2055TEMS, Inc / RAND Corporation January 2007 46
Great Lakes-St. Lawrence SeawayNew Cargoes/New Vessels - Market AssessmentExhibit 3-29: Canadian Container Traffic Foreca<strong>st</strong>14Container Traffic (in million TEUs)1210864High ScenarioLow ScenarioTems Scenario202000 2005 2010 2015 2020 2025 2030 2035 2040 2045 2050 2055TEMS, Inc / RAND Corporation January 2007 47
Great Lakes-St. Lawrence SeawayNew Cargoes/New Vessels - Market Assessment4 TECHNOLOGY ASSESSMENT4.1 INTRODUCTION AND METHODOLOGYIn this chapter the “<strong>new</strong> <strong>vessels</strong>” component of the New Cargoes/New Vessels <strong>st</strong>udy,characterizes four classes of generic <strong>vessels</strong> that could be used on the Great Lakes -St.Lawrence Seaway (GLSLS) to transport containerized cargo. These classes are Container onBarge (COB), a GLSLS containership, a roll-on/roll-off (Ro/Ro) fa<strong>st</strong> ferry and the partial aircushionsupport catamaran (PACSCAT). All of the <strong>vessels</strong> are based on exi<strong>st</strong>ing technology.Each technology has different speed, cargo, and operating characteri<strong>st</strong>ics. The performancecharacteri<strong>st</strong>ics of the <strong>vessels</strong> shall be an input to the economic analysis that determineswhich, if any, of the vessel technologies presents a viable economic case for use in theGLSLS.The fir<strong>st</strong> task is the characterization of the GLSLS itself. The St. Lawrence SeawayDevelopment and Management Corporation imposes speed re<strong>st</strong>rictions based on the widthand depth of the channels and the currents present in them. The locks that connect portionsof the GLSLS have size re<strong>st</strong>rictions that con<strong>st</strong>rain the maximum dimensions of each vesseltype. Finally, the <strong>vessels</strong> mu<strong>st</strong> call on the ports within the GLSLS, which impose their owncon<strong>st</strong>raints on the <strong>vessels</strong>. An analysis of port infra<strong>st</strong>ructure requirements and inve<strong>st</strong>mentsis beyond the scope of this analysis. 1The <strong>vessels</strong> are characterized in terms of their dimensions, cargo handling capabilities, andoperational performance. All prototype <strong>vessels</strong> are con<strong>st</strong>rained by the dimensions of thelocks that connect portions of the GLSLS. For the COB, fa<strong>st</strong> ferry and PACSCAT <strong>vessels</strong>, wepresume the use of currently available designs. For the GLSLS containership, we derive aprototype vessel based on currently operational bulk freighters and container “feeder”<strong>vessels</strong>. The capacity of a vessel in twenty-foot equivalent units (TEU) is a function of thecargo deadweight, which is the maximum load that the vessel can carry. The operationalperformance includes the fuel consumption and crew requirements of each vessel.4.2 GREAT LAKES-ST. LAWRENCE SEAWAY OPERATING CHARACTERISTICS4.2.1 OPERATING SPEEDS IN THE GREAT LAKES-ST. LAWRENCE SEAWAYSpeed limits exi<strong>st</strong> in the GLSLS to prevent erosion, protect riparian habitat and promotesafety 2 . Exhibit 4-1 li<strong>st</strong>s the maximum speeds allowed along the GLSLS. Speed limits areindicated for segments of the GLSLS between the major ports or waypoint locations. Thedi<strong>st</strong>ance and e<strong>st</strong>imated travel time of the segments at maximum speed are also li<strong>st</strong>ed 3 .There are several segments of the GLSLS sy<strong>st</strong>em that con<strong>st</strong>rain the flow of <strong>vessels</strong>. Thetable li<strong>st</strong>s the speed limits for <strong>vessels</strong> originating where the Atlantic Ocean meets the Gulf ofSt. Lawrence near Halifax, Nova Scotia and continues until the GLSLS terminus in Duluth,Minnesota. Along the over 4,000 km of the GLSLS, there are 6 short canals over a total ofless than 110 km. These canals account for approximately three percent of the length of theGLSLS but approximately 10 percent of the be<strong>st</strong> case travel time. The Detroit, St. Clair andSt Mary’s Rivers compose an additional 10 percent of the length of the GLSLS and an1 There are also environmental re<strong>st</strong>rictions for <strong>vessels</strong> operating within the GLSLS. These include requirements for balla<strong>st</strong> exchange,among others. We shall assume that all vessel types comply with these re<strong>st</strong>rictions.2 Burgess, Peter. Interview Regarding Speed Limits along the St. Lawrence Seaway. Arlington, Virginia, March 3, 2006.3 The Seaway Handbook. Cornwall, Ontario: The St. Lawrence Seaway Management Corporation, 2002TEMS, Inc. / RAND Corporation January 2007 48
Great Lakes-St. Lawrence SeawayNew Cargoes/New Vessels - Market Assessmentadditional 10 percent of be<strong>st</strong> case vessel travel time. 4 The remaining 2,895 km areclassified as open water including Lakes Ontario, Erie, Huron, and Superior. The open watersegments of the GLSLS compose 87 percent of the di<strong>st</strong>ance and typically, 80 percent of thebe<strong>st</strong> case travel time.In general, there are three types of waterways along the GLSLS: canals and locks, channelsand open water. In locks and canals, the speed limit is 11.1 km/h. In channels, the speedlimit varies from 14.8 km/h in the leg from Port Robinson to Buffalo, to 24.1 km/h in thechannel entering Lake Ontario. In less re<strong>st</strong>ricted, non-open water sections of the GLSLS,such as Lake St. Louis, the speed limit is 29.6 km/h. For the Detroit, St. Clair, and St.Mary’s Rivers, we assume a speed limit of 19.4 km/h, which is the same as in similarchannels elsewhere in the GLSLS. In the Detroit and St. Clair rivers, the maximum speed of<strong>vessels</strong> operating in non-displacement mode is 64.4 km/h; we will assume that nondisplacement<strong>vessels</strong> may operate at this speed in certain sections of the Canadianmanagedportion of the GLSLS. 5 In the open water of the Great Lakes, there is no regulatedspeed limit: as an example, the recently discontinued ferry service from Roche<strong>st</strong>er, NewYork, to Toronto, Ontario, cruised at over 74 km/h 6 . In addition, maximum speedsoccasionally vary depending on whether or not the GLSLS is in a high water or normal water<strong>st</strong>ate. 7The speed limits are motivated by several factors. Some factors are environmental: thespeed limits seek to minimize wake, preventing erosion and protecting habitat. The speedlimits also promote safe use of the sy<strong>st</strong>em. Large <strong>vessels</strong> share the GLSLS with commercialand private <strong>vessels</strong> of varying size and agility. Thirteen percent of the length of the GLSLSis composed of locks, canals, and rivers. These sections require more precise navigation by<strong>vessels</strong>, especially through canals and locks that are often only ju<strong>st</strong> wide enough toaccommodate the large<strong>st</strong> <strong>vessels</strong>. Furthermore, there are several sections of the GLSLS inwhich the navigable channel is only 300 feet wide, leaving little space to separate twopassing <strong>vessels</strong> of maximum size. The maximum navigable depth of the GLSLS is 8.23 m. 84 All traveling times are for ideal conditions absent delays including backups and technical problems at the locks.5 Vessels operating in non-displacement mode may operate at 64.4 km/h, “except when required for the safety of the vessel or anyother vessel. Vessels 20 meters or more in length but under 100 gross tons operating in the nondisplacement mode and meeting therequirements set out in paragraph (c) of this section, may operate at a speed not exceeding 40 miles per hour (34.8 knots)-- (i) Duringdaylight hours (sunrise to sunset); (ii) When conditions otherwise safely allow; and (iii) When approval has been granted by the Coa<strong>st</strong>Guard Captain of the Port…. In this section, ‘nondisplacement mode’ means a mode of operation in which the vessel is supportedby hydrodynamic forces, rather than displacement of its weight in the water, to an extent such that the wake which would otherwisebe generated by the vessel is significantly reduced” (33CFR162.138).6 New U.S.-Canada ferry link 2006. MarineLog 2002 [cited March 6 2006]. Available fromhttp://www.marinelog.com/DOCS/NEWSMMIIb/MMIISep06.html7 During high water conditions, waves and currents increase, which makes navigation more difficult.8 The Seaway Handbook. Cornwall, Ontario: The St. Lawrence Seaway Management Corporation, 2002TEMS, Inc. / RAND Corporation January 2007 49
Great Lakes-St. Lawrence SeawayNew Cargoes/New Vessels - Market AssessmentSegmentNumber Origin Origin Waypoint De<strong>st</strong>inationExhibit 4-1: Segments of the GLSLS and legal operating speeds.De<strong>st</strong>inationWaypointSpeedLimit inNormalWater(km/h)(dspl./non.displ.)SpeedLimit inHigh Water(km/h)(dspl./non.displ.)Di<strong>st</strong>ance(km)TimeTraveling atNormalSpeed Limit(h)(dspl./non.displ.)CumulativeDi<strong>st</strong>ance(Km)1 Halifax Quebec No limit No limit 1514.9 NA 1514.92 Quebec Montreal 29.6/64.4 29.6/64.4 2608.8/4.0 1774.9Upper Entrance3 Montreal South Shore Canal 19.4 19.4 0.9 0 1775.84Upper EntranceSouth Shore Canal Lake St. Louis 19.4 19.4 26.2 1.3 18025 Lake St. LouisLower EntranceBeauharnois Lock 29.6/64.4 29.6/64.4 19.6 0.7/0.3 1821.66Lower EntranceBeauharnois LockUpper EntranceBeauharnois Lock 11.111.1 1.7 0.2 1823.37Upper EntranceBeauharnois Lock Lake St. Francis 18.5 18.5 21.2 1.1 1844.58 Lake St. Francis Lake St. Francis 23.2/64.4 23.2/64.4 49 2.1/0.8 1893.59 Lake St. Francis ` 17.6 17.6 3.8 0.2 1897.310 Snell Lock Eisenhower Lock 11.1 11.1 6.6 0.6 1903.911 Eisenhower Lock Iroquois Lock 21.3 19.4 41.9 1.9 1945.812 Iroquois LockMcNair Island LightBuoy 24.1 19.4 44.91.8 1990.713McNair Island LightBuoy Deer Island 21.3 19.4 23.91.1 2014.614 Deer Island Bartlett Point 17.6 17.6 24.6 1.4 2039.215 Bartlett Point Tibetts Point 24.1 19.4 25.9 1.1 2065.116a King<strong>st</strong>on Welland Canal Entrance No limit No limit 244.4 NA 2309.516b King<strong>st</strong>on Toronto No limit No limit 297 NA 2362.116c King<strong>st</strong>on Hamilton No limit No limit 300.8 NA 2662.9TEMS, Inc. / RAND Corporation January 2007 50
Great Lakes-St. Lawrence SeawayNew Cargoes/New Vessels - Market Assessment17Welland CanalEntranceWelland Canal Exit11.1 11.1 43.43.2 2352.918 Port Robinson Buffalo 14.8 14.8 13.6 0.9 2366.519a Buffalo Toledo No limit No limit 412.5 NA 277919b Buffalo Erie No limit No limit 133.5 NA 250020 Erie Toledo No limit No limit 278.2 NA 2778.221 Toledo Start - Detroit River No limit No limit 66.1 NA 2844.322Start - Detroit River Detroit 16.7 16.7 34.6 2.123 Detroit Lake St Claire 16.7 16.7 10 0.6 2888.92878.924 Lake St. Claire Lake St. Claire No limit No limit 35.2 NA 2924.125 Lake St. Clair Port Huron 16.7 16.7 55.4 3.3 2979.526 Port HuronDe Tour Passage No limit No limit 368 NA 3347.527aDe Tour Passage Soo Locks Entry 16.7 16.7 73 4.4 3420.527bDe Tour Passage Chicago No limit No limit 592 NA 3939.528 Soo Locks Entry Soo Locks Exit 11.1 11.1 3.2 .3 3423.729 Soo Locks Exit Lake Superior 16.7 16.7 9.7 .6 3433.430a Lake Superior Thunder bay No limit No limit 364.3 NA 3797.730b Lake Superior Duluth No limit No limit 639.9 NA 4073.3TEMS, Inc. / RAND Corporation January 2007 51
Great Lakes-St. Lawrence SeawayNew Cargoes/New Vessels - Market Assessment4.2.2 CANALS AND LOCKS OF THE GREAT LAKES-ST. LAWRENCE SEAWAYThe GLSLS extends from the Gulf of St. Lawrence to Duluth, Minnesota. Six short canals and19 locks with a total length of less than 110 km connect major sections of the sy<strong>st</strong>em.Exhibit 4-2 li<strong>st</strong>s the locks and their dimensions, age, operator.The Montreal/Lake Ontario section of the GLSLS includes a series of seven locks over adi<strong>st</strong>ance of 300 km from Montreal, Quebec to Iroquois, Ontario enabling ships to navigatefrom the St. Lawrence River to Lake Ontario. The fir<strong>st</strong> canal is the South Shore Canal, whichincludes two locks, the St. Lambert and Côte Ste. Catherine; the South Shore Canal is 26km long and extends from the Port of Montreal to Lake St. Louis. Next, the BeauharnoisCanal is 21 km long and links Lake St. Louis to Lake St. Francis through two locks. TheWiley-Dondero Canal is 15 km long and provides access to Lake St. Lawrence via the Snelland Eisenhower Locks. The la<strong>st</strong> canal in the Montreal/Lake Ontario section of the GLSLS i<strong>st</strong>he Iroquois Canal, which is 600 m long and includes one lock. 9 All of the seven locks of theMontreal/Lake Ontario section of the GLSLS are 233.5 m long, 24.4 m wide and 9.1 m deep.The Welland Canal links Lake Ontario and Lake Erie with a series of eight locks, allCanadian-operated, over a di<strong>st</strong>ance of 43.4 km. The Welland Canal lifts <strong>vessels</strong> from aheight of 75 m above sea level to 99 m above sea level. Counting from the north, three ofthe fir<strong>st</strong> seven locks (locks 4, 5 and 6) are twinned and contiguous. 10 The eighth lock, atthe south end, is a guard lock. 11 All of the locks in the Welland Canal are the same size:233.5 m long, 24.3 m wide and 9.1 m deep.The final canal in the GLSLS, the St. Mary's Canal, links Lake Huron to Lake Superior andhas four twinned locks of various dimensions at Sault Ste. Marie. These are also known a<strong>st</strong>he Soo Locks. The locks on the St. Mary’s Canal are admini<strong>st</strong>ered by the U.S. Army Corpsof Engineers. The Poe lock is 366 m long, 33.5 m wide and 9.8 m deep. The MacArthur lockis 244 m long, 24.4 m wide and 9.4 m deep. The Canadian lock is 250.8 m long, 16.1 mwide and 9.9 m deep and the Sabin lock is 411.5 m long, 24.3 m wide and 7.0 m deep. 12The speeds and times li<strong>st</strong>ed in Exhibit 4-1 account for the time required to traverse locksand canals assuming no delay. Transit through locks includes a queuing time to enter thelock and the time to perform the locking procedure. Additional delays sometimes occur dueto mechanical causes related to lock operation and maintenance. 13 The St. LawrenceSeaway Management Corporation claims that the average transit time for the Welland Canal(eight locks) is 12 hours. 14 Rodrigue, Jean-Paul claims 15 that the average transit time for theWelland Canal is 11 hours. The lockage time for the seven locks from Montreal to LakeOntario is claimed to take five hours giving an overall transit time of 24 hours upbound and22 hours downbound, this difference being primarily due to river currents. 16 Queuing delaysin the South Shore, Beauharnois, Wiley Dondero, and Iroquois Canals average 0.35 hours.9 The Seaway Handbook. Cornwall, Ontario: The St. Lawrence Seaway Management Corporation, 200210 Twinned locks are arranged in pairs to allow simultaneous locking of ships in both directions.11 A guard lock or tide lock is a canal lock located between a canal and a body of water of varying depth such as a harbor or a river.When the canal is at a different level than the open body, such a lock allows ships and boats to pass into and out of the canalregardless of the water level or tide.12 The Seaway Handbook. Cornwall, Ontario: The St. Lawrence Seaway Management Corporation, 200213 We do not consider such delays in this analysis.14 Great Lakes St. Lawrence Seaway Sy<strong>st</strong>em: Seaway Facts 2006. St. Lawrence Seaway Management Corporation 2006 [cited May 30 2006].Available from http://www.reawt<<strong>st</strong>rong>lakes</<strong>st</strong>rong>-<strong>seaway</strong>.com/en/aboutus/<strong>seaway</strong>facts.html.15 Rodrigue, Jean-Paul. 2006. The St. Lawrence Seaway and Regional Development. Hof<strong>st</strong>ra University, May 27 2003 [cited April10 2006].Available from http://people.hof<strong>st</strong>ra.edu/geotrans/eng/ch7en/appl7en/ch7a2en.html.TEMS, Inc. / RAND Corporation January 2007 52
Great Lakes-St. Lawrence SeawayNew Cargoes/New Vessels - Market AssessmentIn the Soo Locks, vessel queuing delays of 0.25 hours and 0.56 hours per vessel per lock forthe MacArthur and Poe Locks respectively. 17Exhibit 4-2: Canals and locks of the GLSLS and their characteri<strong>st</strong>ics.Canal Lock NameLength Width Depth Year of(m) (m) (m) Con<strong>st</strong>ructionOperatorSt. Lambert 233.5 24.3 9.1South ShoreCanal Côte Ste.233.5 24.3 9.1Catherine1959 CanadaLowerBeauharnois Beauharnois233.5 24.3 9.1Canal UpperBeauharnois233.5 24.3 9.11959 CanadaWiley Snell 233.5 24.3 9.1Dondero1959 U.S.CanalEisenhower 233.5 24.3 9.1IroquoisCanalIroquois 233.5 24.3 9.1 1959 CanadaLock 1 233.5 24.3 9.1Lock 2 233.5 24.3 9.1Lock 3 233.5 24.3 9.1Lock 4 233.5 24.3 9.1Con<strong>st</strong>ructionWellandoccurred: 1913 toCanal Lock 5 233.5 24.3 9.1 1932Lock 6 233.5 24.3 9.1CanadaLock 7 233.5 24.3 9.1Lock 8 233.5 24.3 9.1St. Mary’s MacArthur Lock 243.8 24.3 9.3 1943Canal Poe Lock 365.8 33.5 9.8 1968U.S.4.2.3 PORTS IN THE GREAT LAKES-ST. LAWRENCE SEAWAYExhibit 4-3 li<strong>st</strong>s the 19 large<strong>st</strong> U.S. and Canadian ports along the GLSLS. The data in thetable were compiled from online sources presented by the St. Lawrence SeawayManagement Corporation (Canada), the St. Lawrence Seaway Development Corporation(United States) 18 and the U.S. Army Corps of Engineers. 19Predictably, the ports are built to accommodate <strong>vessels</strong> that can traverse the GLSLS. Thedata show that mo<strong>st</strong> of the ports along the Seaway can accommodate <strong>vessels</strong> with amaximum draft of 8.2 m, length of 233.5 m and beam of 24 m. The ports at Quebec,Windsor, Ontario, Monroe, Michigan and Milwaukee and Green Bay, Wisconsin would requiredredging to accommodate “Seaway-max” <strong>vessels</strong>.Currently, the ports along the GLSLS do not have the required infra<strong>st</strong>ructure to supportlarge-scale containerized operations. The ports do have rail connections that could facilitatethe development of intermodal trade. For the purpose of this analysis, we will assume thatall ports contain appropriate infra<strong>st</strong>ructure to handle containerized trade. A completeanalysis would require site-specific surveys of available infra<strong>st</strong>ructure, con<strong>st</strong>ructionrequirements, and financing.16 Great Lakes St. Lawrence Seaway Sy<strong>st</strong>em: Seaway Facts 2006. St. Lawrence Seaway Management Corporation 2006 [cited May 30 2006].Available from http://www.reawt<<strong>st</strong>rong>lakes</<strong>st</strong>rong>-<strong>seaway</strong>.com/en/aboutus/<strong>seaway</strong>facts.html.17 NDC Publications and U.S. Waterway Data CD, Volume 9. 2003. Alexandria, Virginia: U.S. Army Corps of Engineers.18 The Seaway Handbook. Cornwall, Ontario: The St. Lawrence Seaway Management Corporation, 200219 NDC Publications and U.S. Waterway Data CD, Volume 9. 2003. Alexandria, Virginia: U.S. Army Corps of Engineers.TEMS, Inc. / RAND Corporation January 2007 53
Great Lakes-St. Lawrence SeawayNew Cargoes/New Vessels - Market AssessmentExhibit 4-3: Characteri<strong>st</strong>ics of ports of the GLSLS.Port Name City State/ProvinceRailConnectionsDepth(m)BerthLength (m)EquipmentQuebec Port Authority Quebec Quebec Yes 11.3 341 – 1366 4 cranes, conveyor, ship loaderMontreal Port Authority Montreal Quebec Yes 8.2 144 – 1620Ogdensburg Bridge andPort Authority Ogdensburg New York Yes 8.2 381Port of OswegoAuthority Oswego New York Yes 8.2 229Toronto Port Authority Toronto Ontario Yes 8.2 1829 Ro/Ro berthHamilton PortAuthority Hamilton Ontario Yes 8.8 128 – 2300Port of Buffalo Buffalo New York Yes 8.8 2292 Crawler Cranes2 - 46 m ship loading conveyorsand related highliftsErie-We<strong>st</strong>ernPennsylvania PortAuthority Erie New York Yes 8.8 396 272 * 10 3 kg <strong>st</strong>iff-legged craneCleveland-CuyahogaCounty Port Cleveland Ohio Yes 8.2 191 – 1524Toledo-Lucas CountyPort Authority Toledo Ohio Yes 8.2 244 – 1250Windsor Port Authority Windsor Ontario Yes 8.0 96 – 732Port of Monroe Monroe Michigan Yes 6.4 457Detroit/Wayne CountyPort Authority Detroit Michigan Yes 8.5 274 – 1036Ports of IndianaBurnsHarbor Indiana Yes 8.2 1676Illinois InternationalPort Di<strong>st</strong>rict Chicago Illinois Yes 8.2 305Port of Milwaukee Milwaukee Wisconsin Yes 7.9 122 – 1067Brown County Port andSolid Wa<strong>st</strong>e DepartmentPort of Green Bay Green Bay Wisconsin Yes 7.9 213 – 457Thunder Bay Port ThunderAuthorityBay Ontario Yes 8.2 201Duluth Duluth Minnesota Yes 8.2 192 – 1524One 163 * 10 3 kg crawlingcrane, one 100 * 10 3 kg, one 66* 10 3 kg, three 32 * 10 3 kgcranes for break bulkAll general cargo, heavy lift andRo/RoCranes - one 318 * 10 3 kg, one272 * 10 3 kg, eight 209 * 10 3 kg,three 181 * 10 3 kg, one 159 *10 3 kg, four 91 * 10 3 kgTEMS, Inc. / RAND Corporation January 2007 54
Great Lakes-St. Lawrence SeawayNew Cargoes/New Vessels - Market Assessment4.3 CANDIDATE VESSEL TECHNOLOGIESA critical component of this Great Lakes and St. Lawrence Seaway Study is an assessmentof the different water transport technologies that can be used to move containers on theGLSLS sy<strong>st</strong>em. Two novel technologies, Fa<strong>st</strong> Freighter and PACSCAT (as described below)have also been included in this assessment. These vessel technologies span a full range ofco<strong>st</strong>/performance tradeoffs for the GLSLS. For conducting the assessment, specificrepresentative <strong>vessels</strong> of each type were selected by the RAND Corporation, as reportedhere, for quantification of performance factors. We provide performance data for four vesseltechnologies for use for containerized trade on the GLSLS. These candidates represent arange of speeds and cargo-handling capabilities. The dimensions of each vessel are suchthat it may traverse the complete GLSLS and call at all ports of the sy<strong>st</strong>em.A review of the full range of water technology options and an assessment of the potentialperformance of each option included the following vessel types as <strong>st</strong>udy options –• Container on Barge (COB): The simple<strong>st</strong> and slowe<strong>st</strong> technology is COB, whichconsi<strong>st</strong>s of several barges configured to handle containers towed by a towboat.• GLSLS Container Ship: The trend in the con<strong>st</strong>ruction of containerships has been tolarger and larger <strong>vessels</strong>; the containership we consider is a moderate-size butcomparatively fa<strong>st</strong> vessel built especially for use in the GLSLS.• Fa<strong>st</strong> Freighter: The so-called “fa<strong>st</strong> ferry” is a catamaran configured to handle “rollon roll off” (Ro/Ro) cargo; Ro/Ro <strong>vessels</strong> often have built-in ramps, or use landbasedramps, to load and unload the vessel by “rolling on” and “rolling off” thecargo. These <strong>vessels</strong> are capable of high-speeds at the expense of cargo deadweightand fuel economy.• Partial Air Cushion Support Catamaran (PACSCAT): The final technology is thepartial air-cushion support catamaran (PACSCAT). Vessels using aero<strong>st</strong>atic supportwith rigid hulls are not <strong>new</strong>: the U.S. Navy experimented with such <strong>vessels</strong> in the1980s. 20 In commercial operation, these <strong>vessels</strong> promise increase cargo-handlingcapability over <strong>st</strong>andard multihull <strong>vessels</strong> and improved fuel efficiency. 21For each of the candidate technologies, a vessel could be designed to optimize parameterssuch as displacement, deadweight, maximum speed, crew requirements and wake, amongothers. We have not attempted to perform this task, rather we report on the generalparameters that di<strong>st</strong>inguish the candidates, basing them on exi<strong>st</strong>ing <strong>vessels</strong>. However,there is actually some overlap in the performance ranges of different vessel types. Forexample, the performance of a large seagoing Container Barge is not too much differentthan a small container ship. Similarly, PACSCAT technology spans a range from that of asmall container ship up to the Fa<strong>st</strong> Freighter. In order to assess the performance capabilitiesof the vessel technologies, two variants of the GLSLS Container Ship and two variants ofPACSCAT have been evaluated. By varying the size, configuration, and propulsion power ofthe <strong>vessels</strong>, a full range of deployment options has been developed for each vessel type.The remainder of the section is organized as follows. Fir<strong>st</strong>, we discuss assumptions we makeregarding cargo, crew, and propulsion that we will apply to all <strong>vessels</strong>. Then we discusseach technology in turn, accounting for their technical and operational characteri<strong>st</strong>ics. Thefollowing sections will outline the basic performance parameters for each vessel type thathave been included in this <strong>st</strong>udy. An exhibit summarizing all <strong>vessels</strong> appears in the followingsection.20 Gillmer, Thomas C. and Bruce Johnson. 1982. Introduction to Naval Architecture. Annapolis, Maryland: Naval In<strong>st</strong>itute Press.21 Both the fa<strong>st</strong> ferry and the PACSCAT operate in non-displacement mode and are able to operate at higher speeds thandisplacement <strong>vessels</strong> when in the open water of the <<strong>st</strong>rong>lakes</<strong>st</strong>rong>. The speed limit for these <strong>vessels</strong> is 64.4 km/h whereas the speed limit fordisplacement <strong>vessels</strong> is 29.6 km/h.TEMS, Inc. / RAND Corporation January 2007 55
Great Lakes-St. Lawrence SeawayNew Cargoes/New Vessels - Market Assessment4.3.1 PARAMETERS USED FOR ESTIMATING VESSEL PERFORMANCE 22The choice of a propulsion method for <strong>vessels</strong> is particular to the application. A large cargovessel may have a directly coupled propeller turning at a relatively low rate. A light and fa<strong>st</strong>vessel may choose a water-jet propulsion sy<strong>st</strong>em and employ engines that operate atrelatively high revolutions per minute (RPM). One of our candidate technologies is a “fa<strong>st</strong>freighter” concept designed by the Au<strong>st</strong>ralian firm Au<strong>st</strong>al; it has four 9,000 kW engines. 23At 90 percent output, Au<strong>st</strong>al claims that the fuel consumption of the vessel is 6,500kg/hour, yielding a specific fuel consumption of 0.201 kg/kW-hr of marine diesel oil (MDO).Similar engines have a specific fuel consumption of 0.201 kg/kW-hr of MDO. 24 The enginesare optimized for peak power production, so the specific fuel consumption increases byapproximately 10 percent at lower power. We shall assume that the specific fuelconsumption of all <strong>vessels</strong> is con<strong>st</strong>ant at all power ratings and is 0.201 kg/kW-hr. Thedensity of MDO is 836 kg/m 3 . The assumed values of parameters appear in Exhibit 4-4.We make several additional assumptions regarding vessel and their operation –• Crew requirements. For <strong>vessels</strong> with a regi<strong>st</strong>ered displacement over 907 * 10 3 kg,the management of the GLSLS requires a minimum crew of three certified deckofficers and two engineers. 25 Additional crewmembers are required to man mooringlines and tend cargo. We will derive e<strong>st</strong>imates for crew based on this baseline and onthe amount of cargo the ship handles.• Starting and <strong>st</strong>opping. We assume that the time/di<strong>st</strong>ance to full speed/<strong>st</strong>op undernormal operating conditions to be 5 minutes and 2 km.26• Balla<strong>st</strong> exchange. We assume that all <strong>vessels</strong> are configured to comply with balla<strong>st</strong>exchange requirements of the GLSLS.• Port infra<strong>st</strong>ructure requirements. We assume that all ports have the appropriatefacilities and equipment to handle containerized cargo operations.• To compare vessel economics on a consi<strong>st</strong>ent basis, average line-haul unit co<strong>st</strong>shave been calculated per Forty-Foot Equivalent Unit (FEU) mile. The FEU rather thanTEU has been chosen as the basis for comparison, because it more closelycorresponds to one truckload and therefore supports a comparison to trucking andrail co<strong>st</strong>s as well as between vessel types.22 All unites are metric and all figures are reported to three significant digits.23 Fa<strong>st</strong> Freighter Outline Spec 1. 2004. Henderson, Au<strong>st</strong>ralia: Au<strong>st</strong>al.24 3618 Marine Propulsion Engine, LEHM1875-01. 2002. Peoria, Illinois: Caterpillar, Inc.25 The Seaway Handbook. Cornwall, Ontario: The St. Lawrence Seaway Management Corporation, 200226 This assumption <strong>st</strong>andardizes the operation of the <strong>vessels</strong> near ports. The assumption should not have an effect on the analysis ofthe four vessel technologies. The assumption does not hold in the case when a route requires frequent docking of the vessel and theamount of time the vessel spends <strong>st</strong>opping and <strong>st</strong>arting is a significant fraction of the overall transit time.TEMS, Inc. / RAND Corporation January 2007 56
Great Lakes-St. Lawrence SeawayNew Cargoes/New Vessels - Market AssessmentExhibit 4-4: Li<strong>st</strong> of assumed parameters for calculation ofvessel performance and operating characteri<strong>st</strong>icsParameterValueTEU empty mass1,810 kgTEU revenue tonnage 12,700 kgTEU loaded mass14,500 kgSpecific fuel consumption 0.201 kg/kW-hrDensity of MDO 836 kg/m 3Crew requirements5 for navigation; 4 to 9 additionalStart/<strong>st</strong>op time/di<strong>st</strong>ance 5 minutes over 2 km4.3.2 CONTAINER ON BARGEThe fir<strong>st</strong> technology considered is COB. A barge is a flat-bottomed boat built mainly for riverand canal transport of heavy goods. Mo<strong>st</strong> barges are not self-propelled and need to bemoved by tugboats or towboats. Each barge has a relatively small cargo capacity, but i<strong>st</strong>ypically towed as a member of a group. The drawback of COB is its relatively slow speed.Container on BargeWe base the prototype COB on <strong>vessels</strong> currently operating in the GLSLS. McKeil MarineLimited operates a fleet of more than 45 tugs and 60 barges 27 . As a model, we choose thetug Evans McKeil and barge Labrador Spirit, as a vessel to develop our prototype. Wemaximize the allotted lock and canal dimensions by linking the tug and two Labrador Spiritbarges together. We assume that the number of crewmembers is 9, which is the same as on(larger) Mississippi tow-barge combinations. 28 E<strong>st</strong>imating the fuel consumption of thetowboat-barge combination is particularly difficult. The hydrodynamics of the <strong>vessels</strong> isdifficult to analyze, because the frequent changes in configuration cause fuel consumptionto vary. Based on a ton-km e<strong>st</strong>imate of fuel consumption, we can e<strong>st</strong>imate the fuelconsumption of the loaded COB to be 560 kg/hr at cruise and 370 kg/hr at 11.1 km/h,27 McKeil Marine Limited is a Canadian company. McKeil Marine Limited is headquartered in Hamilton and has commercial officesand operational facilities in several cities including Toronto, Montreal and St. John's. McKeil Marine specializes in the transportationof dry and liquid bulk, oversized project <strong>cargoes</strong>, heavy equipment and general cargo on the Great Lakes, St. Lawrence River, theea<strong>st</strong>ern seaboard and in the Canadian Arctic. The acquisition of larger, ocean-going tugs and barges has also enabled them to expandinto the international trade <strong>market</strong>. Both the tug Evans McKeil and the barge Labrador Spirit are Canadian-flag (similar to all ofMcKeil's tugs, barges and <strong>vessels</strong>). Details on McKeil's fleet can be found at http://www.mckeilmarine.com/fleet1.html.28 Coatney, Mark. 2006. Down the Mississippi: The Pulse of America. Time.com 2000 [cited 8 March 2006]. Available fromhttp://www.time.com/time/reports/mississippi/day5.htmlTEMS, Inc. / RAND Corporation January 2007 57
Great Lakes-St. Lawrence SeawayNew Cargoes/New Vessels - Market Assessmentwhich is a common slower operating speed along the GLSLS. 29 The fuel efficiency at 14.8km/h for COB is 0.061 kg/TEU-km.Acquisition co<strong>st</strong>s of a COB unit comprise the co<strong>st</strong>s of a towboat and two barges. MarconInternational, Inc., a vessel brokerage firm, e<strong>st</strong>imates the total acquisition co<strong>st</strong> of the COBunit described in this section to be $11 million. 30 Each barge co<strong>st</strong>s $1 million; the towboatco<strong>st</strong>s approximately $9 million. The e<strong>st</strong>imate for the co<strong>st</strong> of the towboat is based on a ruleof-thumbco<strong>st</strong> of $1.5 million per 1000 hp (746 kW) of in<strong>st</strong>alled power. Based on thespeed/fuel consumption e<strong>st</strong>imates above, the in<strong>st</strong>alled power of the towboat isapproximately 3,000 kW, or 4,000 hp.Exhibit 4-5: Summary of the characteri<strong>st</strong>ics of the tug Evans McKeil and barge Labrador Spiritand a prototype vessel combining the tug and two barges for use in the GLSLS.Parameter Evans McKeil Labrador Spirit Prototype VesselLength Overall (m) 33.5 73.15 179.8Beam (m) 7.7 21.9 21.9Draft (m) 3.5 3.7 3.7Cargo deadweight (kg) 4.50 * 10 6 9.00 * 10 6Loaded TEU 310 620Exhibit 4-6: Fuel consumption at common operating speeds in the GLSLS for the COB.Speed (km/h) Fuel consumption (kg/hr) Fuel economy (kg/TEU-km)11.1 370 0.05414.8 560 0.06119.4 NA NA29.6 NA NAExhibit 4-7: Container on Barge Performance ParametersPerformance ParameterPrototype VesselCruise Speed (km/h) 14.8Fuel consumption at cruise speed (kg/hr) 560Fuel economy at cruise speed (kg/TEU-km) .061Loaded TEU/FEU capacity 620 / 310Crew 9COB service is generally limited to 8-10 knots due to the barge hullform. Streamlined hullsfor lake or ocean service can go up to 15 knots and deployment of these is underconsideration by some GLSLS ports. COB service is energy efficient, but it is very slow. 31New technologies, such as Germany’s “Futura Carrier” use bubble-lubrication technology tomake COB service even more efficient but unfortunately, without improving the speed byvery much. For a be<strong>st</strong>-case evaluation of the transit time of COB service, it is assumed that29 Prozzi, et al. (2002) <strong>st</strong>ate that a gallon of fuel can move one ton of cargo 514 miles. Applying conversions and assuming that themovement is at the cruise speed of 14.8 km/h, we e<strong>st</strong>imate the fuel consumption of a loaded combination of towboat and barges tobe 560 kg/hr. Using this value as a data point, it is possible to fit a quadratic equation to the speed/fuel consumption curve to derivethe e<strong>st</strong>imate of 370 kg/h at a speed of 11.1 km/h, since hydrodynamic drag rises roughly with the square of the velocity of the vessel.30 Marcon International. 2006. Co<strong>st</strong> E<strong>st</strong>imate for Container on Barge Vessel. Santa Monica, California, May 18, 2006.31 Because of their <strong>st</strong>reamlined hullforms and larger size, container ships are even more energy efficient than COB and are fa<strong>st</strong>er than COB as well.For a deep-draft waterway such a GLSLS, container ships are therefore generally more co<strong>st</strong> effective than COB. COB is better suited to shallow draftriver navigation that excludes ships.TEMS, Inc. / RAND Corporation January 2007 58
Great Lakes-St. Lawrence SeawayNew Cargoes/New Vessels - Market Assessmentthe vessel will be limited to a top speed of 12 knots, even on the open waters of the GreatLakes.Exhibit 4-8 shows the speed profile for COB service from Port Colbourne – the Lake Erieentrance to the Welland Canal – to Montreal. The required transit time from Montreal toLake Erie would be 48 hours. For a trip from Halifax to Montreal, the trip time is 84 hoursfor a seagoing barge. From Montreal to Port Colbourne on Lake Erie, the time would be 48hours and from Port Colbourne to Chicago the time would be 70 hours. The total fromHalifax to Chicago would be 202 hours, approximately 8½ days sailing time for a <strong>st</strong>andard<strong>st</strong>reamlined seagoing barge. The RAND COB vessel as described in Exhibit 4-7 is evenslower than this and would take about 11 days to transit the entire length of the GLSLS.Exhibit 4-8: Container on Barge Speed Profile: Port Colbourne to Montreal1816Welland CanalLake OntarioSt LawrenceRiver1412Speed(mph)10864200.000 50.000 100.000 150.000 200.000 250.000 300.000 350.000Milepo<strong>st</strong>Maximum Allowable SpeedMaximum Attainable SpeedOverall, the COB line-haul is projected to co<strong>st</strong> $0.21 per FEU-mile for Ro/Ro service, or$0.11 per FEU-mile for Lo/Lo service. While both of these co<strong>st</strong>s are highly competitive withrail movement, barge service would be much slower.On the inland rivers and canals of Europe, containers are frequently handled on barges.Barge service is especially prevalent as feeder service to the Port of Rotterdam, which islocated at the mouth of the Rhine River. Container on barge service is provided on manyother European waterways, as well as for intracoa<strong>st</strong>al or “short sea” shipping service.However, this form of shipping has not been very popular in North America because it hasbeen perceived as too slow as compared to rail or truck shipping.32 Although COB servicecan be very economical, reducing the co<strong>st</strong> is not that helpful since the main issue is transittime, not co<strong>st</strong>. While COB service may prove useful for some low-value commodities, ahigher speed at a competitive co<strong>st</strong> is the critical requirement for being able to attract trafficto the waterways from truck and rail.32 Crew, J.G. and Horn, K.H., “Assessment of Container-on-Barge Service on the Mississippi River Sy<strong>st</strong>em,” Journal of the Transportation Research Forum,Vol. XXVIII, No. 1, (Washington, D.C.: Transportation Research Forum, 1987) pp.92-95.TEMS, Inc. / RAND Corporation January 2007 59
Great Lakes-St. Lawrence SeawayNew Cargoes/New Vessels - Market Assessment4.3.3 GREAT LAKES-ST. LAWRENCE SEAWAY CONTAINERSHIPThe second technology we consider is a containership specifically designed to traverse theGLSLS. The size of the locks and the clearance limits throughout the sy<strong>st</strong>em would con<strong>st</strong>rainthe maximum dimensions of such a vessel. Also, because freshwater is less buoyant thanseawater, the capacity of such a vessel would be less than that of a similarly sizedoceangoing vessel. We propose a containership with dimensions based on those of bulkfreighters currently operating in the GLSLS and with a shape based on containerships ofsimilar size. We derive a cargo deadweight and displacement for the vessel and e<strong>st</strong>imatethe power requirements of such a vessel.GLSLS Container ShipWe base the prototype containership on <strong>vessels</strong> currently operating in the GLSLS. TheSeaway Marine Transport Corporation operates a fleet of <strong>vessels</strong> sized specifically for theGLSLS. As a model, we choose the bulk freighter Algoville, as a vessel from which to size acontainership. In reality, were a firm to develop a containership for the GLSLS, the designwould be influenced by the con<strong>st</strong>raints of the GLSLS, the expected operational scenariosincluding average loading, typical di<strong>st</strong>ances, and current and future port facilities. TypicalGreat Lakes freighters are squared-off and slow-moving <strong>vessels</strong> optimized for carrying bulkcommodities throughout the GLSLS. 33 Despite their size, containerships are designed forrelatively high speed operation and tend to be more <strong>st</strong>reamlined. 34 Therefore, our prototypevessel is sized according to the GLSLS, but sacrifices cargo deadweight for speed, as typicalin containerships. The basic parameters of our vessel compared with that of the Algovilleare li<strong>st</strong>ed in the exhibit below.Exhibit 4-9: Comparison of the Seaway Marine Transport Corporation Algoville bulkfreighter and a prototype container vessel for use in the GLSLS.Parameter Algoville Prototype VesselLength Overall (m) 222.5 222.5Length Between Perpendiculars (m) 216.5 216.5Length at Waterline (m) 219.5 (e<strong>st</strong>imated) a 219.5 (e<strong>st</strong>imated) aBeam (m) 23.8 23.8Draft (m) 7.9 7.9Displacement (kg) 33.0 * 10 6 26.0 * 10 6Cargo deadweight (kg) 28.2 * 10 6 19.3 * 10 6Loaded TEU N/A 1,330a E<strong>st</strong>imated as the mean of the length overall and the length between perpendiculars.33 Gillmer, Thomas C. and Bruce Johnson. 1982. Introduction to Naval Architecture. Annapolis, Maryland: Naval In<strong>st</strong>itute Press.34 Propulsion Trends in Container Vessels. No date. Copenhagen, Denmark: MAN B&W Diesel A/S.TEMS, Inc. / RAND Corporation January 2007 60
Great Lakes-St. Lawrence SeawayNew Cargoes/New Vessels - Market AssessmentWe e<strong>st</strong>imated the power requirements of the vessel using two online tools and fitting thecurves to a prototype vessel of similar cargo carrying capacity. The Holtrop and Mennenmethod is a well-respected method for calculating the resi<strong>st</strong>ance of a vessel as it move<strong>st</strong>hrough the water. 35,36 The engine manufacturer MAN B&W used the method to evaluatethe power requirements for various prototype container <strong>vessels</strong> in a recent technicalpaper. 37 MAN B&W added margins of 10 percent for the engine and 15 percent for seaconditions to the e<strong>st</strong>imated power requirements. We used an online tool available fromSchiffbau-Versuchsan<strong>st</strong>alt Potsdam GmbH to evaluate the power requirements of ourvessel. 38 To this e<strong>st</strong>imate, we added a 10 percent margin for the engine and machinery, a15 percent margin for sea conditions and an additional 10 percent margin for operation inshallow water. 39 We employed another tool from an information clearinghouse on marinediesel engines to double check our calculations 40 ; this tool used as inputs only the type ofvessel – i.e. displacement or non-displacement – displacement weight and length overall tocompute an e<strong>st</strong>imated power requirement. Its e<strong>st</strong>imate was approximately 35 percent<<strong>st</strong>rong>great</<strong>st</strong>rong>er than the e<strong>st</strong>imate using the Schiffbau-Versuchsan<strong>st</strong>alt tool. To derive an e<strong>st</strong>imatedpower requirement for the prototype GLSLS containership, we compute a weighted averagebased on the output of both online tools and the e<strong>st</strong>imate for a 1,500 TEU containership byMAN B&W. The fuel efficiency is 0.054 kg/TEU-km at cruise speed.Exhibit 4-10: Power and fuel consumption at common operating speeds in the GLSLS.Speed (km/h) Power (kW) Fuel consumption (kg/hr) Fuel efficiency (kg/TEU-km)11.1 370 74 0.005019.4 1,940 390 0.015029.6 6,760 1,360 0.035037.0 13,300 2,680 0.0540The GLSLS containership carries 14 crewmembers. A typical po<strong>st</strong>-Panamax containershipcapable of carrying 6,000 or more TEU has a crew of 21. 41 The prototype vessel has les<strong>st</strong>han one-quarter the cargo capacity, but because of the frequent port calls and canalcrossings, additional crew are required for mooring operations and cargo maintenance.Therefore, in addition to the three certified deck officers and two engineers, we assume theemployment of 9 additional crewmembers to assi<strong>st</strong> in vessel operation and dockingmaneuvers.Container ship technology has dramatically changed in recent years, focusing ondevelopment of fa<strong>st</strong>er, more <strong>st</strong>reamlined hulls along with more powerful engines. Moderncontainerships have a cruising speed of 22-23 knots as compared to the 10-15 knots typicalof older <strong>vessels</strong>. Although energy consumption has increased, the fa<strong>st</strong>er <strong>vessels</strong> are <strong>st</strong>illvery energy-efficient as compared to truck, rail, and even COB service. The higher energyconsumption for operating fa<strong>st</strong>er is offset by savings in crew and capital co<strong>st</strong>s, so the speedimprovement can be attained without significantly increasing overall operating co<strong>st</strong>s.The approximate acquisition co<strong>st</strong> of a GLSLS containership would be $18 million. The Exhibit4-11 below summarizes the performance parameters for the prototype containership for theGLSLS.35 Holtrop, J. and G. G. J. Mennen. 1978. A <strong>st</strong>ati<strong>st</strong>ical power prediction method. International Shipbuilding Progress 25.36 Holtrop, J. and G. G. J. Mennen. 1982. An approximate power prediction method. International Shipbuilding Progress 29.37 Propulsion Trends in Container Vessels. No date. Copenhagen, Denmark: MAN B&W Diesel A/S.38 ePING - Engineering Assi<strong>st</strong>ance in Hydrodynamics 2006. Schiffbau-Versuchsan<strong>st</strong>alt Potsdam GmbH 2006 [cited January 29 2006].Available from http://www-sva-po<strong>st</strong>sdam.de/eping/free/holtrop/holtrop.php39 Gillmer, Thomas C. and Bruce Johnson. 1982. Introduction to Naval Architecture. Annapolis, Maryland: Naval In<strong>st</strong>itute Press.40 Vessel Power Calculator 2006. boatdiesel.com 2006 [cited January 29 2006]. Available fromhttp://boatdiesel.com/BDR/Members/Calculators/PowerRequired.cfm.41 Pollak, Richard. 2004. The Colombo Bay. New York, New York: Simon and Schu<strong>st</strong>er.TEMS, Inc. / RAND Corporation January 2007 61
Great Lakes-St. Lawrence SeawayNew Cargoes/New Vessels - Market AssessmentExhibit 4-11: GLSLS Container Ship Performance ParametersPerformance ParameterPrototype VesselCruise Speed (km/h) 37.0Fuel consumption at cruise speed (kg/hr) 2,680Fuel economy at cruise speed (kg/TEU-km) .054Loaded TEU/FEU capacity 1,330 / 665Crew 14The higher speed of modern container ships directly addresses the core concern of mo<strong>st</strong>shippers – that water transportation is too slow. The near doubling of the speed of modern<strong>vessels</strong> can bring GLSLS water transit times within a competitive range of groundtransportation. In the GLSLS, ship speeds will <strong>st</strong>ill be limited in the con<strong>st</strong>rained locks andchannels; but there is plenty of open-water sailing on both the Great Lakes and lower St.Lawrence River where a fa<strong>st</strong>er vessel speed could reduce transit times.Furthermore, it should be noted that while there is <strong>st</strong>ill a considerable supply of older<strong>vessels</strong> (many of which are commercially obsolete in the ocean trades) which fit the GLSLSlocks and might be considered as candidates for providing GLSLS water feeder service, theylack the operating efficiency of modern <strong>vessels</strong>. As a result, despite their low capital co<strong>st</strong>,they generally operate at a much lower speed than modern ships, which typically make<strong>st</strong>hem uncompetitive in time sensitive container <strong>market</strong>s.Since the GLSLS shipping lanes are fiercely competitive with ground transportation modes,it would be a mi<strong>st</strong>ake to try to introduce obsolete <strong>vessels</strong> into the GLSLS trade. It isconsidered that the operating advantages of a modern vessel outweigh the higher initialcapital co<strong>st</strong> in this <strong>market</strong>. All the Container Ship demand foreca<strong>st</strong>s prepared for this <strong>st</strong>udyassume the introduction of modern containerships that are capable of a top speed of 22-23knots. If an older vessel is to be used in<strong>st</strong>ead, the results will be more consi<strong>st</strong>ent with theforeca<strong>st</strong> developed for the slower COB service.At the same speed, COB is slightly less efficient on a co<strong>st</strong> basis than the GLSLS containership, mainly due to the improved fuel efficiency of the larger and more <strong>st</strong>reamlinedcontainer ship hull. However, the main advantage of the container ship is that it can gomore than twice as fa<strong>st</strong> as COB at approximately the same co<strong>st</strong> per FEU-mile. It makessense that deep draft <strong>vessels</strong> would provide better economics on GLSLS, since COBtechnology is optimized for river service, not for a deep-draft waterway sy<strong>st</strong>em like theGLSLS.A critical choice is whether a modern ship design should be deployed in Ro/Ro or Lo/Loconfiguration. Lo/Lo uses cranes to <strong>st</strong>ack containers in the hold and on the deck and cancarry more containers than a Ro/Ro design. The benefit of the Ro/Ro design is reduced portco<strong>st</strong>s as well as shortened vessel dwell times at the docks. Both Ro/Ro and Lo/Lo containership versions are under evaluation as sensitivities to the Lo/Lo design that was originallyproposed by RAND. As well, two possible vessel sizes have been evaluated.TEMS, Inc. / RAND Corporation January 2007 62
Great Lakes-St. Lawrence SeawayNew Cargoes/New Vessels - Market AssessmentExhibit 4-12 shows the speed profile for GLSLS Container Ship from Lake Erie to Montreal.The transit time would be 43 hours, sub<strong>st</strong>antially fa<strong>st</strong>er than the COB service, because ofthe ability to sail fa<strong>st</strong>er on the open waters of the Great Lakes. Obviously, once the openwaters of the Upper Lakes are attained beyond the Welland Canal, a modern container shipcould go up to twice as fa<strong>st</strong> as a COB service. For a trip from Halifax to Montreal, the triptime is 50 hours for a modern container ship. From Montreal to Port Colbourne on Lake Erie,the time would be 43 hours and from Port Colbourne to Chicago the time would be 42hours. The total from Halifax to Chicago would be 135 hours, approximately 5½ days sailingtime, a dramatic saving over the be<strong>st</strong>-case 8 ½ days for a COB sy<strong>st</strong>em.Exhibit 4-12: GLSLS Container Ship Speed Profile: Port Colbourne to Montreal25Welland CanalLake OntarioSt LawrenceRiver2015Speed(mph)10500.000 50.000 100.000 150.000 200.000 250.000 300.000 350.000Milepo<strong>st</strong>Maximum Allowable SpeedMaximum Attainable SpeedExhibits 4-13 and 4-14 show the speed vs. operating co<strong>st</strong> tradeoff for a modern GLSLS-maxcontainer ship. Exhibit 4-23 has the ship in Ro/Ro configuration, whereas Exhibit 4-24 is forLo/Lo. As shown in Exhibit 4-23, a 342-FEU Ro/Ro vessel’s total operating co<strong>st</strong> is projectedat $0.17 per FEU-mile at 11-knots, or $0.23 per FEU-mile at 20-knots. By comparison, railintermodal line-haul co<strong>st</strong> is about $0.36 per FEU-mile and trucking co<strong>st</strong>s $1.75 per FEUmile.Therefore, it can be seen that the GLSLS-max Ro/Ro ship can be very co<strong>st</strong>-competitivewith rail intermodal shipping, provided the port handling charges are not so large as toundermine the line-haul co<strong>st</strong> advantage of this vessel.TEMS, Inc. / RAND Corporation January 2007 63
Great Lakes-St. Lawrence SeawayNew Cargoes/New Vessels - Market AssessmentExhibit 4-13: 342-FEU Ro/Ro GLSLS Container Ship: Co<strong>st</strong> per FEU-mile$0.25$0.20$0.15$0.10Time Co<strong>st</strong>Fuel Co<strong>st</strong>Total Co<strong>st</strong>$0.05$0.000 5 10 15 20 25KnotsIn Exhibit 4-14, the 665-FEU Lo/Lo vessel has a sub<strong>st</strong>antially higher capacity, whichtranslates into an even lower unit co<strong>st</strong> per FEU. This vessel is clearly co<strong>st</strong> competitive withrail intermodal shipping. The disadvantage is the requirement for crane loading, whichwould subject the vessel to higher port co<strong>st</strong>s. As a rule, to maximize line-haul efficiency,Lo/Lo service would be more advantageous in the longer di<strong>st</strong>ance shipping lanes, whereasRo/Ro service would offer less expensive terminal operations for shorter haul lanes.Exhibit 4-14: 665-FEU Lo/Lo GLSLS Container Ship: Co<strong>st</strong> per FEU-mile$0.14$0.12$0.10$0.08$0.06$0.04Time Co<strong>st</strong>Fuel Co<strong>st</strong>Total Co<strong>st</strong>$0.02$0.000 5 10 15 20 25KnotsTEMS, Inc. / RAND Corporation January 2007 64
Great Lakes-St. Lawrence SeawayNew Cargoes/New Vessels - Market AssessmentExhibits 4-15 and 4-16 gives the basic performance specifications for a smaller containership based on a design commonly used in European coa<strong>st</strong>al waters. Data in Exhibit 4-16was obtained from the vessel manufacturer 42 .Exhibit 4-15: Coa<strong>st</strong>er Container ShipExhibit 4-16: Coa<strong>st</strong>er Container Ship Performance ParametersPerformance ParameterPrototype VesselCruise Speed (km/h) 37.0Fuel consumption at cruise speed (kg/hr) 1,005Fuel economy at cruise speed (kg/TEU-km) .078Loaded TEU/FEU capacity 350 / 175Crew 8Exhibit 4-17 gives the co<strong>st</strong> per FEU-mile for this smaller ship in Ro/Ro configuration. A 90-FEU Ro/Ro vessel’s total operating co<strong>st</strong> is projected at $0.45 per FEU-mile at 17-knots, or$0.48 per FEU-mile at 20-knots. By comparison to rail line-haul co<strong>st</strong> of about $0.36 perFEU-mile and $1.75 for a truck, it can be seen that the smaller vessel in Ro/Ro configurationmay have a hard time directly competing with rail intermodal service, although it couldcertainly <strong>st</strong>ill compete with trucking.42 UAB Laivu Projetai, Lithuania. http://www.laivuprojektai.com/index.php?page=coa<strong>st</strong>ersTEMS, Inc. / RAND Corporation January 2007 65
Great Lakes-St. Lawrence SeawayNew Cargoes/New Vessels - Market AssessmentExhibit 4-17: 90-FEU Ro/Ro Coa<strong>st</strong>er Container Ship: Co<strong>st</strong> per FEU-mile$0.90$0.80$0.70$0.60$0.50$0.40$0.30$0.20$0.10$0.000 5 10 15 20 25KnotsTime Co<strong>st</strong>Fuel Co<strong>st</strong>Total Co<strong>st</strong>Exhibit 4-18 gives the co<strong>st</strong> for this Coa<strong>st</strong>er vessel in Lo/Lo configuration. A 175-FEU Lo/Lovessel’s total operating co<strong>st</strong> is projected at $0.23 per FEU-mile at 17-knots, or $0.25 perFEU-mile at 20-knots. Rail line-haul co<strong>st</strong>s about $0.36 per FEU-mile; trucking co<strong>st</strong>s $1.75.It can be seen that the Coa<strong>st</strong>er vessel could very effectively compete with rail in Lo/Loconfiguration if port loading and unloading charges are not too high.Exhibit 4-18: 175-FEU Lo/Lo Coa<strong>st</strong>er Container Ship: Co<strong>st</strong> per FEU-mile$0.45$0.40$0.35$0.30$0.25$0.20$0.15$0.10$0.05$0.000 5 10 15 20 25KnotsTime Co<strong>st</strong>Fuel Co<strong>st</strong>Total Co<strong>st</strong>TEMS, Inc. / RAND Corporation January 2007 66
Great Lakes-St. Lawrence SeawayNew Cargoes/New Vessels - Market Assessment4.3.4 A RO/RO FAST FREIGHTERThe third technology we consider is a “fa<strong>st</strong> freighter.” The vessel is a high-speed catamaranconfigured to handle Ro/Ro cargo. These <strong>vessels</strong> are primarily designed for high-speedmovement and low-cargo capacity relative to other technologies examined in this analysis.Traditionally, the technology has focused on passenger movement. At times, however,<strong>vessels</strong> are configured to handle cargo. The size of the locks and the clearance limit<strong>st</strong>hroughout the GLSLS do not con<strong>st</strong>rain the maximum dimensions of mo<strong>st</strong> <strong>vessels</strong> of thi<strong>st</strong>ype.Fa<strong>st</strong> Freighter (Ferry)Many manufacturers produce such <strong>vessels</strong>, including Au<strong>st</strong>al and Incat of Au<strong>st</strong>ralia. Au<strong>st</strong>alproduces a passenger ferry that operated between Roche<strong>st</strong>er, New York and Toronto,Ontario for several years 43 and built a similar vessel through its U.S. subsidiary to operatebetween Milwaukee, Wisconsin and Muskegon, Michigan. 44 The vessel prototype examinedin this analysis is a proposed vessel by Au<strong>st</strong>al. 45 The beam of the prototype vessel isseveral meters wider than that allowed by the GLSLS; we make the assumption that a fa<strong>st</strong>freighter con<strong>st</strong>ructed for the GLSLS would have approximately the same deadweighttonnage. The basic parameters of the vessel are li<strong>st</strong>ed in the exhibit below.Exhibit 4-19: Performance parameters for a prototype fa<strong>st</strong> freight vessel for use in the GLSLS.ParameterPrototype VesselLength Overall (m) 115.0Length at Waterline (m) 100.0Beam (m) 28.7Draft (m) 4.2Cargo deadweight (kg) 1.52 * 10 6Loaded TEU 95Engines4 x 9,000 kWThe performance parameters for the fa<strong>st</strong> freighter are much different than that of theGLSLS containership. Since it operates in non-displacement mode, current GLSLSregulations allow it to operate at 63.9 km/h when traversing the Great Lakes and enteringthe GLSLS from the Gulf of St. Lawrence. The hourly fuel consumption increases43 U.S. Department of Transportation. 2004. Fa<strong>st</strong> Ferries on the Great Lakes: Success is Here to Stay. In Seaway Compass.44 Egan, Dan. 2006. Futuri<strong>st</strong>ic high-speed catamaran ferry plies uncharted waters in lake travel. LakeNet, December 14, 2003 2003 [cited May 302006]. Available from http://www.world<<strong>st</strong>rong>lakes</<strong>st</strong>rong>.org/show<strong>new</strong>s.asp?<strong>new</strong>sid=1583.45 Fa<strong>st</strong> Freighter Outline Spec 1. 2004. Henderson, Au<strong>st</strong>ralia: Au<strong>st</strong>al.TEMS, Inc. / RAND Corporation January 2007 67
Great Lakes-St. Lawrence SeawayNew Cargoes/New Vessels - Market Assessmentconsiderably: the fuel consumption at cruise speed, assuming a specific fuel consumption of0.201 kg/kW-hr, is 6,510 kg of MDO, yielding a fuel efficiency of 1.07 kg/TEU-km.The cargo capacity of the fa<strong>st</strong> freighter is <<strong>st</strong>rong>great</<strong>st</strong>rong>ly reduced from that of the containership.Because the vessel is to be used for Ro/Ro carriage, the vessel also mu<strong>st</strong> carry theintermodal chassis, which has a mass of 3,240 kg. 46 The 1.52 * 10 6 kg deadweight tonnagecan theoretically accommodate 47 40-foot containers with their chassis, or 95 TEU. Thisnumber fits within the lane capabilities of a similar vessel, which has 730 lane meters on asingle deck, enough to accommodate approximately 60 40-foot containers. 47 , 48Our e<strong>st</strong>imate for crew on the fa<strong>st</strong> freighter differs from that of the manufacturer. Themanufacturer proposes that the vessel be manned by 14 crewmembers. 49 However, sincethe vessel carries relatively little cargo and is smaller than other <strong>vessels</strong>, we assume that 9crewmembers are sufficient to operate the vessel, tend cargo, and assi<strong>st</strong> in docking.Fuel consumption for the fa<strong>st</strong> ferry has been e<strong>st</strong>imated by Au<strong>st</strong>al and is reported in theexhibit below.Exhibit 4-20: Fuel consumption for a fa<strong>st</strong> freighter at common operating speeds in the GLSLS. 50Speed (km/h) Fuel consumption (kg/hr) Fuel efficiency (kg/TEU-km)11.1 510 0.48419.4 810 0.44029.6 1,200 0.42737.0 1,500 0.42763.9 6,510 1.07Au<strong>st</strong>al, Inc. e<strong>st</strong>imates the acquisition co<strong>st</strong> of the fa<strong>st</strong> ferry to be approximately $50million. 51Fa<strong>st</strong> Ferry <strong>vessels</strong> employ very powerful engines to operate in non-displacement mode at ahigh speed. The ships were initially designed as automobile and truck ferries. To reduceweight, they often employ welded aluminum hull con<strong>st</strong>ruction. Despite the lightweightdesign cruising at 40-knots, unfortunately, these <strong>vessels</strong> have very high-energyconsumption – almo<strong>st</strong> 20 times more fuel per FEU-mile than the container ship. The resultis that the Fa<strong>st</strong> Freighter (Ferry) consumes sub<strong>st</strong>antially more fuel per TEU-mile thantrucking. Exhibit 4-21 gives the basic performance specifications for the Fa<strong>st</strong> Freighter(Ferry).46 GE Equipment Services, Rail Services 2006. General Electric 2006 [cited February 12 2006]. Available fromhttp://www.ge.com/railservices/productsservices/intermodal/containers.html.47 This discrepancy between tonnage and lane capacity would be a major consideration in the design of a GLSLS-specific fa<strong>st</strong> ferry.The manufacturer e<strong>st</strong>imates that the vessel can carry 132 TEU.48 Fa<strong>st</strong> Freight - Au<strong>st</strong>al 2006. Au<strong>st</strong>al 2006 [cited February 12 2006]. Available from http://www.au<strong>st</strong>al.com/go/productinformation/commercial-products/fa<strong>st</strong>-freight49 Fa<strong>st</strong> Freighter Outline Spec 1. 2004. Henderson, Au<strong>st</strong>ralia: Au<strong>st</strong>al.50 Operating in non-displacement mode changes the drag characteri<strong>st</strong>ics of <strong>vessels</strong>, a phenomenon witnessed here as the vessel speedincreases. (Regan 2006)51 Regan, Richard. 2006. Au<strong>st</strong>al Fa<strong>st</strong> Ferry Product Information. Santa Monica, California, May 10.TEMS, Inc. / RAND Corporation January 2007 68
Great Lakes-St. Lawrence SeawayNew Cargoes/New Vessels - Market AssessmentExhibit 4-21: Fa<strong>st</strong> Freighter (Ferry) Performance ParametersPerformance ParameterPrototype VesselCruise Speed (km/hr) 63.9Fuel consumption at cruise speed (kg/hr) 6,510Fuel economy at cruise speed (kg/TEU-km) 1.07Loaded TEU / FEU capacity 95 / 42Crew 9As shown in Exhibit 4-22, the Fa<strong>st</strong> Freighter (Ferry) needs 40 hours to go from PortColbourne to Montreal: three hours fa<strong>st</strong>er than the container ship and eight hours fa<strong>st</strong>erthan COB service. The difference is entirely due to fa<strong>st</strong>er speeds on the open waters of LakeOntario, since it is assumed the vessel is con<strong>st</strong>rained by normal speed limits on the StLawrence Seaway and Welland Canal. For a trip from Halifax to Montreal, the trip time is 25hours for the Fa<strong>st</strong> Freighter (Ferry). From Montreal to Port Colbourne on Lake Erie, the time(Exhibit 4-31) would be 40 hours and from Port Colbourne to Chicago the time would be 21hours. The total from Halifax to Chicago would be 86 hours, approximately 3½ days sailingtime. This is less than half the time for a COB vessel and a 36 percent savings over acontainer ship. Exhibit 4-23 shows the co<strong>st</strong> of the Fa<strong>st</strong> Ferry, which is higher than truckingper FEU-mile, in large part due to the high fuel consumption of the vessel.Exhibit 4-22: Fa<strong>st</strong> Freighter (Ferry) Speed Profile: Port Colbourne to Montreal45Welland CanalLake OntarioSt LawrenceRiver403530Speed(mph)25201510500.000 50.000 100.000 150.000 200.000 250.000 300.000 350.000Milepo<strong>st</strong>Maximum Allowable SpeedMaximum Attainable SpeedTEMS, Inc. / RAND Corporation January 2007 69
Great Lakes-St. Lawrence SeawayNew Cargoes/New Vessels - Market AssessmentExhibit 4-23: 46-FEU Fa<strong>st</strong> Ferry: Co<strong>st</strong> per FEU-mile$2.50$2.00$1.50$1.00Time Co<strong>st</strong>Fuel Co<strong>st</strong>Total Co<strong>st</strong>$0.50$0.000 10 20 30 40Knots4.3.5 THE PARTIAL AIR-CUSHION SUPPORT CATAMARANThe final technology we consider is the PACSCAT. The PACSCAT is a slender-hulledcatamaran partially supported by a lift fan. Vessels with partial aero<strong>st</strong>atic support have beenin exi<strong>st</strong>ence for several decades. 52 Features include reduced resi<strong>st</strong>ance and fuelconsumption, increased speed, shallow draft, and reduced wake when compared toconventional displacement or other high-speed <strong>vessels</strong>. The size of the locks and theclearance limits throughout the GLSLS do not con<strong>st</strong>rain the maximum dimensions ofprototype PACSCAT <strong>vessels</strong>.Partial Air Cushion Catamaran – PACSCAT52 Gillmer, Thomas C. and Bruce Johnson. 1982. Introduction to Naval Architecture. Annapolis, Maryland: Naval In<strong>st</strong>itute Press.TEMS, Inc. / RAND Corporation January 2007 70
Great Lakes-St. Lawrence SeawayNew Cargoes/New Vessels - Market AssessmentThe PACSCAT discussed here is similar those that have been designed for use in inlandEuropean waterways. 53 If PACSCAT were to be put into operation in the GLSLS, a particularvessel would need to be developed, optimizing the size, power and lift sy<strong>st</strong>em to maximizedeadweight tonnage and meet GLSLS speed re<strong>st</strong>rictions. The vessel, whose parameters isli<strong>st</strong>ed in the exhibit below, is a novel design provided by Independent Maritime AssessmentAssociates and has a cargo deadweight of 3.05 * 10 6 kg, which translates into 210 loadedTEU when used in a LoLo configuration. 54Independent Marine Assessment Associates e<strong>st</strong>imates the acquisition co<strong>st</strong> of the PACSCATdescribed in this section to be approximately $20 million. 55Exhibit 4-24: Characteri<strong>st</strong>ics of a PACSCAT vessel appropriate for use on the GLSLS. 56ParameterPrototype VesselLength Overall (m) 225Beam (m) 23.8Draft (m) 1.8Cargo deadweight (kg) 3.05 * 10 6Loaded TEU 210Performance characteri<strong>st</strong>ics of the PACSCAT are a result of the use of the air cushion toreduce draft, resi<strong>st</strong>ance and wake. The cruise speed of the vessel is 37.0 km/h, which is thesame cruising speed as the prototype containership, but less than that of the fa<strong>st</strong> freighter.The fuel consumption of the vessel at cruise speed is 2,460 kg of MDO and the fuelefficiency is 0.316 kg/TEU-km. We assume slightly increased crew requirements for thePACSCAT over that of the fa<strong>st</strong> freighter, due to the increased cargo capacity of the vessel.The performance characteri<strong>st</strong>ics of the vessel are li<strong>st</strong>ed in the exhibits below.Exhibit 4-25: Power and fuel consumption for a prototype PACSCAT vessel. 57Speed(km/h)Propellerpower (kW)Lift power(kW)TotalpowerFuelconsumptionFuel efficiency(kg/TEU-km)(kW) (kg/hr)11.1 380 1,200 1,580 318 0.13619.4 2,730 1,200 3,930 790 0.19429.6 7,300 1,200 8,500 1,710 0.27537.0 11,000 1,200 12,200 2,450 0.31655.6 34,000 1,200 35,200 7,075 0.60663.9 42,000 1,200 43,200 8,683 0.65753 Clements, R., John C. Lewthwaite, P. Ivanov and P. Wilson. 2005. The Potential for the Use of a Novel Craft, PACSCAT, in InlandEuropean Waterways. Paper read at International Conference on Fa<strong>st</strong> Sea Transportation, June, at St. Petersburg, Russia.54 Lewthwaite, John C. 2006. 225m PACSCAT Freighter Specifications. Independent Maritime Assessment Associates. Santa Monica,California, April 10.55 Lewthwaite, John C. 2006. 2000t PACSCAT River Freighter Fuel Consumption. Independent Maritime Assessemnt Associates.Santa Monica, California, February 14.56 Clements, R., John C. Lewthwaite, P. Ivanov and P. Wilson. 2005. The Potential for the Use of a Novel Craft, PACSCAT, in InlandEuropean Waterways. Paper read at International Conference on Fa<strong>st</strong> Sea Transportation, June, at St. Petersburg, Russia.57 Lewthwaite, John C. 2006. 2000t PACSCAT River Freighter Fuel Consumption. Independent Maritime Assessemnt Associates.Santa Monica, California, February 14.TEMS, Inc. / RAND Corporation January 2007 71
Great Lakes-St. Lawrence SeawayNew Cargoes/New Vessels - Market AssessmentThe PACSCAT is a prototype design for a surface-effect ship – a vessel that uses an aircushion to partially lift itself out of the water. This reduces the draft of the vessel as well asits wave-making effect. The vessel was designed for the Rhine and coa<strong>st</strong>al waters ofEurope, as an environmentally more friendly way of operating at higher speeds. Thesurface-effect concept is not <strong>new</strong> – it has been applied to military vessel design for a longtime. Normally a surface-effect vessel operates in displacement mode up to a certain speed– usually the vicinity of 20 knots – above which the air cushion is activated to allow thevessel to go fa<strong>st</strong>er, up to 40 knots.The PACSCAT, however, employs lift in a novel fashion at low speeds, as well as highspeeds. The ‘Rhine’ river-freighter version of the PACSCAT technology has been designed tooperate at speeds up to 20 knots. The advantage of this vessel is that it reduces the wavesin the river to acceptable levels while permitting a higher vessel operating speed. For thisapplication, the air-lift sy<strong>st</strong>em is kept on all the time. The air-lift sy<strong>st</strong>em also reducesrequired water depth, a valuable feature in shallow river environments.The “North Sea Freighter” version of PACSCAT is designed to operate both on river channelsand in the open waters of the North Sea. As such, it is designed with a higher verticalclearance in order to handle larger waves in open ocean operation. As well, the North SeaFreighter is equipped with more powerful engines to be able to attain a maximum speed of40 knots. Exhibit 4-26 gives the basic performance parameters for both versions of thePACSCAT.Exhibit 4-26: PACSCAT Performance ParametersPerformance Parameter River North SeaCruise Speed (km/h) 37.0 63.9Fuel consumption at cruise speed (kg/hr) 2,450 8,683Fuel economy at cruise speed (kg/TEU-km) .315 .647Loaded TEU/FEU capacity 210 / 105 210 / 105Crew 11 11While both versions of PACSCAT were included in the scope of the initial analysis, it quicklybecame apparent that the River version of PACSCAT may not be particularly well suited tothe GLSLS.• Since it is an improved deep-draft waterway, the GLSLS does not present the samecon<strong>st</strong>raints of a typical river sy<strong>st</strong>em in terms of channel depth or vertical clearance.In locks and canal sections, PACSCAT may not be permitted a higher speed limitbecause of safety considerations.• Opportunities to utilize PACSCAT’s higher-speed in the St. Lawrence River are limitedto Lake St Louis and Lake St Francis. On the Great Lakes, a container ship can goju<strong>st</strong> as fa<strong>st</strong> as the river version of PACSCAT and the container ship is moreseaworthy than the PACSCAT River Freighter.• PACSCAT’s capital co<strong>st</strong> is more expensive than a container ship but offers muchsmaller capacity.TEMS, Inc. / RAND Corporation January 2007 72
Great Lakes-St. Lawrence SeawayNew Cargoes/New Vessels - Market Assessment• The River PACSCAT burns almo<strong>st</strong> as much fuel as a GLSLS container ship at thesame cruising speed but offers only one-sixth the capacity. Therefore, by comparisonto modern containership designs, it is clear that the PACSCAT River Freighter offerslittle benefit to GLSLS.However, the North Sea freighter version of PACSCAT is much more intere<strong>st</strong>ing for apotential GLSLS application. This vessel can go twice as fa<strong>st</strong> as a container ship on the openwaters of the Great Lakes and below Montreal and it offers higher capacity and better fueleconomy than the Fa<strong>st</strong> Ferry.As shown in Exhibit 4-27, the North Sea PACSCAT needs only 37 hours to go from Lake Erieto Montreal: the fa<strong>st</strong>e<strong>st</strong> time of any vessel available. The PACSCAT can go 40-knots on theopen waters of Lake Ontario, the same as the Fa<strong>st</strong> Ferry. However, it is also assumed thatthe vessel could go up to 35-knots in non-displacement mode on Lake St Louis and Lake StFrancis, because of PACSCAT’s reduced wave-making as compared to conventional shipdesigns.Exhibit 4-27: North Sea PACSCAT Speed Profile: Port Colbourne to Montreal45Welland CanalLake OntarioSt LawrenceRiver403530Speed(mph)25201510500.000 50.000 100.000 150.000 200.000 250.000 300.000 350.000Milepo<strong>st</strong>Maximum Allowable SpeedMaximum Attainable SpeedFor a trip from Halifax to Montreal, the trip time is 25 hours for the North Sea PACSCAT.From Montreal to Port Colbourne on Lake Erie, the time (from Exhibit 4-32) would be 37hours and from Port Colbourne to Chicago the time would be 21 hours. The total fromHalifax to Chicago would be 83 hours, approximately 3½ days sailing time, the same timeas the Fa<strong>st</strong> Freighter (Ferry).The operating co<strong>st</strong> comparison for PACSCAT is shown in Exhibit 4-28. This shows thatPACSCAT has a co<strong>st</strong> of $0.71 per FEU-mile at 20-knots and $1.26 per FEU-mile at 42-knots.PACSCAT has higher co<strong>st</strong>s than North American railroads, but <strong>st</strong>ill comes in at a lower co<strong>st</strong>than trucking. This is consi<strong>st</strong>ent with the European commission’s finding, where PACSCAT isbeing introduced mainly in lanes where rail intermodal service is very weak. However, inNorth America, rail freight is much better developed than in Europe and our analysis ofcomparative economics for the GLSLS reflects this differential.TEMS, Inc. / RAND Corporation January 2007 73
Great Lakes-St. Lawrence SeawayNew Cargoes/New Vessels - Market AssessmentPACSCAT technology shows much more favorable economics for hauling freight than doe<strong>st</strong>he Fa<strong>st</strong> Freighter (Ferry). Both technologies are capable of top speeds in the 40-knotrange, but PACSCAT appears to have more capacity, better fuel consumption and loweroverall operating co<strong>st</strong>s than does the Fa<strong>st</strong> Freighter (Ferry). Perhaps this should come as nosurprise, since PACSCAT was purpose-designed as a freight transport sy<strong>st</strong>em, whereas theFa<strong>st</strong> Freighter (Ferry) was designed primarily for automobile and passenger transport.Exhibit 4-29: 105-FEU PACSCAT: Co<strong>st</strong> per FEU-mile$1.40$1.20$1.00$0.80$0.60$0.40Time Co<strong>st</strong>Fuel Co<strong>st</strong>Total Co<strong>st</strong>$0.20$0.000 10 20 30 40 50KnotsTEMS, Inc. / RAND Corporation January 2007 74
Great Lakes-St. Lawrence SeawayNew Cargoes/New Vessels - Market Assessment4.4 COMPARISON OF THE PERFORMANCE OF THE VESSEL TECHNOLOGIESExhibit 4-30 provides a summary of the parameters for technologies presented in thedocument. This exhibit compares the performance characteri<strong>st</strong>ics of the four vesseltechnologies and summarizes the inherent <strong>st</strong>rengths and weaknesses of each vessel relativeto the others.Exhibit 4-30: Summary of performance characteri<strong>st</strong>ics of the candidate vessel technologies.Container on Barge Containership Fa<strong>st</strong> Ferry PACSCATLength Overall (m) 179.8 222.5 115.0 225Beam (m) 21.9 23.8 28.7 23.8Draft (m) 3.7 7.9 4.21.6 with lift /2.5 at re<strong>st</strong>Cargo deadweight (kg) 9.00 * 10 6 19.3 * 10 6 1.52 * 10 6 3.05 * 10 6Loaded TEU 620 1,330 95 210Starting and <strong>st</strong>opping time anddi<strong>st</strong>anceEnvironmental complianceWe assume that the time/di<strong>st</strong>ance to full speed/<strong>st</strong>op under normal operatingconditions to be 5 minutes and 2 kmWe assume that all <strong>vessels</strong> are configured to comply with balla<strong>st</strong> exchange andother environmental requirements of the GLSLS.Port infra<strong>st</strong>ructure requirementsWe assume that all ports have the appropriate facilities and equipment tohandle containerized cargo operations.Cruise speed (km/h) 14.8 37.0 63.9 37.0Fuel consumption at cruise speed(kg/hr)560 1,360 6,510 2,450Fuel consumption at 19.4 km/hr(kg/hr)Fuel consumption at 11.1 km/hr(kg/hr)Fuel economy (kg/TEU*km) atcruise speedN/A 390 810 790370 74 510 3180.061 0.054 1.07 0.315Crew 9 14 9 11Approximate acquisition co<strong>st</strong> ($M) 11 15 50 20Exhibit 4-31 builds on the fuel efficiency data presented above and adds truck and rail datato compare the candidate vessel technologies to the other prevailing options. Fuel efficiencyis a per-TEU measure of fuel used over a given di<strong>st</strong>ance. Among the four candidate vesseltechnologies, the containership is the mo<strong>st</strong> fuel efficient (0.054 kg/TEU-km) closely followedby container on barge (0.061 kg/TEU-km). PACSCAT is the third mo<strong>st</strong> fuel efficient vessel(0.315 kg/TEU-km) while the fa<strong>st</strong> ferry is the lea<strong>st</strong> fuel efficient vessel (1.07 kg/TEU-km).Both the containership and container on barge <strong>vessels</strong> are more fuel efficient than truck(0.186 kg/TEU-km) and rail (0.070 kg/TEU-km). 58 Both high-speed vessel technologies,PACSCAT and Fa<strong>st</strong> Ferry, have significant fuel consumption and have less fuel efficiencythan that of truck or rail. The fa<strong>st</strong> ferry is the lea<strong>st</strong> fuel-efficient option.58 Inland Waterway Navigation: Value to the Nation. 2000. Washington, Di<strong>st</strong>rict of Columbia: U.S. Army Corps of Engineers.TEMS, Inc. / RAND Corporation January 2007 75
Great Lakes-St. Lawrence SeawayNew Cargoes/New Vessels - Market AssessmentExhibit 4-31: Summary of fuel efficiency of the candidate vessel technologies.Container onBarge ContainershipFa<strong>st</strong>Ferry PACSCAT Truck RailFuel efficiency at cruise speed(kg/TEU-km) 0.061 0.054 1.07 0.315 0.186 0.070Fuel economy at cruise speed(ton-mi/gal) 514 582 29.4 99.5 148 390Chicago to Halifax transit times for the different vessel technologies are summarized inExhibit 4-32. This exhibit includes both the river and sea versions of PACSCAT:Exhibit 4-32: St. Lawrence Seaway: Vessel Transit Times SummarySectionSeagoingCOB(12 kts)Cont Ship(20 kts)RiverPACSCAT(20 kts)Fa<strong>st</strong> Ship(40 kts)SeaPACSCAT(40 kts)Chicago to Pt Colbourne 70 42 42 21 21Welland Canal 13 13 13 13 13Lake Ontario 12 7 7 4 4St. Lawrence to Montreal 23 23 22 23 20Montreal to Halifax 84 50 50 25 25Total Hours 202 135 134 86 83Approx Days 8½ 5½ 5½ 3½ 3½For comparing the performance of the four vessel technologies considered –• The simple<strong>st</strong> and slowe<strong>st</strong>, technology is container on barge (COB), which consi<strong>st</strong>s oftwo barges configured to handle containers, towed by a towboat. The COB has theslowe<strong>st</strong> cruising speed (14.8 km/h) but is relatively fuel-efficient (560 kg/hr), for itscargo capacity (620 TEU).• The trend in the con<strong>st</strong>ruction of containerships has been to larger and larger <strong>vessels</strong>;the containership we consider is a moderate-size vessel built especially for use in theGLSLS. Like the COB, this technology has a high cargo capacity (1,330 TEU). Thisvessel also consumes a significant amount of fuel at its top speed (2,680 kg/hr). Akey difference between the two technologies is that the cruising speed of thecontainership (37.0 km/h) is more than twice the speed of the COB. 59• We also examined a novel technology called a “fa<strong>st</strong> freighter”, which is a catamaranconfigured to handle Ro/Ro cargo. The cruising speed of the fa<strong>st</strong> ferry is 63.9 km/hbut the container carrying capacity of the fa<strong>st</strong> ferry is only 95 TEU. The vesselconsumes a significant amount of fuel at cruise speed (6,510 kg/hr).59 Because the containership is a displacement vessel, it mu<strong>st</strong> travel at a slower speed (29.6 km/h) in many parts of the GLSLS.TEMS, Inc. / RAND Corporation January 2007 76
Great Lakes-St. Lawrence SeawayNew Cargoes/New Vessels - Market Assessment• The final technology we examined was the partial air-cushion support catamaran(PACSCAT). The PACSCAT technology consumes more fuel at a cruise speed of 37.0km/h (2,450 kg/hr), when compared to the containership. Since the PACSCAT is anovel technology, the prototype we examined was not designed for the GLSLS. Thisversion is capable of carrying 210 TEU but a vessel designed specifically for thedeeper channel of the GLSLS might carry more cargo.Choosing the technology be<strong>st</strong> suited for the GLSLS is a complex function of a number offactors, including average trip di<strong>st</strong>ance, the type of cargo, and the con<strong>st</strong>raints of the GLSLS.While the top speed of the PACSCAT and the fa<strong>st</strong> ferry makes them attractive for quickturnaround shipping for high value commodities or accompanied trailers, their limited cargocarrying capacity with respect to other technologies and increased fuel consumption maycon<strong>st</strong>rain their economic viability.TEMS, Inc. / RAND Corporation January 2007 77