
You also want an ePaper? Increase the reach of your titles
YUMPU automatically turns print PDFs into web optimized ePapers that Google loves.
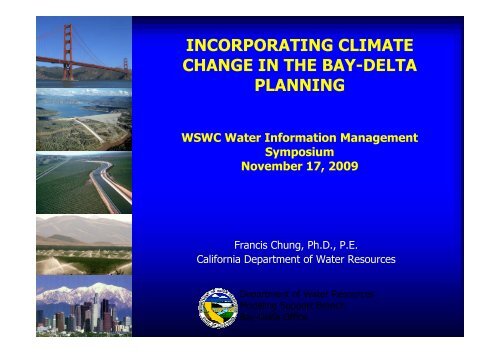
INCORPORATING CLIMATECHANGE IN THE BAY-DELTAPLANNINGWSWC Water Information ManagementSymposiumNovember 17, 2009<strong>Francis</strong> <strong>Chung</strong>, Ph.D., P.E.California Department of Water ResourcesDepartment of Water ResourcesModeling Support BranchBay-Delta Office
Governor’s Executive Order S-3-05• Signed June 1, 2005• Targets to reduce emissionlevels of greenhouse gases• Required biennial reportsstarting January 2006– Water supply– Public health– Agriculture– CA coastline– Forestry• Formed Climate Action Team2
2006 Report4 Scenarios (2 GCM x2 GHG)2009 Report12 Scenarios (6 GCM x2 GHG)3
What’s New for 2009 DWR CAT Report• More future climate scenarios– 4 in 2006, 12 in 2009• Comparison of GCM and historical data• Updated methods for creating data series thatreflect possible future climate conditions– Reservoir inflows– Outdoor urban and agricultural water demands• Incorporating sea level rise in SWP-CVPimpacts assessments4
2009 CAT Future Climate Scenarios6 Global Climate Models– GFDL-CM2.1 (USA)– NCAR-PCM1 (USA)– CNRM-CM3 (France)– MPI-ECHAM5 (Germany)– MIROC3.2med (Japan)– NCAR-CCSM3 (USA)2 GHG Emissions Scenarios– A2 (higher GHG emissions)• high population growth• regional economic growth• fragmented technologicalchanges– B1 (lower GHG emissions)• low population growth• rapid economic growth• sustainable technology12 Total Scenarios = 6 GCM x 2 GHG Emissions Scenarios5
Using Future Climate Projectionsin Decision Making• Sea level rise• Effects of increasing air temperatureon the upper Feather Basin• Climate change impacts on watersupply reliability6
How much will sea level rise?What is the likelihood that sea levelswill rise by a certain amount?How can we represent sea level rise effectson Delta salinity in computer models?8
Air TemperatureBased ProjectionsHistoricalExtrapolationAir TempBasedUncertaintyRangeMid-centuryEnd of century0.5 ft1.0 ft0.8-1.0 ft 0.5-1.3 ft1.8-3.1 ft 1.4-3.9 ftHistorical extrapolation9
Relative Likelihood from 12 Scenarios2050 20% chance 1ft SLR 2090 10% chance SLR 2.75-2.80ft10
Relative Likelihood from 12 ScenariosCautionLikelihoods:• are based on 12 scenarios• represent average sea levels• do not include extremewater level events• depend on choice of methodand parameter estimationsMore Research is Needed11
Models of SWP and CVP OperationsNeed a Way to Quickly RepresentDelta Water Quality Standard ComplianceSea Level Rise Artificial Neural NetworksSacramento-San JoaquinDeltaA Delta salinity ANN is a computerprogram that quickly estimates Deltasalinity based on inflows and exportsAn ANN can be used in managementtools such as CalSim and CalLite toestimate sea level rise impacts12
Developing Delta Salinity ANNs1. Use DSM2 to simulate Delta Salinityfor SLR scenarios2. Using DSM2 results, “train” SLR ANNto replicate Delta salinity basedDSM2 DomainSacramentoRiverSacramentoSan<strong>Francis</strong>coStocktonSanJoaquinRiverSea Level Rise ANN•Increase water level at Martinez•Increase salinity at Martinez based onDRMS study by Ed GrossANN=Artificial Neural Network13
Delta Salinity ANNs used in CAT report• Base sea level• +1ft sea level rise and +9% tidal amplitude– used for mid-century impacts analysis• +2ft sea level rise and +18% tidal amplitude– used for end of century impacts analysisANN=Artificial Neural Network14
Air Temperatureeffects onFeather River Basin15
Upper Feather River Basin• Inflow to Lake Oroville• Effects of rising air temperature– Precipitation-runoff model PRMS– +1°C, +2°C, +3°C, +4°C16
Day of 50% Annual Inflow at OrovilleA 4°C increase in air temperature shifts 50% inflow from mid-March to mid-Feb17
Runoff in April to JulyWater supply impactsWater year types may need to be modifiedYear types affect water quality standards18
SWP-CVP Impact Assessment Methodology• Delta exports• Carryover storage• Groundwater pumping• X2 location• Vulnerability to SystemInterruptionSWP= State Water ProjectCVP=Central Valley Project20
Mid-CenturyAnnualDeltaExportsEnd ofCenturyHigherGHGE (A2)LowerGHGE (B1)HigherGHGE(A2)LowerGHGE(B1)MedianAnnual Delta Exports, TAF Annual Delta Exports, TAF95%ConfidenceRange-10% -3 to -18%-7% 0 to -16%MedianMid-CenturyProbability that Exports Exceeds a Certain Volume (%)95%ConfidenceRange-25% -17 to -33%-21% -15 to -27%End of Century21
Mid-CenturyEnd ofCenturyHigherGHGE (A2)LowerGHGE (B1)ReservoirCarryoverStorageHigherGHGE(A2)LowerGHGE(B1)MedianCarryover Storage, TAF Carryover Storage, TAF95%ConfidenceRange-19% -6 to -31%-15% -3 to -26%MedianMid-CenturyProbability that Storage Exceeds a Certain Volume (%)95%ConfidenceRange-38% -24 to -51%-33% -21 to -45%End of Century22
Mid-CenturySac ValleyGroundwaterPumpingEnd ofCenturyHigherGHGE (A2)LowerGHGE (B1)HigherGHGE(A2)LowerGHGE(B1)Groundwater Pumping, TAFMedianGroundwater Pumping, TAF95%ConfidenceRange+9% +2 to +15%+5% -2 to +11%MedianMid-CenturyProbability that GW Pumping Exceeds a Certain Volume (%)95%ConfidenceRange+17% +7 to +24%+13% +7 to +18%End of Century23
Power SupplyMid-CenturyHigherGHGE(A2)LowerGHGE(B1)End of CenturyHigherGHGE(A2)LowerGHGE(B1)CVP Gen. -11% -4% -13% -12%CVP Use -14% -9% -28% -24%SWP Gen. -12% -5% -16% -15%SWP Use -10% -5% -16% -16%24
X2 PositionFuture Climate X2 RangeHistorical X2 Range25
Mid-CenturyX2Positionkm fromGoldenGateX2 Position (km) X2 Position (km)End of Century26
System Vulnerability toOperational Interruption• The SWP-CVP system is vulnerable tooperational interruption when water levels gobelow the lowest outlets (dead storage) in atleast one of the main storage reservoirs– Trinity, Shasta, Oroville, and/or Folsom27
SWP-CVP Vulnerabilityto Operational InterruptionAt mid-century 1 in 6 years is vulnerable for A21 in 8 years is vulnerable for B1By the end of the century 1 in 3 years is vulnerable for A21 in 4years is vulnerable for B128
Amount of Additional Water Needed to AvoidOperational Interruption in Vulnerable YearsAt mid-century 750 TAF is needed in vulnerable years for A2575 TAF is needed in vulnerable years for B1By the end of the century 750 TAF is needed in vulnerable years for A2850 TAF is needed in vulnerable years for B129
• Sea level riseSummary of Findings– Amount, probability, Delta salinity ANNs• Effects of increasing air temp on Feather basin– April snowpack, runoff in April-July– 50% inflow to Oroville up to a month earlier• Effects of climate change on SWP and CVP– annual Delta exports, reservoir carryover storage– annual groundwater pumping– X2 range moves upstream, standard still met– Power supply– vulnerability to operational interruption30
Caveats• Uncertainty grows over time• Relevance to Water Resources Planningand Management: planning horizon• Assertion of Non-stationarity• Diversity in GCM and selection of GCM• RCM variance• Best can be wrong31
Approach• 30-year Historical Period (WY1972-2001)• Alternative Scenarios: Daily Min/Max Air TemperatureIncreased by+1° C+2° C+3° C+4° C• All other parameters: same for all simulations
Key FindingsApril Snow Water Equivalent decreases astemperatures increase
Key FindingsThe day in the water year when 50% of the annual inflow arrives inLake Oroville moves earlier in the year as air temperatures increase.
Key FindingsApril-July runoff decreases in all scenarios
Key Findings –increase in Q1, Q3, Q5 peak flows andevents > 99% percentile• Qx represents x days movingaverage of flows at OrovilleUpper Feather Basin PRMS Events Exceeding99th Percentile of Base Case300• 99% percentile means 99% ofthe values of the Base Caseare below this flow numberNumber of Events250200150100500Base Plus-1 Plus-2 Plus-3 Plus-4ScenarioQ1Q3Q5• Differences in trendsUpper Feather River Basin PRMS Peak Flows250000200000Flow in cfs15000010000050000Q1Q3Q50Base Plus-1 Plus-2 Plus-3 Plus-4Scenario
Snow Index: April 1 Snow Water Equivalent as % of Long Term April 1st SWEFeather Basin Snow IndicesFeather Basin Cumulative Snow IndicesSnow Index [% of April 1 mean]300250200150100500April 1 High Elevation IndexApril 1 Low Elevation IndexCumul. Snow Index Departure from Mean3002001000-100-200-300-400-500April 1 High Elevation IndexApril 1 Low Elevation IndexCumulative departure from 1930-80High index is mean of 12 snow courses between 5600' and 7300'Low index is mean of 10 snow courses between 4800' and 6200'1920 1940 1960 1980 2000 20201920 1940 1960 1980 2000 2020Reference: John Pierre Stevens (DWR)
www.climatechange.ca.govwww.water.ca.gov/climatechange/chung@water.ca.gov38