

Jammu & Kashmir - DISE
Jammu & Kashmir - DISE
Jammu & Kashmir - DISE
- No tags were found...

Create successful ePaper yourself
Turn your PDF publications into a flip-book with our unique Google optimized e-Paper software.
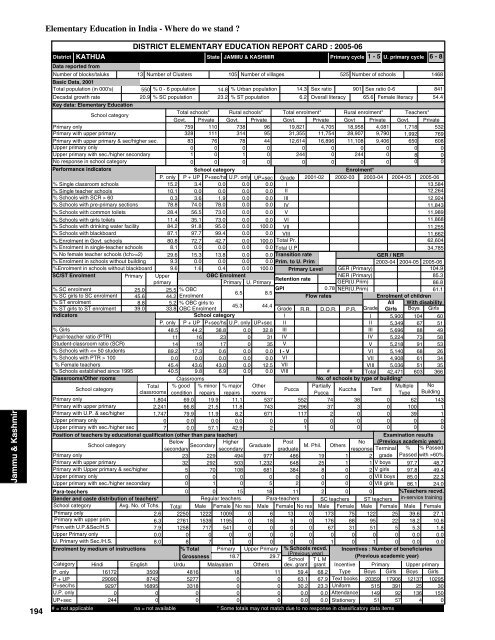
<strong>Jammu</strong> & <strong>Kashmir</strong>194Elementary Education in India - Where do we stand ?KATHUADistrictData reported fromNumber of blocks/taluksBasic Data, 2001Total population (in 000's)Decadal growth rateDISTRICT ELEMENTARY EDUCATION REPORT CARD : 2005-06StateJAMMU & KASHMIR13 Number of Clusters 105 Number of villages525 Number of schools1468550 % 0 - 6 population 14.8 % Urban population 14.3 Sex ratio 901 Sex ratio 0-684120.9 % SC population 23.2 % ST population6.2 Overall literacy 65.6 Female literacy 54.4Primary cycle 1 - 5 U. primary cycle 6 - 8Key data: Elementary EducationSchool categoryTotal schools* Rural schools* Total enrolment* Rural enrolment* Teachers*Govt. Private Govt. Private Govt. Private Govt Private Govt. PrivatePrimary only759 110 738 96 19,821 4,705 18,958 4,081 1,718 532Primary with upper primary328 111 314 95 31,355 11,754 28,907 9,790 1,992 769Primary with upper primary & sec/higher sec.83 76 78 44 12,614 16,896 11,108 9,406 650 608Upper primary only0 0 0 0 0 0 0 0 0 0Upper primary with sec./higher secondary1 0 1 0 244 0 244 0 8 0No response in school category0 0 0 0 0 0 0 0 0 0Performance indicatorsSchool categoryEnrolment*P. only P + UP P+sec/hs U.P. only UP+sec Grade 2001-02 2002-03 2003-04 2004-05 2005-06% Single classroom schools15.2 3.4 0.0 0.0 0.0 I13,584% Single teacher schools10.1 0.0 0.0 0.0 0.0 II12,264% Schools with SCR > 600.3 3.6 1.9 0.0 0.0 III12,924% Schools with pre-primary sections 78.8 74.0 78.0 0.0 0.0 IV11,843% Schools with common toilets 28.4 56.5 73.0 0.0 0.0 V11,989% Schools with girls toilets 11.4 35.1 73.0 0.0 0.0 VI11,868% Schools with drinking water facility 84.2 91.8 95.0 0.0 100.0 VII11,255% Schools with blackboard87.1 97.7 99.4 0.0 0.0 VIII 11,662% Enrolment in Govt. schools 80.8 72.7 42.7 0.0 100.0 Total Pr. 62,604% Enrolment in single-teacher schools8.1 0.0 0.0 0.0 0.0 Total U.P34,785% No female teacher schools (tch>=2) 29.6 15.3 13.8 0.0 0.0 Transition rateGER / NER% Enrolment in schools without building 9.3 0.0 0.0 0.0 0.0 Prim. to U. Prim2003-04 2004-05 2005-06%Enrolment in schools without blackboard 9.6 1.6 0.4 0.0 100.0 Primary Level GER (Primary)104.9SC/ST EnrolmentPrimary UpperOBC EnrolmentNER (Primary)85.3Retention rateprimaryPrimary U. PrimaryGER(U.Prim)86.8% SC enrolment25.0 25.5 % OBCGPI0.78 NER(U.Prim)61.16.5 8.5% SC girls to SC enrolment 45.6 44.2 EnrolmentFlow ratesEnrolment of children% ST enrolment8.8 5.2 % OBC girls toAll With disability45.3 44.4% ST girls to ST enrolment 39.0 33.8 OBC EnrolmentGrade R.R. D.O.R. P.R. Grade Girls Boys GirlsIndicatorsSchool categoryII 5,900 104 60P. only P + UP P+sec/hs U.P. only UP+sec IIII 5,349 67 51% Girls48.5 44.2 38.8 0.0 32.8 IIIIII 5,696 88 49Pupil-teacher ratio (PTR)11 16 23 0 31 IVIV 5,224 73 58Student-classroom ratio (SCR)14 19 17 0 35 VV 5,218 91 53% Schools with 1000.0 0.0 0.0 0.0 0.0 VIVII 4,908 61 34% Female teachers45.4 43.6 43.0 0.0 12.5 VIIVIII 5,036 51 35% Schools established since 199540.5 9.8 6.9 0.0 0.0 VIII# # Total 42,471 603 366Classrooms/Other roomsClassroomsNo. of schools by type of building*School categoryTotal % good % minor % major OtherPartiallyMultiple NoPuccaKuccha Tentclassrooms condition repairs repairs roomsPuccaType BuildingPrimary only1,804 69.0 19.9 11.1 537 552 74 38 0 62 143Primary with upper primary2,241 66.8 21.5 11.8 743 296 37 3 0 100 1Primary with U.P. & sec/higher1,747 79.9 11.9 8.2 671 117 2 0 0 39 1Upper primary only0 0.0 0.0 0.000 0 0 0 0 0Upper primary with sec./higher sec7 0.0 57.1 42.921 0 0 0 0 0Position of teachers by educational qualification (other than para teacher)Examination resultsSchool category BelowHigherPost(Previous academic year)M. Phil.secondarysecondarygraduateNoresponse Terminal % % Passed23 229 494 977 486 19 1 2 grade Passed with >60%V boysPrimary onlyPrimary with upper primaryPrimary with Upper primary & sec/higherUpper primary onlyUpper primary with sec./higher secondaryPara-teachersGender and caste distribution of teachers*School categoryAvg. No. of Tchs.Primary only2.6 2250 1222Primary with upper prim.6.3 2761 1539 1195 0 18Prim.with U.P.&Sec/H.S7.9 1258 717 541 0 0Upper Primary only0.0 0 0 0 0 0U. Primary with Sec./H.S.8.0 8 7 1 0 0Enrolment by medium of instructions% Total Primary Upper PrimaryGrossness 18.7 29.7Category Hindi English Urdu Malayalam OthersP. only16172350948161811P + UP290908742527700P+sec/hs929716895331800U.P. only00000UP+sec244000032 292 503 1,232 648 25 1 15 70 108 681 384 8 0 2 V girls0 0 0 0 0 0 0 0 VIII boys0 1 0 5 2 0 0 0 VIII girls0 0 15 18 11 2 0 0Regular teachers Para-teachers SC teachers ST teachersTotal Male Female No res Male Female No res Male Female Male Female1009 0 6 13 0 173 75 122 259000001766708831095510Male Female39.6 27.118.2 10.65.3 1.80.0 0.00 0 1 0 1 0 0.0 0.0% Schools recvd. Incentives : Number of beneficiaries(Previous year)(Previous academic year)School T L Mdev. grant grant Incentive Primary Upper primary59.4 68.2 Type Boys Girls Boys Girls63.1 67.9 Text books 20359 17906 12137 1029530.2 23.3 Uniform 515 391 25 300.0 0.0 Attendance 149 92 136 1500.0 0.0 Stationery 51 57 4 0# = not applicable na = not available * Some totals may not match due to no response in classificatory data items225097.7 48.797.8 49.485.0 22.386.1 24.0%Teachers recvd.in-service training


