

Download the PDF - Cambodia Property for Sale & Rent | Knight ...
Download the PDF - Cambodia Property for Sale & Rent | Knight ...
Download the PDF - Cambodia Property for Sale & Rent | Knight ...

You also want an ePaper? Increase the reach of your titles
YUMPU automatically turns print PDFs into web optimized ePapers that Google loves.
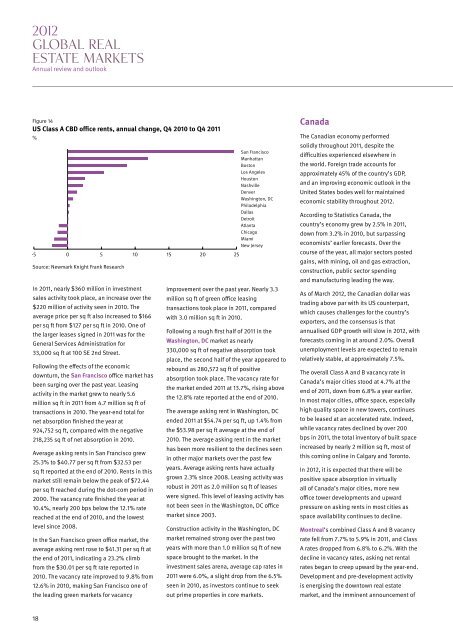
2012GLOBAL REALESTATE MARKETSAnnual review and outlookFigure 14US Class A CBD office rents, annual change, Q4 2010 to Q4 2011%San FranciscoManhattanBostonLos AngelesHoustonNashvilleDenverWashington, DCPhiladelphiaDallasDetroitAtlantaChicagoMiamiNew Jersey-5 0 5 10 15 20 25Source: Newmark <strong>Knight</strong> Frank ResearchIn 2011, nearly $360 million in investmentsales activity took place, an increase over <strong>the</strong>$220 million of activity seen in 2010. Theaverage price per sq ft also increased to $166per sq ft from $127 per sq ft in 2010. One of<strong>the</strong> larger leases signed in 2011 was <strong>for</strong> <strong>the</strong>General Services Administration <strong>for</strong>33,000 sq ft at 100 SE 2nd Street.Following <strong>the</strong> effects of <strong>the</strong> economicdownturn, <strong>the</strong> San Francisco office market hasbeen surging over <strong>the</strong> past year. Leasingactivity in <strong>the</strong> market grew to nearly 5.6million sq ft in 2011 from 4.7 million sq ft oftransactions in 2010. The year-end total <strong>for</strong>net absorption finished <strong>the</strong> year at924,752 sq ft, compared with <strong>the</strong> negative218,235 sq ft of net absorption in 2010.Average asking rents in San Francisco grew25.3% to $40.77 per sq ft from $32.53 persq ft reported at <strong>the</strong> end of 2010. <strong>Rent</strong>s in thismarket still remain below <strong>the</strong> peak of $72.44per sq ft reached during <strong>the</strong> dot-com period in2000. The vacancy rate finished <strong>the</strong> year at10.4%, nearly 200 bps below <strong>the</strong> 12.1% ratereached at <strong>the</strong> end of 2010, and <strong>the</strong> lowestlevel since 2008.In <strong>the</strong> San Francisco green office market, <strong>the</strong>average asking rent rose to $41.31 per sq ft at<strong>the</strong> end of 2011, indicating a 23.2% climbfrom <strong>the</strong> $30.01 per sq ft rate reported in2010. The vacancy rate improved to 9.8% from12.6% in 2010, making San Francisco one of<strong>the</strong> leading green markets <strong>for</strong> vacancyimprovement over <strong>the</strong> past year. Nearly 3.3million sq ft of green office leasingtransactions took place in 2011, comparedwith 3.0 million sq ft in 2010.Following a rough first half of 2011 in <strong>the</strong>Washington, DC market as nearly330,000 sq ft of negative absorption tookplace, <strong>the</strong> second half of <strong>the</strong> year appeared torebound as 280,572 sq ft of positiveabsorption took place. The vacancy rate <strong>for</strong><strong>the</strong> market ended 2011 at 13.7%, rising above<strong>the</strong> 12.8% rate reported at <strong>the</strong> end of 2010.The average asking rent in Washington, DCended 2011 at $54.74 per sq ft, up 1.4% from<strong>the</strong> $53.98 per sq ft average at <strong>the</strong> end of2010. The average asking rent in <strong>the</strong> markethas been more resilient to <strong>the</strong> declines seenin o<strong>the</strong>r major markets over <strong>the</strong> past fewyears. Average asking rents have actuallygrown 2.3% since 2008. Leasing activity wasrobust in 2011 as 2.0 million sq ft of leaseswere signed. This level of leasing activity hasnot been seen in <strong>the</strong> Washington, DC officemarket since 2003.Construction activity in <strong>the</strong> Washington, DCmarket remained strong over <strong>the</strong> past twoyears with more than 1.0 million sq ft of newspace brought to <strong>the</strong> market. In <strong>the</strong>investment sales arena, average cap rates in2011 were 6.0%, a slight drop from <strong>the</strong> 6.5%seen in 2010, as investors continue to seekout prime properties in core markets.CanadaThe Canadian economy per<strong>for</strong>medsolidly throughout 2011, despite <strong>the</strong>difficulties experienced elsewhere in<strong>the</strong> world. Foreign trade accounts <strong>for</strong>approximately 45% of <strong>the</strong> country’s GDP,and an improving economic outlook in <strong>the</strong>United States bodes well <strong>for</strong> maintainedeconomic stability throughout 2012.According to Statistics Canada, <strong>the</strong>country’s economy grew by 2.5% in 2011,down from 3.2% in 2010, but surpassingeconomists’ earlier <strong>for</strong>ecasts. Over <strong>the</strong>course of <strong>the</strong> year, all major sectors postedgains, with mining, oil and gas extraction,construction, public sector spendingand manufacturing leading <strong>the</strong> way.As of March 2012, <strong>the</strong> Canadian dollar wastrading above par with its US counterpart,which causes challenges <strong>for</strong> <strong>the</strong> country’sexporters, and <strong>the</strong> consensus is thatannualised GDP growth will slow in 2012, with<strong>for</strong>ecasts coming in at around 2.0%. Overallunemployment levels are expected to remainrelatively stable, at approximately 7.5%.The overall Class A and B vacancy rate inCanada’s major cities stood at 4.7% at <strong>the</strong>end of 2011, down from 6.8% a year earlier.In most major cities, office space, especiallyhigh quality space in new towers, continuesto be leased at an accelerated rate. Indeed,while vacancy rates declined by over 200bps in 2011, <strong>the</strong> total inventory of built spaceincreased by nearly 2 million sq ft, most ofthis coming online in Calgary and Toronto.In 2012, it is expected that <strong>the</strong>re will bepositive space absorption in virtuallyall of Canada’s major cities, more newoffice tower developments and upwardpressure on asking rents in most cities asspace availability continues to decline.Montreal’s combined Class A and B vacancyrate fell from 7.7% to 5.9% in 2011, and ClassA rates dropped from 6.8% to 6.2%. With <strong>the</strong>decline in vacancy rates, asking net rentalrates began to creep upward by <strong>the</strong> year-end.Development and pre-development activityis energising <strong>the</strong> downtown real estatemarket, and <strong>the</strong> imminent announcement of18