BRT Case Studies - Bus Rapid Transit Policy Center
BRT Case Studies - Bus Rapid Transit Policy Center
BRT Case Studies - Bus Rapid Transit Policy Center

You also want an ePaper? Increase the reach of your titles
YUMPU automatically turns print PDFs into web optimized ePapers that Google loves.
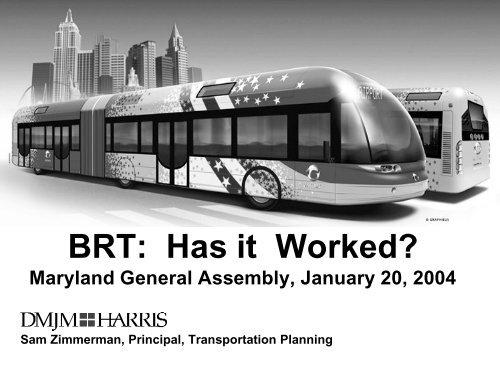
<strong>BRT</strong>: Has it Worked?Maryland General Assembly, January 20, 2004Sam Zimmerman, Principal, Transportation Planning
“<strong>Bus</strong> Mythology”• Speeds• Ridership attraction• Capacity• O/M Costs• Development effects2
Sources of Information• Transportation Research Board <strong>Transit</strong> CooperativeResearch Program Project: <strong>BRT</strong> Planning andImplementation Guidelines• Federal <strong>Transit</strong> Sponsored Before-After <strong>Studies</strong>• “<strong>Bus</strong> <strong>Rapid</strong> <strong>Transit</strong> Shows Promise,” U.S. GeneralAccounting Office, 9/20013
TRB <strong>BRT</strong> <strong>Case</strong> <strong>Studies</strong>Systems in Revenue ServiceU.S., Canada, Australia– Honolulu– Houston– Los Angeles– Miami-Dade– New York City– Pittsburgh– Seattle– Ottawa– Vancouver– Adelaide– BrisbaneEurope– Rouen, France– Leeds, U.K.– Runcorn, U.K.South America– Bogota– Quito– Belo Horizonte– Curitiba– Porto Alegre– Sao Paulo5
<strong>BRT</strong> <strong>Case</strong> <strong>Studies</strong>Projects in Development– Cleveland– Hartford– Eugene-Springfield– Charlotte– Boston (Now Open)– Sydney, Australia (Now Open)6
<strong>BRT</strong> Service• Fast• Reliable7
Reported Travel Time Savings• Compared to Local <strong>Bus</strong><strong>Bus</strong>ways andFreeway <strong>Bus</strong> Lanes32 – 47%Arterial Street<strong>Bus</strong>ways / <strong>Bus</strong>Lanes29 – 32 %8
Competitive Speeds *Los AngelesSan JoseSan DiegoDenverPittsburghLRT2316211114<strong>BRT</strong>17**32243529* “<strong>Bus</strong> <strong>Rapid</strong> <strong>Transit</strong> Shows Promise,” U.S. General Accounting Office, 9/2001** All mixed traffic operation9
Ridership• Attractive to customers withchoices10
Net Corridor Ridership GainsSystemLAMiamiRidership Gain+35% (3 Yrs, Strike)+70% (6 Yrs.)From Cars30%Brisbane+60% (18 months)30%Vancouver, BC+30% (2 Yr., strike)20%Boston+100% (15 months)Oakland+29% (2 months)11
Characteristics of Customers:Houston <strong>Transit</strong>way System*% Riders,HouseholdIncomes >$50,000/Yr% Riders,HouseholdIncomes>$75,000/Yr%Riders,Households with > 2Vehicles<strong>BRT</strong> Services(Park/Ride)70%50%61%Local <strong>Bus</strong>11%-16%Houston Metro, 2001 On-Board Survey12
Development Effects• Attractive to Developers andOwners• Attractive to Market13
Land Development BenefitsPittsburgh$375 M in development around stations, 80’s throughmid – 1990’sOttawa$1B (CDN) in development around stations, 80’sthrough mid – 1990’sBrisbane20% increase in residential values near stations afterone yearBoston$500m in development and redevelopment sinceconstruction began14
Boston MBTA: Silver Line, Phase IMixed Use Development15
Boston MBTA: Silver Line, Phase IIOffices, Hotel Residential16
Ottawa <strong>Transit</strong>waysSt. Laurent Mall: Highest Grossing(per Sq. Ft) In Ottawa17
Ottawa <strong>Transit</strong>waysMixed Use18
“Brisbane Courier Mail,” 1/26/0219
Brisbane: SE <strong>Bus</strong>wayOffice, Retail20
Carrying Capacity• Not a Problem21
Capacity to Meet Highest U.S. DemandsSystem<strong>BRT</strong>Rail <strong>Transit</strong>Pittsburgh MLKOttawaBrisbaneBogotaCalgary LRTLineSeattle Downtown <strong>Bus</strong> TunnelToronto King Street StreetcarBoston Green Line, Park St.TunnelWashington Blue/Orange LineMetrorail Tunnel* Highest in*HighestU.S. outsidein U.S.NYCPeak Direction PeakHour Volume5,40010,0004,2007,000+25,000+10,0004,50010,000*17,500*22
Operating and Maintenance Costs• Modest at U.S. Volumes– High speed operation– Large vehicles– Low maintenance costs of all kinds– Economies of scale– Amenable to competitive contracting• Competitive with other <strong>Rapid</strong> <strong>Transit</strong> Modes23
Operating, Maintenance Costs*per Equivalent LRT Vehicle HourSan JosePortlandDallasLos AngelesSacramentoSan DiegoLRT$217.69$143.17$214.90$313.20$177.23$ 97.62<strong>BRT</strong>$233.61$141.60$170.89$172.40$161.62$108.00*Source: FTA, National <strong>Transit</strong> Database, 2000<strong>Bus</strong> costs are regional averages and include only vehicleO/M and Admin.; LRT numbers cover all O/M activitiesFigures adjusted for vehicle capacity24= Av. # seats+ standees @ 3/Mtr2
Total Operating, Maintenance CostsPittsburgh (Port Authority of Alleghany County)*$/Rev.Veh.MiRev.Veh.Mi.$/Rev.Veh.HrRev.Veh.Hr.$/Pass.-Mi.$/BrdngPAT West<strong>Bus</strong>way$ 6.40$81.90$ 0.65$ 2.73PAT LRT$ 15.25$222.37$ 0.84$ 3.78* FTA Evaluation of Port Authority of Alleghany CountyWest <strong>Bus</strong>way <strong>Bus</strong> <strong>Rapid</strong> <strong>Transit</strong> Project, 4-200325
Modest Implementation Costs• Limited dedicated ROW needed• Maximum use of:– existing street/highway/HOV system,O/M facilities– current and/or off-thethe-shelf equipmentand systems• Running ways inexpensive to build• Maximum use of local contractors• Relatively low cost vehicles26
Modest Implementation Costs*LRT(18 corridors, 13 cities) $34.79m/Mi.***<strong>Bus</strong>ways(9 corridors, 4 cities) $13.49m/Mi.*HOV Facilities (8(8 corridors, 5 cities) $ 8.97m/Mi.*Arterial <strong>Bus</strong> Fclts. . (3(Cors., 2 cities) $ .68m/Mi.Rouen TEOR (3 corridors)Brisbane SE <strong>Bus</strong>waySilver Line Phase I$11.00m/Mi.**$19.00m/Mi.$25.00m/Mi.***U.S. General Accounting Office Report, “<strong>Bus</strong> <strong>Rapid</strong> <strong>Transit</strong> Shows Promise,” 9/2001; Year 2000 $ U.S.**Includes Vehicles27
Lessons Learned• <strong>BRT</strong> is a high quality, highperformance rapid transit option• Plan for <strong>BRT</strong> as for any potentiallycost-effective rapid transit mode28
Lessons Learned• Use an open, objective process• Start with nature of issues andproblems• Objectively evaluate alternativesolutions, including <strong>BRT</strong>29
FY2004 Approps. Conference Report“... the alternatives analysis made byapplicants must fully weigh viablealternatives and ensure thatquantitative measures are used inchoosing the locally preferredalternative.”30