Food Security Atlas Of RURAL MAHARASHTRA - WFP Remote ...
Food Security Atlas Of RURAL MAHARASHTRA - WFP Remote ...
Food Security Atlas Of RURAL MAHARASHTRA - WFP Remote ...
You also want an ePaper? Increase the reach of your titles
YUMPU automatically turns print PDFs into web optimized ePapers that Google loves.
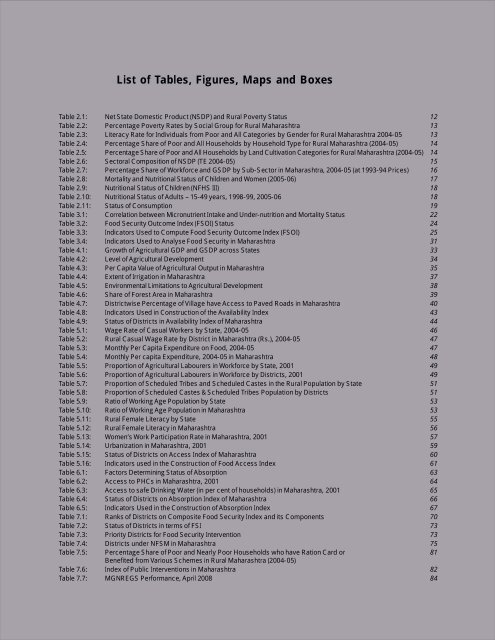
List of Tables, Figures, Maps and BoxesTable 2.1: Net State Domestic Product (NSDP) and Rural Poverty Status 12Table 2.2: Percentage Poverty Rates by Social Group for Rural Maharashtra 13Table 2.3: Literacy Rate for Individuals from Poor and All Categories by Gender for Rural Maharashtra 2004-05 13Table 2.4: Percentage Share of Poor and All Households by Household Type for Rural Maharashtra (2004-05) 14Table 2.5: Percentage Share of Poor and All Households by Land Cultivation Categories for Rural Maharashtra (2004-05) 14Table 2.6: Sectoral Composition of NSDP (TE 2004-05) 15Table 2.7: Percentage Share of Workforce and GSDP by Sub-Sector in Maharashtra, 2004-05 (at 1993-94 Prices) 16Table 2.8: Mortality and Nutritional Status of Children and Women (2005-06) 17Table 2.9: Nutritional Status of Children (NFHS III) 18Table 2.10: Nutritional Status of Adults – 15-49 years, 1998-99, 2005-06 18Table 2.11: Status of Consumption 19Table 3.1: Correlation between Micronutrient Intake and Under-nutrition and Mortality Status 22Table 3.2: <strong>Food</strong> <strong>Security</strong> Outcome Index (FSOI) Status 24Table 3.3: Indicators Used to Compute <strong>Food</strong> <strong>Security</strong> Outcome Index (FSOI) 25Table 3.4: Indicators Used to Analyse <strong>Food</strong> <strong>Security</strong> in Maharashtra 31Table 4.1: Growth of Agricultural GDP and GSDP across States 33Table 4.2: Level of Agricultural Development 34Table 4.3: Per Capita Value of Agricultural Output in Maharashtra 35Table 4.4: Extent of Irrigation in Maharashtra 37Table 4.5: Environmental Limitations to Agricultural Development 38Table 4.6: Share of Forest Area in Maharashtra 39Table 4.7: Districtwise Percentage of Village have Access to Paved Roads in Maharashtra 40Table 4.8: Indicators Used in Construction of the Availability Index 43Table 4.9: Status of Districts in Availability Index of Maharashtra 44Table 5.1: Wage Rate of Casual Workers by State, 2004-05 46Table 5.2: Rural Casual Wage Rate by District in Maharashtra (Rs.), 2004-05 47Table 5.3: Monthly Per Capita Expenditure on <strong>Food</strong>, 2004-05 47Table 5.4: Monthly Per capita Expenditure, 2004-05 in Maharashtra 48Table 5.5: Proportion of Agricultural Labourers in Workforce by State, 2001 49Table 5.6: Proportion of Agricultural Labourers in Workforce by Districts, 2001 49Table 5.7: Proportion of Scheduled Tribes and Scheduled Castes in the Rural Population by State 51Table 5.8: Proportion of Scheduled Castes & Scheduled Tribes Population by Districts 51Table 5.9: Ratio of Working Age Population by State 53Table 5.10: Ratio of Working Age Population in Maharashtra 53Table 5.11: Rural Female Literacy by State 55Table 5.12: Rural Female Literacy in Maharashtra 56Table 5.13: Women’s Work Participation Rate in Maharashtra, 2001 57Table 5.14: Urbanization in Maharashtra, 2001 59Table 5.15: Status of Districts on Access Index of Maharashtra 60Table 5.16: Indicators used in the Construction of <strong>Food</strong> Access Index 61Table 6.1: Factors Determining Status of Absorption 63Table 6.2: Access to PHCs in Maharashtra, 2001 64Table 6.3: Access to safe Drinking Water (in per cent of households) in Maharashtra, 2001 65Table 6.4: Status of Districts on Absorption Index of Maharashtra 66Table 6.5: Indicators Used in the Construction of Absorption Index 67Table 7.1: Ranks of Districts on Composite <strong>Food</strong> <strong>Security</strong> Index and its Components 70Table 7.2: Status of Districts in terms of FSI 73Table 7.3: Priority Districts for <strong>Food</strong> <strong>Security</strong> Intervention 73Table 7.4: Districts under NFSM in Maharashtra 75Table 7.5: Percentage Share of Poor and Nearly Poor Households who have Ration Card or 81Benefited from Various Schemes in Rural Maharashtra (2004-05)Table 7.6: Index of Public Interventions in Maharashtra 82Table 7.7: MGNREGS Performance, April 2008 84xiii


