Standard Reference Material 2881 - National Institute of Standards ...
Standard Reference Material 2881 - National Institute of Standards ...
Standard Reference Material 2881 - National Institute of Standards ...
Create successful ePaper yourself
Turn your PDF publications into a flip-book with our unique Google optimized e-Paper software.
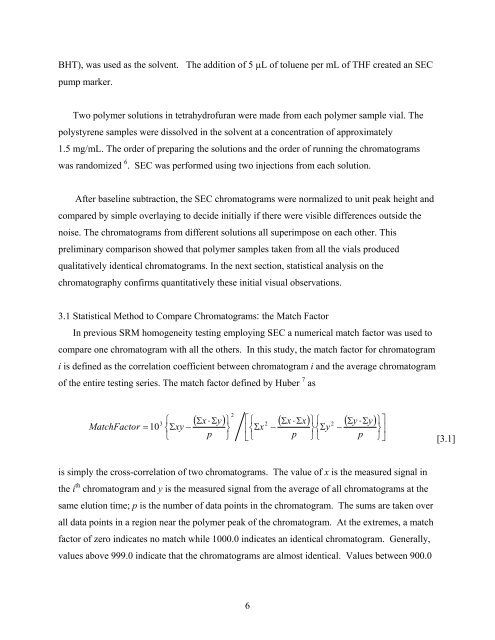
BHT), was used as the solvent. The addition <strong>of</strong> 5 μL <strong>of</strong> toluene per mL <strong>of</strong> THF created an SECpump marker.Two polymer solutions in tetrahydr<strong>of</strong>uran were made from each polymer sample vial. Thepolystyrene samples were dissolved in the solvent at a concentration <strong>of</strong> approximately1.5 mg/mL. The order <strong>of</strong> preparing the solutions and the order <strong>of</strong> running the chromatogramswas randomized 6 . SEC was performed using two injections from each solution.After baseline subtraction, the SEC chromatograms were normalized to unit peak height andcompared by simple overlaying to decide initially if there were visible differences outside thenoise. The chromatograms from different solutions all superimpose on each other. Thispreliminary comparison showed that polymer samples taken from all the vials producedqualitatively identical chromatograms. In the next section, statistical analysis on thechromatography confirms quantitatively these initial visual observations.3.1 Statistical Method to Compare Chromatograms: the Match FactorIn previous SRM homogeneity testing employing SEC a numerical match factor was used tocompare one chromatogram with all the others. In this study, the match factor for chromatogrami is defined as the correlation coefficient between chromatogram i and the average chromatogram<strong>of</strong> the entire testing series. The match factor defined by Huber 7 asMatchFactor = 103⎧⎨Σxy−⎩2( Σx⋅ Σy) ⎫ ⎡⎧( Σx⋅Σx) ⎫⎧( Σy⋅Σy) ⎫⎤⎥⎦p⎬⎭⎢⎨Σx⎣⎩2−p⎬⎨Σy⎭⎩2−p⎬⎭[3.1]is simply the cross-correlation <strong>of</strong> two chromatograms. The value <strong>of</strong> x is the measured signal inthe i th chromatogram and y is the measured signal from the average <strong>of</strong> all chromatograms at thesame elution time; p is the number <strong>of</strong> data points in the chromatogram. The sums are taken overall data points in a region near the polymer peak <strong>of</strong> the chromatogram. At the extremes, a matchfactor <strong>of</strong> zero indicates no match while 1000.0 indicates an identical chromatogram. Generally,values above 999.0 indicate that the chromatograms are almost identical. Values between 900.06


