Failures in Addressing DMC in Connecticut's Juvenile Justice System
Failures in Addressing DMC in Connecticut's Juvenile Justice System
Failures in Addressing DMC in Connecticut's Juvenile Justice System

Create successful ePaper yourself
Turn your PDF publications into a flip-book with our unique Google optimized e-Paper software.
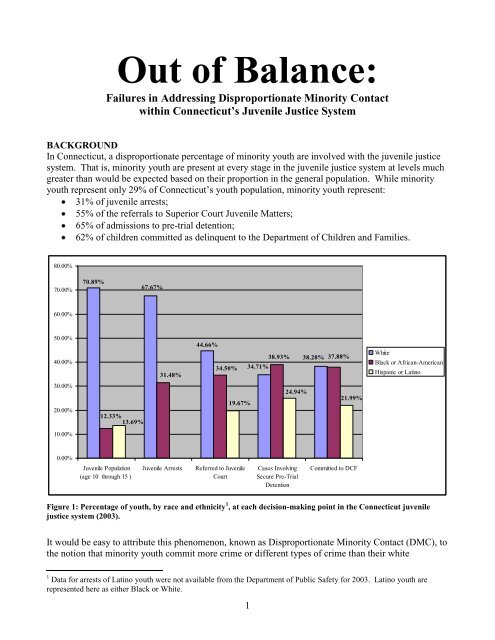
Out of Balance:<strong>Failures</strong> <strong>in</strong> Address<strong>in</strong>g Disproportionate M<strong>in</strong>ority Contactwith<strong>in</strong> Connecticut’s <strong>Juvenile</strong> <strong>Justice</strong> <strong>System</strong>BACKGROUNDIn Connecticut, a disproportionate percentage of m<strong>in</strong>ority youth are <strong>in</strong>volved with the juvenile justicesystem. That is, m<strong>in</strong>ority youth are present at every stage <strong>in</strong> the juvenile justice system at levels muchgreater than would be expected based on their proportion <strong>in</strong> the general population. While m<strong>in</strong>orityyouth represent only 29% of Connecticut’s youth population, m<strong>in</strong>ority youth represent:31% of juvenile arrests;55% of the referrals to Superior Court <strong>Juvenile</strong> Matters;65% of admissions to pre-trial detention;62% of children committed as del<strong>in</strong>quent to the Department of Children and Families.80.00%70.00%70.89%67.67%60.00%50.00%40.00%31.48%44.66%34.50%38.93% 38.28% 37.88%34.71%WhiteBlack or African-AmericanHispanic or Lat<strong>in</strong>o30.00%20.00%12.33%13.69%19.67%24.94%21.99%10.00%0.00%<strong>Juvenile</strong> Population(age 10 through 15 )<strong>Juvenile</strong> ArrestsReferred to <strong>Juvenile</strong>CourtCases Involv<strong>in</strong>gSecure Pre-TrialDetentionCommitted to DCFFigure 1: Percentage of youth, by race and ethnicity 1 , at each decision-mak<strong>in</strong>g po<strong>in</strong>t <strong>in</strong> the Connecticut juvenilejustice system (2003).It would be easy to attribute this phenomenon, known as Disproportionate M<strong>in</strong>ority Contact (<strong>DMC</strong>), tothe notion that m<strong>in</strong>ority youth commit more crime or different types of crime than their white1 Data for arrests of Lat<strong>in</strong>o youth were not available from the Department of Public Safety for 2003. Lat<strong>in</strong>o youth arerepresented here as either Black or White.1
counterparts. However, research conducted across the United States, has found that the extent ofm<strong>in</strong>ority overrepresentation cannot be expla<strong>in</strong>ed by differences <strong>in</strong> del<strong>in</strong>quent behavior acrossracial/ethnic groups.The Connecticut <strong>Juvenile</strong> <strong>Justice</strong> Alliance has prepared this report <strong>in</strong> an effort to better understand theextent of <strong>DMC</strong> <strong>in</strong> Connecticut and to recommend next steps for reduc<strong>in</strong>g it <strong>in</strong> our state. Data wasrequested from the Federal Office of <strong>Juvenile</strong> <strong>Justice</strong> and Del<strong>in</strong>quency Prevention (OJJDP), theConnecticut Department of Public Safety, and the Court Support Services Division (CSSD) of theJudicial Branch <strong>in</strong> order to calculate the extent to which m<strong>in</strong>ority youth are overrepresented at everydecision-mak<strong>in</strong>g po<strong>in</strong>t <strong>in</strong> the juvenile justice system. The data <strong>in</strong> this report represents the system as itwas <strong>in</strong> the year 2003, the last year for which complete data is available from all data sources.Federal mandate to Address Disproportionate M<strong>in</strong>ority ContactStates have been required to address <strong>DMC</strong> s<strong>in</strong>ce 1988. In the 1988 Amendments to the <strong>Juvenile</strong><strong>Justice</strong> and Del<strong>in</strong>quency Prevention Act (JJDPA) of 1974, Congress required that states address <strong>DMC</strong><strong>in</strong> their juvenile justice plans. Specifically, the JJDPA requires that each state address efforts to reducethe proportion of m<strong>in</strong>ority youth deta<strong>in</strong>ed or conf<strong>in</strong>ed <strong>in</strong> secure detention facilities, secure correctionalfacilities, jails and lockups if the proportion of m<strong>in</strong>ority youth exceeds the proportion of such youth <strong>in</strong>the general population.In 1992, the requirement that states address <strong>DMC</strong> was elevated to a core requirement of the JJDPA,with federal juvenile justice fund<strong>in</strong>g eligibility tied to compliance. S<strong>in</strong>ce the addition of <strong>DMC</strong> as acore requirement of the JJDPA, OJJDP has offered numerous tra<strong>in</strong><strong>in</strong>g and technical assistance<strong>in</strong>itiatives for states around this issue.In 2002, Congress reauthorized the JJDPA and modified the <strong>DMC</strong> language to broaden the scope ofthe <strong>DMC</strong> <strong>in</strong>itiative. The changes enacted <strong>in</strong> 2002 changed the focus of the core requirement fromreduction <strong>in</strong> disproportionate m<strong>in</strong>ority “conf<strong>in</strong>ement” to disproportionate m<strong>in</strong>ority “contact.” The newfocus requires an exam<strong>in</strong>ation of all decision-mak<strong>in</strong>g po<strong>in</strong>ts of contact along the cont<strong>in</strong>uum of thejuvenile justice system.Past Efforts to Address <strong>DMC</strong> <strong>in</strong> ConnecticutLike other states, Connecticut has been required to assess and address Disproportionate M<strong>in</strong>orityContact <strong>in</strong> the juvenile justice system s<strong>in</strong>ce 1988. The pr<strong>in</strong>cipal responsibility to meet this mandatelies with the state’s <strong>Juvenile</strong> <strong>Justice</strong> Advisory Committee (JJAC), which is housed with<strong>in</strong> the Office ofPolicy and Management. In 1995 and aga<strong>in</strong> <strong>in</strong> 2001, the JJAC released assessments exam<strong>in</strong><strong>in</strong>g theextent of <strong>DMC</strong> <strong>in</strong> Connecticut’s juvenile justice system. Each of these reports <strong>in</strong>cludedrecommendations for local police, the Court Support Services Division of the Judicial Branch and theDepartment of Children and Families. Neither <strong>in</strong>cluded timel<strong>in</strong>es nor required report<strong>in</strong>g. As a result,it is unclear to what extent these recommendations have been carried out.In 2000, the Connecticut General Assembly created a 21-member Commission on Racial and EthnicDisparity <strong>in</strong> the Crim<strong>in</strong>al <strong>Justice</strong> <strong>System</strong>. The Commission is charged with creat<strong>in</strong>g a plan thatspecifically focuses on reduc<strong>in</strong>g <strong>DMC</strong> <strong>in</strong> the juvenile justice system and recommends steps for theimplementation of measures to address <strong>DMC</strong>. The most recent plan developed by the Commission(2004) <strong>in</strong>cludes recommendations for address<strong>in</strong>g <strong>DMC</strong>, but aga<strong>in</strong>, no timel<strong>in</strong>e or method of2
accountability was built <strong>in</strong>to the plan, and it is unclear to what extent any of the recommendations havebeen implemented.While both the JJAC and the Commission on Racial and Ethnic Disparities have maderecommendations <strong>in</strong>tended to reduce <strong>DMC</strong>, little progress has been made <strong>in</strong> achiev<strong>in</strong>g racial balance <strong>in</strong>our juvenile justice system. Nearly twenty years after Congress first required states to address <strong>DMC</strong>,Connecticut has made no significant systemic changes to address this problem. To date, no significantlegislation has been passed, no pilot programs have been developed and no comprehensive review ofdecision-mak<strong>in</strong>g <strong>in</strong> the juvenile justice system has been conducted.EXTENT OF <strong>DMC</strong> IN CONNECTICUT’S JUVENILE JUSTICE SYSTEMBecause compar<strong>in</strong>g states of vary<strong>in</strong>g populations and racial/ethnic composition can prove difficult,OJJDP suggests a common measure of disproportionality called the Relative Rate Index (RRI). TheRRI is a calculation that puts a value on the extent of <strong>DMC</strong> and allows for comparisons over time andacross jurisdictions. The follow<strong>in</strong>g calculation is required to determ<strong>in</strong>e the RRI for a m<strong>in</strong>oritypopulation at any decision-mak<strong>in</strong>g po<strong>in</strong>t <strong>in</strong> the juvenile justice system:Number of m<strong>in</strong>orityNumber of m<strong>in</strong>orityyouth at decision-youth <strong>in</strong> the general youth at decisionmak<strong>in</strong>gpo<strong>in</strong>t mak<strong>in</strong>g po<strong>in</strong>t ÷ population÷÷Number of WhiteNumber of Whiteyouth <strong>in</strong> the generalpopulation= RRIAn RRI greater than 1.0 means that the m<strong>in</strong>ority youth population be<strong>in</strong>g exam<strong>in</strong>ed is overrepresentedat the decision-mak<strong>in</strong>g po<strong>in</strong>t. For example, an RRI of 4.44 for African-American youth at the po<strong>in</strong>t ofcourt referral means that African-American youth are 4.44 times more likely to be referred to juvenilecourt than their White counterparts.Connecticut’s rate of <strong>DMC</strong> is one of the worst <strong>in</strong> the United States. Human Rights Watch and thefederal Office of <strong>Juvenile</strong> <strong>Justice</strong> and Del<strong>in</strong>quency Prevention consistently rank Connecticut amongthe worst states <strong>in</strong> terms of the disproportionate number of m<strong>in</strong>ority youth who enter and progressthrough the juvenile justice system.In order to address this problem, it is imperative to quantify the extent of <strong>DMC</strong> for the variousracial/ethnic groups at every decision-mak<strong>in</strong>g po<strong>in</strong>t <strong>in</strong> the juvenile justice system. Specifically, it ishelpful to know the number of juveniles, by race and ethnicity, at every one of the follow<strong>in</strong>g po<strong>in</strong>ts:1. General Population – the number of 10 to 15 year olds resid<strong>in</strong>g <strong>in</strong> Connecticut;2. <strong>Juvenile</strong> Arrests – the number of arrests of children and youth, age 15 and under;3. Referrals to <strong>Juvenile</strong> Court – the number of children and youth referred to Superior Court<strong>Juvenile</strong> Matters for del<strong>in</strong>quency;4. Cases Diverted – the number of cases diverted from the court process by a community-based<strong>in</strong>tervention;5. Cases Involv<strong>in</strong>g Secure Detention – the number of cases <strong>in</strong>volv<strong>in</strong>g pre-trial juvenile detention;6. Cases Petitioned – the number of cases handled judicially by the Superior Court <strong>Juvenile</strong>Matters;7. Cases Result<strong>in</strong>g <strong>in</strong> Del<strong>in</strong>quent F<strong>in</strong>d<strong>in</strong>gs – the number of cases where the juvenile is found to bedel<strong>in</strong>quent;3
8. Cases Result<strong>in</strong>g <strong>in</strong> Conf<strong>in</strong>ement/Commitment – the number of cases where the juvenile is founddel<strong>in</strong>quent and committed to the custody of the Department of Children and Families;9. Cases Transferred to Adult Court – the number of cases where the juvenile is transferred fortrial <strong>in</strong> the adult crim<strong>in</strong>al court.2003 Connecticut RRI OverviewRelative Rate Index Compared with White<strong>Juvenile</strong>sReport<strong>in</strong>g Period Jan / 2003State : Connecticut through Dec / 2003County: All CountiesBlack orAfrican-AmericanNativeHawaiianor otherPacificIslandersAmericanIndian orAlaskaNativeHispanicor Lat<strong>in</strong>o AsianOther/Mixed2. <strong>Juvenile</strong> Arrests 2.67 --- 0.28 --- 0.41 --- 1.163. Refer to <strong>Juvenile</strong> Court 4.44 2.28 0.24 --- 0.03 --- 3.024. Cases Diverted 2 --- --- --- --- --- --- ---AllM<strong>in</strong>orities5. Cases Involv<strong>in</strong>g SecureDetention1.45 1.63 1.89 --- --- 1.39 1.526. Cases Petitioned 1.11 1.14 1.11 --- --- 1.14 1.127. Cases Result<strong>in</strong>g <strong>in</strong>Del<strong>in</strong>quent F<strong>in</strong>d<strong>in</strong>gs0.98 1.03 1.27 --- --- 1.10 1.018. Cases result<strong>in</strong>g <strong>in</strong>Probation Placement0.93 0.95 0.97 --- --- 0.72 0.939. Cases Result<strong>in</strong>g <strong>in</strong>Conf<strong>in</strong>ement <strong>in</strong> Secure<strong>Juvenile</strong> Correctional1.17 1.11 1.03 --- --- 1.67 1.15Facilities10. Cases Transferred to3Adult Court--- --- --- --- --- --- ---Group meets 1% threshold? Yes Yes Yes No No NoStatewide data on diversion of juveniles from Superior Court <strong>Juvenile</strong> Matters are not readilyavailable. As will be discussed <strong>in</strong> the recommendations section, collect<strong>in</strong>g diversion program data byrace, ethnicity and offense type would help to determ<strong>in</strong>e the extent of disparate treatment of m<strong>in</strong>orityyouth between the po<strong>in</strong>t of arrest and referral to juvenile court.Us<strong>in</strong>g the RRI formula, the follow<strong>in</strong>g can be said about Disproportionate M<strong>in</strong>ority Contact <strong>in</strong>Connecticut’s juvenile justice system:African-American juveniles are 2.67 times more likely to be arrested than their Whitecounterparts;2 Cases diversion data is not available on a state-wide basis by race and ethnicity. While some of this data is collectedlocally by Youth Service Bureaus, aggregate data is not readily available.3 Data for juveniles transferred to adult court by race and ethnicity was not available for 2003.4
M<strong>in</strong>ority juveniles are 3.02 times more likely to be referred to juvenile court than their Whitecounterparts. The extent of this disparity is much greater for African-American juveniles thanfor Lat<strong>in</strong>os (RRI of 4.44 for African-Americans compared to RRI of 2.28 for Lat<strong>in</strong>os);Once referred to juvenile court, m<strong>in</strong>ority youth are 1.52 times more likely to be placed <strong>in</strong> pretrialdetention than their White counterparts who are referred to court;M<strong>in</strong>ority youth referred to court are just as likely as their White counterparts to have their caseshandled judicially, to be found del<strong>in</strong>quent and to be committed as del<strong>in</strong>quent to the Departmentof Children and Families.The RRI overview po<strong>in</strong>ts to juvenile arrests, referrals to Superior Court <strong>Juvenile</strong> Matters andplacement <strong>in</strong> secure pre-trial detention as areas of concern regard<strong>in</strong>g <strong>DMC</strong>. These three decisionmak<strong>in</strong>gpo<strong>in</strong>ts should be the focus of future work <strong>in</strong> this area.Comparison of 2003 Data to 1998 Data1998 4 2003WhiteBlack orAfrican-AmericanHispanicor Lat<strong>in</strong>o Asian WhiteBlack orAfrican-AmericanHispanicor Lat<strong>in</strong>oAsianConnecticutPopulation % 74.92% 11.15% 11.07% 2.66% 71.11% 12.37% 13.73% 2.79%10-15 Years Old N 231,156 34,398 34,153 8,208 211,284 36,760 40,806 8,291Referred to <strong>Juvenile</strong> DRI 0.66 2.52 1.85 0.19 0.63 2.81 1.44 0.15Court % 49.26% 28.07% 20.52% 0.50% 45.00% 34.76% 19.82% 0.43%N 5,719 3,259 2,382 58 7,103 5,487 3,128 68Cases Involv<strong>in</strong>gSecure Detention DRI 0.37 3.91 2.47 0.05 0.49 3.17 1.83 0.23% 27.99% 43.64% 27.35% 0.13% 34.99% 39.24% 25.14% 0.63%N 220 343 215 1 1,052 1,180 756 19Cases Result<strong>in</strong>g <strong>in</strong>Commitment to DRI 0.38 3.32 3.04 0.18 0.55 3.10 1.62 0.19DCF % 28.29% 37.07% 33.66% 0.49% 38.79% 38.39% 22.28% 0.54%N 58 76 69 1 289 286 166 4Prior to the advent of the RRI as a generally accepted tool for measur<strong>in</strong>g <strong>DMC</strong>, most states used amethod called the Disproportionality Rate Index (DRI). While this measure can prove biased whencompar<strong>in</strong>g jurisdictions to each other, it is presented here as a basis for gaug<strong>in</strong>g Connecticut’s progress<strong>in</strong> address<strong>in</strong>g <strong>DMC</strong> s<strong>in</strong>ce 1998. As was the case <strong>in</strong> 1998, m<strong>in</strong>ority children and juveniles <strong>in</strong>Connecticut are still two to three times more likely than their White counterparts to be referred to4 1998 DRI data is made available here from the Reassessment of M<strong>in</strong>ority Overrepresentation 2001 report, commonlyknown as the Spectrum Associates report. The Spectrum Associates report, however, used a population of 10-16 years ofage and their referral statistics were based on “<strong>in</strong>stant offense.” The “<strong>in</strong>stant offense” is def<strong>in</strong>ed as the juvenile’s last casedisposed <strong>in</strong> the study year. The data provided to the Connecticut <strong>Juvenile</strong> <strong>Justice</strong> Alliance by the Court Support ServicesDivision of the Judicial Branch, however, <strong>in</strong>cludes all offenses <strong>in</strong> the calendar year.5
juvenile court, placed <strong>in</strong> secure pre-trial detention and committed as del<strong>in</strong>quent to the Department ofChildren and Families.AREAS OF CONCERNArrestThe Connecticut <strong>Juvenile</strong> <strong>Justice</strong> Alliance requested juvenile arrest data, by race and offense type,from the Connecticut Department of Public Safety (DPS). DPS, <strong>in</strong> turn, requested assistance with thisrequest from the Programs Support Section of the Federal Bureau of Investigation. Data was providedto the Alliance represent<strong>in</strong>g juvenile arrests, by race and offense type, for the year 2003. Race data isonly available for the categories “White” or “Black,” which makes determ<strong>in</strong><strong>in</strong>g the arrest patterns ofLat<strong>in</strong>o youth impossible to analyze on a statewide basis.The arrest data furnish the number of arrests for Part I offenses, <strong>in</strong>clud<strong>in</strong>g:murder and non-negligent manslaughter;forcible rape;robbery;aggravated assault;burglary;larceny-theft;motor vehicle theft; andarson.The Unified Crime Report (UCR) Part I offenses are categorized as Violent Crime Index offenses andProperty Crime Index offenses. The violent crime <strong>in</strong>dex is comprised of: murder and non-negligenthomicide, forcible rape, robbery, and aggravated assault. The property crime <strong>in</strong>dex is comprised of:burglary, larceny-theft, motor vehicle theft and arson.The Federal Bureau of Investigations also provided data for Part II offenses, which are the 21additional offense types for which the UCR Program collects data nationally.6
court. It must be reiterated that, accord<strong>in</strong>g to the <strong>in</strong>formation <strong>in</strong> Figure 2, the larger number ofreferrals of African-American youth to court can NOT be expla<strong>in</strong>ed by a higher rate of more serious orviolent crimes by those youth.80.00%70.00%70.89%67.67%60.00%50.00%44.66%40.00%30.00%31.48%34.50%White YouthAfrican-American Youth20.00%12.33%10.00%0.00%<strong>Juvenile</strong> Population(age 10 through 15 )<strong>Juvenile</strong> ArrestsReferrals to <strong>Juvenile</strong>CourtFigure 3: Overrepresentation of African-American Youth <strong>in</strong> referrals to <strong>Connecticut's</strong> Superior Court <strong>Juvenile</strong>Matters (2003).DetentionIn addition to be<strong>in</strong>g overrepresented at the po<strong>in</strong>ts of arrest and court referral, m<strong>in</strong>ority youth are alsooverrepresented <strong>in</strong> pre-trial juvenile detention. While m<strong>in</strong>ority youth represent only 29% of thepopulation of 10- to 15-year-olds <strong>in</strong> Connecticut, they represent 65% of admissions to juveniledetention. A comparison to similar data from 1998 shows the extent of this overrepresentation <strong>in</strong>Connecticut, while still one of the largest <strong>in</strong> the country, improved somewhat from 1998 to 2003.8
100%90%80%70%77%65%60%50%40%30%26%29%M<strong>in</strong>ority Youth as Percentageof the General PopulationM<strong>in</strong>ority Youth as Percentageof Detention Admissions20%10%0%1998 2003Figure 4: M<strong>in</strong>ority Overrepresentation <strong>in</strong> <strong>Connecticut's</strong> <strong>Juvenile</strong> Detention Centers (1998 & 2003).The Relative Rate Index (RRI) calculation for detention admissions is based on the number ofjuveniles referred to Superior Court <strong>Juvenile</strong> Matters. In Connecticut, the RRIs for m<strong>in</strong>ority youthshow that, once referred to juvenile court, m<strong>in</strong>ority youth are 1.52 times more likely to be placed <strong>in</strong>pre-trial detention than their White counterparts (RRIs of 1.45 for African-Americans, 1.63 for Lat<strong>in</strong>osand 1.89 for Asians). This level of <strong>DMC</strong> <strong>in</strong> pre-trial detention is difficult to expla<strong>in</strong> <strong>in</strong> light of the factthat arrest data furnished by the Department of Public Safety shows total arrests of White juveniles forviolent crime are approximately equal to arrests of African-American juveniles for violent crime.Commitment to DCFChildren <strong>in</strong> Connecticut who are found to be del<strong>in</strong>quent and are deemed to require residential care arecommitted to the Department of Children and Families (DCF). Review of the data shows that, oncethey have been found del<strong>in</strong>quent, m<strong>in</strong>ority youth are only slightly more likely to be committed to DCFthan their White counterparts. More specifically, of the population of juveniles found del<strong>in</strong>quent,m<strong>in</strong>ority youth are only 1.15 times more likely to be committed to DCF.While m<strong>in</strong>ority youth do not appear to receive disparate treatment once they have been founddel<strong>in</strong>quent, the cumulative effect of Disproportionate M<strong>in</strong>ority Contact earlier <strong>in</strong> the juvenile justicesystem results <strong>in</strong> great overrepresentation of m<strong>in</strong>ority youth <strong>in</strong> DCF-licensed residential facilities andthe Connecticut <strong>Juvenile</strong> Tra<strong>in</strong><strong>in</strong>g School. The rate at which African-American and Lat<strong>in</strong>o juvenilesare committed del<strong>in</strong>quent is much greater than their White counterparts. African-American juvenilesare committed to DCF at a rate of 778 juveniles per 100,000 and Lat<strong>in</strong>o juveniles are committed at arate of 406 juveniles per 100,000. This is compared to 137 White juveniles committed per 100,000.9
Based on their proportion of the population, African-American youth are 5.69 times more likely to becommitted del<strong>in</strong>quent than their White counterparts. They are also 1.91 times more likely to becommitted than their Lat<strong>in</strong>o counterparts.Rate of Del<strong>in</strong>quency Commitment to DCF900.00800.00778.02700.00600.00500.00400.00406.80300.00253.33200.00136.78100.0048.250.00Total Youth White Black or African-AmericanHispanic or Lat<strong>in</strong>oAsianFigure 5: Rate of del<strong>in</strong>quency commitments to the Department of Children and Families, by race and ethnicity (per100,000 youth of each race and ethnicity <strong>in</strong> the population) (2003).RECOMMENDATIONSThe Connecticut <strong>Juvenile</strong> <strong>Justice</strong> Alliance recommends the follow<strong>in</strong>g strategies for reduc<strong>in</strong>g <strong>DMC</strong> <strong>in</strong>Connecticut:1. Relative Rate Indexes Must be Calculated Annually.The Relative Rate Index (RRI) is a useful <strong>in</strong>dicator for determ<strong>in</strong><strong>in</strong>g the rate of <strong>DMC</strong>. In order tomake the best use of this tool, however, the RRIs for every decision-mak<strong>in</strong>g po<strong>in</strong>t <strong>in</strong> the juvenilejustice system should be calculated annually. In addition to calculation of statewide RRIs, theRRIs should also be calculated by court location and by offense type. This annual report will proveto be a powerful management tool for Connecticut’s juvenile justice system.10
2. Decision-Mak<strong>in</strong>g Po<strong>in</strong>ts Where <strong>DMC</strong> is Present Must be Scrut<strong>in</strong>ized.The RRIs for 2003 show <strong>DMC</strong> is most prevalent at the po<strong>in</strong>ts of arrest, referral to Superior Court<strong>Juvenile</strong> Matters and admission to secure pre-trial juvenile detention. For each of these decisionmak<strong>in</strong>gpo<strong>in</strong>ts, data should be analyzed by gender, race and offense type to ascerta<strong>in</strong> whetherm<strong>in</strong>ority youth are receiv<strong>in</strong>g disparate treatment.3. Data Collection with<strong>in</strong> the <strong>Juvenile</strong> <strong>Justice</strong> <strong>System</strong> Must be Improved.Currently, arrest data for juveniles <strong>in</strong> Connecticut is not available for all races and ethnicities. Theuniform arrest report should be changed to allow for track<strong>in</strong>g all race and ethnicity data. This willallow for more accurate portrayals of arrests of Lat<strong>in</strong>o youth, which are currently recorded as eitherWhite or Black.In addition to better collection of arrest data, Connecticut should also focus on collect<strong>in</strong>g accuratedata on juveniles who are arrested but diverted from juvenile court. Such data should track youthdiverted from juvenile court by arrest<strong>in</strong>g offense, municipality where arrest occurred, race/ethnicityand gender.4. Connecticut Must Develop a Pilot Program to Implement Proven Strategies for Reduc<strong>in</strong>g <strong>DMC</strong>.Several jurisdictions <strong>in</strong> other states have achieved double-digit reductions <strong>in</strong> <strong>DMC</strong> byimplement<strong>in</strong>g programs based on the Annie E. Casey Foundation’s <strong>Juvenile</strong> Detention AlternativesInitiative (JDAI) or through consultation with Haywood Burns Institute and the Youth Law Center.Connecticut should partner with one or more of these well-respected groups to develop a pilotproject to reduce <strong>DMC</strong> <strong>in</strong> one juvenile court location. Lessons learned <strong>in</strong> the pilot project couldhelp to reduce <strong>DMC</strong> statewide and may po<strong>in</strong>t to other improvements <strong>in</strong> the juvenile justice system.For example, Santa Cruz County <strong>in</strong> California found that by focus<strong>in</strong>g on reduc<strong>in</strong>g <strong>DMC</strong> <strong>in</strong> theirdetention centers, they also reduced the use of detention overall. This resulted <strong>in</strong> a more equitablejuvenile justice system and <strong>in</strong> cost reductions across the board.5. Better Coord<strong>in</strong>ation of the Process for Reduc<strong>in</strong>g <strong>DMC</strong> is NecessaryAs noted earlier <strong>in</strong> this report, several groups have statutory responsibility for address<strong>in</strong>g <strong>DMC</strong> <strong>in</strong>Connecticut. It is unclear to what extent, if any, these groups are work<strong>in</strong>g collaboratively toaddress this problem. The <strong>Juvenile</strong> <strong>Justice</strong> Advisory Committee, Commission on Racial andEthnic Disparities <strong>in</strong> the Crim<strong>in</strong>al <strong>Justice</strong> <strong>System</strong> and senior management from the Court SupportServices Division of the Judicial Branch and the Department of Children and Families should meetregularly to coord<strong>in</strong>ate efforts to elim<strong>in</strong>ate <strong>DMC</strong>. The discussions at these jo<strong>in</strong>t meet<strong>in</strong>gs shouldbe reflected <strong>in</strong> the juvenile justice plans that the JJAC and Commission must submit to the federalgovernment and state legislature, respectively.6. Accountability Must be Built Into Future PlansAs was noted earlier <strong>in</strong> the report, <strong>in</strong> the past Connecticut has taken steps to measure <strong>DMC</strong> and hasdeveloped plans and recommendations for address<strong>in</strong>g <strong>DMC</strong>. However, these plans andrecommendations carry no timel<strong>in</strong>es and build <strong>in</strong> no accountability. Connecticut must create plansfor address<strong>in</strong>g <strong>DMC</strong> that <strong>in</strong>clude clear timel<strong>in</strong>es for action and require regular, public report<strong>in</strong>g ofprogress toward outl<strong>in</strong>ed goals.11
7. Connecticut Must Use More of its <strong>Juvenile</strong> <strong>Justice</strong> Dollars to Fund Programs to Elim<strong>in</strong>ate<strong>DMC</strong>.The reduction of <strong>DMC</strong> is one of the four core requirements of the federal <strong>Juvenile</strong> <strong>Justice</strong> andDel<strong>in</strong>quency Prevention Act (JJDPA). As such, Connecticut should commit a considerable portionof its federal juvenile justice fund<strong>in</strong>g to address<strong>in</strong>g this problem. The <strong>Juvenile</strong> <strong>Justice</strong> AdvisoryCommittee should report annually to the Governor and legislature the total amount of fund<strong>in</strong>gtargeted to the reduction of <strong>DMC</strong>. This report should also be available onl<strong>in</strong>e with the state’sjuvenile justice plan, as submitted to the Office of <strong>Juvenile</strong> <strong>Justice</strong> and Del<strong>in</strong>quency Prevention(OJJDP).Elim<strong>in</strong>at<strong>in</strong>g <strong>DMC</strong> will require a concerted effort <strong>in</strong>volv<strong>in</strong>g parents, youth, police, court personnel,and service providers. More than anyth<strong>in</strong>g else, however, elim<strong>in</strong>at<strong>in</strong>g <strong>DMC</strong> will require theleadership of the executive, legislative and judicial branches of government to commit to ensur<strong>in</strong>gall our young people have equal justice under the law.RESOURCES:Listed here are reports about jurisdictions that have put programs and policies <strong>in</strong> place to reduce <strong>DMC</strong>.Recently Build<strong>in</strong>g Blocks for Youth Initiative compiled a report entitled, No Turn<strong>in</strong>g Back, whichpulled together <strong>in</strong>formation about several different approaches to reduc<strong>in</strong>g <strong>DMC</strong>. Information aboutthat report is listed here as well as <strong>in</strong>formation about other reports that may be helpful as Connecticutdevelops its own strategies to address this problem.Build<strong>in</strong>g Blocks for Youth Initiative. (2005). No Turn<strong>in</strong>g Back, Promis<strong>in</strong>g Approaches to Reduc<strong>in</strong>gRacial and Ethnic Disparities Affect<strong>in</strong>g Youth of Color <strong>in</strong> the <strong>Justice</strong> <strong>System</strong>Available: http://www.build<strong>in</strong>gblocksforyouth.org/noturn<strong>in</strong>gback.htmlCox., Judith A. (2000). Address<strong>in</strong>g Disproportionate M<strong>in</strong>ority Representation With<strong>in</strong> The <strong>Juvenile</strong><strong>Justice</strong> <strong>System</strong>. Santa Cruz County Probation, Santa Cruz, California.Available: http://www.build<strong>in</strong>gblocksforyouth.org/issues/dmc/address<strong>in</strong>gdmc.htmlDev<strong>in</strong>e, P., Coolbaugh, K, Jenk<strong>in</strong>s, S. (1998). Disproportionate M<strong>in</strong>ority Conf<strong>in</strong>ement: Lessonslearned from five states. Wash<strong>in</strong>gton, DC: Office of <strong>Juvenile</strong> <strong>Justice</strong> and Del<strong>in</strong>quency Prevention.Available: http://www.ncjrs.org/94612.pdf.Schiraldi, V. & Zeidenberg, J. (2002). Reduc<strong>in</strong>g disproportionate m<strong>in</strong>ority conf<strong>in</strong>ement: TheMultnomah County, Oregon success story and its implications. Wash<strong>in</strong>gton, DC: <strong>Justice</strong> PolicyInstitute.Available: http://www.cjcj.org/pubs/portland/portland.html12
APPENDIX I: ARRESTS OF JUVENILES IN CONNECTICUT, 2003CODE OFFENSE White01aWhite %of TotalBlackBlack %of Total Indian Asian TotalTOTAL ARRESTS 13,747 67.67% 6,395 31.48% 24 149 20,315Murder/Non-NegligentHomicide 0 0.00% 7 100.00% 0 0 702 Forcible Rape 27 60.00% 18 40.00% 0 0 4503 Robbery 109 38.52% 174 61.48% 0 0 28304 Aggravated Assault 315 55.17% 250 43.78% 0 6 57105Burglary - Break<strong>in</strong>g orEnter<strong>in</strong>g 518 76.06% 158 23.20% 1 4 68106Larceny-Theft (except MotorVehicle) 2,203 66.44% 1,070 32.27% 8 35 3,31607 Motor Vehicle Theft 210 63.25% 113 34.04% 0 9 33209 Arson 53 80.30% 12 18.18% 1 0 66VIOLENT 451 49.78% 449 49.56% 0 6 906PROPERTY 2,984 67.90% 1,353 30.78% 10 48 4,395PART I OFFENSEARRESTS 3,435 64.80% 1,802 33.99% 10 54 5,30108 Other Assaults 2,086 56.55% 1,584 42.94% 5 14 3,68910 Forgery and Counterfeit<strong>in</strong>g 24 64.86% 13 35.14% 0 0 3711 Fraud 50 68.49% 20 27.40% 1 2 7312 Embezzlement 12 60.00% 7 35.00% 0 1 20Stolen Property: Buy<strong>in</strong>g,13 Receiv<strong>in</strong>g, Possess<strong>in</strong>g 39 59.09% 27 40.91% 0 0 6614 Vandalism 794 79.32% 202 20.18% 1 4 1,00115Weapons: Carry<strong>in</strong>g, Posses<strong>in</strong>g,etc. 224 67.07% 103 30.84% 0 7 33416Prostitution andCommercialized Vice 1 100.00% 0 0.00% 0 0 117Sex Offenses (except forciblerape and prostitution) 93 66.91% 43 30.94% 0 3 13918 Drug abuse violations 1,247 75.17% 396 23.87% 2 14 1,65919 Gambl<strong>in</strong>g 1 33.33% 2 66.67% 0 0 3Offenses aga<strong>in</strong>st family and20 children 70 73.68% 24 25.26% 0 1 9521 Driv<strong>in</strong>g under the Influence 95 96.94% 2 2.04% 0 1 9822 Liquor Laws 344 96.09% 11 3.07% 0 3 35823 Drunkenness 5 33.33% 10 66.67% 0 0 1524 Disorderly Conduct 2,555 67.95% 1,181 31.41% 1 23 3,76025 Vagrancy 6 66.67% 3 33.33% 0 0 9All other offenses (except26 Traffic) 2,469 72.81% 902 26.60% 4 16 3,39127 Suspicion 4 57.14% 3 42.86% 0 0 7Curfew and Loiter<strong>in</strong>g Law28 Violations 88 71.54% 29 23.58% 0 6 12329 Runaways 105 77.21% 31 22.79% 0 0 136PART II OFFENSEARRESTS 10,312 68.68% 4,593 30.59% 14 95 15,01413
APPENDIX II: RAW DATA FOR ALL DECISION-MAKING POINTSAREA REPORTEDState :ConnecticutCounty: AllCountiesData Entry SectionReport<strong>in</strong>g Period Jan / 2003through Dec / 2003TotalYouthBlack orAfrican-AmericanHispanicor Lat<strong>in</strong>oNativeHawaiianor otherPacificIslandersAmericanIndian orAlaskaNativeOther/MixedAllM<strong>in</strong>oritiesWhiteAsian1. <strong>Juvenile</strong> Population(age 10 through 15 )298,034 211,284 36,760 40,806 8,291 0 893 0 86,7502. <strong>Juvenile</strong> Arrests 20,315 13,747 6,395 149 24 6,5683. Refer to <strong>Juvenile</strong>Court15,904 7,103 5,487 3,128 68 0 1 117 8,8014. Cases Diverted 05. Cases Involv<strong>in</strong>gSecure Detention6. Cases Petitioned(Charge Filed - JudicialHandl<strong>in</strong>g)7. Cases Result<strong>in</strong>g <strong>in</strong>Del<strong>in</strong>quent F<strong>in</strong>d<strong>in</strong>gs8. Cases result<strong>in</strong>g <strong>in</strong>Probation Placement9. Cases Result<strong>in</strong>g <strong>in</strong>Conf<strong>in</strong>ement <strong>in</strong> Secure<strong>Juvenile</strong> CorrectionalFacilities (Commitmentto DCF)10. Cases Transferred toAdult Court3,031 1,052 1,180 756 19 0 0 24 1,97911,069 4,628 3,986 2,319 49 0 0 87 6,4415,552 2,314 1,963 1,196 31 0 0 48 3,2383,563 1,545 1,220 755 20 0 0 23 2,018755 289 286 166 4 0 0 10 466Meets 1% rule? Yes Yes Yes Yes No No Norelease 1/02/045. DATA SOURCES &NOTESItem 1: Puzzanchera, C., F<strong>in</strong>negan, T.and Kang, W. (2005). "Easy Access to<strong>Juvenile</strong> Populations" Onl<strong>in</strong>e. Available:http://www.ojjdp.ncjrs.org/ojstatbb/ezapop/Item 2: State Police, Department of Public Safety& Federal Bureau of Investigations0Item 3: Judicial Branch statistics, 2003Item 4: N/AItem 5: Judicial Branch statistics, 2003 Item 6: Judicial Branch statistics, 2003Item 7: Judicial Branch statistics, 2003 Item 8: Judicial Branch statistics, 2003Item 9: Judicial Branch statistics, 2003Item 10: N/A14
APPENDIX III: RELATIVE RATE INDEX TABLES1. AREA REPORTED 2. MINORITY GROUP: Black or African-AmericanState : ConnecticutCounty: All Counties Report<strong>in</strong>g Period Jan / 2003Data Itemsthrough Dec / 2003TotalNumber ofWhiteYouthRate ofOccurrence- WhiteYouthTotalNumber ofM<strong>in</strong>orityYouthRate ofOccurrence- M<strong>in</strong>orityYouthRelativeRateIndexStatisticallySignificant?(p
1. AREA REPORTED 2. MINORITY GROUP: Hispanic or Lat<strong>in</strong>oState : ConnecticutCounty: All Counties Report<strong>in</strong>g Period Jan / 2003Data Itemsthrough Dec / 2003TotalNumber ofWhiteYouthRate ofOccurrence- WhiteYouthTotalNumber ofM<strong>in</strong>orityYouthRate ofOccurrence- M<strong>in</strong>orityYouthRelativeRateIndexStatisticallySignificant?(p
APPENDIX IV: PER-CAPITA DELINQUENCY COMMITMENTS TO DCF1. Population at risk(age 10 through 15 )9. Cases Result<strong>in</strong>g <strong>in</strong>Conf<strong>in</strong>ement <strong>in</strong>Secure <strong>Juvenile</strong>CorrectionalFacilities(Commitment toDCF)TotalYouthWhiteBlack orAfrican-AmericanHispanicor Lat<strong>in</strong>oAsianNativeHawaiianor otherPacificIslandersAmericanIndian orAlaskaNativeOther/Mixed298,034 211,284 36,760 40,806 8,291 0 893 0755 289 286 166 4 0 0 10SecureConf<strong>in</strong>ement Rate(per 100,000) 253.33 136.78 778.02 406.80 48.25 0.00 0.00 0.0017