
Create successful ePaper yourself
Turn your PDF publications into a flip-book with our unique Google optimized e-Paper software.
<strong>International</strong><strong>Finance</strong>Fourth editionMaurice D. Levi
First published 2005by Routledge2 Park Square, Milton Park, Abingdon, Oxon OX14 4RNSimultaneously published in the USA and Canadaby Routledge270 Madison Avenue, New York, NY 10016Routledge is an imprint of the Taylor & Francis Group# 2005 Maurice D. LeviTypeset in Perpetua and Bell Gothic by Newgen Imaging Systems (P) Ltd, Chennai, IndiaPrinted and bound in Great Britain by Bell & Bain Ltd, GlasgowAll rights reserved. No part of this book may be reprinted or reproduced or utilised in any form or by anyelectronic, mechanical, or other means, now known or hereafter invented, including photocopying and recording,or in any information storage or retrieval system, without permission in writing from the publishers.British Library Cataloguing in Publication DataA catalogue record for this book is available from the British LibraryLibrary of Congress Cataloging in Publication DataA catalog record for this book has been requestedISBN 0–415–30899–2 (hbk)ISBN 0–415–30900–X (pbk)
To Kate‘‘As for foreign exchange, it is almost as romantic as young love, and quiteas resistant to formulae.’’H.L. Mencken(As you shall see, it is not entirely resistant to formulae!)
About the authorSince receiving his PhD from the University of Chicago, Maurice D. Levi has taught and written researchpapers in a wide variety of areas of finance and economics. This broad range of research and teaching interestsform the foundation for this book in international finance, a subject that he believes to be best treatedas an application of financial and economic principles, rather than as a separate and isolated subject area.Professor Levi has published research papers on financial market anomalies, the effectiveness ofmonetary and fiscal policy, the relationship between inflation and interest rates, the effect of taxes oninternational capital flows, and the link between inflationary expectations and unemployment, as well as inthe numerous areas of international finance that are reflected in this book. He has also written in the areas ofeconometric methods, macroeconomics, labor economics, environmental economics, money and banking,and regional economics. His papers have appeared in just about every leading research journal in financeand economics including: American Economic Review; Econometrica; Journal of Political Economy; Journal of<strong>Finance</strong>; Journal of Monetary Economics; Journal of Money, Credit and Banking; Journal of <strong>International</strong> Money and<strong>Finance</strong>; Journal of <strong>International</strong> Economics; Management Science; Ecological Economics, and Journal of Econometrics.He is also the author of Economics and the Modern World (Heath, Lexington MA, 1994), Economics Deciphered:A Layman’s Survival Guide (Basic Books, New York, 1981), and Thinking Economically (Basic Books,New York, 1985) and the coauthor, with M. Kupferman, of Slowth (Wiley, New York, 1980).Since joining the Sauder School of Business of the University of British Columbia, Professor Levi has heldvisiting positions at the Hebrew University of Jerusalem, the University of California, Berkeley, MIT,the National Bureau of Economic Research, the University of Exeter, University of New South Wales, andthe London Business School. He has received numerous academic prizes and awards including Killam andNomura Fellowships and the Bronfman Award.
ContentsList of illustrationsPrefacexiiixviii1 THE WORLD OF INTERNATIONAL FINANCE 1Unique dimensions of international finance 1The benefits of studying international finance 1The growing importance of international finance 2Topics covered in this book 13Summary 17Review questions 17Assignment problems 18Bibliography 18Parallel material for case courses 19Appendix A 19Appendix B 22PART ITHE MARKETS FOR FOREIGN EXCHANGE 272 AN INTRODUCTION TO EXCHANGE RATES 29The foreign bank note market 29The spot foreign exchange market 32Organization of the interbank spot market 32Direct versus indirect exchange and cross exchange rates 43Summary 50Review questions 51Assignment problems 51Bibliography 523 FORWARD EXCHANGE 53What is forward foreign exchange? 53Forward exchange premiums and discounts 54Forward rates versus expected future spot rates 56Payoff profiles on forward exchange 56Outright forward exchange and swaps 58vii &
CONTENTSThe flexibility of forward exchange 60Forward quotations 61Summary 65Review questions 66Assignment problems 66Bibliography 674 CURRENCY FUTURES AND OPTIONS MARKETS 68Currency futures 68Currency options 75Forwards, futures, and options compared: a summary 85Summary 86Review questions 87Assignment problems 88Bibliography 89Appendix A 89PART IITHE DETERMINATION OF EXCHANGE RATES 955 THE BALANCE OF PAYMENTS 97Influences on currency supply and demand 97Principles of balance-of-payments accounting 98Balance-of-payments entries and the factors that influence them 99Implications of the balance-of-payments accounting identity 108The net international investment position 111Objectives of economic policy 113Summary 114Review questions 116Assignment problems 116Bibliography 1176 SUPPLY-AND-DEMAND VIEW OF EXCHANGE RATES 119Imports, exports, and exchange rates 120The factors affecting exchange rates 122The stability of exchange rates 130Short-run versus long-run trade elasticities and the J curve 133Summary 135Review questions 136Assignment problems 136Bibliography 137Appendix A 137PART IIITHE FUNDAMENTAL INTERNATIONAL PARITY CONDITIONS 1417 THE PURCHASING-POWER-PARITY PRINCIPLE 143The law of one price 143Absolute (or static) form of the PPP condition 144The relative (or dynamic) form of PPP 145& viii
CONTENTSEfficient markets (or speculative) form of PPP 147The empirical evidence on PPP 148Reasons for departures from PPP 151Statistical problems of evaluating PPP 152The practical importance of PPP 154Summary 155Review questions 156Assignment problems 156Bibliography 1578 INTEREST PARITY 159The investment and borrowing criteria 160The covered interest-parity condition 166Combining PPP and interest parity 169Why covered interest differences persist 171Summary 184Review questions 185Assignment problems 186Bibliography 187PART IVMANAGING FOREIGN EXCHANGE RISK AND EXPOSURE 1899 FOREIGN EXCHANGE EXPOSURE AND RISK 191The importance of understanding risk and exposure and measuring them 191The nature of exchange-rate risk and exposure 192Examples of foreign exchange exposure 193Exposure as a regression slope 198Definition of foreign exchange risk 204Exposure, risk, and the parity relationships 205Summary 211Review questions 213Assignment problems 213Bibliography 21410 ACCOUNTING EXPOSURE VERSUS REAL EXPOSURE 216Accounting principles 216Real changes in exchange rates 220Summary 226Review questions 227Assignment problems 227Bibliography 22811 OPERATING EXPOSURE 230Operations affected by exchange rates 230The exporter 231The importer 240Summary of effects of exchange rates on exporters and importers 244Effect of currency of invoicing and forward hedging 244Measuring exposure: an alternative approach 249Summary 251ix &
CONTENTSReview questions 252Assignment problems 253Bibliography 25412 HEDGING RISK AND EXPOSURE 256Whether to hedge: managerial hedging versus shareholder hedging 256Hedging of receivables and payables 259The cost of forward hedging 260The benefit of forward hedging 264Financial engineering: payoff profiles of different hedging techniques 272Having a company hedging policy 276Summary 276Review questions 277Assignment problems 278Bibliography 27913 EXCHANGE-RATE FORECASTING AND SPECULATION 280Speculation 280Market efficiency 283Exchange-rate forecasting 288Summary 300Review questions 302Assignment problems 302Bibliography 303PART VINTERNATIONAL INVESTMENT AND FINANCING 30514 CASH MANAGEMENT 307The objectives of cash management 307Investment and borrowing choices with transaction costs 308<strong>International</strong> dimensions of cash management 310Summary 319Review questions 320Assignment problems 320Bibliography 32115 PORTFOLIO INVESTMENT 322The benefits of international portfolio investment 322<strong>International</strong> capital asset pricing 331Bonds and international portfolio diversification 339Settlements of international portfolio investments 341Summary 341Review questions 343Assignment problems 343Bibliography 34416 CAPITAL BUDGETING FOR FOREIGN INVESTMENTS 346Selecting projects 346Difficulties in evaluating foreign projects 348& x
CONTENTSCash flows: home versus foreign perspectives 349Discount rates: corporate versus shareholder perspectives 351The adjusted-present-value technique 351Selecting the appropriate discount rates 354An example 356Actual practice of capital budgeting 360Summary 361Review questions 362Assignment problems 362Bibliography 363Appendix A 364The different forms of taxes 364Organizational structures for reducing taxes 367Appendix B 36917 THE GROWTH AND CONCERNS ABOUT MULTINATIONALS 373The growth of MNCs 373Special issues facing MNCs: transfer pricing 381Special issues facing MNCs: country risk 384Problems and benefits from the growth of MNCs 390Transnational alliances 393Summary 393Review questions 395Assignment problems 395Bibliography 39618 INTERNATIONAL DIMENSIONS OF LONG-TERM FINANCING 397Equity financing 397Bond financing 402Bank financing, direct loans, and the like 410Government and development-bank lending 413Other factors affecting the financing of subsidiaries 413Financial structure 414Summary 417Review questions 418Assignment problems 418Bibliography 419PART VIINSTITUTIONAL STRUCTURE OF INTERNATIONAL TRADE AND FINANCE 42119 MULTINATIONAL BANKING 423The Eurodollar and offshore currency markets 423Multinational banking 431Summary 441Review questions 442Assignment problems 442Bibliography 44320 INSTRUMENTS AND INSTITUTIONS OF INTERNATIONAL TRADE 445Extra dimensions of international trade 445<strong>International</strong> trade involving letters of credit: an overview of a typical transaction 445xi &
CONTENTSAlternative payment and guaranteeing procedures 450The financing of international trade 452Countertrade 456The institutions regulating international trade 459Summary 463Review questions 464Assignment problems 464Bibliography 465PART VIITHE INTERNATIONAL MACROECONOMIC ENVIRONMENT: THEORIESAND PRACTICES 46721 ASSET-BASED THEORIES OF EXCHANGE RATES 469Stock versus flow theories of exchange rates 469The monetary theory of exchange rates 469The asset approach to exchange rates 474The portfolio-balance approach to exchange rates 475Theories of exchange-rate volatility 479Summary 483Review questions 484Assignment problems 484Bibliography 48522 ALTERNATIVE SYSTEMS OF EXCHANGE RATES 487The classical gold-standard system 488The Bretton Woods and dollar standards 491The European monetary system (EMS) 496Hybrid systems of exchange rates 499Target zones 502Summary 504Review questions 506Assignment problems 506Bibliography 507Appendix A 508Appendix B 51123 THE INTERNATIONAL FINANCIAL SYSTEM: PAST, PRESENT, AND FUTURE 514The past 514The present 529The future 529Degree of exchange-rate flexibility: fixed versus flexible exchange rates 536Summary 543Review questions 544Assignment problems 545Bibliography 546Glossary 547Name index 573Subject index 578& xii
IllustrationsFIGURES1.1 Percentage of GDP arising from exports 31.2 <strong>International</strong> investment position of the United States 101B.1 The gain from the better allocation of capital 231B.2 Utility from different consumption patterns 242.1 Daily turnover in the US foreign exchange market, 1986–2001 332.2 Organization of the foreign exchange market 352.3 Interbank spot and selected forward exchange rates 412.4 Direct versus indirect exchange: zero transaction costs 442.5 Direct versus indirect exchange: nonzero transaction costs 473.1 Payoff profile on forward contract to buy ¤1 million 583.2 Payoff profile on forward contract to sell ¤1 million 594.1 Prices of principal CME currency futures: September 18, 2003 694.2 Payoff profile for purchase of euro futures contract 744.3 Premiums on principal CME options on currency futures: September 18, 2003 764.4 Payoff profiles of buyer and writer of euro call option for ¤125,000 844.5 Payoff profiles of buyer and writer of euro put option for ¤125,000 854A.1 Equivalence of buying foreign currency European call and selling put, versus buying theforeign currency forward 904A.2 Equivalence of selling foreign currency European call and buying put, versus selling theforeign currency forward 906.1 Deriving the supply of pounds 1216.2 Deriving the demand for pounds 1226.3 The exchange rate from imports and exports 1236.4 Deriving the demand for imports 1246.5 Deriving the export supply curve 1256.6 Inflation in relation to supply and demand 1266.7 Inflation and exchange rates 1276.8 Currency supply and import elasticity 1316.9 Stability of foriegn exchange markets 1326.10 The J curve 1347.1 US–Mexican inflation and the peso–dollar exchange rate 1548.1 Dollar versus hedged pound investments 1618.2 Dollar versus hedged pound borrowing 1648.3 Covered interest arbitrage: dollar borrowing and pound investing 165xiii &
ILLUSTRATIONS8.4 The covered interest parity diagram 1678.5 The interdependence of exchange rates, interest rates, and inflation rates 1718.6 One way and round-trip interest arbitrage 1748.7 Interest parity in the presence of transaction costs, political risk, or liquidity premiums 1758.8 A more roundabout one-way arbitrage 1789.1 Exposure as the slope of a regression line 19911.1 Exporter and devaluation in a competitive market 23211.2 Exporter and devaluation in a competitive market: effect of cost increases 23511.3 Devaluation and the demand curve 23611.4 Exporter and devaluation in an imperfectly competitive market 23711.5 Exporter and devaluation in an imperfectly competitive market: foreign-currency units 23911.6 The importer and a devaluation 24111.7 Importer and devaluation in foreign-currency units 24311.8 Importer of inputs and devaluation 24411.9 Exporter with payables exposure: dollar accounting 24611.10 The J curve 24612.1 Payoff profiles, payables exposure, and resulting exposure with forward and futurescontracts 27312.2 Payoff profiles from option hedges 27514.1 Example of Navistar <strong>International</strong>’s foreign exchange netting system 31614.2 Digital Equipment’s weekly cash cycle 31815.1 Correlations between US and other countries’ stock markets, US dollars, 1980–90 32315.2 Correlations between Japanese and other countries’ stock markets, Japanese yen,1980–90 32415.3 Correlations between British and other countries’ stock markets, British pounds,1980–90 32415.4 The size of the gain from international diversification 32715.5 Local-market versus exchange-rate components of volatility of US dollar values ofnon-US stocks, 1970s and 1980s 32815.6 The advantages of international diversification with and without exchange risk 33015.7 The relationship between expected return and total risk 33315.8 Efficiency frontier of global stocks, US dollar, 1980–90 33415.9 Contribution of bonds to the globally efficient frontier, US dollars, 1980–90 34117.1 Euromoney’s country-risk rating scheme 38618.1 Parallel loans and credit swaps 41219.1 Deposit and asset shares of foreign banks in the United States, 1990–2001 43219.2 Share of loans by foreign banks in the United States, 1990–2001 43220.1 Application and agreement for documentary letter of credit 44720.2 The draft and banker’s acceptance 44820.3 The steps in international trade 44920.4 The steps involved in forfaiting 45420.5 The different forms of countertrade 45821.1 The portfolio-balance theory: effect of open-market operations 47621.2 Real income growth and the portfolio-balance theory 47821.3 Exchange-rate overshooting 48022.1 The workings of the gold-exchange and dollar standards 49322.2 The price-level adjustment mechanism of the gold-exchange and dollar standards 49522.3 Crawling peg 50022.4 Target zones for exchange rates 50323.1 Post-war changes in economic importance 530& xiv
ILLUSTRATIONS23.2 US and Japanese trade balances, 1965–2002 53323.3 US bilateral trade balance with China and Japan, 1985–2003 53423.4 Stabilizing and destabilizing currency speculation 540TABLES1.1 Aggregate international trade versus GDP 31.2 Selected foreign exchange gains, 2001 61.3 Selected foreign exchange losses, 2001 71.4 The volatility of exchange rates 121A.1 The situation with no international trade 201A.2 Input/output under free trade 212.1 Exchange rates on foreign bank notes (Traveler’s dollar – October 22, 2002) 302.2 Geographical distribution of average daily foreign exchange turnover, April 2001 323.1 Foreign exchange net turnover by market segment: daily averages, April 2001 533.2 Per annum percentage premium (þ) or discount ( ) on forward foreign exchangevis-à-vis the US dollar 553.3 Unanticipated changes in the spot exchange rate and gains or losses on forward purchaseof ¤1 million at $1.15/¤ 573.4 Unanticipated changes in the spot exchange rate and gains or losses on forward saleof ¤1 million at $1.15/¤ 583.5 Foreign exchange derivative turnover by currency pair: daily turnover in April 2001 633.6 Bids and asks on pounds 644.1 Settlements on a pound futures contract 714.2 Realized spot rates and gains/losses on futures to buy euros 734.3 Impact of variables affecting currency call and put option premiums 794.4 Payoffs on purchase of euro call option 834.5 Payoffs on purchase of euro put option 854.6 Forwards, futures, and options compared 864A.1 European option put-call forward parity 925.1 Summary format of the US balance of payments, 3rd quarter, 2002 1005.2 <strong>International</strong> investment position of the United States year-end 2001 1127.1 Average absolute deviations from PPP 1498.1 Exchange rates and interest rates on different currency-denominated 3-month bank deposits 1638.2 Points off the interest parity line 1689.1 Exposure on a contractual asset: euro bank deposit 1939.2 Exposure on a contractual liability: euro bank loan 1949.3 Exposure on a noncontractual asset: Euro-zone exporter 1959.4 Exposure on a noncontractual asset: Euro-zone exporter 1959.5 Exposure on a noncontractual asset: Euro-zone importer 1969.6 Exposure on a noncontractual asset: euro bond 1979.7 Exposure on a noncontractual asset: dollar bond 1979.8 Exposure on a noncontractual asset: foreign real estate 19810.1 Earnings on domestic versus foreign financial assets 22210.2 Earnings on foreign fixed assets 22512.1 Dollar payments on £1-million accounts payable using different hedging techniques 26512.2 Payoffs from different hedging techniques 27213.1 Test of unbiasedness of forward rates as predictors of future spot rates, monthlydata 1978–87 287xv &
ILLUSTRATIONS13.2 Correlation coefficients between the yen–dollar spot rate and various possible spot-ratepredictors, 1974–87 28913.3 Correlation coefficients between the Deutschemark–dollar spot rate and various possiblespot-rate predictors, 1974–87 28913.4 The performance of econometric-oriented services 29313.5 Speculative return on capital from following the advice of econometric services 29413.6 Speculative return on capital from following the advice of technical services 29513.7 Connection between past changes in exchange rates and median forecasts of future rates:different forecast horizons 29913.8 Forecasting methods of Euromoney respondents 29914.1 Factors affecting working-capital management 31515.1 Monthly US dollar returns and risks for national stock markets, 1994–2002 32515.2 Correlations between US dollar monthly returns in automobile manufacturing, 1986–91 32615.3 Correlations between US dollar monthly returns in the consumer electronics industry,1986–91 32615.4 Composition of US dollar weekly returns on individual foreign stock markets, 1980–85 32916.1 Value of a £1-million concessionary loan 35316.2 Adjusted-present-value elements for Turkish jeans factory 35916A.1 Corporate income tax rates, 2003 36517.1 The 50 largest nonfinancial MNCs, ranked by total assets, 2000 37417.2 Euromoney’s country-risk ranking, 2003 38818.1 Costs of foreign-currency bonds 40518.2 Sources of funds for subsidiaries 41118.3 Mean and standard deviation of debt to asset ratios, sorted by type of legal system 41519.1 Change in balance sheets from $100 of primary deposits 43019.2 Activities open to different institutions in different centers 438EXHIBITS1.1 Currency matters: corporate experiences 81.2 Getting a grip on globalization 92.1 Institutional basics of the foreign exchange market 362.2 An exchange on the exchange: a conversation between market-makers in the foreignexchange market 393.1 Structure of the forward market 613.2 Differences between outright forwards and swaps 624.1 The scope for writing options 825.1 Extraterrestrial trade or the ether? Data difficulties in the balance of payments 1079.1 Hedging horizons 2079.2 Flying high: risk and exposure at American airlines 20910.1 Translating accountants’ and economists’ languages 21810.2 From historical to current rates: the rationale for a change in approach 21911.1 A practical solution to estimating operating exposure 24912.1 To hedge or not to hedge: Merck’s motives 25812.2 Different corporate choices over hedging 26113.1 The success of professional forecasters 29713.2 Good luck or good judgement? 29814.1 Decentralizing currency management at general electric 31415.1 Home bias and corporate governance 33615.2 Evolution of capital market integration 34016.1 Investment strategies: a dynamic matter 347& xvi
ILLUSTRATIONS16.2 Competitive pressure to pursue FDI 34817.1 Counting on a good name 37717.2 Multinationals: creatures of market imperfections 38017.3 Do US multinationals export jobs? 39218.1 Overstating differences: US-Japanese borrowing costs more similar than it seems 39918.2 Going abroad: the appeal of Euroequities 40018.3 Special drawing rights (SDRs) 40919.1 Foreign bank operations in the United States 43319.2 Derivatives: differentiating the hyperbole 44020.1 Just-in-time inventory systems: too late for The Merchant of Venice 45320.2 US free-trade zones 46122.1 The Wonderful Wizard of Oz: a monetary allegory 49222.2 Alphabet soup: ERM, EMS, ECU, and all that 49823.1 Seeing the forest through the trees: the Bretton Woods vision 51723.2 Bretton Woods faces the axe 52123.3 The cost of change: conversion to the euro 52823.4 The bank for international settlements 53123.5 <strong>International</strong> trade and the environment 535xvii &
PrefaceThis book is intended for use in MBA and senior-level undergraduate business courses in internationalfinance and international business. It is comprehensive, covering both the markets and management ofmultinational business. It is designed to be used in its entirety in courses that cover all areas of internationalfinance, or to be used selectively in courses dealing only with international financial markets or only withinternational financial management. To the extent possible, the two major subdivisions of internationalfinance are self contained, being delivered in separate segments.The book is specifically designed for students who have taken introductory economics and finance, andwho wish to build upon the basic financial and economic principles they have acquired. By assuming theseprerequisites, this book is able to go further than competing textbooks in international finance. It is able tointroduce the student to the new and exciting discoveries and developments in the dynamic and rapidlyexpanding field of international finance. These discoveries and developments, many of which have occurredduring the last few years, are extensions of the principles of finance and economics.Of course, it is necessary to recognize that business students, whether concentrating in finance or ininternational business, have a practical interest in the subjects they take. Consequently, a good textbook ininternational finance must cover real managerial topics such as how to evaluate foreign investmentopportunities, where to borrow and invest, how exchange rates affect cash flows, what can be done to avoidforeign exchange exposure and risk, and the general financial management problems of doing business inthe global environment. However, even these highly practical topics can be properly dealt with only byapplying basic financial and economic principles that many other international finance textbooks appearreluctant to employ. As a result, despite adequate levels of preparation, generally including thoroughintroductions to economics and finance, the student often receives a rather descriptive treatment of thesetopics that fails to build on the foundations of previous courses. For this reason, many MBA students andundergraduate business majors with solid backgrounds in, for example, the consequences of arbitrage orthe principles of capital budgeting feel they move sideways rather than forward into international finance.The topics in this text are covered from the perspective of a person who wishes to learn about thefinancial management of an internationally oriented business. However, it is important that managers alsounderstand international financial developments on a macroeconomic level. Such an understanding enablesmanagers to anticipate economic changes and adjust to what they expect to occur. Because of this doublelevel of interest in the forces behind events and the consequences of these events for the firm, this bookincludes several chapters on the international finance of the economy. However, these chapters are dividedinto two parts, with the essential material on the international financial environment limited to onlytwo chapters in the early part of the book. This is to provide the book with a financial management focus,& xviii
PREFACEunlike the previous three editions that have given more priority to the wider picture of the global economy.The aspects of the international financial environment that are less essential to day-to-day internationalfinancial decisions are in a separate section at the end of the book. Nevertheless, even at this more aggregatelevel, a managerial perspective is taken, with the material linked to factors relevant to the handling ofvolatility that has its roots in global events.This book represents a major revision and updating of the third edition of <strong>International</strong> <strong>Finance</strong> that gobeyond moving less essential material on the international financial environment to later in the book. Newtopics have been included and topics previously covered have been considerably rearranged and reintegrated.In addition, additional examples have been provided. The guiding principle throughout this substantialrevision has been to bring the book closer to the syllabus that is emerging in one-semester international financecourses in MBA and senior level undergraduate business programs. Most particularly, an attempt has beenmade to go beyond theory and into the vital and increasingly important real world of international finance.As with previous editions, a substantial revision has been necessary because the international financialdevelopments that are occurring are nothing short of spectacular. For example, new markets andinstruments are emerging at a frantic pace, in part as a response to exchange rates that at times have been sovolatile they have grabbed the headlines, not of the business section of the newspaper, but of the front page.The day-to-day lives of people have been affected by events such as the introduction of the euro, a commoncurrency now shared by numerous countries in Europe. The euro represents an unprecedented experimentin international financial cooperation with huge implications for the traveler and the person in the street aswell as corporate financial management. Great fortunes have been made and lost in foreign exchange. Newsreports have also been full of exchange rate crises in Asia, South and Central America, and Russia, andeconomic summits of world leaders dealing with these periodic crises. At the same time, there has been anexplosion of research in international finance and international financial management. The revisions in thisfourth edition of <strong>International</strong> <strong>Finance</strong> reflect the important recent developments and current research thathave sharpened the insights from studying this dynamic subject.This book has evolved over a number of years while teaching or doing research at the University ofBritish Columbia and also at the Hebrew University, Jerusalem; the University of California, Berkeley; theMassachusetts Institute of Technology; the London Business School; the University of New South Wales;and the University of Exeter. I am indebted to all these institutions, especially the Sauder School of Businessat the University of British Columbia, which has been my home base for over three decades.An author’s debts are a pleasure to acknowledge, and in the course of four editions of this book I haveincurred many I would find difficult to repay. A huge debt is owed to Cynthia Ree who has spent endlessdays and weeks providing a usable electronic copy from which I could work, and to my colleague Ali Lazrakwho has provided valuable comments. The help offered by reviewers has been immensely important inimproving the final product. Only the anonymity of the individual reviews prevents me from apportioningthe vast credit due to them. My wife, Kate, son Adam, and daughter Naomi have provided professional andindispensable help in preparing the manuscript. My son Jonathan also helped by asking questions thatsharpened my understanding of difficult matters. Too numerous to mention individually but of greatimportance were the students in my MBA and undergraduate courses in international finance at theUniversity of British Columbia, whose reactions have been a crucial ingredient in the revision of this text.It is to my wife, Kate, and my daughter Naomi that I owe my greatest thanks. In addition to playing a vitalrole in preparing and checking the manuscript they have provided the moral support and encouragementthat have made a fourth venture far less stressful than I had imagined.Maurice D. LeviVancouver, BCxix &
Chapter 1The world of international financeThe globe is not a level playing field.AnonymousUNIQUE DIMENSIONS OFINTERNATIONAL FINANCEWhile tradition dictates that we continue to refer tothe subject matter in this book as internationalfinance, the modifier ‘‘international’’ is becomingincreasingly redundant: today, with fewer andfewer barriers to international trade and financialflows, and with communications technologydirectly linking every major financial center, allfinance is becoming ‘‘international.’’ Indeed, notonly are domestic financial markets increasinglyinternationally integrated, but the problems facedby companies and individuals in different lands areremarkably similar.Even though most if not all finance must beviewed at the international level, there are specialproblems that arise from financial and tradingrelations between nations. These are the problemsaddressed in this book. Many of these problems aredue to the use of different currencies used in differentcountries and the consequent need toexchange them. The rates of exchange betweencurrencies – the amount of a currency received foranother – have been set by a variety of arrangements,with the rates of exchange as well as thearrangements themselves subject to change.Movements in exchange rates between currenciescan have profound effects on sales, costs, profits,asset and liability values, and individual well-being.Other special, uniquely international financialproblems arise from the fact that there are politicaldivisions as well as currency divisions betweencountries. In particular, the world is divided intonation-states that generally, but not always, correspondto the currency divisions: some nations sharecurrencies, such as the euro that is the commoncurrency for numerous European nations, and theRussian ruble that is still used by several formerSoviet states. Political barriers provide additionalopportunities and risks when engaging in overseasborrowing and investment. <strong>International</strong> finance hasas its focus the problems managers face from thesecurrency and country divisions and their associatedopportunities and risks.THE BENEFITS OF STUDYINGINTERNATIONAL FINANCEKnowledge of international finance can help afinancial manager decide how international eventswill affect a firm and what steps can be taken toexploit positive developments and insulate the firmfrom harmful ones. Among the events that affect thefirm and that must be managed are changes inexchange rates as well as interest rates, inflationrates, and asset values. These different changesare themselves related. For example, decliningexchange rates tend to be associated with relatively1 &
THE WORLD OF INTERNATIONAL FINANCEhigh interest rates and inflation. Furthermore, someasset prices are positively affected by a decliningcurrency, such as stock prices of export-orientedcompanies that are more profitable after devaluation.Other asset prices are negatively affected, suchas stock prices of companies with foreign-currencydenominated debt that lose when the company’shome currency declines: the company’s debt isincreased in terms of domestic currency. Theseconnections between exchange rates, asset and liabilityvalues, and so on mean that foreign exchangeis not simply a risk that is added to other businessrisks. Instead, the amount of risk depends cruciallyon the way exchange rates and other financial pricesare connected. For example, effects on investorswhen exchange rates change depend on whetherasset values measured in foreign currency move inthe same direction as the exchange rate, therebyreinforcing each other, or in opposite directions,thereby offsetting each other. Only by studyinginternational finance can a manager understandmatters such as these. <strong>International</strong> finance is notjust finance with an extra cause of uncertainty. It is alegitimate subject of its own, with its own risks andways of managing them.There are other reasons to study internationalfinance beyond learning about how exchange ratesaffect asset prices, profits, and other types of effectsdescribed earlier. Because of the integration offinancial markets, events in distant lands, whetherthey involve changes in the prices of oil and gold,election results, the outbreak of war, or theestablishment of peace, have effects that instantlyreverberate around the Earth. The consequences ofevents in the stock markets and interest rates of onecountry immediately show up around the globe,which has become an increasingly integrated andinterdependent financial environment. The linksbetween money and capital markets have become soclose as to make it futile to concentrate on anyindividual part.In this book we are concerned with the problemsfaced by any firm whose performance is affectedby the international environment. Our analysisis relevant to more than the giant multinational& 2corporations (MNCs) that have received so muchattention in the media. It is just as valid for acompany with a domestic focus that happens toexport a little of its output or to buy inputs fromabroad. Indeed, even companies that operate onlydomestically but compete with firms producingabroad and selling in their local market are affectedby international developments. For example, USclothing or appliance manufacturers with no overseassales will find US sales and profit marginsaffected by exchange rates which influence thedollar prices of imported clothing and appliances.Similarly, bond investors holding their owngovernment’s bonds, denominated in their owncurrency, and spending all their money at home, areaffected by changes in exchange rates if exchangerates prompt changes in interest rates. Specifically,if governments increase interest rates to defendtheir currencies when their currencies fall in valueon the foreign exchange markets, holders ofdomestic bonds will find their assets falling in valuealong with their currencies: bond prices fall wheninterest rates increase. It is difficult to think of anyfirm or individual that is not affected in some way orother by the international financial environment.Jobs, bond and stock prices, food prices, governmentrevenues, and other important financial variablesare all tied to exchange rates and otherdevelopments in the increasingly global financialenvironment.THE GROWING IMPORTANCE OFINTERNATIONAL FINANCEWhile we shall emphasize the managerial issues ofinternational finance in this book, it is important toemphasize that the international flows of goods andcapital that are the source of supply of and demandfor currencies, and hence essential to the subjectof international finance, are fundamental to ourwell-being. A strong currency, for example, ceterisparibus, improves a country’s standard of living:the currency buys more in world markets. Notonly does a strong currency allow citizens to buymore imports, they can also buy more domestically
THE WORLD OF INTERNATIONAL FINANCEproduced products that are internationally tradedbecause a country’s citizens have to compete withforeigners for their own country’s tradable products.The gain in standard of living from a risingcurrency is also evident when living standards arecompared between nations. <strong>International</strong> rankingsof living standards require conversions of localcurrencyincomes into a common measure, usuallythe US dollar. A rising currency moves a country upthe ladder by making local incomes worth moredollars.Citizens also gain from the efficient global allocationof capital: when capital is allocated to its bestuses on a global scale, overall returns are higher andthese extra returns can be shared among the globalinvestors. Let us therefore pause to consider theevidence of the international movement of goodsand capital. We shall also take a look at the sourcesof gains from the flows of goods and capital. Weshall see that international finance is a subject ofimmense and growing importance.The growth of international trade<strong>International</strong> trade has a pervasive importance for ourstandard of living and our daily lives. In the departmentstore we find cameras and electrical equipmentfrom Japan and clothing from China and India. On thestreet we find automobiles from Germany, Japan,Korea, Sweden, and France using gasoline fromNigeria, Saudi Arabia, Great Britain, Mexico, andKuwait. At home we drink tea from India, coffeefrom Brazil, whiskey from Scotland, beer fromGermany, and wine from just about every country onEarth. We have become so used to enjoying theseproducts from distant lands that it is easy to forgetthey are the result of complex international tradingand financial linkages discussed in this book.Record on the growth of tradePeoples and nations have been trading from timeimmemorial. During the period since records havebeen kept the amount of this trade between nationshas typically grown at a faster rate than has domesticcommerce. For example, since 1950, world tradehas grown by about 6 percent per annum, roughlytwice that of world output over the same period.During the nineteenth century, international tradegrew at such a tremendous rate that it increased bya factor of 25 times in the century leading up tothe First World War. Even in the period since1980, a mere moment in the long history ofinternational trade, the value of trade betweennations has tripled (see Table 1.1). Growth inthe importance of trade in the form of the fractionof Gross Domestic Product (GDP) consisting ofexports is shown for several countries in Figure 1.1.& Table 1.1 Aggregate international tradeversus GDPYear World exports, Exports/GDP%billion US$1999 4945.9 16.01995 4531.7 15.71990 3070.0 14.21985 1610.8 13.71980 1541.3 14.7Source: National Account Statistics: Analysis of MainAggregates, United Nations, New York, 2003.50%40%30%20%10%0%CanadaSouthKoreaUnitedKingdomUnitedStates197019901999India& Figure 1.1 Percentage of GDP arising fromexportsNoteToday, foreign markets represent a more important proportionof aggregate demand for the products of most countries than inthe past. For example, the fraction of US GDP that is exportedhas almost doubled since 1970, while the fraction of SouthKorea’s GDP that is exported has almost tripled.Source: National Account Statistics: Analysis of MainAggregates, United Nations, New York, 2003.3 &
THE WORLD OF INTERNATIONAL FINANCEIndeed, if anything, the published export figuresunderstate the growth of world trade. This issuggested by the fact that when the world’scombined reported exports are compared toreported imports, global imports exceed exports.In the absence of extraterrestrial trade, this suggestsa reporting error: when properly calculated,global imports must equal global exports. Themechanisms for reporting imports are generallybetter than those for reporting exports – governmentskeep track of imports for collection ofduties and for safety and health reasons – andtherefore it is likely that exports are understatedrather than that imports are overstated. It is worthpausing to consider why international trade and theinternational financial activity associated with thattrade have grown so rapidly in recent decades.Reasons for the growing importance ofinternational tradeThere are two principal reasons why internationaltrade has grown so rapidly:1 A liberalization of trade and investment viareductions in tariffs, quotas, currency controls,and other impediments to the internationalflow of goods and capital.2 An unprecedented shrinkage of ‘‘economicspace’’ via rapid improvements in communicationand transportation technologies, andconsequent reductions in costs.Much of the trade liberalization has come from thedevelopment of free-trade areas such as that of theEuropean Union (EU) now consisting of morethan two dozen countries from Sweden to Malta andPortugal to Greece, and that of the United States,Canada, and Mexico which signed the NorthAmerican Free Trade Agreement (NAFTA) in1993. Similarly, rapid growth of trade has occurredamong the members of the Association of SouthEast Asian Nations (ASEAN). Indeed, more andmore of global trade is occurring within tradingblocks. This regionalization of trade has important& 4currency implications, making the trend of paramountimportance to international finance. Forexample, the euro has become the common currencyof many of the members of the EU, motivatedby the desire to reduce the foreign exchange risksand currency conversion costs of doing businesswithin this important customs union. 1 The previouscurrencies of this area have completely disappeared:no more German marks, Italian lira, andso on. The role of the US dollar within NAFTA hasbecome a source of serious debate: should there be aNorth American common currency to reduce risksand costs in this important and possibly expandingregion?The second factor contributing to growing trade,namely the shrinkage of ‘‘economic space’’ causedby a lower cost of communication and transportation,has had a profound effect. For example, in realterms, long-distance telephone costs have beenreduced by more than 90 percent since the 1920s.Connection times have been reduced even moredramatically: long-distance calls used to be connectedmanually by operators who would routecalls through available lines. 2 The cost of internationalbusiness travel by air has dropped sosubstantially that it can cost little more for a USexecutive to meet with an Asian or European clientthan another US executive in another US city. Airfreight and ocean tanker costs for transportinggoods have also fallen rapidly. This has resulted in aglobalization of markets and consequent rapid1 A customs union is different from a free-trade area.A customs union maintains common levels of tariffs andother trade restrictions against nonmembers while havingfree trade between the union members. A free-trade areaallows countries to maintain different tariffs and otherrestrictions against nonmembers. This limits the abilityof goods and services to move freely between members of afree-trade area: countries must check when products moveacross borders to see if they are produced by membercountries or by nonmember countries.2 See Ronald Abler, ‘‘Effect of Space-Adjusting Technologieson the Human Geography of the Future,’’ in HumanGeography in a Shrinking World, Ronald Abler, DonaldJanelle, Allen Philbrick and John Sommer (eds), DuxburyPress, North Scituate, MA, 1975, pp. 35–56.
THE WORLD OF INTERNATIONAL FINANCEgrowth in international financial activity for settlingtransactions on the multinational scale.Given the growing importance of internationaltrade, it is worth briefly considering the rewardsand risks that accompany it. This will allow us tobriefly introduce some of the matters discussed atlength later in this book.The rewards of international tradeThe principal reward of international trade is that ithas brought about increased prosperity by allowingnations to specialize in producing those goodsand services at which they are relatively efficient.The relative efficiency of a country in producing aparticular product can be described in terms of theamounts of other, alternative products that could beproduced by the same inputs. In other words,we can think of relative efficiencies in terms ofthe opportunity cost of one product in terms ofanother. When considered this way, relative efficienciesare described as comparative advantages.All nations can and do simultaneously gainfrom exploiting their comparative advantages, aswell as from the larger scale production and broaderchoice of products that is made possible byinternational trade. 3In the last few years it has become increasinglyrecognized that there is more to successful internationaltrade than comparative advantages based onproductive efficiencies. 4 These particular advantagescannot explain distinct patterns of success,such as Singapore and Hong Kong’s rapid growthwith limited resources, versus Argentina’s sloweconomic advance despite abundant natural advantages.Also, comparative advantages do not explainwhy some regions within countries, such as northern3 For those who have not learned or have forgotten theprinciple of comparative advantage, a summary is given inAppendix A at the end of this chapter. The gains fromexploitation of comparative advantage are no differentfrom the gains from specialization within a country.4 This recognition is in large part due to the influential bookby Michael E. Porter, The Competitive Advantage of Nations,Harvard University Press, Cambridge, MA, 1989.Italy, grow faster than other regions, or why partsof industries expand while others contract. Dynamicfactors, rather than static production efficienciesand ‘‘factor endowments,’’ play a vital role ininternational trading success by offering countriescompetitive advantages. In particular,countries typically are successful internationally inproducts for which there are dynamic, discerningbuyers at home. For example, the French successin wine and cheese, German success in beer andfinely engineered automobiles, British success incookies, Italian success in fashion and US success inentertainment, are all in part due to the presence ofconsumers in the respective countries whosesophisticated tastes have forced firms to producefirst-class products to maintain their markets. Oncesuccessful at home, these firms have been able tosucceed abroad.A further factor affecting success in internationaltrade is the presence of suppliers and firms in supportiveindustries in the vicinity of exporting firms.For example, in southern California the US entertainmentindustry can call on lighting and cameraengineers, actors and screen designers, and even such‘‘extras’’ as exotic animal trainers and explosivesexperts. Other so-called ‘‘clusters’’ of supportiveactivities are found in the northern German chemicalindustry, Mid-Western US automobile industry,northern Italian manufacturing industry and theTokyo–Osaka-based consumer-electronics sector.The risks of international tradeThe rewards of trade do not come withoutaccompanying risks. The most obvious additionalrisk of international versus domestic trade arisesfrom uncertainty about exchange rates. Unexpectedchanges in exchange rates have important impactson sales, prices and profits of exporters andimporters. For example, if a Scottish whiskeyexporter faces an unexpected increase in the valueof the pound from $1.5/£ to $1.6/£, a bottle ofwhiskey sold for £10 will increase in price in theUnited States from $15 to $16. This will reducesales, and since the Scottish exporter receives5 &
THE WORLD OF INTERNATIONAL FINANCE& Table 1.2 Selected foreign exchange gains, 2001: millions of US dollarsCompany Country Gain Net Inc. (Loss) Fx.Gain (%) IndustryCiticorp USA 2,383 9,642 25 Banking/<strong>Finance</strong>Barclays UK 1,470 3,585 41 Banking/<strong>Finance</strong>Deutsche Bank Germany 1,233 149 828 Banking/<strong>Finance</strong>UBS Swiss. 1,232 2,996 41 Banking/<strong>Finance</strong>HSBC UK/HK 600 5,406 11 Banking/<strong>Finance</strong>Ford Motors USA 283 (5,453) n/d Auto. Manuf.IBM USA 198 7,723 3 ComputingChevron/Texaco USA 191 3,288 6 EnergyDeutsche Telekom Germany 178 (3,074) n/d TelecommunicationsTelefonos De Mex. Mexico 127 2,566 5 TelecommunicationsRio Tinto UK 58 1,079 5 MiningChina Petroleum China 45 1,936 2 MiningInco Canada 39 305 13 MiningXerox USA 29 (71) n/d Bus. Equip.BHP Billiton Australia 29 1,348 2 MiningChina Eastern China 15 65 23 AirlinesApple Comp. USA 15 (25) n/d ComputingCan. Pacific Canada 9 258 4 RailwayNortel Canada 9 (27,446) n/d TelecommunicationsSource: COMPUSTAT, 2003. Information contained in this document is subject to change without notice. Standard andPoor’s assumes no responsibility or liability for any errors or omissions or for results obtained by the use of such information.£10 before and after the change in the exchangerate, it reduces the exporter’s revenue and profit. 5Similarly, prices, sales, revenue, and profits ofimporters are also affected by unexpected changesin exchange rates.Tables 1.2 and 1.3 provide some examples ofcompanies whose profits have been affected bychanges in exchange rates. The examples indicatethat effects can be substantial viewed both absolutelyand relative to net income. Some companies,such as Ford Motor Company, have made foreignexchange gains while making losses overall. Thepower of exchange rates to affect the bottom lineand even the survival of companies is also illustratedin Exhibit 1.1.5 In our whiskey example, the dollar price might in realityincrease by less than the change in the exchange rate. Asis shown in Chapter 11, the amount of ‘‘pass through’’ ofchanges in exchange rates reaching the buyer depends onthe elasticity of demand, use of tradable inputs, and so on.& 6Whether changes in exchange rates affect prices,sales, and profits of exporters and importersdepends on whether changes in exchange ratesreally make a firm’s goods cheaper or more expensiveto buyers. For example, if a decrease in thevalue of the British pound from $1.5/£ to $1.4/£occurs while the price of a bottle of whiskey forexport from Scotland goes from £10 to £10.71,a bottle of whiskey will continue to cost $15 in theUnited States. This is because the pound pricemultiplied by the exchange rate, which gives thedollar price, is unchanged. Our example shows thatin order to determine the effect of a change inexchange rates, we must examine inflation andhow inflation and exchange rates are related. Thisrequires that we study international finance at thelevel of the economy as well as at the level of theindividual firm.The risk faced by exporters and importersresulting from the impact of exchange rates on
THE WORLD OF INTERNATIONAL FINANCE& Table 1.3 Selected foreign exchange losses, 2001: millions of US dollarsCompany Country Loss Net Inc. (Loss) IndustryTelefonica Spain 697 1,875 TelecommunicationsKoninklijke Holland 279 984 PublishingSony Japan 239 115 Music/ElectronicsUnited Pan Europe Holland 153 (3,935) CommunicationsTurkcell Iletisim Turkey 151 (187) TelecommunicationsUnited Global Com. USA 148 (4,494) CommunicationsExxon Mobil USA 142 15,320 EnergyGeneral Motors USA 107 601 Transport Manuf.Portugal Telecom Portugal 106 273 TelecommunicationsAlcatel France 105 4,418 TelecommunicationsAlberta Energy Canada 71 517 EnergyLucent USA 58 (16,198) TelecommunicationsBASF Germany 56 5,214 ChemicalBell Canada Canada 39 235 TelecommunicationsPfizer USA 33 7,788 PharmaceuticalsMonsanto USA 32 5,462 Agricultural SupplyAbbot USA 31 16,285 HealthShell UK/Holland 30 135,211 EnergyDow Chemical USA 24 27,805 ChemicalSource: COMPUSTAT, 2003. Information contained in this document is subject to change without notice. Standard and Poor’sassumes no responsibility or liability for any errors or omissions or for results obtained by the use of such information.prices, sales, and profits is only one, albeit probablythe most important, of the additional risks ofinternational trade versus domestic trade. Anotherrisk of international trade is country risk. Thisincludes the risk that, as a result of war, revolution,or other political or social events, a firm may not bepaid for its exports: many exporters extend tradecredit to buyers. Country risk applies to foreigninvestment as well as to credit granted in trade, andexists because it is difficult to use legal channels orreclaim assets when the investment is in anotherpolitical jurisdiction. Furthermore, foreign companiesmay be willing but unable to pay because, forexample, their government unexpectedly imposescurrency exchange restrictions. Other countryrelatedrisks of doing business abroad includeuncertainty about the possible imposition or changeof import tariffs or quotas, possible changes insubsidization of local producers, and possibleimposition of nontariff barriers such as qualityrequirements that are really designed to givedomestic firms an advantage.Practices have evolved and markets have developedwhich help firms cope with many of the addedrisks of doing business abroad. For example, specialtypes of foreign exchange contracts have beendesigned to enable importers and exporters tohedge, orcover, some of the risks from unexpectedchanges in exchange rates. Similarly, exportcredit insurance and letters of credit havebeen developed to reduce risks of nonpaymentwhen granting trade credit to foreign buyers. Withinternational trade playing a growing role in justabout every nation, it is increasingly importantthat we learn about the risk-reducing instrumentsand practices. We must also learn about the fundamentalcauses of the special risks of internationaltrade. These are two important topics of this book.7 &
THE WORLD OF INTERNATIONAL FINANCEEXHIBIT 1.1CURRENCY MATTERS: CORPORATE EXPERIENCESNews reports over the years have been full ofaccounts of companies that have suffered huge lossesor enjoyed great gains from exchange rate movements.The very fact that foreign exchange losses andgains frequently make the business headlines is proofin itself that companies have not hedged their foreignexchange exposure, or if they have hedged, that thehedges have been incorrectly designed. Consider, forexample, the following reports during just one shortperiod of time:“ In 1985, the same year that Volkswagen producedits 50 millionth car, the company founditself apparently defrauded to the tune of nearlyhalf a billion Deutschmarks. At the time this wasequivalent to approximately a quarter of a billiondollars. The problem was that the US dollar fellwell below what it could have been sold for, andas required by company policy, by using anappropriate foreign exchange contract. Theforeign exchange loss that ensued was enoughto wipe out the profit from a calendar quarter ofglobal operations.“ In the case of BOC, a British producer of gasesfor industry, a foreign exchange gain of nearlyseventeen million pounds was made by using aforeign exchange contract to sell the entire year’srevenues for 1985 at a substantially higher pricethan would have been received by selling theforeign exchange as it was received.“ The US photographic company, Eastman-Kodak,estimated that in the few years leading up to1985, the strong US dollar cost the company$3.5 billion in before-tax earnings. Subsequentweakening of the dollar helped reverse the losses,showing that failure to fully hedge may or may notbe harmful.“ In 1986, Japan’s largest camera producerreported a more than two-thirds reduction inprofit attributed to a strong Japanese yen.It is worth mentioning that in the case of Volkswagen,the apparent fraud was the result of a failure ofmanagers in charge of reducing the company’s foreignexchange risk – or more precisely its‘‘exposure,’’ a term we define later – to take thesteps they were supposed to. Indeed, forged documentswere used to hide the absence of the appropriatesteps. The Volkswagen experience is a vividexample of how costly it can be not to apply someof the principles in this book, even though inVolkswagen’s case top management knew very wellwhat should be done. Indeed Volkswagen had verystrict rules that all foreign exchange exposure behedged. Unfortunately, those responsible for puttingthe rules into effect ignored top management’sinstructions. Hedging is action taken to reduce foreign exchangeexposure, and is discussed later at length, especially inChapters 12–15.Source: Based on information in ‘‘Companies andCurrencies: Payment by Lottery,’’ The Economist, April 4,1987, p. 8, and ‘‘Ex-VW Official is Arrested in Fraud Case,’’The Wall Street Journal, April 8, 1987, p. 27.Increased globalization of financial andreal-asset marketsAlongside the growing importance of internationaltrade, there has been a parallel growth in theimportance of foreign investment in the moneymarket, the bond market, the stock market, thereal-estate market, and the market for operating& 8businesses (see Exhibit 1.2). 6 At times, the importanceof overseas investments and investors hasswelled to overshadow that of domestic investmentsand investors. For example, there have been periodswhen purchases of US bills and bonds by Japanese,6 Some measures of globalization of financial markets areprovided in Exhibit 1.2.
THE WORLD OF INTERNATIONAL FINANCEEXHIBIT 1.2GETTING A GRIP ON GLOBALIZATIONAdefinition of globalization that many economistslike is that ‘‘globalization is a shrinkage of economicspace.’’ In terms of economic arrangements, distancedoes not matter as much as it used to.This book is an example of globalization. Theauthor lives in Canada. The book is published bya British publisher. The copyediting was done in India.You, the reader, could be sitting down to learn internationalfinance just about anywhere. Was all thisdifficult to achieve? The answer is ‘‘no, not at all!’’With e-mail, fax, couriers and multinational publishinghouses it is scarcely more difficult to do thisacross the globe than to try and do it all in a singlecountry. Indeed, there are benefits from takingadvantage of the forces of globalization.If there is one industry where globalization canprogress most easily, possibly even easier than intextbook publishing, it is in the area of banking andfinance. This is because the costs of moving moneyfrom place to place can be inconsequential comparedto transportation costs in, say, the oil or the automobileindustry. The result is that returns offered toinvestors have to be just about the same in everycountry, at least after possible changes in exchangerates have been taken into account. Similarly, the costof borrowing is similar everywhere, again after consideringthe role of changes in exchange rates. Sure,there are places with high interest rates facinginvestors and high financing costs facing borrowers,but these are typically countries where the currenciesare widely anticipated to fall in value in the future.The high interest rates are the financial market’s wayof compensating for the expected exchange ratechanges. One measure of globalization is, therefore,the extent to which real investment returns andborrowing costs differ from country to country. Themore similar are interest rates, the greater the degreeof globalization.Another possible measure of globalization is theproportions of typical investment portfolios that areheld in foreign securities. If people hold only their owncountries’ securities, this would be a sign thatglobalization has not come very far. However, ifinvestors are internationally diversified, this is evidencethat globalization has occurred. The actualholdings of foreign versus domestic securities wouldneed to be compared to the importance of eachcountry in the global financial market. For example, ifa country is 10 percent of the world market, completeglobalization would mean that only 10 percent ofinvestments should be in domestic securities. Themore domestic holdings exceed this proportion, thefurther globalization still has to go (as we shallsee later in this book, on this measure globalizationhas scarcely begun).There are yet further ways to measure the extent ofglobalization of financial markets. One way is to see iflisting of a stock on a foreign stock exchange has anyinfluence on its price. It should not if the world is trulyglobal, because in such a world the security could bebought in its home country, wherever the investorsreside. Similarly, if the world is really just one single,seamless global financial market as much of therhetoric would suggest, central banks would havelittle or no effect on investment yields and borrowingcosts in their countries. This would be especiallythe case for central banks of small countries, andis because in an open, competitive financial worldeach small country is a price taker, facing the returnsand costs determined in the global financial marketplace.A measure of globalization is, therefore, thedegree of influence a central bank has on domesticconditions.There are other ways to measure globalization infinancial markets. For example, does the pricing ofsecurities depend on global factors affecting risk or isthere room for domestic factors? To what extent doborrowers rely on lenders in their own country? Theseand other measures of globalization are explored inthis book. As we shall see, while globalization hasproceeded quite far already, there is still a long waythat it can go.9 &
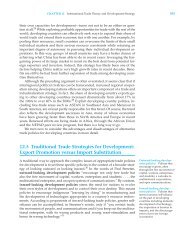
THE WORLD OF INTERNATIONAL FINANCE$ billion10,0009,0008,0007,0006,0005,0004,0003,0002,0001,0000Foreign assets in USUS assets abroad1976 1980 1985 1990 1995 2000 2002& Figure 1.2 <strong>International</strong> investment position of the United StatesNoteIn the mid-1980s the United States switched from being an international net creditor nation to an internationalnet debtor. By 2002 this net debt position had grown to over $2 trillion.Source: Survey of Current Business, US Department of Commerce, Office of Business Economics, 2003.Chinese, German, and other foreign investorshave exceeded purchases of these instruments byAmericans. Foreign buyers can be so crucial to thesuccessful sale of securities that the US Treasury andprivate brokerage firms must watch overseascalendars to ensure they do not launch a major salewhen, for example, Japanese or European financialinstitutions are closed for an official holiday. Thehorizons of investors and borrowers have clearlybecome global. In catering to the expanding horizonsof investors and borrowers, there has been anexplosion of internationally oriented financial productssuch as internationally diversified, global, andsingle foreign country mutual funds. The popularityof these products is a sign of the internationalizationof financial markets.Mutual funds that are called ‘‘internationalfunds,’’ are those with foreign but no US component.Global funds are those that include US as wellas foreign assets. Funds referred to as ‘‘emergingcountry funds’’ hold assets from smaller economiessuch as Thailand, Turkey, Malaysia, the Philippines,and Indonesia. The buying of foreign securitiesdirectly by individuals without the use of mutualfunds has also enjoyed rapid growth. Real estate andother markets have also experienced transformationsfrom the phenomenal pace of globalization.& 10However, as with the expansion of internationaltrade, the increased globalization of investment hasbrought with it both rewards and risks. The rewardsand risks are evident in the large gains and largelosses that have been made, depending on thetiming and locations of investments. 7The growth in globalization of investment viewedfrom a US perspective can be seen in Figure 1.2.Since the mid-1970s Americans increased theirinvestments abroad by more than ten times. Duringthis same period, foreigners increased their investmentsin the United States by almost twenty times.As a consequence, the United States has gone frombeing the world’s largest net creditor to the largestdebtor in only a quarter of a century. Withoutaccess to foreign funds the United States would havehad great difficulty funding its many financial needs,largely due to the low savings rate of Americans.The price, however, has been a need to make debtservice payments that has reduced the fraction of theUS national product enjoyed by Americans.7 The dependence of returns on the timing and locationof investment is graphically illustrated in Elroy Dimson,Paul Marsh, and Mike Staunton, Triumph Of The Optimists:101 Years Of Global Investment Returns, Princeton UniversityPress, Princeton, NJ, 2002.
THE WORLD OF INTERNATIONAL FINANCERewards of globalization of investmentAmong the rewards of the globalization ofinvestment has been an improvement in the efficiencyof the global allocation of capital and anenhanced ability to diversify investment portfolios.The efficiency gain from the better allocation ofcapital arises from the fact that internationalinvestment reduces the extent to which investmentswith high returns in some countries are forgone forwant of available capital, while low-return investmentsin other countries with abundant capital goahead. The flow of capital between countries movesmarginal rates of return in different locations closertogether, thereby offering investors at home andabroad overall better returns. There is an additionalgain from increased international capital flowsenjoyed via an enhanced ability to smooth consumptionover time by international lending andborrowing: countries can borrow abroad during badyears and pay back in good years. The analyticalbasis of the gain from consumption smoothing,along with the gain from a better internationalallocation of capital, are described in Appendix B.Cost of globalization of investmentThe benefits of the globalization of investment havenot come without a price. The price is the additionof exchange-rate risk and country risk.Unanticipated changes in exchange rates causeuncertainty in home-currency values of assets andliabilities. For example, if the exchange rate is $1.6per British pound, that is, $1.6/£, a bank balance of£100 in London is worth $160 to a US investor.If the British pound unexpectedly falls in value to$1.5, the US investor’s bank balance falls in value to$150. If instead of having an asset the US investorhad a debt or liability of £100, the unexpectedchange in exchange rate from $1.6/£ to $1.5/£means a reduction in the dollar value of what theAmerican owes. The dollar value of the liability willdecline from $160 to $150.In the case of a foreign-currency-denominatedbank balance or debt, exchange-rate risk is duesolely to uncertainty in the future exchange rates atwhich the asset or liability will be translated intodollars. In the case of many other assets and liabilities,exchange-rate risk is due both to uncertaintyin the exchange rate to be used for translation, andalso due to variations in local-currency values thatmay be affected by exchange rates: home-currencyvalues of foreign stocks, bonds and property areaffected by exchange rates. However, as we shallsee later, the mere fact that an asset or liability is in aforeign country does not mean that it is subject toexchange-rate risk, and the mere fact that an assetor liability is at home does not mean that it is notsubject to exchange-rate risk. 8Accompanying the increased exchange-rate riskassociated with the globalization of investment isthe risk from increasing interdependence betweendifferent countries’ financial markets: by marketsmoving up and down together, diversification gainsfrom global investment are diminished. There havebeen numerous examples of this interdependence inrecent years. For example, the Asian Crisis of1997–98 began in Thailand, but it quickly spreadto South Korea, Malaysia, the Philippines, andIndonesia. Fear of the impact of massive drops in thevalues of Asian currencies on competitiveness ofother trading nations spilled over to Argentina,Brazil, and eventually even to the markets of Europeand North America. The process of spreading crisesthrough the interconnectedness of financial marketsbecame widely referred to as contagion.The globalization of investment has not onlymeant increased importance of foreign exchangerisk but the increase in ownership of foreign assetshas also meant that investors face increased countryrisk. As we have mentioned, country risk involvesthe possibility of expropriation or confiscation ofproperty, or its destruction by war or revolution.It also involves the possibility of changes in taxeson foreign income and the imposition of restrictionson repatriating income from abroad. As in the case8 The surprising fact that foreign assets may not be exposedto exchange-rate exposure while domestic assets areexposed is explained in Chapter 9.11 &
THE WORLD OF INTERNATIONAL FINANCE& Table 1.4 The volatility of exchange ratesPeriod Volatility %UK FR GER ITALY CAN JAP EURO, ¤1999–2002 5 8 a 8 a 8 a 3 7 81990–98 7 7 8 14 9 14 —1980–89 18 22 19 21 6 24 —1970–79 14 10 22 17 6 16 —1960–69 7 3 2 0 3 0 —1957–59 0 14 0 0 1 0 —Notea Coefficient of variation of euro.Source: Standard deviation of month-end-to-month-end exchange rates, divided by the mean exchange rate over the period1957–2002 (<strong>International</strong> Financial Statistics, <strong>International</strong> Monetary Fund, Washington, DC, 2003).of foreign exchange risk, this book shows howpractices and institutions have evolved to helpinvestors reduce country risk.Increased volatility of exchange ratesThe more rapid growth of international trade versusdomestic trade and the expanded international focusof investment that we have described offer morethan adequate reason why it is increasingly importantfor students of business to study internationalfinance. There is, however, an additional reason whyknowledge of this exciting discipline has becomeimperative.Exchange-rate risk has at times risen even morethan the amount of foreign trade and overseasinvestment because of exchange-rate volatility.The volatility is described in Table 1.4 which showsthe coefficient of variation of some majorcurrencies. 9Exchange-rate volatility has been so substantialthat at times the plight of the dollar, or the soaringor sinking value of some other major currency, hasbecome headline material even outside of thebusiness press. Prompted at times by tensions inRussia, the Middle East or some other politically9 The coefficient of variation is the standard deviation dividedby the mean. It is a measure of volatility that can becompared over time and across counties.& 12sensitive part of the world, and at other times bynews on the economic health or malaise of somemajor country, exchange rates have jumped anddropped by startling amounts. Billions of dollars –and yen, euros, pounds, and francs – are made andlost in a day as a result of these currency swings.Rarely before have exchange rates darted around asmuch as they have in recent years, and thereforenever before has exchange-rate risk been soimportant to measure and manage. If we add to thehigher volatility the fact that international trade andinvestment are both far more important than theyused to be, we can see why it has become soessential to understand the nature of exchange-raterisk and how to manage it.There is no consensus as to why exchangerates have been so volatile. Some blame theswitch to flexible exchange rates that occurredaround 1973. However, others say the previousfixed-exchange-rate system could not have copedwith the larger shocks that have occurred sincethat time: jumps and drops in oil prices, internationalconflicts, acts of terrorism, and so on.What is fairly certain is that the increased globalizationof investment played a role by beingassociated with more hot money skipping fromfinancial center to financial center in search of thehighest return or to find safety. Another factormay have been the technology for moving moneyand transmitting information, which has allowed
THE WORLD OF INTERNATIONAL FINANCEboth to move at the speed of light. Whatever thereason, a consequence of the greatly increasedexchange-rate volatility has been a parallel increasein the importance of understanding themethods of managing foreign exchange risk, andthe other topics covered in this book.Increased importance of MNCs andtransnational alliancesIn addition to the growth of international trade andinvestment flows, and the riskiness of internationaltrade and investment due to country risk and thevolatility of exchange rates, interest in internationalfinance has grown with the increased importance ofmultinational corporations. While the multinationalizationof business is no easier to measure thanglobalization of financial markets, corporate investmentacross borders, which is the essence of corporationsbecoming multinational, has at times grownfour times faster than global output and three timesfaster than international trade. 10 The United Nationsestimates that there are more than 35,000 MNCs,with the largest 100 of these possibly being responsiblefor approximately 16 percent of the world’sproductive assets. The power held by these massive,effectively stateless enterprises has long been a sourceof governmental and public concern. The fear hasbeen that by extending their activity they couldinfluence governments and exploit workers andconsumers, especially in smaller nations that mightcontrol fewer resources than the corporations themselves.Indeed, concern over the extension of controlby foreign multinationals has been voiced even in theworld’s largest economy, the United States.Concern has been expressed about the dominanceof multinationals in international trade. 11According to the US Bureau of Economic Analysis,US-based multinationals were associated with80 percent of US exports and 40 percent of10 See ‘‘Multinationals: A Survey,’’ in The Economist, March 27,1993, p. 5.11 See F. Steb Hipple, ‘‘The Measurement of <strong>International</strong>Trade Related to Multinational Companies,’’ AmericanEconomic Review, December 1990, pp. 1263–70.imports. Because of their importance, we shalldiscuss multinationals both from the perspective ofwhy they have grown in relative importance, andwhether there really is any reason for concern. Thisis done in Chapter 17. We shall also discusstransnational alliances, which consist of separatelyowned corporations in different countriesworking in cooperation: MNCs are commonlyowned business operations in different countries.Let us briefly review how the discussion of multinationalsand transnationals fits with other topics inthis book before beginning an exploration of theworld of international finance.TOPICS COVERED IN THIS BOOKPart 1, consisting of Chapters 2–4, describes theorganization of the foreign exchange markets. Anintroduction to the structure of the markets and theform in which currencies are exchanged is essentialbackground to the study of international financialmanagement. Chapter 2 explains the nature ofthe bank-note market and bank-draft market, theformer involving the paper currency in our walletsand the latter involving checks, also known asdrafts. It is shown, for example, that the ability tochoose direct or indirect exchange between any pairof currencies allows us to compute all exchangerates from exchange rates of each currency vis-à-visthe US dollar. Transaction costs are shown to cloudthe link between currencies. Chapter 3 turns to theso-called ‘‘forward exchange market’’ and explainshow it works. This is the market in which it ispossible to contract for future sale or purchase ofa foreign currency so as to avoid being affected byunanticipated changes in exchange rates. Chapter 4introduces two other instruments for reducing riskassociated with exchange rates, namely currencyfutures and options. We explain their similaritiesand differences as well as the organization of themarkets in which these instruments trade.Part 2, consisting of Chapters 5 and 6, deals withthe determination of exchange rates. The purposeof these two chapters is to give the reader anunderstanding of the fundamentals of why exchange13 &
THE WORLD OF INTERNATIONAL FINANCErates move up and down when they are free tochange, as they are under the system of flexibleexchange rates. Such an understanding is essentialfor successful financial management in today’sinternational financial environment.Chapter 5 looks at the structure and meaning ofthe balance-of-payments account, where the factorsbehind the supply of and demand for a country’scurrency are recorded. Indeed, the balanceof-paymentsaccount is viewed as a record of thecauses of the supply and demand for a currency.Chapter 6 examines the supply and demand curvesfor currencies and the nature of the exchange-rateequilibrium they determine. It is shown that there isa real possibility that the exchange-rate equilibrium isunstable. This possibility is related to a phenomenonknown as the J curve, whereby changes in exchangerates have unexpected effects. For example, it isshown that a depreciating currency – a currency witha falling foreign exchange value – can actually make acountry’s balance of trade worse. (Normally, onewould think depreciation of a country’s currencywould improve its trade balance.)In Part 3, consisting of Chapters 7 and 8, wedescribe two fundamental principles of internationalfinance, the purchasing-power-parity(PPP) principle, and the covered interestparityprinciple. The PPP principle states thatexchange rates should reflect the relative localcurrencyprices of baskets of products in differentcountries, and that changes in exchange rates reflectdifferences in countries’ inflation rates; according toPPP, countries with relatively rapid inflation shouldhave depreciating currencies, and vice versa.Chapter 7 examines both the theory behind the PPPcondition and its empirical validity. The principleused to explain the PPP condition in Chapter 7 isarbitrage, and it is shown that the conclusions inChapter 6 based on currency supplies and demandscan alternatively be reached by considering PPP.Chapter 8 is devoted to the covered interestparitycondition. This condition says that whenexchange-rate risk is avoided by using forwardexchange contracts, investment yields and borrowingcosts are the same in different currencies.& 14If there really were no differences in investmentyields and borrowing costs between currencies,it would not matter how or where investment orborrowing occurred. However, there are differencesin investment yields and borrowing costs, andthe reasons they exist are explained in Chapter 8. Itis important that we understand why these yield andborrowing cost differences occur, because they haveimplications for international cash management.Part 4, consisting of Chapters 9–13, considersforeign exchange risk and exposure, and how exposuremay be hedged by the use of forward, futures,and options contracts, as well as by borrowing orinvesting in the money market, so-called swaps.Chapter 9 is concerned with the definition andmeasurement of foreign exchange exposure, which isthe amount which is at risk to changes in exchangerates. Different types of exposure and the factorsdetermining the size of each type of exposure aredescribed. In addition, exchange-rate exposure iscarefully distinguished from exchange-rate risk. Weexplain that exposure is found virtually everywhere.For example, companies that do not export orimport and have no foreign currency debts or assetsmay be exposed. This occurs if they compete at homewith foreign firms whose share of a company’smarket depends on exchange rates.Because the accounting conventions that are usedcan affect exposure as it appears in financial statements,Chapter 10 examines accounting proceduresused for international transactions. This chapter,which can be omitted without loss of continuity,also explains the concept of real changes inexchange rates and its relation to exposure.Most discussions of the effects of exchange ratesemphasize the gains or losses on assets or liabilities,not the effects on a firm’s ongoing profitability ofits operations. However, as international tradegrows and companies’ competitors are increasinglyforeign, exchange rates are having larger and largereffects on operations. Chapter 11 deals with theimportant matter of operating exposure by applyingthe standard tools of microeconomics. These toolsare applied to discover the factors that influencehow product prices, sales, production costs and
THE WORLD OF INTERNATIONAL FINANCEprofits of exporters and importers are affected bychanges in exchange rates.Chapter 12 then deals with the importantquestion of whether managers should take steps toreduce the amount that is exposed to risk fromunanticipated changes in exchange rates, or whethermanagers should leave hedging to individual shareholders.Several possible valid reasons for managerialhedging are discussed, and the consequences ofdifferent hedging techniques are described andcompared. These include forward, futures, andoptions contracts, as well as swaps. The simplegraphical technique of payoff profiles that hasbecome commonplace in financial engineeringis used to compare the consequences of differenthedging techniques.Chapter 13 considers the extent to which foreignexchange markets reflect available information, andthe closely connected question of whether it ispossible to profit from currency speculation. Thisleads into a discussion of exchange-rate forecastingand the record of attempts to forecast exchangerates and to profit from such forecasts.Part 5 examines international investment andthe financing of that investment. This begins with adiscussion of short-term cash management inChapter 14, and why an MNC might want tocentralize the management of its working capital.It is shown that the same factors causing differencesin investment yields and borrowing costsbetween currencies described in Chapter 8 are thefactors which must be considered in cash management.Chapter 15 deals with portfolio investment,and explains how investors can choosebetween investments in different countries’ stockand bond markets. Attention is paid to the benefitsof an internationally diversified portfolio of securities.It is shown that because economic conditionsdo not move in a perfectly parallel fashion indifferent countries, it pays to diversify internationally.The theory and evidence on whethersecurities are priced in an internationally integratedor a segmented market setting are examinedwithin the context of the capital asset pricingmodel.Chapters 16 and 17 focus on foreign directinvestment, which is what occurs when, forexample, a company builds a manufacturing plant inanother country. Chapter 16 shows how to evaluateforeign direct investments, including the discountrate and tax rate to employ, the way to handlefavorable financing terms offered to investingcompanies by foreign governments, restrictions onrepatriating income, and so on. This involves theapplication of the principles of capital budgeting tothe international context. Chapter 17 looks at thefactors behind the growth of the giant MNCs whichhave been the result of foreign direct investment.It also considers problems caused by the growth ofMNCs, and how costs and earnings can be allocatedamong divisions of an MNC by internal transferprices for items exchanged between corporatedivisions. Since a primary concern of MNCs iscountry risk of foreign facilities being seized and oftaxes being imposed or changed on repatriatedearnings, Chapter 17 looks at the measurementand avoidance of country risk. Associations betweencorporations in different countries, forming socalledtransnational corporations, are one suchmeans of reducing country risk and so transnationalcorporations are also discussed in Chapter 17.Chapter 18 is concerned with financing ofoverseas investment. It covers equities, bonds, bank,and government lending, and the choices betweenthem that result in alternative possible financialstructures, including the question of whetheroverseas subsidiaries should follow parent companyfinancing practices or those in the overseas destinationof investment.Part 6 considers the institutional structure ofinternational trade and finance. We begin with adiscussion of the important role played by commercialbanks. Today, large commercial banksoffer deposits and make loans in a variety of currenciesother than the currency of the country inwhich they are located. Such deposits and loans arecalled offshore currencies, of which Eurodollarsare the best-known examples. Chapter 19explains why the offshore-currency market hasdeveloped, and how it works. This leads naturally15 &
THE WORLD OF INTERNATIONAL FINANCEinto a discussion of international banking. Weexplain the organizational structure of internationalbanking, including the reasons why banks are amongthe largest MNCs that exist, sometimes having anoffice or other presence in a hundred countries.As well as covering trade financing, Chapter 20looks at the practical side of exporting andimporting. It describes the documents that areinvolved in international trade, the methods ofinsuring trade, and so on. Among the matters discussedare letters of credit and bills of exchange.Because a substantial part of international tradetakes a special form known as countertrade, whichinvolves circumventing the normal use of currencyin the exchange of goods and services, an accountis also given of the nature of and possible reasons forthis practice.Part 7, consisting of Chapters 21–23, is devotedto further aspects of the global financial marketbeyond the fundamentals covered in Part 2.Chapter 21 presents several new theories ofexchange rates when exchange rates are flexible,while Chapter 22 describes a variety of internationalfinancial systems based on fixed exchange rates –rates set and maintained by governments. The discussionof fixed rates involves descriptions of thenow-defunct gold standard, the Bretton Woodssystem, target zones (which are bands withinwhich governments try to keep exchange rates), theEuropean Monetary System (EMS) and theadvent of the new common currency of Europe,the euro. This leads us into a discussion of theautomatic adjustment mechanisms which help tocorrect payments imbalances between countries,especially the mechanism involving the price level.While it is less important to study fixedexchange rates today than when the exchange ratesof almost all most major currencies were formallyfixed, we should pay some attention to issuesconcerning fixed exchange rates because theinternational financial system has moved awayfrom complete flexibility in exchange rates since1985. Furthermore, fixed rates still exist in anumber of countries. For example, the value ofthe Hong Kong dollar has been pegged to theUS dollar since the 1980s, and the Chinese RMBhas also been pegged since the 1990s. It is alsopossible that the international financial systemcould return to fixed exchange rates. Systems ofexchange rates have a history of change, with manydifferent attempts to improve the way the financialsystem works.Chapter 23 looks at the historical events whichhave shaped the international financial system, andsome of the problems the system faces today. Weconsider many of the serious crises that have attimes threatened the normal conduct of internationalbusiness, including the Argentine Crisis andAsian Crisis. In the course of considering thepossible future evolution of the internationalfinancial system, we consider the pros and cons offixed and flexible exchange rates, and the internationalfinancial institutions charged with chartingthe course through trade imbalances, mountingdebts, and fundamental shifts in global economicpower.The discussion in Part 7 is self-contained and canbe covered at any point in the book. One possibilityis that rather than leave this to the end, it can beinserted between Part 3 on the fundamental internationalparity conditions, and Part 4 on foreignexchange management. Furthermore, the materialin Part 7 can be used in full or in part, depending onthe extent to which the course covers the financialmarkets and environment of multinational business.Chapter 21, in particular, contains material whichmight be heavy going for students without anintermediate-level background in finance andeconomics.The preceding overview of the contents of thisbook, along with the earlier parts of this chapter,indicate the broad range of increasingly importantissues addressed in this most globalized of allsubject areas of business, international finance.Having sketched the main features of the worldwe are to explore, let us begin our journey with atour of the fascinating markets for foreignexchange.& 16
THE WORLD OF INTERNATIONAL FINANCESUMMARY1 Every good or service reaching us from abroad has involved international finance.Knowledge of the subject can help managers avoid harmful effects of international eventsand possibly even to profit from these events.2 <strong>International</strong> trade has grown approximately twice as fast as domestic trade. Theincreased relative importance of international trade has brought rewards and costs.3 The principal reward from international trade is the gain in standard of living it haspermitted. This gain comes from exploiting relative efficiencies of production in differentcountries and the exploitation of competitive advantages.4 The costs of international trade are the introduction of exchange-rate and countryrisk. Methods and markets have evolved that allow firms to avoid or reduce theserisks, and since international trade has become more important it has become moreimportant to learn about these methods and markets.5 <strong>International</strong> finance has also become a more important subject because of anincreased globalization of financial markets. The benefits of the increased flow ofcapital between nations include a more efficient international allocation of capitaland greater opportunities for countries and their citizens to diversify risk. However,globalization of investment has meant new risks and increased interdependence offinancial and economic conditions in different countries.6 Adding to the increase in relevance of exchange-rate risk from the growth ininternational trade and the globalization of financial markets has been an increasein the volatility of exchange rates and a growth in importance of MNCs. All of thesefactors combine to make it imperative that today’s student of business study thefactors behind the risks of international trade and investment, and the methods ofreducing these risks.REVIEW QUESTIONS1 How might you measure growth in the relative importance of international trade in recentdecades?2 Why has international trade grown more rapidly than domestic trade?3 What is a ‘‘comparative advantage?’’4 What helps provide a ‘‘competitive advantage?’’5 What is ‘‘country risk?’’6 What does it mean to ‘‘hedge?’’7 What are the principal benefits of international investment?8 What are the principal costs of international investment?9 What is ‘‘hot money?’’10 What is the difference between a multinational corporation and a transnationalcorporation?17 &
THE WORLD OF INTERNATIONAL FINANCEASSIGNMENT PROBLEMS1 In what ways might the following be affected by sudden, unexpected changes in exchangerates?a An American holder of US Treasury bondsb An American holder of GM stockc An American on vacation in Mexicod An American holder of Honda stocke A Canadian on vacation in the United States2 What is meant by ‘‘shrinkage of economic space?’’3 What are the possible implications of adoption of a common currency such as the euro?4 What competitive advantages may be behind the success of a particular industry ininternational trade?5 Why have some governments been concerned with the growing importance ofmultinational corporations?BIBLIOGRAPHYAliber, Robert Z., The Handbook of <strong>International</strong> Financial Management, Dow Jones-Irwin, Homewood, IL, 1989.Aliber, Robert Z. and Reid W. Click, Readings in <strong>International</strong> Business, MIT Press, Cambridge, MA, 1993.The Economist, ‘‘Multinationals: A Survey,’’ March 27, 1993.Eichengreen, Barry, Michael Mussa, Giovanni Dell’Ariccia, Enrica Detragiache, Gian Maria Milesi-Ferretti,and Andrew Tweedie, ‘‘Liberalizing Capital Movements: Some Analytical Issues,’’ Economic Issues, 17,<strong>International</strong> Monetary Fund, Washington, DC, 1999.Evans, John S., <strong>International</strong> <strong>Finance</strong>: A Markets Approach, Dryden Press, Fort Worth, TX, 1992.Harris, Richard G., ‘‘Globalization, Trade and Income,’’ Canadian Journal of Economics, November 1993,pp. 755–76.Krugman, Paul A. and Maurice Obstfeld, Geography and Trade, MIT Press, Cambridge, MA, 1991.—— Currencies and Crises, MIT Press, Cambridge, MA, 1991.—— <strong>International</strong> Economics: Theory and Policy, 6th edn, Addison-Wesley, Boston, MA, 2002.Ohmae, Keniche, The Borderless World: Power and Strategy in the Interlinked Economy, Harper-Collins,New York, 1990.Porter, Michael E., The Competitive Advantage of Nations, Palgrave-Macmillan, New York, 1998.Reich, Robert B., The Work of Nations: Preparing Ourselves for the Twenty-First Century, Alfred A. Knopf,New York, 1991.Vernon, Raymond and Louis Wells, Jr, Manager in the <strong>International</strong> Economy, 5th edn, Prentice-Hall, EnglewoodCliffs, NJ, 1986.& 18
THE WORLD OF INTERNATIONAL FINANCEPARALLEL MATERIAL FOR CASE COURSESCarlson, Robert S., H. Lee Remmers, Christine R. Hekman, David K. Eiteman, and Arthur Stonehill, <strong>International</strong><strong>Finance</strong>: Cases and Simulation, Addison-Wesley, Reading, MA, 1980.Dufey, Gunter and Ian H. Giddy, Cases in <strong>International</strong> <strong>Finance</strong>, 2nd edn, Addison-Wesley, Reading, MA, 1993.Feiger, George and Bertrand Jacquillat, <strong>International</strong> <strong>Finance</strong>: Text and Cases,AllynandBacon,Boston,MA,1982.Moffett, Michael H., Cases in <strong>International</strong> <strong>Finance</strong>, Addison Wesley Longman, Reading, MA, 2001.Poniachek, Harvey A., Cases in <strong>International</strong> <strong>Finance</strong>, Wiley, New York, 1993.Rukstad, Michael G., Corporate Decision Making in the World Economy, Dryden, Fort Worth, TX, 1992.APPENDIX AThe gains from trade in goods and services: the principle ofcomparative advantageComparative advantage is not the most intuitive concept in economics, and it can require a little thought to leave thereader convinced of why countries gain from exploiting their comparative advantages. Discovered by the Englishstockbroker-millionaire David Ricardo, an understanding of comparative advantage helps answer the followingquestion:Suppose that China is much more efficient than the United States in producing steel and marginally moreefficient than the United States in producing food, and that steel and food are the only items produced andrequired in both countries. Would both countries be better off from free trade between them than by prohibitingtrade?When faced with this question, some people might say that while China would be better off from free trade becauseit is more efficient producing both products, the United States would be worse off. The reasoning behind this view isthe presumption that China would be able to undercut US prices for both products and thereby put Americans out ofwork. What the principle of comparative advantage shows is that in fact both countries are better off from free tradethan no trade, and that it is relative efficiencies rather than absolute efficiencies of production that determine thepattern and benefits of trade. These relative efficiencies of production are referred to as comparative advantages.Let us explain this important principle of comparative advantage by an example. This example will also clarify whatwe mean by this concept.Suppose that the amounts of labor needed to produce a ton of steel and food in the United States and China withthe given stocks of land and capital devoted to these products are as shown on the top of Table 1A.1. These numbersassume that China can produce both products with less labor than the United States, which means that China has anabsolute advantage in both products (of course, the assumption is made simply to provide an example).If the United States were to produce one more ton of food by moving labor from producing steel, the forgoneoutput of steel – that is, the opportunity cost of food in terms of steel – would be 2.5 tons of steel. 12 On the otherhand, if the United States were to produce one more ton of steel by moving labor from producing food, theopportunity cost would be 0.4 tons of food. Similarly, in China the opportunity cost of one more ton of food is12 Of course, it is individuals, not nations, who make production decisions. However, referring to countries as if they madeproduction decisions is a convenient anthropomorphism.19 &
THE WORLD OF INTERNATIONAL FINANCE& Table 1A.1 The situation with no international tradeOutput United States ChinaNumber of people employed per ton of outputFood 25 20Steel 10 4Opportunity cost per ton of outputFood 2.5 tons steel 5.0 tons steelSteel 0.4 tons food 0.2 tons foodMillions of people employedFood 75 40Steel 75 40Outputs, millions of tonsFood 3 2Steel 7.5 105.0 tons of steel, and the opportunity cost of one more ton of steel is 0.2 tons of food. These numbers are shown inTable 1A.1. We see that the United States has a lower opportunity cost of producing food, while China has a loweropportunity cost of producing steel. These relative opportunity costs are the basis of the definition of comparativeadvantage.A comparative advantage in a particular product is said to exist if, in producing more of that product, a countryhas a lower opportunity cost in terms of alternative products than the opportunity cost of that product in othercountries. Table 1A.1 shows that the United States has a comparative advantage in producing food and China has acomparative advantage in producing steel. It should be clear that as long as relative efficiencies differ, every countryhas some comparative advantage. This is the case even if a country has an absolute disadvantage in every product.What we will demonstrate next is that by producing the good for which the country has a comparative advantage(lower opportunity cost) and trading it for the products for which other countries have a comparative advantage(lower opportunity cost), everybody is better off.Table 1A.1 shows the number of workers (available labor power) shared by the two industries in the UnitedStates and China. The table also gives the outputs of food and steel in each country, assuming half of the relevantworking populations in each country is employed in each industry. For example, 75 million Americans can produce3 million tons of food when 25 workers are required per ton, and the other 75 million who work can produce7.5 million tons of steel. The total world output of food is 5 million tons, and the total world output of steel is17.5 million tons.Suppose now that 28 million Chinese workers are shifted from agriculture to steel, while at the same time50 million American workers are shifted from steel to agriculture. The effect of this on the outputs of both countriesis shown in Table 1A.2. We find that with China emphasizing steel production and with the United Statesemphasizing food, the outputs for the two countries combined are 5.6 million tons of food and 19.5 million tons ofsteel. The combined output of both items have increased by 10 percent or more merely by having China concentrateon its comparative advantage, steel, and the United States concentrate on its comparative advantage, food.The United States and China can both be richer if they trade certain amounts between themselves. One suchtrading division would be for the United States to sell China 1.8 million tons of food and buy from China 5.5 milliontons of steel, giving a terms of trade of approximately 3 tons of steel per ton of food (the terms of trade arethe amount of imports a country receives per unit of exports). The United States and China would then end up& 20
THE WORLD OF INTERNATIONAL FINANCE& Table 1A.2 Input/output under free tradeOutput United States ChinaMillions of people employedFood 125 12Steel 25 68Total output, millions of tonsFood 5 0.6Steel 2.5 17Consumption amounts under trading divisionFood 3.2 2.4Steel 8 11.5consuming the amounts in the bottom rows of Table 1A.2, all of which exceed what they could consume underautarky as shown in Table 1A.1 (autarky means having no trade relations with other countries).The gains shown by comparing Table 1A.2 with Table 1A.1 are due to specializing production according to thecountries’ comparative advantages. The benefit of specializing production is only one of the gains from trade.Further gains from international tradeGiven our assumption that China is relatively more efficient in producing steel than food, and the United States isrelatively more efficient in producing food than steel, under autarky we can expect food to be cheap relative to steelin the United States and steel to be cheap relative to food in China. This suggests that by exporting food to China,where food is relatively expensive in the absence of trade, the United States can receive a relatively large amount ofsteel in return. Similarly, by exporting steel to the United States where steel is relatively expensive in the absence oftrade, China can receive a relatively large amount of food. Therefore, via exchange of products through trade, bothcountries can be better off. The gain is a pure exchange gain and would be enjoyed even without any specializationof production. That is, there are two components to the gains from trade: the gain from adjusting the pattern ofproduction (the gain from specialization) and the gain from adjusting the pattern of consumption (the pureexchange gain). 13The number of people required to produce the food and steel in our example is assumed to be the same whateverthe output of these products. That is, we have implicitly assumed constant returns to scale. However, if thereare increasing returns to scale it will take fewer people to produce a given quantity of the product for whichthe country has a comparative advantage as more of that product is produced. In this case of economies of scalethere are yet further gains from international trade. Returns to scale can come in many forms, including pure technologicalgains, benefits of learning by doing, and so on. In addition, if there is monopoly power within a countrythat is removed by trade, consumers enjoy an additional benefit in terms of lower prices due to increased competition.14 Yet a further gain from trade comes in the form of an increase in product variety. In addition, international13 The pure exchange gain that comes from adjusting consumption cannot be shown in terms of our numerical example becausedemonstration of this gain requires measurement of relative satisfaction from the two products. This in turn requires the use ofutility theory. Formal separation of the specialization gain from the pure exchange gain is generally presented in courses in thepure theory of international trade.14 For evidence on this effect of trade, see James Levinsohn, ‘‘Testing the Imports-as-Market-Discipline Hypothesis,’’ NBERWorking Paper 3657, 1991.21 &
THE WORLD OF INTERNATIONAL FINANCEtrade can make a broader range of inputs and technology available and thereby increase economicgrowth. 15 Therefore, the gain from exploiting comparative advantages is only part of the total gain fromfree trade. 16Some costs of international tradeWhile most economists believe that international trade is beneficial, there are possible costs to be weighed against thegains. One possible costof freeinternational trade occurs whena country finds its own firmsput out of business and therebyexposesitselftoexploitationby a foreign monopoly. Thisisthe flipsidetothe gainfrom competition described earlier,andislikelytooccuronlyinoligopolisticmarketswithveryfewproducers. 17 Forexample,ithasbeenarguedthatitcanbeadvantageous for governments to subsidize aircraft production in Europe so as to reduce prices faced on importedaircraft. 18 Another possible drawback of trade is the reduction ineconomic diversity a country might face. This is the flipside of the gain from specialization. Finally, some people have decried international trade because of the homogenizationof culture and possible political domination it has brought to the planet, while others have questioned trade becauseof possible impacts on the environment. 19 It is clear that as in most things in economics, there is no free lunch.APPENDIX BThe gains from the international flow of capitalIn Appendix A we showed that everybody can simultaneously benefit from international trade in goods and services.In this appendix we show that everybody can also simultaneously gain from the international flow of financialcapital. Between them, the international flow of goods and services and the international flow of capital constitutethe sum total of reasons for the supply of and demand for foreign exchange. Indeed, as we shall show in Chapter 5,the two major subdivisions of the balance-of-payments account – the current account and the capital account –report respectively the demand for and supply of a country’s currency due to trade in goods and services, and thesupply of and demand for the currency due to the flow of capital. Therefore, what this and Appendix A do is showthat the very bases of the study of international finance – transactions due to the flow of goods and services and theflow of capital – are both important contributors to our well-being. It is not, as is often thought, just the freeinternational flow of goods and services from which we benefit.15 See Gene M. Grossman and Elhanan Helpman, ‘‘Product Development and <strong>International</strong> Trade,’’ Journal of Political Economy,December 1989, pp. 1261–83, and ‘‘Growth and Welfare in a Small Open Economy,’’ National Bureau of Economic Research,Working Paper 2970, May 1989. For an alternative view, see Meir G. Kohn and Nancy P. Marion, ‘‘The Implicationsof Knowledge-Based Growth for the Optimality of Open Capital Markets,’’ Canadian Journal of Economics, November 1992,pp. 865–83.16 An account of the numerous sources of gains from trade can be found in Cletus C. Coughlin, K. Alec Chrystal, and GeoffreyE. Wood, ‘‘Protectionist Trade Policies: A Survey of Theory, Evidence and Rationale,’’ Review, Federal Reserve Bank ofSt. Louis, January/February 1988, pp. 12–26.17 See Elhanan Helpman and Paul R. Krugman, Trade Policy and Market Structure, MIT Press, Cambridge MA, 1989.18 See James A. Brander and Barbara Spencer, ‘‘Export Subsidies and <strong>International</strong> Market Share Rivalry,’’ Journal of <strong>International</strong>Economics, February 1985, pp. 83–100.19 On the effects on culture and political domination, see J. J. Servain-Schreiber, The American Challenge, Hamish Hamilton,London, 1968. On trade and the environment, see Alison Butler, ‘‘Environmental Protection and Free Trade: Are TheyMutually Exclusive?’’ Review, Federal Reserve Bank of St. Louis, May/June 1992, pp. 3–16.& 22
THE WORLD OF INTERNATIONAL FINANCES BS Ar A0Rate of return in Ar Er A0Rate of return in Br Er B1I Br A1I AED CInvestment, savings, country AC D EInvestment, savings, country B& Figure 1B.1 The gain from the better allocation of capitalNotesThe heights of the curves I A and I B give the rates of return on an extra dollar’s worth of investment in countries A and B.The curves S A and S B give savings at different returns on savings in the two countries. With no flow of capital between thecountries, returns will be rA 0 and r0 B . Each dollar moving from A to B will result in a forgone return in A given by the height of I A,and a return in B given by the height of I B . For example, after CD dollars have left A for B, the added global return fromanother dollar is rB1 rA 1. The maximum gain from reallocating capital occurs at r E and is given by the difference between the twoshaded areas; the shaded area in B is the total return on investment between C and E, while the shaded area in A is theforgone total return on investment between C and E.We have already noted in the text of this chapter that the international flow of capital means that a project with avery high yield in one country is not forgone for want of funds while a low-yield project in a country of abundantcapital goes ahead. Capital flowing between the countries benefits everybody because the investors in the countrywith the low-yield projects can enjoy some of the high returns offered in the other country, while the country with thehigh-yield projects is able to fund projects that would otherwise be forgone. This is potentially a very important gainfrom the international flow of capital, and is illustrated graphically in Figure 1B.1.The heights of the curves I A and I B in Figure 1B.1 give the rates of return on investment in countries A and B atdifferent rates of investment. The curves slope downward because countries run out of good investment projects astheir rates of investment increase: the more projects are pursued the lower the expected return from an incrementalproject 20 The curves labeled S A and S B give the amounts saved at different rates of return earned on peoples’savings. If there is no flow of capital between the countries, the equilibrium expected returns in A and B are rA0and rB 0.The first dollar to flow from A to B means a forgone investment return in A of rA 0 in return for a return in B fromthat dollar of rB 0. This is a net gain of (r0 B rA 0 ). After $CD of capital has moved from A to B, an additional dollar ofcapital flow produces a net gain of (rB1 rA 1 ). It should be clear from the figure that there is a global gain in returnfrom investment until enough capital has moved to equalize returns in the two countries. Indeed, if the interest ratein countries A and B is r E , where by assumption the excess of investment over savings in B matches the excess ofsavings over investment in A, then the gain from a better capital flow is at a maximum. This maximum gain can beshown in the figure by recognizing that the total return from investment can be measured from the area underthe investment curve for that amount of investment. For example, the return on the investment between C and E on20 The height of I A or I B is referred to as the marginal efficiency of investment.23 &
THE WORLD OF INTERNATIONAL FINANCEAA 2TUTotal utilityA 1BOC 1 C C 2Consumption/time& Figure 1B.2 Utility from different consumption patternsNotesIf a country faces variable consumption, being with equal frequency C 1 and C 2 , the average total utility level that it enjoys isdistance BC. This is the average of distances A 1 C 1 and A 2 C 2 . If the country borrows from abroad during bad times and lendsabroad during good times, and thereby enjoys consumption at C every period, it enjoys a utility level given by a distance AC.The gain from smoothing consumption via borrowing from abroad and lending abroad is distance AB. This is a gain from theinternational flow of capital.the right-hand-side of Figure 1B.1 is the shaded area: each incremental dollar of investment has a return given bythe height of the investment curve, so adding all incremental gains between C and E gives the area beneath the curve.Against the return in B from imported capital is the forgone return in A from which capital is being exported. Thislost return is given by the area beneath I A between C and E on the left-hand-side of Figure 1B.1. The differencebetween the two areas is at a maximum at the equilibrium interest rate r E . This is the rate that would occur in anintegrated global capital market because it is the rate at which S A þ S B ¼ I A þ I B (note that at the equilibriuminterest rate r E the excess of savings over investment in country A is equal to the excess of investment over savings incountry B).There is a further benefit of the international flow of capital that comes from the smoothing of consumption thatis permitted by lending and borrowing. This gain comes from the fact that if a nation were unable to borrow fromabroad it would have limited scope to maintain consumption during temporary declines in national income. 21Similarly, if the nation were unable to invest abroad, it would have limited scope for dampening temporary jumps inconsumption during surges in national income.It is frequently assumed that people are subject to diminishing marginal utility of income and consumption.Indeed, this is a basic rationale for the postulate of risk aversion which is essential to much of the theory of finance.Diminishing marginal utility of consumption means that a more even path of consumption over time is preferred to amore erratic path with the same average level of consumption. The reason for this preference for a smooth path ofconsumption over time is illustrated in Figure 1B.2.The curve labeled TU shows the total utility derived from different rates of consumption. Because the curveslopes upward throughout its range, it shows that higher levels of consumption are preferred to lower levels; that is,total utility from consumption increases as consumption increases. However, the rate at which total utility increaseswith consumption diminishes as consumption expands. This is revealed by the lower slope of curve TU as21 National income, which is roughly equivalent to the gross national product and usually denoted by Y, can be classified intoconsumption C, investment I, government spending G, and exports minus imports (Ex Im). This classification is metfrequently in macroeconomics as the national income identity, Y C þ I þ G þ (Ex Im). We see that for a decline in Y not toinvolve a decline in consumption it would be necessary to suffer a decline in investment, government spending, or exportsminus imports. All these alternatives involve costs.& 24
THE WORLD OF INTERNATIONAL FINANCEconsumption increases, that is, as we move to the right along TU. The slope of TU gives the increase in total utilityper unit of added consumption and is called the marginal utility. 22If a nation is forced to vary consumption from year to year because it cannot borrow and invest internationallyand prefers not to vary other components of its national product, it may find itself consuming C 1 in one year whennational income experiences a decline, and C 2 in the following year when national income experiences a favorablefluctuation. The total utility from consumption of C 1 is given by the distance A 1 C 1 , while the total utility from C 2 isgiven by A 2 C 2 . The average of A 1 C 1 and A 2 C 2 , which is the average utility enjoyed in the two years, can be found bydrawing a straight line between A 1 and A 2 and finding the height of this line at its center. This follows because theheight of the line halfway between A 1 and A 2 is the average of A 1 C 1 and A 2 C 2 .Wefind that the average utility fromthe two years of variable consumption is BC.If the nation can borrow it might borrow the amount of C 1 C during the economic downturn allowing it toconsume OC. The nation might then lend amount CC 2 during the upturn and therefore also consume amount OCduring this time. 23 With consumption of OC in both periods, and with total utility given by the distance AC in bothperiods, the average total utility is simply AC. It is clear by inspecting Figure 1B.2 that the utility when consumptionis smoothed by international borrowing and lending is higher than when borrowing and lending does not occur.Intuitively, this outcome is because the added or marginal utility of income during the period of higher consumptionis smaller than the marginal utility lost during the period of lower consumption.The empirical relevance of the preceding argument has been examined by Michael Brennan and Bruno Solnik. 24They start by calculating what consumption would have been without international capital flows. This is determinedby subtracting private capital flows from actual consumption during years when there was a net capital inflow to thecountry, and adding private capital flows to actual consumption during years of net capital outflow. This tells uswhat would have had to happen to consumption if borrowing and lending had not occurred. 25 All consumption dataare put in per capita terms and adjusted for inflation.Brennan and Solnik compute the standard deviations of the growth rates of consumption adjusted for capitalflows and compare these with the standard deviations of the growth rates of actual consumption. This comparison ismade for the Organization for Economic Cooperation and Development (OECD) countries. They find that onaverage the standard deviations of actual consumption growth rates – which include international capital flows –are less than half the standard deviations of adjusted consumption growth rates – which exclude internationalcapital flows. The reduction in standard deviation due to international capital flows is apparent in every country theyexamined, and for all measures of capital flows they considered. 2622 Most introductory finance textbooks deal with the notion of diminishing marginal utility of consumption and its role inrisk aversion. See, for example, Richard Brealey and Stewart Myers, Principles of Corporate <strong>Finance</strong>, 7th edn, McGraw-Hill,New York, 2003.23 Borrowing and lending involves paying and receiving interest. However, if the amount borrowed equals the amountsubsequently lent, and if the periods are close together so that time value of money is unimportant, payments and receipts ofinterest cancel and can be ignored.24 See Michael J. Brennan and Bruno Solnik, ‘‘<strong>International</strong> Risk Sharing and Capital Mobility,’’ Journal of <strong>International</strong> Money and<strong>Finance</strong>, September 1989, pp. 359–73.25 This assumes all borrowing and lending affects consumption and not the other components of national product. Of course,borrowing and lending do in reality affect government spending and investment. However, a smoother pattern of governmentspending and investment should contribute to smoother consumption. Furthermore, consumption is often considered as theend purpose of economic activity. This supports the case for concentrating on consumption.26 The implications of consumption smoothing for welfare are overstated in Brennan and Solnik op. cit. See Maurice Obstfeld,‘‘<strong>International</strong> Risk Sharing and Capital Mobility: Another Look,’’ Journal of <strong>International</strong> Money and <strong>Finance</strong>, February 1992,pp. 115–21 and Michael J. Brennan and Bruno Solnik, ‘‘<strong>International</strong> Risk Sharing and Capital Mobility: Reply,’’ Journal of<strong>International</strong> Money and <strong>Finance</strong>, February 1992, pp. 122–3.25 &
THE WORLD OF INTERNATIONAL FINANCEInvestment in new capital could, like consumption, be smoothed via international capital flows. The empiricalevidence suggests, however, that relatively little investment smoothing occurs. This has been concluded from studiesof the connection between saving and investment within countries. In completely integrated capital markets, a dollarincrease in domestic saving would leave domestic investment unchanged and instead result in a dollar of exportedcapital. What has been shown, however, is that each dollar increase in domestic saving is, on average, associatedwith a 79 cent increase in net domestic investment. 27A benefit from international capital flows that is closely related to the gain from consumption smoothing is thegain from increased diversification of investment portfolios. This gain exists because the economic ups and downs indifferent countries are not perfectly synchronized. This allows internationally diversified investors to achieve ahigher expected return for a given degree of risk, or a lower risk for a given expected return. We do not discuss thishere as it is discussed extensively in Chapter 15. However, it should be clear that diversification gains depend ondifferent countries having different economic conditions and experiences, just as do the other gains from the freemovement of capital which we have described in this appendix.27 See Martin Feldstein and Phillippe Bachetta, ‘‘National Saving and <strong>International</strong> Investment,’’ National Bureau of EconomicResearch, Working Paper 3164, 1990.& 26
Part IThe markets for foreign exchangeThe foreign exchange market, which has severalconnected but nevertheless different parts, is the mostactive market on Earth, with daily turnover exceedingthat of major stock markets. Along with the size of themarket go massive profits and losses of unwary companies,opportunistic speculators, and central banks,as well as substantial income and employment incommercial and central banks, currency brokerages,and specialized futures and options exchanges.Part I, which consists of three chapters, introducesthe reader to the different components of theforeign exchange, or forex, market. Chapter 2 beginsby considering the exchange of bank notes, such asthe exchange of US Federal Reserve notes – thepaper money Americans carry in their wallets – foreuros or British pounds. Chapter 2 also explains howmoney in the form of bank deposits is exchanged inthe spot foreign exchange market. An understandingof what actually happens when a personcalls a bank to buy a foreign currency requires thatwe know how customers are debited and credited,and how the banks trade and settle transactionsbetween themselves. This is all explained in Chapter 2.The chapter ends by showing why knowledge ofexchange rates of each currency against the USdollar allows us to calculate all possible exchangerates. For example, it is shown why we can calculatethe exchange rate between the euro and the Britishpound from the euro–US dollar exchange rate andthe pound–US dollar exchange rate. It is also shownwhy this ability to compute so-called cross exchangerates is nevertheless limited in reality by thepresence of foreign exchange transaction costs.Chapter 3 describes another component of theforeign exchange market that plays an importantrole throughout the remainder of the book. This is theforward exchange market. Forward exchangeinvolves a contractual arrangement to exchangecurrencies at an agreed exchange rate on a stated datein the future. The forward market plays an importantrole in avoiding foreign exchange risk (hedging) andin choosing to take risk (speculating). Chapter 3provides the necessary background so that we canshow in later chapters how forward exchange can beused for hedging and speculating.After explaining the forward market we turn ourattention to currency derivatives that, as their namesuggests, derive their values from underlying values ofcurrencies. The derivatives discussed in Chapter 4are currency futures, currency options, and swaps.Currency futures are similar to forward exchangecontracts in that they help fix the net cost of or receiptsfrom foreign exchange involved in future transactions.However, currency futures trade on formal exchangessuch as the Chicago <strong>International</strong> Money Market,have only a limited number of value dates, come inparticular contract sizes, and can be sold back to theexchange. There are also a few other institutionaldifferences that we describe. These differencesmake forward contracts and currency futures ofslightly different value as vehicles for hedging andspeculation. Chapter 4 also describes currency options and swaps.Unlike forward contracts and currency futures, optionsallow buyers of the contracts discretion over whether toexercise (complete) an exchange of currencies at a
specified exchange rate. Different types of currencyoptions are described, along with the factors thataffect market prices, or premiums, on options. Currencyswaps involve twinned transactions, specifically arrangedto buy and to sell a currency, where the buying andselling are separated in time. For example, somebodybuying a British Treasury bill might buy the Britishpound spot and at the same time sell it forwardfor the date of maturity of the Treasury bill.The specifics of using futures, options, and swapsand their roles in hedging and speculating are onlybriefly covered in Chapter 4; we save the details forlater chapters in which investment, borrowing, hedging,and speculation are covered in greater depth. InPart I the purpose of the discussion is primarily tointroduce the reader to the institutional details ofthese fascinating and vital markets for foreignexchange.Most Importantly, forwards are used to settle transactionswhereas futures and options are not. It is primarilyfor this reason that we treat forward exchange in aseparate chapter.
Chapter 2An introduction toexchange ratesThe market in international capital ...is run by outlandishly well-paid specialists, back-roomtechnicians and rows of computer screens. It deals in meaninglessly large sums of money. It seemsto have little connection with the ‘‘real’’ world of factories and fast-food restaurants. Yet attimes ...it seems to hold the fate of economies in its grasp. The capital market is a mystery andit is a threat.The Economist, September 19, 1992To the ordinary person, international finance issynonymous with exchange rates, and indeed, a largepart of the study of international finance involves thestudy of exchange rates. What is not widely knownis the variety of exchange rates that exist at the samemoment between the same two currencies. Thereare exchange rates for bank notes, whichare,forexample, the Federal Reserve notes with picturesof former US presidents, and the equivalent notesissued by the European Central Bank. There are alsoexchange rates between checks stating dollar amountsand those stating amounts in euros or other currencyunits. Furthermore, the rates on these checks dependon whether they are issued by banks – bank drafts –or by corporations – commercial drafts – and onthe amounts of money they involve, and on the dateson the checks. 1 Exchange rates also differ according towhether they are for the purchase or sale of a foreigncurrency. That is, there is a difference, for example,between the number of US dollars required in orderto purchase a British pound, and the number of USdollars received when selling a pound.1 A commercial draft is simply a check issued by a company.We will begin by looking at exchange ratesbetween bank notes. While the market for banknotes is only a small proportion of the overallforeign exchange market, it is a good place to beginbecause bank notes are the form of money withwhich people are most familiar.THE FOREIGN BANK NOTE MARKETThe earliest experience that many of us have ofdealing with foreign currency is on our first overseasvacation. When not traveling abroad, most of ushave very little to do with foreign exchange, whichis not used in the course of ordinary commerce,especially in the United States. The foreign exchangewith which we deal when on vacation involves banknotes, or possibly foreign-currency-denominatedtravelers’ checks. Table 2.1 gives the exchange rateson bank notes facing a traveler on October 22,2002. Let us take a look at how these retail banknote rates are quoted.The first column of Table 2.1 gives exchangerates in terms of the number of units of each foreign29 &
THE MARKETS FOR FOREIGN EXCHANGE& Table 2.1 Exchange rates on foreign bank notes(Traveler’s dollar – October 22, 2002)Foreign Currency per US dollarBank buys foreigncurrency (sells US$)Argentina (Peso) 3.82 3.55Australia (Dollar) 1.84 1.73Bahamas (Dollar) 1.04 0.96Brazil (Real) 4.06 3.80Canada (Dollar) 1.60 1.53Chile (Peso) 758.00 720.00China (Renminbi) 8.48 8.10Colombia (Peso) 2,850.00 2,650.00Denmark (Krone) 7.80 7.40Europe (Euro) 1.05 0.99Fiji Islands (Dollar) 2.22 2.05Ghana (Cedi) 8,600.00 8,150.00Great Britain (Pound) 0.66 0.62Honduras (Lempira) 17.50 16.25Hong Kong (Dollar) 8.00 7.50Iceland (Krona) 91.00 85.50India (Rupee) 50.00 46.50Indonesia (Rupiah) 9,500.00 8,900.00Israel (Shekel) 5.20 4.80Japan (Yen) 129.00 121.00Malaysia (Ringgit) 3.95 3.65Mexico (New Peso) 10.40 9.60Morocco (Dirham) 11.10 10.30New Zealand (Dollar) 2.12 1.98Norway (Krone) 7.85 7.35Pakistan (Rupee) 61.00 57.00Panama (Balboa) 0.97 1.03Peru (New Sol) 3.75 3.48Philippines (Peso) 55.00 51.25Russia (Ruble) 33.00 30.50Singapore (Dollar) 1.85 1.72South Africa (Rand) 11.00 10.25South Korea (Won) 1,290.00 1,200.00Sri Lanka (Rupee) 100.00 93.00Sweden (Krona) 9.60 9.00Switzerland (Franc) 1.55 1.45Taiwan (Dollar) 36.25 33.50Thailand (Baht) 45.00 41.75Trinidad/Tobago (Dollar) 6.30 5.90Tunisia (Dinar) 1.44 1.34Turkey (1 million Lira) 1.59 1.71Venezuela (Bolivar) 1,480.00 1,370.00Source: Compiled from various bank and currency exchange quotations, October 22, 2002.& 30Bank sells foreigncurrency (buys US$)
AN INTRODUCTION TO EXCHANGE RATEScurrency that must be paid to the bank to buy aUS dollar. The column is headed ‘‘Bank buysforeign currency (sells US $)’’ because when a bankbuys foreign currency from a customer, it pays, orsells, the customer US dollars. Table 2.1 shows, forexample, that it takes 3.82 Argentine pesos or 1.84Australian dollars to buy a US dollar from the bank.The second column gives the number of units of eachforeign currency that a customer will receive from thebank for each US dollar. For example, the travelerwill receive Can$1.53 or £0.62 for each US dollar.The rates of exchange posted for travelers in bankand currency exchange windows or internationaltourist centers are the most expensive or unfavorablethat one finds. They are expensive in the sense thatthe buying and selling prices on individual currenciescan differ by a large percentage – frequently morethan 5 or 6 percent. The difference between buyingand selling prices is called the spread. InTable2.1we see that, for example, the 0.11 (¼ 1.84 1.73)difference between the buying and selling exchangeratesfortheAustraliandollarversustheUSdollarisa spread of approximately 6 percent. Differencesbetween the effective buying and selling rates onpaper currency can be particularly large on very smalltransactions when there is a fixed charge for conversionaswellasaspreadonbuyingandsellingrates.Our experience changing currencies on vacationshould not lead us to believe that large-scaleinternational finance faces similar costs. The banknote market used by travelers involves large spreadsbecause generally only small amounts are traded,which nevertheless require as much paperwork asbigger commercial trades. Another reason why thespreads are large is that each bank and currencyexchange must hold many different currencies tobe able to provide customers with the currenciesthey want, and these notes do not earn interest.This involves an opportunity cost of holding currencyinventory, as well as risk from short-termchanges in exchange rates. Furthermore, bankrobbers specialize in bank notes; therefore, thosewho hold large amounts of them are forced to takecostly security precautions – especially whenmoving bank notes from branch to branch orcountry to country. A further risk faced in theexchange of bank notes is the acceptance of counterfeitbills which frequently show up outside theirown country where they are less likely to be identifiedas forgeries.It is worth noting that because banks face a lowerrisk of theft of travelers’ checks, and because thecompanies that issue them – American Express,Visa, Thomas Cook, Master Card, and so on –will quickly credit the banks that accept theirchecks, many banks give a more favorable purchaseexchange rate on checks than on bank notes.In addition, issuers of travelers’ checks enjoy the useof the money paid for the checks before they arecashed. Furthermore, the banks selling the checksto customers do not face an inventory cost;payment to the check issuing company such asAmerican Express by a check-selling bank is madeonly when the checks are being purchased by acustomer. Travelers’ checks also have the advantageof not having to be sent back to the country that usesthe currency, unlike any surplus position of banknotes. They can be destroyed after the acceptor ofthe checks has been credited in their bank account.These benefits to the issuers and acceptors of travelers’checks keep down the buying–selling spread.Credit card transactions share some of theadvantages of travelers’ checks. There is no need tophysically move anything from country to country,no need to hold an inventory of noninterest earningnotes, and so on.While the exchange of bank notes betweenordinary private customers and banks takes place ina retail market, commercial banks, and currencyexchanges trade their surpluses of notes betweenthemselves in a wholesale market. The wholesalemarket involves firms which specialize in buying andselling foreign bank notes with commercial banksand currency exchanges. These currency-tradingfirms are bank-note wholesalers.As an example of the workings of the wholesalemarket – during the summer a British bank mightreceive large numbers of euros from Germans travelingin Britain. The same British bank may also beselling large numbers of Swiss francs to British31 &
THE MARKETS FOR FOREIGN EXCHANGEtourists leaving for vacations in Switzerland. TheBritish bank will sell its surplus euros to a bank-notewholesaler in London, who might then transportthe euro notes back to a bank in continental Europeor to a bank outside Europe in need of euro notesfor their citizens intending to travel to Europe. TheBritish bank will buy Swiss francs from a wholesalerwho may well have transported them from Switzerland,or brought them from banks which boughtfrancs from vacationing Swiss. The spreads on thewholesale level are less than retail bank-notespreads, generally well below 2 percent, becauselarger amounts are generally involved.THE SPOT FOREIGN EXCHANGE MARKETFar larger than the bank note market is the spotforeign exchange market. This is involved withthe exchange of currencies held in different currencydenominated bank accounts. The spot exchangerate, which is determined in the spot market, is thenumber of units of one currency per unit of anothercurrency, where both currencies are in the form ofbank deposits. The deposits are transferred fromsellers’ to buyers’ accounts, with instructions toexchange currencies taking the form of electronicmessages, or of bank drafts, which are checksissued by banks. Delivery, or value, from theelectronic instructions or bank drafts is ‘‘immediate’’– usually in 1 or 2 days. This distinguishes thespot market from the forward market which is discussedin Chapter 3, and which involves the plannedexchange of currencies for value at some date in thefuture – after a number of days or even years.Spot exchange rates are determined by the suppliesof and demands for currencies being exchangedin the gigantic, global interbank foreign exchangemarket. 2 This market is legendary for the freneticpace at which it operates, and for the vast amount ofmoney which is moved at lightning speed in responseto minuscule differences in price quotations.2 The supply and demand curves for currencies are derivedand used to explain the economic factors behind exchangerates in Chapter 6.ORGANIZATION OF THE INTERBANKSPOT MARKETThe interbank foreign exchange market is thelargest financial market on Earth. After correctingfor double-counting, so that a purchase by one bankand the corresponding sale by a second bank is countedonly once, average turnover is over $1.2 trillionper day. 3 The largest part of trading, over 31 percentof the global total, occurs in the United Kingdom.Indeed, the amount of foreign currency tradingconducted in London is so large that a larger shareof currency trade in US dollars (26 percent) andeuros (27 percent) occurs in the United Kingdomthan in the United States (18 percent) or Germany(10 percent) respectively. Table 2.2 shows that the& Table 2.2 Geographical distribution of averagedaily foreign exchange turnover, April 2001CountryNet turnover, abillion US$PercentageshareUnited Kingdom 504 31.1United States 254 15.7Japan 147 9.1Singapore 101 6.2Germany 88 5.4Switzerland 71 4.4Hong Kong 67 4.1Australia 52 3.2France 48 3.0Other 286 17.8Total 1618 100.0Notea Net of double-counting; no adjustment for cross-borderdouble-counting.Source: Central Bank Survey of Foreign Exchange MarketActivity in April 2001, Bank for <strong>International</strong> Settlements,Basle, Switzerland, December 2003, p. 8.3 See Triennial Central Bank Survey of Foreign Exchange andDerivatives Market Activity, Bank for <strong>International</strong> Settlements,Basle, Switzerland, March 2002. After a period ofphenomenal growth, the turnover on the market hasdeclined, partly because of the advent of the euro, thenew common currency of a dozen European countries:there is no longer need to exchange currencies when doingbusiness between Germany, France, Italy, Spain, and so on.& 32
AN INTRODUCTION TO EXCHANGE RATES$ Billion$800$700$600$500$400$300$200$100$0Unadjusted for double-countingAdjusted for double-counting$77$58$183$129$230$167$295$244$405$351$287$2541986 1989 1992 1995 1998 2001& Figure 2.1 Daily turnover in the US foreign exchange market, 1986–2001NotesDaily trading volume in the US foreign exchange market averaged $254 billion in April 2001, down 28 percent from1998. Introduction of euro, consolidation among financial institutions, increased trading through electronic brokers andshifting of trading from the United States have contributed to this decline.Source: Summary of Results of the US Foreign Exchange Market Survey Conducted in April 2001, Federal Reserve Bankof New York, 2003, p. 3.United States has the second largest foreignexchange market, followed by Japan, Singapore,and Germany. Figure 2.1 shows the size of the USforeign exchange market, indicating the recentdecline due to the introduction of the euro and thenew forms of electronic price discovery in theinterbank market made possible by new electronicforms of market making.The foreign exchange market is an informalarrangement of the larger commercial banks and anumber of foreign exchange brokers. The banks andbrokers are linked together by telephone, telex, anda satellite communications network called theSociety for Worldwide <strong>International</strong> FinancialTelecommunications (SWIFT). This computer-basedcommunications system, based inBrussels, Belgium, links banks and brokers in justabout every financial center. The banks and brokersare in almost constant contact, with activity in somefinancial center or other 24 hours a day. 4 Because of4 Indeed, in the principal centers like New York, London,Tokyo,and Toronto,largebanks maintain 24-houroperationsto keep up with developments elsewhere and continuetrading during other centers’ normal working hours.the speed of communications, significant events havevirtually instantaneous impacts everywhere in theworld despite the huge distances separating marketparticipants. This is what makes the foreign exchangemarket just as efficient as a conventional stock orcommodity market housed under a single roof.The efficiency of the foreign exchange market isrevealed in the extremely narrow spreads betweenbuying and selling prices. These spreads can besmaller than a tenth of a percent of the value of acurrency exchange, and are therefore about onefiftiethor less of the spread faced on cash by internationaltravelers. The efficiency of the market isalso manifest in the electrifying speed with whichexchange rates respond to the continuous flowof information that bombards financial markets.Participants cannot afford to miss a beat in thefrantic pulse of this dynamic, global market. Indeed,the bankers and brokers that constitute the foreignexchange market can scarcely detach themselvesfrom the video monitors that provide the latestnews and prices as fast as the information cantravel along the telephone wires and radio waves ofbusiness news wire services such as Dow JonesTelerate and Reuters.33 &
THE MARKETS FOR FOREIGN EXCHANGEIn the United States, as in most other markets, Figure 2.2, which depicts the US foreignsingle-auction market. 6there are two levels on which the foreign exchangemarket operates, the direct interbank level, andan indirect level via foreign exchange brokers.In the case of interbank trading, banks trade directlywith each other, and all participating banks aremarket-makers. That is, in the direct interbankmarket, banks quote buying and selling prices toeach other. The calling bank does not specifywhether they wish to buy or sell, or how much ofthe currency they wish to trade. Bank A can callBank B for a quote of ‘‘their market’’ or Bank B cancall Bank A. This is known as an open-bid doubleauction, ‘‘open’’ because the buy/sell intentionand amount are not specified – it is left open – and‘‘double auction’’ because banks can call each otherfor price quotations. Because there is no centrallocation of the market and because price quotes area continuous process – a quote of the bank’s marketto another bank is good only for seconds whilethe traders speak – the direct market can becharacterized as a decentralized, continuous,open-bid, double-auction market. 5In the case of foreign exchange brokers, of whichthere are fewer than 20 versus over 100 commercialbanks in the New York market, so-called limitorders are placed with brokers by some banks.For example, a commercial bank may place an orderwith a broker to purchase £10 million at $1.5550/£.The broker puts this on their ‘‘book,’’ and attemptsto match the purchase order with sell orders forpounds from other banks. While the market-makingbanks take positions on their own behalf and forcustomers, brokers deal for others, showing callerstheir best rates, and charging a commission to buyingand selling banks. Because of its structure, theindirect broker-based market can be characterized asexchange market, shows that currencies are alsobought and sold by central banks. Central banksenter the market when they want to changeexchange rates from those that would result onlyfrom private supplies and demands, and in order totransact on their own behalf; central banks buy andsell bonds and settle transactions for governmentswhich involve foreign exchange payments andreceipts. Exhibit 2.1 provides a succinct summaryof the players in the foreign exchange market.As we have mentioned, in the direct interbankmarket, which is the largest part of the foreignexchange market, bankers call foreign exchangedealers at other banks and ‘‘askforthemarket.’’ Thecaller might say, ‘‘Your market in sterling please.’’This means, ‘‘At what price are you willing to buy andat what price are you willing to sell British pounds forUS dollars?’’ (British pounds are sometimes calledsterling). In replying, a foreign exchange dealer mustattempt to determine whether the caller really wantsto buy or to sell, and must relate this to what his orher own preference is for sterling: do they want moreor fewer pounds? This is a subtle and tricky gameinvolving human judgment. Bluff and counterbluffare sometimes used. A good trader, with a substantialorder for pounds, may ask for the market in Canadiandollars. After placing an order he or she might say,‘‘By the way, what’s your market in sterling?’’ Dealersare not averse to having their assistants place the reallylarge and really small orders, just to hope for favorablequotes. A difference in quotation of the fourth decimalplace can mean thousands of dollars on a large order.It is rather like massive-stakes poker.If a trader who has been called wants to sellpounds, he or she will quote on the side that is feltto be cheap for pounds, given this trader’s feel ofa quasi-centralized, continuous, limit-book,5 See Mark D. Flood, ‘‘Microstructure Theory and theForeign Exchange Market,’’ Review, Federal Reserve Bankof St. Louis, November/December 1991, pp. 52–70.6 See Mark D. Flood, op.cit., p. 57.& 34the market. For example, if the trader feels thatother banks are selling pounds at $1.6120/£, he orshe might quote $1.6118/£ as the selling price,along with a buying price that is also correspondinglylow. Having considered the two-way price,the caller will state whether he or she wishes tobuy or sell, and the amount. Once the rate hasbeen quoted, convention determines that it must be
AN INTRODUCTION TO EXCHANGE RATESOrdersplacedCentral bankOrdersplacedOrdersplacedCompanies Commercial bankOrders placedInside spread shownOpen-biddouble auctionExchangebrokerCommercial bankOrdersplacedOrders placedInside spread shownCompanies& Figure 2.2 Organization of the foreign exchange marketNotesThe main foreign exchange market makers are large commercial banks who are in continuous contact with each other, quoting‘‘bid’’ and ‘‘ask’’ exchange rates in the interbank market. The currency trading banks trade on their own account to affect theinventories of currencies they hold, as well as in response to large buy or sell orders of customers. In addition to interbanktrading, limit book orders to buy and sell are placed with foreign exchange brokers who help match trades. Central banks alsosometimes enter the market, buying and selling to influence exchange rates or performing transactions for the government.honored whatever the decision of the caller, up to apredetermined limit. The standard-sized interbanktrade is for $10 million (and the equivalent in theforeign currency). However, trades may be a multipleof the standard trade or less than the standardtrade (although always more than $1 million).As mentioned, after being quoted the market thecaller has only seconds to decide. Good judgmentof the counterparty and good judgment of thedirection of the market are essential in this multibillion-dollargame. It is important to be accurateand constantly in touch with events.Delivery dates and procedures forspot exchangeWhereas bank notes of the major Western countriesare exchanged for each other instantaneously over thecounter, when US dollars are exchanged in the NewYork interbank spot market with non-North Americancurrencies, funds are not generally received untiltwo business days after the initiation of the transaction.With the currencies of the North Americancontinent, the US and Canadian dollars and theMexican peso, delivery is slightly quicker, with anexchange providing value after one business day. Thismeans there is a distinction between the value dateand the initiation date of a transaction, the trade date.The distinction can be illustrated by an example. 7Suppose that a financial executive of an Americancorporation, Amcorp, calls his or her bank, AmbankNational, a large currency-dealing bank in New YorkCity, to buy £2 million. Suppose that the call isplaced on Thursday, May 18, and that the Britishpounds are to be used to settle Amcorp’s debt toBritcorp. Ambank will quote an exchange rate atwhich it will sell Amcorp the £2 million. If Amcorpapproves of this rate, then the foreign exchangedepartment of Ambank will request details formaking the payment in Britain. These details willinclude the bank at which Britcorp is to be paid andthe account number.7 It is possible to send money for value sooner than two daysoutside of North America and one day within NorthAmerica. However, this is somewhat more expensive thanthe normal spot rate.35 &
THE MARKETS FOR FOREIGN EXCHANGEEXHIBIT 2.1INSTITUTIONAL BASICS OF THE FOREIGNEXCHANGE MARKETThe following account of the foreign exchange market,which appeared in the Review of the Federal ReserveBank of St. Louis, explains the dual tiers of the market:direct interbank trades plus trades through brokers:The foreign exchange market is the internationalmarket in which buyers and sellers of currencies‘‘meet.’’ It is largely decentralized: the participants(classified as market-makers, brokers and customers)are physically separated from one another;they communicate via telephone, telex and computernetwork. Trading volume is large, estimated at$254 billion for the US market in 2001. Most ofthis trading was between bank market-makers.The market is dominated by the market-makersat commercial and investment banks, who tradecurrencies with each other both directly andthrough foreign exchangebrokers. Market-makers,as the name suggests, ‘‘make a market’’ in one ormore currencies by providing bid and ask pricesupon demand. A broker arranges trades by keepinga ‘‘book’’ of market-maker’s limit orders – that is,orders to buy (alternatively, to sell) a specifiedquantity of foreign currency at a specifiedprice – from which he quotes the best bid and askorders upon request. The best bid and ask quotes ona broker’s book are together called the broker’s‘‘inside spread.’’ The other participants in themarket are the customers of the market-makingbanks, who generally use the market to completetransactions in international trade, and centralbanks, who may enter the market to move exchangerates or simply to complete their own internationaltransactions.Market-makersmaytradefortheirownaccount–that is, they may maintain a long or short position ina foreign currency – and require significant capitalizationfor that purpose. Brokers do not contactcustomers and do not deal on their own account;instead, they profit by charging a fee for the serviceof bringing foreign market-makers together. Number updated from original publication.Source: Mark D. Flood, ‘‘Microstructure Theory and theForeign Exchange Market,’’ Review, Federal Reserve Bankof St. Louis, November/December 1991, pp. 52–70.The details provided by Amcorp to Ambank willtypically be conveyed to the designated bank inBritain, Britbank, by sending a message on the day ofordering the pounds, May 18, via SWIFT. TheSWIFT network, which has been available since 1977,has grown so rapidly that it has virtually replaced thepreexisting methods of conveying messages, namelythe mail and telegraphic transfer. SWIFT uses satellitelinkages, and transmits messages between banks in astandard format to minimize errors which can easilyoccur due to different languages and banking customs.SWIFT has been so successful that banks in justabout every country, including Russia and othercommunist countries, have joined or applied to join. 88 Since 1987, non-banking financial institutions such asbrokerage firms have also been given access to SWIFT.& 36The spot exchange rate that is agreed by AmbankNational on Thursday, May 18 will be binding andwill not be changed even if market conditionssubsequently change. A confirmation of the orderfor £2 million at the agreed exchange rate – forexample, $1.6000/£ – will be sent out to Amcorpon Thursday, May 18. Because of the interveningweekend, the value date, which is two business dayslater, is Monday, May 22, and on this day Ambankwill debit Amcorp’s account at the bank by$3.2 million, the dollar price of the £2 millionat $1.6000/£. On the same value date, May 22,Britbank will credit Britcorp’s account by£2 million. The transaction is complete for the payerand payee, with the payee, Britcorp, being credited£2 million in Britain, and Amcorp, the payer,being debited the dollar equivalent, $3.2 million.
AN INTRODUCTION TO EXCHANGE RATESOur description of the transaction in theexample is complete only for the payer and thepayee. We have not yet described the settlementbetween the banks. Specifically, the bank that haspurchased foreign currency will have to pay thebank that has sold the foreign currency. This paymentgenerally takes place via a clearing house.A clearing house is an institution at which bankskeep funds which can be moved from one bank’saccount to another to settle interbank transactions.When foreign exchange is trading against the USdollar the clearing house that is used is calledCHIPS, an acronym for Clearing HouseInterbank Payments System. CHIPS is locatedin New York and, as we shall explain later, transfersfunds between member banks. Currencies are alsotraded directly for each other without involving thedollar – for example, euros for British pounds, orDanish crowns for Swiss francs. In these situationsEuropean clearing houses are used. However,because a substantial volume of transactions is settledin dollars, we consider how CHIPS works,although we can note that settlement betweenbanks is similar in other financial centers. We willalso explain a relatively new form of settlementbetween banks that has been spurred on by concernover the possible vulnerability of the internationalfinancial system to extreme outside events.Bank settlement via CHIPS and CLSCHIPS is a computerized mechanism through whichbanks hold US dollars to pay each other whenbuying or selling foreign exchange. 9 The system isowned by the large New York-based clearing banks;has over 150 members, including the US agenciesand subsidiaries of many foreign banks; and handleshundreds of thousands of transactions a day, worthtogether hundreds of billions of dollars.We can see how CHIPS works by extending thesituation considered earlier, of Amcorp initiatingpayment to Britcorp on Thursday, May 18, with9 For an account of the workings of CHIPS, see www.chips.orgBritcorp being credited at Britbank two businessdays later, Monday, May 22, after the interveningweekend. The extension is to assume that immediatelyon agreeing to sell Amcorp £2 million,Ambank enters the interbank market to replenish itspound account at Britbank (Ambank has its sterlingon deposit at Britbank).Let us suppose that after placing a few telephonecalls in the interbank market, Ambank finds thecheapest rate on pounds to be at UKbank (perhapsUKbank has just paid out US dollars for a client andwants to replenish its dollar holdings in exchangefor pounds). On agreeing to buy £2 million fromUKbank, Ambank gives instructions to deliver thepounds to its account at Britbank. 10 Ambank’spayment to Britbank will be effected by Ambankentering into its CHIPS computer terminal its owncode, that of UKbank, and the number of dollars tobe paid. Similarly, UKbank enters its code,Ambank’s code, and the number of dollars to bereceived. This is all done at the time the two banksagree on the purchase/sale, assumed to be the sameday as Amcorp orders the pounds, May 18.CHIPS records the information received fromAmbank and UKbank, and keeps track of otheramounts to be paid or received by these banks andthe many other CHIPS members. On the value dateof the transaction, May 22, settlement reportsare sent to the banks for gross and net amounts tobe paid or received on that day. Assuming Ambankand UKbank have no dispute over the reports theyreceive, the debtor bank, in our case Ambank, mustsend instructions to the Federal Reserve Bank ofNew York to debit Ambank’s account there, calledits escrow account, and to credit the escrowaccount of UKbank. The instruction from Ambankis sent via Fedwire, a system also used forsettlement of domestic transactions.Since September 2002 a new settlement systemhas been provided to the foreign exchange marketsby New York-based CLS Bank, where CLS stands10 The pounds will be moved from UKbank to Britbank as partof the normal settlement between banks provided by theclearing house in London.37 &
THE MARKETS FOR FOREIGN EXCHANGEfor Continuous Linked Settlement. 11 Thevirtue of a continuous linked system is that itprevents situations where a bank pays for a currencybefore receiving it, and then finds out the bank thatwas to provide the currency has become bankrupt.This has been a fear since at least 1974 whenHerstatt Bank, a small German bank, failed. Bycontinuously linking payment and receipt so theyoccur at the same time, what is sometimes called‘‘Herstatt risk’’ is avoided. The CLS Bank is ownedby a consortium of banks and began settling justthe major currencies and handling settlementonly for banks, but is expanding to settle morecurrencies and to settle transactions for corporatemembers. The corporate members are referredto as ‘‘third parties,’’ with their transactionsgoing through banks, but with all transactionslinked.The informal, doubled-tiered structure of the USforeign exchange market, with direct interbankdealing coexisting with indirect brokered transactions,is similar to that of markets in Canada,Britain, and many other countries. In some continentalEuropean countries the procedure is moreformal, with bank representatives, including arepresentative of the central bank, meeting dailyface-to-face. Contracts are exchanged directly,although an informal market coexists in which manyof the transactions occur. The formal meetingprovides official settlement exchange rates that areused for certain transactions.Exhibit 2.2 gives a lively and vivid account ofa typical transaction in the US interbank market,and a transaction made indirectly via a broker. Theexample introduces some of the jargon that isinvolved in the parsimonious conversations.Retail versus interbank spot ratesWhile it is only exchange rates between banks thatare determined in the interbank market, exchange11 CLS is described in Global <strong>Finance</strong>, July 2003, pp. 1–3.See also www.cls-group.com& 38rates faced by banks’ clients are based on theseinterbank rates. Banks charge their customersslightly more than the going interbank selling or askrate, and pay their customers slightly less than theinterbank buying or bid rate. That is, the retailspread is wider than the interbank spread. Theextent of a bank’s markup or markdown fromthe going interbank rate depends principally on thesize of the retail transaction. Banks will not generallyenter the interbank market, especially for smalltransactions, using instead currency they alreadyown or adding to the amount they own. However,banks still base their retail spot rates on the interbankrates, telephoning the banks’ own foreignexchange trading desks before quoting on largetransactions. Larger banks have tellers’ terminalslinked to the foreign exchange trading room forcontinuous updating of retail rates.Customer drafts and wire transfersWhen a customer requests foreign exchange from abank, with this to be paid to a creditor in a foreigncountry, the bank sells the customer a draft payableto the creditor. This draft will be drawn against anaccount the bank holds with a bank in the countryin which the payment is to be made. For example, ifan American needs to make a Canadian dollarpayment to a Canadian, they can buy a draft from aUS bank, where this draft is drawn against the USbank’s Canadian dollar account at a Canadian bank.A speedier settlement can be made by buyinga wire transfer, where instead of mailing a draft,the instructions are sent via SWIFT or some similarelectronic means. The customer pays the US banka charge for the draft or transfer, with wire transferscosting slightly more.When one bank maintains an account at anotherbank the banks are called correspondents, wherethis term originates from the mail instructions thatused to be sent between them. Commercial bankskeep accounts at correspondents in all majorcountries to help their customers make payments inthese countries, and to earn the fees charged fortheir services.
AN INTRODUCTION TO EXCHANGE RATESEXHIBIT 2.2 AN EXCHANGE ON THE EXCHANGE: A CONVERSATIONBETWEEN MARKET-MAKERS IN THE FOREIGN EXCHANGE MARKETThe following account of an exchange betweencurrency traders is an updated, slightly revisedversion of a description of a typical conversationthat appeared in the Review of the Federal ReserveBank of St. Louis: updating is required to reflectthe fact that Germany has replaced the Deutschmarkwith the euro. In this account, Mongobank and Loans’n Things are two market-making banks. Interpretationsof jargon are given as the jargon is used. Forexample, we are told that ‘‘Two mine’’ means topurchase two million units of a currency. ‘‘One bytwo’’ means being willing to buy one million units ofa currency and sell two million units of the samecurrency.In the direct market, banks contact each other.The bank receiving a call acts as a market-makerfor the currency in question, providing a two-wayquote (bid and ask) for the bank placing the call. Adirect deal might go as follows:Mongobank: ‘‘Mongobank with a dollar-europlease?’’(Mongobank requests a spot marketquote for the euro (EUR)against US dollars (USD).Loans’n Things: ‘‘20–30’’(Loans’n Things will buy euros at1.1520 USD/EUR and sell eurosat 1.1530 USD/EUR – the 1.15part of the quote is understood.The spread here is ‘‘10 points.’’)Mongobank: ‘‘Two mine.’’(Mongobank buys EUR 2,000,000for USD 2,306,000 at 1.1530USD/EUR, for payment twobusiness days later. The quantitytraded is usually one of a handful of‘‘customary amounts.’’)Loans’n Things: ‘‘My euros to Loans ‘n ThingsFrankfurt.’’Mongobank:(Loans n’ Things requests that paymentof euros be made to their accountat their Frankfurt branch. Paymentwill likely be made via SWIFT.) a‘‘My dollars to Mongobank New York.’’(Mongobank requests that paymentof dollars be made to them in NewYork. Payment might be made viaCHIPS.) bSpot transactions are made for ‘‘value date’’ (paymentdate) two business days later to allow settlementarrangements to be made with correspondents orbranches in other time zones. This period is extendedwhen a holiday intervenes in one of the countriesinvolved. Payment occurs in a currency’s home country.The other method of inter-bank trading is brokeredtransactions. Brokers collect limit orders from bankmarket-makers. A limit order is an offer to buy(alternatively to sell) a specified quantity at a specifiedprice. Limit orders remain with the broker untilwithdrawn by the market-maker.The advantages of brokered trading include therapid dissemination of orders to other marketmakers,anonymity in quoting, and the freedom not toquote to other market-makers on a reciprocal basis,which can be required in the direct market. Anonymityallows the quoting bank to conceal its identity andthus its intentions; it also requires that the brokerknow who is an acceptable counterparty for whom.Limit orders are also provided in part as a courtesy tothe brokers as part of an ongoing business relationshipthat makes the market more liquid ...A market-maker who calls a broker for a quote getsthe broker’s inside spread, along with the quantities ofthe limit orders. A typical call to a broker mightproceed as follows:Mongobank:‘‘What is sterling, please?’’(Mongobank requests the spot quotefor US dollars against British pounds(GBP).)39 &
THE MARKETS FOR FOREIGN EXCHANGEFonmeister:Mongobank:Fonmeister:‘‘I deal40–42,onebytwo.’’(Fonmeister Brokerage has quotes tobuy £1,000,000 at 1.7440 USD/GBP,and to sell £2,000,000 at 1.7442 USD/GBP)‘‘I sell one at 40, to whom?’’(Mongobank hits the bid for thequantity stated. Mongobank couldhave requested a different amount,which would have required additionalconfirmation from the biddingbank.)[A pause while the deal is reported toand confirmed by Loans ‘n Things]‘‘Loans ‘n Things London.’’(Fonmeister confirms the deal andreports the counterparty to Mongobank.Payment arrangements will be madeand confirmed separately by therespective back offices. The broker’sback office will also confirm the tradewith the banks.)Value dates and payment arrangements are thesame as in the direct dealing case. In addition to thepayment to the counterparty bank, the banks involvedshare the brokerage fee. These fees are negotiable inthe United States. They are also quite low: roughly$20 per million dollars transacted.Notesa The Society for Worldwide Interbank Financial Telecommunication(SWIFT) is an electronic message network.In this case, it conveys a standardized paymentorder to a German branch or correspondent bank, which,in turn, effects the payment as a local inter-bank transferin Frankfurt.b The Clearing House for Interbank Payments System(CHIPS) is a private inter-bank payments system inNew York City.Source: Mark D. Flood, ‘‘Microstructure Theory and theForeign Exchange Market,’’ Review, Federal Reserve Bankof St. Louis, November/December 1991, pp. 52–70.Internet exchangeIf one person has more, say, pounds than they need,and another person has fewer pounds than theyneed, they could, in principle, exchange the poundsbetween themselves. For example, the pound sellerwould receive dollars and the pound buyer would paydollars. Both parties would gain relative to exchangingcurrency through a bank provided they kept theexchange rate among themselves between the bid andask exchange rates of the banks. The reasons why thismutually beneficial arrangement rarely occurs are:1 It is difficult for the parties to find each other.2 Private transactions require trust in the otherparty because payment precedes receipt.There are a growing number of alternatives forexchanging foreign currency through the Internet.The Internet provides a medium through which theparties can find each other. However, the needto have trust still necessitates an intermediary. Thiscould be a well-known bank, but there are otherinstitutions that are providing exchange services.& 40As confidence in the safety of such exchangesgrows, it is likely that Internet-based currencyexchange will grow in importance.Conventions for spot exchange quotationIn virtually every professional enterprise, especiallyin the realm of finance and economics, there arespecial conventions and a particular jargon. This iscertainly true in the foreign exchange market,where practices in the quotation of exchange ratesmake the quotes difficult to interpret unless thejargon and conventions are well understood.Let us consider the spot exchange rates shown inthe lower part of Figure 2.3 (the upper part ofthe table showing ‘‘Key Currency Cross Rates’’ isdiscussed later in the chapter). The figure quotesrates from The Wall Street Journal of May 23, 2003.These are the previous day’s exchange rates, quotedat approximately 4:00 pm, Eastern Time inNew York. As the table states, the rates are those onsales of more than $1 million by banks to otherbanks. That is, the rates are interbank rates.
AN INTRODUCTION TO EXCHANGE RATES& Figure 2.3 Interbank spot and selected forward exchange ratesNotesExchange rates can be quoted either as US dollars per unit of foreign currency or as foreign currency per US dollar. The latterform, for example, SFr1.2957/$ is referred to as ‘‘European terms.’’ This is the way most exchange rates are quoted in theinterbank market. The exceptions are the euro and British pound which are quoted as ‘‘US dollar equivalent.’’ For example,the pound would be quoted as $1.6348/£. Newspapers typically quote the mid-rate, which is half way between the bid and the askrates, or selling rates, whereas interbank quotes involve both buying and selling rates.Source: Reprinted by permission of The Wall Street Journal, #2003 Dow Jones & Company Inc. All rights reserved.As indicated in the figure, retail rates to bank clientswill be less favorable than these interbank rates.Figure 2.3 gives rates in two ways – as the numberof US dollars per foreign currency unit, which iscalled US dollar equivalent – and as the numberof units of foreign currency per US dollar. Toaclose approximation, the figures in the second twocolumns are merely the reciprocals of the figures in41 &
THE MARKETS FOR FOREIGN EXCHANGEthe first two columns. With the exception of theeuro and UK pound for which the practice in theinterbank market is to quote in US dollar equivalents,that is as US dollars per euro or per pound,other rates in the interbank market are quoted asforeign currency per US dollar. The quotation,(foreign) currency per US dollar, is known asEuropean terms. 12 For example, on May 22,2003 in the interbank market, the US dollar wouldhave been quoted in European terms as 1.5195Australian dollars (A$1.5195/$) or 8.2781ChineseRenminbi (¥8.2781/$). 13Figure 2.3 does not reveal whether the exchangerates are for selling or buying foreign currency.It is customary for newspapers to quote eithermid-rates – rates half way between the buying andselling rates – or if only one side of the market isgiven, the rates are most likely the banks’ sellingrates. However, as we have seen, interbank traderswhen asked for the market give two-way quotations.The selling rates are called offer rates orask rates. If the rates in the figure are the offer or askrates, then in order to determine the buying orbid rates, the numbers in the table would have tobe adjusted. We might guess that if banks are sellingUS dollars for 1.2957 Swiss francs (SFr 1.2957/$),they might be buying US dollars for SFr1.2952/$.Because the conventional form of quotation ofSwiss franc and almost every other currency is inEuropean terms, that is, foreign currency per USdollar, it is easier to think of exchange rates asthe buying and selling prices of US dollars, ratherthan as the selling and buying prices of the foreigncurrency.Note that the Swiss franc amount being paid forUS dollars (the bank’s Swiss franc buying or bidprice on dollars, SFr1.2952/$) is slightly lower12 This is a carry over of the fact that the practice on theEuropean Continent was to quote in units of foreigncurrency per dollar, while the practice in the UnitedKingdom was to quote dollars per pound that is, US dollarequivalent.13 Renminbi means ‘‘the peoples’ money.’’ The symbol ¥follows the Chinese currency name, the ‘‘yuan.’’& 42than the amount being charged for US dollars (thebank’s Swiss franc selling or ask price for dollars,SFr1.2957/$). The difference between the tworates is the spread. More generally, the Europeanterms exchange rates can all be thought of as bidsand asks on the US dollar since they are in terms ofamounts of foreign currency per US dollar. Forexample, the Can$1.3757/$ entry in Figure 2.3,can be thought of as the bid on a US dollar (ask onthe Canadian dollar): the bank pays Can$1.3757 fora US dollar. The ask for the US dollar (bid on theCanadian dollar) might be Can$1.3762/$.In the case of the euro and pound, which unlikeother currencies, are conventionally quoted as USdollar equivalents, it is easier to think of the$1.1694/d and $1.6348/£ in Figure 2.3 as the USdollar selling prices of euros and pounds – thebank’s ask or offer (selling) prices for euros andpounds. The bid or buying price of euros andpounds might be $1.1690/d and $1.6343/£. Ofcourse, an ask on the pound is a bid on the dollar,and a bid on the pound is an ask on the dollar.Because the convention is to quote the euro andsterling as US dollars per euro or pound, it is easierto think of their exchange rates as buying and sellingprices of the euro or pound. That is, just as we canmost easily think of European terms as buyingand selling prices of US dollars – the rates areamounts of foreign currency per US dollar – in thecase of the euro and pound we can most easily thinkof rates as buying and selling prices of euros andpounds.In quotations between traders in the interbankmarket bids always precede asks. For example,in the case of quoting Swiss francs versus USdollars the rates would be quoted as SFr1.2957/62per dollar. This means SFr1.2957 bid for a USdollar, and SFr1.2962 asked for a US dollar. Indeed,as Exhibit 2.2 indicates, the SFr1.29 part mightbe assumed to be understood, and the quote mightbe simply 57/62. The pound would be quoted as$1.6343/48 per pound, or simply 43/48, the bidon the pound preceding the ask.Whichever way rates are quoted, the last digit ofthe quotation is referred to as a point. For example,
AN INTRODUCTION TO EXCHANGE RATESthe difference between the bid on the US dollarof SFr1.2957 and the ask for US dollars ofSFr1.2962 is 1.2962 1.2957 ¼ 0.0005 or fivepoints. Similarly the assumed bid on British poundsof $1.6343 differs from the ask of $1.6348 by fivepoints. A point always refers to the last digitquoted. This is not always the fourth decimal.For example, with the Japanese yen the bid-askspread quoted by a bank may be ¥110.20/25 perUS dollar. Here, the point is the second digit afterthe decimal.It is important that we distinguish between bidand ask exchange rates, even if it seems that thedifferences are so small as to be almost irrelevant.There are two reasons for this. First, the bid-askspread provides banks with their incomes, earnedby charging their customers, from dealing in foreignexchange. For example, even if the banks chargeonly 0.0002 (¼ 2 104 ) of the value of eachtransaction, the revenue to the market-makingbanks on their transactions of over $1.2 trillion(¼ $1.2 10 12 ) each day is $1.2 10 12 2 10 4 ¼ $240 million. This is not all profit for banksbecause much of this revenue merely movesbetween banks doing interbank transactions, andalso because banks themselves face operating costs.However, the amount does indicate the importanceof spreads to banks, and to the banks’ customerswho face the spreads. Second, spreads may seemsmall but can have a substantial effect on yieldswhen the spreads are faced on investments made foronly a short period. For example, if a companyinvests abroad for 1 month and must therefore buythe foreign currency today and sell it after 1 month,a 0.1 percent spread on buying and on sellingthe foreign exchange is a 0.2 percent spreadfor the investment. When put on an annual basisby multiplying by 12, this involves an annualizedcost of approximately 2.4 percent. If the extrainterest available on foreign securities versusdomestic securities is smaller than 2.4 percent,the spread will eliminate the advantage. The shorterthe period for which funds are invested abroad, themore relevant bid-ask spreads on foreign exchangebecome.DIRECT VERSUS INDIRECT EXCHANGEAND CROSS EXCHANGE RATESIndirect exchange and the practice ofquoting against the dollarWith more than 150 currencies in the world, there aremore than 150 149 ¼ 22,350 different exchangerates. This is because each of 150 different currencieshas an exchange rate against the remaining 149 currencies.Fortunately for the people who work in theforeign exchange market, many of the more thantwenty thousand possible exchange rates are redundant.The most obvious cause of redundancy is thatonce we know, for example, the price of dollars interms of pounds, this immediately suggests knowingthe price of pounds in terms of dollars. This reducesthe number of relevant exchange rate quotations byone-half. However, there is another cause of redundancybecause it is possible, for example, to computethe exchange rate between the euro and British poundfrom the exchange rate between the euro and thedollar and the pound and the dollar. Indeed, if therewere no costs of transacting in foreign exchange, thatis, no bid-ask spreads, with 150 currencies all 22,350possible exchange rates could be precisely computedfrom the 149 exchange rates of each currency versusthe US dollar. Let us show why by beginning with thesimple situation in which the only currencies are theeuro, the British pound, and the US dollar.The procedure we are going to use is to considerpeople who either want to exchange euros for poundsor pounds for euros. These exchanges can be madedirectlybetweentheeuroandpound,orindirectlyviathe dollar. For example, it is possible to sell euros fordollars,andthensellthesedollarsforpounds.Wewillargue that for banks to attract business involving thedirect exchange of euros and pounds, the exchangerate they offer cannot be inferior to the exchangerate implicit in indirect exchange via the US dollar. 1414 As we shall see, banks in the United Kingdom and theEuropean Continent do indeed quote direct exchange ratesbetween the euro and pound, and the pound and euro.Furthermore, these rates are at least as favorable as theimplicit rates calculated from rates vis-à-vis the US dollar.43 &
THE MARKETS FOR FOREIGN EXCHANGEWe will see that when there are no foreignexchange transaction costs, the constraint of competingwith indirect exchange will force banks toquote a direct exchange rate between the euro andpound that is exactly equal to the implicit indirectexchange rate via the dollar. This means that, ifthere are no transaction costs, we can find all possibleexchange rates by taking appropriate exchangerates versus the dollar. When there are transactioncosts, we will see that direct exchange rates are notalways precisely those that are implicit in ratesagainst the dollar. However, we will see that in thatcase there are limits within which direct quotationscan move, set by exchange rates versus the dollar.Triangular arbitrage: zero foreignexchange transaction costsLet us begin by defining the spot exchange ratebetween the dollar and pound as S($/£). That is:S($/£) is the number of US dollars per Britishpound in the spot foreign exchange market.More generally, S(i/j) is the number of units ofcurrency i per unit of currency j in the spotexchange market.First, consider a person who wants to go from eurosto pounds. In terms of Figure 2.4, this is characterizedby the darker arrow along the base of thetriangle between d and £. If a bank is to attractbusiness selling pounds for euros, the exchange rateit offers directly between the euro and pound mustbe no worse than could be achieved by goingindirectly from the euro to the dollar and then fromthe dollar to the pound. In terms of Figure 2.4 theindirect route involves traveling from d to £ via $,that is, along the heavily shaded arrows from d to $,and then from $ to £.If the person buys pounds directly for euros, thenumber of pounds received per euro is S(£/d), thespot number of pounds per euro, as shown onthe bottom of the triangle in Figure 2.4 withthe dark arrow pointing from d to £. If instead theindirect route is taken from d to £ via $, then on the& 44S($/ )S( /$)S( /£)first leg of the exchange, that from d to $, each eurobuys S($/d) dollars. Then, on the second leg, thatfrom $ to £, each of these S($/d) dollars buysS(£/$) pounds. Therefore, from the two legsS($/d) S(£/$) pounds are received for each euro.It is worth noting that the units of measurementfollow the usual rules of algebra. That is, looking onlyat the currency units, ($/d) (£/$) ¼ (£/d),with the dollar signs canceling.As we have said, a bank offering to exchangeeuros directly for pounds at S(£/d) pounds pereuro must offer at least as large a number of poundsas via the indirect route through exchanging intoand out of the US dollar. That is, for the bank’sexchange rate to be effective in attracting directeuro to pound business its quote must be such thatSð£/dÞ Sð$/dÞ Sð£/$Þ$S(£/ )S($/£)S(£/$)& Figure 2.4 Direct versus indirect exchange:zero transaction costsNotesIt is possible to buy pounds with euros directly or else to do thisindirectly, using euros to buy dollars and then dollars to buypounds. Similarly, it is possible to buy euros with poundsdirectly or to do this indirectly by buying and then sellingdollars. The possibility of indirect exchange via dollars forcesbanks to quote a cross rate between euros and pounds given bythe euro and pound rates vis-à-vis the dollar. With zerotransaction costs, S(d/£) ¼ S(d/$) S($/£), precisely.ð2:1ÞThat is, euros will be exchanged for pounds directlyrather than via the dollar only if at least as manypounds are received directly.Let us next consider a person who, instead ofwanting to convert euros into pounds, wants toconvert pounds into euros. This person can go from£
AN INTRODUCTION TO EXCHANGE RATES£tod directly along the lighter leftward pointingarrow in Figure 2.4. This would result in S(d/£)euros for each pound. Alternatively the person cango from £ to d indirectly along the other twolighter arrows, going from £ to $, and then from$tod. This route gives S($/£) dollars for eachpound, and then each of these dollars buys S(d/$)euros. Therefore, the number of euros received perpound from the indirect route is S($/£) S(d/$).A bank quoting an exchange rate for directlyconverting pounds into euros must offer at least asmany euros as would be obtained by using theindirect route via the US dollar. That is, for the bankto attract business, the exchange rate must satisfySðd/£Þ Sð$/£Þ Sðd/$Þð2:2ÞWe can compare the inequality (2.2) with theinequality (2.1) by noting that in the absence oftransaction costs, by definition,Sð£/dÞ 1Sðd/£ÞSð$/dÞ 1ð2:3ÞSðd/$ÞSð£/$Þ 1Sð$/£ÞThat is, for example, if there are £ 0.7153/d, thereare (1/0.7153) ¼ d1.3980/£. Using equations(2.3) in inequality (2.1) gives1Sðd/£Þ 1Sðd/$Þ 1Sð$/£Þð2:4ÞInverting both sides of the inequality (2.4), andtherefore necessarily reversing the inequality, givesSðd/£Þ Sðd/$Þ Sð$/£Þð2:5ÞThe inequality (2.5) is consistent with (2.2) only ifthe equalities rather than the inequalities hold. Thatis, the ability to choose the better of the two ways togo from euros to pounds and from pounds to eurosensures thatSðd/£Þ ¼Sðd/$ÞSð$/£Þð2:6ÞEquation (2.6) tells us we can compute theexchange rate between euros and pounds from theeuro–dollar and dollar–pound exchange rates.For example, if there are $1.5/£ and d0.9/$,there are d1.35/£. What we have shown inderiving equation (2.6) is why this is so. In summary,the reason is that there is always the possibilityof indirect exchange via the dollar in goingfrom euros to pounds or from pounds to euros.However, we recall that so far we have assumedzero transaction costs.The exchange rate S(d/£) is a cross rate. Moregenerally, cross rates such as those given at the topof Figure 2.3 are exchange rates directly betweencurrencies when neither of the two currencies is theUS dollar. For example, S(Can$/£), S(¥/Can$),S(¥/d), S(d/SFr) are all cross rates. What we havederived in equation (2.6) generalizes for any crossrate asSði/jÞ ¼Sði/$Þ Sð$/jÞð2:7ÞOf course, since S($/j) ¼ 1/S( j/$), we can alsocompute the cross rate S(i/j) fromSði/jÞ ¼ Sði/$Þð2:8ÞSð j/$ÞThe cross rate formula in equation (2.8) usesexchange rates in European terms, that is, as unitsof currency per US dollar. For example, if weknow S(Can$/$) ¼ 1.40 and S(SFr/$) ¼ 1.30, wecan calculate the Canadian dollar per Swiss francrate asSðCan$/SFrÞ ¼ SðCan$/$ÞSðSFr/$Þ ¼ 1:401:30¼ 1:0769If instead of exchange rates being in European termsas in equation (2.8) they are in US dollar equivalentterms, that is, dollars per unit of foreign currency,then we can writeSði/jÞ ¼ Sð$/jÞSð$/iÞð2:9Þ45 &
THE MARKETS FOR FOREIGN EXCHANGEMore generally, we can write the cross rate in fourpossible waysSði/jÞ ¼ Sði/$ÞSð j/$ÞSði/jÞ ¼ Sð$/jÞSð$/iÞSði/jÞ ¼Sði/$ÞSð$/jÞSði/jÞ ¼ 1Sð$/iÞ 1Sð j/$ÞIn the case of the euro and the pound, both arenormally quoted in US dollar equivalent terms, thatis, as US dollars per euro or per pound. Therefore,instead of equation (2.6) we should writeSðd/£Þ ¼ Sð$/£ÞSð$/dÞTraditionally, the rule for calculating cross rates hasbeen based on round-trip triangular arbitrage,which involves a different line of argumentthan is employed earlier. We can use Figure 2.4 toexplain the difference between round-trip triangulararbitrage and the argument we have employed.Round-trip triangular arbitrage is based upon thenotion that if you started with $1, and wentclockwise from $ to £ to d and then back to $ inFigure 2.4, you could not end up with more than $1from this triangular journey or there would be anarbitrage profit. Similarly, you would not be ableto take the reverse, counterclockwise route, and gofrom $ to d to £ and back to $, and end up withmore than $1 if you started with $1. Indeed, itshould not be possible to profit from starting at anypoint of the triangle and going around in eitherdirection, ending up where you started. This argument,based on going along all three sides of thetriangle and ending up where you started, gives thecorrect result when there are no transaction costs.However, it gives an inaccurate answer when thereare transaction costs, for the following reason.The choice of direct versus indirect exchange ofcurrencies that we employed above in deriving& 46equation (2.6) involves selecting between one(direct) transaction and the alternative of two(indirect) transactions. This means just one extratransaction cost when taking the indirect routerather than the direct route. On the other hand,round-trip triangular arbitrage is based on threetransactions, and hence three transaction costs, forexample, for converting $ to £, for converting £ tod, and converting d to $. When there are transactioncosts, the approach we have taken, whichmay be called one-way arbitrage, gives a narrowerpermissible bid-ask spread for a cross-ratetransaction than is found by triangular arbitrage: theterm ‘‘one-way’’ comes from starting with onecurrency and ending up with another. In a marketwhere a few points may translate into thousands ofdollars, it is important that we derive the correctpermissible spread, and this requires one-wayarbitrage, not the more circuitous round-triptriangular arbitrage. 15Triangular arbitrage: nonzero foreignexchange transaction costsDefining the costs of transactingAs we have already noted, in reality the price thatmust be paid to buy a foreign currency is differentfrom the price at which the currency can be sold.For example, the US dollar price a person must paya bank for a euro will exceed the US dollar amountreceived from the sale of a euro. In addition, thebuyer or seller of a currency might have to pay alump-sum fee or commission on each transaction.Economists have identified advantages of ‘‘two-parttariffs’’ such as a lump-sum and a per-unit charge,but for our purpose, we can think of both the bidaskspread and the exchange dealer’s fee as twoparts of the total spread. They both provide revenuefor dealers in foreign currencies and cause those15 Transaction costs become especially important in thecontext of interest arbitrage, which is covered inChapter 8.
AN INTRODUCTION TO EXCHANGE RATESwho need to exchange currencies to lose in goingback and forth. Let us define buy and sell rates:S($/ask£) is the price that must be paid to the bankto buy one pound with dollars. It is the bank’soffer or ask rate on pounds. S($/bid£) is thenumber of dollars received from the bank for the saleof pounds for dollars. It is the bank’s bid rate onpounds.Instead of writing S($/ask£) we could write S(bid$/ask£), because if a bank is offering to sell pounds fordollars, it is offering to buy dollars for pounds; theseare just two perspectives of the same transaction.Similarly, instead of writing S($/bid£) we couldwrite S(ask$/bid£). However, we need label onlyone currency because, for example, if we are talkingof the bank’s ask rate for pounds in terms of dollars,S($/ask£), we know this is also the bank’s bid rateon dollars. That is, when we have stated what isdone with one currency – a purchase or a sale –stating what is done with the other is redundant.We choose to label only the second currency in theexpression, showing whether this is the bank’s ask(selling) or bid (buying) price, because the exchangerate is most easily thought of as the price of thesecond currency.Because of transaction costs, we must be carefulwhen taking the inverse of an exchange rate. Whenthere are transaction costs, instead of writingSð$/£Þ 1Sð£/$Þas in equations (2.3), we must write1Sð$/ask£Þ andSð£/bid$Þ1Sð$/bid£Þ Sð£/ask$ÞMore generally,1Sði/askjÞ Sð j/bidiÞ1Sði/bidjÞ Sð j/askiÞandð2:10ÞThese rules follow immediately from the extendednotation described above.Cross-rate spreads and transaction costsFigure 2.5 shows exchange rates when goingbetween pairs of currencies when transaction costsare included. If a person were to buy poundsdirectly with euros they would receive S(£/bidd)of pounds from the bank; this is what the bank bidsfor euros in terms of pounds, as is shown along thedarker horizontal arrow in Figure 2.5. If instead theperson goes indirectly from d to $ and then from $to £ along the darker arrows, on the first leg eacheuro buys S($/bidd) of dollars; this is the bank’sbuying or bid rate for euros in term of dollars.On the second leg, each dollar buys S(£/bid$)pounds – the bank’s buying or bid rate on dollarsfor pounds. Therefore, the indirect route givesS($/bidd) S(£/bid$) pounds per euro.The bank’s direct quote for S(£/bidd) – poundspaid for a euro – will not be accepted by customersif it gives less pounds than the indirectroute. Therefore, for direct exchange to occur weS($/bid )S( /bid$)$S( /bid£)S(£/bid )S($/bid£)S(£/bid$)& Figure 2.5 Direct versus indirect exchange:nonzero transaction costsNotesOne-way arbitrage ensures that the number of euros receivedfor each pound sold directly for euros, S(d/bid£), must be noless than the number of euros received indirectly via the dollar,which is S($/bid£) S(d/bid$). Similarly, the number ofpounds received for each euro sold directly for pounds,S(£/bidd), must be no less than the number of pounds receivedindirectly, which is S($/bidd) S(£/bid$). In this way, one-wayarbitrage imposes a trading range on the possible cross ratesbetween euros and pounds.47 &£
THE MARKETS FOR FOREIGN EXCHANGErequireSð£/biddÞ Sð$/biddÞSð£/bid$Þor using US dollar equivalent quotations for theeuro and poundSð£/biddÞ Sð$/biddÞSð$/ask£Þð2:11ÞNext, consider a person wanting to exchangepounds into euros, the reverse of the previoussituation. They can exchange directly along the lighterarrow in Figure 2.5, receiving S(d/bid£) eurosper pound – the rate in euros the bank pays for, orbids on, pounds. Alternatively, they can exchangevia the dollar receiving S($/bid£) S(d/bid$)euros per pound; this is seen from the two lighterarrows from £ to $ and from $ to d in Figure 2.5.The direct euro–pound rate will attract businessonly if it gives at least as many euros per pound asbuying euros indirectly. Therefore, for the directexchange rate to attract business it is required thatSðd/bid£Þ Sð$/bid£Þ Sðd/bid$Þor using equation (2.10) to have US equivalentquotation for the euro as well as the poundSðd/bid£Þ Sð$/bid£ÞSð$/askdÞð2:12ÞInverting the left-hand-side of equation (2.12)gives1Sð£/askdÞ Sð$/bid£ÞSð$/askdÞð2:13ÞTaking reciprocals, and therefore reversing theinequality in (2.13), givesSð£/askdÞ Sð$/askdÞSð$/bid£Þð2:14ÞBy comparing the inequalities (2.11) and (2.14), wefind what we do and do not know about cross rateswhen there are transaction costs. We no longer& 48know exactly what the cross rates are from ratesagainst the dollar. Instead, we know the smallestnumber of pounds a bank can offer on euros – givenby inequality (2.11). We also know the maximumnumber of pounds it can ask per euro – given byinequality (2.14). Indeed, if we assume spreads onthe cross rate assureSð£/biddÞ Sð£/askdÞthen from equations (2.11) and (2.14)Sð$/biddÞ Sð£/biddÞ Sð£/askdÞSð$/ask£Þ Sð$/askdÞSð$/bid£ÞWhat we learn is that, while the extreme points ofthe cross rate are set by arbitrage, we do not knowwhere in between these limits the actual direct crossexchange rate will be.The exact bid and ask cross rates depend on thecompetition between banks for direct exchangebetween currencies. If there is a lot of competitionbecause there is a lot of business, the spread in thecross rate between euros and pounds will be small,perhaps on the order of the size of the bid-askspread between the dollar and one of these foreigncurrencies. If there is little competition, the spreadcould be quite large, perhaps as much as double thesize of the bid-ask spread in the euro rate or poundrate vis-à-vis the dollar.For example, suppose that rates on the euro andpound vis-à-vis the US dollar are quoted as:S($/bid¤) S($/ask¤) S($/bid£) S($/ask£)1.1020 1.1050 1.5775 1.5810Then, for cross transactions to occur between eurosand pounds we know from inequality (2.11) thatSð£/biddÞ Sð$/biddÞSð$/ask£Þ ¼ 1:10201:5810¼ 0:6970ð2:15Þ
AN INTRODUCTION TO EXCHANGE RATESand from inequality (2.14) thatSð£/askdÞ Sð$/askdÞSð$/bid£Þ ¼ 1:10501:5775¼ 0:7005ð2:16ÞThe point spread on the dollar–euro rate is30 points, equivalent to approximately 0.29 percentof the spot rate. The point spread on thedollar–pound rate is 35 points, or approximately0.22 percent of the spot rate. On the other hand,the maximum possible point spread on the crossrate between euro and pounds, given frominequalities (2.15) and (2.16), is 35 points or0.050 percent of the cross spot rate. This is alarger percent spread than for either of thespreads of rates versus the dollar. Indeed, it isapproximately the sum of the two spreads versusthe dollar. However, there is a large volume ofdirect exchange between euros and pounds, andtherefore spreads in quoted cross-rates are likelyto be less than 0.50 percent. With the pound–euro market being very active, the cross-ratespread might be similar to that between the euroand the dollar or pound and the dollar.What do we conclude from the above? Welearn that when going from one foreign currencyto another, for example, from Chinese RMB topounds or from Mexican pesos to Japanese yen, itpays to call a number of banks. The worst youcould find are exchange rates as unfavorable as ontwo separate transactions, going into and out ofthe US dollar. Generally you will find a bettersituation. Different banks may have quite differentdirect quotes according to whether or not theyare market makers in the direct exchange youare considering, and you might as well find thebest deal.Another thing we have discovered is that, if therewere no transaction costs, we could find all thepossible exchange rates between n currencies from(n 1) exchange rates, those against the US dollar.However, since in reality there are transactioncosts, the situation is very different. Not only arethere 2(n 1) rates against the US dollar, that is,a bid and an ask for each rate, but there are alsoa number of bid and ask rates for cross exchanges.The major currencies of OECD countries tradedirectly against each other with, for example, quotationsin Britain for direct purchase or sale ofCanadian dollars, Swiss francs, and so on. In Tokyothere are quotes in yen against British pounds,Canadian dollars, and so on. There are consequentlyfar more than 2(n¢ 1) different quoted exchangerates.It is worth pointing out that there is no rule thatexchange rates must always be expressed onlyagainst the US dollar. Any currency would do from aconceptual point of view. However, as a practicalmatter, it is important that the currency of quotationbe one that is widely traded and held. The amount oftrading and familiarity create the needed liquidity.At the beginning of the twentieth century, the poundsterling was widely used as the quotation currency,but after the 1944 Bretton Woods Agreement(which is described in Chapter 22), the US dollaremerged as the standard for stating other currencies’values. 16 We might also note that it is possible to findall exchange rates even without knowing the valuesof currencies against an nth currency. Instead, wecan use the values of all currencies against a commoditysuch as gold, or even against a currency‘‘basket’’ such as Special Drawing Rights (SDRs),which are described in Chapter 18.The conditions we have derived are valid notonly for conventional or spot exchange rates, butalso for forward exchange rates, which areexplained in Chapter 3. That is, if we replaced theS(i/j)’s in this chapter with forward exchange rates,everything would still be valid.16 There is some evidence that the attractiveness of quoting inthe US dollar is diminishing, especially in the European andAsian trading blocs. See Stanley W. Black, ‘‘TransactionCosts and Vehicle Currencies,’’ Journal of <strong>International</strong>Money and <strong>Finance</strong>, December 1991, pp. 512–26, andJeffrey Frankel and Shang-Jin Wei, ‘‘Trade Blocs andCurrency Blocs,’’ National Bureau of Economic Research,Paper 4335, 1991.49 &
THE MARKETS FOR FOREIGN EXCHANGESUMMARY1 The bid-ask spread on foreign bank notes is high because of inventory costs and thecosts and risks of note handling. Bank notes are exchanged at a retail and at a wholesalelevel.2 The spot foreign exchange market is the market in which currencies in the form ofbank deposits are exchanged. In this market, currencies are received one or twobusiness days after an exchange of currencies is agreed.3 The interbank foreign exchange market is the largest market on Earth. It consists of acomplex, international network of informal linkages between banks and foreignexchange brokers. When banks are dealing with each other, they quote two-wayexchange rates. The interbank market can be characterized as a decentralized,continuous, open-bid double-auction market. When banks or companies deal witha foreign exchange broker, they state their intentions. The broker quotes the insidespread to prospective counterparties.4 Banks settle between themselves on the same day their customers receive and pay forforeign exchange. Messages between banks are sent via SWIFT.5 Banks use clearing houses like CHIPS to clear balances between themselves.Banks also maintain correspondent accounts with each other for settling customers’accounts in foreign currencies. System-wide risk has helped spur the growth ofContinuous Linked Settlement, (CLS). Under this system, credits and debits aresimultaneous.6 Exchange rates are generally quoted in European terms, that is, in units of foreigncurrency per US dollar. Newspapers generally quote selling or middle rates.When exchange rates are quoted in European terms, it is easier to think of rates asbids and asks on the US dollar. The British pound and the euro are quoted in US dollarequivalent. The dollar–pound and dollar–euro rates are best thought of as bids andasks on the pound or euro. In the interbank market, bid rates are typically quoted beforeask rates.7 Transaction costs in the form of bid-ask spreads on exchange rates are important becausethey can greatly influence returns on short-term foreign investments. They also providelarge revenues for banks and represent a cost to businesses.8 A cross rate is an exchange rate which does not involve the US dollar, for example,Malaysian ringgits per British pound. In the absence of transaction costs, cross exchangerates between currencies other than the US dollar can be obtained from exchange ratesvis-à-vis the US dollar.9 In the absence of transaction costs, the many possible cross exchange rates betweenn different currencies can be obtained by just knowing the n 1 values of thecurrencies against the remaining n th currency. In principle, any standard will do formeasurement.10 In the presence of transaction costs, we cannot compute cross rates precisely fromrates versus the dollar. Instead, we can compute only a range within which crossrates must be quoted.& 50
AN INTRODUCTION TO EXCHANGE RATESREVIEW QUESTIONS1 What is a ‘‘bank draft’’?2 What is an exchange rate ‘‘spread?’’3 What does a bank-note wholesaler do?4 What is a ‘‘spot exchange rate?’’5 What is the ‘‘interbank spot market?’’6 What is SWIFT and what does it do?7 What is Continuous Linked Settlement?8 What is CHIPS and what does it do?9 How does the interbank spot market differ from the brokered market?10 What do we mean by the ‘‘bid’’ rate and ‘‘ask’’ rate on a foreign currency?11 What is the difference between the US $ equivalent and European terms methods ofquoting exchange rates?12 What do we mean by a ‘‘point’’ in quotation of exchange rates?13 What is triangular arbitrage, and how does it differ from one-way arbitrage?14 What is a cross rate?ASSIGNMENT PROBLEMS1 Do you think that because of the costs of moving bank notes back to their country ofcirculation, buying foreign currency bank notes could sometimes be cheaper thanbuying bank drafts? Could there be a seasonal pattern in exchange rates for bank notes?(Hint: Think of what is involved in shipping US dollars arising from Americansspending summers in Europe versus Europeans vacationing in America.)2 How can companies that issue and sell traveler’s checks charge a relatively low fee?How do they profit?3 Compute the percentage spread on South African rands and Canadian dollars fromTable 2.1. Why do you think the spread on Canadian dollars is lower?4 What steps are involved in settling a purchase made in Britain with a credit card issuedby a US bank? Why do you think the spread between buy and sell rates used incredit-card payments is smaller than those applying to foreign bank notes?5 Does the use of US dollars as the principal currency of quotation put US banks atan advantage for making profits? Why do you think the US dollar has become a principalcurrency of quotation?6 Why do you think that banks give bid and ask rates when dealing with each other?Why don’t they state their intentions as they do when dealing with foreign exchangebrokers?7 Check a recent business newspaper or the business page for spot exchange rates.Form an n n exchange-rate matrix by computing the cross rates, and check whetherS($/£) ¼ 1/S(£/$) and so on.51 &
THE MARKETS FOR FOREIGN EXCHANGE8 Complete the following exchange-rate matrix. Assume that there are no transactioncosts.Currency sold Currency purchased$ £ SFr ¤ ¥$ 1 1.5 0.8 1.2 0.009£ 1SFr 1d 1¥ 1BIBLIOGRAPHYAliber, Robert Z. (ed.), The Handbook of <strong>International</strong> Financial Management, Dow Jones Irwin, Homewood,IL, 1989.Bank of England, The Foreign Exchange Market, Fact Sheet, Bank of England, London, 1999.Chebucto Community Net, The Tobin Tax: An <strong>International</strong> Tax on Foreign Currency Transfers,http://www.chebucto.ns.ca//Current /P7/bwi/ccctobon.html, 2004.Deardorff, Alan V., ‘‘One-Way Arbitrage and Its Implications for the Foreign Exchange Markets,’’ Journal ofPolitical Economy, April 1979, pp. 351–64.Einzig, Paul A., Textbook on Foreign Exchange, St. Martins, London, 1969.Flood, Marc D., ‘‘Microstructure Theory and the Foreign Exchange Market,’’ Review, Federal Reserve Bank ofSt. Louis, November/December 1991, pp. 52–70.Frankel, Jeffrey A., Giampaolo Galli, and Alberto Giovannini, The Microstructure of Foreign Exchange Markets,Conference Report, National Bureau of Economic Research, Cambridge, MA, 1996.Krugman, Paul, ‘‘Vehicle Currencies and the Structure of <strong>International</strong> Exchange,’’ Journal of Money, Credit andBanking, August 1980, pp. 513–26.Kubarych, Roger M., Foreign Exchange Markets in the United States, Federal Reserve Bank of New York, 1978.Lothian, James R., ‘‘Exchange Rates,’’ The Oxford Encyclopedia of Economic History, Joel Mokyr (ed.), OxfordUniversity Press, Oxford, 2003.Miller, Paul and Carol Ann Northcott, ‘‘CLS Bank: Managing Foreign Exchange Settlement Risk,’’ Bank ofCanada Review, Autumn 2002, pp. 13–25.Reihl, Heinz and Rita M. Rodriguez, Foreign Exchange Markets, McGraw-Hill, New York, 1977.Syrett, William W., A Manual of Foreign Exchange, 6th edn, Sir Isaac Pitman, London, 1966.& 52
Chapter 3Forward exchangeThe future is not what it used to be.Paul ValéryIt would be difficult to overstate the importance ofthe forward market for foreign exchange. Indeed,a financial manager of a firm with overseas interestsmay find herself as much involved with this market aswith the spot market. This is confirmed in theaggregate turnover statistics in Table 3.1 which showthat the market share of forward exchange is evenlarger than the share for spot exchange. Table 3.1also makes it clear that the majority of forwardcontracts are part of swaps (swaps are a combinationof spot purchase/sale and forward sale/purchase andare discussed later in this chapter). The forwardmarket is valuable for reducing risks arising fromchanges in exchange rates when importing, exporting,borrowing, and investing. Forwards are also& Table 3.1 Foreign exchange net turnoverby market segment: daily averages, April 2001Market segmentTurnover inbillions ofUS dollarsPercentageshareSpot market 387 33.0Forwards 787 66.6Outright 131 11.0Swaps 656 55.6Options (OTC) 60 0.4Total turnover 1234 100Source: Central Bank Survey of Foreign Exchange Marketand Derivative Market Activity in April 2001, Bank for<strong>International</strong> Settlements, Basle, Switzerland, October 2001.used by speculators. This chapter explains the natureof this extremely important market, while a laterchapter, Chapter 12, describes the role forwardexchange plays in foreign exchange management.WHAT IS FORWARD FOREIGNEXCHANGE?The 1- or 2-day delivery period for spot transactionsis so short that when comparing spot rates withforward exchange rates we can usefully think of spotrates as exchange rates for un-delayed transactions.On the other hand, forward exchange rates involvean arrangement to delay the exchange of currenciesuntil some future date. A useful working definition is:The forward exchange rate is the rate that iscontracted today for the exchange of currenciesat a specified date in the future.If we look back at Figure 2.3 in Chapter 2, we notethat for Canada, Japan, Switzerland, and UnitedKingdom we are given exchange rates for 1-, 3-,and 6-month forwards. Although they are notquoted in the table, forward rates are also availablefor other currencies and for other maturities.Forward exchange contracts are drawn up betweenbanks and their clients or between two banks.The market does not have a central locationbut instead is similar to the spot market, being53 &
THE MARKETS FOR FOREIGN EXCHANGEa decentralized arrangement of banks and brokerslinked by telephone, SWIFT, and similar networks.Furthermore, the interbank component of theforward market involves continuous two-way openbidding between participants, that is, a so-called‘‘continuous open-bid double auction’’: each bank,on request, quotes a ‘‘bid’’ and ‘‘ask’’ rate to otherbanks, valid for that moment. Foreign exchangebrokers play a similar role as in the spot market,serving to match buy and sell orders betweenpotential counterparties.Figure 2.3 tells us that on Thursday, May 22,2003 a bank dealing in over $1 million could havepurchased spot US dollars with Japanese yen forapproximately ¥117.23/$. 1 This would have meantdelivery of the yen to the dollar-selling bank’sdesignated account on Monday, May 26, 2003,2 business days after the agreement was reached:Saturdays and Sundays are not business days. Dollarswould be received on the same day by the dollarbuyingbank. If, however, the purchaser wanted tohave the dollar in 6 months rather than ‘‘immediately,’’then the rate would have been ¥116.54/$, or0.69 (116.54 versus 117.23) fewer ¥/$ than the ratefor spot delivery. That is, the US dollar is cheaper forforward than for spot purchase. Figure 2.3 gives theexchange rate for buying the US dollar with the UKpound in 6 months as £0.6188/$. In the case of thedollar in terms of pounds, the forward price of thedollar is 71 points (0.6188 versus 0.6117) moreexpensive than for spot delivery. Hence, while theforward dollar is cheaper than the spot dollar interms of Japanese yen, the forward dollar is moreexpensive than the spot dollar in terms of pounds.FORWARD EXCHANGE PREMIUMSAND DISCOUNTSWhen it is necessary to pay more for forwarddelivery than for spot delivery of a currency, as1 We say approximately because the quoted rates are forcurrency trades that have already occurred (at or just before4 pm Eastern time). The exchange rate on new transactionsat which banks can transact will depend on the market that iscontinually changing.& 54is the case for the US dollar in terms of pounds inFigure 2.3, we say that the currency is at a forwardpremium. When a currency costs less forforward delivery than for spot delivery, as is the casefor the dollar in terms of Japanese yen in Figure 2.3,we say that the currency is at a forward discount.In the figure the dollar is at a forwardpremium against the pound, and at a forward discountagainst the yen.In order to show how to calculate forwardpremiums and discounts, let us first express theforward exchange rate in terms similar to those usedfor the spot rate:F n (¥/$) is the n-year forward exchange rate ofJapanese yen per dollar. More generally, F n (i/j)is the n-year forward exchange rate of currency ito currency j.For example, in Figure 2.3, F 1/4 (¥/$) ¼ ¥116.86/$and F 1/2 (¥/$) ¼ ¥116.54/$ With the help of thedefinition of the forward rate we can define then-year forward exchange premium or discount ofUS dollar versus the Japanese yen, on a per annumbasis, as approximately 2Premium/discount ð$ versus ¥Þ¼ F nð¥/$Þ Sð¥/$ÞnSð¥/$Þð3:1ÞWhen the value of expression (3.1) is positive, thedollar is at a forward premium vis-à-vis the Japaneseyen. This is because in this case the dollar costsmore yen for forward delivery than for spot delivery.When expression (3.1) is negative, the dollaris at a forward discount vis-à-vis the Japanese yen.In this case the dollar is cheaper to buy forward thanto buy spot. In the event that the forward rate andspot rate are equal, we say that the forward currencyis flat. In Figure 2.3 the dollar is at a forward2 We simplify the annualized premium or discount by takinga simple arithmetic average. If we want the exact premiumor discount at a compound rate we would computenp ffiffiffiffiffiffiffiffiffiffiffiffiffiffiffiffiffiffiffiffiffiffiffiffiffiffiffiffiffiFn (¥/$)/S(¥/$) 1.
FORWARD EXCHANGE& Table 3.2 Per annum percentage premium (þ) or discount (vis-à-vis the US dollar) on forward foreign exchangeCurrency Premium or discount Forward period1-month 3-month 6-monthUK pound £ discount 2.34 2.33 2.30US$ premium þ2.35 þ2.35 þ2.32Can dollar Can$ discount 1.98 2.09 2.12US$ premium þ2.01 þ2.09 þ 2.14Swiss franc SFr premium þ1.09 þ0.99 þ0.91US$ discount 1.11 þ0.99 þ0.91Japanese yen ¥ premium þ1.27 þ1.27 þ1.20US$ discount 1.23 1.26 1.18NotesThis table is derived from Figure 2.3 in Chapter 2 using the formula, Premium/Discount (i versus j) ¼ {[F n (j/i)S(j/i)]/nS(j/i)} 100, where n is the number of years forward. The discounts/premiums on the US dollarversus the foreign currencies (bottom row of each pair) do not precisely equal the negatives of the forwardexchange premiums/discounts of the foreign currencies versus the US dollar (top row) because of thebase-selection problem in computing percentage differences and because of bid-ask spreads.discount. More generally, the per annum n-yearpremium/discount of currency i versus currency j isPremium/discountði versus jÞ¼ F nð j/iÞ Sð j/iÞnSð j/iÞForward premiums and discounts are put intoannual terms by dividing by n because interest ratesare quoted in per annum terms, and it is useful tobe able to compare interest rates and forwardpremiums in these same terms. Often, forwardpremiums and discounts are put in percentageterms by multiplying by 100. Using the values inFigure 2.3, we find that for the 6-month forwarddollar versus the Japanese yen, expression (3.1) isnegative and equal toPremium/discountð$ versus ¥Þ116:54 117:23¼ 100% ¼ 1:18%0:5 117:23This is a forward discount on the dollar versus theyen of 1.18 percent per annum; the dollar costs1.18 percent per annum less for forward deliverythan for spot delivery. Table 3.2 gives the forwardpremiums and discounts for all forward currenciesquoted in Figure 2.3.When the dollar is at a forward discount vis-à-visthe Japanese yen, the yen is at a forward premiumvis-à-vis the dollar. This follows because whendollars cost less yen for forward delivery than forspot delivery, the yen must cost more dollarsfor forward delivery than for spot delivery. Indeed,the n-year annualized forward premium of the yenversus the dollar isPremium/discount ð¥ versus $Þ0:008581 0:008530¼ 100% ¼ 1:20%0:5 0:008530This is an annualized premium on the yen (since thevalue is positive) of 1.20 percent per annum. 3The definition of forward premium or discountdoes not depend on whether exchange rates arequoted in US dollar equivalent or in Europeanterms. A currency is at a forward premium if theforward price of that currency in terms of a secondcurrency is higher than the spot price. This appliesto cross rates as well as to rates involving the US3 There is a small difference between the numerical value ofthe dollar-versus-yen discount and the numerical value ofthe yen-versus-dollar premium, that is, 1.18 percent versus1.20 percent. This is because of the base-selection problemin taking percentage differences.55 &
THE MARKETS FOR FOREIGN EXCHANGEdollar. For example, if the euro costs more poundsfor forward than for spot delivery, the euro is at aforward premium against the pound, and the poundis therefore at a forward discount against the euro.FORWARD RATES VERSUS EXPECTEDFUTURE SPOT RATESAs is explained in more detail in Chapter 13, ifwe assume that speculators are risk-neutral, thatis, speculators do not care about risk, and if weignore transaction costs in exchanging currencies,then forward exchange rates equal the market’sexpected future spot rates. That is, if we write themarket’s expected spot price of currency j in termsof currency i as S n (i/j) where the refers to‘‘expected’’ and n refers to the number of yearsahead, thenthey have no euros and are not expecting any euros.They would expect to profit from subsequentlybuying euros for delivery on the forward contract attheir expected price of $1.1600/d which is$0.0100 less than the price at which they have soldeuros forward. In the course of selling euros forwardspeculators would drive down the forward europrice until it were no longer above the expected spotprice. This can be written asF n ð$/dÞ S n ð$/dÞð3:4Þwhere inequality (3.4) means that the forward priceof the euro cannot be above the expected spot pricefor the date of forward maturity: it is either less thanor equal to.Inequalities (3.3) and (3.4) are consistent only ifthe equalities of both relationships hold, that is,F n ði/jÞ ¼S n ði/jÞð3:2ÞF n ð$/dÞ ¼S n ð$/dÞð3:5ÞEquation (3.2) follows because if, for example, themarket in general expected the euro to be trading at$1.1600/d in 1-year’s time, and the forward ratefor 1 year were only $1.1500/d, speculators wouldbuy the euro forward for $1.1500/d, and expect tomake $0.0100 (¼ $1.1600 $1.1500) on eacheuro when the euros are sold at their expected priceof $1.1600 each. In the course of buying the euroforward, speculators would drive up the forwardprice of the euro until it was no longer lower thanthe expected future spot rate. That is, forwardbuying would continue until the forward price ofthe euro was no longer below the expected spotrate. This can be written asF n ð$/dÞ S n ð$/dÞð3:3Þwhere inequality (3.3) means that the forward priceof the dollar cannot be below the expected spotprice for the date of forward maturity: it must begreater than or at most equal to.Similarly, if the market expected the euro to betrading at $1.1600/d in 1-year’s time and the forwardrate for 1-year were $1.1700/d, speculatorswould sell euros forward. They do this even though& 56More generally, we have the condition in equation(3.2), recalling again that we are at this stageassuming risk neutrality and zero transactioncosts – assumptions we relax later in the book.PAYOFF PROFILES ON FORWARDEXCHANGEWhile the price paid for a forward currency equalsthe future spot rate expected by the market at thetime of purchase, when the forward contractmatures its value is determined by the realized spotrate at that time. The greater the extent to whichthe eventually realized spot rate differs from the spotrate that was expected at the time of buying thecontract, the larger is the change in the value of theforward contract vis-à-vis the purchase price. Stateddifferently, the larger is the unexpected change inthe spot exchange rate, the greater is the change inthe value of a forward contract between purchaseand maturity. If the spot rate is as was expected,there is no gain or loss on the forward contract.However, if the spot rate is higher or lower thanexpected, there is a gain or loss.
FORWARD EXCHANGEIt is possible to plot the gain or loss on a forwardcontract against the unanticipated change in the spotrate, where the unexpected change in the spot rateis the difference between the anticipated spot ratethat influenced the forward rate and the eventuallyrealized spot rate. Such a plot is called a payoffprofile, and is useful for comparing the consequencesof buying different instruments –forwards versus futures versus options – and for themanagement of foreign exchange risk which wediscuss in later chapters. Let us develop a payoffprofile by considering an example. Suppose that theexpected spot rate between the dollar and euro for1-year’s time is $1.15/d at the time of buying a1-year forward contract to purchase d1 millionwith US dollars. With the forward rate equal to theexpected future spot rate, the forward contract willbe priced at $1.15 million: the contract buyer is topay $1.15 million in one year’s time in exchange ford1 million received at that time. Let us now considerthe gain or loss on the forward contract whenthe eventually realized spot rate is different fromthe originally expected rate.As Table 3.3 shows, if the realized future dollarvalue of the euro is $1.14/d instead of the originallyexpected $1.15/d the unanticipated decline in theeuro by $0.01/d causes a decline in the value ofthe contracted d1 million by ($0.01/d) (d1 million), or $10,000 (note the d signs cancelin the multiplication to give a dollar amount). On& Table 3.3 Unanticipated changes in thespot exchange rate and gains or losses onforward purchase of ¤1 million at $1.15/¤Realizedspot rateUnanticipatedchange inspot rateGain (þ) orloss ( )oncontract$1.12/¤ $0.03/¤ $30,000$1.13/¤ $0.02/¤ $20,000$1.14/¤ $0.01/¤ $10,000$1.15/¤ $0 $0$1.16/¤ $0.01/¤ $10,000$1.17/¤ $0.02/¤ $20,000$1.18/¤ $0.03/¤ $30,000the other hand, if the eventually realized US dollarvalue of the euro is $1.16/d the dollar value of thecontracted d1 million increases by ($0.01/d) d1 million ¼ $10,000. Similarly, at a realized spotrate of $1.18/d the value of the d1 million to bereceived under the forward contract provides a gainof $30,000 (¼ $0.03/d d1million). These andother values for different realized spot rates areshown in Table 3.3.We plot the unanticipated change in the spot ratealong the horizontal axis of Figure 3.1, and the gainor loss on the forward contract to purchased1 million at $1.15/d on the vertical axis. Theunanticipated change in the expected spot rateis written symbolically as DS u ($/d) where D isthe Greek ‘‘delta’’ for ‘‘difference,’’ and the ‘‘u’’superscript represents ‘‘unanticipated.’’ The gain(þ) or loss ( ) on the contract is written as DV($),where the $ sign in parentheses indicates it is a USdollar gain or loss. We see from the figure that thepayoff profile is an upward-sloping straight line. Tothe right of the vertical axis where DS u ($/d) ispositive, that is, the euro has unexpectedly gone upin value, or appreciated, there is a gain on theforward contract to buy euros. To the left of thevertical axis where DS u ($/d) is negative, that is,the euro has unexpectedly declined, or depreciated,there is a loss on the forward contract tobuy euros.A forward contract to sell d1 million at $1.15/dhas a payoff profile that is opposite to that inFigure 3.1. In order to construct the profile, weagain plot the gains or losses on the contract againstthe unanticipated change in the spot exchange rate.These gains and losses, and the associated unexpectedchanges in the spot exchange rate, are shownin Table 3.4. For example, selling d1 million forthe contracted $1.15 million when the realizedexchange rate at maturity is $1.14/d means havinga gain of $10,000: the forward contract provides$1.15 million for d1 million at the contractrate, whereas d1 million would provide only $1.14million if sold at the realized spot exchange rate.However, if, for example, the realized spot ratebecame $1.16/d the forward sale of d1 million at57 &
THE MARKETS FOR FOREIGN EXCHANGEGain(+) or loss(–) ∆V($)+ +$40,000$30,000$20,000– –0.04 –0.03 –0.02 –0.01$10,0000.01 0.02 0.03 0.04–$10,000–$20,000–$30,000+Unexpectedchange in spotexchange rate,∆S u ($/ )–-–$40,000& Figure 3.1 Payoff profile on forward contract to buy d1 millionNotesWe assume the forward rate is the expected future spot rate. When the realized spot value of the foreign currency exceedsthe expected value and hence the forward rate, there is a gain from buying the forward currency. The figure plots the gains andlosses on a forward purchase of d1 million for different values of the difference between the expected (and hence forward)exchange rate and the realized rate. These values are shown in Table 3.3. We observe an upward-sloping payoff profile.& Table 3.4 Unanticipated changes in thespot exchange rate and gains or losses onforward sale of ¤1 million at $1.15/¤Realizedspot rateUnanticipatedchange inspot rateGain (þ) orloss ( )oncontract$1.12/¤ $0.03/¤ $30,000$1.13/¤ $0.02/¤ $20,000$1.14/¤ $0.01/¤ $10,000$1.15/¤ $0 $0$1.16/¤ $0.01/¤ $10,000$1.17/¤ $0.02/¤ $20,000$1.18/¤ $0.03/¤ $30,000$1.15/d means having a loss of $10,000: at$1.16/d the d1 million is worth $1.16 millionversus the $1.15 million for which the euros weresold. When these and the other values in Table 3.4are plotted as they are in Figure 3.2 we obtain adownward-sloping profile.The payoff profiles are useful for comparing theconsequences of different foreign exchange managementtechniques. Before we turn in the next& 58chapter to the profiles from other instruments,specifically futures and options, let us consider afew other aspects of the forward exchange market.OUTRIGHT FORWARD EXCHANGEAND SWAPSOutright and swap transactionsAs Table 3.1 shows, the largest part of averagedaily turnover on the foreign exchange markettakes the form of swaps. 4 The balance consists ofoutright forward contracts. As the namesuggests, an outright forward exchange contractconsists simply of an agreement to exchangecurrencies at an agreed price at a future date. Forexample, an agreement to buy Canadian dollars in180 days at Can$1.3988/$ is an outright forwardexchange contract. A swap, on the other hand, has4 The term ‘‘swap’’ is also used in the context of exchange ofinterest payments involved in debt responsibilities ratherthan the exchange of principal as in the context here. Thisother context is discussed in Chapter 18.
FORWARD EXCHANGEGain(+) or loss(–) ∆V($)+$40,000$30,000$20,000––0.04–0.03–0.02–0.01–$10,000$10,0000.01 0.02 0.03 0.04+Unexpectedchange in spotexchange rate,∆S u ($/ )–$20,000–$30,000–$40,000–& Figure 3.2 Payoff profile on forward contract to sell d1 millionNotesWe assume the forward rate is the expected future spot rate. When the realized spot value of the foreign currency exceedsthe expected value and hence the forward rate, there is a loss from selling the foreign currency forward: it has been sold forless than it has become worth. When the realized spot value of the currency is lower than expected there is a gain to the sellerof the forward currency; it has been sold for more than it has become worth. The figure plots the gains and losses on aforward contract to sell d1 million for different values of the difference between the expected (and hence forward) exchange rateand the realized rate. These values are shown in Table 3.4. We observe a downward-sloping payoff profile.two components, usually a spot transaction plusa forward transaction in the reverse direction,although a swap could involve two forwardtransactions in opposite directions. For example, aswap-in Canadian consists of an agreement tobuy Canadian dollars spot, and also an agreementto sell Canadian dollars forward. A swap-outCanadian consists of an agreement to sell Canadiandollars spot and to buy Canadian dollars forward.An example of a swap involving two forwardtransactions would be a contract to buy Canadiandollars for 1-month forward and sell Canadiandollars for 2-months forward. This is a forward–forward swap. When the purchase and sale areseparated by only one day the swap is called arollover. A definition of swaps that covers allthese forms is:A foreign exchange swap is an agreement to buyand sell foreign exchange at pre-specifiedexchange rates, where the buying and selling areseparated in time.The uses of swapsSwaps are valuable to those who are investing orborrowing in foreign currency. For example, aperson who invests in a foreign treasury bill can usea spot-forward swap to avoid foreign exchange risk.The investor sells forward the foreign currencymaturity value of the treasury bill at the same timeas the spot foreign exchange is purchased to pay forthe bill. Since a known amount of the investor’shome currency will be received according to theforward component of the swap, no uncertaintyfrom exchange rates is faced. In a similar way, thosewho borrow in foreign currency can buy forwardthe foreign currency needed for repayment of theforeign currency loan at the same time that theyconvert the borrowed foreign funds into their owncurrency on the spot market. The value of swaps tointernational investors and borrowers helps explaintheir substantial popularity.While valuable to investors and borrowers, swapsare not very useful to importers and exporters.59 &
THE MARKETS FOR FOREIGN EXCHANGEPayments and receipts in international trade arefrequently delayed. However, it is an outright forwardpurchase of foreign exchange that is valuable tothe importer, not a swap. Similarly, the exporterneeds to make an outright forward sale of foreignexchange to ensure the amount received in its owncurrency. This is not, however, the place to presentthe details of these uses of forward exchange or thedetails of the value of forward exchange to borrowersand investors. That must wait until Part 4.Swaps are popular with banks because it is difficultto avoid risk when making a market for manyfuture dates and currencies. For some dates andcurrencies a bank will be long in foreign exchangeby having agreed to purchase more of the foreigncurrency than it has agreed to sell. For other datesand currencies, a bank will be short, having agreedto sell more of these currencies than it has agreed tobuy. Swaps help the bank to economically reducerisk. For example, if bank A is long on spot Britishpounds and short on 30-day forward pounds it willtry to find another bank, bank B, in the oppositesituation. Bank A will sell pounds spot and buypounds forward – a swap-out of sterling – withbank B. In this manner, both banks balancetheir spot versus forward positions while economizingon the number of transactions thatachieves this. The use of only standard length, or socalledeven-dated contracts, leaves someexposure to remaining long and short positionsfrom day to day. These are then covered withrollover swaps. In this way swaps allow banks toexchange their surpluses and shortages of individualcurrencies to offset spot and forward trades withtheir customers and with each other. It should be nosurprise that matching customer trades with appropriateswaps is a complex and dynamic problem. 55 The reader is referred to the many accounts of this dynamicmarket. Foreign Exchange Markets in the United States, by RogerKubarych, Federal Reserve Bank of New York, 1978, is anexcellent account of the New York foreign exchange market.Other valuable sources include Paul Einzig, A Dynamic Theoryof Forward Exchange, Macmillan, London, 1966; RaymondG. Connix, Foreign Exchange Today, revised edn, Wiley,New York, 1980.& 60Exhibits 3.1 and 3.2 summarize the different uses ofswaps and outrights and some of the characteristicsof the forward market.THE FLEXIBILITY OF FORWARDEXCHANGEThe forward market offers more flexibility thanFigure 2.3 in the previous chapter might indicate.For example, as Table 3.5 shows, while themajority of contracts involve the US dollar versusthe major currencies, there are contracts against lessimportant currencies and also ‘‘cross forwards’’between other major currencies. 6 Furthermore,while Figure 2.3 suggests only a few specific andrather short maturities of forward contracts – 1, 3,and 6 months – contracts can be arranged for anyperiod from a couple of days up to several years.Since for most currencies the spot market value dateis already 2 business days in the future, the shortestforward contracts are for 3 days (forwards can befor 2 days ahead – rollovers – in North Americawhere settlement takes only 1 business day).Sometimes buyers and sellers of forwardexchange are not precisely sure when they will needtheir foreign currency or when they will receive it.For example, a US importer may know that he orshe must pay a British producer 30 days afterdelivery of the goods, but the exact day of deliverymay not be known because of possible shippingdelays. To take care of this, banks also sell forwardexchange with some flexibility, allowing buyers totake delivery of foreign exchange on any day duringthe last 10 days of the contract period, or accordingto some other flexible scheme. Flexibility will costthe buyer a little more, the exchange rate being, forexample, the most unfavorable for the customerduring the period of possible delivery. However,it can relieve the buyer of considerable worry.Some banks offer nondeliverable forwardcontracts alongside conventional contracts. Theseare similar to the traditional form of forward6 Table 3.5 also shows currency pairs for futures and optionswhich are discussed in Chapter 4.
FORWARD EXCHANGEEXHIBIT 3.1STRUCTURE OF THE FORWARD MARKETThe following excerpt from the Review of theFederal Reserve Bank of St. Louis explains the differencebetween outright forwards and swaps as wellas the different users of these ‘‘products.’’Participants in the foreign exchange marketalso deal for future value dates. Such dealingcomposes the forward markets. Active forwardmarkets exist for a few heavily traded currenciesand for several time intervals corresponding toactively dealt maturities in the money market.Markets can also be requested and made forother maturities, however. Since the foreignexchange market is unregulated, standard contractspecifications are matters of tradition andconvenience, and they can be modified by thetransacting agents.Forward transactions generally occur in twodifferent ways: outright and swap. An outrightforward transaction is what the name implies,a contract for an exchange of currencies atsome future value date. ‘‘Outrights’’ generallyoccur only between market-making banks andtheir commercial clients. The interbank market foroutrights is very small.A swap is simply a combination of two simultaneoustrades: an outright forward contract and anopposing spot deal. For example, a bank might‘‘swap in’’ six-month yen by simultaneously buyingspot yen and selling six-month forward yen ...In practice, the vast majority of foreignexchange transactions involve the U.S. dollar andsome other currency. The magnitude of U.S. foreigntrade and investment flows implies that, foralmost any other currency, the bilateral dollarexchange markets will have the largest volume.Source: Mark D. Flood, ‘‘Microstructure Theory and theForeign Exchange Market,’’ Review, Federal Reserve Bankof St. Louis, November/December 1991, pp. 52–70.contract in that they specify an exchange rate and afuture settlement date. However, on the settlementdate, the foreign currency is not paid for anddelivered. Rather, the difference between theagreed settlement rate and the current spot rate ispaid by the party losing, and received by the partygaining. The amount would be that shown on therelevant payoff profile, with this being on thematurity date. The settlement is in US dollars.These types of contracts are particularly popularwith emerging market currencies where physicaldelivery is difficult. This type of contact is in someways like a currency futures contract, which is atopic in Chapter 4.FORWARD QUOTATIONSSwap points and outright forwardsEven though some forward contracts are outright,the convention in the interbank market is to quoteall forward rates in terms of the spot rate andthe number of swap points for the forwardmaturity in question. For example, the 6-monthforward Canadian rate would conventionally bequoted asSpot1.3965–70 23–276-month swapThe swap quote is the way spot transactionsthemselves are quoted, and is in Canadian dollarsper US dollar. The spot rate means that the bid onUS dollars is Can$1.3965 – the quoting bank iswilling to pay Can$1.3965/$ – and the ask onUS dollars is Can$1.3970 – the quoting bankwill sell US dollars for Can$1.3970/$. The swappoints, 23–27 in this example, must be addedto or subtracted from the spot bid and ask rates.The need to add or subtract depends on whetherthe two numbers in the swap points are ascending61 &
THE MARKETS FOR FOREIGN EXCHANGEEXHIBIT 3.2DIFFERENCES BETWEEN OUTRIGHT FORWARDS AND SWAPSThe following excerpt from a biannual survey offoreign exchange markets by the Basle-based Bank of<strong>International</strong> Settlements highlights the importantdifferences between outright forwards and swaps. Forexample, it explains how much more ‘‘international’’are swaps.The forward market comprises two distinctsegments, the outright forward market and theswap market. Outright forward deals are similarto spot transactions except that they are for settlementmore than two days hence. Swap deals onthe other hand have two separate legs. The twocounterparties agree to exchange two currencies ata particular rate at one date and to reverse thetransaction, generally at a different rate, at somefuture date. Most swaps have a spot and a forwardleg but forward/forward transactions also takeplace. Swap transactions in the exchange marketinvolve the exchange of principal. In this theydiffer from other currency swaps (for exampleinterest rate swaps) which entail the exchangeof cash flows ...The maturity of most forward business is quiteshort. Nearly two thirds of all transactions havea maturity of seven days or less, and only 1%have a maturity of more than one year. There issome variation across countries, with shortermaturities tending to account for a larger share ofbusiness in the countries with the most activemarkets ....The outright forward market is strikingly differentfrom other market segments. Firstly, a farlarger share of this type of business is with ‘‘customers’’,particularly in countries which do nothost major trading centers. In the market asa whole, almost half of all outright forward dealsare with customers .... Many of the deals areundertaken to hedge exposures arising from foreigntrade rather than to manage financial risksarising from funding and portfolio decisions.A second notable feature of the outright forwardmarket is that trading is less international than inother market segments. Almost 56% of all dealsare concluded with counterparties located in thesame country, with the share of local deals beinghigher, sometimes much higher, in countries withsmall markets. The domestic orientation of theoutright forward market owes much to theimportance of business with customers, whichtends to be more local in character.The swap market is ...capable of being used to aconsiderable degree for the purpose of hedgingfinancial risk – in contrast to the use of outrightforwards mainly for commercial risk hedging....The swap market is heavily concentrated on theU.S. dollar. This currency is involved on one side in95% of all transactions.... Swap business is quiteinternational, with about 57% of transactionsbeing concluded with counterparties locatedabroad. The pattern of cross-border trading is notmuch different from that of the market as a whole.Dealers tend to do more of their business withcounterparties located abroad while customersconclude the bulk (71%) of their deals with localcounterparties.Source: Central Bank Survey of Foreign Exchange MarketActivity in April 1992, Bank for <strong>International</strong> Settlements,Basle, Switzerland, March 1993, pp. 18–20.(the second being higher than the first) or descending.Let us consider our example.When the swap points are ascending, as they arein the example, the swap points are added tothe spot rates so that the implied bid on US dollarsfor 6 months ahead is& 62Can$1:3965/$ þ Can$0:0023/$¼ Can$1:3988/$That is, the quotation ‘‘Spot 1.3965–70; 6-monthswap 23–27’’ means the quoting bank is biddingCan$1.3988 on the US dollar for 6-months forward.
FORWARD EXCHANGE& Table 3.5 Foreign exchange derivative turnoverby currency pair: daily turnover in April 2001, inbillions of US dollarsCurrency pairCurrency OptionsswapsUS dollar/Euro 1 17US dollar/Japanese yen 2 17US dollar/British pound 1 3Euro/Japanese yen — 6Euro/British pound — 2All other 3 15Source: Central Bank Survey of Market Activity in April2001, Bank for <strong>International</strong> Settlement, Basle, December2003.In other words, the quoting bank is willing to buy6-month forward US dollars – sell Canadian – atCan$1.3988/$. This is the 6-month outright forwardrate. Similarly, the above quote, ‘‘Spot1.3965–70; 6-month swap 23–27’’ is an impliedoutright ask on US dollars for 6 months ofCan$1:3970/$ þ Can$0:0027/$¼ Can$1:3997/$This means the quoting bank is willing to sell forwardUS dollars – buy Canadian – for Can$1.3997/$.The need to add the swap points in this case isdue to the ascending order of the swap points: 27 islarger than 23. If the numbers had been reversed thepoints would have to be subtracted. For example,suppose the Canadian dollar had been quoted asThat is, the market-maker is willing to buy USdollars for delivery in 6 months for Can$1.3938/$.Similarly, the implied ask on the US dollar for6-months forward isCan$1:3970/$ Can$0:0023/$¼ Can$1:3947/$The need to add or subtract points based simply onthe order of the swap points – ascending or descending– is a matter of convention. There is,however, a simple way of checking whether thearithmetic has been done correctly. Specifically, wenote in the first case where we hadSpot6-month swap1.3965–70 23–27that there are 5 basis points in the spot spread –Can$1.3965/$ versus Can$1.3970/$. However,the implied 6-months forward spread is largerbecause we calculated the forward bid on the USdollar as Can$1.3988/$ and the ask on the USdollar as Can$1.3997/$. This is a spread of 9 points(1.3997 1.3988). Similarly, in the second casewhere we hadSpot6-month swap1.3965–70 27–23Spot6-month swap1.3965–70 27–23The bid and ask on the US spot are the same asbefore: the market-maker bids Can$1.3965 on theUS dollar and asks Can$1.3970. However, theimplied outright bid on the US dollar for 6-monthsforward isCan$1:3965/$ Can$0:0027/$¼ Can$1:3938/$The spot has the same 5-point spread. The implied6-month outright forwards are in this case a6-month bid on the US dollar of Can$1.3938/$ andan ask of Can$1.3947/$. The spread on the6-month forward rate is larger than on the spot rate,again being 9 points (1.3947 1.3938) on theforward versus 5 points on the spot. The simple testof the outright calculation arithmetic is whetherspreads widen with maturity as they should.The same rule of adding swap points when theorder of swap points is ascending, and subtractingswap points when they are descending, applies63 &
THE MARKETS FOR FOREIGN EXCHANGEwhether exchange rates are quoted in foreigncurrency per US dollar, as are all currencies exceptthe euro and pound, or as US dollars per foreigncurrency. For example, suppose a market-makingbank is quoting British pounds asSpot 1-month 3-month 6-month1.5780–85 19–17 55–50 95–85that is, with the forward swap points being descendingin magnitude. In this case the swap pointsmust be subtracted, giving the implied forwardoutrights quoted in Table 3.6.While the rule for adding or subtracting pointsdepending on whether they are ascending ordescending is the same whether rates are quotedin currency per US dollar – European terms – oras US dollar per unit of foreign currency – US dollarequivalent – the interpretation of whether the foreigncurrency is at a forward premium or discountis different. In the case of the foreign currencyper US dollar quotation used for currencies otherthan the euro and pound, adding points means thatthe foreign currency is at a forward discount; thereis more foreign currency per US dollar for forwardthan for spot delivery. This means that withquotation as foreign currency per US dollar,an ascending order of swap points means the foreigncurrency is at a forward discount, and a descendingorder means the foreign currency is at a forwardpremium. This is the opposite to the situation with& Table 3.6 Bids and asks on poundsType ofexchangeBank buyssterling(bids)Bank sellssterling(asks)(US dollars/£ sterling)Spot 1.5780 1.5785 51-month 1.5761 1.5768 73-month 1.5725 1.5735 106-month 1.5685 1.5700 15& 64Spread(points)US dollar equivalent quotation with the euro andpound. Clearly, it is necessary for foreign currencytraders to think quickly and accurately.Bid-ask spreads and forward maturityThe check that we have suggested, of seeingwhether implied outright rates have wider spreadswith increasing forward maturities, is based onspreads observed in the market. The reason banksquote larger spreads on longer maturity contractsis not, as some people seem to think, that longermaturity contracts are riskier to the banksbecause there is more time during which the spotexchange rates might change. As we have seen,banks tend to balance their forward positions bythe use of swaps and rollovers, and since they cansimultaneously buy and sell forward for eachmaturity, they can avoid losses from changes inexchange rates during the terms of forwardcontracts; what a bank gains (loses) on a forwardcontract to sell it loses (gains) on an offsettingforward contract to buy. Rather, the reasonspreads increase with maturity is the increasingthinness of the forward market as maturityincreases.By increasing thinness we mean a smaller tradingvolume of longer maturity forwards, which inturn means greater difficulty offsetting positions inthe interbank forward market after taking ordersto buy or sell; since banks state their market andare then obligated if their bid or ask is accepted,they may want to enter the market immediatelythemselves to help offset the position they have justtaken. The market-makers cannot count on receivingoffsetting bids and asks and simply enjoyingtheir spreads. The longer the maturity, the lesslikely are unsolicited offsetting orders, and thereforethe more likely the market-maker is to faceother market-makers’ spreads. The difficulty ofoffsetting longer maturity forward contracts makesthem riskier than shorter maturity contracts, butthe extra risk involves uncertainty about the priceof an offsetting forward contract when reenteringthe market, rather than uncertainty about the path
FORWARD EXCHANGEof the spot exchange rate during the maturity of theforward contract. That is, the concern is foruncertainty between rates when buying and sellingoffsetting contracts.Maturity dates and value datesContracts traded on the interbank forward marketare mostly for even dates – ‘‘1 month,’’ ‘‘6months,’’ and so on. The value date of an evendatedcontract such as, for example, a 1-monthforward, is the same day in the next month as thevalue date for a currently agreed spot transaction.For example, if a forward contract is written onMonday, May 18, a day for which spot transactionsare for value on Wednesday, May 20, the value datefor a 1-month forward is June 20, the value date fora 2-month forward is July 20, and so on. A 1-yearforward contract agreed to on May 18 is for valueon May 20 in the following year. However, ifthe future date is not a business day, the valuedate is moved to the next business day. Forexample, if a 1-month forward contract is agreedon Tuesday, May 19, a day for which spot valueis May 21, the 1-month forward value date wouldnot be Sunday, June 21, but rather the followingbusiness day, Monday, June 22. The exception tothis rule is that when the next business day meansjumping to the following month, the forwardvalue date is moved to the preceding business dayrather than the next business day. In this way, a1-month forward always settles in the followingmonth, a 2-month forward always settles2 months later, and so on. 7It makes no difference whether the terminology‘‘1 month,’’ ‘‘2 months,’’ and so on is used, orwhether the terminology is 30 days, 60 days, and soon. The same rules for determining the value datesfor forward contracts apply whichever way we referto even-dated contracts.SUMMARY1 A forward exchange contract is an agreement to exchange currencies at a future dateat a pre-contracted exchange rate. Forward contracts are written by banks and tradebetween banks in the interbank market and are sold to bank’s clients.2 As with the spot market, the forward market is a decentralized, continuous open-biddouble-auction market. Forward exchange trades in both outright and swap form, wherethe latter involves the purchase/sale and subsequent sale/purchase of a currency.3 A forward premium on a foreign currency means that the forward value of the foreigncurrency exceeds the currency’s spot value. A forward discount means the forward valueis less than the spot value.4 If speculators are risk neutral and we ignore transaction costs, the forward exchange rateequals the market’s expected future spot rate.5 Payoff profiles show the change in value of an asset or liability that is associated withunanticipated changes in exchange rates. For forward contracts, payoff profiles areupward- or downward-sloping straight lines.6 Swaps, which involve a double exchange – usually a spot exchange subsequentlyreversed by a forward exchange – are traded between banks so that individual bankscan efficiently manage their foreign exchange risk.7 When holiday dates differ between countries so that the value date in one country is a business day, but not in the other, the valuedate is determined by the business days of the bank making the market, that is, the bank which was called to quote its market.65 &
THE MARKETS FOR FOREIGN EXCHANGE7 Swaps are also valuable to international investors and borrowers, whereas outrightforwards are valuable to importers and exporters.8 In the interbank market forward exchange rates are quoted as the spot rate plus or minusswap points. The swap points are added to or subtracted from the spot rate dependingrespectively on the ascending or descending order of the swap points.9 It is possible to tell from the order of swap points whether a currency is at a forwardpremium or discount.10 Forward bid and ask spreads widen with increased maturity because of the increasingthinness of markets as maturity increases. It is harder to keep buy and sell ordersbalanced simply by changing the bid-ask rates in markets with fewer transactions.REVIEW QUESTIONS1 What is a forward rate?2 What is a forward premium?3 What is a forward discount?4 Why and under what conditions is the forward rate equal to the expected future spot rate?5 What goes on the axes of a payoff profile for a forward exchange contract?6 How does an ‘‘outright’’ forward contract differ from a ‘‘swap?’’7 What does it mean to be ‘‘long’’ in a currency?8 What does it mean to be ‘‘short’’ in a currency?9 What is the meaning of the ‘‘maturity date’’ on a forward contract?10 What is the meaning of the ‘‘value date’’ on a forward contract?ASSIGNMENT PROBLEMS1 Why are forward spreads on less-traded currencies larger than on heavily tradedcurrencies?2 Why do banks quote mainly even-dated forward rates, for example, 1-month rates and3-month rates, rather than uneven-dated rates? How would you prorate the rates ofuneven-dated maturities?3 Compute the outright forward quotations from the following swap quotations ofCanadian dollars in European terms:Spot 1-month 3-month 6-month1.3910–15 10–9 12–10 15–124 When would spreads widen quickly as we move forward in the forward market? Considertwo sets of quotations, from a volatile time and from a stable time.& 66
FORWARD EXCHANGE5 Could a bank that trades forward currency ever hope to balance the buys and sells offorward currencies for each and every future date? How do swap contracts help?6 Why do banks operate a forward exchange market in only a limited number ofcurrencies? Does it have to do with the ability to balance buy orders with sell orders, andis it the same reason why they rarely offer contracts of over 5 years?7 Why is risk neutrality relevant for the conclusion that forward exchange rates equal themarket’s expected future spot exchange rates?8 Why is it necessary to assume zero spreads when concluding that forward exchange ratesequal expected future spot rates?9 Plot the payoff profile for a forward contract to buy $1 million US at Can$1.3900/$.10 Plot the payoff profile for a forward contract to sell $1 million US at ¥120/$.BIBLIOGRAPHYBurnham, James B., ‘‘Current Structure and Recent Developments in Foreign Exchange Markets,’’ in SarkisJ. Khoury (ed.), Recent Developments in <strong>International</strong> Banking and <strong>Finance</strong>, Volume IV, Elsevier, Amsterdam,1991, pp. 123–53.Chrystal, K. Alec, ‘‘A Guide to Foreign Exchange Markets,’’ Review, Federal Reserve Bank of St. Louis, March1984, pp. 5–18.Einzig, Paul A., The Dynamic Theory of Forward Exchange, 2nd edn, Macmillan, London, 1967.Flood, Mark D., ‘‘Microstructure Theory and the Foreign Exchange Market,’’ Review, Federal Reserve Bank ofSt. Louis, November/December 1991, pp. 52–70.Glassman, Debra, ‘‘Exchange Rate Risk and Transaction Costs: Evidence from Bid-Ask Spreads,’’ Journal of<strong>International</strong> Money and <strong>Finance</strong>, December 1987, pp. 479–90.Kubarych, Roger M., Foreign Exchange Markets in the United States, Federal Reserve Bank of New York,New York, 1983.Riehl, Heinz and Rita M. Rodriguez, Foreign Exchange and Money Markets: Managing Foreign and DomesticCurrency Operations, McGraw-Hill, New York, 1983.67 &
Chapter 4Currency futures andoptions marketsFutures and options on futures are derivative assets; that is, their values are derived fromunderlying asset values. Futures derive their value from the underlying currency, and options oncurrency futures derive their values from the underlying futures contracts. ...Chicago Fed Letter, November 1989CURRENCY FUTURESWhat is a currency future?Currency futures are standardized contracts thattrade like conventional commodity futures on thefloor of a futures exchange. Orders to buy or sell afixed amount of foreign currency are received bybrokers or exchange members. These orders, fromcompanies, individuals, and even market-makingcommercial banks, are communicated to the floorof the futures exchange. At the exchange, ordersto buy a currency – long positions – are matchedwith orders to sell – short positions. Theexchange, or more precisely, its clearingcorporation, guarantees both sides of each twosidedcontract, that is, the contract to buy and thecontract to sell. The willingness to buy versus thewillingness to sell moves futures prices up anddown to maintain a balance between the numberof buy and sell orders. The market-clearing price isreached in the vibrant, somewhat chaotic appearingtrading pit of the futures exchange. Currencyfutures began trading in the <strong>International</strong> MoneyMarket (IMM) of the Chicago Mercantile Exchange(CME) in 1972. Since then many other markets& 68have opened, including the COMEX commoditiesexchange in New York, the Chicago Board ofTrade, and the London <strong>International</strong> FinancialFutures Exchange (LIFFE).In order for a market to be made in currencyfutures contracts, it is necessary to have only a fewvalue dates. At the CME, there are four value datesof contracts per year – the third Wednesday in themonths March, June, September, and December.In the rare event that contracts are held to maturity,delivery of the underlying foreign currency occurstwo business days after the contract maturity date toallow for the normal two-day delivery of spotcurrency. Contracts are traded in specific sizes:¥12,500,000; Can$100,000; £62,500; d125,000;and so on. This keeps the contracts sufficientlyhomogeneous and few in number that there isenough depth for a market to be made. The majorcurrencies that are traded, along with their contractsizes and other information, are shown inFigure 4.1.Figure 4.1 shows that in the CME, prices offutures on foreign currencies are quoted as USdollar equivalents, that is, as the number of USdollars per unit of the foreign currency. On the
CURRENCY FUTURES AND OPTIONS MARKETS& Figure 4.1 Prices of principal CME currencyfutures: September 18, 2003NotesFutures prices of foreign currencies against the dollar arequoted in US dollar equivalent terms. The table shows theUS dollar cost per unit of foreign currency. The price of acontract is the per unit value in the table multiplied by thecontract size. In the case of the Japanese yen, it is necessaryto put 0.00 in front of the unit price. The cross ratesbetween the euro and yen and euro and pound are prices ofthe euro in terms of yen and pounds (reprinted by permissionof The Wall Street Journal ª 2003 Dow Jones &Company Inc. All rights reserved).other hand, forward rates, except for the euro andBritish pound, are quoted in European terms, thatis, as foreign currency per US dollar. In the case ofthe Japanese yen the first two zeros in the US dollarprice of the yen are omitted. For example, thecontract maturing in December has an actualsettle price of $0.008695 per Japanese yen (this isequivalent to ¥115.01/$ in European terms).The prices in Figure 4.1 are US dollar prices perunit of foreign currency. To convert these per-unitprices into futures contract prices it is necessary tomultiply the prices in the figure by the contractamounts. For example, the Japanese yen contract isfor ¥12.5 million. With the settle price per yen forDecember delivery of $0.008695, the price of oneJapanese yen contract is$0:008695/¥ ¥12,500,000 ¼ $108,687Note that as always, the currency symbols can becanceled, so that ¥ disappears leaving a price in USdollars. Similarly, a September 2004 Canadian dollarcontract has a settle price of$0:7237/Can$ Can$100,000 ¼ $72,370As with forward exchange contracts, if we assumerisk neutrality, the per unit price of futures equalsthe expected future spot exchange rate of the foreigncurrency. Otherwise, if, for example, theexpected September 2004 spot rate of the Canadiandollar were above $0.7237/Can$, speculatorswould buy Canadian dollar futures, pushing thefutures price up to the expected future spot level.Similarly, if the expected September 2004 spot ratewere below the futures price of $0.7237/Can$,speculators would sell Canadian dollar futures untilthey had forced the futures price back to theexpected future spot rate. With futures prices equalto expected future spot exchange rates, it followsthat it is changes in expected spot exchange ratesthat drive futures contract prices up and down.Both buyers and sellers of currency futures mustpost a margin and pay a transaction fee. Themargin is posted in a margin account at a brokeragehouse, which in turn posts margin at the clearinghouse of the exchange. The clearing house of theexchange, in turn, pairs buy and sell orders, that is,matches each buy order with a sell order. As wehave said, all buy and sell orders are guaranteed bythe clearing corporation which operates the clearinghouse. Margins must be supplemented by contract69 &
THE MARKETS FOR FOREIGN EXCHANGEholders and brokerage houses if the amount ina margin account falls below a certain level, calledthe maintenance level. For example, the CME’sstandard required margin on British pounds is$2,000 per contract, and the maintenance level is$1,500. 1 This means that if the market value ofthe contract valued at the settle price has a cumulativefall of more than $500, the full amount of thedecline in value from the standard margin must beadded to the clients’ and the brokers’ marginaccounts. Declines in contract values which aresmall enough to leave more than $1,500 of equitydo not require action. Increases in the values ofcontracts are added to margin accounts and can bewithdrawn or used as margin on further futurescontracts. Margin adjustment is done on a dailybasis and is called marking to market. Let usconsider an example of marking to market.Marking to market: an exampleSuppose that on Day 1 (which for Figure 4.1 isSeptember 18, 2003), a British pound Decemberfutures contract is purchased at the opening of themarket at the opening per unit price of $1.6002/£.This means that one contract for £62,500 coststhe buyer$1:6002/£ £62,500 ¼ $100,012The settle price, which is the price at the end of theday used for calculating settlement in the buyers’ andsellers’ accounts, is $1.6042/£; this per unit futuresprice is the market’s expected future spot price forthe third Wednesday in December at the end oftrading on Day 1, September 18. At this price, theDecember contract to buy £62,500 is worth$1:6042/£ £62,500 ¼ $100,2621 Brokers who trade on the CME set the Exchange’s marginand maintenance level for clients, but may require morefrom small clients and less from large clients. Brokersface the minimum levels of margin. All futures trading inthe United States is regulated by the Commodities FuturesTrading Commission (CFTC).& 70The purchase of the pound futures contract hasearned the contract buyer$100,262 $100,012 ¼ $250This is placed in the contract purchaser’s marginaccount, being added to the $2,000 originallyplaced in the account. This is shown in Table 4.1.Suppose that by the end of Day 2 the Decemberpound futures price falls to $1.5980/£. Thecontract is now worth$1:5980/£ £62,500 ¼ $99,875Compared to the previous settle contract price of$100,262 there is a loss of$100,262 $99,875 ¼ $387When this is deducted from the $2,250 in the marginaccount the total is $1,863 ($2,250 $387).The margin remains above the maintenance level of$1,500 so nothing needs to be done.Suppose that by the close of Day 3, because ofa decline in the expected future spot rate, the settleprice on December pounds falls to $1.5920. Thecontract is now valued at$1:5920/£ £62,500 ¼ $99,500The loss from the previous day is$99,875 $99,500 ¼ $375This brings the margin account to $1,488($1,863 $375) which is below the maintenancelevel of $1,500. The contract buyer is asked to bringthe account up to $2,000, requiring that at least$512 be put in the buyer’s account.If on Day 4 the December pound futures ratesettles at $1.6010/£ the contract is worth$1:6010/£ £62,500 ¼ $100,062This is a gain over the previous settlement of$100,062 $99,500 ¼ $562This is added to the margin account and can bewithdrawn or used towards the margin on another
CURRENCY FUTURES AND OPTIONS MARKETS& Table 4.1 Settlements on a pound futures contractDayOpeningor settlepriceContractpriceMarginadjustmentMargincontribution (þ)or withdrawal ( )Marginaccount1 Opening $1.6002/£ $100,012 0 þ$2,000 $2,0001 Settle $1.6042/£ $100,262 þ$250 $0 $2,2502 Settle $1.5980/£ $99,875 $387 $0 $1,8633 Settle $1.5920/£ $99,500 $375 þ$512 $2,0004 Settle $1.6010/£ $100,062 þ$562 $562 $2,000futures contract. We assume it is withdrawn. Allthis is summarized in Table 4.1.We have seen that with risk neutrality, the futuresprice equals the expected future spot exchange rate.Therefore, the example indicates that futures can bethought of as daily bets on the value of the expectedfuture spot exchange rate, where the bets are settledeach day: futures traders are trying to guess what willhappen tomorrow to the market’s viewofwhatthespot rate will be on the date of contract maturity. 2On the other side of the margin adjustments to thefutures buyer’s account described earlier and inTable 4.1, are the adjustments to the margin accountof the futures seller. When the buyer’s accountisadjusted up, the seller’s account is adjusted down thesame amount. That is, what buyers gain, sellers lose,and vice versa. The two sides are taking bets againsteach other in a zero-sum game. The fee for playingthe game is the brokerage charge.Futures contracts versus forward contractsThe daily settlement of bets on futures means thata futures contract is equivalent to entering a forwardcontract each day and settling each forwardcontract before opening another one, where the forwardsand futures are for the same future deliverydate. 3 The daily marking to market on futures2 Therefore, as in all financial markets, successful tradinginvolves beliefs about what other peoples’ beliefs will be,those of the market in general.3 See Fischer Black, ‘‘The Pricing of Commodity Contracts,’’Journal of Financial Economics, January/March 1976, pp. 167–9.means that any losses or gains are realized asthey occur, on a daily cycle. With the loser supplementingthe margin daily and in relatively modestamounts, the risk of default is minimal.Of course, with the clearing corporation of theexchange guaranteeing all contracts, the risk ofdefault is faced by the clearing corporation. Werethe clearing corporation not to guarantee all contracts,the party on the side of winning the dailybets would be at risk if the other party couldnot pay. Let us consider how these institutionalarrangements in the futures market differ from theforward market.In the forward market there is no formal anduniversal arrangement for settling up as theexpected future spot rate and consequent forwardcontract value move up and down. Indeed, there isno formal and universal margin requirement.Generally, in the case of interbank transactionsand transactions with large corporate clients, banksrequire no margin, make no adjustment for day-todaymovements in exchange rates, and simply waitto settle up at the originally contracted rate. A bankwill, however, generally reduce a client’s remainingline of credit. For example, if a bank has granted aclient a $1 million line of credit and the customertrades $5 million forward, the bank is likely toreduce the credit line by, perhaps $500,000, or10 percent of the contract. For a customer withouta credit line, the bank will require that a margindeposit be established. The procedure for maintainingthe margin on a forward contract dependson the bank’s relationship with the customer.Margin may be called, that is, requested,71 &
THE MARKETS FOR FOREIGN EXCHANGEfrom customers without credit lines, requiringsupplementary funds to be deposited in the marginaccount, if from the customer’s perspective, anunfavorable movement in the exchange rate occurs.In deciding whether to call for supplementing ofmargin accounts, banks consider the likelihood oftheir customers honoring forward contracts. Thebanks exercise considerable discretion, which is insharp contrast to the formal daily marking to marketof the futures market.Many banks are also very flexible about whatthey will accept as margin. For example, stocks,bonds, and other instruments may be accepted inorder to ensure that customers honor contracts,although it may be necessary to post more than10 percent of the value of a forward contract if theinstruments that are posted are risky. In the case offutures-exchange brokers’ margins at the futuresexchange, a substantial part of initial margins may beaccepted in the form of securities, such as treasurybills, but subsequent maintenance payments aretypically in cash. This means that while with forwardcontracts there is no opportunity cost of marginrequirements, there may be such an opportunitycost with futures contracts, especially when contractprices have fallen and substantial cash payments haveconsequently been made into the margin account.Unlike the case for forward contracts, when thebuyer of a futures contract wants to take delivery ofthe foreign currency, the currency is bought atthe going spot exchange rate at the time deliveryis taken. What happens can be described byconsidering an example.Suppose a futures contract buyer needs Britishpounds in August, and buys a September poundfutures contract. 4 In August, when the pounds areneeded, the contract is sold on the exchange, andthe pounds are bought on the spot exchange marketat whatever exchange rate exists on the day inAugust when the pounds are wanted. Most ofthe foreign exchange risk is still removed in this4 Alternatively, a June contract might be purchased anddelivery of the pounds taken. The pounds could then beheld, earning interest until needed.& 72situation because if, for example, the pound hasunexpectedly increased in value from the time ofbuying the futures contract, there will be a gain inthe margin account. This gain will compensate forthe higher than expected spot exchange rate inAugust. However, not all exchange rate risk isremoved because the margin account will not ingeneral exactly compensate for the unexpectedmovement in the spot exchange rate. The remainingrisk is due to variations in interest rates and marginaccount balances which leave uncertainty in theamount in the account or in the cost of maintainingthe account. Specifically, the amount in the marginaccount or paid to maintain it depends on the entirepath of the futures price from initial purchase, andon interest rates earned in the account or forgoneon cash contributions to the account; daily cashsettlements generally do not earn interest. The riskdue to variability in the amount in the account andin the interest rate is called marking-to-marketrisk, and makes futures contracts riskier than forwardcontracts for which there is no marking tomarket. 5 Even in the very rare circumstance thatdelivery is taken on the maturity date of a futurescontract, there is still marking-to-market riskbecause the margin account does not provide exactcompensation for any unexpected change in the spotexchange rate. 6 This is again due to variations in thetime path of amounts in the margin account and ininterest rates. We see that a problem with futures incomparison with forwards is that futures contractsleave some risk whereas forwards do not.Another problem with using futures contractsto reduce foreign exchange risk is that the contractsize is unlikely to correspond exactly to a firm’sneeds. For example, if a firm needs £50,000, theclosest it can come is to buy one £62,500 contract.On the other hand, forward contracts with banks5 While marking to market adds risk vis-à-vis forwards, theguarantee of the futures exchange to honor all contractsreduces risk.6 Statistics from the CME show that fewer than 1 percent offutures contracts result in delivery. See Currency Tradingfor Financial Institutions, <strong>International</strong> Monetary Market,Chicago, 1982.
CURRENCY FUTURES AND OPTIONS MARKETScan be written for any desired amount. Theflexibility in values of forward contracts and inmargin maintenance, and absence of markingto-marketrisk, make forwards preferable tofutures for importers, exporters, borrowers, andlenders who wish to precisely hedge foreignexchange exposure. Currency futures are morelikely to be preferred by speculators because gainson futures contracts can be taken as cash, andbecause the transactions costs are small. 7 As wehave mentioned, with forward contracts it isnecessary to buy an offsetting contract for the samematurity to lock in a profit, and then to wait formaturity before settling the contracts and takingthe gain. For example, if pounds are boughtforward in May for delivery in December, andby August the buyer wants to take a gain, inAugust it is necessary to sell pounds forward forDecember, and then wait for the two contractsto mature in December to collect the gain. 8 Theextent to which futures are used to speculaterather than to hedge is indicated, albeit imperfectly,by the statistics on open interest. Openinterest refers to the number of outstanding twosidedcontracts at any given time. (Recall thatorders to buy are matched with orders to sell soeach contract has two sides.) The statistics on openinterest in the last column of Figure 4.1 indicatethat most of the activity is in the nearest maturitycontracts. While not apparent from Figure 4.1,open interest also falls off substantially just prior tomaturity, with delivery rarely being taken. Thisdoes not necessarily mean that futures are notgenerally used to reduce risk, but is suggestiveof this. 97 A spread of just 10 points on a forward contract for$100,000 translates into $100, compared to a typicalcombined cost of a comparably valued futures purchase andsubsequent sale of typically $20–$40.8 Banks will sometimes offer to pay gains out early bydiscounting what is to be received. This is done to makeforward contracts more competitive with futures as aspeculative vehicle.9 See James Tobin, ‘‘On the Efficiency of the FinancialSystem,’’ Lloyds Bank Review, July 1984, pp. 1–15.Payoff profiles on currency futuresIt should come as little surprise that becausecurrency futures are similar to forward contracts,the payoff profiles are also similar. The similaritiesbetween the profiles, as well as the minordifferences that exist, can be clarified by consideringan example similar to that used in Chapter 3for a forward contract. The situation is summarizedin Table 4.2 and in the associated payoffprofile in Figure 4.2. Both the table and the figuredescribe the consequences of unanticipated changesin the spot exchange rate on the contractvalue and margin account of a purchaser of eurofutures.We assume that at the time of buying the futurescontract the market’s expected future spot rate forthe maturity date of the contract is $1.12/d. At thisexpected spot rate a futures contract for d125,000has a market price of$1:12/d d125,000 ¼ $140,000The purchaser is betting on the outcome vis-à-visthis price. Let us compare this contracted pricewith the value of d125,000 at realized spot rates tofind the outcome of the bet.If the eventually realized spot exchange rateis $1.13/d, the contract price at maturity will be& Table 4.2 Realized spot rates and gains/losseson futures to buy eurosRealizedspot rateRealizedrate versusfutures priceMaturityvalue ofcontractAccumulatedmarking-tomarketgain(þ) orloss ( )$1.15/¤ þ$0.03/¤ $143,750 þ$3,750$1.14/¤ þ$0.02/¤ $142,500 þ$2,500$1.13/¤ þ$0.01/¤ $141,250 þ$1,250$1.12/¤ $0 $140,000 $0$1.11/¤ $0.01/¤ $138,750 $1,250$1.10/¤ $0.02/¤ $137,500 $2,500$1.09/¤ $0.03/¤ $136,250 $3,75073 &
THE MARKETS FOR FOREIGN EXCHANGEGain(+) or loss(–) ∆V($)+$4,000$3,000$2,000––0.04–0.03–0.02$1,000–0.010.01 0.02 0.03 0.04–$1,000+Unexpectedchange in spotexchange rate,∆S u ($/ )–$2,000–$3,000–$4,000–-& Figure 4.2 Payoff profile for purchase of euro futures contractNotesThe futures contract is for the purchase of ¤125,000. If the spot price of the euro unexpectedly increases by $0.01/¤there is a gain on the contract of $0.01/¤ ¤125,000 ¼ $1,250 which is added to the buyer’s margin account. If the spotprice of the euro unexpectedly decreases by $0.01/¤ there is a loss on the contract of $1,250 which is subtracted from thebuyer’s margin account. However, the exact gain or loss also depends on the path of interest rates which affect earnings onmargin accounts and the cost of maintaining margin. This makes the actual gain or loss associated with any change in theexchange rate somewhat uncertain, represented by the broad line. The payoff profile for the seller of a euro futures contractis a downward-sloping line of the same absolute slope.worth $1.13/d d125,000 ¼ $141,250. 10 Thisrepresents a gain over the initially contracted priceof $1,250. That is, the futures contract buyer haswon $1,250 on the bet. However, depending onthe actual time path of the expected future spot ratebetween the initial purchase of the contract at$1.12/d and the contract’s maturity, the gain,properly calculated, might not be exactly $1,250.For example, if it has been necessary to make manycash contributions to the margin account which willinvolve an opportunity cost, the true gain, includingthis cost, would be less than $1,250. Alternatively,if money has been withdrawn and invested, there10 A minimum change in price per unit of currency – ortick – for the euro is $0.0001/d, which for a contract ofd125,000 is worth $0.0001/d d125,000 ¼ $12.50.For the other currencies traded on the IMM the minimumprice changes per unit and associated contract pricechanges are Japanese yen ($0.000001/¥; $12.50);Canadian dollar ($0.0001/Can$; $10); British pound($0.00002/£; $12.50); Swiss franc ($0.0001/SFr; $12.50);Australian dollar ($0.0001/A$; $10).& 74might be more than $1,250 from the margin,including the interest earnings. The uncertainty isthe result of marking-to-market risk and is shown inTable 4.2 by the in the last column.Table 4.2 also shows that if the realized spot rate is$1.11/d the futures contract is worth $138,750($1.11/d d125,000). This is a loss vis-à-vis thecontracted price of $140,000. The bet has resulted ina loss of $1,250 ($140,000 $138,750). However,because of daily marking-to-market, the properlycalculated loss might differ slightly from this amount.Other values in Table 4.2 are calculated in similarfashion. The table shows that as the eventually realizedspot value of the euro increases – reading up thetable from bottom to top – there is a larger and largergain on the futures contract to buy euros. The exactgain depends on the time path of the future’s pricefrom buying the contract to the contract’s maturity,and on interest rates along this time path.The gain or loss on the contract at differentrealized spot rates, that represent unexpected
CURRENCY FUTURES AND OPTIONS MARKETSchanges in the spot rate, are plotted in Figure 4.2(recall that the unexpected change in the spot ratefrom purchase to maturity is the realized spot rate atmaturity, minus the expected spot rate at the timeof buying the futures contract, $1.12/d). We seean upward-sloping line, akin to that plotted fora forward purchase of euros in Chapter 3 – seeFigure 3.1. However, the upward-sloping line hereis made purposely ‘‘fuzzy’’ because of uncertainty inprecise payoffs from marking-to-market risk.The opposite side of the purchase of euro futuresis the sale of euro futures. The payoffs for this arethose in the final column of Table 4.2 with the signsreversed, and the consequent payoff profile is adownward-sloping line, but one sharing the sameabsolute value of slope as the line in Figure 4.2.The link between the futures andforward marketsAs mentioned in Chapter 3, the market for currencyfutures is small compared with the market for forwards.However, despite the large difference in thesizes of the two markets, there is a mutual interdependencebetween them; each one is able toaffect the other. This interdependence is the resultof the action of arbitragers who can take offsettingpositions in the two markets when prices differ. Themost straightforward type of arbitrage involvesoffsetting outright forward and futures positions. 11If, for example, the 3-month forward price forbuying euros were $1.1200/d while the sellingprice on the same date on the CME were $1.1210/d,an arbitrager could buy euros forward from a bankand sell futures on the CME. The arbitrager wouldmake $0.0010/d, so that on each contract ford125,000, he or she could make a profit of$125.Action to profit from this arbitrage opportunity11 We can note that even without any arbitrage via offsettingoutright forward and futures positions, the rates forforward contracts and currency futures will be kept inline by users of these markets choosing between them if therates differ. This is analogous to one-way arbitrage in thecase of cross rates in Chapter 2.would quickly bring the forward price up to thefutures price. Similarly, arbitrage would bring thefutures price up to the forward price if the futuresprice were lower. However, we should rememberthat since the futures market requires daily maintenance,or marking-to-market, the arbitrage involvesrisk which can allow the futures and forward rates todiffer a little. It should also be clear that the degree towhich middle exchange rates on the two markets candeviate will depend very much on the spreadsbetween buying and selling prices. Arbitrage willensure that the bid price of forward currency doesnot exceed the effective ask price of currencyfutures, and vice versa. However, the prices candiffer a little beyond this due to marking-to-marketrisk. We should also note that the direction ofinfluence is not invariably from the rate set on thelarger forward market to the smaller futures market.When there is a move on the futures markets thatresults in a very large number of margins beingcalled, the scramble to close positions with suddenbuying or selling can spill over into the forwardmarket.CURRENCY OPTIONSWhat is a currency option?Forward exchange and currency futures contractsmust be exercised. It is true that currency futurescan be sold and margin balances can be withdrawn.It is also true that forward contracts can be offsetby a second contract that is the reverse of the originalcontract. However, all forward contracts andcurrency futures must be honored by both parties.That is, the banks and their counterparties, or thoseholding outstanding futures, must settle. There isno option allowing a party to settle only if it is tothat party’s advantage.Unlike forward and futures contracts, currencyoptions give the buyer the opportunity, but not theobligation, to buy or sell at a pre-agreed price – thestrike price or exercise price – in the future.That is, as the name suggests, the buyer of an option75 &
THE MARKETS FOR FOREIGN EXCHANGEcontract purchases the option or right to trade at therate or price stated in the contract if this is to theoption buyer’s advantage, but to allow the option toexpire unexercised if that would be better. That is,options have a throw-away feature.Exchange-traded optionsFutures options versus spot optionsAt the CME, the currency options that trade areoptions on currency futures. Such options give thebuyers the right but not the obligation to buy orsell currency futures contracts at a pre-agreed price.Options on futures derive their value from theprices of the underlying futures. The futures, inturn, derive their value, as we have seen, from theexpected future spot value of the currency. Therefore,indirectly, options on futures derive theirvalue from the expected future spot value of theunderlying currency.Currency options also trade on the PhiladelphiaExchange. Unlike the CME options which are oncurrency futures, the Philadelphia options are onspot currency. These options give the buyers theright to buy or sell the currency itself at a preagreedprice. Therefore, options on spot currencyderive their value directly from the expected futurespot value of the currency, not indirectly via theprice of futures. However, ultimately, all currencyoptions derive their value from movements in theunderlying currency. Indeed, as they approachmaturity, futures options become more and morelike spot options. 12Characteristics of currency optionsWe can illustrate the features of currency options byconsidering the quotations in Figure 4.3. The figureshows the major currency options trading on the& Figure 4.3 Premiums on principal CME optionson currency futures: September 18, 2003NotesCurrency options trading on the CME are options on futurescontracts that trade on the same exchange. Prices quoted areUS cents per unit of foreign currency. Contract prices aretherefore the prices quoted multiplied by contract sizes(reprinted by permission of The Wall Street Journalª 2003 Dow Jones & Company Inc. All rights reserved).12 As we have seen, if delivery on futures is taken, thecurrency is purchased at the spot rate. This means that atmaturity of the futures contract, an option on currencyfutures is an option on the spot currency.& 76CME, on September 18, 2003 (options also exist onother currencies including the Australian dollar,Brazilian real, and Mexican peso).
CURRENCY FUTURES AND OPTIONS MARKETSThe first thing we notice in Figure 4.3 is thatthe sizes of CME contracts are the same as oncurrency futures. This is to allow options to beused in conjunction with futures. The options areAmerican options. American options offerbuyers flexibility in that they can be exercised onany date up to and including the maturity date of theoption. European options, on the other hand,can be exercised only on the maturity date of theoption contract and not before (the PhiladelphiaStock Exchange trades European options as well asAmerican options). Buyers would pay no more fora European option of a given kind than for a moreflexible American option of the same kind.The expiry months for options are March, June,September, and December plus two near-termmonths (hence the October and November quotesin Figure 4.3). 13 CME options expire on theSaturday before the third Wednesday of the expirymonth. This makes them essentially mid-monthoptions. The Philadelphia Exchange also trades endof-monthoptions which expire on the last Friday ofthe nearest 3-month maturing contract.The numbers in the first column of each currencyin Figure 4.3 give strike prices in US dollarequivalent terms. As we have stated, the strikeprice gives the exchange rate at which the optionbuyer has the right to buy or sell the foreign currency,and is also known as the exercise price. Wecan see that on each currency there are options atnumerous strike prices with gaps of 0.5 cents on theCanadian dollar, one cent on the British pound, andso on (in interpreting the strike prices, 7300 forthe Canadian dollar means US$0.73/Can$, 1600means US$1.60/£, etc). When a new set of optionsis introduced, which occurs as an old set expires,the new options are written at the rounded-offvalue of the going spot exchange rate, and at aslightly higher and slightly lower exchange rate.New strike prices are introduced if the spot ratechanges by a large amount.13 The Philadelphia Exchange also trades longer term optionswith maturity up to 36 months.Whether the option gives the buyer the right tobuy or sell the foreign currency is identified bywhether the option is listed in one of the columnsheaded ‘‘Calls’’ or one of the columns headed‘‘Puts.’’ A call option gives the buyer the right tobuy the foreign currency at the strike price orexchange rate on the option, and a put optiongives the buyer the right to sell the foreign currencyat the strike price.We can illustrate the concepts so far introduced,and at the same time explain how options work,by considering a couple of options on euros inFigure 4.3 showing option prices on September 18,2003. Let us consider the euro call option forOctober with a strike price of $1.1200/d. Thisoption gives the buyer the right to purchase aeuro futures contract for d125,000 at a price pereuro of $1.1200 until and including the expirydate in October: all CME options are Americanoptions. The price of the option, 1.09 US centsper euro, means that for the contract to buy ad125,000 futures contract the option buyermust pay. 14$0:0109/d d125,000 ¼ $1,362:50This means that by paying $1,362.50, the optionbuyer acquires the right to buy the d125,000futures contract for $1.12/d until and includingthe expiry date of the option. The option will not beexercised if the futures price of the euro is below$1.1200/d because in these circumstances itwould be better to buy the contract directly. Sincethe futures contract maturity date is only onemonth away the futures price will be very close tothe spot rate. Therefore, we can think of the calloption on the euro at $1.1200/d as having exercisevalue if the spot rate is above $1.1200/d. 15 If the14 As always, the currency symbols can be canceled.15 In actual fact, rather than exercise the option, the buyer islikely to accept the difference between the exercise priceand the going futures price from the option writer. Thewriter is the person selling the call option, and whoreceived the $1,362.50 from the sale of the option.77 &
THE MARKETS FOR FOREIGN EXCHANGEspot rate is below $1.1200/d the option has novalue for immediate exercise because it gives theholder the right to pay more than the euro’s currentvalue.Consider next the October put option on theeuro, also at the strike price $1.1200/d. Thisoption has a price per euro of 0.94 US cents, or$0.00940/d. Therefore, the option to selld125,000 up to and including the maturity date inOctober costs$0:00940/d d125,000 ¼ $1,175If the futures price of the euro is above $1.1200the option will have no immediate exercise value;it would be better to sell the euro on the futuresmarket than at the exercise price. It is thrownaway, with the loss of $1,175. On the other hand,if the euro futures price is below $1.1200 thenthe put option gives the buyer the right to selld125,000 at the higher exercise price, $1.1200.The $1,175 paid for the put option can be thoughtof as an insurance premium against the risk thatthe euro futures price might fall below $1.1200. Inthe event that this does not occur, the insurancesimply expires.Because of the way new options are introduced,with strike prices at, above and below the currentfutures price, there are options with higher andlower strike exchange rates than the futuresexchange rate. A call option that gives the buyer theright to buy currency futures at a strike exchangerate that is below the current futures price is said tobe in the money. This is because the option holderhas the right to buy the futures contract for less thanit would cost in the futures market. For example,the euro call option at $1.1200 is in the money if thecurrent futures price is above $1.1200. A call optionwith a strike price that is above the current futuresexchange rate is said to be out of the money; theoption holder would find it cheaper to buy theforeign currency on the futures market than toexercise the option. The fact that a call option mightbe out of the money does not mean the option hasno value. As long as there is a possibility that thefutures price might move above the strike price& 78during the maturity of the option, people willbe willing to pay for the option contract.A put option that gives the buyer the right to sellthe foreign currency is said to be in the money whenthe strike exchange rate is higher than the currentfutures exchange rate. This is because the optionholder has the right to sell the currency contract formore than it could be sold on the futures market.A put option is out of the money when the strikeexchange rate is lower than the current futuresexchange rate. This is because the option holderwanting to sell the futures contract would be betteroff not to exercise the option, but rather to sell atthe futures price. As with call options, the fact that aput option is out of the money does not mean it hasno value. It has value as long as there is a possibilitythat the futures rate might move below the strikeexchange rate during the life of the option.The extent to which an option is in the money iscalled its intrinsic value. For example, if thefutures exchange rate is $1.1300 per euro the$1.1200 call has an intrinsic value of one US centper dollar. That is, the intrinsic value is how muchper euro would be gained by exercising the optionimmediately. The actual market price of the optionwill exceed the intrinsic value. This is because thereis always the possibility of an even larger gain fromexercising the option during the remainder of itsmaturity. While call options have intrinsic valuewhen the strike price is below the futures exchangerate, put options have intrinsic value when thestrike price exceeds the futures exchange rate. Theimpact of different variables on option premiums issummarized in Table 4.3.The amount paid for the option on each unitof foreign currency – for each British pound or eacheuro etc. – is called the option premium. Thispremium can be considered to consist of two parts,the intrinsic value if there is any, and the timevalue of the option. The time value is the part of thepremium that comes from the possibility that, atsome point in the future, the option might havehigher intrinsic value than at that moment. When anoption is at the money, which occurs whenthe strike price exactly equals the current futures
CURRENCY FUTURES AND OPTIONS MARKETS& Table 4.3 Impact of variables affecting currencycall and put option premiumsVariable thatis increasingSpot price offoreign currencyEffect onprice of callIncreaserate, the option premium is equal to the option’stime value.Quotation conventions and marketorganizationEffect onprice of putDecreaseExercise price Decrease IncreaseExchange rate Increase IncreasevolatilityDomestic interest Increase DecreaserateForward premium Increase DecreaseTime to maturity Uncertain a Uncertain aNotea Time to maturity increases the chance the option willmove into the money, increasing the option premium. Onthe other hand, longer time to maturity involves greateropportunity cost of money invested.Option dealers quote a bid and an ask premium oneach contract, with the bid being what buyers arewilling to pay, and the ask being what sellers want tobe paid. After the buyer has paid for an optioncontract, he or she has no financial obligation.Therefore, there is no need to talk about margins foroption buyers. The person selling the option is calledthe writer. The writer of a call option must standready, when required, to sell the currency to theoption buyer at the stated strike price. Similarly,the writer of a put option must stand ready to buy thecurrency from the option buyer at the strike price.The commitment of the writer is open throughoutthe life of the option for American options, and on thematurity date of the option for European options.The option exchange guarantees that option sellershonor their obligations to option buyers, andtherefore requires option sellers to post a margin.As in the case of futures contracts, an exchangecan make a market in currency options sufficientlydeep only by standardizing the contracts. This iswhy option contracts are written for specificamounts of foreign currency, for a limited numberof maturity dates, and for a limited number of strikeexchange rates. The standardization allows buyersto resell contracts prior to maturity. It also allowswriters to offset their risks more readily because,for example, the writer of a call option can enter themarket as a buyer of a call option to limit losses or tolock in gains. 16Determinants of the market values ofcurrency optionsThe factors that influence the price of anoption are:1 Intrinsic value As we have said, the premiumon an option can be considered to be made up ofthe time value and the intrinsic value. (We recallthat the intrinsic value is the extent to which thecurrent futures price exceeds the strike price ona call option, and the extent to which the strikeprice exceeds the current futures price on a putoption. Alternatively, it is what the optionwould be worth if it had to be exercisedimmediately.) Therefore, the more the option isin the money (i.e. the higher is the intrinsicvalue) the higher is the option premium.2 Volatility of the underlying exchange rateCeteris paribus, the more volatile is the underlyingrate, the greater the chance that anoption will be exercised to the benefit of thebuyer and to the cost of the seller. 17 That is,16 The ways that options can be used for hedging andspeculating are described in Chapter 13.17 The effects of volatility and the other influences listed hereon stock options were first described by Fischer Black andMyron Scholes, ‘‘The Pricing of Options and CorporateLiabilities,’’ Journal of Political Economy, May/June 1973,pp. 637–59. The effects of volatility and other factors oncurrency options have been described by Mark B. Garmanand Steven W. Kohlhagen, ‘‘Foreign Currency OptionValues,’’ Journal of <strong>International</strong> Money and <strong>Finance</strong>,December 1983, pp. 231–7, and by J. Orlin Grabbe,‘‘The Pricing of Call and Put Options on ForeignExchange,’’ Journal of <strong>International</strong> Money and <strong>Finance</strong>,December 1983, pp. 239–53.79 &
THE MARKETS FOR FOREIGN EXCHANGEthe higher the volatility of the underlyingexchange rate, the greater the possibility thatit will at some time exceed the strike exchangerate of a call, or be below the strikeexchange rate of a put. Consequently, buyerswill pay more for an option, and sellers willdemand more, if the volatility of the exchangerate is higher.Since Philadelphia options give the buyerthe option to buy or sell spot foreignexchange, it is the volatility of the spotexchange rate that determines the value ofPhiladelphia options. With CME options beingon currency futures contracts rather than onspot exchange, it is the price and volatility ofCME futures contracts that determines thevalue of CME currency options. However,because the spot exchange rate is the principalfactor affecting futures contract prices, it isstill the volatility of the spot rate that matters.American or European option type Thegreater flexibility of American than Europeanoptions means buyers will not pay more for aEuropean option than for an American optionof the same strike price and maturity (recallthat American options can be exercised at anytime before the expiry date, while Europeanoptions can be exercised only on the expirydate). Indeed, for a given strike price, exchangerate volatility and period to expiration,American options are typically more valuablethan European options.Interest rate on currency of purchase Thehigher the interest rate on the currency paidfor an option, the lower is the present value ofthe exercise price. A higher interest rate consequentlyhas the same effect on an option asdoes a lower exercise price, namely, it increasesthe market value of a call and reduces themarket value of a put. 18 5 The forward premium/discount or interestdifferential Because of very different rates ofinflation, imbalances of trade, and so on, therecan be trends in exchange rates that are to anextent predictable. For example, the foreignexchange values of currencies of countries withvery rapid inflation tend to decline vis-à-visthose with slow inflation. Ceteris paribus, thegreater the expected decline in the foreignexchange value of a currency, the higher is thevalue of a put option on that currency becausethere is a greater chance the put option will beexercised, and the larger the possible intrinsicvalue when it is exercised. Similarly, the morea currency is expected to increase in value –because of low inflation, consistently goodinternational trade performance, and so on –the higher is the value of a call option on thatcurrency. Again, this is because, ceteris paribus,the more the currency is expected to increasein value, the more likely it is that a call optionwill be worth exercising and the bigger thepossible intrinsic value.Because the forward rate, under the assumptionof risk neutrality, equals the expectedfuture spot rate, currencies that are expectedto decline in value tend to trade at a forwarddiscount, while currencies expected to increasein value tend to trade at a premium. 19 Indeed,the more a currency is expected to decline/increase in value, the larger the forwarddiscount/premium tends to be. It follows thatceteris paribus, the greater is the forwarddiscount on a currency, the higher the valueof a put option and the lower the value of a calloption on that currency. Similarly, the greateris the forward premium, the higher the valueof a call option and the lower the value of a putoption on the currency. 203418 This is because other things are assumed constant asthe interest rate changes. See John C. Cox and MarkRubenstein, Options Markets, Prentice-Hall, EnglewoodCliffs, NJ, 1985, p. 35.& 8019 This was explained in Chapter 3.20 There is an arbitrage relation between option prices and theforward exchange rate that can be used to describe the effectswe have described. This is discussed in the appendix to thischapter. See also Cox and Rubinstein, op. cit., pp. 59–61.
CURRENCY FUTURES AND OPTIONS MARKETSAn alternative way of stating the effect ofexpected decreases or increases in exchangerates on the value of options is in terms ofinterest rates. Countries with currencies thatare expected to decline in value tend to havehigh interest rates relative to other countries.(such high rates are necessary to compensateinvestors for the expected decline in exchangerates). Therefore, put options tend to be worthmore when interest rates are higher thanelsewhere; the relatively high interest ratessuggest an expected decline in the value of thecurrency, and a consequently increased chancethataputwillbeexercised.Similarly,calloptionstend to be worth more when interest rates arelower than elsewhere because relatively lowinterest rates suggest an expected increase inthe currency’s value, and consequently anincreased chance the call will be exercised.6 Length of period to expiration Ceteris paribus,the longer the maturity period of the option, thegreater is the chance that at some time theexchange rate will move above the strike price ofa call or below the strike price of a put. That is,the longer the maturity, the greater the chancethe option will move into the money. Thisparticular effect of time means that the longerthe period to expiration, the higher the optionpremium a buyer is prepared to pay, and thehigher the option premium a seller will require.However, there is another force of time workingin the other direction. Specifically, the longer thematurity, the higher is the opportunity cost offunds used to buy the option. This effect lowersthe option premium: buyers pay less when themoney paid for an option could earn more ifinvested in something else. As it turns out, theempirical evidence shows what seems intuitivelyreasonable, namely that option premiums increasewith maturity. That is, the chance ofmoving into the money has a larger effect thanthe opportunity cost.The effects of different variables on call and putoption premiums described earlier are summarizedin Table 4.3. They are also illustrated in theappendix to this chapter. 21Over-the-counter (OTC) optionsWell before options began trading on formalexchanges in 1981, there had been an active overthe-counteroption market in Europe, the optionsbeing written by large banks. 22 Indeed, the over-thecounteroption market continues to exist alongsidethe formal option exchanges. Amounts traded tend tobe large, generally over $1 million. The banks thatwrite over-the-counter options often use formalexchange options to hedge their own positions.Many over-the-counter options written by banksare contingent upon such outcomes as whether acorporate takeover or bid on a foreign project isaccepted 23 (see Exhibit 4.1). That is, the buyer ofthe option purchases the opportunity to buy a foreigncurrency at a given strike exchange rate if, forexample, a particular takeover occurs. An exampleof such an over-the-counter option is the option onsterling purchased by US insurance broker, Marshand McLennan Company. Marsh and McLennanmade a cash and share offer for C.T. Bowring andCompany, a member of Lloyds of London, whichrequired Marsh and McLennan to pay £130 millionif the offer was accepted. Rather than take a chance onthe exchange rate that might prevail on the takeoversettlement date, Marsh and McLennan wanted tobuy a call option for £130 million that it couldexercise only if its takeover effort succeeded. 24Bankers Trust agreed to provide an option whichcould be exercised up to 6 months after the original21 The appendix considers arbitrage conditions referred to asput-call parity and put-call forward parity.22 Currency options had also been traded in an unorganizedfashion in the United States until this was ruled illegal.See David Babbel, ‘‘The Rise and Decline of CurrencyOptions,’’ Euromoney, September 1980, pp. 141–9.23 As Exhibit 4.1 explains, there are many other possible waysof designing options.24 This interesting case is described in ‘‘Marsh and McLennanInsures Takeover Exposure with Call Provision,’’ MoneyReport, Business <strong>International</strong>, June 13, 1980.81 &
THE MARKETS FOR FOREIGN EXCHANGEEXHIBIT 4.1THE SCOPE FOR WRITING OPTIONSIt is possible to write options based on more than justthe eventually realized spot exchange rate. Amongthe various currency options that are used are thefollowing:Path-dependent or ‘‘Asian’’ Options These payout according to the average spot rate that hasprevailed over a stated previous period of time. Forexample, an Asian option might have an exerciseprice equal to the average end-of-day spot rate forthe previous year. Such an option is useful forhedging risk when a company is converting itsforeign currency income into domestic currencycontinuously throughout the year. For example, toavoid making foreign exchange losses, an exportercan buy Asian puts on each of the foreign currenciesit earns. Then, if a foreign currency, onaverage, falls in value over the year, the optionholder makes a gain on that option equal to its losson foreign exchange earnings in that currency.Look-back Options These options give buyersthe right to enjoy the best exchange rate that hasoccurred during a preceding period of time. Forexample, a 3-month look-back call on the Japaneseyen gives the option buyer the right to buy yenat the lowest price of the yen in the previousquarter of a year. Similarly, a look-back yen putgives the owner the right to receive the best sellingprice of the yen in a given previous period of time.Of course, the premiums charged by writers of suchoptions are higher than for regular options; in asense the option provides discretion over whetherto exercise, and over the exercise price within therange it has traveled.Option-linked Loans An option can be writtento repay a loan in the currency of the borrower’schoice, where the different amounts of the alternativecurrencies which can be paid are stated inthe contract. Multinational companies earningvarious foreign currencies find these useful sincethey can pay back with the less valuable currencies.The cost of the loans does, however, reflect theoption the borrower enjoys. Alternatively, theoption over currency of repayment can be given tothe lender. In this case the cost of the loan – theinterest rate – is low to reflect the lender’s option.Option-linked Bonds An extension of the optionlinkedloan is a bond for which the buyer has thechoice of currency for paying coupons, and possibly,also for repayment of principal. As with optionlinkedloans, the amounts of alternative currenciesrequired on the coupons or principal are stated onthe bond, with the borrower deciding what to paybased on spot exchange rates when payments occur.Payments will be in the least valuable currency atthe time. This makes the bond yields high to compensatethe lender. Alternatively, the option overcurrency of receipt of coupons or principal can begiven to the lender. This reduces yields as the lenderstands to benefit, and the borrower stands to lose.Source: ‘‘The Look-back and the Linkage,’’ Euromoney,special supplement, Risk Management; Taming the Demon,April 1989, p. 51.takeover offer. The takeover bid did succeed andthe option was duly exercised.The reason why the over-the-counter marketcoexists alongside the formal options market is thatoptions that trade on option exchanges are not perfectlysuited for contingencies such as whethera takeover bid is accepted, whether an exportcontract is signed, and so on. Exchange-tradedoptions are imperfectly suited for such contingencies& 82because, even though the option buyer can choosewhether to exercise, the value of exchange-tradedoptions is contingent upon what happens toexchange rates rather than on whether a deal isconsummated. 25 An option that is contingent uponcompletion of a takeover might be cheaper than a25 See Nalin Kulatilaka and Alan J. Marcus, ‘‘Hedging ForeignProject Risk,’’ Working Paper, Boston University Schoolof Management, April 1991.
CURRENCY FUTURES AND OPTIONS MARKETStraditional exchange-traded option. This is becausethe writer of a call contingent on completion ofa takeover or a bid on a foreign projectdoes not deliver foreign exchange if the foreigncurrency increases in value but the deal is notcompleted. That is, there are outcomes where thedeal-completion-contingent option writer does notlose, but where the writer of an exchange optionwould lose; an exchange call option will be exercisedif the option has value on the options exchange, evenif the deal is not completed. Banks that write overthe-countercustomized options frequently ‘‘reinsure’’on an options exchange, so it is the bank ratherthan the option buyer that gains when the foreigncurrency increases in value but, for example, thetakeover offer is rejected. The bank gains becauseit reinsures by buying an exchange-issued calloption to cover the call it has written, and theexchange call increases in value without the need todeliver the foreign currency if the takeover offer isrejected.Payoff profiles for currency optionsBy plotting the payoff profiles for currency optionswe can graphically compare the consequences ofusing options for hedging and speculation withthe alternative methods involving forward andfutures contracts. Let us begin by considering a calloption.Payoff profiles for call option buyers/writersLet us consider a call option on d125,000 with astrike or exercise price of $1.1200/d. If at the dateof expiry the spot (and hence also the futures) rate is$1.1200/d, so that the option expires exactly atthe money, the option buyer will lose what he orshe had paid for the option. Let us suppose thiswas $1,000. The option buyer will also lose theamount paid for the option if it expires out of themoney, that is at a spot exchange rate of less than$1.1200/d. This is shown in Table 4.4 with zeroexercise value at the strike price of the euro andbelow. It is also illustrated by the horizontal line at$1,000 in Figure 4.4.If the realized spot price of the euro at maturity ismore than $1.1200/d the call option ends up in themoney and has exercise value. For example, at$1.1280/d the intrinsic value of the call option at$1.1200/d is:$0:0080/d d125,000 ¼ $1,000& Table 4.4 Payoffs on purchase of euro call optionRealizedspot rateRealized rateminus strike rateGain (þ) orloss( ) on contractCost ( )of optionOverallgain (þ) orloss ( )1.1500 þ$0.0300/¤ þ$4,000 $1,000 þ$3,0001.1420 þ$0.0240/¤ þ$3,000 $1,000 þ$2,0001.1360 þ$0.0160/¤ þ$2,000 $1,000 þ$1,0001.1280 þ$0.0080/¤ þ$1,000 $1,000 —1.1200 — — $1,000 $1,0001.1120 $0.0080/¤ — $1,000 $1,0001.1040 $0.0160/¤ — $1,000 $1,0001.0960 $0.0240/¤ — $1,000 $1,0001.0880 $0.0300/¤ — $1,000 $1,000NotesWe assume the option is a call to buy ¤125,000 with a strike price, X($/¤), of $1.1200/¤, and that the price paid forthe option is $1,000. At $1.1200/¤ and exchange rates below this at maturity the option has no exercise value. At realizedspot rates above $1.1200/¤ the call option expires in the money. At $1.1280/¤, for example, the option has exercise valueof ¤125,000 $0.0080/¤ ¼ $1,000. This gain on the option is offset by the amount paid. Above $1.1280/¤ there is anoverall gain on the option for the option buyer. The option writer gains what the option buyer loses and loses what the buyer gains.83 &
THE MARKETS FOR FOREIGN EXCHANGE+$$3,000$2,000Optionsbuyer–$1,000+–0.03 –0.02 –0.010.01–$1,000–$2,0000.020.03S($/ )–X($/ )Optionswriter–$3,000–& Figure 4.4 Payoff profiles of buyer and writer of euro call option for ¤125,000NotesThe euro call buyer is assumed to pay $1,000 for an option to buy ¤125,000 at strike exchange rate, X($/¤). If therealized spot exchange rate S($/¤), is at or below the strike rate the option has no exercise value. Then, the buyerloses $1,000 and the writer gains $1,000. At realized spot rates above X($/¤) the call option has exercise value.For example, at S($/¤) X($/¤) ¼ $0.0080/¤ the exercise value is $1,000, so buyer and writer both break even overall.At S($/¤) X($/ ¤) > $0.0080/¤, the buyer gains overall and the writer loses. The greater is S($/¤) X($/¤)the greater the buyer’s gain and writer’s loss. The figure plots the values shown in Table 4.4.This is the same as the amount paid for the optioncontract and so the option buyer breaks even. Atrealized spot exchange rates at maturity above$1.1280/d the option buyer enjoys a profit, andthe higher the value of the euro the greater the gainfrom having purchased the option contract. This isshown in Table 4.4 and plotted in Figure 4.4. Thepayoff profile for the euro call option buyer isshown to be $1,000 at all exchange rates wherethe realized spot value of the euro is no greater thanthe strike price, that is, to the left of the verticalaxis. At realized spot rates above the strike pricethere is positive exercise value, with this increasinglinearly with the spot rate.Figure 4.4 also shows the payoff profile of thewriter, that is, the seller, of the option. What thebuyer pays the writer receives, and what the buyerreceives, the writer pays. 26 Therefore, the writerhas a gain of $1,000 when the option ends up outof-the-money,that is, to the left of the vertical axis.When the realized spot rate ends up above the strike26 We are ignoring transactions costs. Under this assumption theoption market, like the futures market, is a zero-sum game.& 84price, that is, to the right of the vertical axis, thewriter loses what the buyer gains, so the slope of thepayoff profile is the negative of the buyer’s profile.Payoff profiles for put option buyers/writersThe gains or losses of buyers of euro put options areshown in Table 4.5 and plotted in Figure 4.5. Whenthe realized spot price of the euro ends up at orabove $1.1200/d the put has no exercise value. Thewriter receives the price the buyer pays for theoption, assumed to be $1,000, and so the writergains $1,000 and the buyer loses $1,000. At realizedspot rates below $1.1200/d the put on the euromoves into-the-money. For example, at $1.1120/dthe option to sell d125,000 at $1.1200/d hasexercise value of$0:0080/d d125,000 ¼ $1,000This just offsets the amount paid for the option so thewriter and the buyer break even. At realized spotrates below $1.1120/d the option buyer begins tohave an overall gain and the buyer an equal overallloss. The more the realized rate is below $1.1120/dthe more the put buyer gains and the writer loses.
CURRENCY FUTURES AND OPTIONS MARKETS& Table 4.5 Payoffs on purchase of euro put optionRealizedspot rateRealized rateminus strike rateGain (þ) orloss( ) on contractCost ( ) of option Overall gain (þ)or loss ( )1.1500 þ$0.0300/¤ — $1,000 $1,0001.1420 þ$0.0240/¤ — $1,000 $1,0001.1360 þ$0.0160/¤ — $1,000 $1,0001.1280 þ$0.0080/¤ — $1,000 $1,0001.1200 — — $1,000 $1,0001.1120 $0.0080/¤ þ$1,000 $1,000 —1.1040 $0.0160/¤ þ$2,000 $1,000 þ$1,0001.0960 $0.0240/¤ þ$3,000 $1,000 þ$2,0001.0880 $0.0300/¤ þ$4,000 $1,000 þ$3,000NotesWe assume the option is a put to sell ¤125,000 with a strike price, X($/¤), of $1.1200/¤, and that the price paid forthe option is $1,000. At $1.1200/¤ and exchange rates above this at maturity the option has no exercise value. At realizedspot rates below $1.1200/¤ the put option expires in the money. At $1.1120/¤, for example, the option has exercise valueof ¤125,000 $0.0080/¤ ¼ $1,000. This gain on the option is offset by the amount paid. Below $1.1280/¤ there is anoverall gain for the option buyer.+$Optionbuyer$3,000$2,000$1,000– +–0.03Optionwriter–0.02 –0.01 0.01 0.02 0.03–$1,000–$2,000–$3,000–S($/ )–X($/ )& Figure 4.5 Payoff profiles of buyer and writer of euro put option for ¤125,000NotesThe buyer of the ¤125,000 euro put at strike price X($/¤) is assumed to pay $1,000 to the option writer. If the realizedspot exchange rate ends up at or above the strike rate, that is, S($/¤) X($/¤) 0, the put option ends up out of money,and the writer earns $1,000 and the buyer has a loss of $1,000. At spot rates below X($/¤) the option has exercise value.For example, at S($/¤) X($/¤) ¼ 0.0080/¤ the put option has exercise value of $1,000. The buyer and writer then bothbreak even. When S($/¤) X($/¤) < $0.0080/¤ the buyer makes an overall gain and the writer loses. The values plottedare shown in Table 4.5.FORWARDS, FUTURES, AND OPTIONSCOMPARED: A SUMMARYWhile forwards, futures, and options can allbe used to both reduce foreign exchange risk –that is, to hedge – and purposely to take foreignexchange risk – that is, to speculate – thedifferences between forwards, futures, and optionsmake them suitable for different purposes.An explanation of which type of contract wouldbe most appropriate in different circumstancesmust wait until we have dealt with many othermatters, including further ways of hedging and85 &
THE MARKETS FOR FOREIGN EXCHANGE& Table 4.6 Forwards, futures, and options comparedForward contracts Currency futures a Currency options bDelivery discretion None None Buyer’s discretion. Sellermust honor if buyerexercises.Maturity date Any date Third Wednesday ofMarch, June, Sept.,or Dec.Maximum length Several years 12 months 36 monthsContracted amount Any value £62,500, Can$100,000,etc.Secondary market Must offset with Can sell via exchangebankMargin requirementInformal, oftenline of credit or5–10% on accountFormal fixed sum percontract, for example,$2,000. Daily markingto market.Contract variety Swap or outrightformOutrightGuarantor None Futures clearingcorporationFriday before thirdWednesday of March,June, Sept., or Dec. onregular options. LastFriday of month onend-of-month options.£31,250, Can$50,000,etc.Can sell via exchangeNo margin for buyer whopays for contract. Sellerposts 130% of premiumplus lump sum varyingwith intrinsic value.OutrightOptions clearing corporation.Major users Primarily hedgers Primarily speculators Hedgers and speculatorsNotesa Based on Chicago IMM Contracts.b Based on Philadelphia Stock Exchange contracts which are on spot foreign exchange. IMM options are on futures, andcontracted amounts equal those on futures contracts.speculating, so that at this point we can do littlemore than list the differences between forwards,futures, and options. This is done in Table 4.6.The table notes the primary users of the marketsas well as the institutional difference betweenforwards, futures, and options. The reasons thedifferent markets have different primary userscan be explained with the payoff profiles we haveconstructed, and are covered more fully inChapter 13.SUMMARY1 Currency futures are bets on what will happen to the spot exchange rate, settled every day.2 Futures are traded in specialized markets in standard contract sizes, such as d125,000.There are relatively few maturity dates.3 Because of their low transaction costs and easy settlement, currency futures appeal tospeculators.& 86
CURRENCY FUTURES AND OPTIONS MARKETS4 The payoff profiles for futures are similar to those for forward contracts, except thatfutures outcomes are a little uncertain because of marking-to-market risk.5 Marking-to-market risk is the result of uncertainty in the path of the future’s contractvalue between purchase and sale and the volatility of interest rates.6 Futures and forward exchange rates are linked by arbitrage.7 Currency options give buyers the right or opportunity, but not the obligation, to buy or sellforeign exchange at a pre-agreed exchange rate, the strike exchange rate. Call optionsgive the buyer the right to purchase the foreign currency at the strike exchange rate,and put options give the buyer the right to sell the foreign currency at the strikeexchange rate.8 American options allow the buyer to exercise at any time prior to the expiry of theoption, while European options allow the buyer to exercise only on the expiry date ofthe option.9 The value of an option depends on the extent to which it is in the money, that is,the extent to which the option has intrinsic value, and also on the volatility ofthe underlying exchange rate, the interest rate on the currency paid for theoption, the forward exchange premium or discount and the length of time toexpiration. The value of the option can also be considered to depend on theinterest rate differential, which, like the forward premium or discount, reflectsthe expected path of the exchange rate.10 An over-the-counter customized options market coexists with the exchange-basedcurrency options. Over-the-counter options are written by banks.11 Options allow their owners to gain from favorable outcomes, but to lose only the pricepaid for the option when outcomes are unfavorable. Buying an option is like buyinginsurance against an unfavorable change in the exchange rate.12 Payoff profiles for options have sloped segments like those of forwards and futures,but also have horizontal segments. The horizontal segments represent the limit of any lossto the amount paid for an option contract.REVIEW QUESTIONS1 What is a currency futures contract?2 How are futures contracts ‘‘cleared?’’3 What is the meaning of ‘‘margin’’ on a futures contract?4 What is a meant by a margin’s ‘‘maintenance level?’’5 What is ‘‘marking-to-market?’’6 What causes marking-to-market risk?7 What is meant by the ‘‘strike’’ or ‘‘exercise’’ price of an option?8 How do American options differ from European options?9 What is a ‘‘put option’’ on a currency?10 What is a ‘‘call option’’ on a currency?11 What is an options ‘‘writer?’’12 What does it mean to be ‘‘in the money?’’87 &
THE MARKETS FOR FOREIGN EXCHANGE13 What does it mean to be ‘‘out of the money?’’14 What is an ‘‘option premium?’’15 What is the ‘‘time value’’ on an option?16 What factors influence options prices?17 What is an ‘‘over-the-counter option?’’18 What goes on the axes of a payoff profile for a currency option?ASSIGNMENT PROBLEMS1 Why do you think that futures markets were developed when banks already offeredforward contracts? What might currency futures offer which forward contracts do not?2 To what extent do margin requirements on futures represent an opportunity cost?3 How does the payoff profile of a futures sale of a currency compare to the profile of apurchase of the same currency?4 Why is a futures contract similar to a string of bets on the exchange rate,settled every day?5 Do you think that a limit on daily price movements for currency futures would makethese contracts more or less risky or liquid? Would a limitation on price movementmake the futures contracts difficult to sell during highly turbulent times?6 How could arbitrage take place between forward exchange contracts and currencyfutures? Would this arbitrage be unprofitable only if the futures and forward rates wereexactly the same?7 Does the need to hold a margin make forward and futures deals less desirable than if therewere no margin requirements? Does your answer depend on the interest paid on margins?8 How does a currency option differ from a forward contract? How does an optiondiffer from a currency future?9 Suppose a bank sells a call option to a company making a takeover offer where the optionis contingent on the offer being accepted. Suppose the bank reinsures the option on anoptions exchange by buying a call for the same amount of foreign currency. Consider theconsequences of the following four outcomes or ‘‘states:’’abcdThe foreign currency increases in value, and the takeover offer is accepted.The foreign currency increases in value, and the takeover offer is rejected.The foreign currency decreases in value, and the takeover offer is accepted.The foreign currency decreases in value, and the takeover offer is rejected.Consider who gains and who loses in each state, and the source of gain or loss. Satisfyyourself why a bank that reinsures on an options exchange might charge less for writingthe takeover-contingent option than the bank itself pays for the call option on theexchange. Does this example help explain why a bank-based over-the-counter marketcoexists with a formal options exchange market?10 What is the payoffprofile from buying and writingacalloption?Ignorethe transaction costs.11 What type of option(s) would speculators buy if they thought the euro would increasemore than the market believed?& 88
CURRENCY FUTURES AND OPTIONS MARKETS12 What type of option would speculators write if they thought the Swiss franc wouldincrease more than the market believed?BIBLIOGRAPHYBorensztein, Eduardo R. and Michael P. Cooley, ‘‘Options on Foreign Exchange and Exchange Rate Expectations,’’IMF Staff Papers, December 1987, pp. 643–80.Einzig, Paul A., The Dynamic Theory of Forward Exchange, 2nd edn, Macmillan, London, 1967.Garman, Mark B. and Steven W. Kohlhagen, ‘‘Foreign Currency Option Values,’’ Journal of <strong>International</strong> Moneyand <strong>Finance</strong>, December 1983, No. 3, pp. 231–7.Giddy, Ian H., ‘‘Foreign Exchange Options,’’ The Journal of Futures Markets, Summer 1983, No. 2, pp. 143–66.Grabbe, J. Orlin, ‘‘The Pricing of Call and Put Options on Foreign Exchange,’’ Journal of <strong>International</strong> Money and<strong>Finance</strong>, December 1983, No. 3, pp. 239–53.<strong>International</strong> Monetary Market of the Chicago Mercantile Exchange, The Futures Market in Foreign Currencies,Chicago Mercantile Exchange, Chicago, undated.——, Trading in <strong>International</strong> Currency Futures, Chicago Mercantile Exchange, Chicago, undated.——, Understanding Futures in Foreign Exchange, Chicago Mercantile Exchange, Chicago, undated.Kolb, Robert W., Futures, Options and Swaps, 4th edn, Blackwell, Malden, MA, 2002.Kubarych, Roger M., Foreign Exchange Markets in the United States, Federal Reserve Bank of New York, 1978.Levy, Edmond, ‘‘Pricing European Average Rate Currency Options,’’ Journal of <strong>International</strong> Money and <strong>Finance</strong>,October 1992, pp. 474–91.Philadelphia Stock Exchange: Understanding Foreign Currency Options: The Third Dimension to ForeignExchange, Philadelphia Stock Exchange, undated.Smith, Clifford W. Jr., Charles W. Smithson, and D. Sykes Wilford, Managing Financial Risk, Harper and Row,New York, 1990.APPENDIX A:PUT-CALL FORWARD PARITY FOR EUROPEAN OPTIONSPut-call forward parity: a graphical viewWhen there are alternative financial arrangements that can achieve the same goal, arbitrage ensures the prices ofthe alternatives and/or returns on the alternatives are equal. 27 When it comes to options, equivalent outcomes canbe achieved by buying a European call and selling a European put on the one hand, and a forward purchase of theforeign currency at the strike exchange rate on the other hand. 28 Similarly, selling a European call and buying a putis equivalent to selling the foreign currency forward at the same exchange rate. The equivalence of the payoffs forthese situations is illustrated in Figures 4A.1 and 4A.2.Figure 4A.1 shows the payoff profile for the buyer of a spot call option for d125,000 at a strike price of X($/d)for different realized spot rates. At realized spot rates at maturity that are less than or equal to the strike price, that27 The choice between alternatives can be thought of as one-way arbitrage. We ignore transaction costs.28 The maturities of options and forwards must also be the same.89 &
THE MARKETS FOR FOREIGN EXCHANGE$+$3,000Forwardpurchase ofBuy callon$2,000$1,000Sell puton––0.03–0.02–0.01+0.01 0.02 0.03S($/ )–X($/ )–$1,000–$2,000–$3,000–& Figure 4A.1 Equivalence of buying foreign currency European call and selling put, versus buyingthe foreign currency forwardNotesThe payoff profiles are drawn for options and forwards for ¤125,000 with an assumed option contract price of$1,000. The call is seen to increase in value with the dollar price of the euro, S($/¤), versus the strike price, X($/¤),breaking even when the euro ends up in the money by $0.0080/¤. The sale of the euro put provides $1,000 when the eurocall ends up in the money, and loses money otherwise. The vertical sum of payoffs for the call purchase and put sale is thesame as the payoffs for a forward purchase of the euro at the same price and for the same maturity date. Note, however,that this put-call forward parity applies only to European options.$+$3,000Buy puton$2,000$1,000––0.03–0.02–0.01–$1,0000.01 0.02 0.03+S($/ )–X($/ )–$2,000–$3,000Forwardsale ofSell callon–& Figure 4A.2 Equivalence of selling foreign currency European call and buying put, versus sellingthe foreign currency forwardNotesThe payoff profiles are drawn for options and forwards for ¤125,000 with an assumed option contract price of $1,000.The put is seen to increase in value as the spot price of the euro falls below the strike price, breaking even when the optionis in the money by $0.0080/¤. The sale of the euro call provides $1,000 when the euro put is in-the-money, and losesmoney otherwise. The vertical sum of payoffs for the purchase of the euro put and sale of the euro call is the same as for thesale of the euro forward at the same price and for the same maturity date. Note, however, that this put-call forward parityapplies only to European options.& 90
CURRENCY FUTURES AND OPTIONS MARKETSis, [S($/¤) X($/¤)] 0, the buyer loses the price paid for the contract, assumed to be $1,000. At realizedspot rates above the strike price the call moves into the money and the option has exercise value. For example, atS($/¤) X($/¤) ¼ $0.0080/¤ the exercise value of the option is$0:0080/¤ ¤125;000 ¼ $1;000This amount is the same as the price we assume was paid for the option so the buyer and writer do not gain or lose. Atrealized values of S($/¤) X($/¤) above $0.0080/¤ the option buyer has a net gain and the writer an equal netloss. 29 For example, at S($/¤) X($/¤) ¼ $0.0160 the exercise value of the option is$0:0160/¤ ¤125; 000 ¼ $2;000After allowing for the $1,000 paid for the option by the buyer and received by the writer, the buyer gains $1,000 andthe writer loses $1,000. Other payoffs to the option buyer are shown by the line that is horizontal to the left of thevertical axis and upward sloping to the right of the vertical axis.Writing a put on ¤125,000 provides $1,000 to the option writer if the option ends up at or out of the money, thatis, if the spot price of the euro is not below the exercise price. This is illustrated in Figure 4A.1 by the horizontal line tothe right of the vertical axis at height $1,000. Sale of the put is a break-even proposition at a spot rate where the put isin the money by $0.0080/¤, thatis,S($/¤) X($/¤) ¼ $0.0080/¤, and when the option ends up more in themoney the put seller loses. This is illustrated in Figure 4A.1 by the upward-sloping line to the left of the vertical axis.If the two option profiles, those for buying a call and writing a put, are combined, the result is an upwardslopingline through the origin as in Figure 4A.1. This is the same payoff profile as for a forward contract tobuy ¤125,000 at X($/¤). 30 For example, when S($/¤) X($/¤) ¼ $0.0080/¤ a forward contract for ¤125,000at X($/¤) gains $1,000, when S($/¤) X($/¤) ¼ 0.0080/¤ the forward contract loses $1,000, and so on.Figure 4A.1 shows that the forward profile is identical to the combination of buying the euro call and selling theeuro put at the same price and for the same maturity. We recall, however, that these results hold only forEuropean options.Factors influencing currency option pricesThe equivalence of the option combination and forward contract described earlier can also be illustrated byconsidering the payoffs in Table 4A.1. The table can also be used to identify the factors influencing option premiumssummarized in Table 4.3.The top line of Table 4A.1 shows the payoffs from buying a call at price C. If the realized spot price of the euro,S T ($/¤), ends up less than or equal to the strike price, X($/¤), the euro call option has no exercise value. If, on theother hand, the spot rate is higher than the strike price, the option buyer’s gain on each euro is equal to the excess ofthe spot rate over the strike rate, that is, S T ($/¤) X($/¤).The second row of Table 4A.1 shows the payoffs from selling a put on the euro and being paid P. This has zerovalue if the realized spot rate is above the strike rate, and causes the writer a loss of the difference between the spotand strike rate, S T ($/¤) X($/d), if the spot rate1 is below the strike rate. The combination of the call purchaseand put sale are shown in the third line of the table. We see that for a net outlay of (P C) the option combinationprovides the difference between the spot rate and the forward rate, whether this is positive or negative.The bottom part of Table 4A.1 considers the payoffs from what we later call a ‘‘synthetic’’ forward contract. 31As we shall show, a forward purchase of the euro for dollars is equivalent to borrowing dollars, buying euros spot29 We ignore any transactions costs.30 Profiles for forward contracts are shown in Chapter 3.31 This is covered in Chapter 12.91 &
THE MARKETS FOR FOREIGN EXCHANGE& Table 4A.1 European option put-call forward parityPosition taken$ cash flow/¤period 0$ cash flow/¤,S T ($/¤) X($/¤)Period TS T ($/¤) > X($/¤)Option positionBuy call C 0 S T ($/¤) X($/¤)Sell put þ P S T ($/¤) X($/¤) 0Combination P C S T ($/¤) X($/¤) S T ($/¤) X($/¤)‘‘Forward’’ positionBorrow dollar þX($/¤)/(1 þ r $ ) T X($/¤) X($/¤)Invest euro S 0 ($/¤)/(1 þ r ¤ ) T þ S T ($/¤) þ S T ($/¤)Combination X($/¤)/(1 þ r $ ) T S 0 ($/¤)/(1 þ r ¤ ) T S T ($/¤) X($/¤) S T ($/¤) X($/¤)with the borrowed dollars, and the investing the euros. If the borrowing and investing is for the same maturity as theforward contract, the payments and receipts on the borrowing-investment combination results in the same paymentsand receipts as with the forward exchange contract. Specifically, from the forward purchase of euros, euros arereceived at maturity and dollars are paid. The same occurs from borrowing dollars, buying euros with the dollarsand investing the euros: euros are received at maturity and dollars are paid. 32Table 4A.1 shows a ‘‘synthetic’’ forward contract to buy a euro at exchange rate X($/¤). This is the numberof dollars paid per euro received at maturity and is shown in the second column. There is a minus sign in front ofX($/¤) because the cash flow in T years is a dollar payment for the euro. The realized value of each euro at maturity isS T ($/¤). This is the amount received and is hence positive. The amount of dollars paid for the euro and the realizedvalue of the euro do not depend on whether X($/¤) is larger or smaller than S T ($/¤), as shown in the table.In order to owe X($/¤) dollars T years in the future means borrowing X($/¤)/(1 þ r $ ) T dollars today: if youborrow this amount today you will owe X($/¤) inT years time. 33 The borrowed dollars are a cash inflow.In order to receive S T ($/¤) dollars from investing in euros for T years it is necessary to invest today,S 0 ($/¤)/(1 þ r ¤ ) T . 34 Since this is invested, it is a cash outflow which is shown by the minus sign in Table 4A.1.The bottom half of the table shows the effect of the combination of borrowing dollars and investing in euros. We seethat the cash flows in period zero and period T are the same as with the option position, buying the call and sellingthe put. Therefore, the option combination, buying a call and selling a put is equivalent to buying euros forward forthe same maturity date.The option combination has a net cost of (P C), as shown in the first column. The forward purchase of euroshas a net cost of [X($/¤)/(1 þ r $ ) T ] [S 0 ($/¤)/(1 þ r ¤ ) T ]. These are equivalent as shown by comparing the optionposition and forward contract payoffs. Arbitrage therefore ensures:PC ¼ Xð$/¤Þð1 þ r $ Þ TS 0 ð$/¤Þð1 þ r ¤ Þ T32 We ignore costs of transacting.33 If we allow for borrowing-investment spreads, then r $ is the borrowing rate, not the investment rate.34 If we allow for interest rate spreads, r d is the investment rate. S 0 ($/¤) is the current spot rate.& 92
CURRENCY FUTURES AND OPTIONS MARKETSAlternatively:C ¼ P þ S 0ð$/¤Þð1 þ r ¤ Þ TXð$/¤Þð1 þ r $ Þ Tð4A:1ÞThe expression in (4A.1) is the put-call forward parity relationship. This can be used to describe the factorsinfluencing option premiums.We see from put-call forward parity relationship in equation (4A.1) that for a given value of P, the call onthe euro is worth more the greater the extent that the euro is in the money, that is, the greater is S 0 ($/¤) relative toX($/¤). Also, the call premium is higher the larger is r $ relative to r ¤ . The intuition for the prediction about interestrates is that the higher are dollar versus euro interest rates, the more the market believes the euro will be increasingin value. Indeed, the higher dollar interest rates are the way the market is compensating for the expected decline inthe dollar versus the euro. 35 The impact of time to maturity, T, is seen to be ambiguous.The put-call forward parity relationship can also be used to explain the factors influencing the premiums oncurrency put options. To do this, we can rewrite equation (4A.1) as:P ¼ C þ Xð$/¤Þð1 þ r $ Þ TS 0 ð$/¤Þð1 þ r ¤ Þ Tð4A:2ÞFrom equation (4A.2) we can see that for a given value of the call premium, C, the put is worth more, the greater isthe strike price relative to the spot price of the euro, that is, the greater the put is in the money. The put premiumalso depends on the two interest rates. In this case, the lower the euro interest rate, r ¤ , relative to the dollar interestrate, r $ , the less the put option is worth. The intuition here is that a low euro interest rate versus the dollar ratereflects a market expectation that the euro will appreciate. This lowers the value of an option to sell the euro: it isless likely to be exercised. As with the call option, the effect of time to maturity is ambiguous.35 This is explained more fully in Chapter 8 which explains the interest rate parity theory.93 &
Part IIThe determination of exchange ratesAn exchange rate can be thought of as the price of onecountry’s money in terms of another country’s money.With exchange rates being a price, it should come aslittle surprise that they are the result of supply anddemand. As with traditional supply and demand, we canconstruct curves which describe how quantities suppliedor demanded depend on the price, in this case the priceof the currency. We can then determine the equilibriumprice, or exchange rate. After the equilibrium isexplained we can identify how different factors such asinflation, interest rates, economic growth, foreign debt,political uncertainty, and so on can cause exchangerates to change.In this chapter we consider the system of flexibleexchange rates, which is the predominant exchangerate system in operation today. We also limit ourselvesto consideration of ‘‘flow’’ supplies of and demandsfor currencies – the amount demanded or suppliedper period of time – rather than stocks of currencies,which are the amounts that exist at a given point intime. Later in the book, in Chapters 21, 22, and 23,we deal with fixed exchange rates, and with exchangerate theories involving stocks rather than flows ofcurrencies. These later chapters can be inserted afterChapter 6 in courses that focus on internationalfinancial markets and the international financialenvironment. The two chapters that we do include inPart II contain the essential material on why exchangerates change that is needed in courses that focus oninternational financial management.Chapter 5 begins by describing why the balance-ofpaymentsaccount can be considered as a listing of thereasons for a currency being supplied and demanded.The chapter explains that all positive or credit itemslisted in the account give rise to a demand for thecountry’s currency, and all negative or debit items giverise to a supply of the currency. After explaining thebasic principles of balance-of-payments accounting,each major entry in the account is examined to providean understanding of what factors can make it increaseor decrease, and thereby change the equilibriumexchange rate. The purpose of the chapter is to providean understanding of the forces behind movements incurrency values which is an essential input into themeasurement and management of foreign exchangerisk later in the book.Chapter 5 includes a brief account of the differentinterpretations of the balance of payments with fixedand flexible exchange rates. It is shown that withflexible exchange rates, the balance of payments isachieved without any official buying or selling ofcurrencies by governments, whereas with fixedexchange rates there are changes in official foreignexchange reserves. The chapter also shows how tointerpret imbalances in the current- and capitalaccountcomponents of the balance of payments. Thisis illustrated by comparing a country’s balance-ofpaymentsaccount to the income statement of a firm.The chapter concludes with a discussion of a country’snet indebtedness, and a brief account of recentdevelopments in the balance of payments and indebtednessof the United States.Chapter 6 builds the supply-and-demand pictureof exchange rates that is suggested by the balance-ofpaymentsaccount. This involves deriving the supplycurve for a country’s currency from that country’sdemand curve for imports, and the demand curve for acountry’s currency from that country’s supply curve of
exports. Using the knowledge about balance-of-paymententries developed in Chapter 5, it is shown howinflation and other factors can shift the currency supplyand demand curves, and therefore result in a changein exchange rates. It is also shown, however, that acurrency supply curve can slope downward ratherthan upward as might normally be expected, and thatif this happens, exchange rates may be unstable.The chapter explains that the conditions resultingin an unstable foreign exchange market are thesame conditions that result in the so-called ‘‘J curve.’’(A J curve occurs, for example, when a depreciationmakes a country’s balance of trade worse, rather thanbetter as would normally be expected.)
Chapter 5The balance of paymentsMoney is just something to make bookkeeping convenient.H.L. HuntINFLUENCES ON CURRENCY SUPPLYAND DEMANDThe price of a country’s currency depends on thequantity supplied relative to the quantity demanded,at least when exchange rates are determined ina free, unregulated market. 1 It follows that if weknow the factors influencing the supply of anddemand for a currency, we also know what factorsinfluence exchange rates. Any factor increasing thedemand for the currency will, ceteris paribus,increase the foreign exchange value of the currency,that is, cause the currency to appreciate. Similarly,any factor increasing the supply of thecurrency will, ceteris paribus, reduce its foreignexchange value, that is, cause the currency todepreciate. 2 Clearly then, there is considerableinterest in maintaining a record of the factorsaffecting the supply of and demand for a country’scurrency. That record is maintained in the1 When exchange rates are fixed, they are still determined bysupply and demand, but there is an official supply ordemand that is adjusted to keep rates from changing. Fixedexchange rates are discussed briefly later in this chapter,and in greater detail in Chapter 22.2 When an exchange rate is fixed at a lower value, the currencyis said to have been devalued. When an exchange rate isfixed at a higher value, the currency is said to have beenrevalued. These terms replace ‘‘depreciate’’ and‘‘appreciate,’’ which are the terms used with flexible rates.balance-of-payments account. Indeed, we can thinkof the balance-of-payments account as an itemizationof the reasons for demand for and supply ofa currency.The motivation for publishing the balance-ofpaymentsaccount is not simply a desire to maintaina record of the reasons for a currency being suppliedor demanded. Rather, the account is primarily toreport the country’s international performance intrading with other nations, and to maintain a recordof capital flowing into and out of the country.However, reporting on a country’s internationaltrading performance and capital flows involvesmeasurement of all the reasons why a currency issupplied and demanded. This is what makes thebalance-of-payments account such a handy way ofthinking about exchange rates. This chapter showswhy the balance-of-payments account can bethought of as a list of items behind the supply of anddemand for a currency. We begin by examining theprinciples guiding the structure of the balance-ofpaymentsaccount and the interpretation of theitems that are included. We then consider the differentways that balance can be achieved betweenquantities supplied and quantities demanded. As weshall see, the balance-of-payments account isdesigned to always balance, but the price at whichbalance is achieved depends on the magnitudes ofitems in the account.97 &
THE DETERMINATION OF EXCHANGE RATESPRINCIPLES OF BALANCE-OF-PAYMENTSACCOUNTINGThe guiding principles of balance-of-paymentsaccounting come from the purpose of the account,namely to record the flow of payments between theresidents of a country and the rest of the worldduring a given time period. The fact that the balanceof payments records the flow of payments makes theaccount dimensionally the same as the nationalincomeaccount – so many dollars per year or percalendar quarter. Indeed, the part of the balance-ofpaymentsaccount that records the values of exportsand imports also appears in the national-incomeaccount.Balance-of-payments accounting uses the system ofdouble-entry bookkeeping, which means thatevery debit or credit in the account is also representedas a credit or debit somewhere else. To see how thisworks we can take a couple of examples.Suppose that an American corporation sells $2million worth of US-manufactured jeans to Britain,and that the British buyer pays from a US dollaraccount that is kept in a US bank. We will then havethe following double entry in the US balance ofpayments:Export (of jeans)Foreign assets inthe US: US bankliabilities(credits þ; debits )Millions dollarsþ22We can think of the export of the American jeansas resulting in a demand for US dollars, and thepayments with dollars at the US bank as resulting ina supply of dollars. The payment reduces the liabilityof the US bank, which is an asset of the Britishjeans buyer. We see that the balance-of-paymentsaccount shows both the flow of jeans and the flow ofpayments, and the entries sum to zero.As a second example, suppose that an Americancorporation purchases $5 million worth of denimcloth from a British manufacturer, and that theBritish company puts the $5 million it receives intoa bank account in the United States. We then havethe double entry in the US account:(credits þ; debits )Millions dollarsImports (of cloth) 5Foreign assets inþ5the US: US bankliabilitiesWe can think of the US import of cloth asresulting in a supply of US dollars, and the depositof money by the British company as resulting in ademand for dollars. The deposit of money increasesUS bank liabilities and the assets of the Britishcompany. In a similar way, every entry in thebalance of payments appears twice.The balance-of-payments account records alltransactions that affect the supply of or demand for acurrency in the foreign exchange markets. There isjust as much demand for US dollars when non-Americans buy US jeans as there is when they buyUS stocks, bonds, real estate, bank balances, oroperating businesses, and all of these transactionsmust be recorded. Since all sources of potentialdemand for dollars by foreigners or supply of dollarsto foreigners are included, there are many types ofbalance-of-payments account entries. We need arule for determining which entries are credits andwhich entries are debits. The rule is that anyinternational transaction that gives rise to a demandfor US dollars in the foreign exchange market isrecorded as a credit in the US balance of payments,and the entry takes a positive sign. Any transactionthat gives rise to a supply of dollars is recorded as adebit, and the entry takes a negative sign. A moreprecise way of expressing this rule is with thefollowing definition:Credit transactions represent demands for USdollars, and result from purchases by foreigners& 98
THE BALANCE OF PAYMENTSof goods, services, goodwill, financial and realassets, gold, or foreign exchange from US residents.Credits are recorded with a plus sign.Debit transactions represent supplies of USdollars, and result from purchases by US residentsof goods, services, goodwill, financial, andreal assets, gold, or foreign exchange from foreigners.Debits are recorded with a minus sign. 3The full meaning of our definition will becomeclear as we study the US balance of payments inTable 5.1. Let us consider each item and the factorsthat influence them.BALANCE-OF-PAYMENTS ENTRIES ANDTHE FACTORS THAT INFLUENCE THEMExports of goods, services, andincome receiptsIn order for overseas buyers to pay for US goods andservices which are invoiced in dollars, the overseasbuyers must purchase dollars. In the rarer event thatUS exports of goods and services are invoiced inforeign currency, it is the American exporter thatwill purchase dollars when selling the foreign currencyit receives. In either case US exports give riseto a demand for US dollars in the foreign exchangemarket, and are recorded with a plus sign. (If theforeign buyer of a US good or service pays withforeign currency which the US exporter chooses tohold rather than sell for US dollars, the balance-ofpaymentsaccount records the value of the export,and an increase in US assets abroad. In this case theUS export is considered, as always, to give rise toa demand for US dollars, and the increase in USassets abroad is considered to give rise to an equalincrease in the supply of US dollars.)3 The item with the least obvious meaning in this definition is‘‘goodwill.’’ As we shall explain later, goodwill consists ofgifts and foreign aid. In keeping with the double-entrybookkeeping system, the balance-of-payments accountassumes gifts and aid buy goodwill for the donor.US exports of goods, which are sometimesreferred to as merchandise exports, includewheat and other agricultural commodities, aircraft,computers, automobiles, and so on. The factorsaffecting these exports, and hence the demand forUS dollars, include:1 The foreign exchange value of the US dollar Fora particular level of domestic and foreign pricesof internationally traded goods, the higherthe foreign exchange value of the dollar, thehigher are US export prices facing foreigners,and the lower is the quantity of US exports.Normally, we single out the exchange rate asthe principal factor of interest and put this onthe vertical axis of a supply and demand figure.Then, all other factors listed below shiftthe currency demand curve. Changes in theexchange rate cause movements along thedemand curve.2 US prices versus the prices of foreign competitors Ifinflation in the United States exceeds inflationelsewhere then, ceteris paribus, US goodsbecome less competitive, and the quantity ofUS exports will decline. US inflation thereforetends to reduce the demand for US dollars ateach given exchange rate. 4 This is a leftwardshift in the demand curve for dollars.3 Worldwide prices of products that the US exportsChanges in the worldwide prices of what theUS exports shift the demand curve for dollars.Higher world prices shift the demand curve tothe right, and vice versa. This is a differenteffect to that in point 2 mentioned earlier.Here, we refer to terms of trade effects; anincrease in US export prices versus US importprices – where imports are different goods thanexports – is an improvement in the US terms4 The value of exports could increase if the reduced quantityof exports comes as a result of higher prices. As we shallshow in chapter 6, values increase from higher prices whendemand is inelastic so that the quantity of exports falls lessthan export prices increase. However, profit maximizingexporters do not choose an inelastic part of the demandcurve.99 &
THE DETERMINATION OF EXCHANGE RATES& Table 5.1 Summary format of the US balance of payments, 3rd quarter, 2002Line# (credits, þ; debits, ) Billions of US dollars1 Exports of goods, services, and income receipts þ3132 Goods þ1763 Services, including travel, royalties, andþ74license fees4 Income receipts on US assets abroad þ635 Imports of goods, services, and income payments 4276 Goods 2997 Services, including travel, royalties, and61license fees8 Income payments on foreign assets in United Status 679 Unilateral transfers, net, increase/financial13outflow ( )10 US-owned assets abroad, net þ2411 US official reserve assets, incl. gold reserves1at IMF, net12 US Govt. assets other than official reserves, net 013 US private assets, net þ2514 Direct investment 2715 Foreign securities þ1816 US claims on foreigners reported by non-banks 1217 US claims reported by US banks þ4618 Foreign owned assets in the US net, increase/financialþ149inflow (þ)19 Foreign official assets in US þ920 Other foreign assets in US þ13921 Direct investment þ1122 US Treasury securities þ5523 US securities other than Treasury securities þ4724 US currency þ225 US liabilities reported by non-banks þ1626 US liabilities reported by US banks þ827 Statistical discrepancy (sum of above, sign reversed) 46Memoranda:28 Balance on goods (lines 2þ6) 12329 Balance on services (lines 3þ7) þ1230 Balance on goods and services (lines 28þ29) 11131 Balance on investment income (lines 4þ8) 332 Unilateral current transfers (net) (line 9) 1333 Balance on current account (lines 1þ5þ9, orlines 30, 31, and 32)127Source: US Department of Commerce, Survey of Current Business, December 2002.& 100
THE BALANCE OF PAYMENTSof trade. On the other hand, in point 2 werefer to prices of US goods versus competitors’goods abroad, that is, prices of the same goodssupplied by Americans or by foreigners.4 Foreign incomes When foreign buyers experiencean increase in their real incomes, theresult is an improvement in the export marketfor American raw materials and manufacturedgoods. Ceteris paribus, this increases US exports,and therefore also increases the demandfor dollars.5 Foreign import duties and quotas Higher foreignimport tariffs – taxes on imported goods – andlower foreign import quotas – the quantity ofimports permitted into a country during aperiod of time – as well as higher foreignnontariff trade barriers such as qualityrequirements and red tape, reduce US exports.Alongside exports of goods are exports of services.These service exports are sometimes calledinvisibles. US service exports include spending byforeign tourists in the United States. Serviceexports also include overseas earnings of US banksand insurance companies, engineering, consulting,and accounting firms; overseas earnings of USholders of patents; overseas earnings of royalties onbooks, music, and movies; overseas earnings of USairlines and shipping, courier, and freight services;and similar items. These service exports give rise toa demand for US dollars when the foreign touristsbuy US currency, when the US banks repatriatetheir earnings, and so on. US earnings on these‘‘performed service’’ exports respond to the samefactors as affect exports of goods – exchange rates,US prices versus foreign competitors’ prices, worldwideprices of US exports, incomes abroad, foreignimport tariffs and quotas, and so on.The final category covered by ‘‘exports of goods,services, and income receipts,’’ namely ‘‘incomereceipts,’’ is the earnings US residents receive frompast investments made abroad. These earnings cancome in the form of interest on bills and bonds,dividends on stocks, rent on property, and profits ofbusinesses. Sometimes these various sources ofinvestment income are, for convenience, simplyreferred to as debt-service exports. Theseexport earnings are derived from past foreigninvestments and therefore depend principally on theamount Americans have invested abroad in the past.Debt-service exports also depend on the rates ofinterest and sizes of dividends, rents, and profitsearned on these past foreign investments. Unlikethe situation with goods and services exports, theexchange rate plays only a minor role in the incomereceived from abroad. Exchange rate changes affectonly the translated value of foreign currencydenominated income.Imports of goods, services, and incomepaymentsUS imports of goods include such items as oil,automobiles, consumer electronics, computers,clothing, wine, coffee, and so on. US importsrespond to the same factors that affect exports, thedirection of response being reversed. Ceteris paribus,the quantity of US imports of goods increases whenthe US dollar is worth more in the foreign exchangemarkets: a more valuable dollar makes importscheaper. US imports are also higher when US pricesare higher relative to competitors’ prices of thesame goods, when world prices of US importsincrease, when US tariffs are reduced, and when USimport quotas are increased. 5 US imports of performedservices (such as American tourists’spending abroad, Americans’ use of the servicesof foreign banks and consulting firms, Americans’use of foreign patents, airlines, and shipping, andpurchases of foreign movies and books) also dependon exchange rates, relative prices, US incomes,and US import restrictions. In the case of incomepayments, which are payments by Americans of5 As with the effects of exchange rates and inflation onexports, we should really distinguish between the quantityand value of imports. For example, an appreciation of theUS dollar could reduce the value of US imports even if itincreases the quantity of US imports. This occurs if thedemand for imports is inelastic. We discuss this possibilityin Chapter 6.101 &
THE DETERMINATION OF EXCHANGE RATESinterest, dividends, profit and rent abroad, theprincipal relevant factor is past foreign investmentin the United States; US income payments arehigher the higher have been foreign investments inUS government bonds, corporate bonds, stocks,and past foreign investments in US real estate andoperating businesses. Income imports also dependon the rates of return foreigners earn on theirinvestments in the United States.Until 1986, the United States earned more on itsinvestments abroad than foreigners earned on USinvestments. That is, US investment income fromabroad – income receipts – exceeded US investmentincome paid abroad – income payments. Thiswas because until 1986, the value of US investmentsabroad exceeded the value of foreign investments inthe United States. Because of considerable borrowingby the US government from overseas lenders,and because of considerable foreign privateinvestment in the United States, in 1986 thecountry went from being a net creditor nation to anet debtor nation. Indeed, in a matter of only a fewyears after 1986, the United States became thelargest debtor nation. This has meant that the UShas become a net payer of investment incomeabroad.Table 5.1 shows that the United States ran a largegoods deficit in the third quarter of 2002. USexports of goods amounted to $176 billion duringthe quarter, while US goods imports amounted to$299 billion. This is a balance-of-trade deficitduring the quarter of $123 billion. This is shown online 28 of Table 5.1.On the service side, US exports of performedservices were $13 billion ($74 billion $61 billion)larger than US imports. However, there is a $4billion ($67 billion $63 billion) deficit on income.This is a result of US indebtedness. 6 Services,including debt service, therefore had a $9 billionsurplus, offsetting a little the balance-of-tradedeficit.6 Indebtedness is difficult to measure accurately becauseUS overseas investments are generally older than foreigninvestments in the US, and may therefore be undervalued.& 102Unilateral transfers (net)Unilateral transfers include such items as foreignaid, nonmilitary economic development grants, andprivate gifts or donations. These items are calledunilateral transfers because, unlike the case of otheritems in the balance of payments, where the itembeing traded goes in one direction and the paymentgoes in the other direction, in the case of gifts andaid there is a flow in only one direction, thedirection of payment. However, unilateral transfersmust be included somewhere in the account becausethe receipt of a gift or of foreign aid gives rise to ademand for the country’s currency in the same wayas the export of goods and services. 7 Similarly, giftsor aid to foreigners give rise to a supply of thecountry’s currency in the same way as the import ofgoods and services. What the balance-of-paymentsaccountant therefore does is include unilateraltransfers as if the donor were buying goodwill fromthe beneficiary. That is, the granting of aid is consideredas a purchase or import of goodwill, a debitentry under unilateral transfers, and the receipt ofaid is considered a sale or export of goodwill, acredit entry. By including transfers as a trade ingoodwill, we preserve double-entry bookkeeping,since the payment for or receipt from the transfer,which will appear elsewhere in the account, ismatched by the transfer entry itself.The value of unilateral transfers depends both on acountry’s own generosity and on the generosity of itsfriends. It also depends on the number of expatriateswho send money to relatives or receive money fromrelatives. Poorer countries, from which large numbersleave for job opportunities elsewhere, receivenet earnings on unilateral transfers. India andPakistan, for example, receive net inflows on transfers.Richer countries – such as the United States,Canada, Britain, and Australia – which have foreign7 If the gift or aid must be spent in the donor country, so thatthe money never leaves the country, the gift or aid appearselsewhere in the account. In this case it is as if the donorcountry had an export that automatically matched thetransfer.
THE BALANCE OF PAYMENTSaid programs and many recent immigrants, generallyhave net outflows on transfers.When we compute the subtotal up to andincluding unilateral transfers we obtain the balanceof payments on current account. Thatis, the balance of payments on current accountconsists of exports and imports of goods, services,and income, plus net unilateral transfers: lines 1, 5,and 9 in Table 5.1. The current account is in deficitby $127 billion, as shown on line 33. The balance ofpayments on current account shows how much thecountry will have to borrow or divest – sell off itspast investments – to finance the current-accountdeficit, or how much the country must lend orinvest if it has a current account surplus. Borrowingor divesting is necessary if a country has a deficit inits current account, because it is necessary to pay forthe extent to which its imports exceed its exports orto which it gives away more than it earns or receivesfrom abroad. Similarly, lending or investing mustoccur if the country has a current-account surplus,since what the country earns and does not spend orgive away is not destroyed, but is loaned or investedin other countries. In summary:The current account of the balance of paymentsis the result of the export and import of goods,services, income and goodwill (or unilateraltransfers). A deficit in the current account mustbe financed by borrowing from abroad or bydivestment of foreign assets, while a surplusmust be loaned abroad or invested in foreignassets.A country can finance a current-account deficit byselling to foreigners the country’s bills, bonds,stocks, real estate, or operating businesses. Acountry can also finance its current account deficitby selling off its previous investments in foreignbills, bonds, stocks, real estate, and operatingbusinesses, that is, via divestment. Before weexamine how the US financed its $127 billion current-accountdeficit in Table 5.1, we should recallthat there is nothing to distinguish the demand for acountry’s currency when foreigners buy its financialand real assets from when foreigners buy its goodsand services; a check or draft for the country’scurrency must be purchased whatever is beingbought. Similarly, a country’s currency is suppliedin the same way whether residents of a country arebuying foreign financial or real assets or areimporting goods and services. Of course, differentfactors influence the purchase and sale of financialand real assets than influence the purchase and saleof goods and services. As we shall see, there aredifferent long-run implications of trade in assetsthan of trade in goods and services; today’s trade instocks, bonds, real estate, and businesses affectsfuture flows of dividends, interest, rents, and profits.US-owned assets abroad (net)There are several components to this item whichcan be considered separately. We see from Table5.1, line 10, that collectively, the items under thisheading satisfied $24 billion of the US borrowingrequirement: the US reduced by $24 billion itsforeign assets, meaning a divestment and associatednet additional demand for $24 billion US dollars.The first subcomponent of US assets abroad is USofficial reserve assets. Official reserves are liquidassets held by the US Federal Reserve and theDepartment of the Treasury; the Federal ReserveBank of New York buys and sells foreign exchangeon behalf of the Federal Reserve System and the USTreasury. These liquid assets include gold, foreigncurrency in foreign banks, and balances at the <strong>International</strong>Monetary Fund (IMF). 8 Weseeinline11ofTable5.1thatthereisanentryof$1billionforchanges in official reserves. The negative sign means asupply of US dollars because the US Federal Reserveor Treasury bought gold, foreign currency, or balancesheld at the IMF. Whatever is bought, the USis accumulating foreign assets and is supplyingUS dollars: recall that US dollar supply is a debit andhence negative item in the account. The Federal8 The IMF is an organization in which many countries holdfunds for financing balance-of-payments deficits. Wediscuss this institution in Chapter 22.103 &
THE DETERMINATION OF EXCHANGE RATESReserve sells dollars when it is trying to prevent anappreciation of the dollar vis-à-vis other currencies:adding to the supply of dollars tends to push the priceof the dollar down. On the other hand, the USgovernment buys dollars – reducing foreign assets –when it wishes to prop up the dollar in the foreignexchange market. The main influence on the size ofthe officialreserveentryistheextenttowhichtheUSGovernment wishes to influence exchange rates. Theharder the Government is trying to support thedollar, the larger is the positive entry.The next item under the heading US assets abroad(net) is ‘‘U.S. government assets other than officialreserves,’’ line 12 of Table 5.1. This item shows newloans and loan repayments involving the US Government.When the US Government makes a foreignloan or repays a loan, this item shows a negativeentry because there is a supply of dollars. When theUS Government borrows from foreign governments,there is a positive entry and a demand fordollars. In the third quarter of 2003, the net demandfor dollars under this heading is approximatelyzero, indicating the US Government made no newnet loans during this period. As with the US officialreserve assets entry, a major factor influencing thesize of this item is US Government efforts toinfluence the foreign exchange value of the US dollar.After the two entries reflecting US Governmentactivity are four items which together constitute‘‘U.S. private assets abroad.’’ These entries showthe extent to which US private firms and individualshave made investments in foreign companies, bills,bonds, stocks, real estate, and so on, or havedivested themselves of such investments by sellingassets purchased in the past.The first subcategory of US private assets isdirect investment. Bydefinition, direct investmentby Americans occurs when US ownership ofa foreign operating business is sufficiently extensiveto give Americans a measure of control. Governmentstatisticians have chosen the level of 10 percentor more ownership of a company’s voting shares toconstitute control. New flows of investment duringthe measurement period, where 10 or morepercent ownership has been reached, are considered& 104direct investment (or divestment when funds arebrought home). A typical example of directinvestment would be the building of a factory in aforeign country by a US multinational corporation.Line 14 of Table 5.1 shows a supply of $27 billion ofUS currency to the foreign exchange market due toUS direct investment during the period. This supplyof US dollars adds to the supply of dollars from thedeficit in the current account and the dollar sales ofthe US Government. This means that further downthe balance-of-payments account there must beentries showing the US borrowing and/or divestmentthat is financing the current-account deficit,the US Government sales of dollars, and the USdirect investment abroad.Direct investment depends on the after-tax,expected return from investing in plant andequipment, real estate, and so on in foreign countriesrelative to the opportunity cost of shareholdercapital. The expected return must be sufficient tocompensate for the unavoidable risk of the directinvestment. 9 Expected after-tax returns abroad maybe high if foreign real wage rates are low, if rawmaterials are cheap, if corporate taxes are low,if borrowing rates are low – perhaps becauseof subsidized loans – and so on. The risks offoreign direct investment include both businessand political risks.The next private investment item is titled‘‘foreign securities.’’ This shows the supply of ordemand for US dollars from the purchase or sale byUS residents of foreign stocks and bonds. 10 WhenUS residents add to their holdings of these assets,there is a supply of dollars and a negative entry inthe balance-of-payments account: it is a capitaloutflow from the United States. When US residents9 Because the opportunity cost of capital includes the chanceof investing at home rather than abroad, direct investmentcan also be considered to depend on expected returnsabroad versus expected returns at home. The details offactors affecting direct investment are described inChapters 16 and 17.10 Of course, when a US resident holds 10 percent or more ofthe voting stock of a foreign company, the flow of USdollars for the foreign stock appears as a direct investment.
THE BALANCE OF PAYMENTSsell these assets and repatriate the proceeds, thereis a demand for dollars and a positive entry. Line 15shows that during the third quarter of 2003 USresidents divested themselves, that is, sold, $18billion of foreign stocks and bonds. This is a demandof dollars, partially offsetting the supply of dollarsfrom direct investment, US Government dollarsales, and the deficit in the current account.The amount of foreign security investmentdepends on the difference in expected returnsbetween foreign stocks and bonds and domesticstocks and bonds, and on relative risks of investmentsat home versus abroad. The expected returnon a foreign security depends on the expecteddividend on the stock or interest on the bill or bond,the expected change in the security’s local currencymarket value, and the expected change in theexchange rate. Because funds flow between countriesuntil the risk-adjusted expected returns indifferent locations are equal, the advantage thatexists for investing in a particular location will bemore obvious from statistics in the balance-ofpaymentsaccount on the amounts flowing, thanfrom statistics on yields. 11 In addition to the differencebetween expected returns abroad andexpected returns at home, US residents’ purchasesof foreign securities depend on diversificationbenefits from foreign investment. We shall discussthese benefits in Chapter 15.The next two items, shown in lines 16 and 17,give the supply of and demand for US dollars due toinvestments by businesses and banks. Line 16 giveslending by non-bank firms, including creditsextended by US firms in commercial transactions,where the receivables on the credits are assets of USfirms. A negative entry means an increase in outstandingloans and credits during the reportingperiod, and a consequent supply of dollars. Apositive entry means a reduction in outstandingloans and credits, and a demand for dollars from11 This point is made, for example, by Fischer Black in ‘‘TheIns and Outs of Foreign Investment,’’ Financial AnalystsJournal, May–June 1978, pp. 1–7.repayment. US firms extended $12 billion of creditsand loans during the reporting period.Line 17 shows the change in the amount loanedto foreign borrowers by US banks. The large positiveentry for this item tells us that US banksreduced their lending abroad during the reportingperiod. This can occur because US banks’ dollarclaims on their own offices abroad decline, andbecause of loan repayments by foreign borrowers.A reduction of US bank claims on their own officesabroad occurs when the banks find it more profitableto make dollar loans in the US than to makedollar loans in the Eurodollar market. 12 Themain reason why banks find it more profitable tolend in the US than abroad is higher interest rates inthe US than in the Eurodollar market. Even a smallinterest-rate advantage can move a vast amount ofmoney between nations. The speed with which themoney can move is so rapid that funds movedbetween banks and bank offices has been called hotmoney. This money needs only an internal bankreallocation, or an order sent via the SWIFT networkif the money is moving between unrelatedbanks. The effect on exchange rates can be as fast asthe money itself can move, which in turn is as fast asa satellite signal. For this reason, changes in interestrates can cause very large, sudden changes inexchange rates.Foreign owned assets in theUnited States (net)The next set of items in the balance of payments,those on lines 18 to 26, are comparable to thosedescribed earlier and shown in lines 10 to 17, butgive the supply of and demand for US dollars due toborrowing, lending, investment, and divestment byforeigners rather than US residents. The entry‘‘foreign official assets in U.S.’’ on line 19 gives the12 Eurodollars are US-dollar-denominated bank depositsin banks located outside the United States. The USdollarloans that appear in line 17 are made out ofEurodollar deposits. The reasons for the emergence ofthe Eurodollar market are given in Chapter 22.105 &
THE DETERMINATION OF EXCHANGE RATESincrease or decrease in US dollar assets held byforeign governments in the Unites States. Thepositive entry shows that there was a demand for USdollars due to dollar buying by foreign governments.This occurs when there are efforts by foreigngovernments to support the US dollar or depreciatetheir own currency. The principal factor determiningthe size of this item is the extent to whichforeign governments are trying to influenceexchange rates.When exchange rates are fixed, central banksbuy/sell whatever amount of dollars is necessary toprevent the dollar from falling/rising. Whenexchange rates are flexible, or floating, governmentsdo not buy or sell foreign currencies, insteadleaving exchange rates to be determined by themarket forces of supply and demand. What then dowe make of the positive entry on line 19? Theanswer is that exchange rates were not completelyflexible in 2003. Rather, there was an effort tosupport the US dollar even though officiallyexchange rates were flexible, a so-called dirtyfloat. If exchange rates had been truly flexible,there would have been no buying or selling of USdollars by foreign governments, and line 19 wouldhave been zero.Line 21 shows the amount of direct investmentmade by foreigners in the United States. As with USdirect investment abroad, this is determined by theafter-tax expected rate of return on the directinvestment relative to the shareholders’ opportunitycost of capital, and the amount of unavoidablerisk on the investment. The expected rate of returnis a function of market opportunities in the UnitedStates, including the possibility of facing quotas andother forms of protectionism if the direct investmentis not made. We find a demand for US dollarsfrom direct investment by foreigners in the UnitedStates during the reporting period. This helpsfinance the current account deficit, but means profitrepatriation within the income payments componentof future US current accounts.Line 22 shows substantial purchases of USTreasury securities by overseas investors; the entryis positive when foreigners increase their holdings of& 106US Treasury securities, and negative when theyreduce them. Similarly, in line 23 we see a substantialincrease in foreign holdings of US stocks andbonds during the reporting period, augmenting thedemand for dollars by foreign governments and fordirect investment. The principal factors influencingforeign investment in US Treasury securities, aswell as stocks, bonds, and other securities, are USversus foreign yields, and expected future changesin exchange rates. Ceteris paribus, the higher are USversus foreign yields, and the more the dollar isexpected to increase in value, the greater is thedemand for US securities and dollars. Expectedchanges in exchange rates tend to be reflected inforward exchange premiums or discounts. Therefore,we can also think of the demand for USsecurities in lines 22 and 23 as depending on yieldadvantages, plus the forward premium or discounton the US dollar. At times, the need to issueTreasury bills and bonds to finance the US fiscaldeficit helps to fuel the demand for dollars: paradoxically,large US fiscal deficits contribute to astrong US dollar by increased dollar demand byforeigners. Line 24 shows foreign demand for UScurrency, specifically Federal Reserve notes peoplecarry in their wallets. The wide acceptability ofdollars around the world contributes to this.Line 25 shows the non-bank trade credits(deferred payment when buying goods) granted byforeign firms to US firms. These are liabilities of thefirms granted the credits. As well as the $16 billionof US dollar demand for this reason, line 26 showsa further $8 billion demand for dollars due toUS bank liabilities. US bank liabilities consist ofdeposits by foreigners in US banks. This could haveoccurred because of an expected appreciation of theUS dollar, or because foreign investors preferred toshift their dollars into US bank accounts from USsecurities. However, this does not seem likely inlight of the positive entry in line 23.Statistical discrepancyUntil 1976 the statistical discrepancy was called‘‘errors and omissions,’’ which gives a better idea of
THE BALANCE OF PAYMENTSEXHIBIT 5.1 EXTRATERRESTRIAL TRADE OR THE ETHER?DATA DIFFICULTIES IN THE BALANCE OF PAYMENTSWhile we remain Earthbound, the balances of paymentsof all the countries in the world should themselvesbalance. That is, surpluses in some countriesshould exactly match deficits in others, with the sumof positive and negative balances being zero. So muchfor the theory. As the following excerpt from theReview of the Federal Reserve Bank of St. Louisexplains, in practice, balance-of-payments accountingdoes not quite fit the theory. It turns out that theunderreporting of service exports is probably theprincipal culprit.In late 1987, the U.S. Commerce Departmentannounced that in its monthly trade reports,exports to Canada would henceforth use Canadiancustoms data on imports from the United Statesrather than U.S. export data. The rationale for thisprocedure is the documented inaccuracy since1970 of U.S. customs data for exports to Canada.The discrepancies between the U.S. and Canadiandata have become substantial both in absoluteterms – nearly $11 billion in 1986 – and in termsof their effect on the U.S. trade balance – a42 percent reduction in the 1986 U.S. trade deficitwith Canada. While these errors are corrected inthe annual reconciliation of U.S.-Canadian tradedata, their persistence raises a broader question:Are U.S. exports to other countries similarlyunderstated?This possibility raises some important politicaland economic issues. In recent years, the tradebalance has been the focus of much economicpolicy debate, rivaling or complementing suchtraditional domestic issues as employment, inflationand growth. In this context, isolating largeunderstatements in U.S. merchandise export datais clearly a topic with important policy implications....Any exported good from the country oforigin is an imported good for the country of destination.As a consequence, if the data are completeand accurate, the world can have neither atrade deficit nor surplus; it must have a balance.Yet, the world trade data do not yield a balance oncurrent account.Throughout the first half of the 1980s, worldmerchandise trade was in ‘‘surplus,’’ substantiallyso in 1980 and 1981, and negligibly so since then.More broadly throughout the 1980s, the currentaccount – the sum of merchandise and servicetrade minus transfers – has been in substantialdeficit with no clear trend toward balance. Theimplication of these statistical discrepancies isthat substantial export income is not being reported;that is, exports of services are understated.The world current account balance discrepancycan be accounted for by a negative service accountbalance, with unreported shipping income, unreporteddirect investment income and unreportedportfolio investment income the largest contributors.Shipping income is irrelevant for theUnited States; the IMF working party found itattributable to ‘‘several economies with largemaritime interests (notably those of Greece, HongKong and Eastern Europe).’’ The other two discrepancyitems, direct and portfolio investmentincome, were found to be attributable in large partto U.S. investors’ unreported or misreportedforeign income.Source: Mack Ott, ‘‘Have U.S. Exports been Larger thanReported?,’’ Review, Federal Reserve Bank of St. Louis,September/October 1988, pp. 3–23.its meaning. A discrepancy can exist because oferrors in estimating many of the items in Table 5.1.Errors might appear because of differences betweenthe time that current-account entries are made andthe time that the associated payments appearelsewhere in the balance-of-payments account. It iscustomary for the US Department of Commerceand similar foreign agencies to collect data on107 &
THE DETERMINATION OF EXCHANGE RATESexports and imports of goods and services fromcustoms agents; the data on these current accountitems are reported as the goods cross the border oras the services are rendered. The payments for thesegoods or services, which are financial flows, appearonly afterward, possibly in a subsequent report ofthe balance-of-payments statistics. The trade creditsthat allow payments to occur after goods or servicesare delivered should be in the accounts – in line 16or line 25 – but they are often missed.Another reason for errors is that many entries areestimates. For example, data on travel expendituresare estimated from questionnaire surveys of a limitednumber of travelers. The average expenditure discoveredin a survey is multiplied by the number oftravelers. A further reason for measurement error isthat illegal transactions, which affect foreign exchangesupply and demand despite their illegality, do notexplicitly enter the accounts. We can therefore haveflows of funds without any associated measured flowsof goods or services. As Exhibit 5.1 explains, erroralso arises from unreported or misreported incomeon investment and shipping, although the latter is nota problem in the US account. Finally, we can haveunreported flows of capital.An obvious question is how the balance-ofpaymentsaccountant knows the size of the statisticaldiscrepancy, since by definition, it is due to missingor inaccurate data. The answer is that due to the useof double-entry accounting principles, all the entriesin the account must add to zero (we saw this earlierin this chapter where we explained that every positiveentry is matched by a negative entry). If thebalance-of-payments entries do not sum to zero,errors must have been made equal to the extent towhich the sum of entries differs from zero. If youcheck by adding the numbers in the far-right columnof Table 5.1 you will see they add to þ$46 billion.Therefore a supply of $46 billion must have beenmissed and is included to reconcile the account.The fact that the balance of payments must sumto zero means that it is subtotals such as the balanceon current account that are of interest. Furthermore,as we shall explain later, the fact that theoverall balance is zero can provide useful insights& 108into, for example, why a country has a currentaccountdeficit.IMPLICATIONS OF THE BALANCE-OF-PAYMENTS ACCOUNTING IDENTITYInterpreting the accounts with fixed andflexible ratesWe can offer an interesting explanation of why acountry can run a current-account deficit if weconsider the following accounting identity:B c þ DR þ B k þ e 0ð5:1ÞHere B c is the balance of payments on currentaccount, which is the sum of lines 1, 5, and 9 inTable 5.1. The next term DR is the change in officialreserves of both the United States and foreigngovernments, that is, the sum of lines 11 and 19.The next term, B k , is the result of private investmentsof US residents overseas, titled ‘‘U.S. privateassets, net,’’ and foreign private investments inthe United States, titled ‘‘Other foreign assets inU.S.’’ B k is the sum of lines 13 and 20, and is calledthe balance of payments on capital account.The balance of payments on capital account, B k , is thenet result of all the borrowing, lending, investment,and divestment of non-bank firms, banks, andindividuals. The final term, e, is the statisticaldiscrepancy shown in line 27. In summary:B c ¼ balance on current accountDR ¼ changes in official reservesB k ¼ balance on capital accounte ¼ statistical discrepancyEquation (5.1) is a fundamental balance-ofpaymentsidentity. It is useful to consider theimplications of this identity separately for fixed andflexible exchange rates.Flexible ratesWe have said that if exchange rates are truly flexible,there cannot be any changes in official reserves
THE BALANCE OF PAYMENTSbecause central banks do not buy or sell currenciesand gold. This means that if exchange rates are trulyflexible,B c þ B k þ e ¼ 0Assuming that we can calculate balances withouterror, this meansB c þ B k ¼ 0ð5:2ÞEquation (5.2) says that with flexible exchangerates, the correctly measured current-account deficit/surplusis exactly equal to the correctly measuredcapital-account surplus/deficit. It is equation(5.2) that is behind the view of many economiststhat the large US current-account deficits of the1980s were the result of too much foreign borrowing,which in turn was the result of the low USsavings rate. Let us consider this view.Some people tend to think that the direction ofcausation runs from the current account to thecapital account. They would argue that having adeficit in the current account from spending moreabroad than is earned from abroad causes a countryto have to borrow abroad or divest itself of assets.This suggests a direction of causation from B c to B k .However, an equally valid way to view the situationis that an inflow of capital, such as occurs when theUS Government sells its bills and bonds to foreignlenders to finance the US fiscal deficit, forces thecountry to run a deficit in the current account equalto the net import of capital. What happens is thatthe demand for dollars that foreigners must buyin order to be able to purchase the US bills andbonds increases the value of the dollar, therebyreducing US exports and increasing US imports,causing a current-account deficit. Indeed, flexibleexchange rates are the mechanism that ensures acurrent-account deficit results from the capitalimports. A need to borrow from abroad can arisewhen a country is investing more in new plant,equipment, R&D, and so on, than is being saved inthat country. More generally, borrowing ariseswhen domestic savings are insufficient to fundbusiness, government, and consumer needs forfinancing.Fixed ratesWhen exchange rates are fixed, there is no simplelink between the correctly measured current andcapital accounts as in equation (5.2). However, wecan still use the fundamental accounting identity inequation (5.1) to reach some important conclusions.If we again assume the current- and capitalaccountbalances are correctly measured, we canrearrange equation (5.1) to stateDR ¼ðB c þ B k ÞThis tells us that when exchange rates are fixed, asthey were for the major currencies during the socalledBretton Woods era from 1944 to 1973, theincrease/decrease in official reserves equals thecombined surplus/deficit in the current and capitalaccounts. 13 Indeed, the mechanism for fixingexchange rates ensured that this happened. If acountry had a combined deficit on its current andcapital accounts, the net excess supply of thecountry’s currency would have forced down itsexchange rate if the government did nothing. 14Only by buying an amount of its currency equal tothe excess supply could the country keep itsexchange rate from falling. That is, governmentshad to demand whatever excess amounts of theircurrencies were supplied if they were to preventtheir exchange rates from falling. Similarly, governmentshad to supply whatever excess amounts oftheir currencies were demanded if they were toprevent their exchange rates from increasing.Therefore, DR had to be equal and opposite in signto the combined balance on current and capitalaccount, B c þB k .13 The Bretton Woods fixed-exchange-rate system isdescribed in more detail in Chapters 22 and 23.14 Current- and capital-account deficits mean residents areselling more of their own currency to buy foreign goodsand assets than foreigners are demanding to pay forAmerican goods and assets. Hence the net excess supply.109 &
THE DETERMINATION OF EXCHANGE RATESLong-run versus short-run implications ofpayments imbalancesFlexible ratesIf B c þ B k ¼ 0, but B c is large and negative and B k islarge and positive, the country is likely to run intotrouble eventually. This is because with B c negativeand B k positive a country is paying for its excess ofimports over exports of goods, services, income,and goodwill by borrowing abroad or divestingitself of investments made in the past. This is sustainablein the short run, but not in the long run,because B c includes income payments and receipts.If the country is borrowing or divesting, the size ofincome payments will grow faster than its incomereceipts, and so therefore will future deficits oncurrent account. That is, if B c is negative and B k ispositive, then B c will become more negative in thefuture via the additional net payments of interest,dividends, rents, and profits. This will make itnecessary to borrow or divest more, thereby makingB c even more negative in the future, and soon. As we explain in Chapter 23 when discussinginternational debt crises, such patterns haveoccurred in the past with nearly catastrophicconsequences.Fixed ratesIf B c þ DR þ B k ¼ 0 with B c þ B k negative and DRpositive, this means the government is buying up itsown currency to offset the net excess supply due tothe current- plus capital-account deficits. Thegovernment buys its own currency by selling goldand foreign exchange reserves. This can occur in theshort run if the government has a large stock ofreserves. However, eventually reserves will runout. Official reserves can sometimes be borrowedfrom foreign governments, but the income paymentsto official foreign lenders due to borrowingcauses higher future current-account deficits,requiring even more borrowing, still higher futurecurrent-account deficits, and so on. Eventually thecountry is likely to run out of credit.& 110What we discover is that a country must notallow anything but temporary deficits in the currentaccount, or it is likely to fall deeper and deeper intodebt. With fixed exchange rates, it is possible tohave a deficit in the combined current and capitalaccounts, but again, if this is not temporary, thecountry will run out of reserves, fall into debt, andeventually run out of credit.The firm versus the economy: an analogyWe can illustrate the importance of correctingimbalances of payments by considering an analogoussituation of imbalances in the current and capitalaccounts of an individual firm. This analogy alsohelps us push our understanding of the balance ofpayments a little further.The analogous account to the balance of paymentson current account for the firm is the firm’sincome statement. In the case of the firm, the creditentries are revenues from sales and earnings on pastinvestment such as interest received on bankaccounts. The debit entries are the firm’s paymentsfor wages, salaries, rent, raw materials, equipment,and entertainment/advertising – the buying ofgoodwill – plus interest and dividend payments. Ifthe firm has a surplus on its income statement, it canadd to its investments or build up a reserve in thebank against possible losses in the future. If the firmhas a deficit in its income statement, it must borrow,raise more equity, or divest itself of assetspurchased in the past.In the case of a surplus, the addition to investmentsmeans higher future income and, ceterisparibus, ever larger future surpluses in its incomestatements. In the case of borrowing or divesting tocover losses, the extra debt or reduced income baseof assets suggests even larger future losses. However,when we consider an individual firm, werecognize that having payments that exceed receiptsis acceptable when it occurs because the firm isexpanding or otherwise enhancing its capital stock.This situation is acceptable because the firm isincreasing its potential to generate future revenueor reducing its future costs of production. Indeed,
THE BALANCE OF PAYMENTSprovided the investment is a good investment,the extra revenue or saving in production costswill service any added debt incurred in makingthe investment. Therefore, having a deficit in theincome statement, the analogous account to thecurrent account of the balance of payments, is notnecessarily a matter of concern. It depends onwhether the deficit is the result of current operatingand debt costs exceeding current revenue, orwhether the deficit results from capital investment.It follows from what we have just said that it isnot necessarily bad for a country to have a currentaccountdeficit and a capital-account surplus. If thecountry is borrowing from abroad to finance thebuilding of important infrastructure, the developmentof natural resources such as oil reserves, thepurchase of state-of-the-art production robots,construction equipment, and so on, then an excessof imports over exports in the current account isdue to the import of capital equipment. This isfar healthier than a trade balance from importingconsumer goods such as VCRs, expensive wine,clothing, and automobiles. Indeed, if the importedcapital offers a return in excess of future interest ordividend payments incurred in financing the capital,this is a very healthy and sustainable situation. Wesee that we need to know the composition of thecurrent-account deficit as well as whether theaccount is in deficit. 15 Unfortunately, no accountingdistinction is made between the import of capitalgoods and the import of consumer goods. Bothappear in the current account and contribute to adeficit even though they have different implicationsfor future living standards and financial viability.THE NET INTERNATIONAL INVESTMENTPOSITIONThe capital account of the balance of paymentspresents the record of the flows of funds into and out15 This point has been made by K. Alec Chrystal and GeoffreyE. Wood, ‘‘Are Trade Deficits a Problem?,’’ Review,Federal Reserve Bank of St. Louis, January/February1988, pp. 3–11.of a country. Capital inflows result from the sale offinancial and real assets, gold, and foreign exchangeto foreigners. Outflows result from the purchase ofthese assets from foreigners. The inflows and outflowsare added to and subtracted from stocks ofoutstanding international assets and liabilities. Theaccount that shows the stocks of assets and liabilitiesis called the international-investmentpositionaccount. This account is analogous to afirm’s balance sheet. Table 5.2 gives the internationalinvestment position of the United States atthe end of 2001.When capital leaves the United States for investmentoverseas, it is added to US assets abroad. Thedebit that appears in the balance of payments thereforecorrespondstoanincreaseinthevalueofUSassets in Table 5.2. Similarly, when capital flows intothe United States, the credit that appears in the balanceof payments corresponds to an increase in foreignassets in the United States as shown in Table 5.2.The inflows and outflows of investments arecategorized into official/government and privatecomponents, with further divisions within thesemajor categories. The listed items correspond tothose in the balance-of-payments account andindeed, in principle, an outflow of capital in thebalance of payments should increase the corresponding‘‘U.S. asset abroad’’ item in the internationalinvestment-position account. Similarly, aninflow of capital should increase the corresponding‘‘foreign assets in the U.S.’’ item in the investmentpositionaccount. However, while there is a closecorrespondence between the balance-of-paymentsaccount and the net-international-investmentpositionaccount, that correspondence is imperfect.One of the main problems arises from changes inmarket values of existing assets. Such changes invalues do not appear in the balance of payments butshould be reflected in a country’s investment position.An attempt is made to deal with changes invalues of existing assets for direct investment butnot for stocks, bonds and other investment items.We see in Table 5.2 that the market value of USdirect investments abroad exceeds their ‘‘currentcost’’ – the value at the time of the investment – by111 &
THE DETERMINATION OF EXCHANGE RATES& Table 5.2 <strong>International</strong> investment position of the United States year-end 2001, billions of US dollarsUS Govt. assets abroad 216 Foreign official assets in US 1,022US official reserves 130 Foreign private assets in US7,123with FDI at current costOther US Govt. assets 86 (Foreign private assets in US8,150with FDI at market value)US private assets abroad5,981 FDI at current cost 1,499with FDI at current cost(US private assets abroad(6,647) (FDI at market value) (2,527)with FDI at market value)FDI at current cost 1,623 US Securities 3,246(FDI at market value) (2,291) Treasury securities 389Bonds 1,394Foreign securities 2,111 Stocks 1,464Bonds 1046 US Currency 276Stocks 1065Liabilities of US non-banks 804US non-bank assets 830 Liabilities of US banks 1,298US bank assets 1,417 Foreign owned assets in US,8,145FDI at current costTotal US assets withFDI at current cost6,197 (Foreign owned asset in US,FDI at market value)(9,172)(Total US assets withFDI at market value)(6,863) Net international positionof US, with FDI atcurrent cost(Net international positionof US, with FDI atmarket value)Source: US Department of Commerce, Bureau of Economic Analysis, June 2002.1,948( 2,309)$666 billion ($6,647–$5,981 billion). In the case offoreign direct investment in the United States thediscrepancy is a somewhat larger at $1,028 billion($2,527–$1,499 billion). The use of these twomeasures of direct investment means there are twodifferent measures of national net indebtedness,where for the United States, net indebtedness isforeign assets in the United States minus US assetsabroad. Table 5.2 shows that the United States is anet debtor by approximately $2 trillion. Thisrepresents approximately 20 percent of the USGDP. Therefore, while substantial, the US foreigndebt problem is not as serious as the debt problemsthat have been faced by many Latin American and& 112Eastern European nations which have often haddebts equal to more than a year of the debtors’GDPs. 16One of the most important items in the netinternational investment position is the officialreserve position of the government. This positionis very important during times of fixed exchangerates or dirty floats for judging how long a countrycan influence exchange rates. A government candefend its currency only as long as it has sufficientreserves. If, for example, a government can affordmany years of substantial deficits with its stock of16 <strong>International</strong> debt problem are discussed in Chapter 23.
THE BALANCE OF PAYMENTSreserves, a devaluation – an official reduction in thefixed exchange rate – can be considered unlikely.On the other hand, if reserves will meet existingdeficits for only a few months, a devaluation isquite possible.OBJECTIVES OF ECONOMIC POLICYEven when it is pointed out that a trade deficit canbe healthy if it is due to importing capital equipmentthat increases future output and exports, it is difficultfor many people to avoid thinking that it is stillbetter to try to achieve trade surpluses than tradedeficits. This presumption that trade surpluses arean appropriate policy objective has a long history,being the opinion of a diverse group of writers ofthe sixteenth, seventeenth, and eighteenth centuriesknown as mercantilists. The mercantilistsbelieved that trade surpluses were the objective oftrade because, during the time that this view oftrade prevailed, surpluses resulted in increasedholdings of gold, the medium of exchange againstwhich internationally traded products wereexchanged. Today, a version of mercantilism is thattrade surpluses are an appropriate objective becausethey result in accumulations of foreign assets, asreflected in the net international investment position.This seems so eminently reasonable that it isworth asking why indefinitely running tradesurpluses is not a good policy objective.Consider what it means to have a trade surplus,with merchandise exports exceeding imports, andto have this surplus continue indefinitely. It meansthat a country is producing more goods for foreignersto enjoy than foreign countries producefor the country’s own residents. But why shouldone country manufacture goods for the pleasureof another in excess of what it receives in return?Indefinite trade surpluses mean a country is livingbelow its means. The country could enjoy moreof its own production and still keep trade inbalance.One of the most direct ways of exposing themodern-day mercantilist fallacy is by consideringthe national-income accounting identitywhich is met in macroeconomics. This identity iswritten asY C þ I þ G þðEx ImÞ ð5:3ÞwhereY ¼ Gross domestic product (GDP) 17C ¼ ConsumptionI ¼ Gross investmentG ¼ Government expendituresEx ¼ Exports of goods and servicesIm ¼ Imports of goods and servicesBy rearranging equation (5.3) we can state thebalance of payments on goods and services asEx Im Y ðC þ I þ GÞ ð5:4ÞEquation (5.4) makes it clear that to have a surplusin trade, that is, to have (Ex Im) positive, meansproducing, Y, more than is ‘‘used’’ or ‘‘absorbed’’by the economy, (C þ I þ G), in the form of consumption,business investment or the provision ofservices by the government. Interpretation of thebalance of trade as expressed in equation (5.4) hasbeen called the absorption approach to thebalance of payments.Just as surpluses mean a country is living belowits means, deficits mean a country is living aboveits means. In terms of equation (5.4), a deficitmeans producing less than the country absorbs, thatis, Y < (C þ I þ G). A deficit means enjoying theproducts and resources of other nations in excess ofthe products the country in turn provides for othercountries. This is marvelous as long as a country canget away with it, but as with individuals or firms thatlive beyond their means, a day of reckoning eventuallycomes when the credit runs out. This makes17 Gross domestic product, is the value of goods and servicesproduced within a nation. Gross national product (GNP) isthe value of goods and services produced by factors ofproduction owned by residents of a nation. GNP includes netincome earned by residents from abroad via having madeinvestments, working abroad, and so on. If we write Y asGDP, then we exclude income earned abroad or paid toforeigners in Ex and Im in equation (5.3).113 &
THE DETERMINATION OF EXCHANGE RATEScontinuous deficits as undesirable as continuoussurpluses. Indeed, in the case of deficits the situationis not easily sustainable.In order to live within its means, a country doesnot need to balance its trade each and every year.Rather, it can have temporary surpluses and temporarydeficits that on average leave its tradebalanced.Temporary trade surpluses followed by temporarytrade deficits, or temporary deficits followedby temporary surpluses, are a very different matterthan continuous surpluses or deficits. During temporarytrade surpluses, the country increases itsholdings of foreign assets such as stocks, bonds, realestate, operating businesses, and so on. The incomeon these foreign assets allows the country to runtrade deficits in the future without the countryslipping into debt; interest, dividend, and otherearnings in the current account can offset the tradedeficit. Even if there is an overall current accountdeficit because interest, dividends, and other‘‘invisibles’’ do not fully offset the trade deficit, acountry can sell off some of its past investmentswithout becoming a debtor nation.When a country has a trade surplus, it is saving,that is, acquiring foreign assets which can add tofuture income or which can be sold to finance futurespending. It follows that indefinitely running tradesurpluses is analogous to a family saving, and neitherthemselves nor their descendants ever dissaving.Saving is a reasonable choice for people who arepatient, but only if it means that at some point inthe future they or their descendants enjoy thebenefits of past saving by consuming more thanthey earn. That is, it is appropriate to save sometimes,and dissave sometimes, as long as on averageover a long interval of time the savings areapproximately equal to the dissavings. Similarly, itis appropriate to sometimes have trade deficits andsometimes have trade surpluses. The objective ofeconomic policy should be to aim to have balancedtrade over a long period, perhaps as long as adecade or more. 18What we have said is important because peopletend to look at relatively short periods of tradestatistics and become seriously alarmed withoutconsidering the trade pattern of earlier years, or thelikely trade pattern of future years. Such alarm wasvoiced, for example, in the 1990s at the largeJapanese trade surpluses. More recently worrieshave been expressed about the trade surpluses of thePeoples Republic of China. Few people stop torecall that in the 1970s Japan ran trade deficits fromimporting expensive oil and other resources.Similarly, China, which has run trade deficits in thepast as capital investments were occurring, mayagain run deficits as consumers express their tastesfor imports, as they can now more easily do sinceadmission to the World Trade Organization,(WTO) in 2002.SUMMARY1 The balance-of-payments account is a record of the flow of payments between theresidents of one country and the rest of the world in a given period. Entries in theaccount that give rise to a demand for the country’s currency – such as exports andasset sales – are identified by a plus sign. Entries giving rise to a supply of thecountry’s currency are identified by a minus sign. Therefore, we can think of the balanceof-paymentsaccount as a record of the supply of and demand for a country’s currency.18 The conclusion that an appropriate objective of policy is to balance the current account on average by borrowing sometimesand lending at other times is supported by the gain from consumption smoothing that is described in Appendix B, Chapter 1. Inthat appendix, it is shown that there is a gain in expected utility from borrowing and lending.& 114
THE BALANCE OF PAYMENTS2 The balance-of-payment account is based on double-entry bookkeeping. Therefore, everyentry has a counterpart entry elsewhere in the account, and the account must balance.What is important, however, is how it balances. Anything tending to increase the size ofpositive entries, such as higher exports or increased sales of bonds to foreigners, willcause the account to balance at a higher exchange rate.3 Credit entries in the balance of payments result from purchases by foreigners of acountry’s goods, services, goodwill, financial and real assets, gold and foreignexchange. Debit entries result from purchases by a country’s residents of goods,services, goodwill, financial and real assets, gold and foreign exchange from foreigners.4 The current account includes trade in goods and services, income and unilateraltransfers. The goods or merchandise component alone gives the balance of trade as theexcess of exports over imports. If exports exceed imports, the balance of trade is insurplus, and if imports exceed exports, it is in deficit. Income includes the flow of interestand dividend receipts and payments. Unilateral transfers are flows of money not matchedby any other physical flow, and double-entry bookkeeping requires that we have anoffsetting flow that can be marked down as goodwill.5 A current-account deficit can be financed by selling a country’s bills, bonds, stocks,real estate, or businesses. It can also be financed by selling off previous investmentsin foreign bills, bonds, stocks, real estate, or businesses. A current-account surplus canbe invested in foreign bills, bonds, stocks, real estate, or businesses. The principal factorsinfluencing investments in foreign financial and real assets are rates of return in theforeign country versus rates of return at home, and the riskiness of the investments.6 Purchases and sales of financial and real assets result in a supply of or demand fora country’s currency in the same way as purchases and sales of goods and services.7 Changes in official reserves occur when governments intervene in the foreign exchangemarkets to influence exchange rates. When exchange rates are truly flexible, changes inofficial reserves are zero.8 Since all entries in the balance of payments should collectively sum to zero, the balanceof-paymentsaccountant can determine the errors that were made. This is called thestatistical discrepancy.9 With flexible exchange rates, the correctly measured deficit/surplus in the currentaccount equals the correctly measured surplus/deficit in the capital account. Withfixed exchange rates, the combined increase/decrease in official reserves of the domesticand foreign governments is equal to the combined surplus/deficit of the correctlymeasured current and capital accounts.10 It is equally valid to consider a current-account deficit/surplus to be the cause of, or to becaused by, a capital-account surplus/deficit.11 The balance-of-payments account is analogous to a firm’s income statement. Deficits areequivalent to corporate losses and can be financed by selling bonds or new equity, or bydivesting assets. If there is a net outflow from a firm or country due to acquiring newproductive capital, this might not be unhealthy. Unfortunately, the balance-of-paymentsaccount does not distinguish imports of capital goods from imports of consumptiongoods.115 &
THE DETERMINATION OF EXCHANGE RATES12 The international investment position is a record of the stock of foreign assets andliabilities. The size of official reserves is relevant for determining the likelihood ofdevaluation.13 It is not a good idea to run persistent deficits or persistent surpluses in the balance oftrade. Rather, a country should balance its trade on average over the long run.REVIEW QUESTIONS1 Does the balance-of-payments account record stocks or flows?2 Are transactions giving rise to the demand for a country’s currency recorded as debits orcredits in the balance of payments?3 What economic variables might affect the value of a country’s merchandise (goods)exports?4 What are a country’s ‘‘terms of trade?’’5 What are ‘‘invisibles’’ in the balance of payments?6 What are ‘‘debt service exports?’’7 How are interest earnings from foreign investments included in the balance of payments?8 What is a ‘‘balance of trade deficit?’’9 What is a ‘‘unilateral transfer?’’10 What are ‘‘official reserve assets?’’11 What is ‘‘direct investment?’’12 What is a ‘‘current account surplus?’’13 What is a ‘‘capital account deficit?’’14 What is the identity linking the current account, capital account, change in officialreserves, and statistical discrepancy?15 What does the net international-investment-position account show?16 What did the ‘‘Merchantilists’’ think?17 What is the chief characteristic of the absorption approach to the balance of payments?18 If a country is living beyond its means, does it have persistent trade surpluses or deficits?ASSIGNMENT PROBLEMS1 Since gold is a part of official reserves, how would the balance-of-payments statisticsshow the sale of domestically mined gold to the country’s central bank? What happens ifthe mining company sells the gold to foreign private buyers?2 Can all countries collectively enjoy a surplus, or must all surpluses and deficits cancelagainst each other? What does gold mining mean for the world’s balance?3 Under what conditions would inflation increase the value of exports?4 Even if inflation did increase the value of exports, would the balance of trade and theexchange rate necessarily improve from inflation that is higher than in other countries?& 116
THE BALANCE OF PAYMENTS5 How do we know that an exogenous increase in exports will cause a currency toappreciate even though the balance of payments is always zero? How does your answerrelate to the law of supply and demand whereby supply equals demand even after demandhas increased?6 What is the difference between the immediate and the long-run effect of the sale of bondsto foreign investors?7 What is the difference between the immediate and the long-run effect of direct investmentby foreigners when the direct investment is in a heavily export-oriented activity such as oilexploration and development? Would it make any difference if the industry into whichdirect investment occurred were involved in the production of a good the countrypreviously had been importing?8 If the balance of payments of Alaska were prepared, what do you think it would look like?How about the balance of payments of New York City? What do you think the netinvestment position of these locations will be? Should we worry if Alaska is in debt?9 If the overall level of interest rates in all countries went up, how would this affect thebalance of payments of the United States as a net debtor nation?10 Which item(s) in the balance-of-payments account, Table 5.1, would be most affected byan expected appreciation of the US dollar, and how would the item(s) and the currentspot value of the dollar be affected by the expected appreciation? Do you believe that thehigher expected future value of the US dollar could increase the spot value immediately?BIBLIOGRAPHYBaldwin, Robert E., ‘‘Determinants of Trade and Foreign Investment: Further Evidence,’’ Review of Economicsand Statistics, Fall 1979, pp. 40–8.Bame, Jack J., ‘‘Analyzing U.S. <strong>International</strong> Transactions,’’ Columbia Journal of World Business, Fall 1976,pp. 72–84.Caves, Richard E. and Ronald W. Jones, World Trade and Payments: An Introduction, 4th edn, Little Brown andCompany, Boston, 1984, Chapter 5.Chrystal, K. Alec and Geoffrey E. Wood, ‘‘Are Trade Deficits a Problem?,’’ Review, Federal Reserve Bank ofSt. Louis, January/February 1988, pp. 3–11.Cooper, Richard N., ‘‘The Balance of Payments in Review,’’ Journal of Political Economy, August 1966,pp. 379–95.Grubel, Herbert G., <strong>International</strong> Economics, Richard D. Irwin, Inc., Homewood, IL, 1977, Chapter 13.Heller, H. Robert, <strong>International</strong> Monetary Economics, Prentice-Hall, Inc., Englewood Cliffs, NJ, 1974, Chapter 4.Kemp, Donald S., ‘‘Balance of Payments Concepts: What Do They Really Mean?,’’ Review, Federal Reserve Bankof St. Louis, July 1975, pp. 14–23.Miller, Merton H., ‘‘Financial Markets and Economic Growth,’’ Journal of Applied Corporate <strong>Finance</strong>, Fall 1998,pp. 8–15.Mundell, Robert A., ‘‘The Balance of Payments,’’ in David Sills (ed.), <strong>International</strong> Encyclopedia of the SocialSciences, Crowell-Collier and Macmillan, Inc., New York, 1968. Reprinted as Chapter 10 in Robert Mundell,<strong>International</strong> Economics, The Macmillan Company, New York, 1968.117 &
THE DETERMINATION OF EXCHANGE RATESOhmae, Kenichi, ‘‘ ‘Lies, Damned Lies, and Statistics’: Why the Trade Deficit Doesn’t Matter in a BorderlessWorld,’’ Journal of Applied Corporate <strong>Finance</strong>, Winter 1991, pp. 98–106.‘‘Report of the Advisory Committee on the Presentation of the Balance of Payments Statistics,’’ in US Departmentof Commerce, Survey of Current Business, June 1976, pp. 18–25.Salop, Joanne and Erich Spitaller, ‘‘Why Does the Current Account Matter?,’’ Staff Papers, <strong>International</strong>Monetary Fund, March 1980, pp. 101–34.Stern, Robert M., The Balance of Payments: Theory and Economic Policy, Aldine Publishing Company, Chicago,1973, Chapter 1.Stern, Robert M. et al., ‘‘The Presentation of the U.S. Balance of Payments: A Symposium,’’ Essays in <strong>International</strong><strong>Finance</strong>, Number 123, <strong>International</strong> <strong>Finance</strong> Section, Princeton University, Princeton, NJ, August1977.Wilson, John F., ‘‘The Foreign Sector in the U.S. Flow of Funds Account,’’ <strong>International</strong> <strong>Finance</strong> DiscussionPapers, Board of Governors of the Federal Reserve System, Number 239 (undated).& 118
Chapter 6Supply-and-demand view ofexchange ratesAccording to the laws of supply and demand, when buyers don’t fall for prices, prices must fallfor buyers.AnonymousIn Chapter 5 we explained that when exchange ratesare flexible, they are determined by the forces ofsupply and demand. 1 In this chapter we considerthese forces of supply and demand by deriving thesupply and demand curves for a currency and usingthem to explain what makes exchange rates change.As we might expect, this involves consideration ofthe effects of items listed in the balance-of-paymentsaccount on the supply and demand curves. With thebalance-of-payments account recording flows ofpayments into and out of a country, the explanationof exchange rates based on the account emphasizesflow demands and supplies of a currency. 2 However,as we shall see, in the case of currencies there is noassurance that the supply-and-demand situation will1 When exchange rates are fixed, as they were under the goldstandard and the Bretton Woods standard, they are alsodetermined by supply and demand. The difference betweenfixed and flexible rates is that with fixed rates there is officialdemand or supply at the fixed rate, and this is adjusted toensure that the exchange rate stays at or near the chosenrate. The determination of fixed exchange rates under avariety of fixed-rate systems is explained in Chapter 22.2 In Chapter 21 we describe theories of exchange rateswhich emphasize stock demands and supplies, specifically,the amount of currency versus the amount of currencypeople want to hold.have the form that is familiar from the applications ofsupply and demand in other markets. In particular,there is no assurance that the supply curve of acurrency will be upward-sloping.The possibility that a currency supply curve slopesdownwards rather than upwards is not a mere curiositywith little practical relevance. Rather, it is arealistic possibility that is critical to explaining whyforeign exchange markets may be unstable. Thispossibility has attracted substantial interest because ofthe extreme volatility of exchange rates during certaintimes. It is also of interest because the conditionfor exchange-rate instability helps explain the socalled‘‘Jcurve’’ whereby, for example, a depreciationof a currency worsens rather than improves acountry’s trade balance. The cause of the J curve andof exchange-rate instability can be understood byapplying the central economic paradigm of supply anddemand.The traditional approach to supply and demand isto begin by explaining why supply and demandcurves slope the way they do, and then to considerthe effects of shifts of the curves. Our approach hereis the same. Of course, in the case of exchangerates we write the exchange rate (the price of acountry’s currency expressed in terms of someother currency) on the vertical axis. In order to119 &
THE DETERMINATION OF EXCHANGE RATESestablish the slopes of the supply and demand curvesfor currencies, we consider the effects of exchangerates on the values of imports and exports. This issimilar to considering the effect of price on quantitysupplied and demanded. 3 We then show that allother factors in the balance-of-payments accountcan be considered as shifting the supply or demandcurves, with effects on exchange rates that dependon the slopes of the curves.IMPORTS, EXPORTS, ANDEXCHANGE RATESDeriving a currency’s supply curveAs you would expect, the supply curve of acurrency shows the amount of that currency beingsupplied on the horizontal axis, and the price of thecurrency, given by the exchange rate, on the verticalaxis. However, when we draw the supplycurve of a currency, we do not plot quantities onthe horizontal axis as we do with normal supplycurves – so many bushels of wheat or automobilesproduced per month. Rather, we plot monetaryvalues on the horizontal axis – the number of Britishpounds or euros that are being spent on imports.Values involve the multiplication of prices andquantities, and respond differently than do quantities.Indeed, as we shall show, the fact that valuesrather than physical quantities are on the horizontalaxis explains why the currency supply curve caneasily slope downward rather than upward withrespect to the price of the currency.The supply curve of a currency derives, at leastin part, from a country’s demand for imports. Thisis because when paying for imports that are invoicedin foreign currency, the importing country’sresidents must sell their currency for the neededforeign exchange, and when imports are invoiced indomestic currency, the foreign recipient of the3 The pattern is similar, but different in that currenciesinvolve values of exports and imports, not quantities of goodsor services as in traditional supply and demand. We have farmore to say about this later.& 120currency sells it. In either case, imports result in thecountry’s currency being supplied. 4 The amountof the currency supplied is equal to the valueof imports. Let us see how to plot the value ofcurrency supplied against the exchange rate byconsidering British imports of wheat which, forsimplicity, we assume is the only import.The quantity of pounds supplied equals the valueof British wheat imports. This involves multiplyingthe pound price of wheat by the quantity of wheatimported. The multiplication gives the number ofpounds Britain spends on wheat imports, andtherefore also gives the number of pounds suppliedto the foreign exchange market. Let us suppose thatthe world price of wheat is $3/bushel, that wheatis traded without tariffs or other restrictions, andthat Britain buys such a small proportion of globalwheat output that the world price of wheat is notinfluenced by Britain’s imports.At an exchange rate of $1.5/£ the pound price ofwheat is $3 ($1.5/£) ¼ £2/bushel. Figure 6.1a,which shows the British import demand curvefor wheat, reveals that at £2/bushel the quantityof wheat imports is zero, point A. That is, at£2/bushel Britain’s production of wheat equalsBritain’s consumption of wheat so that Britain isprecisely self-sufficient at this price. With zeroimports the number of pounds supplied is thereforezero at the exchange rate $1.5/£. This is shown bypoint A 0 on the supply curve of pounds, S £ ,inFigure 6.1b. If the exchange rate is $1.7/£, thepound price of wheat is $3 ($1.7/£) ¼ £1.76/bushel. Point B on the import demand curve inFigure 6.1a shows that at this price, wheat importsare approximately 0.75 billion bushels. The numberof pounds supplied per year at exchange rate $1.7/£is therefore £1.76 0.75 billion ¼ £1.32 billionper year. This quantity of pounds supplied is plottedagainst the exchange rate $1.7/£, point B 0 on S £ in4 If imports are invoiced in the importer’s currency, and theforeign recipient of the currency chooses not to sell it, westill consider that the currency is supplied to pay forimports. This is matched, however, by a foreign demandfor the currency in the capital account.
SUPPLY-AND-DEMAND VIEW OF EXCHANGE RATESPrice of wheat (pounds)3.02.52.01.51.00.5ABCD UmKExchange rate ($/£)3.02.52.01.51.00.5A9B9C9S £1 2 3 1 2 3Wheat imports/year(billions of bushels)(a) Wheat market& Figure 6.1 Deriving the supply of poundsSupply of pounds/year(billions of pounds)(b) Foreign exchange marketNotesA currency is supplied in the course of paying for imports. If we limit consideration to goods and services, the supply of acurrency equals the value of imports. We find the currency supply curve by taking each possible exchange rate and findingthe price of imports at that exchange rate. We then determine the quantity of imports at that price from the demand curvefor imports and calculate the value of imports by multiplying the price and the quantity of imports. We then plot the valueof imports against the exchange rate at which it occurs.Figure 6.1b. 5 Similarly, at the exchange rate $2/£the pound price of wheat is $3 ($2/£) ¼£1.5/bushel. Figure 6.1a shows import demand of1.5 billion bushels at this price, point C, which involvesan annual expenditure of £1.5 1.5 billion ¼£2.25 billion. This gives point C 0 on S £ in Figure 6.1b.By continuing in this way we can construct thesupply curve of pounds, which in this case happens toslope upward (we consider the condition for adownward-sloping currency supply curve, and theimplications of such a curve, later in the chapter).Deriving a currency’s demand curveThe demand curve for a currency shows the value ofthe currency that is demanded at each exchangerate. Because the need to buy a country’s currencystems from the need to pay for the country’sexports, the currency’s demand curve is derivedfrom the country’s export supply curve, whichshows the quantity of exports at each price ofexports. The value of exports is then the pricemultiplied by the quantity.5 We see that we are calculating the area under D m UK inFigure 6.1a, and plotting this as the distance along thehorizontal axis in Figure 6.1b.Figure 6.2a shows the supply curve of Britishexports. For simplicity of reference we assume thatBritain exports only oil. The demand for pounds topay for Britain’s oil exports is equal to the value ofthese exports. Therefore, in order to construct thedemand curve for pounds we must calculate thevalue of oil exports at each exchange rate. Let ussuppose that the world price of oil is $25/barrel andthat Britain has no effect on this price when itchanges its oil exports.If we begin with an exchange rate of $2/£, thepound price of oil is $25 $2/£ ¼ £12.5/barrel.Figure 6.2a shows that at £12.5/barrel oil exportsare zero, point D. That is, at £12.5/barrel Britain’sproduction of oil equals Britain’s consumption ofoil, so that the country is exactly self-sufficient.With zero oil exports, the quantity of poundsdemanded to pay for Britain’s oil exports is thereforealso zero at $2/£. This is shown by point D 0 onthe demand curve of pounds, D £ , in Figure 6.2b. Ifthe exchange rate is $1.8/£ the pound price of oil is$25 $1.8/£ ¼ £13.89 and oil exports are approximately0.1 billion barrels per year, point E inFigure 6.2a. The value of oil exports and quantity ofpounds demanded per year at $1.8/£ is therefore£13.89 0.1 billion ¼ £1.389 billion. This is121 &
THE DETERMINATION OF EXCHANGE RATESPrice of oil (pounds)252015105DEFS UxKExchange rate ($/£)3.02.52.01.51.00.5DEFD £00.1 0.2 0.3Oil exports/year(billions of barrels)(a) Oil market2 4 6 8Demand for pounds/year(billions of pounds)(b) Foreign exchange market& Figure 6.2 Deriving the demand for poundsNotesA country’s currency is demanded in the course of foreigners buying that country’s exports. If we limit consideration togoods and services, the demand for a currency equals the value of exports. We find the currency demand curve by takingeach possible exchange rate and finding the price of exports at that exchange rate. We then determine the quantity ofexports at that price from the supply curve for exports and calculate the value of exports by multiplying the price by thequantity of exports. We then plot the value of exports against the exchange rate at which it occurs.shown by point E 0 on D £ in Figure 6.2b. Finally, at$1.50/£ the price of oil is $25 $1.5/£¼ £16.67/barrel, and exports are approximately0.2 billion barrels – point F in Figure 6.2a.Therefore, the number of pounds demanded at$1.5/£ is £16.67 0.2 billion ¼ £3.33 billion peryear – point F 0 in Figure 6.2b.THE FACTORS AFFECTINGEXCHANGE RATESTerms of trade and the amount of tradeIf we plot the supply and demand curves for poundsin the same figure, as in Figure 6.3, we can find theexchange rate that equates the value of exports andimports, and hence that equates the supply of anddemand for the country’s currency resulting fromthese activities. We see that equality of supplyand demand occurs at an exchange rate ofapproximately $1.75/£.It is clear from Figure 6.3 that ceteris paribus, anexogenous increase in the value of exports at eachexchange rate, which shifts the demand curve forpounds, D £ , to the right, will, with the slopes ofcurves shown, result in an increase in the value of& 122the pound. Such an increase in the value of exportscould occur as a result of a higher world price of oil,or from an increase in the quantity of oil exported ateach oil price. It is also clear from the figure thatceteris paribus, an exogenous increase in the value ofimports at each exchange rate, which shifts thesupply curve of pounds, S £ , to the right, will resultin a decrease in the value of the pound. This couldresult from a higher world price of wheat or anincrease in the quantity of wheat imported at eachprice. The price of a country’s exports relative tothe price of its imports is called the country’s termsof trade. A country’s terms of trade are said toimprove when the price of its exports increasesrelative to the price of its imports. Our descriptionof Figure 6.3 makes it clear that the pound willappreciate in value as a result of an improvementof Britain’s terms of trade. That is, the pound willappreciate if, ceteris paribus, oil prices increase relativeto wheat prices. The pound will also appreciateif the quantity of exports increases relative to thequantity of imports. This could happen, for example,if Britain steps up production and exports ofoil at each oil price. It could also happen if Britainhas a good wheat harvest and therefore imports lesswheat at each exchange rate.
SUPPLY-AND-DEMAND VIEW OF EXCHANGE RATESS £2.5Exchange rate ($/£)2.01.51.0D £0.50 1 2 3Supply of and demand for pounds(billions/year)& Figure 6.3 The exchange rate from imports and exportsNotesThe equilibrium exchange rate is that at which the quantity of currency supplied equals the quantity demanded. Factorsother than the exchange rate which affect the value of imports and exports shift the currency supply and demand curvesand thereby change the equilibrium exchange rate.InflationTerms of trade effects concern export versus importprices, where the exports and imports are differentproducts. Exchange rates are also influenced byinflation which affects the competitiveness of onecountry’s products versus the same products fromanother country. In order to show the effects ofinflation it is necessary to describe the derivation ofthe import demand and export supply curves. Thesecurves were taken to be exogenous in Figures 6.1aand 6.2a. That is, we have not yet shown what isbehind the import demand curve, D m UK ,inFigure6.1a, and the export supply curve, S x UK in Figure 6.2a.Deriving the import demand curveFigure 6.4a shows the demand for wheat in Britain,D w UK , and the quantity of wheat British farmerssupply at each price, S w UK . If Britain can take theworld price of wheat as given, whether Britain is animporter or exporter of wheat depends on theworld price of wheat translated into pounds. Forexample, if the world price of wheat is equivalent to£1.5/bushel, Britain produces 2.5 billion bushelsper year and consumes 4 billion bushels per year,so that imports are 1.5 billion bushels per year. At£2.0/bushel Britain is self-sufficient, producing andconsuming 3.5 billion bushels per year, and at pricesabove £2.0/bushel Britain is a wheat exporter.If we consider only pound prices of wheat below£2/bushel, where Britain is a wheat importer, wecan plot the British demand curve for imports byselecting different pound prices and measuringthe distance between D w UK and Sw UK at each price.These distances, which are the quantities of wheatimported at each price, are plotted against theprices at which they occur. By doing this we obtainthe British wheat import demand curve D m UK shownin Figure 6.4b. This is the import demand curve thatwe took as our starting point in Figure 6.1a. As wesaw earlier, by assuming that the world price ofwheat is $3/bushel, we can construct the supplycurve of pounds, S £ , in Figure 6.1b.123 &
THE DETERMINATION OF EXCHANGE RATESPrice of wheat (pounds)3.0wS UK2.52.01.5w1.0D UKPrice of wheat (pounds)3.02.52.01.51.00.5 0.5ABCD UwK0 1 2 3 4 5Quantity of wheat/year(billions of bushels)(a) Wheat market01 2 3Wheat imports/year(billions of bushels)(b) Wheat imports& Figure 6.4 Deriving the demand for importsNotesThe quantity of imports demanded at each price is the excess of the quantity of the product that is demanded over thequantity of the product produced in the country. That is, it is the horizontal distance between the country’s demand curvefor the product and its supply curve.Deriving the export supply curveCurves D o UK and So UK in Figure 6.5a show, respectively,British oil demand and supply at differentoil prices. We can construct the export supply curvefrom D o UK and So UK by considering different poundprices of oil, and computing the excess of quantitysupplied over quantity demanded at each price. Forexample, at £12.50/barrel oil consumption equalsoil production, so that exports are zero. This is pointD on the export supply curve, S x UK , shown inFigure 6.5b and Figure 6.2a. Proceeding in this way,we obtain the supply curve of exports, S x UK ,thatwemerely assumed in Figure 6.2a. As we saw earlier, byassuming that the world price of oil is $25/barrel andconsidering different exchange rates, we can derivethe demand curve for pounds, D £ , in Figure 6.2b.When we plot the supply and demand curvesfor pounds in the same figure as in Figure 6.3, wefind that the exchange rate that equates the supplyof and demand for pounds before any inflation hasoccurred. Let us now consider what happens whenthere is inflation.Inflation, import demand, and export supplyLet us assume that Britain experiences inflation of25 percent. If all prices and wages in Britain increase& 12425 percent during a year, the British demand curvesfor wheat and oil at the end of the year will be25 percent higher than at the beginning of the year.That is, they are shifted vertically upward by25 percent. This is because with all prices and wageshigher by the same amount, real incomes andrelative prices are unchanged. Therefore, after the25 percent inflation the same quantities of goodsare purchased at prices 25 percent higher thanbefore the inflation as were purchased before theinflation: nothing real has changed.At the same time as the British demand curvesfor wheat and for oil shift upward, so do the supplycurves. The easiest way of thinking about why thisoccurs is to note that the supply curves for competitivefirms are their marginal cost (MC) curves.Indeed, the individual competitive firm’s short-runsupply curve is that firm’s MC curve, and thecompetitive industry’s short-run supply curve is thehorizontal sum of all existing firms’ MC curves.Long-run supply curves which consider newlyentering firms also shift up by the rate of inflation,because inflation also increases the marginal costs ofnew firms. Hence, if all wages and prices increaseby 25 percent, the marginal costs become 25 percenthigher, and therefore so are the supply curves.We can reach the same conclusion if we think of
SUPPLY-AND-DEMAND VIEW OF EXCHANGE RATES2525Price of oil (pounds)2015105S UOKD UOKPrice of oil (pounds)2015105DEFS UXK0 0.1 0.2 0.3 0.4 0.5 0 0.1 0.2 0.3Quantity of oil/year(billions of barrels)(a) Oil market& Figure 6.5 Deriving the export supply curveQuantity of oil/year(billions of barrels)(b) Oil exportsNotesThe quantity of exports supplied at each price is the excess of the quantity of the product that is supplied over the quantitydemanded in the country. That is, it is the horizontal distance between the country’s supply curve of the product and itsdemand curve.supply as being set to equate marginal cost andmarginal revenue. At any given output themarginal cost is 25 percent higher after inflation, andtherefore if the marginal revenue is also 25 percenthigher from the demand curve shifting up 25 percent,there is no reason to change output; marginalcost remains equal to marginal revenue.The left-hand diagrams in Figure 6.6 show thesupply and demand curves for wheat and oil beforeand after 25 percent inflation. The supply anddemand curves before inflation are identified by P 0 ,the price level at the beginning of the year, andthose after inflation are identified by P 1 , the pricelevel at the end of the year.The right-hand diagrams in Figure 6.6 show thedemand for imports and the supply of exportsbefore and after 25 percent inflation. As before, P 0signifies the curve before inflation, and P 1 afterinflation. We recall that the demand for imports andsupply of exports are obtained by selecting differentprices and calculating the difference betweendomestic supply and demand at each price. Forexample, before inflation, the demand for importsof wheat was zero at £2/bushel. After inflation, itis zero at £2.50/bushel. That is, the intercept ofD m UK (P 1) with the price axis is 25 percent higher thanthe intercept of D m UK (P 0). Since the slopes of thesupply and demand curves for wheat are the samebefore and after inflation, the slope of the demandcurve for wheat imports is the same before and afterinflation. Therefore, we find that D m UK (P 1) is aboveD m UK (P 0) by 25 percent, not only at the interceptwith the price axis, but at every other quantity ofimports. Similarly, the supply curve of oil exportsintercepts the price axis at £12.50 before inflation,because this is where quantity of domestic oil suppliedequals the quantity demanded. After inflationthe intercept is at a price 25 percent higher. Becausethe slopes of the supply and demand curves for oilare the same before and after inflation, the slope ofthe export supply curve is the same before and afterinflation. Therefore, as in the case of the demandcurve for imports, the supply curve of exports shiftsupwards 25 percent at every quantity.We can employ Figure 6.6 to show how inflationaffects currency supply and demand curves andhence the exchange rate. There are different effectsaccording to whether inflation occurs only in Britainalone, or in Britain and elsewhere, and so weconsider these situations in turn.125 &
THE DETERMINATION OF EXCHANGE RATES4.0 4.0Price of wheat (pounds)Price of oil (pounds)3.5wS UK (P 1 )3.53.0 3.0wS UK (P 0 )2.52.52.0 2.01.5wD UK (P 1 )1.51.0wD UK (P 0 )1.00.5 0.50 1 2 3 4 5 0Quantity of wheat/year30oS UK (P 1 )25oS UK (P 0 )2015oD UK (P 1 )10oD UK (P 0 )Price of oil (pounds) Price of wheat (pounds)30252015105 5mD UK (P 1 )mD UK (P 0 )1 2 3Wheat imports/yearxS UK (P 1 )xS UK (P 0 )00.1 0.2 0.3 0.4 0.5 0 0.1 0.2 0.3 0.4Quantity of oil/yearOil imports/year& Figure 6.6 Inflation in relation to supply and demandNotesCurves identified with P 0 represent the situation before inflation. Curves identified with P 1 represent the situation after inflation.We see that inflation in all prices and incomes shifts demand and supply curves vertically upward by the amount of inflation.Thus the demand curve for imports and supply curve of exports also shift vertically upward by the amount of inflation.Inflation in only one countryFigure 6.7a shows the supply and demand curves forpounds that are implied by the demand curve forimports and supply curve of exports when inflationof 25 percent occurs in Britain but not in the UnitedStates. The curves labeled S £ (P 0 ) and D £ (P 0 ) arethose before inflation, and are the same supply anddemand curves for pounds used in Figure 6.3. Thecurves labeled S £ (P 1 ) and D £ (P 1 ) are the supply anddemand curves for pounds after 25 percent inflationin Britain but not in the United States. The derivationof S £ (P 1 ) and D £ (P 1 ) is based on the followingreasoning.& 126Because inflation occurs only in Britain, we cantake the US dollar prices of wheat and oil asunchanged. Consider, first, the supply curve ofpounds. We know from Figure 6.6 that the samequantity of wheat is imported after inflation asbefore inflation if the pound price of wheat isincreased by 25 percent; this follows immediatelyfrom the fact that D m UK (P 1) is 25 percent higherthan D m UK (P 0). When the same quantity of wheat isimported at a price that is 25 percent higher, thesupply of pounds, which is the pound price ofimports multiplied by the quantity of imports, isalso 25 percent higher (recall that the quantity of
SUPPLY-AND-DEMAND VIEW OF EXCHANGE RATESS £ (P 0 )S £ (P 0 ) S £ (P 1 )2.5S £ (P 1 )2.5Exchange rate ($/£)2.01.51.0D £ (P 0 )D £ (P 1 )Exchange rate ($/£)2.01.51.0D £ (P 0 )D £ (P 1 )0.50.50 1 2 3 4 0 1 2 3 4Billions of pounds/year(a) Inflation in one country& Figure 6.7 Inflation and exchange ratesBillions of pounds/year(b) Inflation in both countriesNotesCurves labeled with P 0 represent the situation before inflation. Curves labeled with P 1 represent the situation after inflation.With inflation in one country only (a), the same quantity of exports is sold after a depreciation that is approximately equal to thecountry’s rateofinflation. The same quantity sold at the higher prices means the value of exports is higher by the rate ofinflation. This means the currency demand curve shifts down and to the right approximately in proportion to inflation. The sameargument applies to the currency supply curve. Therefore, the exchange rate of the inflating country depreciates byapproximately its rate of inflation as in (a), and the quantity of currency traded increases by the rate of inflation. When inflationalso occurs in the other country (b), the same quantities are imported and exported at the same exchange rates at the postinflationprices. Therefore, the values of imports and exports are higher by the rate of inflation at each exchange rate. That is, thecurrency supply and demand curves shift to the right in proportion to the rate of inflation, and the exchange rate is unaffected.pounds supplied is the pound value of imports,which is the pound price times the quantity).The change in exchange rate that will achieve a25 percent higher pound price and a corresponding25 percent higher supply of pounds is a 25 percentdepreciation of the pound. This follows because thedollar price of wheat is unchanged. That is, at anexchange rate that is 25 percent lower, the poundprice of wheat is 25 percent higher and the quantityof imports is unchanged. Therefore, at an exchangerate that is 25 percent lower there is a 25 percenthigher quantity of pounds supplied. This means thatinflation of 25 percent shifts the supply curve forpounds downward by 25 percent and to the right by25 percent, so that points on S £ (P 1 ) in Figure 6.7aare 25 percent below and 25 percent to the right ofcorresponding points on S £ (P 0 ).The reasoning behind the effect of inflation onthe demand for pounds is similar to the reasoningbehind its effect on the supply of pounds describedearlier. Figure 6.6 shows that the same quantity ofoil is exported after inflation as before inflation if thepound price of oil increases by 25 percent; S x UK (P 1)is 25 percent above S x UK (P 0). Because the dollarprice of oil is unchanged, to achieve a 25 percenthigher pound oil price we need a 25 percent pounddepreciation. Therefore, at a 25 percent lowerexchange rate in Figure 6.7a we have a 25 percenthigher pound price of oil and the same quantity ofoil exports. This represents a 25 percent increase inthe value of exports, which is price times quantity,and hence in the demand for pounds. Therefore, theeffect of inflation is to shift each point on thedemand curve for pounds downward by 25 percent127 &
THE DETERMINATION OF EXCHANGE RATESand to the right by 25 percent; at a 25 percent lowerexchange rate the demand for pounds is 25 percenthigher after inflation than before.Figure 6.7a shows the supply and demand curvesfor pounds shifted downward by 25 percent and tothe right by 25 percent. If we compare the equilibriumwhere S £ (P 1 ) intersects D £ (P 1 ) with theequilibrium where S £ (P 0 ) intersects D £ (P 0 ), we seethat the pound depreciates by 25 percent. That is,inflation in one country reduces the exchange rateof that country’s currency by the same percentageas the country’s inflation. We also can see fromcomparing equilibria in Figure 6.7a that the quantityof pounds traded also increases by 25 percent. 6We should recall that in order to reach these conclusionswe considered only exports and imports,and assumed that all prices and wages in Britainincreased by the same amount.Inflation also in other countriesThe difference between having inflation only inBritain, and having inflation in Britain and theUnited States, is that in the latter case we mustallow for increases in the dollar prices of theimported and exported products. Let us assume USinflation is also 25 percent, so that the dollar pricesof wheat and oil increase by 25 percent, that is,from $3/bushel and $25/barrel, to $3.75/busheland $31.25/barrel.Let us consider first the supply curve of pounds.We know from our earlier discussion and fromFigure 6.6 that the quantity of wheat imports afterinflation is the same as before inflation if the poundprice of wheat increases by the amount of inflation,that is, 25 percent. Therefore, at the same exchangerate as before there is a 25 percent increase in thepound price of wheat and the same quantity of6 The conclusion that 25 percent inflation, with othercountries having zero inflation, causes 25 percentdepreciation is also reached by considering the PPPprinciple presented later in the book. However, PPP,which is based on arbitrage arguments, does not imply anincrease in the quantity of currencies traded, whereas ourdiscussion here does.& 128wheat imports. It follows that at the same exchangerate the supply of pounds is 25 percent higher afterinflation than before inflation. This is due to anunchanged quantity of imports and a 25 percenthigher price. That is, the supply curve of pounds isshifted 25 percent to the right at every exchangerate. This is shown in Figure 6.7b, where S £ (P 1 )isata 25 percent higher quantity of pounds at eachexchange rate.Considering the demand for pounds, we notethat, as before, oil exports are the same afterinflation as before inflation if the pound price of oilis 25 percent higher. This was seen in Figure 6.6.With the dollar price of oil increasing 25 percent,the pound price of oil increases 25 percent with anunchanged exchange rate. That is, at the sameexchange rate the pound price of oil is 25 percenthigher and the quantity of oil exported is unchanged.This means that at the same exchange ratethe quantity of pounds demanded to pay for oil is25 percent higher after inflation than before. Wediscover that inflation in Britain and the UnitedStates shifts D £ to the right by the rate of inflation.That is, at each exchange rate in Figure 6.7b,D £ (P 1 ), the demand curve for pounds after inflation,is at a 25 percent higher quantity of poundsthan D £ (P 0 ), the demand curve for pounds beforeinflation.Comparing the two equilibria in Figure 6.7b, wesee that when inflation occurs at the same rate inBritain and the United States, the exchange rateremains unchanged. This contrasts with the conclusionin Figure 6.7a where inflation in Britainalone causes the pound to depreciate by the rate ofinflation. What is similar in the two equilibria is thatthe quantity of currency traded is the same. That is,whether it is just Britain with 25 percent inflation,or Britain plus the United States with 25 percentinflation, the quantity of pounds exchanged growsby 25 percent. 77 The conclusion, that with both countries having the sameinflation the exchange rate does not change, also followsfrom PPP. However, PPP does not make predictions aboutthe quantity of currency that is exchanged.
SUPPLY-AND-DEMAND VIEW OF EXCHANGE RATESMore generally, the above analysis can beextended to show that a country’s exchange ratedepreciates by the extent that the country’sinflationexceeds that of other countries. Of course, thisassumes all other factors affecting exchange ratesare unchanged.We know from the description of the balanceof-paymentsaccount in Chapter 5 that there aremany factors behind the supply and demand curvesfor a country’s currency in addition to terms oftrade, inflation and the other factors which affectthe value of merchandise imports and exports. Letus consider how these other factors influenceexchange rates by examining how they shiftthe supply and demand curves for pounds inFigure 6.3.Service trade, income flows, and transfersImports and exports of services such as tourism,banking, consulting, engineering, and so on,respond to exchange rates in the same way asimports and exports of merchandise. Therefore,the currency supply and demand curves derivedfrom international trade in these services look likethose in Figure 6.3. The currency supply curvefrom importing services can be added to that dueto importing merchandise, and the currencydemand curve from exporting services can beadded to that from exporting merchandise. Thishas the effect of shifting both S £ and D £ in Figure6.3totheright.Wecanthinkofthecurrencysupply and demand curves for imports andexportsofservicesasbeing‘‘horizontally added’’to the currency supply and demand curves fromimports and exports of merchandise. Horizontaladdition involves the addition of quantitiesdemanded and supplied at each price, and theplotting of the resulting quantities against theprices at which they occur. With supply anddemand curves for currencies from servicessloping the same way as currency supply anddemand curves from merchandise, the horizontallyadded curves slope the same direction as thecomponent curves.If exports of services exceed imports ofservices, then the currency demand curve, D £ ,isshifted to the right more than the currency supplycurve, S £ , from the inclusion of services. Therefore,the exchange rate is higher than in Figure 6.3.On the other hand, if imports of services exceedexports of services, then the currency supply curveis shifted to the right more than the demand curve.Therefore, the exchange rate is lower than inFigure 6.3.The supply and demand for a currency frompayments and receipts of interest, dividends, rents,and profits do not respond to exchange rates or toother influences in the same manner as the currencysupply and demand from merchandise or services.Income payments and receipts are largely determinedby past investments and the rates of return onthese investments. Therefore, we might considerincome payments and receipts as being independentof exchange rates. 8 However, as in the case ofconsidering the effect of services, we can simply addthe value of income from investments to the currencydemand curve, and the value of debt serviceand similar payments to the supply curve. If thevalues of investment income and payments areindependent of the exchange rate, the addition ofthese items to the currency supply and demandcurves involves simple parallel rightward shifts ofthe curves. It should be apparent that the higher isforeign investment income relative to payments,the higher is the exchange rate. It follows that ceterisparibus, the more a country’s residents have investedabroad in the past and the less they have borrowed,the higher is the country’s exchange rate. Countriesthat have incurred lots of debt, ceteris paribus, havelower exchange rates. In addition, high globalinterest rates are good for net creditor countries –those with more overseas investments than debts.8 Exchange rates do affect the domestic-currency value ofa given amount of foreign-currency receipts or foreigncurrencypayments. However, this is an effect of translatingforeign currency into domestic currency, and is different fromthe effects of exchange rates on merchandise and serviceswhich result from changes in amounts bought and sold.129 &
THE DETERMINATION OF EXCHANGE RATESHigh global interest rates are bad for net debtorcountries. 9Transfers can easily be accommodated in thesupply-and-demand model of exchange rates. Weadd the amount of transfers received from abroad toa currency’s demand curve and the amount sentabroad to the supply curve. Clearly, ceteris paribus,net inflows of transfers tend to increase the value ofa currency and net outflows tend to reduce it.Transfers depend on a country’s need for help or itsability to help others. Transfers also depend on thenumber of residents sending funds to relativesabroad or receiving funds from relatives abroad.Foreign investmentForeign investment in a country represents ademand for the country’s currency when thatinvestment occurs. 10 Therefore, foreign investmentin a country, whether it be direct investment,portfolio investment, or additions to bank depositsof nonresidents, shifts the demand curve for thecountry’s currency to the right. Similarly, investmentabroad by a country’s residents represents asupply of the country’s currency and shifts thecurrency supply curve to the right. Therefore,ceteris paribus, net inflows of investment tend toincrease the foreign exchange value of a country’scurrency, and net outflows tend to reduce it. Theamount of investment flowing into or out of acountry depends on rates of return in the countryrelative to rates of return elsewhere, as well ason relative risks. Ceteris paribus, increases in acountry’s interest rates or expected dividends causean increase in demand for that country’s currencyfrom increased foreign investment, and a decreasein supply of that country’s currency from a decrease9 By high or low global interest rates we are referring to ratesaround the world, not to interest rates in one countryversus another. As we explain in the next section, relativeinterest rates affect exchange rates by affecting the flows offinancial capital between countries.10 In all future periods when interest or dividends are paid, orprofits and rents are repatriated, there is a supply of thecountry’s currency.& 130in residents’ investment abroad. Consequently,increases in interest rates or expected dividendstend to cause a currency to appreciate, and viceversa. Similarly, for given interest rates andexpected dividends, an expected appreciation ofa country’s currency increases the attractiveness ofinvestments in that country and thereby causes thecountry’s currency to appreciate. That is, expectedfuture appreciation of a currency causes the currencyto increase in value, just as with other assets:expectations are generally self-fulfilling.All the conclusions we have reached haveassumed that the demand curve for a currency slopesdownward and the supply curve slopes upward. It istime to show why this assumption may not be valid.In particular, it is time to see why the supply curveof a currency may slope downward, and what thisimplies for exchange rates. We shall focus on theimplications for stability of exchange rates.THE STABILITY OF EXCHANGE RATESThe conditions required for instabilityThe supply curve for pounds, S £ , is derived from theBritish demand for imports. Figure 6.8a shows twodemand curves for imports. The import demandcurve labeled D m UK (Z m > 1) is the same importdemand curve drawn in Figure 6.1a. It is labeledwith Z m > 1 in parentheses because it is an elasticimport demand curve. That is, when the price ofimports falls, the quantity of imports increases bya greater percentage than the price declines; thedemand elasticity exceeds 1.0. The currency supplycurve derived from D m UK (Z m > 1) is S £ (Z m > 1).This is the same supply curve of pounds as in Figure6.1b. The currency supply curve obtained from anelastic demand for imports is seen to slope upward.Figure 6.8a shows an inelastic demand curve forimports, D m UK (Z m < 1). It is inelastic because areduction in the price of imports causes a smallerpercentage increase in the quantity of importsdemanded than the percentage reduction in price.We can derive the supply curve of pounds that isassociated with the inelastic import demand curve
SUPPLY-AND-DEMAND VIEW OF EXCHANGE RATES2.5 3.0Price of wheat (pounds)2.01.51.0ABCD UK (η m 1)Exchange rate ($/£)2.52.01.51.0S £ (η m >1)CBAS £ (η m 1, the supply curve of the currency is upward sloping. When thedemand is inelastic, that is, j Z m j < 1, the supply curve of the currency is downward sloping. The downward slope occursbecause depreciation raises import prices and reduces the quantity of imports, but the value of imports increases. Thisoccurs when the percentage reduction in quantity imported is less than the percentage increase in the price of imports.by doing the same as before. That is, we consider anumber of possible exchange rates, compute theprice and quantity of imports at each of theseexchange rates, and then plot the values of imports(which is price multiplied by quantity) against theassociated exchange rates; recall that it is the value ofimports that is the quantity of currency supplied. Letus do this, and again assume that the given worldprice of wheat is $3/bushel.At an exchange rate of $1.5/£ the pound price ofwheat is $3 $1.5/£ ¼ £2.0/bushel, and accordingto the inelastic demand curve D m UK (Z m < 1), Britainimports 1.5 billion bushels at this price, point A inFigure 6.8a. The quantity of pounds supplied, whichequals the value of imports, is therefore £3 billion(£2/bushel 1.5 billion bushels) at the exchangerate $1.5/£. This gives point A 0 in Figure 6.8b.At $1.7/£ wheat costs $3 $1.7/£ ¼ £1.76and Britain imports 1.6 billion bushels, point B inFigure 6.8a. Therefore, the quantity of pounds suppliedper year at the exchange rate $1.7/£ is £2.82billion (£1.76/bushel 1.6 billion bushels), point B 0in Figure 6.8b. Similarly, at $2/£ wheat costs$3 $2/£ ¼ £1.5/bushel. At this price Britainimports 1.7 billion bushels per year, point C in Figure6.8a. Therefore, the quantity of pounds supplied peryear at the exchange rate $2/£ is £2.55 billion (£1.5/bushel 1.7 billion bushels). This gives point C 0 inFigure 6.8b. We find that when the demand forimports is inelastic, the supply curve of the country’scurrency slopes downward. Yes, it is possible to havea downward-sloping supply curve for a currency,something we are not likely to encounter anywhereelse. 11 What happens is that when demand is inelasticthe amount spent on a product decreases withdecreases in the price of the product. The price ofimports decreases with increases in the foreignexchange value of the importer’s currency. Therefore,when the demand for imports is inelastic, thehigher is the foreign exchange value of a country’scurrency, the lower is the price of imports, the less isspent on imports, and so the lower is the quantity of11 The reason we can have downward-sloping supply curvesfor currencies and not for other things is that for currencieswe plot values (price quantity) on the horizontal axis,whereas we normally plot just the quantity.131 &
THE DETERMINATION OF EXCHANGE RATESExchange rate ($/£)S e ($/£)S £D £Exchange rate ($/£)S e ($/£)S £D £Quantity of pounds/year(a) Unstable marketQuantity of pounds/year(b) Stable market& Figure 6.9 Stability of foreign exchange marketsNotesWhen the currency supply curve slopes downward, foreign exchange markets may be unstable. They are unstable if thecurrency demand curve is steeper than the supply curve, that is, the demand curve cuts the supply curve from abovewhen going down along the demand curve.the country’s currency supplied. We discover that allwe need for a downward-sloping currency supplycurve is inelastic import demand. This could easilyoccur. For example, it is generally felt that when theprice of oil falls due to an appreciation of a country’scurrency, the quantity of oil demanded and importedincreases less than the percent decline in the price,that is, the demand for oil is inelastic. Let us nowconsider the consequences of an inelastic demand forimports and the associated downward-sloping currencysupply curve for the stability of exchange rates.Figure 6.9 shows two situations in which thecurrency supply curve slopes downward. In thesituation in Figure 6.9a the demand curve forpounds is steeper than the supply curve, but inFigure 6.9b the situation is the reverse. Let usconsider the stability of the exchange rate in Figures6.9a and b by allowing the exchange rate to deviateslightly from its equilibrium S e ($/£) where thesupply and demand curves intersect. In particular,let us consider whether market forces are likely topush the exchange rate back to equilibrium when itis disturbed from equilibrium.In Figure 6.9a a small decline in the exchangerate below equilibrium will result in an excesssupply of pounds: at rates below S e ($/£) thequantity of pounds supplied exceeds the quantity& 132demanded. This will push the value of the poundeven lower. This will cause an even larger excesssupply, and so on. Similarly, in Figure 6.9a a smallincrease in the exchange rate above equilibriumwill result in an excess demand for pounds. This willpush the value of the pound even higher, cause aneven larger excess demand, and so on. We find thatthe equilibrium exchange rate in Figure 6.9a isunstable. Small shocks to exchange rates can resultin substantial movements in exchange rates fromequilibrium when the demand and supply curves fora currency have the configuration in Figure 6.9a.Figure 6.9b has a downward-sloping supplycurve of pounds just as in Figure 6.9a, but here thedemand curve for pounds is flatter than the supplycurve. In this case a small decline in the value of thepound below the equilibrium exchange rate S e ($/£)causes an excess demand for pounds: at rates belowS e ($/£) the quantity of pounds demanded exceedsthe quantity supplied. This pushes the exchange rateback up to equilibrium. Similarly, a small increase inthe exchange rate above the equilibrium causes anexcess supply of pounds. This pushes the exchangerate back down to equilibrium. The equilibrium inFigure 6.9b is therefore stable.Consideration of Figures 6.9a and b allows us toconclude that having a downward-sloping currency
SUPPLY-AND-DEMAND VIEW OF EXCHANGE RATESsupply curve is necessary but not sufficient to causean unstable foreign exchange market. A relativelyflat or elastic currency demand curve can offset thedestabilizing nature of a downward-sloping supplycurve. For an unstable market it is necessary to havea downward-sloping currency supply curve – whichwe recall requires inelastic demand for imports –and a relatively steep or inelastic currency demandcurve. A sufficient condition for instability is that thesupply curve slopes downward and the demand curveis steeper at equilibrium than the supply curve.A more precise statement of the condition forstability of the foreign exchange market is derivedin Appendix A. This condition is known as theMarshall-Lerner condition and is stated directlyin terms of the import and export elasticities ofdemand, which are determinants of the slopes ofthe currency supply and demand curves.Unstable exchange rates andthe balance of tradeBecause there have been times when exchange rateshave been extremely volatile, the conditions for anunstable foreign exchange market are of considerableinterest. Therefore, we should not leave thematter until we have an intuitive understanding ofthese conditions. Such an understanding can beobtained by examining how exchange rates affectthe balance of trade.A depreciation of a country’s currency increasesthe price of imports in terms of domestic currency.This reduces the quantity of imports, but does notnecessarily reduce the value of imports. If importdemand is inelastic, the higher price of imports morethan offsets the lower quantity, so that the value ofimports is higher. This means that if import demandis inelastic, depreciation can worsen the balance oftrade (recall that the balance of trade is the value ofexports minus the value of imports). However, evenwhen more is spent on imports after depreciation,the balance of trade is not necessarily worsened. This isbecause depreciation makes exports cheaper in termsof foreign currency, and this increases the quantityexported. The value of exports unambiguouslyincreases along with the quantity of exports becauseexports are not made cheaper in domestic currency.Indeed, if anything the stronger demand for exportsafter depreciation can cause an increase in domesticcurrencyprices of exports. It follows that evenif depreciation increases the value of imports, thebalance of trade is worsened only if the value ofexports increases less than the value of imports.The preceding argument can be directly relatedto Figure 6.9. If import demand is inelastic, adepreciation of the pound, which is a movementdown the vertical axis, causes an increase in thevalue of British imports and hence in the quantity ofpounds supplied; the pound supply curve slopesdownward. This on its own does not causeinstability, for the same reason it does not necessarilyworsen the balance of trade, namely, that thedepreciation also increases the value of exports andhence the quantity of pounds demanded. The foreignexchange market is unstable only if the value ofexports does not increase sufficiently to compensatefor inelastic import demand, just as depreciationworsens the balance of trade only if the value ofexports does not sufficiently increase to compensatefor the increase in the value of imports.SHORT-RUN VERSUS LONG-RUN TRADEELASTICITIES AND THE J CURVEA worsening of the balance of trade following adepreciation of a currency may be temporary.Similarly, instability in exchange rates may be onlya short-run problem. Because the consequences ofthe trade balance worsening with depreciation andof exchange-rate instability are more serious if theypersist, it is worthwhile considering why they maybe temporary problems. Our consideration leads usto the J curve. The J curve has taken on suchimportance since the second half of the 1980s that ithas moved out of the textbooks into the columns ofthe popular press.It takes time for people to adjust their preferencestowards substitutes. Therefore, it is generally believedthat demand is more inelastic in the short run than inthe long run. This belief is particularly strong for the133 &
THE DETERMINATION OF EXCHANGE RATES+ +Change in balance of tradeChange in balance of trade0 0TimeTime– –(a) After depreciation(b) After appreciation& Figure 6.10 The J curveNotesThe J curve describes the balance of trade after a depreciation or appreciation. The time path of the trade balance lookslike a J if the elasticities of demand for imports and supply of exports are smaller in the short run than the long run.elasticity of demand for imports, because the demandcurve for imports is derived from the differencebetween the demand curve for a product in a countryand the domestic supply curve of the product; withboth supply and demand more inelastic in the shortrun than the long run, the difference between supplyand demand is afortiorimore inelastic in the short run.That is, after a depreciation and consequent increase inimport prices, a country’s residents might continue tobuy imports both because they have not adjusted theirpreferences towards domestically produced substitutes(an inelastic demand curve) and because thedomestic substitutes have not yet been produced (aninelastic domestic supply curve). Only after producersbegin to supply what was previously imported andafter consumers decide to buy import substitutescan import demand fully decline after a depreciation.Similarly, exports expand from a depreciation onlyafter suppliers are able to produce more for exportand after foreign consumers switch to these products.If import demand and export supply are moreinelastic in the short run than the long run, we mayfind a depreciation worsening the balance of trade in& 134the short run, but subsequently improving it. Thatis, the time path of changes in the balance of trademight look like that shown in Figure 6.10a. 12 Thefigure assumes that depreciation occurs at time 0,and that because people temporarily spend more onimports, and because exports do not sufficientlyincrease, the trade balance worsens immediatelyafter the depreciation. Only later, when import andexport elasticities increase, does the balance oftrade turn around and eventually improve. Becauseof the shape of the time path followed by the tradebalance in Figure 6.10a, the phenomenon of aninitial worsening and subsequent improvement ofthe trade balance after a depreciation is known asthe J-curve effect.12 For a further discussion of the time path see MichaelH. Moffett, ‘‘The J-Curve Revisited: An EmpiricalExamination for the United States,’’ Journal of<strong>International</strong> Money and <strong>Finance</strong>, September 1989,pp. 425–44, and David K. Backus, Patrick J. Kehoe, andFinn E. Kydland, ‘‘Dynamics of the Trade Balance and theTerms of Trade: The J-Curve?,’’ American Economic Review,March 1994, pp. 84–103.
SUPPLY-AND-DEMAND VIEW OF EXCHANGE RATESFigure 6.10b shows what might happen after anappreciation of the exchange rate if imports andexports are more inelastic in the short run than inthe long run. The figure shows that after anappreciation at time 0, the associated decline inimport prices could reduce spending on imports.If the value of exports does not decrease as much asthe value of imports declines, the balance of tradewill improve from the currency appreciation – notwhat one would normally expect. However, overtime, as import and export demand become moreelastic, the quantity of imports increases more thanthe price declines, and/or exports decrease sufficientlyfor the balance of trade to worsen. In thecase of an appreciation we find that the balance oftrade follows the path of an inverted J. What wehave shown is that the J curve occurs under the sameconditions as instability of exchange rates in theshort run but stability in the long run. Whenimports and exports are sufficiently inelastic in theshort run, we have both unstable exchange ratesand a temporary worsening/improvement of thebalance of trade after a currency depreciation/appreciation, and when the trade balance turnsaround, stability returns to foreign exchangemarkets.Before leaving the question of the J curve andinstability of exchange rates, we should make itclear that foreign exchange markets can be stableeven if imports and exports are extremely inelastic.This is because there are numerous other reasons forsupplying or demanding a currency. For example,currency speculators might buy a currency duringthe downward-sloping period of the J curve if theythink the currency will eventually move back upagain as the trade balance improves. This demandfrom speculators makes the demand curve for acurrency flatter (more elastic) than from consideringthe demand for the currency only by the buyersof the country’s exports. 13 On the other hand, theJ-curve effect which relates to the balance of trade,is not obviated by currency speculators, so that wecan have stable foreign exchange markets coexistingwith a J curve.SUMMARY1 Flexible exchange rates are determined by the forces of currency supply and demand.2 We can construct the supply curve of a currency from a country’s demand curve forimports, and the demand curve for a currency from the country’s supply curve of exports.3 The effect of any item in the balance-of-payments account on the exchange rate can bedetermined by identifying how it shifts the currency supply or currency demand curve.4 Ceteris paribus, an improvement in a country’s terms of trade causes the country’scurrency to appreciate.5 Inflation that is higher than in other countries causes a country’s currency to depreciate.If inflation in different countries is equal, ceteris paribus, exchange rates do not change.6 If import demand is inelastic the currency supply curve slopes downward. This is becausedepreciation raises the price of imports in domestic currency more than it reduces thequantity of imports. In this way depreciation increases the value of imports, meaninga downward-sloping supply curve of the currency.7 When the supply curve slopes downward the foreign exchange market may be unstable.Instability occurs when the currency demand curve is steeper than the downward-slopingsupply curve.13 The question of whether speculators are likely to stabilize or destabilize exchange rates is addressed in Chapter 23.135 &
THE DETERMINATION OF EXCHANGE RATES8 Because import demand elasticities are smaller in the short run than in the long run,instability is more likely in the short run than the long run.9 The same conditions that cause short-run instability and long-run stability result in aJ curve. The J curve shows that a depreciation can temporarily worsen the balance oftrade, while an appreciation can temporarily improve the balance of trade.REVIEW QUESTIONS1 Does currency supply depend on the quantity or on the value of imports?2 Under what condition does the value of imports vary in the opposite direction to thequantity of imports when exchange rates change?3 Does currency demand depend on the quantity or on the value of exports?4 Why does the value of exports always vary in the same directions as the quantity ofexports when exchange rates change?5 Why does inflation shift up a country’s supply curve of a product in proportion toinflation? Does the explanation have to do with the fact that a firm’s supply curve is thefirm’s marginal cost, MC, curve?6 Why does inflation shift up a country’s demand curve for a product in proportion toinflation? Does the explanation have to do with inflation raising all prices and incomes,leaving relative prices and real incomes unchanged?7 How does a country’s demand curve for imports relate to the country’s demand curve forthe good and its supply curve of the good?8 Is a downward-sloping currency supply curve a necessary or sufficient condition forunstable exchange rates?9 What is the J curve?10 How does the J curve depend on short-run versus long-run elasticities of import demand?ASSIGNMENT PROBLEMS1 Assume that the foreign-currency amount of interest and dividend earnings from abroadis fixed. Show how the horizontal addition of interest and dividend earnings to acurrency’s demand curve will appear when consideration is given to the effect ofexchange rates on the translated values of these earnings.2 Are debt-service imports as likely to be affected by exchange rates as are debt-serviceexports? (Hint: It depends on the currency of denomination of debt-service earnings andpayments.)3 What is the slope of the currency supply curve when the demand for imports isunit-elastic, that is, equal to 1.0?4 What is the intuitive explanation for the fact that a decrease in demand for a currency cancause it to appreciate if import and export demand are sufficiently inelastic?5 How can speculators cause the foreign exchange market to be stable even when theeconomy is moving along the downward-sloping part of a J curve?& 136
SUPPLY-AND-DEMAND VIEW OF EXCHANGE RATES6 Why is the import demand curve likely to be more elastic in the long run than in the shortrun?7 Why are exports likely to be more elastic in the long run than in the short run?8 Does only the equilibrium exchange rate change with inflation, or is the quantity ofcurrency traded also affected, and if so, why?BIBLIOGRAPHYAlexander, Sidney S., ‘‘The Effects of a Devaluation on the Trade Balance,’’ IMF Staff Papers, April 1952,pp. 263–78. Reprinted in Richard E. Caves and Harry G. Johnson (eds), AEA Readings in <strong>International</strong>Economics, Richard D. Irwin, Homewood, IL, 1968.Haberler, Gottfried, ‘‘The Market for Foreign Exchange and the Stability of the Balance of Payments: A TheoreticalAnalysis,’’ Kyklos, Fasc. 3, 1949, pp. 193–218. Reprinted in Richard N. Cooper (ed.), <strong>International</strong><strong>Finance</strong>, Penguin, Baltimore, 1969.Heller, H. Robert, <strong>International</strong> Monetary Economics, Prentice-Hall, Englewood Cliffs, NJ, 1974, Chapter 6.McKinnon, Ronald I., ‘‘Money in <strong>International</strong> Exchange: The Convertible Currency System,’’ Oxford UniversityPress, 1979.Mundell, Robert A., <strong>International</strong> Economics, Macmillan, New York, 1968, Chapter 1.Pippenger, John E., Fundamentals of <strong>International</strong> <strong>Finance</strong>, Prentice-Hall, Englewood Cliffs, NJ, 1984,Chapter 5.APPENDIX AStability in foreign exchange marketsLet us consider the stability of S($/£), assuming for simplicity that the only two countries in the world are the UnitedStates and the United Kingdom, and that there are no capital flows. Under these assumptions, the quantity of poundsdemanded is equal to the value of British exports. We can write this as p x Q x (S p x ) where p x is the pound price ofBritish exports and Q x (S p x ) is the quantity of British exports. That is, the value of pounds demanded is the price ofexports multiplied by the quantity of exports. [We put (S p x ) in the parentheses to signify that Q x depends on(S p x ), which is the dollar price of British exports; S is short for the spot rate, S($/£). It is the dollar price that isrelevant to the US buyer of British exports.]The quantity of pounds supplied is equal to the value of British imports. We can write this as (p m /S) Q m (p m /S)where p m is the US dollar price of British imports and Q m (p m /S) is the quantity of British imports. That is, the value ofpounds supplied is the pound price of imports (p m /S) multiplied by the quantity of British imports, where the term inparentheses in Q m (p m /S) signifies that the quantity of imports depends on p m /S [Recall that since S is the exchangerate S($/£), dividing by S puts the dollar price of imports into British pounds. It is the pound price of British imports,p m /S, that is relevant to the British buyer, and which hence determines the quantity of imports into Britain.].We can write the excess demand for pounds, E, asE ¼ p x Q x ðS p x ÞpmS Q pmmSð6A.1ÞThat is, the excess demand for pounds is the value of pounds demanded minus the value supplied. If we assumea perfectly elastic supply of exports and imports then we can assume that p x and p m remain unchanged as137 &
THE DETERMINATION OF EXCHANGE RATESthe quantities of exports and imports vary with the exchange rate. 14 With this assumption we can differentiateequation (6A.1) to obtaindEdS ¼ p dQ xx dðSp x Þ dðSp xÞdSp mS dQ mdðp m /SÞ dðp m/SÞdSQ m dðp m/SÞdSordEdS ¼ p dQ xx dðSp x Þ p x þ p mS dQ mdðp m /SÞ p mS 2 þ p mQ mS 2ð6A.2ÞMultiplying and dividing the first two terms on the right-hand side of equation (6A.2) to form elasticities, we havedEdS ¼ Sp x dQ x p xQ xQ x dðSp x Þ S þ p m/S dQ m p mQ mdðp m /SÞ S 2 þ p mQ mS 2ð6A.3ÞQ mWe can define the elasticity of demand for exports, Z x , and the elasticity of demand for imports, Z m , as follows: 15Sp x dQ xp m /S dQ mZ x ¼ and ZQ x dðSp x Þm ¼ Q m dðp m /SÞWe note that these elasticities are defined in terms of the currencies in which buyers are paying for their purchases,that is, exports from Britain are defined in terms of dollar prices, S p x , and imports into Britain are defined in termsof pound prices p m /S. Using these definitions in equation (6A.3) givesdEdS ¼Z x p xQ xSZ m p mQ mS 2þ p mQ mS 2where we have defined the elasticities as positive. If the foreign exchange market started from a position of balance,thenp x Q x ¼ p mQ mSThat is, the pound value of British exports equals the pound value of British imports. This enables us to writedEdS ¼ ðZ x þ Z m 1Þ p xQ xSð6A.4ÞThe stability of the foreign exchange market requires that as the value of the pound goes up (S increases), the excessdemand for pounds must fall (E falls). Similarly, it requires that as the pound falls in value (S goes down), theexcess demand for pounds must rise (E goes up). This means that for stability, E and S must move in oppositedirections (dE/dS < 0). That is, for stability:dEdS ¼ ðZ x þ Z m 1Þ p xQ xS < 0 ð6A.5Þ14 Stability conditions can be derived without assuming perfectly elastic supply of exports and imports, but only at the expense ofconsiderable additional complexity. See Miltiades Chacholiades, Principles of <strong>International</strong> Economics, McGraw-Hill, New York,1981, pp. 386–7, or Joan Robinson, ‘‘The Foreign Exchanges,’’ in Joan Robinson, Essays in the Theory of Employment,Macmillan, London, 1939.15 In this appendix we use the foreign elasticity of demand for exports, whereas in the main text we use the domestic elasticity ofsupply of exports. We can use the foreign elasticity of demand here because we are assuming only two countries. We could haveassumed two countries in the text and then used the two elasticities of demand as we do here. However, the approach in thetext is more general, because it uses the demand for the currency irrespective of who buys the country’s exports.& 138
SUPPLY-AND-DEMAND VIEW OF EXCHANGE RATESWe know that p x Q x /S is positive. Therefore, stability of the foreign exchange market requires thatorZ x þ Z m 1 > 0Z x þ Z m > 1 ð6A.6ÞWe discover that for stability, the average elasticity of demand must exceed 0.5. For exchange-rate instability,Z x þ Z m < 1When Z x þ Z m ¼ 1, the market is metastable, staying wherever it is. The condition (6A.6) is generally known as theMarshall-Lerner condition, after Alfred Marshall and Abba Lerner, who independently discovered it.Because demand elasticities are generally smaller in the short run than in the long run, foreign exchange marketsmight be unstable in the short run, but eventually return to stability. However, if there are speculators whorealize that stability occurs in the long run, the foreign exchange market may be stable in the short run even if theMarshall-Lerner condition does not hold.139 &
Part IIIThe fundamental internationalparity conditionsPart III explains the nature of, and limitations of,two fundamental international financial relationshipsthat between them tie together interestrates, inflation rates, and expected changes inexchange rates. The first of these relationships isthe purchasing-power-parity (PPP) principle whichoccurs in the product markets. It states that, whenmeasured in the same currency, baskets of freelytraded goods and services should cost the sameeverywhere. The second relationship occurs in themoney markets, and states that, after allowance forexchange rates, investment yields and borrowingcosts should be the same whatever the currency ofinvestment or loan. This relationship is known as theinterest-parity principle.Chapter 7 begins by explaining the law of oneprice as it applies to an individual commodity suchas gold or wheat. In this context the law of oneprice states that the dollar cost of a particularcommodity should be equal everywhere. This meansthat when prices are measured in local currency, theratio of, for example, the dollar price of wheat inthe United States and the pound price of wheat inBritain should be the exchange rate of dollars forpounds. If not, commodity arbitrage would occur.We show, however, that shipping costs, tariffs, andquotas can result in deviations from the law of oneprice.Chapter 7 also explains the extension of the law ofone price from an individual commodity to goods andservices in general. The extension gives rise to thePPP principle, which states that the ratio of the dollarprice of a basket of goods and services in the UnitedStates to the pound price of the same basket in Britainshould be the exchange rate of the dollar for thepound.When considered as a relationship over timerather than at a point in time, PPP becomes a linkbetween changes in exchange rates and differencesbetween inflation rates: currencies of countries withrapid inflation will depreciate vis-à-vis currencies ofcountries with slow inflation. Chapter 7 explains thenature of this link, and why it might be and, indeedfrequently is, broken. It is also shown that anotherversion of PPP that involves expectations of exchangerates and inflation can be derived by consideringspeculation.In the context of the money market, which is themarket in which short-term securities are traded,the law of one price states that covered (i.e.hedged) dollar rates of return and dollar costs ofborrowing will be the same whatever the currencyof denomination of the investment or loan. If thiswere not so, there would be interest arbitrage. Thisinvolves borrowing in one currency and lendingin another currency, with foreign exchange riskhedged on the forward exchange market. Therelationship between interest rates and exchangerates whereby it is irrelevant in which currency aperson invests or borrows is called the coveredinterest-parity condition. This condition is explainedin Chapter 8, along with the way that the forward
exchange market can be used to eliminate exchangeraterisk and exposure when engaging in interestarbitrage.The covered interest-parity condition is derivedwith the assumptions that there are no transactioncosts, political risks of investing abroad, taxes whichdepend on the currency of investment or borrowing, orconcerns over the liquidity of investments. Chapter 8describes the effects of dropping these assumptionswhich, as we shall see in later chapters, have bearingon corporate financing decisions and internationalcash management.
Chapter 7The purchasing-power-parityprincipleIt would be too ridiculous to go about seriously to prove that wealth does not consist in money, or ingold and silver; but in what money purchases, and is valuable only for purchasing.Adam SmithOf the many influences on exchange ratesmentioned in Chapter 6, one factor is considered tobe particularly important for explaining currencymovements over the long run. That factor is inflation.In this chapter we examine the theory andthe evidence for a long-run connection betweeninflation and exchange rates. This connectionhas become known as the purchasing-powerparity(PPP) principle. An entire chapter isdevoted to the exploration of this principle becauseit plays an important role in foreign exchange riskand exposure, and many other topics covered in theremainder of this book.The PPP principle, which was popularized byGustav Cassell in the 1920s, is most easilyexplained if we begin by considering the connectionbetween exchange rates and the local-currencyprice of an individual commodity in differentcountries. 1 This connection between exchangerates and commodity prices is known as the law ofone price.1 Gustav Cassell, Money and Foreign Exchange after 1914,Macmillan, London, 1923, and Gustav Cassell, ‘‘AbnormalDeviations in <strong>International</strong> Exchange,’’ Economic Journal,December 1918, pp. 413–15.THE LAW OF ONE PRICEVirtually every opportunity for profit will catch theattention of an attentive individual somewhere inthe world. One type of opportunity that will rarelybe missed is the chance to buy an item in one placeand sell it in another for a profit. For example, if goldor copper was priced at a particular US dollar pricein London and the dollar price was simultaneouslyhigher in New York, people would buy the metal inLondon and ship it to New York for sale. Of course,it takes time to ship physical commodities, and so atany precise moment, dollar prices might differ alittle between markets. Transportation costs are alsoinvolved in attempts to profit from price differences.However, if there is enough of a price differencebetween locations, people will take advantage of itby buying commodities in the cheaper market andthen sell them in the more expensive market. 2People who buy in one market and sell in anotherare commodity arbitragers. Through their2 As we shall mention later, one-way arbitrage argumentswould mitigate the wedge between prices in differentlocations caused by transportation costs. If a buyer faced thesame transportation costs of sourcing a product from twomarkets the prices in the two source locations would bedriven together.143 &
THE FUNDAMENTAL INTERNATIONAL PARITY CONDITIONSactions commodity arbitragers remove anyprofitableopportunitiesthatmayexist.Theyforceupprices in low-cost countries and reduce priceswhere they are high. Normally, arbitragers ceasetheir activities only when all profitable opportunitieshave been exhausted, which means that exceptfor the costs of moving goods from place to place,including any tariffs that might be involved, prices ofthe same product in different markets are equal. 3In fact, prices of commodities should be the samein different countries even if there is no directcommodity arbitrage between countries themselves.This is because outside buyers will select thelowest price. For example, even if it is extremelycostly to arbitrage wheat between Canada andAustralia, the two countries’ prices would need tobe the same; otherwise, outside buyers would buyeverything from the cheaper and none from themore expensive supplier. In other words, shippingcosts between Canada and Australia set only amaximum on the possible price difference betweenthe countries; the actual price difference is generallysmaller than this maximum. For example, ifCanadian and Australian ports used to export wheatare at the same distance from Chinese receivingports so that shipping costs to China from Australiaand Canada are the same, shipping costs betweenCanada and Australia will not result in differentselling prices. Similarly, even when there are tariffs,if they apply equally to potential sources, theycannot cause price differences. In the terminologyof Chapter 2, one-way arbitrage creates a tighterlink between prices in different countries than doestwo-way arbitrage.When prices in different countries are expressedin the same currency, the outcome of commoditymarket arbitrage – that particular commodity pricesare everywhere equal – is easily seen. For example,the dollar prices of an ounce of gold in London,Paris, Frankfurt, Zurich, and New York, certainly ifobserved at the same time with all markets open,are very similar. But what does it mean for arbitrageto ensure that prices are the same when they are in3 We exclude local sales taxes from the price.& 144different foreign currencies? The answer followsfrom the law of one price, which states that in theabsence of frictions such as shipping costs and tariffs,the price of a product when converted into acommon currency such as the US dollar, using thespot exchange rate, is the same in every country. 4For example, because the dollar equivalent of theprice of wheat in Britain is S($/£)p w UK , where pw UK isthe pound price of wheat in Britain, the law of oneprice states thatp w US ¼ Sð$/£Þpw UKð7:1ÞWhen the law of one price does not hold, buyingdecisions help restore the equality.For example, if p w US ¼ $4/bushel, pw UK ¼£2:5/bushel, and S($/£) ¼ 1.70, then the dollarprice of wheat in Britain is $1.70/£ £2.5/bushel ¼ $4.25/bushel. With the US price of $4/bushel, wheat buyers will buy from the US andnot from Britain, forcing up the US price andforcing down the British price until they satisfyequation (7.1).ABSOLUTE (OR STATIC) FORM OFTHE PPP CONDITIONIf equation (7.1) were to hold for each and everygood and service, and we computed the cost of thesame basket of goods and services in Britain and theUnited States, we would expect to find thatP US ¼ Sð$/£ÞP UKð7:2ÞP US and P UK are respectively the costs of the basketof goods and services in the US measured in dollarsand in Britain in pounds. Equation (7.2) is theabsolute (or static) form of the PPP condition.The condition in this form can be rearrangedto give the spot exchange rate in terms of the relativecosts of the basket in the two countries, namely,Sð$/£Þ ¼ P USP UKð7:3Þ4 As we have just said, even in the presence of shipping costsand tariffs, the law of one price might still hold as a result ofone-way arbitrage.
THE PURCHASING-POWER-PARITY PRINCIPLEFor example, if the basket costs $1,000 in theUnited States and £600 in Britain, the exchange rateaccording to equation (7.3) should be $1.67/£.The PPP condition in the absolute form inequation (7.2) or (7.3) offers a very simple explanationfor the level of exchange rates. However, itis difficult to test the validity of PPP in the form ofequation (7.2) or (7.3), because different baskets ofgoods are used in different countries for computingprice indexes. Different baskets are used becausetastes and needs differ between countries, affectingwhat people buy. For example, people in cold,northern countries consume more heating oil andless olive oil than people in more temperate countries.This means that even if the law of one priceholds for each individual good, price indexes, whichdepend on the weights attached to each good, willnot conform to the law of one price. For example, ifheating oil prices increased more than olive oilprices, the country with a bigger weight in its priceindex for heating oil would have a larger price indexincrease than the olive-oil-consuming country, eventhough heating oil and olive oil prices increased thesame amount in both countries. Partly for thisreason, an alternative form of the PPP conditionwhich is stated in terms of rates of inflation can bevery useful. This form is called the relative (ordynamic) form of PPP.THE RELATIVE (OR DYNAMIC)FORM OF PPPIn order to state PPP in its relative (or dynamic)form let us define the following:_S($/£) is the percentage change in the spotexchange rate over a year, and _P US and _P UK arerespectively the percentage annual rates ofchange in the price levels in the United States andBritain. That is, _P US and _P UK are the US andBritish annual rates of inflation.If the PPP condition holds in its absolute form atsome moment in time, that is,P US ¼ Sð$/£ÞP UKð7:2Þthen at the end of 1 year, for PPP to continue tohold it is necessary thatP US ð1 þ _P US Þ¼Sð$/£Þ½1 þ _Sð$/£ÞŠ P UK ð1 þ _P UK Þð7:4ÞThe left-hand side of equation (7.4) is the price levelin the United States after 1 year, written as the USprice level at the beginning of the year, multipliedby 1 plus the US annual rate of inflation. Similarly,the right-hand side of equation (7.4) shows the spotexchange rate at the end of 1 year as the rate at thebeginning of the year multiplied by 1 plus the rate ofchange in the spot exchange rate. This is multipliedby the price level in Britain after 1 year, written asthe price level at the beginning of the year multipliedby 1 plus the British annual rate of inflation.Equation (7.2) is therefore the PPP condition atone point in time and equation (7.4) is the PPPcondition a year later.Taking the ratio of equation (7.4) to equation(7.2) by taking the ratios of the left-hand sides andof the right-hand sides gives by cancelationð1 þ _P US Þ¼½1 þ _Sð$/£ÞŠð1 þ _P UK Þ ð7:5ÞEquation (7.5) can be rearranged intoor1 þ _Sð$/£Þ ¼ 1 þ _P US1 þ _P UK_Sð$/£Þ ¼ 1 þ _P US1 ð7:6Þ1 þ _P UKAlternatively, equation (7.6) can be written as_P UKP_Sð$/£Þ ¼ _ USð7:7Þ1 þ _P UKEquation (7.7) is the PPP condition in its relative(or dynamic) form.To take an example, if the United Statesexperiences inflation of 5 percent (_P US ¼ 0.05) andBritain 10 percent (_P UK ¼ 0.10), then the dollarprice of pounds should fall, that is, the pound should145 &
THE FUNDAMENTAL INTERNATIONAL PARITY CONDITIONSdepreciate at a rate of 4.5 percent, because_P UKP_Sð$/£Þ ¼ _ US 0:05 0:10¼1 þ _P UK 1:10¼ 0:045, or 4:5%If the reverse conditions hold, with the UnitedStates having 10 percent inflation versus 5 percentinflation in Britain, then _S($/£) is positive, andthe pound appreciates in value against the dollar by4.8 percent:0:10 0:05_Sð$/£Þ ¼ ¼ 0:048, or 4:8%1:05Both values are close to the 5 percent obtained fromtaking an approximation of equation (7.7) andwriting instead_Sð$/£Þ ffi_P US _P UK ð7:8ÞWhat the PPP condition in this approximate formsays is that the rate of change in the exchange rateis equal to the difference between the inflationrates.Equation (7.8) is a good approximation ofequation (7.7) when inflation is low. However,when inflation is high, equation (7.8) may be a poorapproximation of equation (7.7). For example,suppose we are interested in the rate of change inthe number of US dollars per British pound whenBritish inflation is 25 percent and US inflation is5 percent. Equation (7.7), the exact PPP formula,implies that_P UKP_Sð$/£Þ ¼ _ US 0:05 0:25¼1 þ _P UK 1:25¼ 0:16, or 16%However, from the approximation based onequation (7.8)_Sð$/£Þ ¼_P US _P UK ¼ 0:05 0:25¼ 0:20, or 20%Higher inflation makes the approximation evenworse. For example, if British inflation was 50 percent;and US inflation 5 percent, then from the& 146precise PPP condition in equation (7.7)_P UKP_Sð$/£Þ ¼ _ US 0:05 0:50¼1 þ _P UK 1:5¼ 0:30, or 30%However, from the approximation_Sð$/£Þ ¼_P US _P UK ¼ 0:05 0:50¼ 0:45, or 45%The approximation of the dynamic PPP implies adepreciation of the pound much larger than does theexact PPP condition.The relative or dynamic form of PPP in equation(7.7), and its approximation in equation (7.8), arenot necessarily violated by sales taxes or shippingcosts that make prices higher than static-form PPPlevels. For example, suppose that because of aBritish value-added tax (VAT) or because of highershipping costs of principal commodity imports toBritain than to the United States, US prices areconsistently lower by the proportion t than Britishprices as given by equation (7.2). That isP US ¼ Sð$/£ÞP UK ð1 tÞ ð7:9ÞEquation (7.9) means that for a given exchange rateand price level in Britain, US prices are only (1 t)of the British level. If the same connection exists1 year later after inflation has occurred and theexchange rate has changed, we haveP US ð1 þ _P US Þ¼Sð$/£Þ½1 þ _Sð$/£ÞŠ P UK ð1 þ _P UK Þð1tÞð7:10ÞTaking the ratio of equation (7.10) to equation (7.9)givesð1 þ _P US Þ¼½1 þ _Sð$/£ÞŠð1 þ _P UK Þ ð7:11Þwhich is exactly the same as equation (7.5). It followsthat equations (7.7) and (7.8), the exact andapproximate forms of relative PPP, are unaffected
THE PURCHASING-POWER-PARITY PRINCIPLEby t. The relative (or dynamic) form of PPP canhold even if the absolute (or static) form of PPP is(consistently) violated.EFFICIENT MARKETS(OR SPECULATIVE) FORM OF PPPThe PPP condition, which we have derived fromarbitrage considerations, can also be derived byconsidering market efficiency arguments involvingthe behavior of speculators. 5 In order to do this letus define the expected level and rate of change of thespot exchange rate, and expected inflation in theUnited States and Britain, as follows:S 1 ($/£) is the expected spot exchange rate in1 year, and _S ($/£) is the expected annual percentchange in the spot exchange rate. _P US and_P UK are respectively the expected annual rates ofinflation in the United States and Britain.Consider a speculator deciding whether to buy andhold the US basket or the British basket. 6After 1 year, each dollar invested in the USbasket will be expected to be worth$ð1 þ _P US Þ ð7:12Þwhere the dollar sign shows this is a dollar amount.This value will be compared to the expected valueof the British basket if it is alternatively bought andheld for 1 year. To calculate this, note that eachdollar invested in the British basket must first beused to buy pounds, providing 71£Sð$/£Þ5 This approach has been suggested by Richard Roll,‘‘Violations of PPP and their Implications for EfficientCommodity Markets,’’ in Marshall Sarnat and GeorgeSzegö (eds), <strong>International</strong> <strong>Finance</strong> and Trade, Ballinger,Cambridge, MA, 1979.6 We assume the basket of goods is nonperishable in thisversion of PPP, or that an index of price levels exists whichcan be traded.7 Again, here and in what follows we put the currency symbolin front of magnitudes to show what they are.The expected value of this basket in pounds at theend of 1 year is1£Sð$/£Þ ð1 þ _P UK ÞThe expected dollar value of this is$ S 1 ð$/£ÞSð$/£Þ ð1 þ _P UK Þð7:13ÞWe can write the identity S 1 ($/£) S($/£) ½1 þ _S ($/£) Š, and using this in (7.13) allowsus to rewrite this as$1þ ½ _S ð$/£ÞŠð1 þ _P UK Þ ð7:14ÞIn an efficient market, and assuming equal risk ofspeculating in the two baskets, the expected dollarpayoffs from holding the British and Americanbaskets must be the same. That isð1 þ _P US Þ¼½ 1 þ _S ð$/£ÞŠð1 þ _P UK Þ ð7:15ÞRearranging equation (7.15) to place _S ($/£) on theleft-hand side_S ð$/£Þ ¼ ð1 þ _P US Þð1 þ _P UK Þ_P UKP1 ¼ _ USð1 þ _P UK Þ ð7:16ÞEquation (7.16) can be approximated by_S ð$/£Þ ffi_P US _P UK ð7:17Þprovided that expected inflation in Britain is not high.Equation (7.16), and the approximate version inequation (7.17), represent the efficient markets(or speculative) form of PPP. While the relativeand the efficient markets form of PPP look verysimilar, they are in fact different. Realized inflationand realized exchange rates may not fit the relativeform of PPP at any particular time, but the efficientmarkets form of PPP should nevertheless still hold.This is because with rational expectations, expectedvalues of variables should on average be equalto realized values. That is, there should be no147 &
THE FUNDAMENTAL INTERNATIONAL PARITY CONDITIONSpersistent biases. 8 This means that if expectationsare rational, then on average _S ($/£); _P US and _P UKshould equal the actual rates of change in thesevariables, so that if equations (7.16) and (7.17)hold, then equations (7.7) and (7.8) also hold, onaverage. Sometimes the change in exchange rateswill exceed the values predicted by realized inflationin the countries, and sometimes the change inexchange rate will be less than predicted. Onaverage over a long period of time the over- andunder-predictions of exchange rate changes shouldcancel. We see that speculation, in conjunction withthe assumption that expectations are rational,means the relative form of PPP holds on average.Unfortunately, PPP does not fit the data verywell, particularly over short intervals of time. This isbecause, as we saw in Part II, there are many factorsother than commodity prices which influenceexchange rates, and these other factors can dominateinflation, at least in the short run. However, ratherthan simply dismiss the PPP condition as an explanationof exchange rates, let us consider the evidencein more detail to see whether there are circumstancesunder which PPP gives useful predictions.THE EMPIRICAL EVIDENCE ON PPPA major problem in testing the validity of the PPPcondition is the need to use accurate price indexesfor the inflation rates for the countries being studied.Price indexes cover many items, and what ishappening to relative prices within an index is notrevealed.In an effort to use as specific a set of prices ascan be obtained and to avoid index-number problems,J. David Richardson considered data onprices of narrowly classified industrial items in theUnited States and Canada. 9 The classifications areas specific as‘‘cement,’’ ‘‘animal feeds,’’ ‘‘bakery8 The lack of bias in expectations if expectations are rationalis one of the conditions of rationality described by JohnF. Muth, ‘‘Rational Expectations and the Theory of PriceMovements,’’ Econometrica, July 1961, pp. 315–35.9 J. David Richardson, ‘‘Some Empirical Evidence onCommodity Arbitrage and the Law of One Price,’’Journal of <strong>International</strong> Economics, May 1978, pp. 341–51.& 148products,’’ ‘‘chewing gum,’’ and ‘‘fertilizers.’’That is, Richardson examined the law of one pricerather than the PPP condition. Clearly, if the law ofone price does not hold between the United Statesand Canada, there is not much hope for the PPPcondition, especially between countries furtherapart and more different in the contents of priceindexes than are these two neighboring countries.Richardson estimated an equation similar to thatin equation (7.7) for several commodity groups, andfound that it did not fit the data well in most commoditycategories. Richardson’s results suggest thateven the law of one price is violated, at least duringthe time period of his study.A possible explanation of Richardson’s resultson the law of one price is the differential pricing ofthe same object in different countries by multinationalfirms. Such differential pricing, with higherprices charged where demand is more inelastic,is predicted by the theory of discriminating monopoly.10 Firms with monopoly power may be able toprevent arbitragers from taking advantage of pricedifferences by withholding supply from any companywhich handles the monopolists’ product andcooperates with arbitragers. 11 This possibility issupported by the observation that where there islittle or no opportunity for price discrimination,as in the case of commodity markets, the law of oneprice does appear to hold in the long run althoughnot in the short run. 12Irving B. Kravis and Richard E. Lipsey extensivelystudied the relationship between inflationrates and exchange rates using different price10 A monopolist that can segment markets charges a higherprice to customers whose demand is relatively priceinsensitive.11 Substantial evidence supports the discriminating monopolyargument. See Peter Isard, ‘‘How Far Can We Push the‘Law of One Price’? ’’ American Economic Review, December1977, pp. 942–8.12 See Aris A. Protopapadakis and Hans R. Stoll, ‘‘The Law ofOne Price in <strong>International</strong> Commodity Markets: AReformulation and Some Formal Tests,’’ Journal of<strong>International</strong> Money and <strong>Finance</strong>, September 1986,pp. 335–60.
THE PURCHASING-POWER-PARITY PRINCIPLEindexes. 13 They used the GNP implicit deflator(which includes prices of all goods and services inthe GNP), the consumer price index, and theproducer price index. They also took care to distinguishbetween goods that enter into internationaltrade (tradable goods) and those that do not (nontradablegoods). They discovered, using these manyprices and price indexes, that there were departuresfrom PPP. They concluded, ‘‘As a matter of generaljudgment we express our opinion that the results donot support the notion of a tightly integratedinternational price structure. The record ...showsthat price levels can move apart sharply withoutrapid correction through arbitrage.’’ 14 They didfind that PPP holds more closely for tradable goodsthan for nontradable goods, but the departuresfrom PPP even over relatively long periods weresubstantial even for traded goods.Hans Genberg concentrated on testing to seewhether PPP holds more precisely when exchangerates are flexible rather than fixed. 15 The mostimportant aspects of his conclusion can be seen bycomparing the two columns in Table 7.1. The tablegives the average deviations, in percentages, froman estimated PPP condition. The estimates showdepartures from PPP for each country with itscombined trading partners. The importance of eachpartner is judged by the share of that partner in thecountry’s export trade. The PPP condition is thenstatistically fitted between the country, for example,Belgium, and the weighted average of itstrading partners. The table shows, for example, thatfor the United States from 1957 to 1976, the actualdifference between the US inflation rate and theinflation rate in its (weighted) trading partnersdiffered from the exchange rate change by, onaverage, 3.8 percent per annum.& Table 7.1 Average absolute deviations fromPPP, in percent1957–66 1957–76United States 1.2 3.8United Kingdom 0.5 3.8Austria 1.3 2.0Belgium 1.4 2.1Denmark 1.3 2.0France 2.5 3.0Germany 1.3 2.7Italy 1.2 5.8Netherlands 0.5 1.7Norway 0.9 2.9Sweden 0.7 1.4Switzerland 0.7 5.8Canada 2.0 3.3Japan 1.9 3.8Average 1.2 3.2NotesThere are larger departures from PPP for the years 1957–76,which include a period of flexible exchange rate. However,this could be because conditions were more volatile duringthe more recent period.Source: Hans Genberg, ‘‘Purchasing Power Parity underFixed and Flexible Exchange Rates,’’ Journal of <strong>International</strong>Economics, North-Holland Publishing Company, May 1978,p. 260.The second column of Table 7.1 includes theflexible-exchange-rate period which began in 1973.We find from the average deviations from PPPgiven at the bottom of the table that the addition ofthe flexible period makes the deviations increase.The implication is that there were greater violationsduring the flexible years, 1973–76. 16Evidence that considers only years of flexibleexchange rates and that is not in agreement withGenberg’s conclusion has been provided by Maurice13 Irving B. Kravis and Richard E. Lipsey, ‘‘Price Behavior inthe Light of Balance of Payments Theories,’’ Journal of<strong>International</strong> Economics, May 1978, pp. 193–246.14 Ibid., p. 216.15 Hans Genberg, ‘‘Purchasing Power Parity under Fixed andFlexible Exchange Rates,’’ Journal of <strong>International</strong> Economics,May 1978, pp. 247–67.16 Genberg also discovered that most of the departures fromPPP resulted from movements in exchange rates ratherthan from changes in price levels. This supportsRichardson’s conclusion. See also Mario Blejer and HansGenberg, ‘‘Permanent and Transitory Shocks to ExchangeRates: Measurement and Implications for PurchasingPower Parity,’’ unpublished manuscript, <strong>International</strong>Monetary Fund, 1981.149 &
THE FUNDAMENTAL INTERNATIONAL PARITY CONDITIONSObstfeld. 17 Using data for the OECD countries overthe 20-year period 1973–93, Obstfeld finds strongevidence for the relative form of PPP. Similar supportfor the principle in this form, but from a very differentdata set, is obtained in the study of German hyperinflationby Jacob Frenkel. 18 Indeed, Frenkel finds thatin general, every 1 percent difference in inflation isassociated with a 1 percent change in the exchangerate, as predicted by PPP. It would be surprisingin the extreme circumstances experienced duringhyperinflation if we did not find agreement with PPP.Niels Thygesen has summarized the results ofa study by the Commission of the European Communities,which set out to discover how long it takesfor inflation rates to restore PPP after exchange rateshave been artificially changed by the government togain competitiveness for exports. 19 The idea is thatdevaluation should raise the rate of inflation untilPPP is restored. This could come about via higherimport prices and consequent wage demands settingoff reactions elsewhere in the economy. Usingeconomic models of Britain and Italy, the studyconcluded that it took 5–6 years for inflation differentialsto restore the PPP condition. However,Thygesen also observed that 75 percent of thereturn to PPP was achieved within 2 years.The question of whether and how long it takesfor exchange rates to return to PPP levels afterdeparting from them concerns reversion to themean. Niso Abuaf and Philippe Jorion directlystudied this issue of reversion using 80 years of data,a period long enough to offer the prospects of seeingif there is a long-run tendency towards parity. 2017 Maurice Obstfeld, ‘‘<strong>International</strong> Currency Experience:New Lessons and Lessons Relearned,’’ Brookings Papers onEconomic Activity, No. 1, 1995, pp. 119–220.18 Jacob A. Frenkel, ‘‘Exchange Rates, Prices and Money:Lessons from the 1920s,’’ American Economic Review, March1980, pp. 235–42.19 Niels Thygesen, ‘‘Inflation and Exchange Rates: Evidenceand Policy Guidelines for the European Community,’’Journal of <strong>International</strong> Economics, May 1978, pp. 301–17.20 Niso Abuaf and Philippe Jorion, ‘‘Purchasing Power Parityin the Long Run,’’ Journal of <strong>Finance</strong>, March 1990,pp. 157–74.& 150They find that in the event of a 50 percentovervaluation of exchange rates relative to PPP, ittakes 3–5 years for the departure to be halved.Another study that examined how long it takesfor PPP to be restored after being disturbed is thatof John Hodgson and Patricia Phelps. 21 They used astatistical model that allows lags and discovered thatdifferential inflation rates precede the change inexchange rates with a lag of up to 18 months. Asimilar conclusion was reached by William Folks, Jr,and Stanley Stansell. 22 Their purpose was to forecastchanges in exchange rates, and they discoveredthat exchange rates do adjust to relative inflationrates, but with a long lag.A conclusion that differs from that of Hodgsonand Phelps and Folks and Stansell was reached byRichard Rogalski and Joseph Vinso. 23 They chose aflexible-exchange-rate period, 1920–24, and studiedrelative inflation for six countries. 24 Rogalskiand Vinso concluded that there is no lag. This, theyclaim, is what is expected in an efficient market,because relative inflation rates are publicly availableinformation and should therefore be reflected inmarket prices such as exchange rates. This questionof efficiency in the spot exchange rate hasbeen tackled by Jacob Frenkel and Michael Mussa,who argue that even if we do observe departuresfrom PPP, this does not imply that foreign exchange21 John A. Hodgson and Patricia Phelps, ‘‘The DistributedImpact of Price-Level Variation on Floating ExchangeRates,’’ Review of Economics and Statistics, February 1975,pp. 58–64.22 William R. Folks, Jr. and Stanley R. Stansell, ‘‘The Use ofDiscriminant Analysis in Forecasting Exchange RateMovements,’’ Journal of <strong>International</strong> Business Studies,Spring 1975, pp. 33–50.23 Richard J. Rogalski and Joseph D. Vinso, ‘‘Price LevelVariations as Predictors of Flexible Exchange Rates,’’Journal of <strong>International</strong> Business Studies, Spring 1977,pp. 71–81.24 This period was also studied by Jacob A. Frenkel, notbecause exchange rates were flexible but becausethe inflationary experience was so extreme. See JacobA. Frenkel, ‘‘Purchasing Power Parity: DoctrinalPerspective and Evidence from the 1920s,’’ Journal of<strong>International</strong> Economics, May 1978, pp. 169–91.
THE PURCHASING-POWER-PARITY PRINCIPLEmarkets are inefficient. Exchange rates, they show,move like stock and bond prices. Indeed, Frenkeland Mussa find average monthly variations inexchange rates to be more pronounced than thevariation of stock prices. 25As we have mentioned, a possible reason fordepartures from PPP is the use of differentweights in different countries’ baskets of goods.This possibility is considered in the careful work ofIrving Kravis et al. (1975). 26 To overcome theproblem of different weights they recalculatedforeign inflation using US weights for all countries’price indexes, rather than own-country weights.They also separated data according to whether theitems were traded or nontraded. Far strongersupport for the PPP condition was found in thecommon-weight inflation data, especially for tradedgoods. However, since the usefulness of PPP forexplaining exchange rates hinges largely on itapplying to broad baskets of goods and usingavailable price indexes based on local consumptionpatterns, we are left to conclude that PPP providesa rather limited description of exchange-rate levelsand changes.Our conclusion to the empirical evidence, thatPPP violations do occur, should come as littlesurprise. Those who travel extensively oftenobserve that PPP does not occur. There are countriesthat travelers view as expensive and others thatare viewed as cheap. For example, Switzerland andJapan are generally viewed as expensive, while Indiaand China are viewed as relatively cheap. Thisindicates, without any formal empirical evidence,that there are departures from PPP, at least inthe absolute or static form. There are two majorreasons we can offer as to why this occurs.25 Jacob Frenkel and Michael Mussa, ‘‘Efficiency of ForeignExchange Markets and Measures of Turbulence,’’ NationalBureau of Economic Research, Working Paper 476,Cambridge, MA, 1981.26 Irving Kravis, Zoltan Kenessey, Alan Heston and RobertSummers, A System of <strong>International</strong> Comparisons of GrossProduct and Purchasing Power, Johns Hopkins University,Baltimore, 1975.REASONS FOR DEPARTURES FROM PPPRestrictions on movement of goodsThe possibility of two-way arbitrage allows prices todiffer between markets by up to the cost of transportation.For example, if it costs $0.50/bushel toship wheat between the United States and Canada,the price difference must exceed $0.50 in eitherdirection before two-way arbitrage occurs. Thismeans a possible deviation from the absolute form ofPPP for wheat that spans $1. In reality, however,competitive pressures for similar prices to buyers inother countries will keep prices in a narrower rangethan would result from two-way arbitrage betweenCanada and the United States. This is the one-wayarbitrage referred to earlier in this chapter.Import tariffs can also cause PPP violations. Ifone country has, for example, a 15-percent importtariff, prices within the country will have to movemore than 15 percent above those in the otherbefore it pays to ship and cover the tariffs that areinvolved. The effect of tariffs is different from theeffect of transportation costs. Tariffs do not have asymmetric effect. As a result of tariffs, price levelscan move higher only in the country which has theimport tariffs.Whether it be transportation costs or tariffs,these factors explain departures from PPP only in itsabsolute or static form. As indicated earlier in thederivation of equation (7.11), when the maximumprice difference from shipping costs and importtariffs has been reached, the PPP principle in itsrelative or dynamic form should explain movementsthrough time that push against the maximum pricedifference. For example, suppose that prices atexisting exchange rates are already 25 percenthigher in one country because of import tariffs ortransportation costs. If that country has an inflationrate that is 10 percent higher than the inflation ratein another country, its exchange rate will have tofall, on the average, by 10 percent to preventcommodity arbitrage.Quotas, which are limits on the amounts of differentcommodities that can be imported, generally151 &
THE FUNDAMENTAL INTERNATIONAL PARITY CONDITIONSmean that price differences can become quitesizable, because commodity arbitragers are limitedin their ability to narrow the gaps. Likeimport tariffs, they provide a reason for persistentdepartures from PPP.Price indexes and nontraded outputsWe have already observed in describing the researchof Irving Kravis and Richard E. Lipsey that many ofthe items that are included in the commonly usedprice indexes do not enter into international trade.We cannot, therefore, invoke the notion of commodityarbitrage to create an equivalent of equation(7.1) for these items. Most difficult to arbitragebetween countries are immovable items such as landand buildings; highly perishable commodities suchas fresh milk, vegetables, eggs, and some fruits; andalso services such as hotel accommodations andrepairs. These ‘‘nontraded’’ items can allow departuresfrom PPP to persist when we measure inflationfrom conventional market-basket price indexes.To some extent, a tendency towards parity evenin nontraded items can be maintained by themovement of the buyers instead of the movement ofthe items themselves. For example, factories andoffice complexes can be located where land and rentare cheap. Vacationers can travel to places whereholidays are less expensive. The movement of buyerstends to keep prices in different countries in linewith each other.The relative prices of traded versus nontradedoutputs will not differ greatly between countries ifproducers within each country can move into theproduction of the nontraded outputs when theirrelative prices increase. Consequently, if comparativeadvantages do not differ significantlybetween nations, the relative prices of traded versusnontraded items will be kept similar betweencountries by the prospective movement of domesticproducers. Therefore, if the prices of traded goodssatisfy PPP, then so should the prices of nontradeditems. However, we do require that the producerscan move between traded and nontraded goods, andthat comparative advantage differences are small.& 152And even when producers can move, price adjustmentcan take a very long time, during whichdepartures from PPP can persist. 27STATISTICAL PROBLEMS OFEVALUATING PPPIt has been suggested that the difficulty findingempirical support for PPP may be due to the statisticalprocedures that have been used. 28 We canindicate the problems with the statistical proceduresby examining the bases for judging empiricalsupport for PPP.Most tests of PPP are based on estimates ofa regression equation that in the context of thedollar–pound exchange rate can be writtenP_Sð$/£Þ t¼ a þ b _ US _P UKþ e t ð7:18Þ1 þ _P UK twhere e is the ex ante regression error and thesubscripts t refer to the time period of observationof the variables. It is argued that if PPP is valid, thenin estimates of equation (7.18), a should be close tozero, b should be close to 1.0, and the ex postregression errors should be small. 29 This is because27 Mario Blejer and Ayre Hillman have provided a formalmodel with the costs of commodity arbitrage allowingtemporary departures from PPP. See their article ‘‘AProposition on Short-Run Departures from the Law of OnePrice: Unanticipated Inflation, Relative Price Dispersion,and Commodity Arbitrage,’’ European Economic Review,January 1982, pp. 51–60.28 The statistical problems have been surveyed by JohnPippenger, ‘‘Arbitrage and Efficient MarketsInterpretations of Purchasing Power Parity: Theory andEvidence,’’ Economic Review, Federal Reserve Bank of SanFrancisco, Winter 1986, pp. 31–48. See also SandraBetton, Maurice D. Levi, and Raman Uppal, ‘‘Index-Induced Errors and Purchasing Power Parity: Bounding thePossible Bias,’’ Journal of <strong>International</strong> Financial Markets,Institutions and Money, 2/3, 1995, pp. 165–179.29 Small errors mean that the equation fits well. The ‘‘goodnessof fit’’ measure that is usually used is the R 2 statistic, whichgives the fraction of the variation in the dependent variable, _S($/£), that is explained by the explanatory variable(s), in this case,(_P US _P UK )/(1 þ _P UK ).
THE PURCHASING-POWER-PARITY PRINCIPLEin such a case the regression equation reduces toequation (7.7). The statistical problems that canresult in incorrect rejection of PPP are:1 Errors in measuring the inflation differential Acharacteristic of the regression methodology isthat errors in the measurement of explanatory(i.e. right-hand) variables bias regressioncoefficients towards zero. 30 This means thatif the inflation differential is poorly measuredbecause different baskets are used in eachcountry, then we could find the estimated b tobe smaller than 1.0 even if the true b is exactlyequal to 1.0. Generally, when the slope coefficientis biased downwards towards zero,the intercept, a, is made positive even if it isreally zero.2 Simultaneous determination of inflation and exchangerates It is another characteristic of theregression methodology that if the direction ofcausation goes from inflation to exchange ratesand vice versa, then failure to use simultaneous-equationmethods biases coefficientssuch as b, again usually towards zero. 31 Inthe case of PPP, causation does go both waysbecause changes in exchange rates affectinflation and inflation affects exchange rates.Neither side of the regression equation ispredetermined, an essential characteristicrequired to avoid coefficient bias.As mentioned, researchers who have tried toovercome the statistical problems, and who haveconsidered inflation versus exchange rates over longtime periods, have tended to support PPP. Forexample, by considering only the long-term trendswhich remain after removing ‘‘noise’’ in the data,Mark Rush and Steven Husted have shown that PPPholds for the US dollar versus other currencies. 32The Rush and Husted results indirectly support theview that departures from PPP are due to poormeasurement of inflation: long-term trends shouldreduce or remove the unsystematic errors in calculatinginflation because the errors should averageout and become relatively less important as theinterval of measurement increases. Further supportfor the view that data errors are responsible forrejection of PPP is provided by Craig Hakkio whoreduced the possible problem of poor inflationmeasurement by considering many countries concurrentlyover many periods. 33 This reduces therole of measurement errors by reducing the role ofany one variable containing unsystematic errors.Hakkio is unable to reject PPP.Further indication that errors in the inflationvariable may be responsible for poor support forPPP is found in tests using cointegration techniques,which involve studying the differencesbetween two variables versus the variables themselves.The basic intuition behind the cointegrationmethod is that if two economic variables movetogether, then differences between them should bemore stable than the original series. This means thatif the spot exchange rate and the inflation differentialdo move together according to long-run PPP,then even though the two series may temporarilymove apart, they must move back eventuallythrough their cointegration. The cointegratingcoefficient, which is the equivalent to b in equation(7.18), should equal unity if PPP holds.Yoonbai Kim has applied cointegration methodsto the PPP relationship of the US dollar versus the30 See Maurice D. Levi, ‘‘Errors in the Variables Bias in thePresence of Correctly Measured Variables,’’ Econometrica,September 1973, pp. 985–6, and Maurice D. Levi,‘‘Measurement Errors and Bounded OLS Estimates,’’Journal of Econometrics, September 1977, pp. 165–71.31 This bias exists if common factors affect(_P US _P UK )/(1 þ _P UK ) and S($/£). See Maurice D.Levi, ‘‘World-Wide Effects and Import Elasticities,’’Journal of <strong>International</strong> Economics, May 1976, pp. 203–14.32 See Mark Rush and Steven Husted, ‘‘Purchasing PowerParity in the Long Run,’’ Canadian Journal of Economics,February 1985, pp. 137–45.33 Craig S. Hakkio, ‘‘A Re-examination of Purchasing PowerParity: A Multi-Country and Multi-Period Study,’’ Journalof <strong>International</strong> Economics, November 1984, pp. 265–77. Seealso Yoonbai Kim, ‘‘Purchasing Power Parity in the Long-Run: A Cointegration Approach,’’ Journal of Money, Creditand Banking, November, 1990, pp. 491–503.153 &
THE FUNDAMENTAL INTERNATIONAL PARITY CONDITIONS180160140Mexican inflation minus US inflationPercent change in pesos per dollarPercentage change12010080604020–20–40–60–801986 1991 1996 2001& Figure 7.1 US–Mexican inflation and the peso–dollar exchange rateNotesThe dotted line plots the percentage change in the spot rate of pesos per dollar, while the solid line shows Mexicaninflation minus US inflation. The ups and downs of these series show that while the two series are different, they moveclosely enough together to provide casual support for PPP.Source: <strong>International</strong> Financial Statistics, <strong>International</strong> Monetary Fund, Washington, DC.currencies of Britain, France, Italy, Japan, andCanada. 34 He used annual data and found supportfor PPP using both consumer price indexes andwholesale price indexes in all cases except forCanada. Robert McNown and Myles Wallace havealso applied cointegration techniques, focusing onthe situation for countries with very high inflationrates. 35 This is a potentially fruitful context becausethe extreme values of changes in exchange rates andinflation differentials should minimize statisticalproblems such as the use of incorrectly constructedindexes. McNown and Wallace studied Israel,Argentina, Brazil, and Chile, all of which have hadperiods of very high inflation as well as periods of34 See Yoonbai Kim, op. cit.35 See Robert McNown and Myles S. Wallace, ‘‘National PriceLevels, Purchasing Power Parity and Cointegration: A Testof Four High Inflation Economies,’’ Journal of <strong>International</strong>Money and <strong>Finance</strong>, December 1989, pp. 533–46.& 154modest inflation. The estimates of cointegrationcoefficients were not significantly different fromunity as hypothesized according to long-run PPP.Casual support for PPP involving a country whichhas had periods of high inflation is provided by a simpleplot of the spot rate between the Mexican peso and theUS dollar versus the inflation differential betweenthese countries. This is shown in Figure 7.1 for aperiod when Mexican inflation and the peso–dollarexchange rate varied widely. While the time paths ofthe two series do not track each other exactly fromyear to year, the overall correspondence is quite clear.THE PRACTICAL IMPORTANCE OF PPPIt might seem that failure of PPP to hold wouldreduce its practical relevance. After all, it wouldthen be of little use in helping to forecast exchange
THE PURCHASING-POWER-PARITY PRINCIPLErates. In fact, the very opposite is true about PPPdeviations. Knowing whether PPP holds, andknowing whether it holds more-or-less continuouslyor only on average over many years, isimportant in international managerial decisions. Forexample, if it is known that PPP is systematicallyviolated and that these violations are unlikely to becorrected for a long or indefinite period of time,this knowledge can direct production decisions.Plants can be located where costs are lowest as wellas on the basis of comparative advantage. Thisinvolves studying the costs in different locations todetermine which currency is undervalued mostrelative to its PPP value, and where reversion islikely to be the slowest. On the other hand, if PPPholds more-or-less continuously, the only reasonfor choosing one production location over anotheris comparative advantage.If PPP departures occur, but these are correctedover time, knowledge of how long suchcorrections might take is useful for determiningwhether it is worthwhile exploiting the temporarydepartures. Companies for which start-up andshut-down of activities is easiest will have themost to gain from paying attention to the behaviorof PPP.SUMMARY1 The law of one price states that a commodity will have the same price in terms ofa common currency in every country. The law follows from commodity arbitrage,which involves buying in the cheapest country if prices are different.2 It follows from the law of one price that the dollar price of a commodity in the UnitedStates equals the pound price of the commodity in Britain multiplied by the spot exchangerate of dollars per British pound. Deviations from this relationship can be caused bytransportation costs and import tariffs.3 The principle of PPP is the extension of the law of one price to prices of a basket of goods.In its absolute form, PPP says that the dollar price of a basket of goods in the UnitedStates is the pound price of the basket in Britain, multiplied by the exchange rate ofdollars per pound.4 In its relative form, PPP says that the rate of change of the exchange rate isapproximately equal to the difference between inflation rates.5 Speculation and efficient markets also produce the relative form of the PPP condition interms of expected values.6 Empirical support for the PPP condition is weak, although there is some evidence it mayhold in the long run.7 The reasons the law of one price and PPP do not hold include transportation costs,tariffs, quotas, and the fact that there are goods and services that are nontradable. PPPmay not hold even if the law of one price holds for every item because of different weightsfor different items in different countries’ price indexes.8 The fact that empirical evidence does not support PPP may be due to statisticaldifficulties in evaluating the principle.155 &
THE FUNDAMENTAL INTERNATIONAL PARITY CONDITIONSREVIEW QUESTIONS1 What is the ‘‘law of one price?’’2 How does the law of one price relate to PPP?3 Explain what a commodity arbitrager does.4 Write down the absolute form of PPP and interpret it.5 Write down the relative form of PPP and interpret it.6 Write down the efficient markets (or expectations) form of PPP and interpret it.7 Why might the efficient markets (or expectations) form hold exactly even though therelative form of PPP does not?8 What statistical problems are associated with empirical tests of PPP?ASSIGNMENT PROBLEMS1 Why might the law of one price hold even in the presence of import tariffs?2 Assume that the prices of a standard basket of goods and services in different countriesare as followsUnited States $400Canada C$550United Kingdom £280Japan ¥60,000abWhat are the implied PPP exchange rates?How would the presence of a high sales tax in Britain, such as the VAT, influenceyour guess of where the actual value of S($/£) would be vis à vis the PPP valueof S($/£)?3 Why might there be departures from PPP even if the law of one price holds for everycommodity?4 a Assume _P Mex ¼ 50 percent and _P US ¼ 2 percent. Calculate _S(P S /$) and _S($/P S )according to the precise and approximate dynamic PPP conditions.b Assume that Mexican inflation increases to 100 percent, while US inflationremains at 2 percent. Calculate _S(P S /$) and _S($/P S ) according to the preciseand approximate PPP conditions.c How does the error in the approximate condition depend on whether you aremeasuring _S(P S /$) or _S($/P S )?d How would a constant percentage sales tax in Mexico affect your answers above?5 If speculators are risk-averse, could this affect the accuracy of the link between theexpected change in the exchange rate and the difference between expected inflation rates?6 Is the accuracy of the approximate PPP condition negatively affected by the level ofinflation?& 156
THE PURCHASING-POWER-PARITY PRINCIPLE7 Why might the relative form of PPP hold even though the absolute form does not hold?8 Assume inflation in Brazil is 15 percent and in China 2 percent. What is the percentchange in the exchange rate of Brazilian reals per Chinese RMB, and Chinese RMB perBrazilian real, and why do these two percent changes differ?9 What is required for price discrimination between markets to cause departures from thelaw of one price?10 What is the relevance of a ‘‘goodness of fit’’ measure such as the R 2 statistic, forjudging PPP?11 What is one-way versus two-way arbitrage in the context of PPP, and how do theimplications of the two types of arbitrage differ?12 Specialization, which has accompanied freer trade, has caused countries to producelarger amounts of each of a narrower range of products, trading these for the wider rangeof products that people consume. How might this have affected PPP?13 What characteristics of a Big Mac 1 led The Economist to choose it as a basis for theiralternative PPP exchange-rate measure? Can you suggest any other items which mightbe used?14 Several possibilities, both theoretical and empirical, have been raised to explain theapparent failure of PPP. List and explain at least three of these. Comment on the validityof the explanation.15 Does empirical evidence suggest PPP may be more likely to hold in the short-run or thelong-run? Can you suggest an explanation for why this might be true?BIBLIOGRAPHYAbuaf, Niso and Philippe Jorion, ‘‘Purchasing Power Parity in the Long Run,’’ Journal of <strong>Finance</strong>, March 1990,pp. 157–74.Balassa, Bela, ‘‘The Purchasing-Power Parity Doctrine: A Re-Appraisal,’’ Journal of Political Economy,December 1964, pp. 584–96. Reprinted in Richard N. Cooper (ed.), <strong>International</strong> <strong>Finance</strong>: Selected Readings,Penguin Books, Middlesex, UK, 1969.Dornbusch, Rudiger and Dwight Jaffee, ‘‘Purchasing Power Parity and Exchange Rate Problems: Introduction’’and the papers included in ‘‘Purchasing Power Parity: A Symposium,’’ Journal of <strong>International</strong> Economics,May 1978, pp. 157–351.Frenkel, Jacob A., ‘‘Exchange Rates, Prices and Money: Lessons from the 1920s,’’ American Economic Review,March 1980, pp. 235–42.Gaillot, Henry J., ‘‘Purchasing Power Parity as an Explanation of Long-Term Changes in Exchange Rates,’’Journal of Money, Credit and Banking, August 1970, pp. 348–57.Hakkio, Craig, ‘‘A Re-examination of Purchasing Power Parity: A Multi-Country and Multi-period Study,’’Journal of <strong>International</strong> Economics, November 1984, pp. 265–77.Huang, Roger, ‘‘Expectations of Exchange Rates and Differential Inflation Rates: Further Evidence on PurchasingPower Parity in Efficient Markets,’’ Journal of <strong>Finance</strong>, March 1987, pp. 69–79.——, ‘‘Risk and Parity in Purchasing Power,’’ Journal of Money, Credit and Banking, August 1990, pp. 338–56.Kim, Yoonbai, ‘‘Purchasing Power Parity in the Long Run: A Cointegration Approach,’’ Journal of Money, Creditand Banking, November 1990, pp. 491–503.157 &
THE FUNDAMENTAL INTERNATIONAL PARITY CONDITIONSLee, Moon H., Purchasing Power Parity, Marcel Decker, New York, 1976.Manzur, Meher, ‘‘An <strong>International</strong> Comparison of Prices and Exchange Rates: A New Test of Purchasing PowerParity,’’ Journal of <strong>International</strong> Money and <strong>Finance</strong>, March 1990, pp. 75–91.Meese, Richard, ‘‘Currency Fluctuations in the Post-Bretton Woods Era,’’ Journal of Economic Perspectives,Winter 1990, pp. 117–34.Obstfeld, Maurice, ‘‘Currency Experience: New Lessons and Lessons Relearned,’’ Brookings Papers on EconomicActivity, No. 1, 1995, pp. 119–220.Officer, Lawrence H., ‘‘The Purchasing Power Theory of Exchange Rates: A Review Article,’’ Staff Papers,<strong>International</strong> Monetary Fund, March 1976, pp. 1–60.Peel, David A., ‘‘Further Evidence on PPP Adjustment Speeds: the Case of Effective Real Exchange Rates and theEMS,’’ Oxford Bulletin of Economics and Statistics, September 2003, pp. 421–37.Pippenger, John, ‘‘Arbitrage and Efficient Market Interpretations of Purchasing Power Parity: Theory and Evidence,’’Economic Review, Federal Reserve Bank of San Francisco, Winter 1986, pp. 31–48.Roll, Richard, ‘‘Violations of PPP and their Implications for Efficient Commodity Markets,’’ in Marshall Sarnatand George Szegö (eds), <strong>International</strong> <strong>Finance</strong> and Trade, Ballinger, Cambridge, MA, 1979.Rush, Mark and Steven L. Husted, ‘‘Purchasing Power Parity in the Long Run,’’ Canadian Journal of Economics,February 1985, pp. 137–45.Viner, Jacob, Studies in the Theory of <strong>International</strong> Trade, Harper and Row, New York, 1937.& 158
Chapter 8Interest parity<strong>International</strong> finance is the art of borrowing on the strength of what you already owe.Evan EsarThe purchasing-power-parity (PPP) conditionconsidered in Chapter 8, applies to productmarkets. There is another important, parallel paritycondition that applies to financial markets. Thisis the covered interest-parity condition. Itstates that when steps have been taken to avoidforeign exchange risk by use of forward contracts,rates of return on investments, and costs of borrowing,will be equal irrespective of the currency ofdenomination of the investment or the currencyborrowed.In this chapter we derive the covered interestparitycondition and show its connection to the PPPprinciple. We also consider the ‘‘frictions’’ thatmust be absent for the covered interest-paritycondition to hold. The frictions that must be absentinclude legal restrictions on the movement ofcapital, transaction costs, and taxes. These frictionsplay an analogous role to the frictions that mustbe absent for PPP to hold, namely, restrictionson the movement of goods between markets,transportation costs, and tariffs.Our approach to deriving the covered interestparitycondition begins by explaining how to makeshort-term investment and borrowing decisions inthe international context. We then show howshopping around for the highest investment yield orlowest borrowing cost pushes yields and costs indifferent currencies towards equality, therebyresulting in covered interest parity. Our focus is oninvestment yields and borrowing costs in differentcurrencies, and not different countries, because aswe shall see, securities are often denominated indifferent currencies within a single country. Formost purposes in this book the currency of denominationis more important than the country in which asecurity is issued. Currency of denominationintroduces foreign exchange risk while country ofissue introduces political risk, and for most countriesand time periods, foreign exchange risk is a farlarger concern than political risk.As we proceed in this and later chapters, it willbe useful at a number of points to develop andillustrate concepts by referring to an example.For this purpose, we shall consider a manufacturingcompany that makes denim clothing, primarilyjeans. The company is called Aviva Corporation.Aviva is headquartered in the United States but hassales, and purchases its denim, in many differentcountries. For this chapter, the important characteristicabout Aviva is that it has uneven cashflows; therefore, on some occasions it has surplusfunds to invest, and on other occasions it needs toborrow.Short-term borrowing and investment takeplace in the money market. This is the marketin which short-term securities such as treasurybills and commercial paper are traded. Because159 &
THE FUNDAMENTAL INTERNATIONAL PARITY CONDITIONSthere are actively traded forward contracts withrelatively short-term money-market maturities,the money market deserves special treatment.Forward contracts allow money-market borrowersand investors to avoid foreign exchange risk andexposure. Foreign exchange risk and exposure arediscussed in some detail in Chapter 9. For thetime being we note that they are the result ofsensitivity and uncertainty in asset or liability valuesdue to unexpected changes in exchange rates. 1 Letus start by asking in which currency Aviva shouldinvest.THE INVESTMENT AND BORROWINGCRITERIADetermining the currency of investmentSuppose that a firm like Aviva Corporation has somefunds to place in the money market for 3 months.Perhaps it has received a major payment but canwait before paying for a large investment in newequipment. The firm could place these funds insecurities denominated in its own domestic currencyat an interest rate that can be discoveredsimply by calling around for the going rates on,for example, locally traded commercial paperor treasury bills. Alternatively, it could invest inforeign currency-denominated securities. Shouldit buy money market securities denominated indomestic or in foreign currency?Many countries have money markets in whichfinancial securities denominated in the countries’own currencies are actively traded. For example,there is a well-developed market in Canadian dollarsecurities in Canada, of pound securities in Britain,and of yen securities in Japan. Furthermore, in largeinternational financial centers such as Londonand New York, there are active markets in securitiesdenominated in a variety of different foreign1 Risk can exist even if values of assets and liabilities, arenot uncertain. Risk also exists if there is uncertainty in theprices of what people buy, so-called inflation risk, due touncertainty in the buying power of given amounts ofmoney.& 160currencies. For example, in London there are activemarkets in US dollar securities, euro securities,yen securities, Swiss franc securities and othercurrency-denominated instruments, as well, ofcourse, as securities denominated in British pounds.By glancing at quoted interest rates it mightsometimes seem possible to obtain higher yields onsome foreign currency-denominated securities thanon others. However, realized yields on foreigncurrencysecurities depend on what happens toexchange rates as well as on interest rates. If, forexample, the value of the foreign currency in whichAviva’s investments are denominated happens tofall unexpectedly before maturity, then there willbe a foreign exchange loss when the investments areconverted back into dollars. As we shall see, theexistence of the forward exchange market allows usto compute yields which include the effects ofexchange rates. However, we shall also see thatwhen the forward market is used to remove foreignexchange risk, yield differences on differentcurrency-denominated securities are likely to bevery small.Let us see how an exchange-risk-free investmentdecision is made. We will select for our exampleAviva’s choice between alternative 3-month ratherthan full-year securities to make clear the need tokeep exchange-rate movements and interest rates incomparable annualized terms.Aviva knows that if it puts its funds in a US-dollarinvestment such as a bank deposit for 3 months,at maturity each dollar will provide$ 1þ r $4where r $ is the annualized US dollar interest rate,and division by 4 gives the 3-month return. 2The interest rate is measured in decimal form,so a 5-percent rate is expressed as r $ ¼ 0.05.2 Later, we allow for compound interest in computingreturns. However, division by 4 is expositionally moreconvenient than taking the fourth root to find the 3-monthreturn.
INTEREST PARITY1S($/£)r1+ $4$ 0 $ n£ 0r1+ £4& Figure 8.1 Dollar versus hedged poundinvestmentsF¼($/£)NotesA US investor with funds to invest for 3 months cansimply invest in domestic-currency denominated 3-monthsecurities. After 3 months, the payout per dollar invested isas shown on the top horizontal arrow pointing from timezero to maturity, one-quarter of a year later. Alternatively,the investor can buy pounds spot, shown by the left,downward-pointing arrow, and invest in pound-denominatedsecurities, shown by the lower rightward-pointing arrow.The pound investment can be hedged by selling the poundsforward for dollars, shown by the right upward-pointingarrow. The payout from hedged pound investment isgiven by the multiplication of the relevant amounts on thethree sides of the figure, left, bottom, and right.This alternative is illustrated in Figure 8.1 with thehorizontal arrow from $ 0 to $ n . The rightwardpointing arrow indicates an investment, movingmoney from the current period, time zero, to alater period, n, in this case a quarter of a year.Suppose that Aviva considers investing in apound-denominated bank deposit, and that the spotdollar/sterling exchange rate, in the conventionalUS terms of quotation, is S($/£). The exchange rateS($/£) gives the number of dollars per poundsterling, and so for $1 Aviva will obtain 1/S($/£) inBritish pounds, assuming that there are no transactioncosts. This is illustrated in Figure 8.1 with thedownward-pointing arrow from $ 0 to £ 0 .If the annualized interest rate on 3-month Britishpound bank deposits is r £ , then for every dollarinvested, Aviva will receive after 3 months thenumber of pounds that was invested (the principal),£ n1/S($/£), plus the 3-month interest on this, whichis the principal multiplied by r £ /4. This is illustratedin Figure 8.1 with the rightward-pointing arrowfrom £ 0 to £ n where in this case n ¼ 1 4. That is,Aviva will receive1£Sð$/£Þ 1 þ r £ð8:1Þ4For example, if S($/£) ¼ 1.5000 and r £ ¼ 0.06,then each dollar invested in pound-denominatedbank deposits will provide after 3 months: 31£1:5000 1 þ 0:06 ¼ £0:67674This certain number of pounds represents anuncertain number of dollars, but a forward contractcan offer a complete hedge and guarantee thenumber of dollars that will be received for thepounds at the maturity of the security.If, at the time of buying the 3-month pounddenominateddeposit, Aviva sells forward theamount of pounds to be received at maturity, thatis, the amount in equation (8.1) or £0.6767 in ourexample, then the number of dollars that will beobtained is set by the forward contract. After3 months, Aviva delivers the British pounds andreceives the number of dollars stated in the forwardcontract. This is illustrated in Figure 8.1 with theupward-pointing arrow from £ n to $ n .If, for example, the 3-month forward rate at thetime of investment is F 1/4 ($/£), then we multiplythe amount in equation (8.1) by this exchangerate to find the number of dollars received atmaturity for each original dollar invested in thepound-denominated bank deposit. We obtain$ F 1/4ð$/£ÞSð$/£Þ1 þ r £4ð8:2ÞFor example, if F 1/4 ($/£) ¼ 1.4950, then thenumber of pounds from equation (8.1), approximately£0.6767, will provide ($1.4950/£) £0.6767 ¼ $1.0116 when sold forward for dollars.3 We round to the fourth decimal.161 &
THE FUNDAMENTAL INTERNATIONAL PARITY CONDITIONSThis is the number of dollars received after3 months, or 1 4of a year, for each original dollar inthe pound-denominated bank deposit. This impliesan annual rate of return of approximately,1:0116 1:00004 ¼ 0:04647, or 4:65%1:0000It is important to remember that the number ofdollars given in equation (8.2) is a certain amountthat is known at the time of investment. The purchaseof the spot pounds, the investment in thepound-denominated deposit, and the forward saleof pounds all take place at the same time, and so ifthe security itself is risk-free there is no doubtabout the number of dollars that will be received.If the spot exchange rate changes before the depositmatures, that will make no difference. Theexchange rate to be used in converting the dollarsinto pounds at maturity is already set in the forwardcontract, which is part of the swap of dollars forpounds (recall from Chapter 3 that a swap is anyexchange of currencies that is reversed, in this casedollars into pounds in the spot market and back todollars in the forward market). In terms of ourexample, it is guaranteed that $1.0116 will bereceived.It is now a simple matter to express the rule fordeciding the currency in which to invest. Theinvestor should choose a 3-month US-dollardeposit, rather than a pound deposit whenever 41 þ r $4> F 1/4ð$/£ÞSð$/£Þ1 þ r £4The investor should select the pound deposit ratherthan the US-dollar deposit whenever the reverseinequality holds, that is1 þ r $4< F 1/4ð$/£ÞSð$/£Þ1 þ r £44 When exchange rates are in European terms, the forwardand spot rates must be inverted. This is left as an exercise atthe end of the chapter.& 162Only if1 þ r $4¼ F 1/4ð$/£ÞSð$/£Þ1 þ r £4ð8:3Þshould the investor be indifferent, since the sameamount will be received from a dollar invested insecurities denominated in either currency. 5We can convert equation (8.3) into a moremeaningful equality if we subtract (1 + r £ / 4) fromboth sides:1 þ r $41 þ r £4¼ F 1/4ð$/£ÞSð$/£Þ1 þ r £41 þ r £4With cancellation and rearrangement we obtainr $ ¼ r £ þ 4 F 1/4ð$/£Þ Sð$/£ÞSð$/£Þ 1 þ r £ð8:4Þ4We interpret this equation below, but before wedo, we can note that part of the second right-handterm in equation (8.4) involves the multiplicationof two small numbers, the forward pound premiumand r £ /4. This product is very small. Forexample, if the forward premium is 4 percent andBritish interest rates are 8 percent per annum, thecross-product term from equation (8.4) will be0.0008 (0.04 0.02), which is less than one-tenthof 1 percent. In order to interpret equation (8.4),we might therefore temporarily drop the termformed from this product (which means droppingthe r £ /4) and write it as:r $ ¼ r £ þ 4 F 1/4ð$/£Þ Sð$/£Þð8:5ÞSð$/£Þ5 In more general terms, equation (8.3) can be written asF n ð1 þ rÞn¼S ð1 þ r f Þ nwhere the form of the exchange-rate quotation and theannualization are assumed to be understood. Here, r isthe domestic interest rate and r f is the foreign currencyinterest rate.
INTEREST PARITYThe first term on the right of equation (8.5) isthe annualized pound interest rate. The secondright-hand term is the annualized (because of the 4)forward premium/discount on pounds. Therefore,we can interpret equation (8.5) as saying thatinvestors should be indifferent between home- andforeign-currency denominated securities if thehome-currency interest rate equals the foreigncurrencyrate plus the annualized forward exchangepremium/discount on the foreign currency. Investorsshould invest in the home currency when thedomestic-currency interest rate exceeds the sum ofthe foreign-currency rate plus the foreign exchangepremium/discount, and invest abroad when thedomestic-currency rate is less than this sum. Wediscover that a mere comparison of interest rates isnot sufficient for making investment choices. Inorder to determine in which currency-denominatedsecurities to invest, we must add the foreigncurrencyinterest rate to the forward premium ordiscount. Using the terminology of Chapter 3, wemust add the foreign-currency interest rate to thespot-forward swap of pounds for dollars, where thisswap is put in annualized terms.The difference between equation (8.4) andequation (8.5) is that in equation (8.4) we includethe forward exchange premium/discounton the principal invested in pound securities andthe forward exchange premium/discount onthe interest earned. In the approximate formequation (8.5) we consider the forward premium/discount earned on the principal, but not thepremium/discount on the interest.An example: comparing investmentsSuppose Aviva Corporation faces the exchange rateand interest rate situation shown in Table 8.1 andhas $10 million to invest for 3 months. Into whichcurrency-denominated bank deposit should it placeits funds?The yield on pound-denominated deposits whenthe proceeds are sold forward, called the coveredor hedged yield, can be calculated fromr £ þ 4 F 1/4ð$/£Þ Sð$/£ÞSð$/£Þ1 þ r £4where the first element is the pound interest rateand the second element is the premium/discounton the pound vis-à-vis the dollar, including thepremium/discount on both the principal andinterest. Substituting the values in Table 8.1British pound covered yield1:5121 1:5140¼ 0:05125 þ 41:5140 1 þ 0:05125 ¼ 0:046167, or 4:6167%4This yield, which involves no foreign exchange riskbecause the pounds are sold forward, is slightlyhigher than the yield on US-dollar deposits.Similarly, the covered yields on the euro isEuro covered yield1:1175 1:1258¼ 0:07430 þ 41:1258 1 þ 0:07430 ¼ 0:044262, or 4:4262%4& Table 8.1 Exchange rates and interest rates on different currency-denominated 3-month bank depositsUS dollar British pound Euro Swiss franc Japanese yenInterest rate a 4.4375% 5.1250% 7.4300% 3.9375% 1.125%Spot rate(US equivalent)Forward rate b(US equivalent)1.0 $1.5140/£ $1.1258/¤ SFr 1.4065/$($0.710985/SFr)1.0 $1.5121/$ $1.1175/¤ SFr 1.4052/$($0.711642/SFr)¥114.12/$($0.0087627/¥)¥113.20/$($0.0088339/¥)Covered yield 4.4375% 4.6167% 4.4262% 4.3112% 4.3843%Notesa Interest rates on 3-month time deposits.b 3-month forward rate.163 &
THE FUNDAMENTAL INTERNATIONAL PARITY CONDITIONSFor the covered yield on the Swiss franc andJapanese yen hedged against the US dollar we usethe exchange rates in US-dollar terms shown inparentheses below the European-terms quotations.For example, for the covered yield on Swiss francdeposits we computeSwiss franc covered yield0:711642 0:710985¼ 0:039375 þ 40:710985 1 þ 1:039375 4¼ 0:043108, or 4:3108%The covered yields in Table 8.1 are much closer in valuethan the yields in the local currencies. An inspectionof the spot versus forward exchange rates shows why.The British pound and euro which have higher interestrates than are available on US dollar securities, areboth at a forward discount. The discounts offset thehigher foreign currency interest rates. On the otherhand, the Swiss franc and Japanese yen, the currencieswith lower interest rates than on the US-dollardeposits, are both at a forward premium. Thepremiums help make up for the lower interest rates.If Aviva were to invest its $10 million for 3 monthsin the British pound deposits, covered in the forwardmarket, it would receive back,$10,000,000 1 þ 0:046167 4¼ $10,115,415However, if Aviva had chosen US-dollar deposits itwould have received back:$10,000,000 1 þ 0:044375 ¼ $10,109,3754The difference between the two paybacks is $6,040.This is the reward for Aviva doing its homeworkand finding the covered yield on differentcurrency-denominated investments.Determining the currency in whichto borrowImagine that Aviva Corporation needs to borrowfor 3 months. If the annualized interest rate for& 164domestic-currency borrowing is r $ , then therequired repayment after 3 months is the principalplus interest, or$ 1þ r $4ð8:6Þfor each dollar borrowed. This is illustrated bythe upper leftward-pointing horizontal arrow inFigure 8.2, showing borrowing as bringing funds tothe current time period.Suppose that instead of borrowing dollarsdirectly, Aviva considers obtaining dollars indirectlyby using a pound-denominated loan, andconverting the borrowed pounds into the dollars itneeds. If the spot exchange rate is S($/£), thenborrowing $1 requires borrowing 1/S($/£) inpounds. This is illustrated by the left-hand, upwardpointingarrow in Figure 8.2. For example, atthe exchange rate S($/£) ¼ 1.5140, borrowing1S($/£)1+ r $4$ 0 $ n£ 0r1+ £4& Figure 8.2 Dollar versus hedged poundborrowingF¼($/£)NotesA US borrower seeking funds for 3 months can simplyborrow dollars. The repayment at the end of the 3 monthsis shown on the top horizontal arrow pointing leftwardsfrom maturity of the loan to time zero. Alternatively,the borrower can borrow pounds – the bottom leftwardpointingarrow – and use these to buy dollars spot – theleft upward-pointing arrow. In this way the borrower hasuse of dollars. The pound loan can be hedged by buyingthe pounds forward, shown by the right downward-pointingarrow. The repayment for hedged pound borrowing is givenby the multiplication of the relevant amounts on the threesides of the figure, left, bottom, and right.£ n
INTEREST PARITY$1 means borrowing £0.6605. If the annualizedinterest rate is r £ , then for each dollar borrowed viapounds, Aviva must repay1£Sð$/£Þ 1 þ r £ð8:7Þ4This is illustrated in Figure 8.2 by multiplicationof the amount on the lower leftward-pointinghorizontal arrow and the amount on the left-hand,upward-pointing arrow. For example, if r £ ¼ 0.06(the 3-month annualized borrowing rate), Avivamust repay £0.6605 1.015 ¼ £0.6704. Withouta forward exchange contract the number of dollarsthis would represent when Aviva repays its pounddebt is uncertain. However, with a forwardexchange contract the risk is eliminated.Suppose that Aviva buys forward the amountof pounds in equation (8.7) at F 1/4 ($/£). When thedebt is repaid, Aviva will receive the requirednumber of pounds on the forward contract forwhich it must pay$ F 1/4ð$/£ÞSð$/£Þ1 þ r £4ð8:8ÞThe forward hedging is illustrated by the right-handdownward-pointing arrow in Figure 8.2. Forexample, if F 1/4 ($/£) ¼ 1.5121, repaying £0.6704involves paying $1.0137 ($1.5121/£ £0.6704).On the other hand, if Aviva borrowed dollars for3 months at r $ ¼ 0.05, or 5 percent per annum,it would have to repay $1.0125 on each dollar.In this case of dollar borrowing, it is cheaper toborrow dollars directly than incur a hedged loan inpounds. In general, a firm should borrow pounds viaa swap whenever the amount in equation (8.8) isless than that in equation (8.6), that is, whenF 1/4 ð$/£ÞSð$/£Þ1 þ r £4< 1 þ r $4A firm should borrow dollars when the reverseinequality holds. In our particular example Avivashould borrow in dollars: the amount to be repaid islower from a direct dollar loan. The borrowingdecision criterion is seen to be the same as theinvestment criterion with, of course, the inequalityreversed.Borrowing and investing for arbitrage profitImagine a firm that can borrow its own currencyand/or a foreign currency, as can a large corporationor bank. Suppose that it can borrow dollars for3 months at an annualized interest rate of r $ . Thus,for each dollar it borrows, it must repay (1 þ r $ /4)dollars. This is illustrated by the leftward-pointingupper arrow in Figure 8.3. The firm can takeeach borrowed dollar and buy 1/S($/£) pounds,illustrated by the left, downward-pointing arrowin Figure 8.3. If these pounds are invested for3 months at r £ per annum, and if the resultingreceipts are sold forward, the firm will receive$ F 1/4ð$/£ÞSð$/£Þ1S($/£)1 þ r £4r1+ $4$ 0 $ n£ 0r1+ £4& Figure 8.3 Covered interest arbitrage:dollar borrowing and pound investingF¼($/£)NotesAn interest arbitrager may begin by borrowing dollars –the upper leftward-pointing arrow. These borrowed dollarscan be used to buy pounds spot – the left downwardpointingarrow. The pounds can then be invested for thesame maturity as the dollar loan. With pounds maturingfrom the investment and dollars to be repaid on the loanthere is exchange rate exposure and risk. The exposureand risk can be avoided by selling pounds forward fordollars – the right upward-pointing arrow. Exchange ratesand interest rates adjust so that interest arbitrageopportunities do not persist.£ n165 &
THE FUNDAMENTAL INTERNATIONAL PARITY CONDITIONSThe pound investment and forward sale of poundsare illustrated by the lower rightward-pointing andright-hand upper pointing arrows in Figure 8.3.Note that the company has begun with no funds ofits own, and has taken no risk. Borrowing in dollarsand simultaneously investing in pounds will result ina profit if the number of dollars received from thehedged pound investment exceeds the repaymenton the dollar loan, that is, if1 þ r $4< F 1/4ð$/£ÞSð$/£Þ1 þ r £4The reverse activity, borrowing in pounds andinvesting in dollars, will be profitable if the reverseinequality holds. As long as either inequality holds, itpays to borrow in one currency and lend, or invest,in the other. Borrowing and investing in this waywith exchange rate risk hedged in the forward marketis known as covered interest arbitrage. In termsof Figure 8.3, covered interest arbitrage borrowingof dollars and investing in pounds is seen to be acomplete circuit around the figure in a counterclockwisedirection. The alternative covered interestarbitrage of borrowing pounds and investing in dollarswould be a clockwise circuit around the figure.It should be no surprise that the potential forcovered interest arbitrage helps guarantee that littleopportunity for profit remains, and that investorsand borrowers will be relatively indifferent withregard to choosing a currency. This is clear, forexample, from the similarity of covered yields inTable 8.1.THE COVERED INTEREST-PARITYCONDITIONMathematical statement ofinterest parityWe have determined that 3-month investors andborrowers would be indifferent between dollar andpound denominations of investment or debt if1 þ r $4¼ F 1/4ð$/£ÞSð$/£Þ1 þ r £4ð8:9ÞMore precisely, if we allow for compound interest,as we should for long-term investing and borrowing,investors and borrowers will be indifferentbetween the dollar and pound for investing andborrowing whenð1 þ r $ Þ n ¼ F nð$/£ÞSð$/£Þ ð1 þ r £Þ nð8:10ÞWhen equation (8.10) holds, no covered interestarbitrage is profitable. Equation (8.10) is thecovered interest-parity condition. When thiscondition holds, there is no advantage to coveredborrowing or investing in any particular currency,and no profit from any covered interest arbitrage.The covered interest-parity condition is thefinancial-market equivalent of the law of one pricefrom the commodity market, and follows fromfinancial-market efficiency. The market forcesleading to covered interest parity, as well as thefactors which might result in small deviations fromthe parity condition, can be illustrated graphically.Market forces resulting in covered interestparity:a graphical presentationWe can represent covered interest parity by usingthe framework of Figure 8.4. The annualized3-month forward premium on the pound – onprincipal plus interest – is drawn on the verticalaxis, and the annualized interest rate differencebetween the dollar and the pound is drawn along thehorizontal axis. The area above the horizontal axisrepresents a pound forward premium, and the areabelow this axis represents a pound forwarddiscount. To the right of the vertical axis there isa dollar interest advantage, and to the left there isa dollar interest disadvantage.Covered interest parity, as expressed in equation(8.4), can be written asr $ r £ ¼ 4 F 1/4ð$/£Þ Sð$/£ÞSð$/£Þ 1 þ r £ð8:11Þ4& 166
INTEREST PARITY4+.04F¼($/£)–S($/£)S($/£)A1+ r £4.03.02FB.01– +–.04 –.03 –.02 –.01 0 .01 .02 .03 .04 (r $ –r £ )–.01EC–.02–.03D–.04–& Figure 8.4 The covered interest-parity diagramNotesThe diagonal is the line of covered interest parity. On the line, investors and borrowers are indifferent between dollar and poundinvesting/borrowing. Above and to the left of the line there is an incentive to invest in pounds and borrow dollars.Below and to the right of the line there is an incentive to invest in dollars and borrow pounds. In situations off the interestparity line, forces are at work pushing us back towards it.If the same scale is used on the two axes inFigure 8.4, this parity condition is represented by a45-degree line. This line traces the points wherethe two sides of our equation are indeed equal.Suppose that instead of having equality as inequation (8.11), we have the following inequality:r $ r £ < 4 F 1/4ð$/£Þ Sð$/£ÞSð$/£Þ 1 þ r £ð8:12Þ4This condition means for example, that any poundforward premium more than compensates for anydollar interest advantage. Thus:1 Covered investment in pounds yields morethan in dollars.2 Borrowing in dollars is cheaper than coveredborrowing in pounds.It also means that it is profitable for an interestarbitrager to borrow dollars and make a coveredinvestment in pounds. Because this act of coveredinterest arbitrage involves borrowing in the cheapercurrency, and investing in the higher yielding currency,we can concentrate on the consequences ofinterest arbitrage rather than the separate activitiesof borrowing and investing.The incentive in equation (8.12) to borrowdollars and make a covered investment in poundsmeans an incentive to:1 Borrow dollars, perhaps by issuing and sellinga security – thus tending to increase r $ .2 Buy spot pounds with the borrowed dollars –thus tending to increase S($/£).3 Buy a pound security – thus tending toreduce r £ .4 Sell the pound investment proceeds forward forUS dollars – thus tending to reduce F 1/4 ($/£).167 &
THE FUNDAMENTAL INTERNATIONAL PARITY CONDITIONS& Table 8.2 Points off the interest-parity line aPointA B C D E FInterest differential þ.02 .01 .04 .02 þ.01 þ.04Forward premium b .04 .01 þ.02 þ.04 þ.01 .02Covered margin .02 .02 .02 þ.02 þ.02 þ.02Notesa dollar advantage ¼þ; dollar disadvantage ¼ .b Forward premium ( þ ) or discount (!) on the US dollar.The inequality in equation (8.12) can be representedin Figure 8.4 by points such as A, B, and Cthat are above and to the left of the 45-degree line.The character of these points is summarized inTable 8.2. At point B, for example, dollar interestrates are 1 percent lower than pound interest rates,and at the same time the dollar is at a 1 percentforward discount. For both reasons there is anadvantage to covered borrowing of dollars andinvesting in pounds. The covered margin oradvantage of doing this is the interest differential(r £ r $ ), plus the forward pound premium – onprincipal plus interest – for a total of 2 percent.In terms of equation (8.12), the inequality holdsbecause the left-hand side is negative ( 0.01) andthe right-hand side is positive ( þ 0.01). As we shallexplain later, the covered interest arbitrage involvingeach of the four steps we have distinguished,will tend to restore covered interest parity bypushing the situation at B back towards the parityline. The same thing will occur at every other pointoff the interest-parity line. For example, considerthe situation at point A, where there is an incentiveto borrow dollars and invest in pounds, covered.The extra borrowing in dollars to profit from thearbitrage opportunity will put upward pressure ondollar interest rates. If the borrowing is throughselling dollar money-market instruments, efforts tosell them will reduce their prices. For given couponsor maturity values, this will raise their yields.Thus, we will find r $ increasing. The increase in r $can be represented in Figure 8.4 as a force pushingto the right of A, towards the interest-parity line.The second step in covered interest arbitragerequires the spot sale of US dollars for British& 168pounds. This will help bid up the spot price of thepound; that is, S($/£) will increase. For any givenF 1/4 ($/£), the higher value of S($/£) will reduce thenumerator and increase the denominator and therebyreduce the value of the forward pound premiumF 1/4 ð$/£Þ Sð$/£ÞSð$/£ÞThis is shown in Figure 8.4 by an arrow pointingdownward from A, towards the interest-parity line.The pounds that were purchased will be used toinvest in pound securities. Extra pound-securitybuyers will, ceteris paribus, cause the price of poundsecurities to increase, and therefore cause poundyields to decrease, that is, r £ will fall. This means anincrease in (r $ r £ ), which is shown by an arrowpointing to the right from A. Again, the movementis back towards the covered interest-parity line.Covering the pound proceeds of the investmentby the forward sale of pounds will lower F 1/4 ($/£).For every given value of S($/£), there will be alower value of the pound premium, [F 1/4 ($/£)S($/£)]/S($/£). Thus, there is a second force thatwill also push downward from A towards the parityline. 6 We can observe, of course, that since all foursteps of arbitrage occur simultaneously, all theforces shown by the arrows occur simultaneously.Points B and C in Figure 8.4, like point A, indicateprofitable opportunities for covered borrowing indollars and investment in pounds, and so there willbe changes in interest and exchange rates also atthese points as shown by the arrows. For example, at6 There is an additional force pointing downward from A due tothelowerpound interestrate.However,thisistheeffectofthereduced premium on the pound interest and is very small.
INTEREST PARITYpoint C the dollar-interest rate is 4 percent lowerthan the pound rate. This is only partially offset bya 2-percent annual forward discount on pounds. Thiswill encourage covered arbitrage flows towards poundinvestments. As before, there will be borrowing indollars, and hence an increase in r $ ; spot purchases ofpounds, which will raise S($/£); investment in poundsecurities which will lower r £ ; and forward sales ofpounds, which will lower F 1/4 ($/£). All these changesare forces back to the interest-parity line. Indeed, atany point above the interest-parity line the forcesshown by the arrows emanating from A, B, and C inFigure 8.4 are at work. We find that if we are offthe covered interest-parity line and above it, marketforces force us back down towards the line.Below the interest-parity line, forces push us backup.AtpointssuchasD,E,andF,coveredinterestarbitragers will wish to borrow in pounds and investin dollars. For example, at point E, dollarinterest rates are 1 percent higher than pound rates,and the dollar is at a 1-percent forward premium.Thus dollar investments have a 2-percent advantage.This will cause arbitragers to sell pound securities,loweringtheirpricesandraisingr £ .Thisisshownin Figure 8.4 by an arrow that points to the left.The interest arbitragers then sell pounds for dollars,lowering S($/£) and causing a movementupward, towards the parity line. They also purchasedollar securities, lowering r $ and causing a secondmovement towards the left. Hedging by buyingpounds forward for dollars increases F 1/4 ($/£),thereby raising the forward premium on sterling,4[F 1/4 ($/£) S($/£)]/S($/£). This means that againtherewillbemovementtowardstheline,sincetheforward premium is the primary component onthe vertical axis. (The other component, r £ , alsocauses movement, albeit small, back up towards theparity line.)We find that above the covered interest-parityline, dollar borrowing and pound investment, withthe associated spot and forward transactions, pushus back towards the line. Below the line, poundborrowing and dollar investment with associatedcurrency transactions also push us back towards theline. The amount of adjustment in interest ratesversus spot and/or forward exchange rates dependson the ‘‘thinness’’ of the markets. For example, if alarge part of the adjustment towards coveredinterest parity occurs in the forward rate, the pathsfollowed from points such as A or E back towardsthe parity line will lie closer to the vertical arrowsthan to the horizontal ones. In such a case wecan think of the forward premium/discount asbeing determined by the interest differential, ratherthan vice versa. 7COMBINING PPP AND INTEREST PARITYThe uncovered interest-parity conditionEquation (8.10) is the condition for hedged or coveredinterest-parity because it involves the use of theforward market. It can be argued that a similarunhedged interest-parity condition should also hold.This follows because, as we explained in Chapter 3and shall confirm later, speculation will make theforward exchange rate approximately equal to theexpected future spot rate. That is, if we defineS n ($/£) as in Chapter 3, namelyS n ($/£) is the expected spot exchange ratebetween the dollar and the pound in n years’time,then it follows that to a close approximationS n ð$/£Þ ¼F nð$/£Þð8:13ÞRecall that the reason equation (8.13) holds is that ifS n ð$/£Þ > F nð$/£Þspeculators will buy pounds n-years forward; theycan buy pounds forward for less than they expect tobe able to sell them. This will force up the forwardrate, F n ($/£), until it is no longer less than theexpected future spot rate. Similarly, ifS n ð$/£Þ < F nð$/£Þ7 Indeed, foreign exchange traders and brokers frequentlycompute forward premiums and discounts from interestdifferentials.169 &
THE FUNDAMENTAL INTERNATIONAL PARITY CONDITIONSspeculators will sell pounds n-years forward; theycan sell forward pounds for more than they expectto be able to buy them when they honor their forwardcontract. Selling pounds forward pushesthe forward rate down until it is no longer morethan the expected future spot rate. Only whenequation (8.13) holds is the forward rate in equilibriumin the sense that speculative pressures are notforcing the forward rate up or down.Substituting equation (8.13) into equation (8.10)allows us to say that, to a close approximation,uncovered interest parity should hold in theformð1 þ r $ Þ n ¼ S n ð$/£ÞSð$/£Þ ð1 þ r £Þ n ð8:14ÞThis is only an approximate condition becauseuncovered interest parity involves risk: we assumeS n ($/£) ¼ F n($/£) and as we shall see inChapter 13, this assumption is invalid if there is arisk premium in the forward market.Equation (8.14) can be put in a different form bynoting that by definitionS n ð$/£Þ Sð$/£Þð1 þ _S Þ n ð8:15Þwhere _S is the average annual expected rate ofchange of the exchange rate. Substituting equation(8.15) into equation (8.14) givesð1 þ r $ Þ n ¼ð1 þ _S Þ n ð1 þ r £ Þ n ð8:16ÞTaking the nth root of both sides gives1 þ r $ ¼ 1 þ _S þ r £ þ _S r £ ð8:17ÞAssuming _S and r £ are small compared to 1, the‘‘interaction term’’ _S r £ will be very small,allowing us to write to a close approximationr $ r £ ¼ _S ð8:18ÞThat is, the interest differential should approximatelyequal the expected rate of change of the spotexchange rate.The expectations form of PPPWe recall from Chapter 7 that the expecteddollar return from holding commodities in the& 170United States is _P US , that is, the expected US rateof inflation. Similarly, we recall that the expecteddollar return from holding commodities in Britainis P UK þ S because there are expected changesboth in the pound prices of commodities and in thedollar value of the pound. We have seen that if weignore risk, the rates of return from holding commoditiesin the two countries will be driven toequality by speculators until 8_P US_P UK ¼ _S ð7:17Þwhere _S is the expected rate of change of the spotrate, S($/£). Equation (7.17) is the PPP conditionin terms of expectations. It is known variously asthe expectations, speculative, and efficientmarkets PPP.The interrelationship of the parity conditionsIf we take the PPP condition in its expectationsform equation (7.17), and compare it with theuncovered interest-parity condition in equation(8.18), we note a clear similarity. We have_P US_P UK ¼ _S ð7:17Þr $ r £ ¼ _S ð8:18ÞThe right-hand sides of these two equations areequal. It follows that the left-hand sides mustlikewise be equal. This means thatr $r £ ¼ _P US_P UKBy rearranging, we haveð8:19Þr $ _P US ¼ r £ _P UK ð8:20ÞThe two sides of this equation are the two currencies’interest rates less the expected rates of inflationin the associated two countries. The interestrate minus expected inflation is the expected real8 As before, we assume no holding costs, or that holding costsare equal in the two countries.
INTEREST PARITYinterest rate, popularized principally by IrvingFisher. 9 As a result, equation (8.20) is calledthe Fisher-open condition. 10 The Fisher-opencondition states that the expected real rates ofinterest are equal in different countries. Frompurchasing-power-parity and uncovered interestparity we have been able to derive an equalityrelationship between expected real returns indifferent countries. 11The equality of expected real interest rates canbe considered as having an independent existence,one that does not have to be derived from PPP andinterest parity. It follows from investors allocatingtheir funds to where expected real returns arehighest. Investing according to the highest expectedreal yield will tend to reduce returns in the countrieswith high returns where funds are sent –because of the greater supply of funds. It will alsotend to increase expected returns in countries fromwhich the funds are taken – because of the reducedsupply of funds. The flow of funds will continueuntil the expected real returns in different countriesare equalized. 129 See Irving Fisher, The Theory of Interest, A. M. Kelley,New York, 1965.10 Generally, economists refer to equation (8.18), notequation (8.20), as the Fisher-open condition. However,since Fisher spoke of real interest rates as actual rates minusthe expected inflation rate, equation (8.20) would be moreappropriately referred to by his name. Equation (8.18)should perhaps be called the ‘‘interest-open’’ condition,where ‘‘open’’ means ‘‘open economy.’’11 We state this in terms of countries rather than currenciesbecause inflation refers to countries. Of course, returnswithin countries are in the countries’ currencies.12 The relationship between security yields in differentcountries can be extremely complex because of taxes,regulations, currency risks, citizens’ tastes, and so on.The problem has been tackled by F. L. A. Grauer,R. H. Litzenberger, and R. E. Stehle, ‘‘Sharing Rules andEquilibrium in an <strong>International</strong> Capital Market underUncertainty,’’ Journal of Financial Economics, June 1976,pp. 233–56, and Fischer Black, ‘‘<strong>International</strong> CapitalMarket Equilibrium with Investment Barriers,’’ Journal ofFinancial Economics, December 1974, pp. 337–52. Few dataexist on real rates in different countries. See, however,Robert Z. Aliber, ‘‘Real Interest Rates in a MulticurrencyWorld,’’ unpublished paper, University of Chicago.Fisher-openr $ – r £• • (Expected ) PPP•P* US – P* UKS*($/£)WHY COVERED INTERESTDIFFERENCES PERSIST(Uncovered )interest parity& Figure 8.5 The interdependence ofexchange rates, interest rates, and inflationratesNotesInterest parity, PPP, and the Fisher-open condition arerelated. Any one of these conditions can be derived from theother two.If we write the uncovered interest parity,expected purchasing-power-parity, and Fisheropenconditions all together, that is,interest parity: r $ r £ ¼ _S ð$/£ÞPPP: _P US _P UK ¼ _S ð$/£ÞFisher-open: r $ _P US ¼ r £ _P UKwe find that we can derive any one from the othertwo. This is left as an end-of-chapter problem forthe reader. The conditions are shown in Figure 8.5.Each side of the triangle in Figure 8.5 represents acondition. The figure helps clarify why satisfyingany two conditions implies that the remainingcondition is satisfied.Because each of the three parity conditions alongthe sides of Figure 8.5 can be derived from the othertwo, any one condition must be correct if the othertwo are correct. For example, if we believeexpected real returns are equal in different countriesand that uncovered interest parity holds precisely,we are implicitly accepting that PPP in itsexpectations form also holds precisely.In reality, covered interest parity holds veryclosely, but it does not hold precisely. This is171 &
THE FUNDAMENTAL INTERNATIONAL PARITY CONDITIONSapparent from, for example, the covered interestdifferentials in Table 8.1. The failure to achieveexact covered interest parity could occur because inactual financial markets there are1 transaction costs;2 political risks;3 potential tax advantages to foreign exchangegains versus interest earnings; and4 liquidity differences between foreign securitiesand domestic securities.In addition, uncovered interest parity may nothold because of risk aversion: recall that uncoveredparity is based on spot rate expectations, not onforward rates which eliminate foreign exchangerisk.In this chapter we explain how the four factorslisted above contribute to departures from coveredinterest-parity. Later, in Chapter 14, we show thatthese are the same factors that influence cashmanagement.Transaction costs and interest parityThe cost of transacting in foreign exchange isreflected in the bid-ask spread in exchange rates.The bid-ask spread represents the cost of two foreignexchange transactions, a purchase and a sale offoreign currency. That is, if a person buys and thenimmediately sells a foreign currency, the cost ofthese two transactions is the difference between thebuying and selling prices of the currency, whichis the bid-ask spread. Covered investment orborrowing involve two foreign exchange transactioncosts – one on the spot market and the other onthe forward market. These two transaction costsdiscourage foreign-currency denominated investmentand borrowing. Interest arbitrage alsoinvolves two foreign exchange transaction costs,since the borrowed currency is sold spot and thenbought forward. However, there are additionaltransaction costs of interest arbitrage due tointerest-rate spreads. This is because the borrowing& 172interest rate is likely to exceed the investmentinterest rate. 13It might seem that the extra cost of investing inforeign currency-denominated securities vis-à-visdomestic-currency securities would require coveredforeign-currency yields to be higher than domesticcurrencyyields before investors choose the foreigncurrencyalternative; investors need to find itworthwhile to incur the extra transaction costs for aforeign-currency security. Similarly, it might seemthat borrowing costs in foreign currency would haveto be lower than borrowing costs in domestic currencybefore borrowers choose the foreign-currencyalternative; borrowers face extra costs when borrowingvia the foreign-currency swap. In otherwords, it might seem that there could be deviationsfrom interest parity by up to the extra transactioncosts of investing or borrowing in foreign currencybefore the benefits of the foreign alternative aresufficient to compensate for the added costs. Interms of Figure 8.4, it would appear that transactioncosts could allow the situation to be slightly off theinterest-parity line; the apparent advantages toforeign-currency investments/borrowing at pointsjust off the line do not trigger foreign borrowing/investing because the benefits are insufficient tocompensate for the costs. Indeed, because the cost ofcovered interest arbitrage includes the borrowing –investing interest rate spread as well as foreignexchange transaction costs, it might appear thatdeviations from interest parity could be relativelylarge before being sufficient to compensate for thetransaction costs of covered interest arbitrage.Despite the preceding, which would suggest thatdeviations from interest parity could result fromtransaction costs, it has generally become recognizedthat transaction costs do not contribute todeviations from interest parity. A major reason forthis recognition is the realization that one-way13 The borrowing-investment spread can be considered asa transaction cost in the same way that we consider thebid-ask spread on currencies a transaction cost, namely, it isthe cost of borrowing and then immediately investing theborrowed funds.
INTEREST PARITYinterest arbitrage circumvents transaction costs inforeign exchange and securities markets. We canexplain the nature of one-way interest arbitrage andhow it influences the interest-parity condition bycontrasting one-way and round-trip arbitrage.In order to do this, we need to be explicit aboutforeign exchange and borrowing – lending transactioncosts. Using the same notation as in Chapter 2for transaction costs on spot exchange, let us use thefollowing definitions:S($/ask£) and F n ($/ask£) are respectively thespot and n-year forward exchange rates whenbuying pounds with dollars, and S($/bid£) andF n ($/bid£) are respectively the spot and forwardexchange rates when selling pounds for dollars.r I $ and r I £ are the interest rates earned oninvestments in the two currencies, and r B $ and rB £are the interest rates on borrowing in the twocurrencies.This notation is used in Figure 8.6 to show thedifference between one-way and round-trip arbitrageand the implications of this distinction forcovered interest parity.Figure 8.6a illustrates round-trip covered interestarbitrage. As before, the four corners of thediagram show current dollars ($ 0 ), current pounds,(£ 0 ), future dollars ($ n ), and future pounds (£ n ).The arrows drawn between the corners of the figureshow the interest rates or exchange rates whengoing between the corners in the directions of thearrows. For example, when going from $ 0 to £ 0as shown by the downward-pointing arrow in theleft-hand panel of Figure 8.6a, the transactionoccurs at the spot exchange rate, S($/ask£): poundsare being purchased. Similarly, when going from $ nto $ 0 as shown by the upper, horizontal, leftwardpointingarrow in the left-hand panel of Figure 8.6a,this involves borrowing dollars and so occurs at thedollar-borrowing rate, r B $ .The left-hand diagram in Figure 8.6a showsround-trip arbitrage involving borrowing in dollarsand investing in pounds. To understand the natureof this arbitrage we begin at corner $ n . The topleftward-pointing arrow from $ n shows the interestrate on dollar borrowing which gives immediatedollars, $ 0 , in return for paying dollars back in thefuture, $ n . The left downward-pointing arrow showsthe spot exchange rate at which the borroweddollars are exchanged into pounds; the pounds mustbe purchased, so the spot rate is the ask rate forpounds, S($/ask£). The bottom rightward-pointingarrow shows the interest rate earned on the pounddenominatedinvestment which converts today’spounds, £ 0 , into future pounds £ n . Finally, theright upward-pointing arrow shows the forwardexchange rate at which the dollars needed forrepaying the dollar loan are purchased with pounds,F n ($/bid£). The counterclockwise journey in thisleft-hand diagram in Figure 8.6a from $ n and back to$ n is seen to involve foreign exchange transactioncosts – the ask on spot pounds S($/ask£) versus bidon forward pounds F n ($/bid£), and therefore a bidaskspread – plus borrowing – investment transactioncosts – the borrowing rate on dollars r B $versus the investment rate on pounds, r I £ . That is,round-trip arbitrage is expensive in terms of facingcosts in the currency and in the security markets.The right-hand diagram in Figure 8.6a illustratesthe alternative direction of round-trip arbitrage,with borrowing of pounds and investment indollars. Starting at £ n , pounds are borrowed at r B £giving the borrower current pounds £ 0 . These aresold spot for dollars at S($/bid£) and the dollarsinvested at r I $ . The pound-denominated loan iscovered by buying forward pounds at the forwardask rate for pounds, F n ($/ask£). As with the lefthandfigure in Figure 8.6a, we see that the poundborrowing-dollar investment arbitrage also involvesa transaction cost spread in the foreign exchangemarket – spot bid versus forward ask on pounds –and in the securities market – pound borrowingrate versus the dollar investment rate.If the maximum possible sizes of deviations fromcovered interest parity due to transaction costswere determined only by round-trip coveredinterest arbitrage, the deviations could be quitelarge. This is because for round-trip interest arbitrageto be profitable it is necessary to overcome the173 &
THE FUNDAMENTAL INTERNATIONAL PARITY CONDITIONSBr $$ 0 $ 0$ n$ nr $IS($/ask£) S($/ask£)F n ($/bid£)S($/bid£)£ 0 £r I 0£$ borrowing – £ investment £ borrowing – $ investment(a) Round-trip covered interest arbitrager I$$ 0 $ n$ 0£ 0£ nF n ($/ask£)S($/bid£)£ n £ 0£r Bnr I ££r $Br £B£ n$ nF n ($/bid£) F n ($/ask£)Spot dollars to future pounds(b) One-way covered interest arbitrage& Figure 8.6 One way and round-trip interest arbitrageFuture pounds to spot dollarsNotesRound-trip interest arbitrage, illustrated in (a), involves going along all four sides of the diagram at the interest ratesand exchange rates that are shown. The presence of four transaction costs allows for large deviations from interest parity.One-way interest arbitrage, illustrated in (b), involves comparing two alternative ways of going from one corner to anothercorner that is diagonally opposite. Either route involves two transaction costs, but since these are for the same types oftransactions, they do not cause deviations from interest parity.transaction costs in the foreign exchange marketsand the borrowing – lending spread on interestrates. Let us attach some numbers to see the size ofdeviations that might result. We shall use transactionscosts faced by the lowest cost arbitragers, suchas large commercial banks, since it is they who arelikely to act first and preclude others from profitingfrom interest arbitrage.Let us assume a potential interest arbitrager canborrow for 1 year at 1 4percent (25 basis points)above his or her investment rate, and can borrow& 174a sufficient amount to reduce the spot and forwardtransaction costs both to only 110of 1 percent. In thissituation, it is necessary that the interest-paritydeviation calculated using interest rates andexchange rates that exclude transaction costs wouldhave to be almost 1 2of 1 percent for profitablearbitrage. This is because it is necessary to earn 1 4 ofone percent to cover the borrowing – investmentspread, and another 1 5of 1 percent to cover the twoforeign exchange transaction costs, those for thespot and forward exchange transactions, both being
INTEREST PARITYF 1 ($/£)–S($/£)S($/£)1+r £Incentive to borrow in dollarsand invest in pounds.020.015.010.005Unprofitable arbitrage–.020–.015–.010-–.005 .005 .010 .015 .020(r $ – r £ )Unprofitable arbitrage–.005–.010–.015–.020Incentive to borrow in poundsand invest in dollars& Figure 8.7 Interest parity in the presence of transaction costs, political risk, orliquidity premiumsNotesInterest parity might not hold exactly because of transaction costs, political risk, and liquidity preference. This meansinterest rates and exchange rates may not plot on the interest-parity line. Rather, they may be somewhere within a bandaround the line; only outside this band are the covered yield differences enough to overcome the costs and/or political riskof covered interest arbitrage. However, the band is narrow because there are some participants for whom the costs andpolitical risk of arbitrage are unimportant or irrelevant. For example, transaction costs are irrelevant for one-way arbitragers.110of 1 percent. This is illustrated in Figure 8.7. Wecan interpret the interest rates on the horizontal axisas the midpoints between the borrowing andlending rates, and the exchange rates on the verticalaxis as the midpoints between the ‘‘bid’’ and ‘‘ask’’rates.We show a band around the interest-parity linewithin which round-trip interest arbitrage isunprofitable. This band has a width of approximately1 2percent on either side of the interest-parityline, as is seen, for example, along the horizontalaxis around the origin. The band reflects the factthat arbitrage must cover the 1 2percent lost intransaction costs/spreads. Above and to the left ofthe band it is profitable to borrow in dollars andmake covered investments in pounds, and to theright of the band it is profitable to do the reverse. 1414 If interest rates were for 3 months rather than 1 year, theband would be considerably wider. Even if the borrowing –lending spread remained at 1 4of 1 percent and the foreignexchange transaction costs remained at 110of 1 percent, theband would be more than one full percent on either side ofthe interest-parity line. The reason is that the costsof buying spot and selling forward are incurred within a3-month period, and when annualized are effectively 4 timeslarger. With 1 5percent lost in 3 months, it is necessary forthe interest arbitrage to generate 4 5of a percent to coverforeign-exchange costs, plus 1 4of a percent to cover theborrowing–lending spread. If we were dealing with1-month or shorter arbitrage, the potential deviationsfrom interest parity would be even larger.175 &
THE FUNDAMENTAL INTERNATIONAL PARITY CONDITIONSLet us next consider the implication of one-wayarbitrage.One-way arbitrage can come in various forms.However, we need to consider only the form whichinvolves the lowest transaction cost, because it isthis arbitrage that will determine the maximumdeviation from interest parity; just as the arbitragerwith the lowest cost of interest arbitrage drivesinterest rates and exchange rates to levels closest tothe interest-parity line, so it is that the form of onewayarbitrage that faces the lowest transaction costdrives us closest to the parity line.Let us consider first the one-way interest arbitrageillustrated by the left-hand diagram in part b ofFigure 8.6. This shows an arbitrager holding dollars($ 0 ) who wants pounds in the future (£ n ), perhapsto pay for something purchased from Britain. 15 Thearbitrager has two choices to go from currentdollars to future pounds. The dollars can be soldfor pounds on the spot market and invested inpound-denominated securities until the pounds areneeded, or the dollars can be invested in dollarsecurities and forward pounds can be purchased.The first of these choices is illustrated by thedownward-pointing arrow on the left of the diagramfrom $ 0 to £ 0 and the rightward-pointingarrow along the bottom from £ 0 to £ n . The secondchoice is illustrated by the upper rightward-pointingarrow from $ 0 to $ n and the downward-pointingarrow on the right from $ n to £ n . We note that bothroutes take the arbitrager from today’s dollars, $ 0 ,to future pounds, £ n . The choice is to pick the routeproviding the future pounds at lower cost.15 The use of the term ‘‘arbitrager’’ in this context stretchesthe usual meaning of the term, because we have assumedthat dollars are already held, and that there is already a needfor pounds in the future. Without engaging in excessivesemantics we can note that the essence of what our‘‘arbitrager’’ is doing is judging which of two ways of goingfrom current dollars to future pounds is the cheaper. Thischoice of the preferred route is the same type of choicemet in deriving cross exchange rates in Chapter 2. Theterm ‘‘arbitrage’’ comes from ‘‘arbitrate,’’ which means‘‘choose.’’ However, a reader who still objects to theterm ‘‘arbitrager’’ can substitute his or her own term; theconclusion is the same whatever word we use.& 176If the choice that is made is to invest in dollarsecurities and buy pounds forward, each poundpurchased will cost $F n ($/ask£). In order to have thismany dollars in n-years requires investing today at r I $$ F nð$/ask£Þð1 þ r I $ Þnð8:21ÞThis is the cost per pound using the dollar investment,forward pound route from $ 0 to $ n . If theother choice is made, that is, to buy poundsimmediately and invest in pound-denominatedsecurities for n years, the number of pounds thatmust be purchased immediately for each pound tobe obtained in n years is1£ð1 þ r I ð8:22Þ£ ÞnThe cost of this number of pounds at the spot priceof pounds, S($/ask£), is:$ Sð$/ask£Þð1 þ r I ð8:23Þ£ ÞnIn the same way that we saw that there are forcespushing interest rates and exchange rates to theinterest-parity line, there are forces making theamounts in equations (8.21) and (8.23) equal toeach other. For example, if equation (8.23) gave alower cost per pound than equation (8.21), therewould be spot purchases of pounds and fundsinvested in pound-denominated securities. Theseactions would increase S($/ask£) and reduce r I £ .Atthe same time, the lack of forward pound purchaseswould reduce F n ($/ask£), and the capital outflowfrom the United States would increase r I $ . Thechoice between alternatives would therefore drivethem to the same cost, that is,F n ð$/ask£Þð1 þ r I $ Þn¼ Sð$/ask£Þð1 þ r I £ ÞnWe can rewrite (8.24) asð1 þ r I $ Þn ¼ F nð$/ask£ÞSð$/ask£Þ ð1 þ rI £ Þnð8:24Þð8:25Þ
INTEREST PARITYIf the sizes of transaction costs in the spot andforward foreign exchange markets were the same,then equation (8.25) would plot as a 45-degreeline through the origin in the interest-paritydiagram, Figure 8.7. This is because we haveinvestment interest rates on both sides of theequation, and we have ‘‘ask’’ exchange ratesfor both the forward and spot transactions. 16 Thismeans that if spot and forward transaction costswere equal, the choice we have described woulddrive us all the way to the interest-parity line eventhough there are transaction costs. The reason thishappens is that either method of going from $ 0 to£ n requires buying pounds, the only differencebeing whether they are purchased on the spot orthe forward market. Therefore, transactioncosts will be paid whatever choice is made. Similarly,investment interest rates are earned if thechoice is to buy pounds spot or forward, the onlydifference being in which currency the interest isearned.Another form of one-way interest arbitrage isillustrated by the lower right-hand diagram inFigure 8.6b. The choice in this case is between twoways of going from £ n to $ 0 . (A US exporter who isto receive pounds and needs to borrow dollarswould be interested in going from £ n to $ 0 .) Thetwo ways of going from the £ n to $ 0 involve eithergoing from £ n to £ 0 by borrowing pounds, and thenfrom £ 0 to $ 0 via the spot market, or going from £ nto $ n via the forward market, and from $ n to $ 0 byborrowing dollars.If the route that is taken from £ n to $ 0 is toborrow pounds and sell them spot for dollars, thenumber of pounds that can be borrowed today for16 That is, because both exchange rates are ‘‘ask’’ rates, theexchange rates in the numerator and denominator ofequation (8.25) are both on the high side of the bid-askspread. To the extent that transaction costs in the spot andforward markets are equal, they cancel. Similarly, becausethe interest rates on the two sides of equation (8.25) areinvestment rates, they are both on the low side of theborrowing-lending spread. The cost-component againcancels.each pound to be repaid in n years is1£ð1 þ r B £ ÞnThis number of pounds, when sold spot for dollars,provides$ Sð$/bid£Þð1 þ r B £ Þnð8:26ÞThe alternative route of selling pounds forward andborrowing dollars means receiving in the future foreach pound sold$F n ð$/bid£ÞThe number of dollars that can be borrowed todayand repaid with these pounds is$ F nð$/bid£Þð1 þ r B $ Þnð8:27ÞThe dollar amounts in equations (8.26) and (8.27)show the dollars available today, $ 0 , for each poundin the future, £ n . The choice between the alternativeways of obtaining dollars will drive exchangerates and interest rates to the point thatthat is,Sð$/bid£Þð1 þ r B ¼ F nð$/bid£Þ£ Þn ð1 þ r B $ Þnð1 þ r B $ Þn ¼ F nð$/bid£ÞSð$/bid£Þ ð1 þ rB £ Þnð8:28ÞAgain, if forward and spot transaction costs areequal, this is an exact interest-parity line; we haveborrowing interest rates on both sides, and bothexchange rates are bid rates.In fact, forward exchange transaction costs arehigher than spot costs – recall from Chapter 3 thatforward spreads are wider than spot spreads – andso equation (8.25) and equation (8.28) mightdiffer a little from the interest-parity line drawnwithout transaction costs. However, the departures177 &
THE FUNDAMENTAL INTERNATIONAL PARITY CONDITIONSr B$ r I$$ 0 $ n $ 0$ nS($/ask£)F n ($/ask£)S($/bid£)F n ($/bid£)£ 0 £r I n £ 0££r Bn£(a) Pounds needed in future(b) Need to sell pounds& Figure 8.8 A more roundabout one-way arbitrageNotesWe can reduce the band around the interest-parity line by considering whether to use the forward market or the spot marketplus money markets. This choice, however, involves one transaction versus three transactions and is likely to leave largerdeviations from interest parity than other, more similar one-way arbitrage choices.will be much smaller than those obtained fromconsideration of round-trip interest arbitrage. 17This is because round-trip interest arbitrageinvolves the borrowing – investment interest-ratespread and foreign exchange transaction costs ofbuying spot and selling forward, or of buyingforward and selling spot. On the other hand, onewayarbitrage does not involve interest-ratespreads, and foreign exchange transaction costs arefaced whatever choice is made.The one-way arbitrage we have described producesthe interest-parity line because we haveestablished situations where the arbitrager has in anycase to buy/sell foreign exchange and to invest/borrow. An alternative one-way arbitrage is a choicebetween buying/selling forward on the one hand,and buying/selling spot and using the money17 In fact, even if there are transaction cost differencesbetween spot and forward exchange, when all one-wayarbitrages are considered simultaneously with arequirement that there is both supply and demand inevery market, interest parity holds exactly. This is shown inMaurice D. Levi, ‘‘Non-Reversed Investment andBorrowing, Transaction Costs and Covered InterestParity,’’ <strong>International</strong> Review of Economics and <strong>Finance</strong>, 2,1992, pp. 107–19.& 178markets on the other hand. 18 For example anarbitrager could buy pounds forward, or alternativelycould borrow dollars, buy pounds spot, andinvest the pounds. Either way the arbitragerreceives pounds in the future and has to deliverdollars. This is illustrated in Figure 8.8a, where thearbitrager can go from $ n to £ n via the forwardmarket (the downward-pointing arrow on the righthandside), or by borrowing dollars (the upperleftward-pointing arrow), buying pounds spot withthe borrowed dollars (the left-hand downwardpointingarrow), and investing in pounds (the lowerrightward-pointing arrow). This one-way arbitragedoes make foreign exchange transaction costs irrelevant,or at least less relevant, because it involves askrates in either case. However, it does not avoid theborrowing – investing spread. It does not, therefore,take us as close to the interest-parity line as the typeof one-way arbitrage we considered. We reachthe same conclusion if we consider the reverseforward exchange, going from £ n to $ n , versus the18 This is the more usual one-way arbitrage considered inexplaining why transaction costs are not important. Forexample, see Alan V. Deardorff, ‘‘One-Way Arbitrage andits Implications for the Foreign Exchange Markets,’’ Journalof Political Economy, April 1975, pp. 351–64.
INTEREST PARITYalternative of borrowing pounds, using these to buydollars spot, and investing the dollars. This isillustrated in Figure 8.8b; it again gives a line furtherfrom the interest-parity line than the one-wayarbitrage we described.An alternative way of concluding that the deviationsfrom interest parity as a result of transactioncosts are small is to consider the choice faced bythird-country borrowers and investors. For example,if Japanese or German investors and borrowersare looking for the best currency to invest or borrow,they will drive the situation between dollarsand pounds to the interest-parity line. This isbecause the Japanese or Germans pay foreignexchange costs whatever the currency of theirinvestment or borrowing, and compare investmentrates in the two currencies, or borrowing rates in thetwo currencies. 19 For this reason, or because of thepresence of one-way arbitrage, we can expectdeviations from interest parity to be too small forround-trip arbitrage to ever occur. We concludethat transaction costs are probably not a cause ofdeviations from interest parity. 20Political risk and interest parityWhen securities denominated in different currenciestrade in different countries, deviations from interestparity can result from political risk. Politicalriskinvolves the uncertainty that while funds are investedin a foreign country, they may be frozen, becomeinconvertible into other currencies, or be confiscated.Even if such extremes do not occur, investorsmight find themselves facing new or increased19 This assumes that cross exchange rates of pounds for yen orpounds for euros do not have a larger bid-ask spread thandirect yen-dollar or euro-dollar exchange rates. Whencross-exchange-rate spreads are larger, dollar investmentsand borrowing will be favored.20 The arguments we have given for transaction costs to be aminor or irrelevant reason for deviation from interestparity can be supplemented by an argument advanced byKevin Clinton involving the trading of swaps. See KevinClinton, ‘‘Transaction Costs and Covered InterestArbitrage: Theory and Evidence,’’ Journal of PoliticalEconomy, April 1988, pp. 358–70.taxes in the foreign country. Usually, the investmentthat involves the least political risk is at home; if fundsare invested abroad, to the risk of tax or otherchanges at home is added the risk of changes inanother political jurisdiction. However, it is possiblethat for investors in some countries, it is politicallyless risky to send funds abroad. This will be true ifinvestors thereby avoid politically risky possibilities athome. For example, people in some volatile countrieshave invested in Switzerland and the UnitedStates for political safety. In these circumstances, aforeign investment might be made even at a coveredinterest disadvantage. In general, however, weexpect investors to require a premium from a foreigninvestment versus a domestic investment.In diagrammatic terms, political risk creates aband like that shown in Figure 8.7; only in the areabeyond some covered differential is there anincentive to invest abroad. 21 The political risk banddoes not have to be of equal width on the two sidesof the interest-parity line if one country is viewed asriskier than the other. For example, Canadian yieldsare generally a little higher than US yields, evenafter allowance for forward hedging. This can beattributed to US investors viewing Canada as beingpolitically more risky than Canadians view the US,thereby causing a larger political-risk premium onCanadian securities than on US securities.It is important to remember that politicalrisk relates to the country, not the currency, ofinvestment. For example, there is no political riskinvolved in the deviations from covered interestparityin Table 8.1 because the yields are assumed tobe on different currency bank deposits in London.That is, there are no political differences between theinstruments in Table 8.1, but rather only differencesin the currencies of denomination. Indeed, by comparingyield differences when there are no politicaldifferences – as on bank deposits (covered) in a givencountry – with yield differences when there are21 Of course, political risk does not create a band via theborrowing decision. Borrowers have to pay back their loanswhatever happens in the country from which theyborrowed.179 &
THE FUNDAMENTAL INTERNATIONAL PARITY CONDITIONSpolitical differences – as on Treasury bills (covered)in different countries – it is possible to estimate theimportance of political risk. The extra spread whenpolitical risk is faced versus when it is not faced isa measure of the political risk premium. 22Even when covered yields are on instrumentswhich trade in different countries, third-countryinvestors might force interest rates and exchangerates onto the interest-parity line. For example, ifJapanese investors view the United States andBritain as equally risky politically from their perspective,then they will drive the interest rates andexchange rates for the United States and Britainonto the interest-parity line. This is true even ifinvestors in the United States and Britain perceiveforeign investment as riskier than investment athome. Of course, if conditions are driven onto theinterest-parity line, this will encourage US andBritish investors to keep funds at home, becauseneither is receiving compensation for the perceivedrisk of investing in the other country.Taxes and interest parityIf taxes are the same on domestic and on foreigninvestment and borrowing, then the existence oftaxes will make no difference in our investment andborrowing criteria or the interest-parity line; taxeswill cancel out when yield comparisons are made.However, if tax rates depend on the country inwhich funds are invested or borrowed, the interestparitycondition will be affected. There are twoways in which taxes could conceivably affect theparity condition. One way involves withholdingtaxes, and the other involves differences betweenthe tax rate on income and that on capital gains. Letus consider these in turn.Withholding taxesOne might think that a potential cause of higher taxeson foreign earnings than on domestic earnings, and22 See Robert Z. Aliber, ‘‘The Interest Parity Theorem:A Reinterpretation,’’ Journal of Political Economy,November/December 1973, pp. 1451–9.& 180hence a band around the interest-parity line, is theforeign resident withholding tax. A withholdingtax is a tax applied to foreigners at the sourceof their earnings. For example, when a Canadian residentearns $100 in the United States, the payer of that$100 is required to withhold and remit 15 percent ofthe earnings to the US Internal Revenue Service.Similarly, the earnings of US residents in Canada aresubject to a withholding tax. Withholding taxes,however, are unlikely to offer a reason for a bandaround the covered interest-parity line.As long as the rate of withholding is less than orequal to the tax rate that would be applied to theearnings at home, domestic withholding taxcredits that are designed to avoid double taxationof income will offset the tax withheld. For example,suppose that a resident of the United States pays theequivalent of $15 on $100 of interest or dividendsearned in Canada, and the total tax payable onthe $100 when declared in the United States is$25. The Internal Revenue Service will grant theUS resident a $15 credit on taxes paid to thetaxing authority in Canada. Only an additional $10will be payable in the United States. The investorends up paying a total of $25, which is the same asshe would have paid on $100 earned at home.Complete or full withholding tax credit leaves noincentive to choose domestic securities rather thanforeign securities. Only if withholding tax creditsare less than the amounts withheld will there be areason to keep money at home. 23 This means thatthe interest-parity condition is in general notaffected, and we have no band around the parity lineas a result of withholding taxes.Capital gains versus income taxesTaxes can affect the investment and borrowingcriteria and the interest-parity condition if investorspay different effective tax rates on foreign exchange23 Even when full credit is obtained, interest earnings are loston the funds withheld in comparison with what might havebeen earned if taxes had been paid at home at the end of thetax period. This should, however, be a relatively smallconsideration except when interest rates are very high.
INTEREST PARITYearnings than on interest earnings. This can be thesituation for investors who infrequently buy or sellforeign exchange. This is because such investors canobtain capital-account treatment of their foreignexchange gains or losses; gains and losses are normallygiven capital-account treatment if they arenot part of the ‘‘normal conduct of business.’’ 24 Ifthe tax rate on capital gains is lower than thaton ordinary income, this affects the slope of theinterest-parity line. Let us see how, by considering aUS investor who pays a lower effective tax rate oncapital gains than on interest income. 25Let us write the US investor’s tax rate on capitalgains as t K and the US tax rate on income as t Y , and letus assume that for this particular investor, t Y > t K .Since all interest earnings are considered to beincome, after paying taxes and ignoring transactioncosts the US investor will receive from each dollarinvested in dollar-denominated securities for 1 year1 þð1 t Y Þr $ ð8:29ÞThat is, the investor will lose a fraction t Y of theinterest earned. If he or she instead invests in poundsecurities, then before taxes the US dollar receiptswill beF 1 ð$/£ÞSð$/£Þ ð1 þ r £Þ¼ F 1ð$/£Þ Sð$/£ÞSð$/£Þorð1 þ r £ Þþð1 þ r £ ÞF 1 ð$/£ÞSð$/£Þ ð1 þ r £Þ¼ 1 þ r £ þ F 1ð$/£Þ Sð$/£Þð1 þ r £ ÞSð$/£Þ24 Even where the tax rate on realized capital gains is the sameas on ordinary income, the effective tax rate on capital gainsis lower if capital gains can be deferred, or if there arecapital losses against which the capital gains can be taken. Inmany countries the actual tax rate on capital gains is lowerthan that on ordinary income.25 For the conditions for capital-account treatment of foreignexchange earnings, see Martin Kupferman and Maurice D.Levi, ‘‘Taxation and the <strong>International</strong> Money MarketInvestment Decision,’’ Financial Analysts Journal, July/August 1978, pp. 61–4.We have expanded the total dollar payback intothree parts; the principal; the interest earned on thepounds; and the earnings/losses from exchange ratepremiums/discounts on the principal and interest,(1 þ r £ ). After taxes, if capital gains taxes are paidon foreign exchange earnings, even when hedged,the investor will receive only (1 t Y ) of theinterest and (1 t K ) of the gain from the forwardpremium, that is,1 þð1 t Y Þr £ þð1 t K Þ F 1ð$/£Þ Sð$/£Þð1 þ r £ ÞSð$/£Þð8:30ÞWe have used the income tax rate t Y on r £ , since allinterest, whatever the currency or country ofsource, is subject to that rate.We can show the effect of taxes in terms of thegraphical presentation of interest parity if we proceedthe same way as we did when we includedtransaction costs. The US investor for whom wehave assumed t Y > t K will be indifferent betweeninvesting in dollar or pound securities if theamounts in equations (8.29) and (8.30) are equal.This requires thatr $ r £ ¼ 1 t k F 1 ð$/£Þ Sð$/£Þ1 t Y Sð$/£Þð1 þ r £ Þð8:31ÞIn comparing equation (8.31) with the equation forthe interest-parity line in Figure 8.4, which isr $ r £ ¼ F 1ð$/£Þ Sð$/£Þð1 þ r £ ÞSð$/£Þwe see that differential taxes on income versuscapital gains/losses adds (1 t K )/(1 t Y ) to thefront of the forward premium/discount term.When the capital gains tax rate is lower than theincome tax rate,1 t K1 t Y> 1181 &
THE FUNDAMENTAL INTERNATIONAL PARITY CONDITIONSFor example, if t K ¼ 0.10 and t Y ¼ 0.25, then1 t K1 t Y¼ 1:20This means that the line of indifference for investorswho face lower taxes on foreign exchange earningsthan on interest income is flatter than the 45-degreeinterest-parity line in Figure 8.4; each percentchange in ½F 1 ($/£) S($/£)Š/½S($/£)Š(1 þ r £ )on the vertical axis in Figure 8.4 is associated withmore than a 1 percent change in r $ r £ on thehorizontal axis.While some investors may enjoy a lower tax rateon foreign exchange than on interest earnings,banks and other major financial market playersdo not; such investors, for whom internationalinvestment is part of their normal business, pay thesame tax on interest and foreign exchange earnings.For this reason we can expect interest rates andexchange rates to remain on the 45-degree interestparityline; banks will take positions until thesituation is on the line. This implies that thoseinvestors who do pay lower taxes on foreignexchange earnings than on interest income may findvaluable tax arbitrage opportunities. For example,suppose interest rates and exchange ratesare such that interest parity holds precisely on abefore-tax basis with:r $ ¼ 8%r £ ¼ 4%F 1 ð$/£Þ Sð$/£Þð1 þ r £ Þ¼4%Sð$/£ÞFor a US investor for whom t Y ¼ 0.25 andt K ¼ 0.10, US investments yield (1 t Y )r $ ¼ 6percent after tax, while covered pound investmentsyield after tax:ð1 t Y Þr £þð1 t Y Þ F 1ð$/£Þ Sð$/£Þð1 þ r £ ÞSð$/£Þ¼ 6:6%The pound investment will be preferred on anafter-tax basis even though interest parity holdson a before-tax basis. More generally, if coveredinterest-parity holds on a before-tax basis, investorswith favorable capital gains treatment will preferinvestments denominated in currencies trading at aforward premium. It is a natural extension of ourargument to show that in the same tax situation,borrowers will prefer to denominate borrowing incurrencies at a forward discount. 26Liquidity differences and interest parityThe liquidity of an asset can be judged by howquickly and cheaply it can be converted into cash.For example, when a domestic-currency denominatedasset such as a 90-day security is sold beforematurity after only 50 days, domestic securityselling transaction costs must be paid that would nothave been incurred had the security been held tomaturity. If, however, a covered foreign-currency90-day investment is sold after only 50 days, morethan security selling costs are faced. This should beexplained carefully.The brokerage costs for selling a foreigncurrencydenominated security are likely to besimilar to those for selling a domestic-currencysecurity. However, transaction costs are faced wheninvestors convert on the spot exchange market,the foreign exchange received from the sale of theforeign-currency security. These costs would havenot been faced had the security been held tomaturity and the proceeds converted accordingto the original forward contract. Further, when aforeign-currency denominated security is sold priorto maturity and the funds are converted intodomestic currency, there is still the matter ofhonoring the original forward contract to sell the26 This is because the high interest rates they pay are taxdeductible.For more on taxes and interest parity seeMaurice D. Levi, ‘‘Taxation and ‘Abnormal’ <strong>International</strong>Capital Flows,’’ Journal of Political Economy, June 1977,pp. 635–46.& 182
INTEREST PARITYforeign exchange at the maturity of the foreigncurrencyinvestment. If cash managers want toavoid the foreign exchange risk that would be facedby leaving the original forward contract in effect,they must cover their position. In our example, ifthere is a 90-day forward contract and the fundsare converted into domestic currency after only50 days, the investor should buy a new forwardexchange contract of 40 days maturity. This purchaseof forward foreign exchange will offset thesale of foreign exchange that was part of the originalcovered investment. At the conclusion of the full90-day period, the foreign exchange that was originallysold forward will be obtained from thatbought forward 40 days previously.The extra spot and forward exchange transactioncosts from the premature sale of a foreign-currencyinvestment require an initial advantage of coveredforeign investment to make the initial investmentworthwhile. There is also uncertainty at the time ofthe original investment concerning what the spotrate will be if redemption is early and what the ratewill be for offsetting the original forward contractwith a reverse contract. The transaction costs anduncertainty make foreign covered investments lessliquid than domestic investments. Liquiditypreference is hence another reason for a bandaround the covered interest-parity line. Theamount of extra required return and hence thepotential width of the band due to liquidity preferencedepend on the likelihood that the funds willbe needed early, and on whether these funds can beborrowed by using the original covered investmentto secure the loan. Since the required extra returndepends on the likelihood that the funds will beneeded, it is clear that this liquidity consideration isdifferent from the transaction costs considerationdiscussed earlier, which involved known amounts oftransaction costs. Liquidity does relate to transactioncosts, but these are expected costs. Clearly, if itis known that funds will not be required, or if it isknown that the foreign investment can be used asthe guarantee or security for borrowing funds, noforeign yield premium is required. The moreuncertainty there is concerning future needs andalternative sources of short-term financing, thehigher are the premiums that should be requiredbefore venturing into foreign-currency securities.This will mean wider bands around the interestparityline. 27As in the case of transaction costs and politicalrisk, the choice by third-country investors of whichcurrency-denominated securities to invest in shouldbe symmetrical as far as liquidity preference isconcerned. That is, if there is the same probabilityof needing to liquidate investments from eithercurrency and the same transaction costs if liquidationoccurs, liquidity preference in the presence ofthird-country investors should not cause deviationsfrom interest parity.Effect of the reasons for interest disparityon investment and borrowingEach investor or borrower must evaluate yields andborrowing costs from his or her own perspective.This means using exchange rates that includetransaction costs and consideration of applicable taxrates, and then comparing yield or borrowing-costdifferences with the difference the investor orborrower believes is necessary to compensate forthe risk or illiquidity that is faced. What we haveargued suggests that, transaction costs are likely towork towards keeping investing and borrowing inthe home currency. Withholding taxes are likely tomatter only if withholding rates are higher thandomestic tax rates, but differential taxes on interestincome versus capital gains could induce investorswith favorable capital gains treatment to place fundsin currencies at a forward premium. As for politicalrisk, this will create yield and cost differences thatare not exploitable for those facing the political risk,although the differences may be exploitable by27 It might be felt that movements in security values becauseof changes in market interest rates also affect the liquidity ofdomestic investment versus foreign investment. Althoughthe reason is not obvious, this view is not, in general,correct, because relative interest-rate movements shouldbe offset by exchange-rate movements, which are allrelated according to the interest-parity condition.183 &
THE FUNDAMENTAL INTERNATIONAL PARITY CONDITIONSothers. 28 A similar conclusion applies to liquiditypreference. That is, to the extent that interest paritydoes not hold because foreign investments are lessliquid, those investors for whom liquidity is notrelevant can enjoy higher yields. We can see thatit can pay to shop around when investing orborrowing, but it all depends on the specificcircumstances of the investor or borrower.SUMMARY1 Forward exchange markets allow short-term investors and borrowers to avoid foreignexchange risk and exposure.2 An investor should be indifferent with respect to investing in domestic or foreign currencywhen the domestic-currency interest rate equals the foreign-currency rate plus theannualized forward exchange premium or discount on the foreign currency. The investorshould invest in domestic currency when the domestic-currency interest rate exceedsthe foreign-currency rate plus the forward premium/discount on the foreign currency,and vice versa.3 A borrower should borrow in foreign currency when the domestic-currency interestrate exceeds the foreign-currency rate plus the forward foreign exchange premium ordiscount, and borrow in domestic currency when the domestic-currency interest rateis lower than the foreign-currency interest rate plus the forward foreign-exchangepremium or discount.4 Covered interest arbitrage involves borrowing in one currency to invest in another.It is profitable when there are differences between covered borrowing costs andinvestment yields.5 The covered interest-parity condition states that there will be no advantage to borrowingor lending in one currency rather than another. Forces set up by interest arbitragerswill move the money and foreign exchange markets towards covered interest parity.6 The uncovered interest-parity condition states that the differences between interestrates equals the market’s expected change in the exchange rate.7 The uncovered interest-parity condition and the PPP condition in terms of expectedinflation can be used to derive the equality of real rates of return between countries.This latter relationship is the Fisher-open condition, which has an independent rationale.8 If round-trip arbitrage were the only force moving exchange rates and interest ratestowards interest parity, the deviations could be relatively large. This is because it wouldbe necessary to be compensated in the covered interest differential for foreign exchangetransaction costs and borrowing–lending spreads on interest rates.9 One-way interest arbitrage involves choosing between alternative ways of going fromcurrent dollars/pounds to future pounds/dollars. Because the choices involve the same28 Those that can exploit differences are third-country investors for whom the political risks are similar, and borrowers for whompolitical risks are irrelevant. Borrowers will tend to borrow in the low-risk countries because covered interest costs there canremain lower than elsewhere.& 184
INTEREST PARITYtransaction costs whichever route is taken, one-way arbitrage should drive markets veryclose to covered interest parity.10 Third-country investors or borrowers who face the same transaction costs whichevercurrency of denomination they choose for borrowing or investment should also drivemarkets very close to covered interest parity.11 Political risks can also cause deviations from interest parity between countries, and allowa band around the interest-parity line, because investors from each country needcompensation for the greater risk of investing in the other country. However, if investorsoutside the two countries view the countries as equally risky politically, they will drivemarkets to interest parity.12 Withholding taxes do not normally affect the interest-parity condition.13 For those who face differential taxes on income versus capital gains, the relevantinterest-parity line has a different slope than the conventional interest-parity line.However, since banks pay the same tax on interest and foreign exchange gains, interestdisparity should not result from differential taxes.14 Covered foreign-currency investments are less liquid than domestic-currency investmentsbecause extra exchange transaction costs and uncertainties are met on liquidatingcovered foreign-currency securities. The liquidity relates to expected rather than actualtransaction costs.15 Each investor or borrower must evaluate opportunities from his or her own perspectiveof transaction costs, taxes, political risks, and liquidity concerns. There can beadvantages from shopping around.REVIEW QUESTIONS1 What is the ‘‘money market?’’2 How does a forward-covered investment avoid exchange rate risk?3 According to covered interest parity, if the British pound is at a forward premiumvis-à-vis the US dollar, what do we know about pound versus dollar interest rates?4 What is ‘‘covered interest arbitrage?’’5 Does the covered interest-parity condition arise from different perspectives? Name them.6 If the covered yield on pound-denominated securities were to become temporarilyhigher than on dollar securities, what would happen to interest rates and thespot and forward exchange rates?7 What is ‘‘uncovered interest-parity?’’8 What is the ‘‘Fisher-open condition?’’9 What conditions together imply the Fisher-open condition?10 What is ‘‘round-trip interest arbitrage?’’11 Can transaction costs affect interest parity?12 Does political risk affect covered yields on different currency-denominated depositsat London banks?185 &
THE FUNDAMENTAL INTERNATIONAL PARITY CONDITIONS13 Does political risk affect covered yields on US government versus Canadiangovernment bills?14 What is a ‘‘withholding tax credit?’’15 Do low rates of withholding tax affect covered interest parity?16 What is ‘‘liquidity preference,’’ and can it affect covered interest parity if peoplecan borrow without penalty against covered foreign-currency assets?ASSIGNMENT PROBLEMS1 Derive the criteria for making covered money-market investment and borrowingdecisions when the exchange rates are given in European terms. Derive the equivalentof equation (8.4).2 You have been given the following information:r $ r £ S($/£) F 1/4 ($/£)5% 6% 1.5000 1.4985where r $ ¼ annual interest rate on 3-month US-dollar commercial paperr £ ¼ annual interest on 3-month British-pound commercial paperS($/£) ¼ number of dollars per pound, spotF 1/4 ($/£) ¼ number of dollars per pound, 3-months forwardOn the basis of the precise criteria:a In which commercial paper would you invest?b In which currency would you borrow?c How would you arbitrage?d What is the profit from interest arbitrage per dollar borrowed?3 a Use the data in Question 2 and the precise formula on the right-hand side ofequation (8.4) to compute the covered yield on investment in pounds. Repeat thisusing the approximate formula on the right-hand side of equation (8.5).b Compare the error between the precise formula and the approximate formulain ‘‘a’’ above with the error in the situation where r $ ¼ 15 percent, r £ ¼ 16 percent,and S($/£) and F 1/4 ($/£) are as above.c Should we be more careful to avoid the use of the ‘‘interest plus premium or minusdiscount’’ approximation in equation (8.5) at higher or at lower interest rates?d If the interest rates and the forward rate in Question 2 are for 12 months, is thedifference between equation (8.4) and equation (8.5) greater than when we aredealing with 3-month rates?4 Derive the equivalent of Table 8.1 where all covered yields are against pounds rather thandollars. This will require computing appropriate cross spot and forward rates.5 Draw a figure like Figure 8.4 to show what interest arbitrage will do to the interest-ratedifferentials and the forward premiums at points A to F in the table below. If all the& 186
INTEREST PARITYadjustment to the interest parity occurs in the forward exchange rate, what willF 1/12 ($/£) be after interest parity has been restored?A B C D E FS($/£) 1.6200 1.6200 1.6200 1.6200 1.6200 1.6200F 1/12 ($/£) 1.6220 1.6150 1.6220 1.6150 1.6180 1.6120r $ (1 month), % 8.00 8.00 8.00 8.00 8.00 8.00r £ (1 month), % 10.00 9.00 8.00 7.00 6.00 5.006 Write down the expectations form of PPP, the uncovered interest-parity condition,and the Fisher-open condition. Derive each one from the other two.7 Assuming that there are a large number of third-country borrowers and investors,do you think that political risk will cause larger deviations from interest parity thanare caused by transaction costs?8 If banks are as happy to advance loans that are secured by domestic-currencymoney-market investments as they are to advance loans secured by similarforeign-currency covered money-market investments, will firms preferdomestic-currency investments on the grounds of liquidity?9 How does the importance of liquidity relate to the probability that cash will be needed?10 Use the framework of Figure 8.7 to show how the band within which one-way arbitrageis unprofitable compares to the band within which round-trip arbitrage isunprofitable.11 Why might a borrower want to borrow in a currency that is at a forward discount ifthat borrower faces a higher tax rate on interest income than on capital gains?12 Why does the Fisher-open condition relate to countries rather than currencies?13 In general, are transactions costs higher in spot or forward markets? Does this holdany implications for whether interest parity will hold exactly?14 What role does the rest of the world play in determining whether coveredinterest parity will hold between any two currency-denominated securities?15 Suppose that real interest rates are equal for all countries in the world. Does thisimply anything for the relationship between covered interest-rate parity andthe PPP condition?BIBLIOGRAPHYAliber, Robert, Z. and Clyde P. Stickney, ‘‘Accounting Measures of Foreign Exchange Exposure: The Long andShort of It,’’ The Accounting Review, January 1975, pp. 44–57.Bahmani-Oskooee, Mohsen and Satya P. Das, ‘‘Transaction Costs and the Interest Parity Theorem,’’ Journal ofPolitical Economy, August 1985, pp. 793–9.Blenman, Lloyd P. and Janet S. Thatcher, ‘‘Arbitrage Opportunities in Currency and Credit Markets:New Evidence,’’ <strong>International</strong> Journal of <strong>Finance</strong>, 3, 1995.187 &
THE FUNDAMENTAL INTERNATIONAL PARITY CONDITIONSBlenman, Lloyd P. and Janet S. Thatcher, ‘‘Arbitrage Heterogeneity, Investor Horizon and Arbitrage Opportunities:An Empirical Investigation,’’ Financial Review, 30, 1995.Blenman, Lloyd P., Louis Henock, and Janet S. Thatcher, ‘‘Interest Rate Parity and the Behavior of the Bid-AskSpread,’’ Journal of Financial Research, 22, 1999, pp. 189–206.Branson, William H., ‘‘The Minimum Covered Interest Needed for <strong>International</strong> Arbitrage Activity,’’ Journal ofPolitical Economy, December 1969, pp. 1029–34.Clinton, Kevin, ‘‘Transaction Costs and Covered Interest Arbitrage: Theory and Evidence,’’ Journal of PoliticalEconomy, April 1988, pp. 358–70.Deardorff, Alan V., ‘‘One-Way Arbitrage and Its Implications for the Foreign Exchange Markets,’’ Journal ofPolitical Economy, April 1979, pp. 351–64.Frenkel, Jacob A. and Richard M. Levich, ‘‘Covered Interest Arbitrage: Unexploited Profits?,’’ Journal of PoliticalEconomy, April 1975, pp. 325–38.Giddy, Ian H., ‘‘An Integrated Theory of Exchange Rate Equilibrium,’’ Journal of Financial and QuantitativeAnalysis, December 1976, pp. 883–92.Harvard Business School, Note on Fundamental Parity Conditions, Case 9–288–016, 1994.Huang, Roger D., ‘‘Expectations of Exchange Rates and Differential Inflation Rates: Further Evidence onPurchasing Power Parity in Efficient Markets,’’ Journal of <strong>Finance</strong>, March 1987, pp. 69–79.Kubarych, Roger M., Foreign Exchange Markets in the United States, Federal Reserve Bank of New York,New York, 1978.Levi, Maurice D., ‘‘Non-Reversed Investment and Borrowing, Transaction Costs, and Covered Interest Parity,’’<strong>International</strong> Review of Economics and <strong>Finance</strong>, 1 (2), 1992, pp. 107–19.——, ‘‘Spot versus Forward Speculation and Hedging: A Diagrammatic Exposition,’’ Journal of <strong>International</strong>Money and <strong>Finance</strong>, April 1984, pp. 105–10.——, ‘‘Taxation and ‘Abnormal’ <strong>International</strong> Capital Flows,’’ Journal of Political Economy, June 1977,pp. 635–46.Lewis, Karen K., ‘‘Puzzles in <strong>International</strong> Financial Markets,’’ Working Paper, University of Pennsylvania,July 2000.Llewellyn, David T., <strong>International</strong> Financial Integration: The Limits of Sovereignty, Macmillan, London, 1980.Marston, Richard C., ‘‘Interest Differentials under Fixed and Flexible Exchange Rates: The Effects of CapitalControls and Exchange Risk,’’ Working Paper, University of Pennsylvania, May 2004.Officer, Lawrence H. and Thomas D. Willet, ‘‘The Covered-Arbitrage Schedule: A Critical Survey of RecentDevelopments,’’ Journal of Money, Credit and Banking, May 1970, pp. 247–57.Woodward, Robert S., ‘‘Some New Evidence on the Profitability of One-Way versus Round-Trip Arbitrage,’’Journal of Money, Credit and Banking, November 1988, pp. 645–52.& 188
Part IVManaging foreign exchange riskand exposureUntil this point our concern has been with the nature ofmarkets in which currencies and currency derivativestrade. The focus of the remainder of the book is withmanagerial issues, such as using international financialmarkets to deal with the special opportunities andrisks of international trade and investment. We shallsee on numerous occasions on this journey throughinternational managerial finance that an understandingof the financial markets and environment areessential elements of financial decision making. Thechapters in Part IV begin our journey with a discussionof the objectives of international financial managementand how to achieve these objectives. The focus ison operating issues, from the measurement of foreignexchange risk and exposure, to the methods andpotential for success of currency speculation.The opening chapter of Part IV, Chapter 9, takesus directly to the meaning of foreign exchangeexposure. It is shown that exposure is a measure ofthe sensitivity of changes in domestic currencyvalues of assets and liabilities to unanticipatedchanges in exchange rates. We show that surprisingly,domestic as well as foreign financial instrumentscan face foreign exchange exposure, and thatunder special circumstances, foreign financialinstruments may not be exposed. The chapter alsoexplains foreign exchange risk, a matter which isoften confused with exposure. Exchange-rate riskis shown to relate to the variability of domesticcurrency values of assets and liabilities, whereasexposure is the amount at risk. This makes riskand exposure conceptually and even dimensionallydifferent: the two concepts have different units ofmeasurement.Chapter 10 provides a brief introduction to internationalaccounting principles and how these impacton exposure as reflected in financial accounts –accounting exposure – versus true, underlying valuechanges – real exposure. While it is real exposure thatshould really matter to the owners of a multinationalfirm, values that show up in accounting statementscannot be ignored when, for example, taxes are basedon operating incomes as expressed in a company’s‘‘reporting currency.’’Chapter 11 is devoted to the effect of exchangerates on sales and operating profitability, so-called‘‘operating exposure.’’ Use is made of the microeconomictheory of the firm which emphasises marginalcost and marginal revenue. It is shown that theamount of operating exposure depends on such factorsas elasticity of demand and flexibility of production.The chapter ends with a consideration of situationswhere exchange rates have different effects on firmsin the short-run versus the long-run. This short-runversus long-run distinction for firms is analogous tothe short-run versus long-run distinction for the economyas a whole, met in Chapter 6 when we explainedthe J curve.With exposure and risk defined and explained inChapters 9, 10, and 11, in Chapter 12 we shiftattention to the management of exposure and risk. Webegin by asking whether managers should hedge
foreign exchange risk and exposure, or whether theyshould leave this to shareholders. Alternative meansof dealing with risk and exposure are contrasted andcompared using the building blocks of payoff profiles.This approach is sometimes called financialengineering.The opposite to hedging is speculation, whichinvolves purposefully taking exposed positions in foreignexchange. Chapter 13 begins by describingthe methods that exist for currency speculation. Thisleads naturally into a discussion of market efficiency,because as we shall show, speculation cannotbe persistently successful if foreign exchangemarkets are efficient. Chapter 13, and Part IV,end with a discussion of the successes andfailures of attempts to forecast exchange rates. Thisdiscussion appears alongside the discussions ofspeculation and market efficiency because, as weshall see, an ability to forecast exchange ratesand profit from such forecasts is closely related tomarket efficiency and the expected returns fromspeculation.
Chapter 9Foreign exchange exposureand riskIf you want the fruit you have to go out on a limb.Ancient sayingTHE IMPORTANCE OF UNDERSTANDINGRISK AND EXPOSURE ANDMEASURING THEMEven though foreign exchange (forex) riskand exposure have been central issues of internationalfinancial management for many years, considerableconfusion remains about what exactlythey are and how to measure them. For example, itis not uncommon to hear the term ‘‘foreignexchange exposure’’ used interchangeably with theterm ‘‘foreign exchange risk’’ when in fact exposureand risk are conceptually and even dimensionallycompletely different (as we shall explain,foreign exchange risk is related to the variabilityof domestic-currency values of assets or liabilitiesdue to unanticipated changes in exchange rates,whereas foreign exchange exposure is the amountthat is at risk). This chapter is devoted to clarifyingthe nature of, and methods of measurement of,risk and exposure, as well as to explaining the factorscontributing to them. Several subsequentchapters deal with the management of risk andexposure.Measurement of foreign exchange exposure andrisk is an essential first step in international financialmanagement. Without knowing how large a company’sexposure and risk are, it is difficult to knowhow much effort and cost it is worth incurringto manage them. For example, if exposure representsa tiny fraction of the firm’s value, it mightbe decided to ignore the matter, or at least leaveexposure management to the company’s shareholderswho can decide for themselves whether theexposure on a particular company is diversifiable orotherwise avoidable. 1 Furthermore, a company mayfind that it is exposed, but not at risk. This is possiblein a rigidly fixed exchange rate environmentsuch as Hong Kong or the People’s Republic ofChina through the 1990s and beyond. 2 Only bymeasuring exposure and risk can a company knowhow to allocate scarce corporate resources tothe management of different sources of uncertainty.Perhaps hedging of key inputs or prices of outputs ismore important for earnings stability than hedgingforeign exchange-related matters.1 The question of whether a company’s managers or thecompany’s shareholders should manage foreign exchangerisk is discussed in Chapter 12. We shall see there are somevalid reasons why shareholders may prefer that corporatemanagers hedge the risk on their behalf.2 As we shall see, while it is possible to be exposed and not beat risk, it is not possible to face foreign exchange riskwithout being exposed.191 &
MANAGING FOREIGN EXCHANGE RISK AND EXPOSURETHE NATURE OF EXCHANGE-RATERISK AND EXPOSUREDefinition of foreign exchange exposureForeign exchange exposure can be defined inthe following way:Foreign exchange exposure is the sensitivity ofchanges in the real domestic-currency value ofassets or liabilities to changes in exchange rates. 3Several features of this definition are worth noting.First, we notice that exposure is a measure ofthe sensitivity of domestic-currency values. That is,it is a description of the extent or degree to whichthe home-currency value of something is changedby exchange rate changes. This immediately suggestssome type of ratio. For example, it suggestsexposure takes the formExposure ¼DVð$Þð9:1ÞDSð$/dÞwhere in this instance we are considering exposureto a manager or shareholder who cares about USdollar values – the presumed domestic currency –to the exchange rate against the euro. If this ratio iszero, there is no exposure to the exchange rate. Thebigger is the ratio, whether the ratio is positive ornegative, the larger is the exposure to the euro.The second thing we notice in the definition isthat it is concerned with real domestic-currency values.By this we mean, for example, that from a USperspective exposure is the sensitivity of changesin real (i.e. inflation-adjusted) US-dollar values ofassets or liabilities to changes in exchange rates.3 Exposure was first defined this way by Michael Adler andBernard Dumas, ‘‘Exposure to Currency Risk: Definitionand Measurement,’’ Financial Management, Summer 1984,pp. 41–50. See also Christine R. Hekman, ‘‘MeasuringForeign Exchange Exposure: A Practical Theory and ItsApplication,’’ Financial Analysts Journal, September/October1983, pp. 59–65; and Lars Oxelheim and Clas G. Wihlborg,Macroeconomic Uncertainty: <strong>International</strong> Risks and Opportunitiesfor the Corporation, Wiley, New York, 1987.& 192A Euro-zone investor will be concerned with thesensitivity of real euro values. In other words,exposure to an American and a European on thesame asset or liability is different.Third, we notice that exposure exists on assetsand liabilities. Assets and liabilities are balance sheetitems. There are many ways that the value of assetsand liabilities can be affected by exchange rates. Thesimplest way is through the translation of foreigncurrencyvalues into domestic-currency valuesby multiplication of the relevant exchange rate. Forexample, a British stock trading for a given amountof pounds in London, changes in dollar value whenthere is a change in the dollar value of the pound.However, as we shall see, changes in the dollar–pound exchange rate can affect the pound value ofthe British stock. This is because exchange ratesaffect operating revenues and costs. For example,a decline in the value of the pound could makethe British company more competitive and increaseits profits. This could raise the stock price.Alternatively, if the British company depends onimports that become more expensive in poundswhen the dollar value of the pound goes down, thecompany may become less profitable and its shareprice could decline. The effects on revenues, costs,and profits are the result of operating exposureto exchange rates. This is also sometimes calledeconomic exposure. Foreign exchange exposurefrom effects on operations requires separate treatment,and is covered in a later chapter. Forthe moment we can note that operating exposurehas the dimension of a flow, so much per period oftime, unlike assets and liabilities which have a stockdimension, so much at a particular point in time.As we shall see when we focus on operatingexposure, the flow effects of exchange rates canbe converted to present values so that all exposurescan be considered to be measured at a pointin time.Fourth, we notice that we have not qualifiedthe list of exposed items by describing them asbeing foreign assets or liabilities. This is because,as we shall see, changes in exchange rates can affectdomestic as well as foreign assets and liabilities.
FOREIGN EXCHANGE EXPOSURE AND RISKFor example, companies that do not export orimport, but who compete in their domestic marketwith imported products, will find themselvesgaining when their own currency drops in valuebecause it makes the foreign companies less competitivein their own country’s market. Indeed, weshall see that not only is it possible to be exposedwithout being engaged in any sort of internationalinvestment or commerce, it is also possible to not beexposed when investing in foreign assets.It is worth mentioning that exposure, and moreimportantly risk, relate to unanticipated changes inexchange rates. This is because current marketprices should reflect changes in exchange rates thatare widely anticipated. Consequently, it is only tothe extent that exchange rates change by more orless than had been expected that there are likely tobe gains or losses on assets or liabilities. We shallconsider total changes in exchange rates in whatimmediately follows, not just the unanticipatedchange. However, when it comes to measuringexposure and risk, we will explain the importanceof distinguishing between changes in exchange ratesthat are expected and those that are a surprise.EXAMPLES OF FOREIGN EXCHANGEEXPOSUREWe can gain an understanding of exposure byconsidering a number of examples, starting with thesimplest case, and showing that all exposures areobtained by applying equation (9.1). Let us begin byconsidering exposure on what are generally referredto as contractual assets and contractualliabilities. In all cases we take the perspective ofan investor or borrower who is concerned with theUS dollar value of assets or liabilities. That is, thedomestic currency is taken to be the US dollar.Exposure on contractual assetsand liabilitiesContractual assets and liabilities are those withfixed face and market values. Examples of foreigncurrencycontractual assets are bank deposits andforeign-currency accounts receivable. Examples offoreign-currency contractual liabilities are loans andaccounts payable. Let us begin by considering theexposure on a bank deposit of d1,000.Contractual assets and liabilities are those withfixed face and market values, such as bankdeposits and accounts receivable, or bank loansand accounts payable.Exposure on a contractual assetTable 9.1 shows values of the bank deposit beforeand after a change in the exchange rate. We assumethat the euro appreciates from $1.1000/d to$1.2000/d. This is a change of $0.1000/d asshown at the bottom of the first column. The bankaccount remains at d1,000 before and after theappreciation of the euro, but the dollar value of thiscontractual asset increases from $1,100 to $1,200.By subtracting the values of the exchange rate andbank deposit (in dollars) before the euro appreciationfrom the values after the appreciation wehave DV($) ¼ $100 and DS($/d) ¼ $0.1000/d.Using these values in our definition of exposure inequation (9.1) we find:Exposure ¼DVð$ÞDSð$/dÞ ¼ $100$0:1000/d¼ d1, 000where we see that the dollar signs in the numeratorand denominator have cancelled. The exposure ona d1,000 bank account is d1,000, as we wouldexpect. Our sensitivity measure in the ratio inequation (9.1) gives us a magnitude in the foreign& Table 9.1 Exposure on a contractual asset:euro bank depositExchangerateBankaccount, ¤Bankaccount, $Before $1.1000/¤ ¤1,000 $1,100After $1.2000/¤ ¤1,000 $1,200Change $0.1000/¤ ¤0 $100193 &
MANAGING FOREIGN EXCHANGE RISK AND EXPOSUREcurrency, and in this particular case it is equal tothe foreign-currency value of the asset. It is also apositive magnitude, telling us that the change in theexchange rate and the dollar value of the asset movein the same direction: when the euro goes up theeuro bank account is worth more dollars. In sucha case, where the value in domestic-currency valuemoves in the same direction as the price of theforeign currency, we say there is a long positionin the foreign currency. That is, if there is a dollargain when the spot value of the foreign currencyincreases, and a dollar loss when the value of theforeign currency decreases, we say there is a longposition in the foreign currency.An investor is long in a foreign currency if she orhe gains when the spot value of the foreigncurrency increases, and loses when it decreases.That is, an investor is long if the foreignexchange value of the foreign currency and thedomestic currency value of the investment movein the same direction. In this case, exposure isa positive number.Exposure on a contractual liabilityLet us consider foreign exchange exposure from adollar perspective on a bank loan of d1,000. Theexposure on this contractual liability is illustrated inTable 9.2.We show the same appreciation of the euro from$1.1000/d to $1.2000/d as in Table 9.1. Becausein this case we are considering a loan, which is aliability, we prefix this with a minus sign: a loan onitself represents negative worth. The dollar value of& Table 9.2 Exposure on a contractual liability:euro bank loanExchangerateBankloan, ¤Bankloan, $Before $1.1000/¤ ¤1,000 $1,100After $1.2000/¤ ¤1,000 $1,200Change $0.1000/¤ ¤0 $100& 194this liability goes from $1,100 to $1,200. When wetake the difference between these two amounts bytaking the dollar value before the euro appreciationfrom the dollar value after euro appreciation weobtainDVð$Þ ¼ $1, 200 ð $1, 100Þ¼ $100The minus sign signifies that more dollars are nowowed, a bigger liability. Hence, with DS($/d) ¼$0.1000/d and DV($) ¼ $100 exposure on thiseuro loan from equation (9.1) isExposure ¼DVð$ÞDSð$/dÞ ¼ $100$0:1000/d¼ d1, 000As before, exposure has an absolute magnitude ofd1,000. However, in this case of a foreigncurrencyliability, exposure is negative. We say inthis case that the euro liability represents a shortposition in the euro. By definition, a short positionis where there is a loss in terms of domestic currencyif the foreign currency increases in value, or thereis a gain if the foreign currency decreases in value.In other words, a short position is where the value ofthe person’s wealth in their own currency and theforeign exchange value of the foreign currency go inopposite directions.An investor is short in a foreign currency if sheor he loses when the spot value of the foreigncurrency increases, and gains when it decreases.That is, an investor is short if the value of theforeign currency and the domestic currency valueof the investment move in the opposite direction.In this case exposure is a negative number.So far the conclusions concerning the size of exposureare hardly surprising: exposure is the same asthe face value of the contractual assets or liabilities.Let us now consider other assets and liabilities which,to distinguish them from contractual items, we shallcall noncontractual assets and liabilities.
FOREIGN EXCHANGE EXPOSURE AND RISKThese are assets and liabilities that can changein value. Most importantly for foreign exchangeexposure and risk, they can change in value due tochanges in exchange rates.Exposure on a noncontractual assetShares of foreign exporter or import competerTable 9.3 considers the foreign exchange exposurefacing an investor whose domestic currency isthe dollar, and who has bought shares of a Eurozonecompany. We assume the company exports tothe United States, or else competes with US companiesin foreign markets, including the Europeanmarket. What is this investor’s exposure, based onthe sensitivity measure in equation (9.1), on eachshare owned by the investor?Table 9.3 takes the appreciation of the euro tobe the same as in the previous situations. The tablealso assumes that the share price before the euroappreciation is d10. An appreciation of the eurowill harm the profits of a Euro-zone exporter to theUnited States because it makes the company’sproducts less competitive in the US market. It willalso harm the profits of a Euro-zone company thatcompetes in Europe or elsewhere in the world withUS companies: the Euro-zone company is less competitivethan before when the euro increases in valuerelative to the dollar. 4 A company that competes inits own market with foreign competitors is called& Table 9.3 Exposure on a noncontractual asset:Euro-zone exporterExchangerateSharevalue, ¤Sharevalue, $Before $1.1000/¤ ¤10.00 $11.00After $1.2000/¤ ¤9.50 $11.40Change $0.1000/¤ ¤0.50 $0.404 This is due to operating exposure. This type of exposure,which can translate into effects on companies’ values, isdiscussed in Chapter 11.an import competer. Let us assume that the damagedone by the appreciation of the euro versus thedollar in terms of current and future profits puts adent in the share price of the Euro-zone company.Suppose it declines from d10.00 to d9.50 as inTable 9.3.The dollar price of the Euro-zone companyhas increased from $1.1000 d10 ¼ d11.00 to$1.1200 d9.5 ¼ $11.40. Hence, DV($) ¼ $0.40,and exposure given by equation (9.1) isExposure ¼DVð$ÞDSð$/dÞ ¼ $0:40$0:1000/d¼ d4:00The increase in the dollar value of the euro has madethe US investor better off, but by less than the valueof the investment. The reason is that while thehigher spot value of the euro has added to the dollarvalue of the investment – each euro translates intomore dollars – the lower euro share price associatedwith a stronger euro has eroded some of this. Stateddifferently, there is negative correlation betweenthe dollar value of the euro and the euro value of theasset. In this particular case this leaves the investorlong in the euro: the value of exposure is positive sothe investor gains when the foreign-currency gains.However, this may not be so, depending on by howmuch the euro share price is impacted by the changein the exchange rate.Table 9.4 shows what may happen if the Eurozonecompany’s share price falls by more than inTable 9.3. In this case we assume the stronger eurohas done more damage to the company’s profits,with a consequent decline in share price fromd10.00 to d9.00. As we shall see when we discuss& Table 9.4 Exposure on a noncontractual asset:Euro-zone exporterExchangerateSharevalue, ¤Sharevalue, $Before $1.1000/¤ ¤10.00 $11.00After $1.2000/¤ ¤9.00 $10.80Change $0.1000/¤ ¤1.00 $0.20195 &
MANAGING FOREIGN EXCHANGE RISK AND EXPOSUREoperating exposure in Chapter 11, a greater effecton the company’s profit and share price could bedue to more price-sensitivity in the market for thecompany’s products, lower use of tradable inputswhich become cheaper after a currency appreciation,and so on. Applying our sensitivity measure ofexposure we have the same exchange rate changein the denominator, DS($/d) ¼ $0.1000/d, butin the numerator we have DV($) ¼ $10.80$11.00 ¼ $0.20. ThereforeExposure ¼DVð$ÞDSð$/dÞ ¼ $0:20$0:1000/d¼ d2:00We find that in this case the US investor is short inthe euro, specifically by d2 per share: the investorloses from a higher euro, and would gain from alower euro.As we can see, the critical issue determining thesize and direction of exposure – long versus short –is the extent to which the currency value and assetvalue are negatively related. Exposure depends onco-variation between the exchange rate and theforeign-currency value.We have simply assumed numbers as if theyare known. In reality, it may be very difficult toknow how much an asset price might be dentedor boosted by a specific change in the exchangerate. What we need to know is the systematicconnection between the spot rate and the assetvalue, which is what would happen, all else beingequal. In reality many things can affect share pricesbeyond the exchange rate. However, as we shall seelater in this chapter, there may be historical data onshare prices and exchange rates from which systematicconnections may be estimated statistically.There may also be ways of gauging the impact ofexchange rates by asking people in the companywhose experience can help build a picture of whatmight happen under specified circumstances. Thisalternative scenario approach is discussed in thefollowing chapter after describing what can influencethe extent of the impact of exchange rates onthe value of a company.& 196Shares of foreign import companyLet us consider the reverse situation to thatmentioned earlier, specifically, let us analyse aUS investor who has bought shares in a Euro-zonecompany that imports products from the UnitedStates for sale in Europe. In this case an appreciationof the euro means a lower euro cost for the company’simported products and associated higher profits.A systematic increase in current and future profitsfrom an appreciation of the euro will favorably affectthe company’ share price. This is shown in Table 9.5Table 9.5 assumes the same appreciation of theeuro as in the previous situations, so as before,DS($/d) ¼ $0.1000/d. Because a stronger euro isgood for a Euro-zone company that imports for salein the European market, we show an increase in theprice of the importer’s stock, from d11.00 tod12.60, so that, DV($) ¼ $1.60. Again applyingour definition of exposure we haveExposure ¼DVð$ÞDSð$/dÞ ¼ $1:60$0:1000/d¼ d16:00We find that an American investor in a Europeanimport-oriented company has long exposure ofmore than the value of the investment. In this case ad10 stock has d16 of long exposure. What hashappened is that when the euro goes up the stockprice goes up too. Therefore, the US investor gainstwice, from the value of the currency and the valueof the asset. The asset value and exchange rate arepositively correlated.Having dealt with contractual assets and liabilitiesand with stocks, let us next turn to bonds. Let usconsider first foreign currency-denominated bonds.& Table 9.5 Exposure on a noncontractual asset:Euro-zone importerExchangerateSharevalue, ¤Sharevalue, $Before $1.1000/¤ ¤10.00 $11.00After $1.2000/¤ ¤10.50 $12.60Change $0.1000/¤ ¤0.50 $1.60
FOREIGN EXCHANGE EXPOSURE AND RISKForeign currency-denominated bondSuppose a US-dollar-based investor buys aeuro-denominated bond. Suppose that the EuropeanCentral Bank (ECB) follows a policy of ‘‘leaningagainst the wind,’’ lowering interest rates when theeuro rises and raising interest rates when the eurofalls. This is a common policy of central banks whichtry to smooth variations in the foreign exchangevalue of their currencies (lowering interest rateswhen the euro is rising should reduce the currency’sappreciation, and raising interest rates when theeuro is falling should reduce the depreciation).Table 9.6 shows exposure on a euro-denominatedbond when the ECB leans against the wind. Weagain assume the euro increases in value byDS($/d) ¼ $0.1000/d. The higher value of theeuro is assumed to lead to an interest rate reductionby the ECB, causing an increase in the price ofthe bond from d1,000 to d1,050. This means achange in the dollar price of the bond from $1,100to $1,260, so that DV($) ¼ $160. Applying themeasure of exposure:Exposure ¼DVð$ÞDSð$/dÞ ¼ $160$0:1000/d¼ d1, 600The exposure on the bond with initial value ofd1,000 is larger than the value of the bond.Domestic-currency bondIt would seem natural to think that an investor ina domestic bond who buys only domestic productsdoes not face any foreign exchange exposure or risk.This view may be incorrect. In particular, if theinvestor’s country follows a policy of leaning againstthe wind, the investor will have short exposure inthe foreign currency. Let us see how.Suppose that the dollar decreases in value asbefore, and as shown in Table 9.7: the higher dollarvalue of the euro is a depreciation of the dollar. TheUnited States Federal Reserve, to fight againstthe depreciation of dollar – perhaps to preventinflation that can result from a lower currency –may raise interest rates. This would make dollardenominatedbonds worth less. Table 9.7 showsthe decline in the dollar-denominated bonds fromthe dollar depreciation and consequent FederalReserve action. In the table we assumeDV($) ¼ $50. It follows that exposure to anAmerican investor in the dollar bond isExposure ¼DVð$ÞDSð$/dÞ ¼ $50$0:1000/d¼ d500We find that this investor is short d500. This mightseem very odd, and is certainly not intuitive.However, the basic fact is that a higher euro is badfor this investor because it makes dollar-bond pricesfall. As long as the Fed follows a policy of leaningagainst the wind, the investor is short in euros andwould need to find a long position in the euro,through, for example, buying a euro futures contractor euro asset, to avoid exposure on the euro. It is thesystematic application of the Fed’s policy of leaningagainst the wind that is responsible for exposure.To the extent that increases in a country’sinterest rates are bad news to its stock market as awhole, investments in the domestic stock marketare also exposed to the exchange rate if the central& Table 9.6 Exposure on a noncontractualasset: euro bondExchangerateBondvalue, dBondvalue, $Before $1.1000/¤ ¤1,000 $1,000After $1.2000/¤ ¤1,050 $1,260Change $0.1000/¤ ¤50 $160& Table 9.7 Exposure on a noncontractual asset:dollar bondExchange rate Bond value, $Before $1.1000/¤ $1,000After $1.2000/¤ $950Change $0.1000/¤ $50197 &
MANAGING FOREIGN EXCHANGE RISK AND EXPOSUREbank systematically leans against the wind. 5 As withdomestic bonds, when the country’s currencydeclines and the central bank reacts with higherinterest rates the stock market declines.Just as it is possible to be invested in a domesticasset and face foreign exchange exposure, it is alsopossible to invest abroad and not face exposure.To see this, let us consider investment in a real assetsuch as real estate.Foreign real estateTable 9.8 shows what can happen on an asset such asreal estate if the price of the asset and the exchangerate move in opposite directions as predicted bythe dynamic version of Purchasing Power Parity(PPP). 6 We assume that 10 percent inflation inEurope occurs on the investment item. Accordingto the relative or dynamic version of PPP discussedin Chapter 7 and summarized by equation (7.7),if 10 percent inflation also applies to the Europeaneconomy as a whole and there is zero inflation in theUnited States,P_Sð$/dÞ ¼ _ US _P E¼ 0:101 þ _P E 1:10 ¼ 0:0909We have simply replaced the United Kingdom withEurope and the pound with the euro in equation(7.7). We find that the euro should depreciate byapproximately 9.1 percent from the initial value ofS($/d) ¼ $1.10/d. The new spot rate impliedby relative or dynamic PPP is ($1.1000/d) 1.0909 ¼ $1.0000/d as shown in the table. Whenwe use this exchange rate of $1.0000/d to convert5 As we have already indicated, some companies within thedomestic stock market, such as export-oriented companies,are likely to gain in value from depreciation. We speak hereabout the stock market in general which tends to fall wheninterest rates rise because of the higher opportunity cost ofholding stocks rather than bonds.6 To be more precise, we are assuming the law of a single priceapplies to the asset if we are considering a particularindividual investment. We could relate this to PPP if we aretalking about a basket of investment items.& 198& Table 9.8 Exposure on a noncontractualasset: foreign real estateExchangerateAssetvalue, ¤Assetvalue, $Before $1.1000/¤ ¤1,000,000 $1,100,000After $1.0000/¤ ¤1,100,000 $1,100,000Change $0.1000/¤ ¤100,000 $0the euro price of the real estate that has increased ineuro value by 10 percent we find the dollar value tobe unchanged. It follows that with DV($) ¼ 0, andwith DS($/d) ¼ $0.1000, foreign exchangeexposure on the European real estate is zero. Wecan therefore claim that if the relative or dynamicversion of PPP holds systematically for a particularoverseas asset, there is no foreign exchange exposureon this asset. What happens is that the changein the exchange rate exactly offsets the change in thelocal-currency value of the asset. Therefore, asstated earlier, it is possible to face foreign exchangeexposure on domestic assets, and not face exposureon foreign assets.EXPOSURE AS A REGRESSION SLOPEThe exposure lineWe can further clarify the definition of foreignexchange exposure at the same time as we describehow it can be calculated by considering Figures 9.1aand b. The horizontal axis in both figures showsunexpected changes in exchange rates, DS u ($/d),with these being positive to the right of the originand negative to the left of the origin. Positive valuesof DS u ($/d) are unanticipated appreciations of theeuro, and negative values are unanticipated depreciationsof the euro. The vertical axis of each figureshows the changes in the values of assets or liabilitiesin terms of a reference currency, which for a USfirm is the US dollar. We can interpret DV($) as thechange in the value of particular individual assetsor liabilities, or as the change in the value of acollection of assets or liabilities. As we have said,
FOREIGN EXCHANGE EXPOSURE AND RISKGain(+) or loss(–) ∆V($)$40,000$30,000xx$20,000A––0.04x–0.03x–0.02xx$10,000x–0.01xxx x xx0.01 0.02 0.03 0.04 +–$10,000–$20,000–$30,000Unexpectedchange in spotexchange rate,∆S u ($/ )x––$40,000(a) Exposure line for “foreign” assetsGain(+) or loss(–) ∆V($)+$40,000xxx$30,000x$20,000xx x$10,000x– –0.04 –0.03 –0.02 –0.010.01 0.02 0.03 0.04 +x–$10,000x–$20,000xxB–$30,000xx–$40,000xUnexpectedchange in spotexchange rate,∆S u ($/ )–(b) Exposure line for “foreign” liabilities& Figure 9.1 Exposure as the slope of a regression lineNoteEach unanticipated change in the exchange rate will be associated with a change in the dollar value of an asset or liability.The unanticipated change in the exchange rate can be plotted against the associated change in dollar value. Because otherfactors also affect asset and liability values, the same DS u ($/¤) will not always be associated with the same DV($).However, there may be a systematic relationship between DS u ($/¤) and DV($). For example, unanticipated euroappreciations may typically be associated with gains from higher dollar values of euro-denominated assets and lossesfrom higher dollar values of euro-denominated liabilities, the former implying an upward-sloping scatter and the lattera downward-sloping scatter.199 &
MANAGING FOREIGN EXCHANGE RISK AND EXPOSUREDV($) should be in real terms, and so it should beadjusted for US inflation. 7As we have seen, when there is a change in anexchange rate, there will generally be an accompanyingchange in the dollar value of assets orliabilities. The change in dollar value depends onwhether an asset or liability is contractual or noncontractual.For contractual assets and liabilitiesthe change in dollar value is due only to the changein exchange rate. For noncontractual assets andliabilities the change in dollar value depends onthe systematic relationship between the foreigncurrencyasset or liability value and the exchangerate. If a higher value of the foreign-currencydecreases the foreign-currency value, as it doesfor investments in foreign export- or importcompetingcompanies, the dollar value change is lessthan the change in the exchange rate: the two effectsare offsetting. On the other hand, if a higher foreigncurrency also makes the foreign asset worth more,as with a foreign import-oriented company, thedollar value changes by more than the exchange rate.Of course, many factors other than exchangerates can influence dollar market values of assets andliabilities, and so we cannot predict with certaintyhow values will change with any particular unanticipatedchange in exchange rates. However, thereis often a tendency for values to change in more orless predictable ways. Indeed, as we have seen,there is a particularly strong systematic relationshipfor contractual assets and liabilities. For example,when the euro unexpectedly jumps from $1.14/dto $1.16/d, the US dollar value of a d1 millionbank deposit changes from $1.14 million to $1.16million, and this change in dollar value is accuratelyknown. We can then plot a DV($) of $20,000against a DS u ($/d) of $0.02/d in Figure 9.la.This is shown by point A in the upper right-handquadrant of the figure. Similarly, an unexpecteddepreciation of the euro would be associated with7 Inflation itself is unknown in advance and contributes touncertainty. However, because of the difficulty of dealingwith inflation, in much of what follows we ignore the levelof inflation as well as uncertainty about inflation.an accurately known lower US dollar value of thebank deposit, giving rise to a point in the lower lefthandquadrant. With the euro value of the bankdeposit unchanged by changes in the exchange rate,all points sit exactly on a line called the exposureline, which for the bank deposit or any other eurodenominatedcontractual asset is upward-sloping.If we consider a euro-denominated bank loaninstead of a bank deposit, the effect of unanticipatedchanges in exchange rates is again accuratelyknown. However, in this case there is a downwardslopingrelationship. For example, an unanticipatedappreciation in the euro from $1.14/d to $1.16/dresults in a $20,000 loss on a d1 million bank loan,because this is the extra dollar amount of liability.This gives point B in the lower right-hand quadrantof Figure 9.1b. Similarly, an unanticipated depreciationof the pound gives a point in the upperleft-hand quadrant.It should be emphasized that US dollar values ofnoncontractual assets and liabilities would not be aspredictably affected by changes in exchange as thebank accounts or loans just considered. Rather,a given value of DS u ($/d) could be associated withdifferent possible values of DV($). Furthermore,as we have seen, domestic assets and liabilitiesvalues may also change with changes in exchangerates and therefore may also be exposed to exchangerates. We saw this earlier for domestic bonds andeven for the stock market as a whole. As we shall seein Chapter 11, it is also true of individual domesticcompanies through the impact of exchange rates onprices, sales, production costs, and so on.As we have said, exposure is measured by thesystematic tendency for DV($) to change with respectto DS u ($/d), where by systematic tendency we meanthe way these variables are on average related to eachother. Of course, because the actual DV($) associatedwith a given DS u ($/d) is not always the same, theequation which describes the relationship betweenthese variables must allow for errors. Such an equationis a regression equation, which, for exposure tothe dollar–euro exchange rate, takes the formDV t ¼ bDS u t ð$/dÞþm tð9:2Þ& 200
FOREIGN EXCHANGE EXPOSURE AND RISKIn equation (9.2) b is the regression coefficientdescribing the systematic relation between DV($)and DS u ($/d). That is, b shows the tendency forthese variables to be related. Indeed, b describes thesensitivity of the systematic relation betweenunanticipated changes in exchange rates and changesin dollar values of assets and liabilities. The term m tis the random error in the relationship, and is calledthe regression error. The role of m t is to allow thevalue of DV($) to be less than perfectly predictablefor a given DS u ($/d). 8 Because b is the slope of theline described by equation (9.2) we can redefineexposure as: 9Foreign exchange exposure is the slope ofthe regression equation which relates changesin the real domestic-currency value of assets orliabilities to unanticipated changes in exchangerates.Let us consider how we might estimate b.forward rates from the realized spot exchangerates. 10 Similarly, time series of dollar values ofassets and liabilities may be available in market stockand bond prices.If we are unable to calculate unanticipated changesin exchange rates and instead use actual changes inexchange rates the effect is to increase the randomerrors, m t . The reason is that there will be someactual changes in exchange rates that are not associatedwith changes in asset or liability values.Market values reflect what is expected to happen toexchange rates. Therefore, what happens to asset orliability values from a given actual change inexchange rate is not always the same: the responseof market value depends on the extent thatthe change in the exchange rate was anticipated.A combination of anticipated and unanticipatedchanges in exchange rates on the right-hand side ofthe regression equation will add ‘‘noise’’ to therelationship. This will be apparent in the size of theregression errors.Estimating exposureAs we have seen, we can plot the values ofDV($) and associated DS u ($/d) on a graph such asFigure 9.1. Of course, to do this we would have toknow how much of the actual changes in exchangerates were unanticipated and also be able to measurethe changes in the real dollar values of assets andliabilities. These data problems may be surmountable.In particular, the unanticipated changes inexchange rates may be calculated by obtainingforward exchange rates, which are predictions offuture spot exchange rates, and subtracting the8 IfV($) is increasing over time from, for example, inflation,we can add a constant to the right-hand side of equation(9.2). For simplicity, we suppress the constant.9 Those readers with a background in statistics will realizethat this means that by definition exposure is cov(DV,DS u )/var(DS u ). This definition makes it clear that long versusshort exposure depends on whether DV and DS u move inthe same direction or in opposite directions. See also Adlerand Dumas, op. cit., and Oxelheim and Wihlborg, op. cit.Interpreting exposureAs we saw in the various examples that motivatedour definition of exposure as a sensitivity ratio or asthe slope of a regression line, if DV is measured inUS dollars, as it will be if we are measuring exposurefrom a US perspective, and if DS u is measuredin dollars per euro, then the measurement unitof exposure is the euro. This is because in terms ofunits of measurement, equation (9.1) involves$ ¼ b ($/d). Rearranging the measurementunits we have b ¼ $ ($/d) ¼ d. We can thereforethink of exposure as the amount of foreigncurrency that is at risk. In the case of contractualassets and liabilities the amount at risk is the facevalue of the asset or liability. In the case of noncontractualassets and liabilities the amount at riskcould be higher or lower than the value of the asset10 The reason why forward rates can be considered toproxy for expected future spot rates was explained inChapter 3.201 &
MANAGING FOREIGN EXCHANGE RISK AND EXPOSUREor liability depending on the covariance of exchangerates and local-currency values.Foreign exchange exposure is the amount offoreign currency that is at risk. This can be equalto, larger, or smaller than the value of an asset orliability depending on covariance of exchangerates and local-currency values.What do we do if there are many exchange rateschanging at the same time? It is in these situationsthat the definition of exposure in terms of slope ofa line comes to the fore.Exposure on numerous exchange ratesWhen many different exchange rates can affectDV($), as is the case for a firm that holds assets andliabilities in many countries and currencies or earnsincomes in many countries and currencies, we canuse an extension of equation (9.2) to estimateexposure. For example if DV($) could conceivablybe influenced by the exchange rate of the dollarversus the British pound, Japanese yen, Swiss franc,as well as the euro, we can use the multipleregression equationDVð$Þ ¼b d DS u ð$/dÞþb £ DS u ð$/£Þþ b ¥ DS u ð$/¥Þþb SFr DS u ð$/SFrÞþ mð9:3ÞEach slope coefficient or ‘‘beta’’ gives exposureto the associated foreign currency. For example,b ¥ gives the sensitivity of DV($) to unanticipatedchanges in the US-dollar value of the Japanese yen.We note that as in the case of exposure to a singleexchange rate, the coefficients are all measured inunits of the foreign currency. For example, if weare measuring exposure to the dollar–yen exchangerate assuming all other DS u ’s to be zero, then interms of measurement units in equation (9.3),$ ¼ b ¥ ð$/¥Þwhich requires that b ¥ be a yen amount.We showed earlier that a central bank policy of‘‘leaning against the wind,’’ which involves raising& 202interest rates to support a declining currency andlowering interest rates to dampen a rising currency,can make domestic bonds and stocks exposed todomestic investors. It also means that from a non-US investor’s perspective, US stocks are exposedby more than their value. This follows becausethe combined effect of a depreciating dollar and adeclining dollar value of US stocks from associatedhigher interest rates is a more substantial decline inthe foreign-currency values of US stocks than justthe decline in exchange rates.It is worth repeating that while stock prices ingeneral might decline when the US dollar unexpectedlydepreciates, some stocks may benefit fromthe dollar depreciation. In particular, stocks of USexport-oriented firms might increase in valuebecause a cheaper dollar makes these firms morecompetitive in foreign markets. Indeed, as we havementioned before, since a dollar depreciationmakes imports to the United States more expensiverelative to competing American products, US firmswhich sell exclusively in the US market, but whichcompete against imports, may also gain from adepreciation of the dollar. If the extra profitabilityof US export-oriented and import-competing firmsshows up in higher stock prices, these particularstocks are long in foreign currency even though thestock market as a whole may be short.Estimation difficultiesUnfortunately, the calculation of exposure may notbe straightforward, even when we have a longinterval of time series data on the changes indomestic-currency values for the left-hand side ofthe regression equation, and unexpected changes inexchange rates for the right-hand side of the equation.One serious problem is that exposure changesover time. For example, a company may havechanged its assets and liabilities during the period offitting the regression equation. Alternatively, thecorrelations between exchange rates and local assetor liability values may have changed during the timeperiod. Operating exposure may have changed dueto numerous conditions affecting revenue and cost,
FOREIGN EXCHANGE EXPOSURE AND RISKas will be explained in Chapter 11. There is also theproblem mentioned earlier concerning possiblevariation in the extent to which changes in the spotexchange rate had been anticipated. Consequently,we cannot count on collecting the values of DV andthe relevant DS u ’s over a period of time and usingthese to fit an equation like equation (9.3).An application of exposure measurementWe can illustrate what can be learned from theregression approach for the measurement of foreignexchange exposure, as well as some of the difficulties,by considering estimates of exposure in theCanadian forest products sector calculated by theauthor. 11 The market segment provides a useful testcase, because if there is an industry that should beexposed in a straightforward manner, this is it:roughly 70 percent of the paper and 80 percent oflumber is exported. Overall, almost 85 percent ofCanada’s exports go to the United States. Thereforewe would expect exchange rate exposure, particularlyto the US dollar.Using data on the return from holding the paperand forest products index on the Toronto StockExchange as the dependent variable, three potentiallyrelevant exchange rates as regressors, andstudying the period January 1979–August 1985,gave the following result:DVðC$Þ ¼ 0:0039 þ 0:0001r Cð0:44Þ ð0:16Þþ 0:2459DSðC$/$Þð0:74Þ0:2727DSðC$/£Þð1:930Þþ 0:5841DSðC$/¥Þð4:23Þ11 Maurice D. Levi, ‘‘Exchange Rates and the Valuation ofFirms,’’ in Exchange Rates and Corporate Performance, inYakov Amihud and Richard Levich (eds) Irwin Publishing,Burr Ridge IL, 1994.As well as three exchange rates, the regressionincludes r C , which is the Canadian 3-month treasurybill interest rate. The values in parentheses belowcoefficients are ‘t’ values: these must exceedapproximately 2.0 for statistical significance at the5 percent level. The R 2 for the equation, which isa measure of the fraction of variation in the dependentexplained by the right-hand variables, was 0.11.When R 2 ¼ 1.0 the right-hand variables explain allthe variation in the dependent variable, and whenR 2 ¼ 0 none of the variation is explained.It is notable that despite the importance of theUnited States as a market for Canadian paper andforest products, the Canadian–US exchange rate isnot statistically significant. Also, the effect of theCanadian–British exchange rate is of the wrongsign – a higher pound is associated with lower returnsin the sector – although this coefficient is not quitesignificant at the 5 percent level. The only significantvariable that has the sign we would expect is theCanadian dollar–yen exchange rate: a decline in theCanadian dollar versus the yen raises the value ofthe sector, as we would export for an export industry.Why would the exchange rate against the USdollar be insignificant while the yen is significant?This could be because Canadian firms hedge theirexposure against the US dollar: many Canadianexport-oriented firms denominate some of theirdebt in US dollars. Then, if the US dollar fallsin value, they lose on operations but gain on thebalance sheet: the US dollar debt then translatesinto fewer Canadian dollars. If the yen exposure isnot hedged, it being more difficult for Canadianfirms to borrow yen and more difficult to use otheryen hedges, we might find a yen exposure but no USdollar exposure.We see that exposure to an exchange rate couldbe zero because the companies had been verycapable at hedging exchange rate exposure. It is alsopossible, however, that the zero coefficient isbecause the financial markets did not recognizewhat would happen as a result of the exchange ratechanges. That is, either the ignorance of investorsor the keen hedging knowledge of corporatefinancial managers could be responsible for what203 &
MANAGING FOREIGN EXCHANGE RISK AND EXPOSUREwe observe. Being unable to disentangle these twopossibilities limits greatly what we learn.The fact that the R 2 in the regression is only 0.11tells us that almost 90 percent of what is happening toreturns is the result of factors other than exchangerates and the interest rate. We learn that even if thecompanies had hedged their exposure they wouldhave reduced the volatility in their returns by only 11percent – and this includes hedging the interest ratewhich also appears in the regression equation. R 2 is animportant measure to have because it provides anindication of whether exchange rates are importantrelative to other possible influences on a company’sreturns. When R 2 is small it may indicate thatmanagerial effort would better be spent trying toreduce other sources of volatility.Any of the regression difficulties we mentionedearlier could be responsible for the poor explanatorypower of the equation. For example, it ispossible that we are mixing anticipated and unanticipatedchanges in exchange rates: sometimesexchange rate changes may have been predictedbetter than on other occasions. This makes itdifficult for the regression procedure to assign aconstant value to a regression coefficient. It is alsopossible that exposure changed over the time periodstudied. A more careful analysis might be able todisentangle these effects. Indeed, in a study thattried to reduce the problems of regression forestimating exposure, George Allyannis and JaneIhrig found some significant exposures. 12 Four ofthe eighteen manufacturing groups they studiedwere found to be exposed through competitivestructure, export share or imported inputs. Theyfound a 1 percent appreciation of the dollar wasassociated with a 0.13 percent reduction in returns.DEFINITION OF FOREIGNEXCHANGE RISKMichael Adler and Bernard Dumas define foreignexchange risk in terms of the variability of12 See George Allyannis and Jane Ihrig, ‘‘Exposure andMarkups,’’ Review of Financial Studies, 14, 2001, pp. 805–35.& 204unanticipated changes in exchange rates. 13 That is,they define exchange rate risk in terms of theunpredictability of exchange rates as reflected bythe standard deviation of DS u , that is, SD(DS u )where SD stands for standard deviation.While Adler and Dumas’s definition makesit clear that unpredictability is paramount in themeasurement of exchange rate risk, this authorprefers a different focus on variability. The definitionof exchange rate risk we shall use is asfollows:Foreign exchange risk is measured by the standarddeviation of domestic-currency values ofassets or liabilities attributable to unanticipatedchanges in exchange rates.The principal difference between the definitionused in this book and that of Adler and Dumas isthat the definition used here focuses on the unpredictabilityof values of assets or liabilities due touncertainty in exchange rates, not on the uncertaintyof exchange rates themselves. This differencein definitions can have important consequences. Forexample, according to our definition, an asset is notsubject to exchange rate risk if its value does notdepend on exchange rates, even though exchangerates might be extremely volatile. According to ourdefinition, volatility in exchange rates is responsiblefor exchange rate risk only if it translates intovolatility in real domestic-currency values. Thismakes exchange rate risk dependent on exposure aswell as on SD(DS u ). Let us see why this is so byreconsidering regression equation (9.2).Equation (9.2) makes it clear that changes inthe values of assets and liabilities, depend both onexchange rates and on other factors, with the effectof the non-exchange rate factors captured by theterm m t . We can isolate the effect of exchange rates13 Michael Adler and Bernard Dumas, op. cit. We might notethat because the probabilities of outcomes are not known,it would be more appropriate to refer to exchange-rateuncertainty rather than risk. However, because it has becomecustomary to use the term ‘‘risk,’’ we also use this term.
FOREIGN EXCHANGE EXPOSURE AND RISKfrom the effect of other factors if we define thevariableD^V ¼ bDS u ð$/£Þð9:4ÞD^V is the change in domestic-currency value of anasset or liability that is due to unanticipated changes inthe exchange rate. That is, we have partitioned thetotal change in value, DV, into that due to changesin exchange rates, D^V, and that due to otherinfluences, m; this follows by relating equation (9.4)to equation (9.2), givingDV D^V þ mð9:5ÞWith DV so partitioned, we can explain how ourdefinition of exchange rate risk relates to exchangerate exposure.Our definition of exchange rate risk as thestandard deviation of the domestic-currency valuesof assets or liabilities due to unanticipated changesin exchange rates is a definition in terms of SD(D^V),where D^V is as defined in equation (9.4). Applyingstandard statistical procedures to equation (9.4),with the average unanticipated change in exchangerate, written as DS u ($/£), being zero, we have 14sffiffiffiffiffiffiffiffiffiffiffiffiffiffiffiffiffiffiffiffiffiffiffiffiffiffiffiffiffiffiffiffiffiffiffiffiffiffiffiffiffiffiffiffiffiffiffiffiffiffiffiffiffiffiffiffiffiffiffiffiffiffiffiffiffi1 X SDðD^VÞ¼ bDSn 1u ð$/£Þ bDS u 2ð$/£Þn¼bSDðDS u Þð9:6ÞEquation (9.6) shows that foreign exchange riskis proportional to foreign exchange exposure.However, exchange rate risk also depends on thevolatility of DS u , the unanticipated change inexchange rates, which is the risk measure used byAdler and Dumas.Equation (9.6) makes it clear that exchange raterisk requires both exposure and unpredictability ofexchange rates. Having exposure does not mean14 Average unexpected changes of exchange rates are zero ifexpectations are rational: rational people take all relevantinformation into account, and on average predict correctly.having exchange rate risk if exchange rates areperfectly predictable. Similarly, unpredictability ofexchange rates does not mean exchange rate risk foritems that are not exposed.EXPOSURE, RISK, AND THE PARITYRELATIONSHIPSWith exchange rate risk and exposure now definedand compared, we can consider how risk andexposure are related to PPP and interest parity.This will allow us to clarify several features of riskand exposure that we have alluded to, but not so farsystematically explored.Exposure, risk, and interest parityCovered interest parity can be summarized in thedollar–pound context by equation (8.10):ð1 þ r$Þ n ¼ F nð$/£ÞSð$/£Þ ð1 þ r £Þ nð8:10ÞThe right-hand side of equation (8.10) gives thehedged dollar receipts to an investor on a coveredn-year British pound interest-bearing security.Clearly, if the pound security is hedged and held tomaturity, unanticipated changes in exchange ratescan have no effect on the dollar value of the security.That is, the hedged pound security is not exposedand faces no foreign exchange risk. Indeed, this iswhy the return equals that on US securities. However,the lack of exposure and risk on the poundsecurity is only because the security is combinedwith a forward contract, and because both thesecurity and forward contract are held to maturity.When a foreign currency-denominated securityis not hedged with a forward contract or may haveto be sold before maturity, the security is exposedand subject to exchange rate risk, irrespective ofinterest parity. Indeed, the presence or absenceof interest parity has no bearing on the amount ofexchange rate risk or exposure. While uncoveredinterest parity does suggest that anticipated changesin exchange rates are compensated for in interest205 &
MANAGING FOREIGN EXCHANGE RISK AND EXPOSUREdifferentials, there is no compensation forunanticipated changes in exchange rates. 15Interest parity also has no implication forexchange rate risk, which we have measured bySDðD^VÞ ¼bSDðDS u Þð9:6ÞThis is because it has no implications for theexposure, b, or for the variability of unanticipatedchanges in exchange rates, SD(DS u ).Exposure, risk, and purchasing power parityWhereas there are no implications of interest parityfor exposure and risk, the situation is quite differentfor PPP. In the case of PPP there are implicationsfor exposure and risk on real assets such as realestate and equities, the prices of which can systematicallyvary with exchange rates. There are alsoimplications of PPP for exposure and risk on theoperating incomes of firms. It is useful to considerthe implications of PPP for real assets – called fixedassets by accountants – separately from those foroperating incomes.Purchasing power parity andreal-asset exposureWe can see the implications of PPP for risk andexposure on real (or fixed) assets such as real estatefrom the example of investment in European realestate shown earlier in this chapter. The essentialpart of the example is summarized by thefinal column in Table 9.8. This shows an item ofEuropean real-estate that is worth $1.1 millionwhen the exchange rate is $1.1000/d, and the samedollar value one period later when the exchangerate is $1.0000/d. In the example, the change inthe exchange rate has been assumed to exactly offset15 As we have seen, there could be a systematic relationshipbetween DS u ($/£) and the value of pound-denominatedsecurities if the Bank of England leans against the wind.Then, British security prices will decline as DS u ($/£)decreases. However, this has nothing to do with whethercovered interest parity holds.& 206the change in local-currency value of the asset.As we pointed out earlier, if this situationsystematically occurred the real-estate investmentwould not be exposed.The values in Table 9.8 would occur if dynamicor relative PPP holds, and if the euro value ofthe real estate systematically follows the overallEuropean rate of inflation. In such a situation thereis zero exposure. There is also no foreign exchangerisk: foreign exchange risk requires foreignexchange exposure. 16 In reality, two empirical factsforce us to reconsider the absence of exposure andrisk on real assets such as real estate:1 PPP does not hold, as we saw in Chapter 7.2 An individual real-estate investment, or evenreal estate investment in general, will notusually change in value by the overall rate ofinflation.Considering the first point alone, if PPP fails tohold and there is no tendency for adjustment ofprices and/or exchange rates towards PPP levels,then there is exposure. In this case there is nosystematic connection between exchange rates andprices of baskets of goods. If, on the other hand,deviations from PPP are random in the sense thatrelative price levels are sometimes higher andsometimes lower than the exchange rate wouldsuggest, but on average over a period of timeexchange rates equal PPP values, exposure is zero,just as if PPP always held. The departures from PPPin this case add to total risk, but to the extent thatthe deviations from PPP are caused by factors otherthan changes in exchange rates, they are not part offoreign exchange risk.As for the second point mentioned earlier, ifchanges in exchange rates do not reflect movementsin different countries’ prices of real estate, investorscan face exposure on real estate even if PPP holdsfor broad-based baskets of goods – which is the16 Exhibit 9.1 shows that offsets between asset values andexchange rates may depend on the length of investors’horizons.
FOREIGN EXCHANGE EXPOSURE AND RISKEXHIBIT 9.1HEDGING HORIZONSIf currencies depreciate when asset prices denominatedin those currencies increase, exposure is lessthan the value of the foreign assets; the movementsin exchange rates and asset prices are offsettingwhen translating values into a different currency.When there is no connection between asset prices andexchange rates, as with bank deposits, exposureequals the value of foreign assets. Finally, when currenciesand asset prices move in the same direction,with appreciation accompanying increasing assetvalues and vice versa, exposure exceeds the value ofthe foreign assets. As the following explains, the sizeof exposure appears to depend on the length of thehorizon that is studied. Specifically, it appears that anoffsetting of exchange rates and asset values resultingin exposure of less than the asset values occurs in thelong run, but the reverse occurs in the short run.Exposure to changes in exchange rates representsa major risk for international investors. During the1980s, it became common practice for investors tohedge currency risk as fully as possible by methodsincluding the purchase of futures contracts. But formany investors, this simple and seemingly sensiblehedging strategy actually may increase exchangeraterisk rather than reducing it, according toNBER Research Associate Kenneth Froot.In Currency Hedging Over Long Horizons(NBER Working Paper No. 4355), Froot examinesthe variability of returns to British residentson U.S. stock and bond investments during theperiod between 1802 and 1990. Where short-terminvestments are concerned, currency hedginggreatly affects British investors’ returns. Over aone-year period, Froot finds, the earnings fromunhedged U.S. stock portfolios, expressed inBritish pounds of constant value, are 13 percentmore variable than the earnings from fully hedgedportfolios. Unhedged portfolios of U.S. bondsshow 56 percent more variance than hedgedportfolios for British investors.But as the time horizon lengthens, the value ofhedging drops sharply. After three years, Frootreports, fully hedged U.S. stock portfolios showgreater variability than unhedged portfolios whentheir returns are expressed in real pounds. Thesame is true for bond portfolios at horizons ofabout seven years.The length of the investor’s time horizon isimportant where exchange rate hedging is concerned,Froot contends, because while short-termcurrency fluctuations are random, over the longerterm, currencies move toward purchasing-powerparity:the level at which amounts of similar valuehave similar buying power in each country. Thatmovement creates a ‘‘natural’’ exchange ratehedge for physical assets, such as factories andequipment, and for common stocks. If the value ofthe currency declines, the local-currency value ofsuch assets will rise over the long term to keep theirinternational value stable.The value of bonds, however, depends muchmore heavily on each country’s inflation andinterest rates, as well as on the real exchangerate.Convergence toward purchasing-powerparitytherefore will have less effect in reducingthe variability of foreign bond investors’ returns,which is why currency hedging may be more useful.Multinational corporations’ currency hedgingstrategies, Froot concludes, should be based on thenature of the investment and the duration of theanticipated exposure. If, for example, a companyborrows in one currency to build a plant in acountry with another currency, then hedging maybe unnecessary, as the physical assets will benaturally hedged as exchange rates move towardpurchasing-power-parity ...Source: ‘‘The Value of Exchange-Rate Hedging Dependson Your Horizon,’’ The NBER Digest, October 1993,pp. 3–4.207 &
MANAGING FOREIGN EXCHANGE RISK AND EXPOSUREprice measure that is relevant for the PPP principle.When dealing with exposure of particular items, it isthe law-of-a-single price that determines whetherthere is exposure. Furthermore, as with deviationsfrom PPP discussed earlier, it is the systematic relationbetween real-estate prices and exchange ratesthat determines whether or not foreign real-estateinvestment faces foreign exchange exposure. Whatis affected by individual asset prices moving differentlythan overall inflation is the total amount ofrisk. Added to the risk caused by PPP deviations isrelative-price risk. However, if this risk is not dueto exchange rate changes, while it adds to total risk,it does not add to exchange rate risk.Purchasing power parity andoperating exposure 17There are also implications of PPP for the foreignexchange exposure of operating incomes of firmsthat export, import, compete with imports, useimports, supply exporters, and so on. This type ofexposure is called operating exposure, and the riskis operating risk. 18 In particular, operating exposureis the sensitivity of real operating income tochanges in exchange rates. Similarly, operating riskis the volatility of operating income attributable tounanticipated changes in exchange rates. The effectson operations can be considered as effects on theincome statement while effects on assets andliabilities can be considered as effects on the balancesheet. The income statement effects are flows andso must be converted to present value amounts –which have a stock dimension – before being addedto exposure on assets or liabilities. When combined,the present value of operating effects plus theeffects on assets and liabilities gives the totalexposure.We should also note that operating risk andexposure involve effects of exchange rates on thecurrent and future profitability of firms. This isdistinct from the effects of exchange rates on the17 This section may be omitted without loss of continuity.18 Chapter 11 is devoted to the topic of operating exposure.& 208dollar values of foreign-currency accounts receivableand accounts payable. Accounts receivableand payable are fixed, face-value, short-term assetsand liabilities, and have risk and exposure like thoseof foreign-currency bank accounts and loans. Wehave called such items contractual amounts. On theother hand, operating incomes are not contractualvalues. Indeed, as we shall see, operating exposuredepends on very different factors than those wehave met before, such as the elasticity of demand forimports or exports, the fraction of input coststhat depend on exchange rates, the flexibility ofproduction to respond to exchange rate-inducedchanges in demand, and the reference currency forcomputing incomes. 19We can explain the difference between operatingrisk and exposure on the one hand, and asset andliability exposure on the other hand, as well as showthe relevance of PPP for operating risk and exposure,by considering the case of a US exporter sellingto Britain. Let us consider under what conditionsthe profit or operating income of the exporter issystematically affected by exchange rates.Let us denote the dollar profits of the USexporting firm by p; then from the definition ofprofits as revenue minus costs we can writeorp ¼ Sð$/£Þp UK qc US qp ¼½Sð$/£Þp UK c US Šq ð9:7ÞHere p UK is the pound price of the US firm’sexport good in Britain, and c US is the (constant) perunitUS dollar production cost of the export. Theproduct, S($/£)p UK , is the export sales price of thecompany’s product in dollars, and so the differencebetween S($/£)p UK and c US is the dollar profit19 As mentioned, these and other factors influencingoperating risk and exposure are explained in Chapter 11.The complexities of operating risk and exposure, as wellas the distinction between accounts-receivable exposureversus operating exposure, are covered in Exhibit 9.2,which considers the situation facing American Airlines.
FOREIGN EXCHANGE EXPOSURE AND RISKEXHIBIT 9.2FLYING HIGH: RISK AND EXPOSURE AT AMERICAN AIRLINESIn a study that uses statistical regression fordetermining foreign exchange risk and exposurefacing American Airlines, John Bilson discussedthe numerous ways that exchange rates can affectan airline. As the following excerpt explains, theroutes through which exchange rates work are manyand varied.Foreign exchange exposure is of increasingimportance in the airline industry as the largecarriers expand into foreign markets. Net foreigncurrency cash flows at American Airlines (AMR)have grown from $119 million in 1986 to $393million in 1990. <strong>International</strong> revenue has grownfrom 19.3 percent of the system total in 1986 toan estimated 26.7 percent in 1990. While thebulk of this expansion has been in the Europeanmarket, service to the Far East is expected to growrapidly in the near future. It is consequentlyimportant to know how the profitability ofthe airline will be influenced by the inevitablefluctuations in the price of foreign currenciesagainst the dollar.There are two primary sources of currencyexposure. The largest source arises from the timinglag between the sale of a ticket in a foreigncurrency and the receipt of the revenue in dollars.This delay averages 15 to 45 days in the majormarkets. After a ticket is sold in a foreign currency,a delay will occur before AMR receives therevenue (denominated in foreign currency) fromthe sale. If the foreign currency should depreciatebetween the time the ticket is sold and the time therevenues are repatriated, a loss will be recognizedon the transaction. Since AMR has positive excesscash flows in its foreign markets, this analysissuggests that AMR is net long in foreign currenciesand that hedge activities should involve shortpositions in foreign currencies.The second source of exposure results fromthe impact of exchange rates on anticipatedfuture cash flows. Since it is impractical to resetticket prices at short intervals, a depreciation ofa foreign currency will reduce the dollar value offuture cash flows if the foreign currency price andthe load factors are stable. This consideration alsosuggests that AMR is naturally net long in theforeign currencies where it is operationallyinvolved.If this approach is correct, an appreciation offoreign currencies should be associated withincreased profitability and a rise in the value ofAMR stock. However, the effect of the exchangerateon the profitability of an airline is considerablymore complex than its effect on cashflows and contemporaneous load factors. For theAmerican consumer of international air travelservices, appreciation in foreign currenciesincreases the total costs of international travel.While the airline ticket cost, which is denominatedin dollars, is typically not affected immediately, allother travel costs should increase in proportion tothe change in the exchange rate. It is thereforereasonable to assume that American overseastravel will be adversely affected by the appreciationof foreign currencies. It is true that adepreciation of the dollar should make travel tothe United States by foreigners less expensive, butif foreign travelers have a preference for theirnational airline, U.S. carriers could still beadversely affected. This effect would not beimmediately apparent in load factors since internationaltravel typically is planned in advance.However, if the market efficiently forecastsanticipated future revenues, the decline in profitabilityshould be immediately reflected in thestock price.Movements in exchange rates also reflectunderlying economic conditions. The prospect ofa recession in the United States will decreasethe demand for the U.S. currency and lead to adepreciation of the dollar. Since airline travel iscyclical, anticipated future revenue from bothdomestic and international travel is likely to209 &
MANAGING FOREIGN EXCHANGE RISK AND EXPOSUREdecline with prospective recession. While thisdecline is unlikely to be reflected in currentrevenues, it should be reflected in the stock price.Finally, the exchange-rate could also have anindirect effect on energy prices. When the dollardepreciates, U.S. energy prices have to rise inorder to maintain parity with world prices. If theindustry cannot offset the cost increases withhigher prices, anticipated future profitability willbe adversely affected.Source: John F.O. Bilson, ‘‘Managing Economic Exposureto Foreign Exchange Risk: A Case Study of AmericanAirlines,’’ in Yakov Amihud and Richard M. Levich (eds),Exchange Rates and Corporate Performance, New YorkUniversity Salomon Center, New York, 1994, pp. 221–46.(‘‘markup’’) per unit sold. By multiplying this differenceby the total quantity of sales, q, we get theUS exporter’s total profit in dollar terms, or p.In order to see the conditions under whichchanges in exchange rates will raise or lower a USexporter’s profits, we will write the annual rate ofchange in exchange rates as _S, and the rate of changeof profits as _p: as before, a dot over a variablesignifies a rate of change. Let us assume that themarket selling price of the company’s product in theUnited Kingdom grows at the British general rate ofinflation, which we have written as _P UK . Let us alsoassume that the production cost of the product,which is made in the United States, grows at thegeneral rate of inflation in the United States, _P US .For the given output level q, we can write the USexporter’s profit at the end of the year as follows:pð1 þ _pÞ ¼½Sð$/£Þp UK ð1 þ _SÞð1 þ _P UK Þc US ð1 þ _P US ÞŠqð9:8ÞEquation (9.8) is obtained from equation (9.7)simply by replacing p, S($/£), and so on, with theirvalues after one year has passed. These year-latervalues are the values at the beginning multiplied byone plus the annual rates of change.Subtracting equation (9.7) from equation (9.8)gives_p ¼ fSð$/£Þp UK ½_Sð1 þ _P UK Þþ_P UK Š c US _P US gq/pProfits will grow after, for example, a depreciationor devaluation of the dollar (when _S, which is shortfor _S($/£), is positive) if _p > 0, that is, ifSð$/£Þp UK ½_Sð1 þ _P UK Þþ_P UK Š c US_P US > 0& 210If the devaluation or depreciation takes placewhen the profits are zero [S($/£)p UK ¼ c US ], we canrewrite this as_P USSð$/£Þp UK ½_Sð1 þ _P UK Þþ_P UK Š> 0Since S($/£) and p UK are positive, a devaluation ordepreciation of the dollar will raise a US exporter’sprofits if ½_S(1 þ _P UK ) þ _P UK_P US Š > 0, that is, if_P UKP_S > _ USð9:9Þ1 þ _P UKSimilarly, a devaluation or depreciation will reduceprofits if_P UKP_S < _ USð9:10Þ1 þ _P UKComparison of the inequalities (9.9) and (9.10)with the relative form of PPP in equation (7.7)shows that for effects on profits to occur, that is, forthere to be operating exposure, it is necessary tohave ex post violations of PPP. The intuitive explanationof this is that for the US exporter’s productto gain in competitiveness in Britain from a dollardepreciation, it is necessary for the product’s priceto fall vis-à-vis prices of competing British goods.This requires that the depreciation exceed theextent to which US prices are increasing faster thanBritish prices. For example, if US prices areincreasing by 8 percent and British prices areincreasing by 6 percent, it is necessary for the dollardepreciation to exceed approximately 2 percent forthe US exporter’s competitiveness to be improvedfrom depreciation.
FOREIGN EXCHANGE EXPOSURE AND RISKIn deriving equations (9.9) and (9.10) we madean assumption. To repeat, we said: ‘‘assume that themarket selling price of the company’s product in theUnited Kingdom grows at the British general rate ofinflation, (and) that the production cost of theproduct ...grows at the general rate of inflation inthe United States.’’ Rather than PPP, what mattersto an individual firm is its own product price and itsown costs. What we have done above is put theconditions in terms of companies collectively.Consideration of the inequalities (9.9) and (9.10)tells us that if our assumption that an individualcompany’s prices and costs change at overall inflationrates is correct, and if PPP always holds, thereis no operating risk or exposure. Similarly, as withassets and liabilities, if PPP is violated but deviationsfrom PPP are as likely to be positive as be negativeand on average are zero, there is still no exposure.In terms of Figure 9.1, in this situation we have ascatter of points around the horizontal axis: there isno systematic relationship between operating incomeand exchange rates. Again, as with assets andliabilities, random deviations from PPP add to thetotal operating risk but do not add to exchange raterisk, which is the variation in operating income dueto unanticipated changes in exchange rates. That is,when PPP holds only as a long-run tendency, thefirm faces greater risk than when PPP always holds,but this added risk is due to the factors causing thedeviations from PPP, not the exchange rate.In deriving inequalities (9.9) and (9.10) weassumed that the market selling price of the USexporter’s product in Britain grows at the overallBritish rate of inflation and that the cost of productiongrows at the overall US rate of inflation.If these assumptions are possibly invalid at anymoment, but are valid on average, there is still noexposure provided of course that PPP holds, at leaston average. 20 However, violation of the assumptionsdoes add a relative price risk to any risk fromrandom deviations from PPP. This conclusion isvery similar to that reached for real assets.It should be remembered that while operatingrisk and exposure and real-asset risk and exposurerelate similarly to PPP, these two types of riskand exposure are completely different in nature.Indeed, gains and losses from operating risk andexposure have a different dimension to those fromreal-asset exposure and from exposure on any typeof asset or liability. Operating gains and losses havethe dimension of flows, with profit changes occurringby so much per month or per year, that is,over a period of time. On the other hand, assetand liability gains or losses have the dimension ofstocks, occurring at the moment of the change inexchange rates. Overall exposure is best consideredas an amount at a moment in time and so operatingexposures which appear on the income statementneed to be converted into present values beforeadding them to balance sheet exposures.SUMMARY1 From a US dollar perspective, foreign exchange exposure is the sensitivity of realUS-dollar values of assets or liabilities with respect to changes in exchange rates.2 Exposure is measured in units of foreign currency.3 Contractual assets or liabilities are those with domestic-currency values that do notdepend on exchange rates. Examples are bank deposits and bank loans.20 By the assumptions being valid ‘‘on average’’ we mean that there is no systematic difference between the rate of change of theproduct’s price and British inflation, and no systematic difference between the rate of change in production costs and USinflation.211 &
MANAGING FOREIGN EXCHANGE RISK AND EXPOSURE4 Exposure on a contractual asset or liability equals the value of the asset or liability.5 Exposure on a foreign asset or liability can be higher or lower than theforeign-currency value of the asset or liability depending on the correlation betweenthe local-currency value of the asset or liability and the exchange rate.6 Exposure is higher than the foreign-currency value of an asset if the local-currencyasset price and the exchange rate move in the same direction. This can happen withinvestments in foreign import-oriented companies that become more profitablewhen the importer’s domestic currency appreciates, and less profitable when theimporter’s currency depreciates.7 Exposure on a foreign asset is less than the value of the asset if the asset priceand the exchange rate move in opposite direction. This can happen with investments inforeign export-oriented companies that become more profitable when the domesticcurrency falls, and vice versa.8 Long foreign exchange exposure is when an investor gains when the foreign currencyrises and loses when the foreign currency declines. Short exposure is when aninvestor loses when the foreign currency rises and gains when the foreign currencydeclines.9 It is actually possible for an investor in a foreign stock to be short in the foreign currencyif after an appreciation of the foreign currency the stock price falls by more than theforeign-currency increases.10 An investor in foreign-currency bonds is exposed by more than the value of thebonds if the foreign central bank ‘‘leans against the wind,’’ raising interest rates when theforeign currency falls and lowering interest rates when the foreign currency rises.11 Domestic currency-denominated bonds can be exposed to exchange rates if thehome country central bank leans against the wind. If interest rates affect stock prices,the domestic stock market as a whole is also exposed.12 Exposure can be measured by the slope coefficient in a regression equation relating thereal change in the dollar value of assets or liabilities to changes in exchange rates.13 There is exposure only if there is a systematic relationship between home-currencyvalues of assets and liabilities and exchange rates. That is, for exposure to exist,dollar values must on average change in a particular way vis-à-vis unanticipated changesin exchange rates.14 Normally there is noise in the relationship between domestic-currency values andunanticipated changes in exchange rates. However, the size of foreign exchange exposureof, for example, a pound-denominated bond is still the face value of the bond if thenoise is random and on average equal to zero.15 When exposures exist against numerous currencies, they can be measured fromthe slope coefficients in a multiple regression.16 Foreign exchange risk is positively related to both exposure and the standard deviation ofunanticipated changes in exchange rates.17 When a foreign currency-denominated security is not hedged with a forwardexchange contract, it is exposed and subject to exchange rate risk, irrespective of whetherinterest parity holds.18 If individual asset values do not always change by the overall rate of inflation fora country but on average change at the rate of inflation, exposure is still zero if PPP holds& 212
FOREIGN EXCHANGE EXPOSURE AND RISKon average. With random departures from PPP there is an added source of risk,but this is part of the total risk, not the foreign exchange risk.19 The sensitivity of operating income to changes in exchange rates is called operatingexposure, and the standard deviation of operating income due to unanticipated changes inexchange rates is called operating risk.20 If PPP always holds exactly and market prices and production costs always move in linewith overall inflation, there is no operating exposure or operating risk. If PPPholds only on average and prices and production costs move on average at theoverall rate of inflation, there is still no exchange rate exposure or risk,but there is greater total risk.REVIEW QUESTIONS1 What is ‘‘foreign exchange exposure?’’2 What is a contractual asset or liability?3 What is a ‘‘reference currency?’’4 What is meant by a ‘‘systematic relationship?’’5 What variables go on the axes of an ‘‘exposure line?’’ How do these variables relate tothose used for drawing payoff profiles?6 What are the units of measurement of exposure to a particular exchange rate, forexample, euros per US dollar?7 How does the sign associated with exposure – positive versus negative – relate to whetherexposure is ‘‘long’’ or ‘‘short?’’8 What is ‘‘foreign exchange risk?’’9 Can an asset face exposure larger than the foreign-currency value of the asset?10 Can a domestic currency-denominated asset face foreign exchange exposure?11 How does foreign exchange exposure on real assets relate to the PPP condition.12 How does operating exposure relate to the PPP condition?ASSIGNMENT PROBLEMS1 In what sense is the sign – positive versus negative – of the slope coefficient whichmeasures exposure relevant, and in what sense is it irrelevant?2 How can exposure exceed the face value of a foreign currency-denominated asset orliability?3 If the Bank of Canada ‘‘leans against the wind,’’ which means increasing interest rateswhen the Canadian dollar depreciates and lowering interest rates when the Canadiandollar appreciates, what would this mean for the exposure ofa Canadian residents holding Canadian dollar-denominated bonds?b US residents holding Canadian-dollar bonds?Relate your answer to Question 2 above.213 &
MANAGING FOREIGN EXCHANGE RISK AND EXPOSURE4 How does PPP relate to:a exposure on real, fixed assets?b operating exposure?5 Would it make sense to add a firm’s exposures in different currencies at the spot exchangerate to obtain a measure of the firm’s aggregate exposure, and if not, why not?6 What is the problem in using the standard deviation of exchange rates as a measure offoreign exchange risk?7 If a company has used its currency of debt denomination and/or forward contracts tomake its exposure zero, what would measured exposure be from the b of a regression line,if in calculating b, the debt and/or forward contracts were omitted from the regressionequation?8 Would the distinction between real and actual changes in exchange rates be importantif inflation and interest rates were everywhere the same and were also small?9 By studying the stock price of a US-based publicly traded company you have noticed thatwhen the dollar drops against various currencies the company’s value on the stockexchange increases. By averaging the link between exchange rates and the company’svalue you have determined the size of the change in each exchange rate that increases thevalue of the company by $1 million:DS u ð¤/$Þ ¼0:1DS u ð¥/$Þ ¼5DS u ðSFr/$Þ ¼0:05DS u ðC$/$Þ ¼0:04What is the company’s exposure to the various currencies?10 Redo the analysis in this chapter of the effect of exchange rate changes on an exporter byallowing the quantity sold, q, to change with the exchange rate instead of holding itconstant. Use calculus to make the problem easier, and note that p UK and q shouldbe at profit-maximization levels in every period (this is a very difficult question).BIBLIOGRAPHYAdler, Michael and Bernard Dumas, ‘‘Exposure to Currency Risk: Definition and Measurement,’’ FinancialManagement, Summer 1984, pp. 41–50.Flood, Eugene Jr. and Donald R. Lessard, ‘‘On the Measurement of Operating Exposure to Exchange Rates:A Conceptual Approach,’’ Financial Management, Spring 1986, pp. 25–37.Garner C. Kent and Alan C. Shapiro, ‘‘A Practical Method of Assessing Foreign Exchange Risk,’’ MidlandCorporate <strong>Finance</strong> Journal, Fall 1984, pp. 6–17.Hekman, Christine R., ‘‘Measuring Foreign Exchange Exposure: A Practical Theory and its Application,’’Financial Analysts Journal, September/October 1983, pp. 59–65.Hodder, James E., ‘‘Exposure to Exchange-Rate Movements,’’ Journal of <strong>International</strong> Economics, November,1982, pp. 375–86.& 214
FOREIGN EXCHANGE EXPOSURE AND RISKJorion, Philippe, ‘‘The Exchange Rate Exposure of U.S. Multinationals,’’ unpublished manuscript, ColumbiaUniversity, February 1986.Korsvold, Pal E., ‘‘Managing Strategic Foreign Exchange Exposure of Real Assets,’’ presented at European<strong>Finance</strong> Association meetings, Madrid, September 1987.Lessard, Donald R. and David Sharp, ‘‘Measuring the Performance of Operations Subject to Fluctuating ExchangeRates,’’ Midland Corporate <strong>Finance</strong> Journal, Fall 1984, pp. 18–30.Levi, Maurice D., ‘‘Exchange Rates and the Valuation of Firms,’’ in Yakov Amihud and Richard M. Levich,Exchange Rates and Corporate Performance, New York University, New York, 1994, pp. 32–48.—— and Joseph Zechner, ‘‘Foreign Exchange Risk and Exposure,’’ in Robert Z. Aliber (ed.), Handbook of<strong>International</strong> Financial Management, Richard Irwin-Dow Jones, New York, 1989.Nobes, Christopher: <strong>International</strong> Guide to Interpreting Company Accounts: Overcoming Disparities in NationalAccounting Procedures, Financial Times Management Reports, London, 1994.Oxelheim, Lars and Clas G. Wihlborg, Macroeconomic Uncertainty: <strong>International</strong> Risks and Opportunities for theCorporation, Wiley, New York, 1987.Shapiro, Alan C., ‘‘Defining Exchange Risk,’’ The Journal of Business, January 1977, pp. 37–9.——, ‘‘What Does Purchasing Power Parity Mean?’’ Journal of <strong>International</strong> Money and <strong>Finance</strong>, December 1983,pp. 295–318.Solnik, Bruno, ‘‘<strong>International</strong> Parity Conditions and Exchange Risk,’’ Journal of Banking and <strong>Finance</strong>, August1978, pp. 281–93.Stulz, Rene and Rohan Williamson, ‘‘Identifying and Quantifying Exposure,’’ Working Paper 96–14, FisherCollege of Business, Ohio State University, 1996.215 &
Chapter 10Accounting exposure versusreal exposure 1There is no such source of error as the pursuit of absolute truth.Samuel ButlerThe definitions of foreign exchange exposure andrisk in Chapter 9 relate to the true economic effectsof exchange rates, and indeed, exposure and risk aswe have defined them are often called economicexposure and economic risk. While in principle,economic effects should be apparent in companies’accounts, in reality the effects of exchangerates that appear in financial statements rarely ifever correspond with the economic measures. Theeffect of exchange rates which appears in financialstatements is called accounting exposure. Inthis chapter we trace through the ways differentaccounting principles measure the effects ofexchange rates, and how these measures compare towhat we refer to as real changes in exchangerates, where by ‘‘real changes’’ we mean trueeconomic effects of exchange rates. We begin withan outline of accounting principles that have been orthat are currently being used to record internationalfinancial transactions.ACCOUNTING PRINCIPLESIt is necessary to have rules for converting values offoreign assets, liabilities, payments, and receipts1 This chapter can be omitted without loss of continuity.& 216into domestic currency in order to include themin consolidated financial statements in a firm’sdomestic reporting currency (the domesticreporting currency is usually that of the countrywhere the head office is located). Different countriesuse different conversion rules, and so it isdifficult to provide generally valid guidelines inthis book. However, by focusing on the accountingprinciples of one country, the United States,many of the common issues and problems can beidentified and addressed.Acceptable rules for preparing financial statementsin the United States are provided by theFinancial Accounting Standards Board(FASB). Our focus is on the international dimensionsof financial reporting, and not on mattersrelating to corporate governance. This is notmeant to diminish the importance of the role thataccurate accounting plays in the governance ofbusiness. Indeed, as we became so keenly aware inthe stunning revelations of accounting irregularitiesinvolving Enron and WorldCom, the quality andintegrity of financial reporting is critical to properlyfunctioning commerce. However, since this is abook in international finance and since governanceissues do not play a particularly important role atthe international level, we focus instead on the issue
ACCOUNTING EXPOSURE VERSUS REAL EXPOSUREof the effect of rules governing the choice ofexchange rates for the gains or losses on assets andliabilities appearing in income statements. We alsodeal with the effect of exchange rates on operatingincome and expenses. 2The income statement, which is also called theprofit and loss statement, typically attracts moreattention than a firm’s balance sheet because taxesare based on income, and as we shall claim, it isusually assumed that shareholders can see throughthe veil of accounting rules that affect balance sheetvalues.It will help the reader’s understanding of howUS international accounting principles affect gainsand losses on assets and liabilities by distinguishingbetween translation risk and translationexposure on the one hand, and transaction riskand transaction exposure on the other. From aUS perspective, translation risk is the uncertainty ofreal US dollar asset or liability values appearing infinancial statements, where this uncertainty is due tounanticipated changes in exchange rates. Similarly,translation exposure is the sensitivity of valuesappearing in financial statements to changes inexchange rates. On the other hand, transactionrisk is the uncertainty of realized US dollar assetor liability values when the assets or liabilities areliquidated, due to unanticipated changes in exchangerates. Similarly, transaction exposure is the sensitivityof changes in realized US dollar values ofassets or liabilities when the assets or liabilities areliquidated, with respect to unanticipated changesin exchange rates (see Exhibit 10.1). 3Until 1982, the United States used an accountingstandard generally known as Financial AccountingStandard 8, or briefly, FAS 8. Under FAS 8a company was required to show all foreign exchangetranslation gains or losses (those from converting2 The impact of exchange rates on operations, calledoperating exposure, is the topic of the next chapter,Chapter 11, while the management of operating exposureis discussed in Chapter 12.3 The distinction between translation and transactionexposure is discussed in Exhibit 10.1.foreign assets or liabilities into dollar amounts) inthe current-period income statement. Differenttreatment was given to current operating receiptsand expenditures and financial assets/liabilities onthe one hand, and to fixed (or real) assets on theother hand. This was referred to as a temporaldistinction, and the rules were as follows. 41 Revenues and expenses from foreign entities(overseas operations) were translated atthe average exchange rate prevailing during theperiod. Financial assets and liabilities weretranslated at the average exchange rate duringthe period.2 Other assets, primarily fixed assets, weretranslated at historical exchange rates. Historicalcosts were used in terms of local (foreign)currency. 5What FAS 8 therefore required was that if localcurrencyvalues were measured at current cost, theywere to be translated at current exchange rates, andif they were measured at historical cost, they were tobe translated at historical exchange rates.The fact that FAS 8 required that all translationadjustments appear in the income statement madeincome appear highly volatile and caused numerouscorporate treasurers to take permanently hedgedpositions. The procedure which has replaced FAS 8is called FAS 52, and this involves two principalchanges:1 The functional currency is selected foreach subsidiary. This is the primary currency of4 SeeStatement of Financial Accounting Standards, No. 8, FinancialAccounting Standards Board, Stamford, CT, October 1975.The accounting system which replaced the FAS 8 system isdescribed in Statement of Financial Accounting Standards, No. 52–Foreign Currency Translation, Financial Accounting StandardsBoard, Stamford, CT, December 1981.5 Fixed assets include buildings, equipment, and other itemsfor which prices tend to reflect inflation. While economistsrefer to fixed assets as ‘‘real assets,’’ we use the termpreferred by accountants in this chapter to reduce confusionbetween real assets and real changes in exchange rates.217 &
MANAGING FOREIGN EXCHANGE RISK AND EXPOSUREEXHIBIT 10.1 TRANSLATING ACCOUNTANTS’ ANDECONOMISTS’ LANGUAGESThe excerpt below, which is revised slightly to reflectcurrent practices, emphasizes the distinction betweentranslation and transaction exposure according towhether conversion of currencies has occurred. It alsomakes clear why it is the need to consolidate worldwideincome that causes translation exposure.Transaction exposureTransaction exposure occurs when one currencymust be exchanged for another, and when a changein foreign exchange rates occurs between the timea transaction is executed and the time it is settled.Take the case of ABC Corporation, a U.S.-basedmultinational with extensive operations in Europe.Suppose ABC’s UK subsidiary sells product to aGerman company. The customer wishes to transactin euros. The sale is made on May 1 on 30-dayterms. ABC-UK receives euros on June 1 andconverts to British pounds. If the £/d exchangerate changes in May, ABC-UK receives more orfewer pounds than anticipated at the time of thetransaction. The risk here thus involves uncertaintyabout a specific identifiable cash flow; it isreferred to as ‘‘transaction’’ exposure because itinvolves an actual gain or loss due to conversion ofone currency into another.Translation exposureTranslation exposure arises in multinational firmsfrom the requirement that U.S. companies (andthose foreign firms following U.S. accountingpractices) produce consolidated financial statements.Subsidiaries of multinational companiesoperating in different countries typically transactin local currencies. Local currency is also normallythe unit of account for accounting, performancemeasurement, and taxation at the local level;and thus the operating financial statements ofsubsidiaries are generally denominated in localcurrencies.Periodically (often quarterly but at leastannually), however, these subsidiary statementsmust be summed into consolidated statements forthe entire multinational enterprise and denominatedin the home currency. In ABC’s case, thismeans consolidating statements denominated ina wide variety of currencies around the globe andexpressing them in U.S. dollar equivalents. Toprovide a measure of ABC’s worldwide performancein the home currency, operating results andasset values denominated in foreign currenciesmust be translated into dollar equivalents.Although there is a restatement of values intoa different currency, there is no actual conversionof one currency into another.Source: John P. Pringle, ‘‘Managing Foreign ExchangeExposure,’’ Journal of Applied Corporate <strong>Finance</strong>, Winter1991, pp. 73–82. Minor revisions made to reflect currentpractices.the subsidiary. For example, a British subsidiaryof a US parent firm will declare that thepound is its functional currency. Any foreigncurrencyincome of the subsidiary (e.g. eurosor Swiss francs earned by the British subsidiary)is translated into the functionalcurrency according to the FAS 8 rules. Afterthis, all amounts are translated from thefunctional currency into dollars at the currentexchange rate.& 2182 Translation gains and losses are disclosed andaccumulated in a separate account showingshareholders’ equity. Only when foreign assetsor liabilities are liquidated do they becometransaction gains or losses and appear in theincome statement (see Exhibit 10.2). 66 See Exhibit 10.2 for more on the rules and rationale for theexchange rates used to compute gains or losses on assets andliabilities, and on where these gains or losses should appear.
ACCOUNTING EXPOSURE VERSUS REAL EXPOSUREEXHIBIT 10.2FROM HISTORICAL TO CURRENT RATES: THE RATIONALEFOR A CHANGE IN APPROACHUS international accounting rules went through amajor revision in 1982. The following excerpt, revisedto reflect current practices, explains these revisions,their rationale, and the reasons it was decided toseparate foreign exchange translation gains or lossesfrom income.What exchange rate should be used inmaking the translation?This issue has been the center of a longstandingcontroversy among accountants and financial officers.Should it be the current exchange rate at thetime the translation is done? Or should it be thehistorical rate at the time the asset or liability wenton the books? It can make a big difference, especiallyin the case of long-lived items such as fixed assets.Financial Accounting Standard #8, promulgatedin the U.S. in 1975, mandated the so-called temporalmethod, which uses the rate at the time the asset orliability was booked. This meant different rates fordifferent items.FAS #8 was widely criticized and gave way toFAS #52 in 1982, which mandates the current ratemethod. Under the current rate method, all assetsand liabilities are translated at the current exchangerate at the time of the translation; equity accountsare translated at historical rates; and income statementitems are converted at a weighted average ratefor the period. Translation exposure thus arises because changesin exchange rates change the dollar equivalents offoreign currencies. A profit of EUR (euro) 10 millionin ABC-France would translate into USD (U.S.dollar) 11,764,706 at an exchange rate of EUR0.85 per USD. But if the dollar strengthens to EUR0.95 per USD, the same EUR 10 million falls toUSD 10,526,316. An asset worth EUR 25 milliontranslates into USD 29.41 million at an exchangerate of EUR 0.85 per USD, but into only USD 26.32million at 0.95. In short, the USD representation ofthe asset’s value depends on the exchange rate.And so it should. The shareholders of the parentcompany ABC Corporation are ultimately interestedin results expressed in dollar terms. And, for thisreason, ABC Corporation’sprofits and market valueare vulnerable to shifts in the EUR/USD exchangerate. There is no impact on the subsidiary’s financialstatements in EUR terms; the impact is only in thedollar equivalents. Note also that in this case there isno conversion of euros into actual dollars; we havemerely expressed or translated EUR into U.S. dollarequivalents.Note FAS #52 was promulgated in 1982 and made mandatoryfor US companies in 1983. It required the selection ofa ‘‘functional currency’’ for foreign subsidiaries, definedas the currency of the ‘‘primary economic environment.’’If the US dollar were selected as the functional currency,the translation rules were identical to those of FAS #8.If the local currency were chosen, FAS #52 permitted twoimportant changes: (1) it mandated the current rate methodin place of the temporal method, thus permitting the useof the current forex (foreign exchange) rate for translatingfixed assets: and (2) it allowed firms to separate transactionsand translation exposures, and to charge translationgains and losses to a special equity account rather thanrunning them through the profit and loss (P & L) statement,as had been required under FAS #8. Transaction gains andlosses continued to go through the P & L as before.Source: John J. Pringle, ‘‘Managing Foreign ExchangeExposure,’’ Journal of Applied Corporate <strong>Finance</strong>, Winter1991, pp. 73–82. Adapted to reflect current practices.The rule on using current exchange rates on allitems is relaxed when there is extremely highinflation in the country whose currency is beingtranslated. Extremely high inflation means acumulative amount of over 100 percent during theproceeding 3 years. If this condition is met, thetemporal distinction used in FAS 8 still applies. Thismeans that in circumstances of extreme inflation,219 &
MANAGING FOREIGN EXCHANGE RISK AND EXPOSUREcurrent exchange rates are used for current-costitems such as financial assets and liabilities, andhistorical rates are used for historical-cost items.This means that different exchange rates are usedwithin the same account for converting differentitems from the same foreign country/currency,something that some believe could add moreconfusion than clarity.The best way to illustrate the effects of theseaccounting procedures is to take examples. However,before we consider these examples it is usefulto define the concept of real changes in exchangerates. This is because our examples show not onlythe implications of US accounting principles fortranslation and transaction gains and losses butalso the extent to which the accounts accuratelyreflect what has really happened to exchange rates.REAL CHANGES IN EXCHANGE RATESDefinition of the real change inexchange ratesWe can define a real change in exchange rates inthis way:A real change in exchange rates is a change thatproduces a difference between the rates of returnon domestic versus foreign assets/liabilities or inthe operating profitability of firms.As we proceed, we shall see that in order for realchanges in exchange rates to occur there must beex post departures from interest parity or PPP. Wehave already seen that PPP departures are necessaryfor there to be exchange-rate exposure. 7 However,this is as far as the analogy goes. The real change inexchange rates is a measure of how much a particularchange in exchange rates has affected domestic versusforeign returns or profitability. On the other hand,exchange-rate exposure is a measure of the sensitivityof asset or liability values or operating incomes to7 In Chapter 9 we showed that exposure on real assets and onoperating incomes depend on departures from PPP.& 220exchange-rate values that could occur. Therefore, whilethe sources of exchange-rate exposure and of realchanges in exchange rates are similar, they aremeasures of very different phenomena. 8Financial assets and liabilities and realchanges in exchange ratesSuppose that Aviva Corporation, which we introducedin Chapter 8, has invested in British bonds.Let us assume that these are long-term bonds.Clearly, a depreciation of the British pound willdecrease the dollar value of these financial securitieswhen they are translated (i.e. converted) into dollarsat the new exchange rate. But would we want toconsider Aviva as being worse off by holding pounddenominatedbonds rather than dollar-denominatedbonds if the interest rates on the two bonds aredifferent? Alternatively, under what circumstanceswould an appreciation of the pound make Avivabetter off?A depreciation of a currency that is fully compensatedfor in terms of higher interest rates onfinancial assets should not be considered a realdepreciation from the point of view of these assets.For example, if the pound fell in value againstthe dollar by 10 percent but British interest rates were10 percent higher than those in the United States, thefirm would be no worse off from British than fromUS investments. 9 According to our definition of a realchange in exchange rates, that is, a change whichaffects the rate of return on foreign versus domesticassets, we might therefore define the real change forfinancial assets held for a year as follows:Real change in ð$/£Þ¼ S 1ð$/£Þ Sð$/£ÞSð$/£Þðr $ r £ Þ8 Indeed, the units of measurement are different. Wemeasure real changes in exchange rates in percent,whereas exchange-rate exposure has the dimension ofunits of a particular currency.9 For simplicity we talk here of countries rather thancurrencies. The currency difference is the importantdifference.
ACCOUNTING EXPOSURE VERSUS REAL EXPOSURES 1 ($/£) is the actual spot rate at year end, and r $and r £ refer to interest earnings during that year.The definition consists of the actual proportionalincrease in the value of the pound – assumingS 1 ($/£) > S($/£) – adjusted for the extent to whichhigher dollar versus pound interest rates have compensatedfor this percentage increase in the pound.Because translation losses or gains are made onthe interest earned on pound bonds as well as on theprincipal, a more precise definition is:Real change in ð$/£Þ¼ S 1ð$/£Þ Sð$/£Þð1 þ r £ ÞSð$/£Þðr $ r £ Þð10:1ÞThe real change of $/£ shown in equation (10.1)is equal to the ex post deviation from unhedgedinterest-parity, which can be seen as follows.Each dollar a US investor invests in Britain willbuy 1/S($/£) of British pounds, which will pay backafter 1 year1£Sð$/£Þ ð1 þ r £ÞIf the British investment is not hedged by selling thepounds forward, the pounds will be sold and convertedinto dollars at the following year’s spot rate,S 1 ($/£), giving$ S 1ð$/£ÞSð$/£Þ ð1 þ r £ÞThe return from the unhedged British security istherefore this amount minus the original dollarinvested, that isS 1 ð$/£ÞSð$/£Þ ð1 þ r £Þ 1The difference between this return and the USdollar return isS 1 ð$/£ÞSð$/£Þ ð1 þ r £Þð1 þ r $ ÞBy subtracting and adding (1 þ r £ ) this can bewritten asorS 1 ð$/£Þ Sð$/£Þð1 þ r £ Þþð1 þ r £ ÞSð$/£Þð1 þ r $ ÞS 1 ð$/£Þ Sð$/£Þð1 þ r £ ÞSð$/£Þðr $ r £ Þ ð10:2ÞComparison of equation (10.2) with equation (10.1)shows that a real change in the exchange rate forfinancial securities occurs when there is an ex postdeparture from uncovered interest parity.Financial assets and liabilities and financialaccounts: learning by exampleIn order to describe how US international accountingprinciples show translation gains or losses onfinancial assets and liabilities, and to compare thesituation shown by the accounting treatment withthe definition of the real change in exchange rates,suppose that in the previous year Aviva placed$1 million in a US dollar long-term bond yielding12 percent (r $ ¼ 0.12), and $1 million in a poundlong-term bond yielding 20 percent (r £ ¼ 0.20).Suppose that last year the spot rate was S($/£) ¼ 2.0and that during the year the pound depreciates toS 1 ($/£) ¼ 1.8.The actual pound depreciation is 10 percent.However, higher pound versus dollar interest ratesmake up for some of this. The real depreciation ofthe pound given by equation (10.1) is1:8 2:0Real change in ð$/£Þ ¼ ð1:20Þ2:0ð0:12 0:20Þ¼ 0:04The negative value means a real depreciation of thepound of 4 percent, which is a real appreciation ofthe dollar. The 10 percent decline in the value of the221 &
MANAGING FOREIGN EXCHANGE RISK AND EXPOSURE& Table 10.1 Earnings on domestic versus foreign financial assetsRealized spotrateS 1 ($/£)¼ 1.8000S 1 ($/£)¼ 1.8667S 1 ($/£)¼ 1.9000Interest earningsDeclared income,FAS 52Shareholder equity,FAS 52Overall incomeReal gain/losson pound bondþ$180,000 þ$180,000 $100,000 þ$80,000 $40,000þ$186,667 þ$186,667 $66,667 þ$120,000 $0þ$190,000 þ$190,000 $50,000 þ$140,000 þ$20,000pound is not fully compensated by the higher poundinterest rate.In terms of the financial accounts, after placing$1 million in the dollar bond for 1 year, there willbe $120,000 in interest appearing in the incomestatement, and if interest rates and hence dollarbond prices do not change, there is no change in thevalue of financial assets. Therefore, total earningson the dollar bond are $120,000. How does thiscompare to the pound bond?Placing $1 million in a pound bond at the initialexchange rate S($/£) ¼ 2.0 means investing£500,000. At r £ ¼ 0.20, this will earn £100,000. Atthe exchange rate of $1.8/£ at the end of the year,the £100,000 will be translated into $180,000 ofincome. This is shown as interest earnings in the toprow of Table 10.1.The £500,000 pound bond is worth only$900,000 at the rate of $1.8/£. Since the initialvalue was $1 million, there is a translation loss of$100,000. Under FAS 8 this would have appearedin the income account, but with the FAS 52accounting procedure it will appear separately asshown in the third column of Table 10.1. We seethat under the FAS 52 system, there is a declaredincome of $180,000 if the translation loss is notrealized, that is, if the bond is not sold, and a$100,000 loss in the shareholder-equity account.Combining the shareholder-equity account withthe declared income, we have an overall incomeon the pound bond of $180,000 $100,000 ¼$80,000. Compared with the $120,000 that wouldhave been earned on the dollar bond, this involvesa relative loss of $40,000, which is 4 percent of the& 222original investment. The real depreciation ordevaluation of 4 percent found from the FAS 52procedure agrees with what we found in thedefinition, equation (10.1). But we note that wemust include shareholder-equity effects if we are tomake the correct judgment of the real change inthe exchange rate from the accounting statementsbased on FAS 52.If the exchange rate after a year of investmenthad moved to S 1 ($/£) ¼ 1.8667, then thereal change in the exchange rate would have beenzero, since the definition, equation (10.1), tellsus that1:8667 2:0ð1:20Þ ð0:12 0:20Þ ¼0:02:0This result occurs because the end-of-year exchangerate of $1.8667/£ is the rate that produces ex postunhedged interest-parity. 10In terms of the entries in the financial accounts,$1 million invested in the pound bond atS($/£) ¼2.0 is £500,000, which as before earns£100,000. At S 1 ($/£) ¼ 1.8667, the £100,000of interest is worth $186,667. The translationloss on the financial asset at the realized exchangerate is $66,667 [ ¼ ($1.8667/£ £ 500,000)$1,000,000]. Using FAS 52, this gives total earnings10 With r £ ¼ 0.20, r $ ¼ 0.12, and S($/£) ¼ 2.0 we canrearrange the unhedged interest-parity conditionS 1 ð$/£Þ ¼Sð$/£Þ 1 þ r $1 þ r £to find S 1 ($/£) ¼ 1.8667.
ACCOUNTING EXPOSURE VERSUS REAL EXPOSUREof $120,000 (¼ $186,667 $66,667) if we arecareful to aggregate the interest earnings fromthe income account and the foreign exchange lossgiven in the separate shareholder-equity account.We obtain the same recorded earnings on both bonds,$120,000. This corresponds with the conclusionfrom equation (10.1) of no real change in theexchange rate.If the pound falls in actual value by only 5 percentfrom S($/£) ¼ 2.0 to S 1 ($/£) ¼ 1.9, then the£100,000 in earnings from the pound bondwill be worth $1.9/£ £100,000 ¼ $190,000,and the translation loss will be $50,000 [($1.9 500,000) $1,000,000]. The total recorded earningsare therefore $140,000 ($190,000 $50,000) if weare careful to include all earnings. This is $20,000more than the earnings from the dollar bond, ora 2 percent extra return. Even though the pound hasfallen in value, the compensation in the relativelyhigher British interest rate is a real gain from theBritish bond of 2 percent. This will be found as thereal percentage change in the exchange rate fromthe definition, equation (10.1), but we again notethat in order for the accounts to give the correctresult, they must be integrated so that equity effectsare added to income earned.Judging the borrowing decision, which meansjudging financial liabilities, is the reverse of judgingthe investment decision, and we must reverse theinterpretation of equation (10.1). When borrowingis unhedged, real borrowing costs are the same onforeign and domestic currency if the depreciationin the value of the foreign currency is compensatedfor by higher interest payments. There is an ex postreal gain from borrowing foreign instead of domesticcurrency if the realized depreciation of the foreigncurrency is more than the extra interest rate thatis paid on the foreign-currency borrowing. There isa real loss from borrowing foreign rather thandomestic currency if the realized depreciation ofthe foreign currency is less than the extra interestpaid. These effects can be found in financial statementsusing FAS 52, provided we integratethe shareholder-equity account with the incomestatement.Fixed assets and real changesin exchange ratesIf fixed-asset prices have risen at the rate _P US and thereal rate of return (in the form of, e.g. rentalincome or dividends on the assets) has been, r US ,then the overall rate of return on each dollar of fixedassets held at home is 11r US þ _P USð10:3ÞEach dollar placed in British fixed assets thatrose with inflation at _P UK with a rent or dividendrate of r UK will produce, when translated atthe new realized exchange rate S 1 ($/£), dollarreceipts of$ S 1ð$/£ÞSð$/£Þ ð1 þ r UK þ _P UK Þð10:4ÞThis is because the original dollar will purchase£[1/S($/£)] of British fixed assets, on which there isa rental or dividend of r UK and inflation of _P UK , andwhich is translated back into dollars at S 1 ($/£). Therate of return on the dollar invested in the Britishfixed asset is thereforeS 1 ð$/£ÞSð$/£Þ ð1 þ r UK þ _P UK Þ 1 ð10:5ÞAccording to our definition of the real change in theexchange rate as the change causing a differencebetween the overall return on domestic versusforeign investments, from (10.5) minus (10.3)11 We use the subscripts US and UK rather than $ and £because fixed assets are specific toacountry, not a currency.For simplicity we refer to US and British inflation eventhough we are dealing with asset prices, not with overallprice levels. We do this because ‘‘fixed assets’’ is a bigcategory, making it inappropriate to refer to the law of oneprice. Thinking in terms of inflation allows us to reachconclusions in terms of PPP which can be related to otherparts of the book.223 &
MANAGING FOREIGN EXCHANGE RISK AND EXPOSUREwe have:Real changein ð$/£Þ¼S 1ð$/£ÞSð$/£Þ ð1 þ r UK þ _P UK Þ 1ðr US þ _P US Þð10:6ÞBy adding and subtracting _P UK this can be written asReal change in ð$/£Þ ¼ S 1ð$/£ÞSð$/£Þ ð1 þ _P UK Þð1 þ _P UK Þþ_P UKþ S 1ð$/£ÞSð$/£Þ r UKr US_P USwhich by combining terms givesReal change in ð$/£Þ¼ S 1ð$/£Þ Sð$/£Þð1 þ _P UK ÞSð$/£Þð_P US_P UK ÞS 1 ð$/£Þr USSð$/£Þ r UK ð10:7ÞExamination of equation (10.7) shows that if rental ordividend yields in the United States and Britain areequal when we include the translation gain/loss in theBritish yield, that is, if r US ¼ [S 1 ($/£)/S($/£)]r UK ,then equation (10.7) becomesReal change in ð$/£Þ¼ _Sð1 þ _P UK Þ ð_P US _P UK Þ ð10:8Þwhere S ¼ [S 1 ($/£) S($/£)]/S($/£) is the proportionalchange in the exchange rate. A comparisonof equation (10.8) with the relative form ofPPP in equation (7.7) shows that real changes inexchange rates on fixed assets require ex post deviationsfrom PPP. 12 We recall that this conclusionalso applies to real changes in exchange rates for the12 Alternatively, if we think of a specific type of fixed asset sothat _P US and _P UK refer to specific prices, we can concludethat real changes in exchange rates require deviations fromthe law of one price rather than PPP.& 224operating profitability of firms; as we saw in ourdiscussion of operating exposure in Chapter 9,a change in profitability requires ex post departuresfrom PPP.Fixed assets and financial accounts:learning by exampleWhen we examine the financial accounts in order tojudge the performance of domestic versus foreignfixed investments we face even more problems thanwith financial assets and liabilities. With financialassets and liabilities we can obtain the correctjudgment as long as we are sure to include both theincome and the separate shareholder-equity effectswithin total earnings. With fixed assets, this is notsufficient. Indeed, by including shareholder-equityeffects as they are measured with the FAS 52accounting procedure, we might distort the pictureeven more than by leaving these effects out of thecalculations. These points are by no means obvious,so we will show them by taking an example.Suppose that at the beginning of the previousyear, $1 million was invested in US fixed assetsthat provided a 5 percent real rate of return and$1 million was invested in British fixed assets thatprovided a 5.5556 percent real rate of return.Suppose that during the previous year, inflation inthe United States was 10 percent and inflation inBritain was 16 percent, with fixed-asset pricesand general prices moving at the same rates. Supposethat at the beginning of the previous year theexchange rate was $2.0/£ and that by the end ofthe year it was $1.8/£. We haver US ¼ 0:0500 r UK ¼ 0:05556 _P US ¼ 0:10_P UK ¼ 0:16 Sð$/£Þ¼2:0 andS 1 ð$/£Þ¼1:8What we want to know from the example is whatwe will find in a company’s accounts.The actual pound depreciation or devaluation is10 percent. However, the higher inflation in assetvalues in Britain has made up for some of this.The real pound depreciation (dollar appreciation)
ACCOUNTING EXPOSURE VERSUS REAL EXPOSURE& Table 10.2 Earnings on foreign fixed assetsRealizedspot rateS 1 ($/£)¼ 1.8000Rental or Translation gainprofitincome FAS 52 CorrectmethodIncome plus declaredtranslation gainFAS 52CorrectmethodIncome plus actualtranslation gainFAS 52Correctmethodþ$50,000 $100,000 þ$44,000 þ$50,000 þ$94,000 $50,000 þ$94,000against which to judge the measured accountingeffects is calculated with equation (10.7), which givesReal change in ð$/£Þ1:8 2:0¼ ð1:16Þ2:0ð 0:06Þ1:80:052:0 0:05556¼ 0:056, or 5:6%Since the change is negative, we call it a real pounddepreciation. It is smaller than the actual depreciationbecause the change in the exchange rate hasbeen partially compensated by higher rates of returnin Britain and higher inflation in the market value ofBritish fixed assets. But what will the financialaccounts show?In terms of the financial accounts, the $1 millionin the US fixed assets earned a return ofr US $1,000,000 ¼ $50,000. In addition, the10 percent inflation in the United States raised thedollar value of the fixed assets by $100,000, whichis a ‘‘gain’’ to the company even if it does not showin accounts until it is realized. Therefore, the totalearned on the US fixed asset is $150,000. How doesthis compare to the British asset?The $1 million sent to Britain at S($/£) ¼ 2.0had an initial value of £500,000. At r UK ¼ 0.05556,the £500,000 earned r UK £ 500,000 ¼ £27,778.When translated into US dollars at the currentexchange rate S 1 ($/£) as current earnings, this£27,778 becomes $1.8/£ £27,778 ¼ $50,000which appears in the income statement. The $50,000is shown as the first item in Table 10.2. Translationgains and losses – those resulting from convertingforeign asset values into units of domestic currency –require more careful treatment than income on theinvestments.With FAS 52, the values of fixed assets aretranslated at current exchange rates, but historicalcosts are used for the value of the assets in the localcurrency. The current exchange rate is S 1 ($/£) ¼1.8, and the historical cost is £500,000, and so thevalue is recorded as $900,000. There is a translationloss of $100,000 from the original $1 million valueof the British fixed asset. This is excluded fromcurrent income and goes only into the separateshareholder-equity account, and so the declaredincome is only the $50,000 of earnings. 13 However,if exchange rates do not return to the previouslevels before the British fixed asset is sold, the$100,000 will appear as income when it becomesa transaction loss, showing a loss of $50,000($50,000 $100,000).The economically correct method for handlingforeign fixed assets uses the current exchange rateand the current market value of assets. This isdifferent from both the current FAS 52 procedureand the older FAS 8 procedure. We note thatby the year end, the initial £500,000 invested inthe British fixed asset has increased with 16 percentinflation to £580,000. At the current exchange rateof S 1 ($/£) ¼ 1.8, this translates into $1,044,000 onthe income statement, and so there is a translation13 Our treatment is valid for countries which do not sufferfrom extreme inflation and for which the straightforwardforms of FAS 52 rules apply. Countries with extremeinflation (over 100 percent cumulative inflation in 3 years)continue to use the temporal distinction of FAS 8.225 &
MANAGING FOREIGN EXCHANGE RISK AND EXPOSUREgain of $44,000 ($1,044,000 $1,000,000). If thisis included as income, the total earnings fromBritain are $50,000 þ $44,000 ¼ $94,000, comparedwith the total return from US fixedassets of $150,000. The relative loss from thechange in exchange rates is $56,000 ($94,000$150,000), which is 5.6 percent of the originalinvestment, the same as the real percentage changein exchange rate computed with equation (10.7).This correct result is in contrast with the outcomeof FAS 52. When the shareholder-equity effect isincluded in FAS 52 and the total return from theBritish fixed asset is compared with the return fromthe US asset, we have a relative loss on the Britishasset of $200,000 ( $50,000 $150,000),implying a real change in exchange rate of 20percent, far larger than the 5.6 percent obtainedfrom equation (10.7). We do not obtain the correctpicture from the FAS 52 procedure.The relevance of translation exposureFAS 8 rules were frequently criticized because bybringing translation gains and losses into incomestatements, corporate taxes were affected. Whilemany were willing to accept transaction gains andlosses as part of income – as they were under FAS 8rules and continue to be under FAS 52 – translationgains or losses were another matter. Inorder to prevent volatile income from FAS 8translation rules it was common for firms tohedge their accounting exposure. Some economistsbelieved this hedging to be unnecessarybecause, on average, gains and losses from fluctuatingexchange rates average out to zero.Therefore, provided that corporate tax rates arenot progressive, the long-run situation should notbe affected by what appeared in income statementsfrom year to year. These economists alsobelieved that actual and potential shareholderswould be able to see through the veil ofaccounting rules to the true economic effects.Therefore, they believed that if a firm decided tohedge it should hedge against exposure as measuredby b in equation (9.1), rather than hedgeaccounting exposure. However, as we shall see inChapter 12, there are arguments that suggest thatfirms should not bother to hedge their exposurewhatever way it is measured. Rather, a case can bemade that if certain conditions are not present,hedging decisions should be left to the shareholderswho can reduce exposure and risk bydiversifying their portfolios, and who can hedgefrom their own personal perspectives.SUMMARY1 Accounting exposure concerns the effect that exchange rates have on valuesappearing in financial statements.2 Translation risk and exposure have to do with how asset and liability values appearwhen converted into a firm’s domestic reporting currency for inclusion in financialaccounts. Transaction risk and exposure have to do with the effect of exchange rateson asset or liability values when they are liquidated.3 The real change in exchange rates is the change that produces a difference betweenthe rate of return on domestic versus foreign assets/liabilities, or in theprofitability of firms.4 There are no real changes in exchange rates on financial assets and liabilities ifunhedged interest-parity always holds ex post.5 There are no real changes in exchange rates for fixed (real) assets if PPP (or moreprecisely the law of one price) always holds ex post.& 226
ACCOUNTING EXPOSURE VERSUS REAL EXPOSURE6 FAS 52 procedure values assets using historical costs and current exchange rates,but puts translation gains or losses in a separate shareholder equity account.7 FAS 52 produces correct measures of real changes in exchange rates for financialassets if shareholder equity effects are included as part of income.8 FAS 52 produces incorrect measures of real changes in exchange rates for fixedassets. Correct values on fixed assets require using current exchange rates andcurrent market values.REVIEW QUESTIONS1 What is ‘‘accounting exposure?’’2 What are ‘‘translation risk’’ and ‘‘translation exposure?’’3 What are ‘‘transaction risk’’ and ‘‘transaction exposure?’’4 What is the nature of the ‘‘temporal distinction’’ under FAS 52 when inflation is high?5 What is meant by a ‘‘real change in exchange rates?’’6 What is the relationship between ex post departures from uncovered interest parity andreal changes in exchange rates for financial assets?7 What items in the financial statements must be combined in order for accountingexposure on financial assets to reflect the real change in exchange rates?8 What is the relationship between ex post departures from PPP and real changes inexchange rates for fixed assets?9 How well do financial statements reflect real changes in exchange rates on fixed assets?10 If the choice could be made between current exchange rates and current costs, andhistorical exchange rates and historical costs, what would you select in order toaccurately reflect real changes in exchange rates in financial statements?ASSIGNMENT PROBLEMS1 Suppose you had invested $500,000 for 6 months in the United States and in Europe andinterest rates and exchange rates are as follows:r $ r ¤ S($/¤) S 1/2 ($/¤)5% 8% 1.1000 1.0800S($/¤) is the exchange rate when the investment was made, and S 1/2 ($/¤) is the actualrate 6 months later. Was foreign investment a good idea?2 Using the information in Question 1, what values will appear in the income account andthe shareholder-equity account with the FAS 52 accounting procedure?227 &
MANAGING FOREIGN EXCHANGE RISK AND EXPOSURE3 Suppose you had invested $1 million in US fixed assets and in Italian fixed assets underthe following conditions: US IT_P US_P IT S($/¤) S 1 ($/¤)2% 4% 5% 4% 1.1500 1.1200Assume that fixed-asset prices in local currency have kept pace with prices in general.a Which investment yielded higher returns over the year?b What will appear in the income statement and the shareholder equityaccount under the FAS 52 procedure?c What should appear as income?d Why does your answer to ‘‘b’’ (where income and shareholder equity areaggregated) disagree with your answer to ‘‘c’’?4 Redo the analysis in the text of a real change in exchange rates for financial liabilitiesinstead of assets. Describe how a declining value of a currency of denomination ofliabilities retires debt.5 If capital moves around the world so that expected rates of return on fixed assets arethe same, are overseas investors exposed to exchange rates?6 Why do the FAS 52 rules for translating assets in very high inflation countries –accumulated inflation exceeding 100 percent in the previous 3 years – usea ‘‘temporal distinction?’’ (the temporal distinction involves translating current-costitems at current exchange rates and historical-cost items at historical exchange rates).7 To what extent do you think that the difficulty of verifying declared current costs offixed assets has limited the use of current cost – current exchange rate reportingin financial statements?8 FAS 8 rules, which caused exchange rate effects to show directly in financial statements,caused managers to cover foreign exchange exposure very actively. Do you agreewith the decision to hedge accounting exposure?BIBLIOGRAPHYAdler, Michael and Bernard Dumas, ‘‘Should Exposure Management Depend on Translation AccountingMethods?’’ Economoney, June 1981, pp. 132–8.Carsberg, Bryan, ‘‘FAS #52 – Measuring the Performance of Foreign Operations,’’ Midland Corporate <strong>Finance</strong>Journal, Summer 1983, pp. 48–55.Evans, Thomas G. and Thimothy S. Doupnik, Determining the Functional Currency under Statement 52, FinancialAccounting Standards Board, Stamford, CT, 1986.Garlicki, T. Dessa, Frank J. Fabozzi, and Robert Fonfeder, ‘‘The Impact of Earnings under FAS 52 on EquityReturns,’’ Financial Management, Autumn 1987, pp. 36–44.Houston, Carol O., ‘‘Translation Exposure Hedging Post SFAS No. 52,’’ Journal of <strong>International</strong> FinancialManagement and Accounting, Summer/Autumn 1990, pp. 145–70.Miller, Martin A., Comprehensive GAAP Guide, Harcourt Brace Jovanovich, New York, 1989.& 228
ACCOUNTING EXPOSURE VERSUS REAL EXPOSUREPringle, John J., ‘‘Managing Foreign Exchange Exposure,’’ Journal of Applied Corporate <strong>Finance</strong>, Winter 1991,pp. 73–82.—— and Robert A. Connolly, ‘‘The Nature and Causes of Foreign Currency Exposure,’’ Journal of AppliedCorporate <strong>Finance</strong>, Fall 1993, pp. 61–72.Rosenfeld, Paul, ‘‘Accounting for Foreign Operations,’’ Journal of Accountancy, August 1987, pp. 103–12.Shapiro, Alan, C., Statement of Financial Accounting Standards No. 52 – Foreign Currency Translation, FinancialAccounting Standards Board, Stamford, CT, December 1981.Wyman, Harold E., ‘‘Analysis of Gains and Losses from Foreign Monetary Items: An Application of PurchasingPower Parity Concepts,’’ The Accounting Review, July 1976, pp. 545–58.229 &
Chapter 11Operating exposure<strong>International</strong> companies now know that what happens to the currencies in which they tot up thecosts, revenues and assets affects their results as much as their success in making and sellingproducts.The Economist, April 4, 1987This chapter explains the implications of exchangerates for the revenues, costs, and profits of companiesdirectly or indirectly involved in internationalcommerce, and is hence concerned with operatingexposure. For example, it describes the effects ofexchange rates on an exporter’s product price andsales (which affect cash inflows) as well as on productioncosts (which affect cash outflows). It explainshow the elasticity of demand for a company’s products,the types of inputs used, and other marketfactors influence the extent to which profits areaffected by exchange rates. We discover, for example,how the effect of changes in exchange ratesdepends on such things as the use of internationallytraded inputs that may cost more after devaluation,the flexibility of production to meet changes indemand due to changes in exchange rates, the timespan considered, and the degree of competition facedin the markets where goods are sold.We reach the important conclusion in this chapterthat even if a company has hedged its foreigncurrencyreceivables and payables and has noforeign assets or liabilities, there is still an importantelement of foreign exchange exposure. This is theoperating exposure which occurs because currentand, more importantly, future profits from operationsdepend on exchange rates. The techniques used forhedging assets and liabilities are not designed toeliminate operating exposure. Indeed, becauseoperating exposure is so difficult to eliminate,it has been called residual foreign exchangeexposure.OPERATIONS AFFECTED BYEXCHANGE RATESBefore beginning, we should point out that somefirms face operating exposure without ever dealingin foreign exchange. For example, restaurants inUS resorts that are visited by foreign tourists gainor lose customers according to the exchange rate.US restaurants also gain or lose domestic customerswith changes in exchange rates that affectthe vacation destinations of American travelers:exchange rates influence whether American touriststravel abroad or vacation at home. This exposurehappens despite the fact that the US restaurants aregenerally paid in US dollars and pay for food, labor,rent, and interest in US dollars. Similarly, industrieswhich compete with imported goods face operatingexposure. For example, US firms that supply beefto US supermarkets and that never see foreignexchange can find stiffer competition from foreignbeef suppliers when the US dollar gains against& 230
OPERATING EXPOSUREother suppliers’ currencies, lowering prices of thenon-US product. Any company that uses inputs thatare internationally tradable, whether imported ornot, will find costs changing with exchange rates.For example, a US company using oil from Texaswill find the price of oil increasing with a declinein the foreign exchange value of the dollar. 1Companies can even be affected by exchange ratesof countries with which they have no trading relationship.For example, a German car manufacturercan be hurt by a decline in the Japanese yen even ifthe company does not export to Japan and Germanconsumers do not buy from Japan. This can happenif the German manufacturer sells cars in the UnitedStates, and if American car buyers see German andJapanese cars as alternatives.Since the links in the economic chain of interdependenceare many, industries that provide suppliesto US resort hotels, US beef producers, orother industries more directly involved in internationaltrade will find themselves affected by changesin exchange rates. That is, there can be indirecteffects of exchange rates via derived demand fromothers who are directly affected. Even banks withno international asset or liability positions can beaffected by exchange rates in their loan portfolios. Ifthey have made loans to companies whose fortunesdepend on exchange rates, their own fortunes alsodepend on exchange rates through the ability ofborrowers to repay loans. Governments whose taxbase includes corporate income are exposed to theextent that profitability depends on exchange rates. 2It should therefore be apparent that operating1 It is sometimes erroneously thought that because oil pricesare usually quoted in dollars, the dollar price does notdepend on exchange rates. A weaker dollar means moredollars are required to buy internationally tradableproducts because market prices are determined in theglobal marketplace.2 This could provide a motive for a country to issue someforeign-currency debt. Then if the country’s currencyappreciates and this reduces the tax base from lowerinternational competitiveness, the country has an offsettinggain in its balance sheet through a reduction in thedomestic-currency value of its foreign currencydenominateddebt.exposure requires an extremely broad perspective.It should also be apparent that operating exposure isdifficult to avoid with the exposure-reducing techniqueswe have met so far: forwards, futures and soon are geared to current, known payments orreceipts rather than to future operating consequencesof exchange rates. Let us begin byexamining what influences the extent of operatingexposure. We start with exporters. What we sayabout exporters also applies to import competersbecause both gain when their own country’scurrency declines, making foreign competitors’goods more expensive (an import competer is adomestic company that faces competition fromforeign firms in the domestic market).THE EXPORTERCompetitive markets in the short runThe most straightforward situation of operatingexposure involves an export-oriented companyfacing perfectly elastic demand, meaning that it cansell as much as it wishes without affecting themarket price. To put this in context, let us supposethat before a devaluation of the US dollar, AvivaCorporation was able to sell in Britain all the jeansthat it wished to produce at a pound price of p £ 1a pair. The pound superscript denotes that the priceis expressed in terms of pounds, the currencythe British buyer pays. After devaluation, AvivaCorporation will still be able to sell all the jeansit wishes at this same price. This is because in acompetitive market, there are many other firms – athome, in Britain, and around the world – that areprepared to supply similar jeans. There is no reasonfor the non-US suppliers, including the British, tochange their pound prices just because the UnitedStates has experienced a depreciation/devaluation. 33 Henceforth, by ‘‘devaluation’’ we mean either devaluation,which occurs with fixed exchange rates, or depreciation,which occurs with flexible exchange rates. Similarly,‘‘revaluation’’ refers either to revaluation, which happenswith fixed rates, or appreciation, which happens withflexible rates.231 &
MANAGING FOREIGN EXCHANGE RISK AND EXPOSUREMC MCPrice, cost in home currency ($)p 2$p $ Lp $ 1ACBD 2 =MR 2D 1 =MR 1Price, cost in home currency ($)p 2$p $ Lp $ 1D 2 =MR 2D 1 =MR 1OX 1 X L X 2OX 1 X L X 2Exports per period of timeExports per period of time(a) Revenues(b) Costs& Figure 11.1 Exporter and devaluation in a competitive marketNotesA depreciation or devaluation raises the price an exporter can charge in terms of his or her own currency. In the perfectlycompetitive situation the price rises by the percentage of devaluation/depreciation. This raises profit-maximizing output, salesrevenues, and the total cost of production. In the long run, new firms and the expansion of older firms reduce prices, output, andprofits towards original levels. If the country’s exporters are a small part of the overall market, some benefits will remain.If the pound price is unchanged by devaluation thismeans that Aviva can charge a higher US dollarprice: there are more dollars to the pound afterdollar devaluation.We can go further in this competitive situationand say precisely how much higher the new dollarprice, p $ 2 , will be relative to the dollar price beforethe devaluation, p $ 1 . To determine this, note thatbefore the devaluation the dollar price of jeans soldin Britain for p £ 1 isp $ 1 ¼ Sð$/£Þp£ 1ð11:1ÞThis equation merely defines the relationshipbetween the price charged in Britain in pounds andthe equivalent price in dollars. After dollar devaluationto an exchange rate of S 0 ($/£), and with thepound price unchanged at p £ 1 , the dollar-equivalentprice is:Taking the ratio of equation (11.2) to equation(11.1), we havep $ 2p $ 1¼ S0 ð$/£ÞSð$/£ÞThis tells us that after a devaluation of the dollar toS 0 ($/£), the US dollar-equivalent price of jeans inBritain will rise by the same percent as the dollardevaluation. This is the direct result of the poundprice of the jeans being unchanged. 4The pre-devaluation and post-devaluation prices,p $ 1 and p$ 2 ¼½S0 ($/£)/S($/£)Šp $ 1 , are shown inFigure 11.1, where the price axes are drawn inhome-currency ($) units. In this figure we assumethat none of the inputs used by Aviva are internationallytradable so that their prices are unaffectedby the exchange rate. As a result, the marginal cost(MC) curve does not shift. Note that it is theinternational tradability of inputs, not whetherp $ 2 ¼ S0 ð$/£Þp £ 1& 232ð11:2Þ4 For simplicity, we assume inflation is zero in bothcountries.
OPERATING EXPOSUREinputs are imported that determines whether devaluationincreases input costs. After a devaluation,domestically produced inputs which could be soldabroad increase in price because the opportunitycost of selling them at home is higher. Of course, bydefinition, imported inputs are tradable and thereforecost more after devaluation. However, sodo domestically produced goods that could besold overseas. For the time being we assume nointernationally tradable inputs.While the MC curve itself does not shift, the MCper unit does increase as output increases. Becausethe firm is in a perfectly competitive market, thedemand curve is a horizontal line at the marketprice, and the horizontal demand curve is also themarginal revenue (MR) curve: more goods can besold without reducing the price.In Figure 11.1, before the devaluation, our firm,Aviva Corporation, would have produced and soldX l units per period by seeking its optimum outputwhere marginal revenue MR 1 equals marginal cost,MC. This is the point of maximum profit. If outputis less than X l ,MR> MC, and profit is increased byproducing more and adding more revenue thancosts. At an output greater than X l , we haveMC > MR, and profit is increased by producing lessand thereby reducing costs by more than revenue.With the price and hence MR of jeans in dollarterms rising to p $ 2 ¼ ½ S0 ($/£)/S($/£) Šp $ 1 after thedevaluation, and the MC remaining unchanged,Aviva will want to raise its production to X 2 perperiod. This is the new profit-maximizing output,where MR 2 ¼ MC. We find that a higher price indollars and a higher level of sales have resulted fromthe devaluation.Figure 11.1a shows how total revenue in units ofdomestic currency increases as a result of the higherprice and the greater quantity sold. Total revenueincreases by the shaded area as shown in Figure 11.1a.We conclude that there is an unambiguous increasein total revenue measured in terms of homecurrency after a devaluation. A simple reversal ofinterpretation in the diagram to determine theeffects of a revaluation would similarly show thatthere would be an unambiguous decrease in totalrevenue for an exporter when measured in terms ofthe home currency: the dollar price and number ofunits sold would both be reduced.In the short run, if no US inflation results fromthe dollar devaluation, and if per-unit costs of inputsare unaffected by devaluation because they are nottradable, the total production cost will rise by onlythe cost of producing the additional quantity that issold. Since MC is the cost of producing each additionalitem, the area under the MC curve betweenX l and X 2 will be the additional cost incurred inproviding the extra goods. Hence, the total manufacturingcost will increase by the shaded area asshown in Figure 11.1b. We can see that with totalrevenue rising by the shaded area seen in Figure 11.1aand total cost rising by the shaded area in Figure 11.1b,profit, which rises by the difference between totalrevenue and total cost, will rise by the area p $ 1 ABp$ 2in Figure 11.1a. We find that after a devaluation, theincrease in export revenues exceeds the increase incosts, so that profits rise.What are the factors affecting the amount bywhich profits will increase? We note that with p $ 2exceeding p $ 1 by the percentage of the devaluation, theincrease in profits in terms of dollars – assuming thatoutput remains at X l – will be equal to the percentageof the devaluation multiplied by the original totaldollar revenue. For example, with a 10 percentdevaluation, p $ 2 exceeds p$ 1 by 10 percent, and so ifinitial revenues were $1,000, nominal profits will riseby $100, assuming the quantity sold does not increase.However, in general we might expect output toincrease because of upward slope in the MC curve.Then there is an increase in the profit-maximizingoutput, and profits will rise by an even bigger percentagethan the percentage of devaluation. This isclear from Figure 11.1a by comparing the size of theextra profit, shown by area p $ 1 ABp$ 2 , with the originalrevenue given by the unshaded rectangle, Op $ 1 AX 1.We notice also from Figure 11.1 that the flatteris the MC curve, the greater is the increase inprofit resulting from a devaluation. That is,production flexibility increases the profit gainedfrom a devaluation. This is what one would expect,namely, that firms that are able to increase233 &
MANAGING FOREIGN EXCHANGE RISK AND EXPOSUREproduction benefit more after devaluation thanfirms that are producing at capacity. The reader isurged to draw Figure 11.1a with MC curves ofdifferent slopes and show that changes in profits arelarger with a flatter curve. In redrawing Figure 11.1,allow all MC curves to pass through point A.When asked what effect devaluation will have ona company’s profit, many managers say things suchas: ‘‘every one-percent decline in the value of ourcurrency increases our company’s profit by onemilliondollars.’’ When asked how they come up withthat amount, a common explanation is ‘‘total revenueis one-hundred million dollars, so a one-percentincrease in amount of domestic currency received foreach unit of foreign exchange is one million dollars.’’What we can see from Figure 11.1 is that this view ofthe impact of devaluation on an exporter’s profit iscorrect in a perfectly competitive market if the companyis producing at capacity – resulting in a verticalMC curve – and if unit costs at any given output do notincrease. For costs not to increase, inputs must notbe internationally tradable. As we have stated, tradableinput prices are determined in the world marketand cost more in terms of a devalued currency. Whenthe firm is not producing at capacity and does usetradable inputs it is necessary to consider the costside of operations as well as revenues to determine theconsequences of devaluation of revaluation.Long-run effects: tradable inputsSince the accurate forecasting of cash flows is animportant job for the financial manager, we shouldnot limit our discussion to the immediate effects ofdevaluation on flows of revenue and productioncosts. When we are dealing with a firm in anindustry with free entry of new firms and whereexisting firms can expand output, it is important toappreciate that increases in profit that accompanydevaluation may be temporary. 5 The additional5 The characteristics of perfectly elastic demand and freeentry are elements of a perfectly competitive industry.However, as we shall see, free entry within the devaluingcountry may still leave profit, so the situation is a littledifferent from the usual perfectly competitive case.& 234profit that might be available after a real devaluation(i.e. one that does not just make up for differencesin inflation between countries) will serve as anincentive for new firms to get involved and existingfirms to expand. This will reduce the product pricevia an increase in market supply. This can bring therate of profit back to its pre-devaluation level.Therefore, it is possible that only in the interim willhigher-than-normal profits be made. Let us showthis conclusion graphically.The immediate higher profits after devaluationwill induce firms in purely domestic endeavors tomove into the export sector until the ‘‘last’’ firm toenter can reap a profit equal to the best it couldachieve in some alternative endeavor. Competitionfrom new firms might move the price that theoriginal firms such as Aviva receive for their productback towards p $ 1 . As a result, we would move backtowards the pre-devaluation situation of price p $ 1and output X l with original revenues and costs.Extra profits will last only as long as it takes for oldfirms to expand and new firms to get involved. Thiswill depend largely on the nature of the industry.It is important to note that if the devaluingcountry produces only a small fraction of theworld’s output of a particular good, then the freeentry of firms within the country may have littleeffect when cutting into the extra profit fromdevaluation. This is true because many new firmsmight enter the industry within the devaluingcountry without significantly affecting the worldprice. What is required for profits to persist is thatthe country with the devalued currency remainsa small part of the world market. We can thinkof the devaluation as favoring only producers withinthe country. Other world producers do not enjoythe ‘‘subsidy’’ enjoyed by the firms in the devaluingcountry. 6 If the devaluing country does remaina small part of the world market, prices might move6 A devaluation can be thought of as a subsidy to exportersoffset by a tax on importers. The fact that only firms in thedevaluing country receive the ‘‘subsidy’’ is why we canhave free entry into the industry globally as we do in perfectcompetition, and yet still have long-term abnormal profitafter devaluation.
OPERATING EXPOSUREback very little from p $ 2 , perhaps only to p$ L inFigure 11.1. Output would be X L . Profits wouldremain abnormally high and be given by areap $ L CAp$ 1 . Furthermore, industry-level profits arehigher from the profits of newly entering firms aswell as the original firms.There is another route that is possible throughrising costs that can also limit the period ofobtaining extra profit after a real devaluation andhence limit the post-devaluation celebrations of anexporter. This involves the eventual reduction inthe real devaluation via the inflation that the actualdevaluation itself sets up. This will work in allmarket settings, not only in competitive markets,and so we will consider the effect separately. Theeffect will come about even if none of the inputsused by the firm under consideration are tradable,in which case there is no immediate increase in thefirm’s costs. Cost increases may nevertheless takeplace eventually.Tradable consumer goods prices tend to riseafter a depreciation or devaluation. To the extentthat tradable products figure in the cost-of-livingindex, a devaluation increases the cost of livingand thereby reduces the buying power of wages.If efforts to maintain real or price-adjusted wagesresult in nominal wage increases to compensatefor the higher cost of living, then the firm’sproduction costs will rise. That is, the firm’s productioncosts can increase because of indirecteffects of devaluation-induced price increases onwages, even if there are no direct effects on inputprices. Figure 11.2 describes the effect of higherwages caused by the devaluation.In Figure 11.2a, we show the MC of productionrising from MC to MC L and average cost rising fromAC to AC L . Every unit is shown to cost more toproduce as nominal wages rise. We can think of MCand AC moving up by the US inflation rate thatis induced by the devaluation. If a devaluationincreases the dollar price of the product from p $ 1 top $ 2 , and devaluation-induced inflation increasescosts to MC L and AC L , output goes from X 1 to X Land total revenue increase from Op $ 1 SX 1 to Op $ 2 TX L.Total cost is AC multiplied by the output, whichbefore the devaluation was Op $ 1 VX 1. After theMC LMCMC LMCPrice, cost in home currency ($)p $ 2p $ 1STPrice, cost in home currency ($)D 2 =MR 2 p $ 2D 2 =MR 2W AC LZACD 1 =MR p $ 1 1DV1 =MR 1OX 1 X LExports per period of time(a) RevenuesOX 1 X LExports per period of time(b) Costs& Figure 11.2 Exporter and devaluation in a competitive market: effect of cost increasesNotesA devaluation raises the costs of tradable inputs and may eventually raise all costs. This means a reduction in the extentof the real devaluation. Profit-maximizing output and profits return toward original levels. However, as long as some realdevaluation remains, there are extra sales and profits for exporters from devaluation.235 &
MANAGING FOREIGN EXCHANGE RISK AND EXPOSUREdevaluation, at the output X L , the total cost is areaOZWX L . This cost exceeds the pre-devaluation costby the lightly shaded area in Figure 11.2b. Sincerevenues increase by the shaded area in Figure11.2a, or the entire shaded area in Figure 11.2b,and costs rise by the lightly shaded area in Figure11.2b, profits rise by the difference, shown by thedarkly shaded rectangle in Figure 11.2b. 7In the long run, the dampening effect on profitsfrom the competition-induced price reductionshown in Figure 11.1a must be added to the profitreduction from higher costs. Both effects contributeto a smaller profit increase from devaluation in thelong-run than occurs in the short run.The effect of having internationally tradableinputs is, diagrammatically, precisely the same asthe effect of wage pressure from devaluationinducedinflation that we have just discussed.Consequently, Figure 11.2 also describes the effectof having tradable inputs. Devaluation makes tradableinputs more expensive. As a result, MC and ACboth shift upward to the extent that tradable inputsfigure in production. We know that this verticalshift will be less than the shift in the selling pricewhen at least some inputs are non-tradable. Asbefore, the shift is given in Figure 11.2 by the MC Land AC L curves, and the output increase is smallerthan it would be without tradable inputs. Outputincreases to X L , where MC L cuts D 2 . Profits rise bythe darkly shaded area in Figure 11.2b.The difference between the effect of tradableinputs and of wage increases from devaluationinducedinflation is only in the immediateness ofeffect, with input prices probably rising muchmore quickly than with the link through wages.We should remember, however, that tradable inputand wage effects can work together in the longrun. From this point on, we shall consider only the7 To simplify the argument, we have drawn area Op $ 1 SX 1 sothat it is equal to area Op $ 1 VX 1. This means that beforethe devaluation, total revenue equals total cost, and profitsare zero. Any profit after the devaluation is a result of thedevaluation itself. We have also simplified the argument byignoring the long-run envelope of AC curves.& 236short run. We shall see that this can becomecomplicated enough.Imperfect competitionThere are a large number of imperfect-marketsettings, but in general an imperfectly competitivefirm can still sell some of its product if it raises theprice. This is the case when only imperfect substitutesare available, and occurs frequently, sinceproducts of different firms generally have differentcharacteristics.To examine a firmlikeAvivainanimperfectmarketsetting, we allow for some inelasticity indemand; that is we draw a conventional downwardslopingdemand curve. When, as before, the homecurrency is on the vertical axis, what is the effect onthe demand curve of a devaluation? We shall see thatthe demand curve and associated MR curve will movevertically upward, just as in a competitive market.Indeed, the argument will differ little from the onewe used in the discussion of perfectly elastic demand.Let us consider any particular sales volume ondemand curve D 1 in Figure 11.3, for example, X 1 .Note that when the demand curve is at theExport price in dollarsp $ 2p $ 1OABX 1 X 2D 2D 1Exports per period of time& Figure 11.3 Devaluation and the demand curveNotesFor each sales level, the price that can be charged after thedevaluation with sales unchanged rises by the percentage ofthe devaluation. This means that the demand curve shiftsvertically upwards by the percentage of the devaluation.
OPERATING EXPOSUREpre-devaluation level, D 1 , a volume X 1 can be soldat the exporter’s currency (dollar) price p $ 1 . Afterthe devaluation, the same quantity – that is, X 1 –will be sold abroad if the foreign-currency price isstill the same as other suppliers. Sales depend onthe price buyer’s faces, and if Aviva keeps its poundprice in line with the prices charged by other suppliersto the British market it will remain competitive.This is because the British do not look at theprice tag of a pair of US-made jeans on sale in Britainin terms of the US dollar. Rather, they consider thenumber of pounds that must be paid for the jeans,just as a US car buyer considers the dollar price of animported car. But at the devalued exchange rate ofthe dollar the unchanged pound price means ahigher dollar price. Indeed, the dollar price is higherby the percent of dollar devaluation. In otherwords, if the dollar price changes by the amount ofdevaluation from p $ 1 to p$ 2 in Figure 11.3, then saleswill remain unchanged at X l . That is, before thedevaluation at price p $ 1 Aviva will sell X l abroad andhence be at point A. After the devaluation, Avivawill sell the same amount, X l , abroad if the dollarprice is p $ 2 ¼½S0 ($/£)/S($/£)Šp $ 1 . This gives pointB. We find that the percent vertical shift of thedemand curve is equal to the percent of devaluation.We can now take another sales volume, say X 2 ,and follow precisely the same argument. Eachand every point on the new demand curve, D 2 , willbe vertically above the old demand curve, D l ,inproportion to the devaluation.We should think in terms of vertical movementsof the demand curve, rather than think of ‘‘rightwardshifts’’ of the demand curve along the linesthat ‘‘more is sold for the same dollar price afterdevaluation.’’ Although this is true, it does not tellus how much the demand curve shifts, whereas weknow the vertical shift is in the same proportionas the change in the exchange rate. Of course, wenotice that since the vertical shift is always in thesame proportion as the change in exchange rate,the absolute shift is less at lower prices on thedemand curve. This is shown in Figure 11.3, withdemand curve D 2 closer to D 1 at lower prices.Price, cost in home currency ($)p $ 2p $ 1ABCAMR 2MR 1D 2D 1MCPrice, cost in home currency ($)MR 1MR2MCOX 1 X 2O X 1 X 2Exports per period of time(a) RevenuesExports per period of time(b) Costs& Figure 11.4 Exporter and devaluation in an imperfectly competitive marketNotesIn an imperfectly competitive market the home-currency price of exports will increase by a smaller percentage thanthe devaluation. Sales revenue will increase by a smaller fraction than in the case of perfect competition.237 &
MANAGING FOREIGN EXCHANGE RISK AND EXPOSUREFigure 11.4a shows the vertical shift in the demandcurve (D 1 to D 2 ) from a US dollar devaluation, alongwith the corresponding shift in the MR curve. Wehave assumed that costs do not depend on outputin Figure 11.4b by drawing a flat MC. It wouldcomplicate matters only a little to allow forincreasing costs with increasing output by drawingan upward-sloping MC curve and associated ACcurve. Rising costs would reduce the positive effectsof devaluation on profits, but they would noteliminate these effects. We have also assumed notradable inputs.We see from Figure 11.4 that before the devaluation,the firm will produce X l per period, which iswhere MC ¼ MR l , and it will be able to sell thisoutput at the price p $ 1 . After the devaluation, the firmwill produce X 2 per period and sell this at the price p $ 2 .The increase in revenue from Op $ 1 AX 1 to Op $ 2 A0 X 2 isrepresented by the total shaded area in Figure 11.4a.An important point to realize is that with a downward-slopingcurve, the price increase from p $ 1 to p$ 2 isless than the vertical shift in the demand curve(AC < AB). We discover that export prices whenstated in the exporter’s own currency rise by less thanthe percentage of devaluation. This is different fromthe case of perfect competition, where the productprice rises by an amount equal to the devaluation.With output rising from X l to X 2 ,andwitheachunit costing the manufacturer the amount given by theheight of the MC curve, total cost increases by thelightly shaded area in Figure 11.4b (shown also inFigure 11.4a). Profits increase by the differencebetween the change in total revenue, given by thetotal shaded area in Figure 11.4a, and the change intotal cost, given by the lightly shaded area. The changein profits is therefore represented by the darkly shadedarea in Figure 11.4a, which is the difference betweenthe total shaded area and the lightly shaded area.In general, the extent to which prices rise,output increases, and profits are affected dependson the slope (elasticity) of the demand curve andthe slope of the MC curve, which we have madehorizontal so that profits can be easily computed.The reader might note that if the firm is up againsta rigid constraint in raising output, then MC can be& 238vertical, and a devaluation will leave output andsales unchanged, with domestic-currency pricesrising by the full percentage of devaluation – justas in the case of perfect competition. Supportingthis implication of a production capacity constraintis the observation that, for example, auto exportershave typically raised their home-currency prices inproportion to any devaluation; that is, they haveusually left foreign prices unchanged. This has beenattributed to their inability to raise output in theshort run. Why lower your foreign-currency sellingprice if you cannot satisfy any extra demand that thismight create? Similarly, when facing a revaluation oftheir currency, they have lowered their owncurrencyprice in proportion to the revaluation toleave the foreign-currency price unchanged. Theslopes of the demand and cost curves are seen to bevital parameters for effective financial planning in anexporting firm. The demand sensitivity of the firmshould be estimated, and the degree of capacityutilization should be measured to determine theresponse to changes in exchange rates.Analysis in foreign-currency unitsSo far we have measured the vertical axes in ourdiagrams in units of the domestic currency, whichwe have taken as the US dollar. By drawing ourdiagrams in terms of what we have taken to be thehome currency, we have been able to examine theeffects of exchange-rate changes when these effectsare measured in the same units. Our revenue, cost,and profit changes that result from devaluations orrevaluations are therefore US dollar amounts; ingeneral, they are the amounts that are relevant forUS firms. Some firms that are operating withina country, however, will be concerned with revenues,costs, and profits in some particular foreigncurrencyunit. For example, a British firm with amanufacturing operation in the United States maynot be directly concerned with whether devaluationof the US dollar raises its US-dollar earnings. Sincethe dollar is less valuable after devaluation, thehigher US-dollar earnings might bring fewer poundsthan before the devaluation, or so it might seem.
OPERATING EXPOSURESimilarly, a US firm with a subsidiary in, forexample, Canada, may not be thrilled if a depreciationof the Canadian dollar raises the Canadiandollarearnings of its subsidiary. These higherearnings might, it might seem, be worth less inUS dollars. However, as we shall show, thesepossibilities need not concern parent firms.Interest in the effects of a devaluation or revaluation,when measured in foreign-currency units,may not be limited to firms with subsidiariesabroad. Any firm that denominates borrowing in aforeign currency – even if it enjoys only one location– will care about the effect of exchange-ratechanges on its operating revenues, measured inunits of the currency of its debt. For example, a USfirm that has borrowed in British pounds will careabout its trading revenues as measured in poundsafter an exchange-rate change: the firm has payablesin British pounds. Similarly, Canadian firms thatborrow in US dollars care about their US-dollarrevenues, since they must service US-dollar debts.For these reasons, we should consider the effects ofexchange-rate changes on revenues, costs, andprofits when measured in units of foreign currency.We will limit our discussion to an imperfectlycompetitive market; the simple case with a flatdemand curve and an upward-sloping MC curve issimilar and is left as an exercise for the reader.As we said, the price that is relevant to a purchaserof a product is the price he or she has to payin terms of his or her own currency. When the priceof Aviva jeans in Britain remains unchanged in termsof British pounds but changes in terms of US dollars,there is no reason for sales volumes in Britain tochange. It follows that when there is, for example,a devaluation of the US dollar, there is no reasonfor the demand curve for Aviva’s jeans to shift ifit is drawn against the pound price. At the samepound price as before, the same monthly volume ofjeans will be sold. Therefore, the demand curve inPrice, cost in British poundsp £ 1p £ 2ABPrice, cost in British poundsEMC 1C 1MC 1 =AC 1FMC 2 C 2MC 2 =AC 2MRMRO X 1 X 2 O X 1 X 2Exports per period of timeExports per period of time(a) Revenues(b) Costs& Figure 11.5 Exporter and devaluation in an imperfectly competitive market: foreign-currency unitsNotesThe relevant price for demanders is the price denominated in their own, that is, the buyers’ currency. When we measurethe vertical axis in the buyers’ currency, the positions of the demand and MR curves are unaffected by changes in exchangerates: buyers move along the curves. If there are no tradable inputs so production costs are unchanged in the producers’currency, a devaluation of that currency will lower costs denominated in the buyers’ currency by the percent of devaluation.The export price will decline in the buyers’ currency after a devaluation, and the quantity of exports will increase.239 &
MANAGING FOREIGN EXCHANGE RISK AND EXPOSUREFigure 11.5, and hence also the MR curve, are thesame before and after the devaluation.The effect of changes in exchange rates on thecost curves is different from the effect on thedemand curve. When our diagrams are drawn inunits of foreign currency and there is an exchangeratechange, the cost curves will move vertically inproportion to the exchange rate. Why is this so?If it costs, say, MC $ 1 to produce an extra pair ofAviva’s jeans and no inputs are tradable, then aftera devaluation the production cost should still beMC $ 1 if the devaluation has not induced generalinflation. However, before the devaluation, with anexchange rate of S($/£), the cost in units of foreignexchange wasMC £ 1 ¼ 1Sð$/£Þ MC$ 1After the devaluation to S 0 ($/£), with the dollarcost the same, the foreign exchange cost becomesMC £ 2 ¼ 1S 0 ð$/£Þ MC$ 1By simply taking ratios, we getMC £ 2MC £ ¼ Sð$/£Þ1 S 0 ð$/£ÞThat is, the MCs, in terms of British pounds, changein proportion to the exchange rate. Since a devaluationof the dollar means that S 0 ($/£) > S($/£),the MC, in terms of British pounds, falls as thedollar is devalued. In Figure 11.5, this is shown withMC curve moving downward from MC 1 to MC 2 .Since we have drawn Figure 11.5 with a constantMC, we know that MC ¼ AC, and so the AC curvemoves downward with the devaluation of the dollarwhen the vertical axis is in British pounds.With profit maximization requiring thatMC ¼ MR, we see from Figure 11.5 that a devaluationof the US dollar increases Aviva’s profitmaximizingoutput from X I to X 2 ,Withthedemandcurve remaining at D, the pound price falls from p £ 1to p £ 2 . We see that even with the demand curveunaffected by a devaluation, the devaluation lowersthe foreign exchange price of exports and raises the& 240quantity sold. 8 With lower prices and higher sales –movements in opposite directions – what hashappened to total revenue in terms of the Britishpound?The answer clearly depends on whether sales haverisen by a larger or smaller proportion than thereduction in the pound price. If the increase inquantity sold is greater than the price reduction, totalrevenue will be higher. Such a situation requires thatthe elasticity of demand exceed unity, that is,demand is elastic, which we know to be the case bymaking a straightforward observation. Since MC ispositive, and the firm produces where MR ¼ MC,MR must also be positive. With MR positive, anextra unit of sales, even though it requires a reductionin price, must increase total revenue. We know,therefore, that pound total revenue must rise, witharea Op £ 2 BX 2 necessarily greater than area Op £ 1 AX 1.Figure 11.5b gives the required curves for consideringthe effect of a devaluation on total cost.Since total cost is given by AC multiplied by output,whether total cost has increased depends on theslope of MR. Total cost has changed from areaOC 1 EX 1 to area OC 2 FX 2 in Figure 11.5b. Has totalcost increased, and if so, by how much? Well,continuing at this point without the help ofmathematics is difficult. Mathematics helps us showthat for profitable firms, total cost in terms ofpounds increases after the dollar is devalued, but bya smaller amount than the increase in total revenue.In terms of pounds, profit is therefore increased.THE IMPORTERIt is generally presumed that importers lose fromdevaluation and gain from revaluation of their owncurrency. This presumption is correct, with the exactmagnitude of effect of exchange rates depending onsuch factors as the degree of competition and whichcurrency we use for our analysis. The amount of8 By referring back to the equivalent home-currencydiagram, Figure 11.4, the reader will see that while thepound price falls, devaluation raises the export price interms of dollars (from p $ 1 to p$ 2 ).
OPERATING EXPOSUREPrice, cost in dollarsp $ 2p $ 1TRSWDMC 2 =AC 2Price, cost in dollarsZ VMC 2 =AC 2TWMC 1 =AC 1MC 1 =AC 1MRMROM 2 M 1O M 2 M 1Imports per period of timeImports per period of time(a) Revenues(b) Costs& Figure 11.6 The importer and a devaluationNotesIf the price that an importer pays is unchanged in terms of the foreign supplier’s currency after the importer’s currency is devalued,the cost curves will move up by the percentage of devaluation when measured against the importer’s currency. The demandcurve is not affected if it is drawn against the demander’s currency. Only the amount demanded – a move along the curve – isaffected, not the position of the curve. A devaluation will raise import prices and lower sales. The importer’s profit declines.change in cash flows is important information forthe financial manager of an importing firm, whetherthe firm is importing finished goods for sale at homeor some of the inputs used in producing its localoutput. If the goods are finished goods for sale,determining the effects of changes in real exchangerates requires that the financial manager knows theelasticity of demand for the product. The financialmanager must also decide on the relevant currencyfor measurement. To illustrate these points we willbegin by measuring in dollar amounts.Analysis in home-currency (dollar) unitsLet us again consider Aviva Corporation and assumethat it has decided to import finished jeans that aremanufactured in Britain for sale in the United States.The most straightforward case is one in which Avivacan import whatever quantity of jeans it wishes atthe same pound cost per pair. This would be thecase if Aviva is a small part of the market for the jeansand is therefore a price taker. In fact, however, anassumption of constant costs is not necessary and onlyaids in computing total costs and profits. Being ableto buy jeans at a constant cost means that beforedevaluation we have the horizontal cost curveMC 1 ¼ AC 1 showninFigure11.6aandb.Wecanthink of the constant per unit dollar cost as beingthe constant pound cost that is faced whatever theexchange rate, translated into dollars.Assume that Aviva faces market demand conditionsthat are less than perfectly elastic in selling theimported British jeans in the US market. Thisrequires that there not be many other sellers of thesame brand of jeans. This could very easily be thecase in practice if, for example, Aviva is licensed asthe sole importer of these jeans in the UnitedStates. 9 This situation is very common. Many of the9 If the import were freely available to any importer orpotential importer, any one firm would face a flat demandcurve for the good at the going price. This perfectcompetition would put the demand curve at the level ofthe cost curve, and so no profit would be made above thenormal return on the capital and effort involved.241 &
MANAGING FOREIGN EXCHANGE RISK AND EXPOSUREproducts produced in foreign countries are sold ineach market by licensed firms or sales subsidiarieswith exclusive marketing rights.The demand curve is shown along with theassociated MR and cost curves in Figure 11.6.Before the devaluation, Aviva Corporationwill import and sell M 1 , pairs of jeans per period,which is the profit-maximizing quantity whereMR ¼ MC 1 . The jeans will be sold at the price p $ 1per pair, giving total revenue in dollars of areaOp $ 1 SM 1 in Figure 11.6a. The cost of the jeans,MC 1 ¼ AC 1 per unit, gives a total cost of OTWM 1dollars in Figure 11.6b. The initial profit is thedifference between total revenue and total cost,which is area Tp $ 1SW Figure 11.6a.After a devaluation of the dollar to S 0 ($/£),there is no reason for the British-pound productioncost to be affected. With the British-pound costunchanged, the new dollar cost must increase inproportion to the exchange value of the Britishpound against the dollar. The cost curves in Figure11.6a and b shift vertically upward by the percentageof the dollar devaluation, from MC 1 and AC 1to MC 2 and AC 2 . The importer will reducethe amount imported and sold to M 2 per period,where MR ¼ MC 2 , and will sell this new amount,with the demand curve D, at the price p $ 2 . We seethat the effect of a dollar devaluation is to reduce thequantity imported and sold and raise the productprice.The effect on revenues, costs, and profits of theimporter is less obvious from Figure 11.6 thanthe effect on quantities and prices. Revenues havechanged from Op $ 1 SM 1 dollars to Op $ 2 RM 2 dollars.However, we know from the straightforwardobservation made for the exporter that as a result ofdollar devaluation, revenues have fallen for theimporter. All profit-maximizing firms sell at a pointwhere the demand curve for their product is elastic.This is because they choose to be where MR ¼ MC,and since MC must be positive, MR is positive –that is, revenues are increased by additional sales,even though higher sales require lower prices. Withthe importer on an elastic part of his or her demandcurve, the percentage reduction in the quantity sold& 242must exceed the percentage increase in price – thatis, total revenue is reduced by devaluation.To determine the effect of devaluation on profits,we must determine the effect on total cost andcompare this with the effect on total revenue. Thisis not easily done with the diagrammatic analysis ofFigure 11.6. However, with the aid of mathematicsit can be shown that devaluation also reduces thetotal costs of the imports; that is, area OZVM 2 is lessthan area OTWM 1 . It can also be shown that providedwe begin with positive profits, the reductionin total cost is smaller than the reduction in totalrevenue, and so the dollar profits of the importerfall from devaluation. The effects of devaluation interms of British pounds are more easily obtainedfrom a diagrammatic analysis than are the effects interms of dollars. Let us consider this.Analysis in foreign-currency (pound) unitsThe effects of a dollar devaluation in terms of Britishpounds are shown in Figure 11.7. With the cost ofthe jeans to Aviva Corporation at MC £ and thedemand curve at D 1 , Aviva will import and sell M 1pairs of jeans per period at the price p £ 1 per pair.The volume and the price were obtained bychoosing the profit-maximizing position, whereMC £ ¼ MR 1 .Now, if the British-pound cost of the importdoes not change from a dollar devaluation, thenMC £ ¼ AC £ will remain in its original position. Thequantity of items our importer can sell, however,will depend on the dollar price charged. At any levelof sales – for example, M 1 – the same quantity willbe sold after the devaluation only if the dollar priceremains unchanged (buyers consider the dollarprice). An unchanged dollar price means a lowerBritish pound price (lower by the percentage ofthe devaluation). Therefore, in terms of Britishpounds, the demand curve of the American buyersof Aviva’s imported jeans must shift verticallydownward by the percentage of the dollar devaluation.This is shown as a move from D 1 to D 2 ,with the associated MR curves moving from MR 1to MR 2 in Figure 11.7.
OPERATING EXPOSUREPrice, cost in British poundsp 1£p 2£OPrice, cost in British poundsMC £ =AC £ MC £ =AC £MR 1D 1D 2MR 1MR 2MR 2OM 2 M 1 M 2 M 1Imports per period of time(a) RevenuesImports per period of time(b) Costs& Figure 11.7 Importer and devaluation in foreign-currency unitsNotesA devaluation shifts the demand curve downward by the percent of devaluation when the curve is drawn against theproducer’s, not the consumer’s, currency. If the producer’s cost is unaffected by a devaluation, total revenue, total cost,and profit are all reduced by a devaluation.Figure 11.7 tells us that a devaluation will reducethe profit-maximizing amount of imports from M 1to M 2 (not surprisingly the same reduction as inFigure 11.6) and result in a lower British poundprice for the jeans (which, nevertheless, is a higherdollar price, as is seen in Figure 11.6). With boththe quantity and the pound price falling, the Britishpound total revenue must fall by the entire shadedarea in Figure 11.7a.With the British pound per unit cost of the jeansunaffected by devaluation, but with a smaller amountimported, the total cost is reduced by the shaded areain Figure 11.7b. Profits fall by the difference betweenthe reduction in British pound total revenue and intotal cost. This decline in profits is shown by thedarkly shaded area in Figure 11.7a. We conclude thatan importer’s pound profits are reduced from adevaluation of the importer’s currency. This shouldbe no surprise because we saw previously that dollarprofits are reduced, and with fewer pounds per dollarafter the devaluation, pound profits must be reduceda fortiori.Tradable inputsSuppose that instead of importing finished jeans,Aviva is importing the denim cloth or perhaps cutdenim that is ready for final manufacture in theUnited States. When a firm imports unfinishedgoods or other inputs for production, a devaluationof the domestic currency will raise production costsat each level of output. 10Let us consider the general case where MCs andaverage costs increase with output. The effect of adollar devaluation will be to shift the upward-slopingcost curves upward, as shown in Figure 11.8. Theamount by which the curves shift depends on theimportance of imported inputs in the total productioncost, and on whether alternative sources ofinputs can be substituted. As Figure 11.8 shows, theeffect of the dollar devaluation is to raise the productprice and reduce the quantity manufactured and sold.10 The same consequence follows from the use of anyinternationally tradable input, whether the input isimported or domestically produced.243 &
MANAGING FOREIGN EXCHANGE RISK AND EXPOSUREPrice, cost in dollarsp $ 2p $ 1O q 2 q 1MROutput per period of timeMC 2MC 1AC 2AC 1& Figure 11.8 Importer of inputs and devaluationNotesWhen inputs are imported, a devaluation will raiseproduction costs. Higher production costs will lower theoutput of goods domestically and raise prices.SUMMARY OF EFFECTS OF EXCHANGERATES ON EXPORTERS AND IMPORTERSBefore we add to our discussion the complicationsof forward hedging and the invoicing of exports orimports in different currencies, we shall summarizewhat we have learned:1 Even with no foreign assets or liabilities orforeign-currency payables or receivables,changes in exchange rates will affect operations.This is called operating or residualexposure which can be difficult to avoid.2 Devaluations raise export prices in homecurrencyterms and at the same time raiseexport sales volumes. Therefore, total revenuein terms of home-currency is increased by devaluation.The reverse occurs from revaluation.3 Devaluations raise an exporter’s profits. Thegains are reduced by using internationallytradable inputs and may be in any case removedin the long run by free entry of new firms or bygeneral inflation brought about by devaluation.& 244D4 Foreign-owned companies or companies withforeign-currency debts care about receipts andpayments in units of foreign currency. Devaluationlowers prices in foreign-currency units(while raising prices in units of the devaluedcurrency) and raises an exporter’s sales. Totalrevenues increase because the percentage salesvolume increase exceeds the price reduction.This follows because firms sell where demandis elastic. Production costs also increase, but itcan be shown that if profits are being made, anexporter’s total revenues will rise more thantotal costs, and so profits will increase.5 Import prices rise in units of the devaluedcurrency and fall in units of the foreigncurrency. The quantity of imports falls fromdevaluation. The importer’s total sales revenuefalls in terms of the devalued currency becauseprice increases are smaller than quantityreductions. The total cost of imports also falls,but if profits are being made, not by as much astotal revenue. The profits of importers thereforedecline from devaluation. This is truewhether we measure profits in terms of thelocal currency or in terms of foreign currency.EFFECT OF CURRENCY OF INVOICINGAND FORWARD HEDGINGIn our discussion of operating exposure we haveso far allowed the quantity sold and the price theexporter receives or the importer pays to varyimmediately as the exchange rate changes. However,these variations in quantity and price do not alwaysoccur immediately. Often, quantities and pricesare fixed for a period into the future in sales orpurchase contracts. This temporarily postpones theeffects of operating exposure, causes a translation/transaction exposure to be faced in addition to theoperating exposure, and results in conclusions thatare potentially different from those reached earlier.For example, exporters can lose from devaluationsand importers can gain – the reverse of the normaleffects.
OPERATING EXPOSUREThe effect of changes in exchange rates dependson whether sales and inputs are covered by existingcontracts, and on which currency is used in thecontracts. We will consider the following two casesfor exporters:1 A fixed volume of exports has been promisedfor future delivery at prices fixed in dollars(or in pounds, which have been sold on theforward market), but inputs are subject toinflation or are at pound-contracted prices. Thissituation involves what is in effect a translationor transaction exposure on payables and theremoval of this exposure on export revenues.2 Afixed volume of exports has been promised fordelivery at prices stated in British pounds, andthe pounds have not been sold on the forwardmarket. This situation involves a translation ortransaction exposure on receivables.We should note that what we shall be discussinginvolves the pre-contracting of prices and/orquantities. So far in this chapter we have taken pricedetermination, production, and settlement as beingcontemporaneous. Without there being any delaysin payments or receipts there is no transaction ortranslation exposure on payables or receivables,even though exchange rates do change profitabilitythrough operating exposure. When we have precontractingof prices and quantities, we havetranslation or transaction exposure and postponedoperating exposure. Since this situation occurs frequently,we will sketch the potential consequences.The exporter with exposed inputsDollar accountingAssume that Aviva Corporation has fixed the USdollar receipts from exports of a fixed number ofpairs of jeans at an agreed price. As we shall explainin Chapter 12, dollar receipts can be fixed either byinvoicing the jeans in dollars or by invoicing in theforeign buyer’s currency and selling the foreigncurrency forward for a known, fixed number ofdollars. With dollar receipts per pair of jeans andthe quantity supplied fixed, total dollar revenuesare fixed.While total dollar revenues will not change fromdevaluation, total costs could increase. Thisincrease could stem from general inflation inducedby rising tradable-goods prices, or it could occurbecause some inputs are internationally tradable orare imported and priced in pounds. (As we shall seein Chapter 12, it is possible to fix dollar costs ofpound-priced inputs by buying the required poundsforward. It is more difficult to hedge against inflation.)Let us take input prices to be fixed in poundswhich are not bought forward. This means facinga payables exposure on pounds, and the situationshown in Figure 11.9.The total revenue from sales is represented byarea Op $ 1 SX 1. However, costs could increase toOHJX 1 . If Aviva’s profits were minimal beforethe devaluation, the devaluation will result inlosses equal to the area p $ 1HJS. We can see thata US exporter might lose from devaluation of thedollar. 11 Of course, the loss is temporary and existsonly while sales revenues are fixed and while moreis paid for inputs.If production costs as well as revenues from salesare fixed by buying forward foreign exchange forimported inputs and arranging a period of fixeddollar wages, then, of course, both costs and revenueswill be unaffected by exchange rates while thevarious agreements are in effect. The exporting firmcan therefore avoid temporary losses from devaluationif foreign exchange is sold forward orinvoicing is in dollars by trying also to fix dollarinput costs, including wages, for the same period.We should note that the temporary decline inprofits from devaluation as a result of paying morefor inputs is analogous to the temporary worsening ofthe balance of payments, which in Chapter 6 wascalled the J-curve effect. The balance of payments11 Aviva would prefer to reduce output and sales to the levelwhere MC L cuts p $ 1 . Losses would be reduced if this weredone, but with an agreement to deliver X l , it might not bepossible.245 &
MANAGING FOREIGN EXCHANGE RISK AND EXPOSUREMCMCMC L MC LAC LPrice, cost in dollarsp 1$SD =MRPrice, cost in dollarsHp $ 1JSACD =MRO X 1OX 1Exports per period of time(a) Revenues& Figure 11.9 Exporter with payables exposure: dollar accountingExports per period of time(b) CostsNotesIf a fixed number of goods are sold at a fixed dollar price, revenues will be unchanged after devaluations. We can think ofoperating exposure on sales revenues as being postponed. If, however, a devaluation raises input costs, total costs will rise.This is because of transaction exposure if the prices of imported inputs are denominated in foreign currency. The higherinput costs could reduce profits, and so exporters can temporarily lose from a devaluation.can temporarily worsen because the value of importsmay increase in dollars, and this may offset extrarevenues from exports. Our analysis in this chaptershows for an individual firm the J curve that is usuallyshown for the economy. The J curve for the firm orthe economy is shown in Figure 11.10. The figureshows that if a devaluation takes place at time t oprofits could temporarily fall or the balance ofpayments could temporarily worsen, but eventuallythe operational effects of the devaluation will beginto improve both profits and the balance of payments.Pound accountingWith the price of jeans fixed in dollars from sellingexport proceeds forward or from dollar invoicing,a US dollar devaluation means that these contracteddollars represent fewer pounds. Therefore, totalrevenue in pounds declines. A given amount ofproduction costs, which are in dollars, will alsorepresent fewer pounds, but if devaluation causesinflation or if some inputs are tradable and become& 246Change in dollar profits (or balance of payments)+0–& Figure 11.10 The J curvet oTime tNotesWhen prices of inputs increase, a devaluation can lower anexporter’s profits just as it can worsen the balance ofpayments of nations. However, the negative effects aretemporary, and eventually the beneficial effects of adevaluation for an exporter’s profit will begin to dominate.
OPERATING EXPOSUREmore expensive, total revenue will fall more thantotal cost. Thus profit will decline or losses willincrease. We find that exporters might lose not onlyin dollar terms but also in terms of pounds. This is nosurprise, since lower profits in dollars are certainlylower profits in pounds after a dollar devaluation,because there are fewer pounds for each dollar.The exporter with receivables exposureWe have considered the case where the exporter’sdollar receipts are temporarily fixed, either byselling foreign-currency-invoiced receivables forwardor by invoicing in dollars. This temporarilyeliminates operating exposure on revenues butleaves transaction exposure on payables. We cannow consider what will happen when export pricesare pre-contracted in the foreign currency, butthe foreign currency is not sold forward. Thispostpones the operating exposure and causes atransaction exposure on receivables.It is relatively easy to compute the effect ofAviva’s having pre-contracted to supply jeans toBritain at a fixed pound-per-pair price when thepounds have not been sold forward. A dollardevaluation would make these pounds more valuableby the percentage of devaluation – a gain onpound receivables – but postpone the effect ofoperating exposure. Production costs might alsorise because of tradable inputs or wage pressurefrom devaluation-induced inflation, but this effect islikely to be smaller than the effect on revenues, andso dollar profits will rise. This gain on receivables inpounds for jeans that have already been sold will befollowed by gains on jeans not yet sold, resultingfrom the operating exposure described earlier.The importerIf Aviva is operating as an importer and agrees topurchase a given quantity of jeans at a dollar invoiceprice, or at a pound price when the pounds arebought forward, there is no immediate effect of adollar devaluation in dollar terms. Aviva’s costs arein dollars and are unaffected by exchange rates, asare Aviva’s revenues. Only after the period duringwhich dollar prices are fixed will a devaluation havethe operating-exposure effect described earlier inthis chapter. A revaluation of the dollar will alsoleave costs, revenues, and profits unaffected indollar terms. We have a case where there is notranslation or transaction exposure and where theeffects of operating exposure have been postponed.If Aviva agrees to purchase a given quantity ofimports at pound prices, there is a fixed payablein pounds and hence payables transaction exposure.A dollar devaluation, which means a pound revaluation,will increase the dollar value of thispayable. For given total revenue in dollars fromsales of the contracted imported quantity, we havea reduction in dollar profits via losses on payables.The losses on payables will be followed by theimporter’s losses from operating exposure; recallthat devaluations lower operating incomes ofimporters. Therefore, there are immediate andlonger term negative consequences.A reminder: importance of lagsIf sales, delivery, and payment could all occursimultaneously, there would be no need to worryabout the contract currency or the presence of forwardagreements. There would be no receivables orpayables in trade, and the only effects of changes inexchange rates would be those from the operatingexposure described earlier in this chapter. The currencyused for sales invoicing and forward marketcovering are important only when price agreementsand actual payments are separated in time. This,however, frequently happens to be the case. We thenhave the combined effects of translation/transactionexposure and operating exposure.An example: Aviva’s different exposuresSuppose that Aviva has contracted to sell 100 pairs ofjeans per year to Britain at $24/pair and to buy 200yardsofdenimfromBritaininthissameperiodfor£2/yard. Suppose that 2 yards of denim are requiredper pair and that the labor cost for each pair is $8.247 &
MANAGING FOREIGN EXCHANGE RISK AND EXPOSURESuppose that at the time of contracting theexchange rate is S($/£) ¼ 1.5 and that the dollar isthen devalued or depreciates to S($/£) ¼ 2.0.Suppose also that the elasticity of demand for Avivajeans in Britain is 2, which is elastic as is the caseat a profit-maximizing output, and that after thecurrent sales contract expires Aviva raises the priceof jeans to $25 per pair. 121 What are the gains/losses from the dollardevaluation on the jeans sold and on the denimbought at pre-contracted prices? (i.e. what arethe gains/losses from transaction exposure onAviva’s payables and receivables?)2 What are the gains/losses from the extracompetitiveness of Aviva’s jeans, that is, fromoperating exposure?Assume that Aviva can buy all the denim it wishes at£2/yard – it is a price taker – and that wages do notincrease as a result of the devaluation.Effect of transaction exposureBefore the devaluation:Expected total revenue/year¼ 100 pairs $24/pair ¼ $2, 400Expected total cost/year¼ 100 pairs 2yd/pair £2/yd$1:5/£þ100 pairs $8/pair ¼ $1; 400Expected profit ¼ $2, 400 $1, 400¼ $1, 000/yearAfter the devaluation:Total revenue ¼ 100 pairs $24/pair¼ $2, 40012 Firms do not generally know the elasticity of demand fortheir products. An alternative practical approach taken by aEuropean chemicals subsidiary of a US-based multinationalis described in Exhibit 11.1.& 248Total cost ¼ 100 pairs 2yd/pair £2/yd $2/£ þ 100 pairs $8/pair ¼ $1; 600Expected profit ¼ $2, 400 $1, 600¼ $800/yearWe find that the exporter’s profit on contractedquantities and prices of jeans supplied and denimpurchased is reduced by $200 per year because of thetransaction exposure.Effect of operating exposureBefore the devaluation:Expected profit ¼ $1, 000/year(as we just showed)After the contract expires: When the dollar price ofjeans rises from $24 per pair to $25 per pair, thepound price falls from $24 $1.5/£ ¼ £16 to$25 $2/£ ¼ £12.5. This is a 21.875 percent pricereduction. With a demand elasticity of 2, it willresult in sales increasing by 43.75 percent to 143pairs per year. It follows that after the contractexpiresExpected revenue ¼ 143 pairs $25/pair¼ $3, 575Expected cost ¼ 143 pairs 2yd/pair £2/yard $2:0/£þ 143 pairs $8/pair¼ $2, 288Expected profit ¼ $3, 575 $2, 288¼ $1, 287/yearWe find that the exporter’s profit is increasedby $287 ($1,287 $1,000) per year from thedevaluation because of operating exposure.In this specific example the firm is likely to feelhappy about the devaluation because in the long runit will come out ahead. It should be clear, however,that temporary setbacks from transaction exposureon payables can occur.
OPERATING EXPOSUREEXHIBIT 11.1A PRACTICAL SOLUTION TO ESTIMATINGOPERATING EXPOSURERather than knowing elasticities of demand, firmshave an idea of the extent to which the quantitydemanded is sensitive to price changes. The followingexcerpt explains how one firm gains an idea of theprice sensitivity of demand for its products, and takessteps based on what it finds.One company that manages economic exposureexplicitly is the European chemicals subsidiary ofa U.S.-based multinational. As an executive ofthe company commented, ‘Although a lot of peopletalk about economic exposure, we wanted toactually measure it and do something about it.’This company’s system begins with a projectionof cash flows for each of eight majorgeographical regions for one year ahead. Thenext step is to determine the sensitivity of therevenues of each product group and each majorelement of cost to forex (foreign exchange)movements. Because it is based in the U.S., thecompany is most concerned about movementsagainst the dollar.To measure this sensitivity, an analysis is madeby taking a representative sample of productsfrom each product group and interviewing theproduct marketing manager in each case. Questionsconcern the general characteristics of themarket, who the competitors were, how pricingwas determined, and what factors had the largestimpact. Based on these interviews, a rating isassigned to each product group signifying theextent to which the product price is sensitive tomovements in the U.S. dollar....The product rating in a sense is a measure ofthe company’s ability to pass on changes inexchange rates to customers. If a product iscompletely dollar-sensitive, forex changes can bepassed on immediately; if completely insensitive,changes cannot be passed on....A similar analysis is done for costs. Eachmajor cost component is given a rating using thesame scale used for revenues. Feedstocks, forexample, which consist of petroleum derivatives,are viewed as completely dollar-sensitive. Electricpower was entirely local, while fuel and gaswas entirely dollar-sensitive. Locally-sourcedinputs such as labor and services were judged tobe completely dollar-sensitive....Projected cash flows are then transformed into‘‘economic’’ cash flows by multiplying them by theproduct ratings .... This procedure is repeatedfor revenues and costs for each of the company’sEuropean subsidiaries and then aggregated toobtain an estimate of total exposed and nonexposedcash flows for the company overall forthe year ahead. The results provide the companywith a measure of its effective exposure in eachcurrency relative to the U.S. dollar.Source: John J. Pringle, ‘‘Managing Foreign ExchangeExposure,’’ Journal of Applied Corporate <strong>Finance</strong>, Winter1991, pp. 73–82.MEASURING EXPOSURE: ANALTERNATIVE APPROACHThe regression equation approach described inChapter 9 for estimating exposure from time seriesdata on exchange rates and a company’s marketvalue provides a measure of overall exposure. Thatis, it gives the combined exposure from effects ofexchange rates on assets and liabilities and onoperations. The effect on operations showing up inthe share price from which the market value iscalculated should be the present value of futureeffects on profitability of operations. However,sometimes, times series data on a share price is notavailable. The company could be relatively new, orbe privately held. Furthermore, management maybe interested in operating exposure alone, excludingexposure on the balance sheet that would be part ofoverall exposure. What does a company need to do249 &
MANAGING FOREIGN EXCHANGE RISK AND EXPOSUREto find its operating exposure? There are twopossibilities.First, if there is a long history of profits (asopposed to share price), a regression can be run tosee the sensitivity of profits with respect to pastchanges in exchange rates. These are flow effectsbecause they are effects on income which is a flow.It is necessary to take the present value of the effecton income to compute exposure. This would haveto be done at an appropriate risk-adjusted discountrate. But what does a company do when it has nohistory of profits from which to compute exposure?Perhaps the company is new, or perhaps the natureof its business changed. Maybe the company isnow exporting, importing, or being forced tocompete in the home market with importedsubstitutes. The past profits data, even if they exist,are not useful for calculating foreign exchangeexposure. Even in such a situation, however, it maybe possible to glean a reasonable sense of a company’sexposure from interviewing knowledgeablecompany personnel.To gain a sense of operating exposure, theinterviewing might begin with talking to those incharge of sales and/or marketing. The head salesmanager might be asked: ‘‘How badly would salesbe affected if our currency were to appreciate5 percent?’’ ‘‘How about a rise of 10 percent?’’‘‘What if our currency were to increase15 percent?’’ Then the same person(s) could beasked how much sales would increase from a 5, 10,and 15 percent depreciation. Factored into thepredictions about sales revenues would be judgmentof the extent to which changes in exchange ratescould be passed on to buyers through the prices thatcustomers pay. As we have seen in this chapter,depending on the elasticity of demand for a company’sproduct, the profit-maximizing price willreflect different proportions of the change inexchange rates (under perfect competition pricerises in proportion to devaluation. With someinelasticity in demand, the price effect is smaller).Depreciation of currency is like a subsidy, at thesame time reducing the price the buyer paysand increasing what the producer receives.& 250An appreciation of currency is like a tax, raising theprice the buyer pays and reducing the amount theproducer receives.After asking relevant personnel about the impactof possible exchange rate changes on sales volumesand the prices buyers will pay – and hence on totalrevenue – attention can be turned to those withknowledge of the impact of exchange rates on costs,specifically company personnel involved with inputacquisitions and/or production. The question isagain what would happen from various amounts ofcurrency appreciation and currency depreciation.Guidance of those responding is required herebecause they may need to be told that costs of allinternationally tradable inputs, not just those inputsthat are imported, are likely to increase with adepreciation of the buyer’s currency, and vice versafor a revaluation. As we have explained, this isbecause, ceteris paribus, buyers have to compete fortheir own country’s tradable inputs (depreciationof the producer’s currency increases the amountforeign producers can pay for inputs in terms ofthe depreciated currency).As we have seen in this chapter, in addition toimpacts on sales volumes, product prices and inputcosts, the implications of changes in exchange ratesfor profits also depend on the ability of a companyto change its output level without substantiallyaffecting its unit production costs. Specifically, itdepends on whether marginal and average costs arerelatively constant as output is varied, or whetherinstead unit costs increase with output, at leastin the short run. This can be determined fromproduction managers.The ability to substitute between domestic andforeign inputs is also a factor affecting how costschange with changing exchange rates. The greaterthe extent to which domestic input substitutes areavailable, the less production costs are likely torise when the producer’s currency depreciates. Thismay be determined from procurement personnel.After dealing with implications of changes inexchange rates for sales revenue and costs, it isnecessary to put these in present value terms bydiscounting at an appropriate rate. The exposure on
OPERATING EXPOSUREoperations can then be added to any balance-sheetexposure that may exist if the interest is in totalexposure. As explained in Chapter 9, the size ofbalance-sheet exposure depends on the investmentsand debt of the company. For example, if a companyhas any contractual foreign-currency debt it isshort the amount of the debt and this can be combinedwith the exposure on operations in presentvalue form. A company may also hold exposedassets. It should be remembered that the exposureis the sensitivity of the value of assets and liabilities.It depends on whether the exchange rate and theasset of liability price move in the same direction orthe opposite direction.The procedure we have described for determiningexposure by combining the operating andbalance-sheet effects of exchange rates is a complicatedone, and not something that would be donefrequently. It is, however, important that a companychecks periodically how big its exposure isrelative to the size of the company before decidingwhat if anything should be done about it. 13SUMMARY1 An exporting firm in a competitive market will experience an increase in salesrevenues and production costs after a real devaluation/depreciation of its currency.Total revenue will rise by more than total cost, and so profits will increase.2 The higher profit for a competitive firm from devaluation will encourage existingfirms to expand output and new firms to enter the industry, lowering the product price.This may limit the period of extra profit for any particular pre-existing firm.3 Higher input costs associated with devaluation also limit profit improvements.Increases in input costs can result from the effect of devaluation on wages via a generalinflationary impact or from the use of internationally tradable inputs.4 The home-currency price of an exporter’s product will rise by the percentage of thedevaluation when the product is sold in a perfectly competitive market.5 An exporting firm in an imperfectly competitive market will experience an increasein total revenue and total cost after devaluation when amounts are measured in thefirm’s home currency. Total revenue will rise by more than total cost, and soprofit will increase. The higher profits can persist if they are not offset by higherinput costs. Revenues, costs, and profits that are measured in terms of foreignexchange will also increase from devaluation, although by a lesser amount.6 In an imperfectly competitive market the price of the goods sold by an exporter will,after a devaluation of the home currency, rise in terms of the home currency but fallin terms of the amount of foreign exchange. This happens because the home-currencyprice rises by a smaller percentage than the devaluation.13 As we shall see in Chapter 12, what a company should do about exposure also depends on the ability of the company’sshareholders to hedge exposure themselves, perhaps by holding a portfolio of assets for which the exposures cancel.For example, a shareholder could hold importing and exporting firms shares, or exporters’ shares from different countries,so when some lose from a currency change, others in the portfolio gain.251 &
MANAGING FOREIGN EXCHANGE RISK AND EXPOSURE7 Devaluation raises the prices of imports in terms of the devalued currency and reducesthe quantity that is imported and sold. Total revenue and total cost in terms ofdollars will fall, and so will the importer’s profit. A revaluation lowers input pricesand raises an importer’s dollar total revenue, total cost, and profit.8 Devaluation lowers the prices of imports when these prices are measured in theforeign currency.9 Dollar devaluation lowers an importer’s total revenue, total cost, and profit interms of the foreign currency. Revaluation will raise them.10 When an arrangement exists to export a stated quantity at a price fixed in homecurrency (or in foreign exchange that is sold forward), devaluation can temporarily hurtan exporter’s profit. This is true in both dollar and foreign-currency units.11 If prices in an export sales agreement are stated as foreign-currency amounts andthese are not sold forward, devaluation will raise dollar revenues, costs, and profits ofa US exporter via both transaction and operating exposure.12 An importer buying an agreed-upon quantity at an agreed-upon price in dollars(or with required foreign exchange bought forward) will experience no change indollar revenues, costs, or profits after devaluation. An importer buying anagreed-upon quantity at prices invoiced in foreign exchange will temporarily experienceunchanged dollar revenues, increased costs, and reduced profits.REVIEW QUESTIONS1 What is meant by ‘‘operating exposure?’’2 What is a ‘‘tradable input?’’3 Are all imported inputs ‘‘tradable?’’4 In what way does an exporter’s operating exposure depend on the elasticity ofdemand facing the exporter?5 How does an exporter’s operating exposure depend on the flexibility of production?6 How does free entry in an industry affect operating exposure in the short run versusthe long run?7 How does the importance of tradable versus non-tradable inputs affect an exporter’sexposure?8 How is exposure of a perfectly competitive exporter affected by the exporter’scountry being and remaining only a tiny part of the world supply of the product theexporter sells?9 Does the demand curve for an imperfectly competitive firm’s product shift afterdevaluation if the demand curve is drawn again the currency of the buyer, and if sohow does it shift?10 Does the exporter’s demand curve shift after devaluation when the curve is drawn againstthe exporter’s home currency, and if not, what does happen?11 Why might an exporter care about the effect of a change in an exchange rate onthe exporter’s revenue, cost and profit measured in terms of the currency of the buyer ofthe exporter’s product?& 252
OPERATING EXPOSURE12 How does the effect of a revaluation on an importer’s domestic-currency price depend onthe elasticity of demand for the product that is imported?13 How does change in domestic-currency price of an import compare to the size ofdevaluation?14 What happens to the quantity imported after a devaluation of the importer’s currency?15 What happens to an importer’s total revenue after a devaluation of the importer’scurrency?ASSIGNMENT PROBLEMS1 Rank the following export industries according to the amount of increase in sales volumeyou would expect to result from a fall in the value of the US dollar.a Wheat farmingb Automobile productionc Foreign travel to the United Statesd Computer hardwareUse diagrams in your answers.2 Rank the industries in question 1 according to the effects of a devaluation/depreciationon profits. You may assume that there are different amounts of tradable inputs,different elasticities of demand, and so on.3 Do you think that the United States is a sufficiently large importer of products ingeneral so that the effect of a dollar depreciation would be eliminated by pressure onnominal wages from tradable-goods price increases? How about Canada, Fiji,or Iceland?4 Assume that the elasticity of demand for Aviva’s jeans is 2. Assume that productioncosts are constant and that there is a 10 percent dollar depreciation.a By how much will the quantity sold increase?b By how much will dollar revenues increase?c By how much will foreign exchange revenues increase?d By how much will costs increase?e By how much will profits increase?5 As in question 4, assume that Aviva’s jeans face an elasticity of demand of 2with constant costs, and assume also approximately half the total cost is accounted for bydenim cloth, which is imported. To an approximation, what will this mean for youranswers in question 4?6 Redraw Figure 11.2 to show the short-run effect of a dollar revaluation on the profits ofa US exporter that sells in a competitive market.7 Redraw Figure 11.2 to show the long-run effect of a dollar revaluation on the profits ofa perfectly competitive US exporter.8 Redraw Figure 11.4 to show the effect of a revaluation of the dollar on a US exporterselling in an imperfectly competitive market.253 &
MANAGING FOREIGN EXCHANGE RISK AND EXPOSURE9 Redraw Figure 11.2 to show the effect of devaluation-induced cost increases whenamounts are measured in foreign currency.10 Why does devaluation simultaneously raise export prices as measured in home currencyand lower them as measured in foreign currency?11 Redraw Figure 11.6 and Figure 11.7 to show the effect of a revaluation on revenues,costs, and profits.12 Reconcile a rising domestic-currency price and a falling foreign-currency pricefor an imported good after a devaluation of the domestic currency. Why doesthis mean that the domestic-currency price rises by less than the percentage ofdevaluation?13 What would the availability of very close substitutes for an import mean for the e1asticityof demand of the firm that competes with imports? Who will bear the burden ofdevaluation in this case?14 The ‘‘maquiladoras’’ are manufacturing facilities located on the Mexican side of theUS-Mexican border, including factories owned by US firms assembling goods for sale inthe United States. What factors influence the size of operating exposure of thesemaquiladoras for their US owners?15 Due to the North American Free Trade Agreement, NAFTA, the operations of many firmsare more integrated across the continent with, for example, manufacturers sourcing partsfrom United States, Canadian and Mexican factories. How might such integrationinfluence operating exposure of a firm that integrates production, but which also sells itsproducts throughout North America?BIBLIOGRAPHYBodnar, Gordon M. and William M. Gentry, ‘‘Exchange Rate Exposure and Industry Characteristics: Evidencefrom Canada, Japan and the U.S.A.,’’ Journal of <strong>International</strong> Money and <strong>Finance</strong>, February 1993,pp. 29–45.Bodnar, Gordon M., Bernard Dumas, and Richard C. Marston, ‘‘Pass-through and Exposure,’’ Journal of <strong>Finance</strong>,February 2002, pp. 199–231.Ceglowski, Janet, ‘‘Dollar Depreciation and U.S. Industry Performance,’’ Journal of <strong>International</strong> Money and<strong>Finance</strong>, June 1989, pp. 233–51.Dufey, Gunter, ‘‘Corporate <strong>Finance</strong> and Exchange Rate Changes,’’ Financial Management, Summer 1977,pp. 23–33.Flood, Eugene Jr., ‘‘The Effect of Exchange Rate Changes on the Competitive Firm’s Pricing and Output,’’unpublished, Massachusetts Institute of Technology, December 1981.Hekman, Christine R., ‘‘Measuring Foreign Exchange Exposure: A Practical Theory and its Applications,’’Financial Analysts Journal, September/October 1983, pp. 59–65.Hung, Wansing, Yoonbai Kim, and Kerichi Ohno, ‘‘Pricing Exports: A Cross-Country Study,’’ Journal of<strong>International</strong> Money and <strong>Finance</strong>, February 1993, pp. 3–28.Kalter, Elliot R.J., ‘‘The Effect of Exchange Rate Changes upon <strong>International</strong> Price Discrimination,’’ <strong>International</strong><strong>Finance</strong> Discussion Paper 122, Board of Governors of the Federal Reserve, Washington, DC.& 254
OPERATING EXPOSUREMarston, Richard, ‘‘Pricing to Market in Japanese Manufacturing,’’ National Bureau of Economic Research,Working Paper 2905, 1989.——, ‘‘The Effects of Industry Structure on Economic Exposure,’’ Working Paper, University of Pennsylvania,1998.Shapiro, Alan C., ‘‘Exchange Rate Changes, Inflation and the Value of the Multinational Corporation,’’ Journal of<strong>Finance</strong>, May 1975, pp. 485–502.Sundaram, Anant K. and Veena Mishra, ‘‘Exchange Rate Pass Through and Economic Exposure: A Review,’’Dartmouth College, Working Paper, October 1989.255 &
Chapter 12Hedging risk and exposureA good hedge keeps dogs off the yard.Chicago Fed Letter, November 1989With the various forms of foreign exchange riskand exposure defined in Chapters 10 and 11 we canturn our attention to how they can be managed.However, before we proceed we must answerthe question of whether corporate managers – theagents of the company – should hedge exposure, orwhether this should be left to shareholders – theprincipals. The choice between corporate – (ormanagerial-) level and shareholder-level exposureis important because the preferred exposure ofshareholders may differ from that of companymanagers. Indeed, shareholders may want to undohedging done by managers, thereby incurring hedgingtransaction costs twice. After dealing with thequestion of who should hedge, we consider a varietyof means of hedging, employing the technique offinancial engineering to contrast and comparethe consequences of different hedging vehicles.WHETHER TO HEDGE: MANAGERIALHEDGING VERSUS SHAREHOLDERHEDGINGIt is usually argued that the objective of managementshould be to maximize the utility of the company’sshareholders. However, even though hedging reducesor even eliminates exchange-rate risk, and lowerrisk is valued by shareholders, it does not pay fora firm to hedge exchange-rate risk if shareholderscan reduce this risk themselves for the same or lower& 256cost; shareholders will not value risk reduction theycan achieve as or more effectively themselves. This isparticularly relevant because shareholders may beresidents of different countries and buy differentbaskets of goods and therefore have different riskperspectives. 1 However, several arguments havebeen advanced which suggest that managers ratherthan shareholders should hedge foreign exchangeexposure. These arguments include:1 Progressive corporate tax rates Astablebefore-taxcorporate income results in a higher averageafter-tax income than a volatile income of thesame average value if corporate tax rate areprogressive. This is because with progressive taxrates more taxes are paid in high-income periodsthan are saved in low-income periods. 21 If PPP holds, the residence of shareholders should notmatter provided tastes are similar; with PPP the samebundle of goods should cost the same in different countries.However, the buying of different baskets of goods bydifferent shareholders can cause different real exposures fordifferent shareholders.2 This and some of the other reasons given here for whymanagers rather than shareholders should hedge can befound in Rene Stulz and Clifford W. Smith, ‘‘TheDeterminants of Firms’’ Hedging Policies, Journal ofFinancial and Quantitative Analysis, December 1985,pp. 391–405, and Alan C. Shapiro, ‘‘Currency Risk andRelative Price Risk,’’ Journal of Financial and QuantitativeAnalysis, December 1984, pp. 365–73.
HEDGING RISK AND EXPOSURE2 Economies of scale in hedging It may bedifficult for shareholders to determine theamount of exposure in each currency thatexists at any particular moment. Furthermore,even if the overall exposure is known,the share of total exposure facing anindividual shareholder may be so small thatforward or swap hedging by the shareholder isimpractical. This occurs because of economiesof scale in foreign exchange and derivativesmarkets. 33 Product marketing Marketing of a company’sproduct may be adversely affected by anunstable corporate income if buyers wantassurance that the company will stay inbusiness to maintain and service its productor supply parts. This motive for hedging isparticularly important in such industries ascomputer software and telecommunications.Software producers, for example anti-virusproviders, are expected to update theirproduct continuously, and if their incomewas so volatile that their continuation inbusiness was in doubt, sales would beadversely impacted.4 Attracting personnel Corporate employees maybe frightened away by volatile corporateearnings which might suggest less job security.Alternatively, those that accept employmentmight demand higher salaries to compensatefor the employment uncertainty.3 This impracticality is manifest in the large bid-askspreads on small swap and forward transactions: ashareholder whose share of exposure is $1,000 mightface a percent bid-ask spread that is 50 times that ofthe company whose exposure is, say, over $1 million, ifthe shareholder can find forward cover at all. We shouldnote, however, that shareholders have ways of hedgingother than using forward contracts and swaps. Forexample, they can hold a portfolio of shares in importandexport-oriented companies. If shareholders can selectan alternative to the swap or forward markets, higherspreads are not a reason for firms rather than theirshareholders to hedge.5 Expected costs of bankruptcy Bankruptcy costs,which refer to the expected costs of reorganizationin the event of bankruptcy, constitutea higher reduction in corporate value whenearnings are more volatile. Furthermore,suppliers of capital will demand higher returnsto cover expected bankruptcy costs.6 Debt repayment clauses Loan repayments cansometimes be triggered when earnings fallbelow a stated low level. The company mustthen incur costs of refinancing.7 Information on performance and profit centersManagers of multi-division companies needto know the profit centers within the companyin order to properly allocate marketingand capital expansion budgets. Leavinghedging to shareholders reduces the qualityof internal information available to managers,because incomes of different divisions ofthe company can be a mixture of foreignexchange gains and losses and of operatingincome. 48 Instrument availability There are hedgingtechniques involving selecting the currencyof invoicing and buying inputs in markets orcurrencies of exports that are available tothe firm but not to its shareholders. 5Let us assume that for one or more of these reasonsit is the firm that should hedge. Before evaluatingthe techniques that are available for this purpose, letus give the problem a context by considering thehedging decision of importers and exporters dealingfirst with the source of their foreign exchange riskand exposure.4 Of course, firms can calculate the profitability of differentdivisions ‘‘as if ’’ they had hedged. However, this requiresmaintaining a lot of data on foreign-currency inflows andoutflows as well as on forward exchange rates.5 Some of the reasons for corporate-level hedging given here,as well as further reasons, are mentioned in Exhibit 12.1,which discusses how the pharmaceutical giant, Merck & Co.Inc., views hedging.257 &
MANAGING FOREIGN EXCHANGE RISK AND EXPOSUREEXHIBIT 12.1TO HEDGE OR NOT TO HEDGE: MERCK’S MOTIVESThe pharmaceutical giant, Merck & Co. Inc., doesbusiness in over 100 countries through approximately70 subsidiaries. Because the company has 40 percentof total assets overseas and also has an importantnon-US marketing presence, Merck’s managementhas carefully considered whether it should hedgeits foreign exchange exposure. The following excerptfrom an article by the Treasurer and an AssistantTreasurer at Merck reinforces some of the reasons forhedging stated in the text. The article also adds someother reasons which are relevant in a technologicallydriven industry, such as the need for a steady incomewhen committing to long-term R&D.Over the long term, foreign exchange rate movementshave been – and are likely to continue to be –a problem of volatility in year-to-year earningsrather than one of irreversible losses.... Thequestion of whether or not to hedge exchange riskthus becomes a question of the company’s own riskprofile with respect to interim volatility in earningsand cash flows.The desirability of reducing earnings volatilitydue to exchange can be examined from bothexternal and internal perspectives.External concernsThese center on the perspective of capital markets,and accordingly involve matters such as shareprice, investor clientele effects, and maintenanceof dividend policy. Although exchange fluctuationsclearly can have material effects on reportedaccounting earnings, it is not clear that exchangerelatedfluctuations in earnings have significanteffects on stock price. Our own analysis ...suggests only a modest correlation in recentyears between exchange gains and losses andshare price movements, a slight relationship inthe strong dollar period – the scenario of greatestconcern to us ...With respect to investor clientele, exchangewould seem to have mixed effects. To theextent that some investors – especially overseasinvestors – see Merck’s stock as an opportunity forspeculating on a weak dollar, hedging would becontrary to investors’ interests. But, for investorsseeking a ‘‘pure play’’ on the stocks of ethical drugcompanies, significant exchange risk could beundesirable. Thus, given this potential conflict ofmotives among investors, and recognizing ourinability to ascertain the preferences of all ofMerck’s investor clienteles (potential as well ascurrent), we concluded that it would be inappropriateto give too much weight to any specifictype of investor.On the issue of dividend policy, we came toa somewhat different conclusion. MaintainingMerck’s dividend, while probably not the mostimportant determinant of our share price, isnevertheless viewed by management as an importantmeans of expressing our confidence in thecompany’s prospective earnings growth. It is ourway of reassuring investors that we expect ourlarge investment in future research (funded primarilyby retained earnings) to provide requisitereturns. And, although both Merck and the industryin general were able to maintain dividendrates during the strong dollar period, we wereconcerned about the company’s ability to maintaina policy of dividend growth during a futuredollar strengthening. Because Merck’s (and otherpharmaceutical companies’) dividend growthrates did indeed decline during the strong dollar1981–1985 period, the effect of future dollarstrengthening on company cash flows could wellconstrain future dividend growth. So, in consideringwhether to hedge our income against futureexchange movements, we chose to give someweight to the desirability of maintaining growthin the dividend.In general, then, we concluded that although ourexchange hedging policy should consider capitalmarket perspectives (especially dividend policy), itshould not be dictated by them. The direct effect of& 258
HEDGING RISK AND EXPOSUREexchange fluctuations on shareholder value, if any,is unclear; and it thus seemed a better course toconcentrate on the objective of maximizing longtermcash flows and to focus on the potential effectof exchange rate movements on our ability to meetour internal objectives. Such actions, needless tosay, are ultimately intended to maximize returnsfor our stockholders.Internal concernsFrom the perspective of management, the keyfactors that would support hedging againstexchange volatility are the following two: (1)the large proportion of the company’s overseasearnings and cash flows; and (2) the potentialeffect of cash flow volatility on our abilityto execute our strategic plan – particularly, tomake the investments in R & D that furnish thebasis for future growth. The pharmaceuticalindustry has a very long planning horizon, onewhich reflects the complexity of the researchinvolved as well as the lengthy process of productregistration. It often takes more than 10 yearsbetween the discovery of a product and its marketlaunch. In the current competitive environment,success in the industry requires a continuous, longtermcommitment to a steadily increasing level ofresearch funding.Given the cost of research and the subsequentchallenges of achieving positive returns,companies such as Merck require foreign sales inaddition to U.S. sales to generate a level of incomethat supports continued research and businessoperations. The U.S. market alone is not largeenough to support the level of our research effort.Because foreign sales are subject to exchangevolatility, the dollar equivalent of worldwide salescan be very unstable. Uncertainty can make it verydifficult to justify high levels of U.S.-basedresearch when the firm cannot effectively estimatethe pay-offs from its research. Our experience, andthat of the industry in general, has been that thecash flow and earnings uncertainty caused byexchange rate volatility leads to a reduction ofgrowth in research spending.Such volatility can also result in periodicreductions of corporate spending necessary toexpand markets and maintain supportive capitalexpenditures. In the early 1980s, for example,capital expenditures by Merck and other leadingU.S. pharmaceutical companies experienced areduction in rate of growth similar to that in R & D.Our conclusion, then, was that we should takeaction to reduce the potential impact of exchangevolatility on future cash flows. Reduction of suchvolatility removes an important element of uncertaintyconfronting the strategic management of thecompany.Source: Judy C. Lewent and A. John Kearney, ‘‘Identifying,Measuring, and Hedging Currency Risk at Merck,’’ Journalof Applied Corporate <strong>Finance</strong>, Winter 1990, pp. 19–28.Emphasis in original.HEDGING OF RECEIVABLES ANDPAYABLESThe source of risk and exposure forimporters and exportersImporting and exporting firms can face significantexposure because of settlement delays when theirtrade is denominated in a foreign currency. Animporter, for example, does not normally receivea product immediately after ordering it. Often, theordered product has not yet been produced, andthis takes time. Even after production is completed,the goods must be shipped, and this also takes time.After delivery, it is customary for the vending firmto grant the importer a period of trade credit. As aresult of all these delays the importer may not berequired to pay for many months after the order hasbeen placed. Yet the price and amount purchasedare generally agreed on at the time of ordering.As we explained in Chapter 11, if an importeragrees on a price that is stated in the vendor’s259 &
MANAGING FOREIGN EXCHANGE RISK AND EXPOSUREcurrency, the importer faces exposure on theaccount payable if steps are not taken to hedge it.Alternatively, if the price that is agreed upon isstated in the importer’s currency, the exporterfaces exposure on the account receivable if nothingis done to hedge it. 6 The exposure is due bothto the delay between agreeing on the price andsettling the transaction, and to the settlement pricebeing in terms of a foreign currency. However, theexposure can be hedged in various ways. Let usbegin by considering hedging via the forwardmarket.Hedging via the forward marketSuppose that Aviva Corporation has placed an orderwith a British denim-cloth manufacturer for£1 million of fabric to be delivered in 2 months.Suppose also that the terms of agreement allow for1-month trade credit after delivery, so that thesterling payment is due in 3 months.One alternative open to Aviva is to buy£1 million forward for delivery on the settlementdate. This will eliminate all uncertainty about thedollar cost of the denim. However, before Avivacan decide if forward hedging is a good idea, it mustconsider the cost. This can then be compared withthe benefit of making the dollar cost certain. Let ustherefore consider the cost and benefit of forwardhedging. 7THE COST OF FORWARD HEDGINGIf a firm hedges forward, there will be a gain or lossvis-à-vis not hedging and exchanging currency onthe spot market. However, this gain or loss is6 Both buyer and seller can be exposed if the import orexport price is stated in any currency other than that of theimporter or exporter. The frequent practice of statingprices in a major international currency such as the USdollar or euro means the importer and exporter can bothface exposure if neither is an American firm.7 Exhibit 12.2 describes the choice between hedging andnon-hedging alternatives.& 260known only ex post, that is, after the spot ratebecomes eventually known. The relevant cost indeciding whether to hedge is not this ex post cost,but rather the expected or ex ante cost. The expectedcost of forward hedging is equal to the known costof foreign currency if it is bought forward, minusthe expected cost of the foreign currency if thebuyer waits and the currency is bought spot. That is,in the context of our example, the expected cost ofbuying pounds 3 months forward versus waiting andbuying the pounds at the time of payment isExpected cost of hedging £ payables¼ F 1/4 ð$/ask£Þ S 1/4 ð$/ask£Þwhere S 1/4 ($/ask£) is the expected future spot costof buying pounds in 3 months’ time. Note that bothexchange rates are dollar prices that must be paidto the bank to purchase pounds. 8 As we showed inChapter 3, if speculators are risk-neutral and there areno transaction costs, speculators will buy poundsforward whenF 1/4 ð$/£Þ < S 1/4 ð$/£Þð12:1ÞThis is because there is an expected gain from sellingthe pounds in the future at a higher spot price thanwill be paid when taking delivery of the poundsunder the forward contract. Similarly, ifF 1/4 ð$/£Þ > S 1/4 ð$/£Þð12:2Þrisk-neutral speculators will sell pounds forwardand expect to gain by buying pounds spot when it istime to deliver the pounds on the forward contract.With speculation occurring whenever inequality(12.1) or (12.2) holds, and with this speculationforcing the forward rate towards the expectedfuture spot rate, risk-neutral speculation and zerotransactioncosts ensure thatF 1/4 ð$/£Þ ¼S 1/4 ð$/£Þð12:3Þ8 If we were instead to consider the expected cost of hedgingpound receivables, the expected cost of hedging would beF 1/4 ($/bid£) S 1/4 ($/bid£).
HEDGING RISK AND EXPOSUREEXHIBIT 12.2DIFFERENT CORPORATE CHOICES OVER HEDGINGFirms facing foreign exchange exposure should decideat the highest managerial level what their corporatepolicy is on the matter, and convey this policy first andforemost to those in charge of treasury operations.Since sales, investment, borrowing and procurementcan all affect a company’s exposure to foreignexchange risk, the decision that top-level managementmakes on what the company is to do withexposure should have wide distribution. Furthermore,the chosen policy should be periodically reviewed.In the review, a comparison of what would havehappened with different foreign exchange protocolswould provide useful input to the decision of whetheror not to change the company policy.The first matter that should enter the policy decisionis how large is the company’s exposure relative tothe size of the company. This will in turn affect thecontribution of exchange-rate variations to the overallvolatility of company earnings or to the marketvalue of the company. If it is determined thatexchange rates are a minor matter compared to otherinfluences on the company’s performance, the policycould easily be to leave matters alone. Alternatively, itmight be decided that only transactions greater than apre-selected size need to be hedged. Of course, since itis the company’s overall exposure that counts, longand short exposures would need to be considered atthe same time.If it is decided to do nothing the company shouldexpect to gain sometimes and to lose at other timesfrom changes in exchange rates. On average over along period of time the gains and losses should averageout to zero. For example, in the time betweencontracting to make a payment for inputs and makingthe payment the foreign currency may go up or down,and in a rational market each direction should haveequal probability. Some people think the zero averagehides a lot of what might be going on. Indeed, economistshave been criticized for having one foot in thefreezer and one foot in the oven and saying that onaverage things are just about right! This is why thedetermination of company policy should depend onhow much variation in performance might possiblyoccur. It is only if the company feels it can live withthe ups and downs that it should leave forex riskmanagement alone.Since there will be losses if the policy is to nothedge, one factor that is relevant is whether thecompany has good enough credit to carry itself overuntil things improve, or whether it has sufficientcapitalization to handle anything that is likely to hit it.Another consideration is the length of the cycles overwhich exchange rates tend to travel. If the swings arelong, then there could be lengthy periods of forexlosses to deal with, and a policy of hedging makesmore sense. If exchange rates just bob up and down,the company might decide to ride it out. Casualobservation of exchange rate cycles of major currenciesseems to show quite long waves which shouldresult in sober thought among those who must decideon the corporate policy.Foreign exchange risk on receivables and payablesmatters because of delays between agreeing on salesor purchases and receiving or making payment.Therefore, at least as far as these simple types ofexposures are concerned, the amount of delay betweencontracting and payment needs to be included in whatthe protocol is to be. The longer the delays, the moreexchange rates might change and consequently thebigger the impacts might be.Unfortunately, not all exposures are as simple asthose on accounts receivable and payable. In the caseof exposure on assets and liabilities a critical elementis the correlation between exchange rates and asset/liability prices. These correlations have to be calculated,a matter made most difficult by the fact that thecorrelations change over time. Even worse is theexposure on operations. Operating exposure dependson the price sensitivity of a company’s product market.Some companies have an ability to pass on any priceincreases that might be prompted by changes inexchange rates. The ability to do this is sometimesreferred to as ‘‘pass through.’’ Others companies areprice takers. Production costs vary with exchange261 &
MANAGING FOREIGN EXCHANGE RISK AND EXPOSURErates, even when inputs are not imported fromoverseas. This is because tradable inputs from acompany’s home market can be influenced by ups anddowns of currencies. Fortunately, the uncertainty inwhat the exposure and risks are can often be reducedby careful analysis, although some uncertainly isalmost certain to remain even when the matter iscarefully studied.Foreign exchange risk not only depends on exposure,but also on the volatility of exchange rates.Consequently, when a company is dealing in anenvironment where exchange rates are fixed andseem likely to remain fixed, there is little need topay a great deal of attention to the matter. Therehave been times when a company could count ona currency moving in at most a very narrow band,at least in the period between agreeing on a sale orpurchase and the payments being made. The HongKong dollar has not changed in value against theUS dollar for nearly two decades. With their hugeforeign exchange reserves and restrictions on whocan buy and sell their currency, the People’sRepublic of China has been able to enjoy long periodsof exchange-rate stability. This has enabled Chinesecompanies to do business without great fear ofexchange-rate losses.Clearly, different companies are in different positionsas far as exchange rate exposure and risk areconcerned. The challenge is to find what that positionis and what if anything to do about it.as was shown in Chapter 3. That is, with riskneutralspeculation and zero-transaction costs theexpected cost of hedging is zero. 9It is clear that for there to be an expected cost ofhedging, one or both of the assumptions made inarriving at equation (12.3) must be invalid. Theseassumptions were:1 Speculators are risk-neutral.2 There are no transaction costs.As it turns out, only the transaction-cost assumptionis relevant for the existence of an expected cost offorward hedging. Let us see why.Risk premiums on forward contractsIf speculators are risk-averse, they may notbuy forward when the inequality (12.1) holds orsell forward when (12.2) holds. This is because9 This has given rise to the view that forward hedging is a‘‘free lunch.’’ See Andre F. Perold and Evan C. Shulman,‘‘The Free Lunch in Currency Hedging: Implications forPolicy and Performance Standards,’’ Financial AnalystsJournal, May/June 1988, pp. 45–50.& 262with risk aversion, speculators will requirean expected return for taking risk. This expectedreturn is equal to the difference betweenF 1/4 ($/£) and S 1/4 ($/£). That is, risk aversionmay result in a risk premium in the forwardexchange rate; the risk premium is equal tothe expected cost of hedging, assuming zerotransactioncosts.Of course, there is no reason a priori why theneed for a risk premium would result in inequality(12.2) holding rather than (12.1). The situation thatprevails depends on how the forward marketis imbalanced without any speculation occurring.For example, if forward purchases and sales ofpounds from the combined hedging activities ofimporters, exporters, borrowers, investors, andinterest arbitragers result in a net excess demand forforward pounds, then speculators will have to bedrawn in to be sellers of forward pounds; otherwise,the forward exchange market will not be inequilibrium with supply equal to demand. In thiscase speculators will need an expected return fromselling pounds forward, causing inequality (12.2)to be an equilibrium situation; with speculatorsselling pounds forward for more than the expectedfuture spot value of the pound, speculators collect
HEDGING RISK AND EXPOSUREa forward risk premium. 10 Similarly, if there is anexcess supply of forward pounds without the actionof speculators, they will have to be induced todemand pounds forward to balance the market. Inthis case there will be a forward discount on thepound – forward premium on the dollar – to inducespeculators to buy pounds forward. The forwarddiscount, that is, a forward price of pounds belowthe expected future spot price, provides speculatorswith an expected return, in the form of a riskpremium, from buying pounds forward. However,the presence of such a risk premium is irrelevant forthe hedging decision, for the following reason.If there is an expected cost of hedging whenbuying pounds forward because F 1/4 ($/£) >S 1/4 ($/£), the risk premium earned by the speculatorswho sell pounds forward must be justappropriate for the risk they take; otherwise, morespeculators would enter the market to sell poundsforward. If the hedgers who buy pounds forwardhave the same risk concerns as the speculators whosell them pounds forward, the hedgers receive abenefit that equals the expected cost. That is, therisk premium is paid by hedgers when buyingpounds forward because this reduces risk to thehedger, just as it adds to the risk of the speculator.This means that if a company’s shareholders aretypical in their attitude towards the pound, the riskpremium paid to buy (or sell) pounds forwardcomes with an offsetting benefit: there is a risk premiumwhich just compensates for the risk aversion.As a result of the offsetting of the expected cost ofhedging and the benefit of risk reduction, the presenceof the forward risk premium is irrelevant indeciding whether to hedge forward. 1110 The nature of the forward-market equilibrium, withspeculators earning a premium for taking up imbalancesin the forward market from the activities of hedgers, isdescribed in Maurice D. Levi, ‘‘Spot versus ForwardSpeculation and Hedging: A Diagrammatic Exposition,’’Journal of <strong>International</strong> Money and <strong>Finance</strong>, April 1984,pp. 105–09.11 In reality, speculators and hedgers are not similar in theirattitude to risk, and so both can gain by taking oppositepositions in the forward market.Transaction costs in forward versusspot exchange marketsWhereas the presence of a risk premium isirrelevant to the forward-hedging decision, this isnot the case for transaction costs, because transactioncosts constitute an expected cost of hedging.This cost arises because the bid-ask spreads onforward exchange are larger than those on spotexchange. It might be argued that the bid-ask spreadis larger on forward than on spot transactionsbecause forward trading is riskier than spot trading,thereby basing the risk-premium and transactioncostarguments both on the same source, namely,risk. However, in principle we might distinguishtwo types of risk. One risk is that faced by speculatorswho maintain open positions over intervalsof time before the contracts mature, the openpositions being needed to balance the aggregatesupply of, and demand for, forward exchange(the mirror image of the imbalance of forwardcontracts being absorbed by speculators consists ofthe net holdings of forward contracts by hedgers).The other type of risk is that of banks quotingforward buy and sell rates in the open-bid market,each bank knowing it cannot ensure balance ofbuy and sell orders at every moment in time. Theformer risk will cause what we have called a riskpremium, while the latter risk will cause a largerbid-ask spread on forward than on spot transactions.Of course, both risks are related to uncertainty inexchange rates, and they differ only in the period oftime over which the risk is faced.The preceding discussion means that even if inthe absence of transaction costs it were the case thatF 1/4 ð$/£Þ ¼S 1/4 ð$/£Þð12:3Þ(i.e. there is no risk premium), it would still be thecase with transaction costs thatF 1/4 ð$/ask£Þ > S 1/4 ð$/ask£ÞThat is, transaction costs make the forward price forbuying pounds higher than the expected future spot263 &
MANAGING FOREIGN EXCHANGE RISK AND EXPOSUREprice of pounds. At the same time, we wouldexpect transaction costs to result inF 1/4 ð$/bid£Þ < S 1/4 ð$/bid£ÞThat is, the number of dollars received from sellingpounds forward will be less than the expectednumber of dollars to be received from pounds bywaiting and selling the pounds spot. While thelarger spread on forward than on spot transactionsdoes mean an expected cost of forward hedging, thisexpected cost is small. This is because the expectedtransaction cost of buying pounds forward versuswaiting and buying them spot is only the differencebetween the two transaction costs; a transactioncost is paid to buy the pounds whether they arebought forward, or bought spot when needed.Similarly, the expected cost of selling poundsforward rather than waiting and selling them spotis only the difference between the two transactioncosts.To quantify the cost, consider the choicebetween buying and also selling forward on the onehand, and buying and also selling spot on the otherhand. Then the extra expected cost of forwards is:½F 1/4 ð$/ask£Þ F 1/4 ð$/bid£ÞŠ½S 1/4 ð$/ask£Þ S 1/4 ð$/bid£ÞŠThis is the expected cost of buying and sellingforward versus buying and selling spot: it is positivebecause the forward bid-ask spread is larger than thespot bid-ask spread. Therefore, to calculate the costof just buying forward versus buying spot, or of justselling forward versus selling spot, we take half ofthe amount above. That is, the expected cost ofusing the forward versus the spot market when justbuying or when just selling foreign currency is:12 ½F 1/4ð$/ask£Þ F 1/4 ð$/bid£ÞŠ½S 1/4 ð$/ask£Þ S 1/4 ð$/bid£ÞŠThat is, the expected cost of forward hedging is onehalf of the difference between the forward spreadand the spot spread. The longer the maturityforward, the greater will be the expected cost.& 264It is relatively easy to find this expected cost ofhedging because it is possible to ask a bank what itsspot and forward buy and sell rates are every nowand again. Spreads do not change much over time,and therefore finding the expected cost of hedgingdoes not require calling the bank very often.However, the spread will depend on the size oftransaction as well as the distance into the future ofthe forward quote. A conversation with the bankon normal spreads that relate to different amountsof currency and a range of maturities should givea company a good sense of the expected cost ofhedging. 12The second reason why the expected cost ofhedging is small is because banks that buy and sellforward can readily hedge their positions. That is,the bid-ask spread on forward exchange is not dueto the risk of changes in exchange rates over thematurity of the forward contract. Rather, it is due tothe risk of changes in exchange rates while coveringa position the bank has taken by having to quote inthe open-bid market. This risk is higher in forwardthan in spot markets because forward markets arethinner. 13 However, the market for short maturitycontracts is almost as deep as the spot market, andso the spreads on forward contracts used for hedgingimporters’ and exporters’ receivables andpayables – which are typically three months or less –are only slightly higher than those on spot transactions.This makes the size of the spread differencebetween spot and forward exchange a small amount.THE BENEFIT OF FORWARD HEDGINGWhat we have found is that the possibility of a riskpremium on forward contracts is irrelevant becausethe expected cost of hedging is matched by a benefit,and that transaction costs constitute only a small12 The forward spread is likely to be higher in very turbulenttimes because banks take on more risk due to the nature ofthe open-bid quotations in the interbank market. However,while the expected cost of hedging is high in turbulenttimes, so is the benefit from hedging.13 This was mentioned in Chapter 3.
HEDGING RISK AND EXPOSURE& Table 12.1 Dollar payments on £1-million accounts payable using different hedging techniquesTechniqueDollar payment, millionsRate a ¼ 1.3 1.4 1.5 1.6 1.7 $/£Unhedged 1.3 1.4 1.5 1.6 1.7Forward £ purchase @ 1.5£ 1.5 1.5 1.5 1.5 1.5Futures £ purchase @ 1.5£ 1.5 1.5 1.5 1.5 1.5$1.50/£ call option @ $0.06/£ 1.36 1.46 1.56 1.56 1.56$1.40/£ call option @ $0.12£ 1.42 1.52 1.52 1.52 1.52$1.60/£ call option @ $0.02/£ 1.32 1.42 1.52 1.62 1.62Notea Realized future spot exchange rates.cost of hedging via forward exchange. That is, thereis an expected cost of buying or selling forwardrather than waiting and buying or selling spot, but itis a relatively small cost. But what about the benefitof buying or selling forward? As we have explainedearlier in this chapter, there are several benefits offorward hedging which are enjoyed if managementhedges foreign exchange exposure. For example,forward hedging reduces taxes if tax rates areprogressive, reduces expected bankruptcy costs,reduces refinancing costs, has marketing and hiringbenefits, and can improve information on profitcenters and subsidiary performance. These benefitsaccrue because hedging reduces the volatility ofreceipts, payments, and profits. Let us show howforward hedging reduces volatility within the contextof our example of Aviva having agreed to pay£1 million due in 3 months.If Aviva does not hedge its £1 million accountpayable in 3 months, the dollar cost of the poundswill depend on the realized spot exchange rate at thetime of settlement. The possible payments resultingfrom remaining unhedged are shown in the top lineof Table 12.1. If instead of being unhedged Avivadecides to buy forward at $1.50/£, the cost of thepounds is $1.5 million, regardless of what happensto the spot rate by the time of settlement. This isshown on the second line of Table 12.1. Comparingthe certain payment of $1.5 million via the forwardcontract with the uncertain payment if Aviva waitsand buys pounds spot, we see that ex post it issometimes better to hedge and sometimes betternot to hedge. However, since by considering thevarious possibilities or ‘‘states’’ we find the gainsfrom hedging balance the losses from hedging, theaverage or expected cost of the pounds is the samewith forward and spot purchase of pounds. 14 Let usmake this our base case against which to comparealternative ways of hedging. Let us consider nexthedging via the currency futures market.Hedging via the futures marketIf Aviva decides to hedge its pound payables exposurein the futures market and buys £1 million offutures contracts, it is necessary to post a margin. Ifsubsequent to buying the futures contracts the priceof these contracts declines, it may be necessary toadd to the margin account. 15 Alternatively, if thefutures price increases, the margin account iscredited by the amount gained. This addition orsubtraction to the margin account is done on a dailybasis and is called marking to market, as we said inChapter 4. What marking to market means is that if,for example, the pound increases in value more thanhad been anticipated in the original pricing of thefutures contract, at the maturity of the contract14 The average of $1.3 million, $1.4 million, $1.5 million,$1.6 million, and $1.7 million, with equal probabilities ofall outcomes, equals $1.5 million. Of course, this outcomeis the result of assuming a zero expected hedging cost indetermining the forward rate.15 As mentioned in Chapter 4, it is necessary to supplementthe margin only if it falls below the maintenance level.265 &
MANAGING FOREIGN EXCHANGE RISK AND EXPOSUREthe margin account will include the value of theunanticipated increase in the value of the poundsrepresented by the futures contracts, as well as theoriginal margin.The gain or loss from buying pound futurescontracts rather than waiting to buy spot poundsis the amount added to or taken from the margin.A gain made on a futures contract can be puttowards buying the pounds on the spot market.As we saw in Chapter 4, the net result of payinga higher-than-anticipated spot rate for the pounds,and the gain made on the futures contracts when thespot rate ends up higher than was anticipated, is toend up paying approximately the same for thepounds as if a forward contract had been purchased.For example, if, in the pricing of the futures contractsfor £1 million, the expected future spotexchange rate had implicitly been $1.5/£, and itturns out at the maturity date of the futures contractsthat the actual spot rate is $1.7/£, then ifAviva buys futures it will find it has gained about$200,000initsmarginaccount.Avivawill,ofcourse,have to pay $1.7 million for the £1 million pounds itneeds, rather than $1.5 million that would havebeen paid with a forward contract. However, afterthe compensating gain in the margin account, Avivawill be paying only approximately $1.5 million, thesame as if the pounds had been purchased on theforward market. On the other hand, if the expectedfuture spot rate had been $1.5/£, but the actualspot rate ended up at $1.3/£, Aviva would find ithad contributed $200,000 to its margin account.Aviva would then buy the required £1 million for$1.3 million at the going spot rate, making the totalcost of pounds $1.5 million. We find that whateverhappens to the spot rate, Aviva pays approximately$1.5 million for its £1 million. A differencebetween using the forward and futures markets isthat in the forward market all the payment is madeat the end, whereas with the futures market someof the payment or compensation received occursbefore the pounds are eventually bought at thespot rate.As we explained in Chapter 4, because interestrates vary over time, it is possible that the amount& 266in the margin account at the maturity of the futurescontract, or the amount paid into the accountand lost, does not bring the eventual price of the£1 million to exactly $1.5 million. For example, ifinterest rates are low when the margin account hasa large amount in it and high when the marginaccount goes below the maintenance level, it couldbe that slightly more than $1.5 million is paid forthe pounds. Alternatively, varying interest ratescould make the eventual cost of the pounds slightlyless than $1.5 million. This is the markingto-marketrisk of futures contracts discussed inChapter 4. Because of this risk, in Table 12.1 wewrite the cost of the £1 million when using thefutures market as $1.5 million.Hedging via the options marketIf Aviva buys call options on pounds at a strike priceof $1.50/£, the options will be exercised if the spotrate for the pound ends up above $1.50/£. Theoptions to buy pounds will not be exercised ifthe spot rate for the pound is below $1.50/£,because it will be cheaper to buy the pounds at thespot rate; the option has no exercise value at maturity.Table 12.1 shows the result of buying £1 millionof $1.50/£ strike-price call options if the optionpremium, that is, the option price, is $0.06/£. Atthis option premium the cost of the option for £1million is £1 million $0.06/£ ¼ $60,000. Let usexamine the entries in Table 12.1 for the $1.50/£call option to see how the entries are obtained.If the realized spot rate at the time of paymentis $1.30/£, then the $1.50/£ strike-price calloption will not be exercised, and the pounds willbe bought spot for $1.3 million. However,$60,000 has been paid for the option, so we canthink of the pounds as having a total cost of $1.36million, as shown in Table 12.1. 16 Similarly, if thespot rate ends up at $1.40/£, the total cost of the16 Our description is directly applicable to options on spotexchange, such as those trading on the Philadelphia StockExchange. For simplicity we exclude the opportunity costof forgone interest on the payment for the option contract.
HEDGING RISK AND EXPOSUREpounds including the option premium is $1.46million. If the spot rate is the same as the strikerate, both $1.50/£, then Aviva will be as well offto exercise as to buy spot, and in either case thetotal cost of pounds is $1.56 million. If the spotrate ends up at $1.60/£ or $1.70/£, Aviva willexercise and pay the call rate of $1.50/£, whichwith the option premium included, brings thetotal cost of the pounds to $1.56 million.It is clear from examining Table 12.1 that thebenefit of buying a call option on the pound whenthere is a pound payable is that it puts a ceiling onthe amount that is paid for the pounds but allows theoption buyer to benefit if the exchange rate ends upbelow the strike rate. It can similarly be demonstratedthat if a firm has a receivable in pounds, bybuying a put option it can ensure that a minimumnumber of dollars is received for the pounds, andyet can still benefit if the dollar value of the poundends up higher than the strike rate.Let us suppose that instead of buying a call optionat a strike price of $1.50/£, Aviva buys one at astrike price of $1.40/£, which, if the spot rate at thetime of buying the option is above $1.40/£, is anin-the-money option. Table 12.1 shows the effect ofbuying this option if it costs $0.12/£.Aviva will not exercise the $1.40/£ call option ifthe eventually realized spot rate is $1.30/£.Instead, it will buy the pounds spot for $1.3 million.Adding the $0.12/£ £1 million ¼ $120,000 priceof the option gives a total cost for the £1 million of$1.42 million. At a realized spot rate of $1.40/£Aviva will be indifferent between exercising theoption and buying spot. Either way the pounds willcost $1.52 million, including the cost of the option.At any spot rate above $1.40/£, the $1.40/£ calloption will be exercised, and whatever the spot ratehappens to be, the cost of the pounds is $1.40million. When we include the amount paid for theoption, this brings the cost to $1.52 million.If Aviva chooses a $1.60/£ call option – which, ifthe spot rate of the pound at the time it is purchasedis below this value, is an out-of-the-money option –and if the option premium is $0.02/£, then theeffect is as shown on the bottom line of Table 12.1.These values are obtained in a similar fashion tothose for the other options, recognizing that theoption is exercised only when the spot rate ends upabove $1.60/£.A comparison of the effects of the differentstrike-priceoptions and of using options versusforwards and futures can be made by looking alongeach row in Table 12.1. We can see that with theexposure of a payable in pounds, the out-of-themoneyoption (that with a strike price of $1.60/£)turns out to have been the best option hedge if thepound ends up at a low value, but the in-the-moneyoption (that with a strike price of $1.40/£) is best ifthe pound ends up at a high value. The at-the-moneyoption is somewhere in between. All options arebetter than forwards and futures if the pound endsup very low, but options are worse if the pound endsup high. If the pound ends up at its expected value,$1.50/£, having used forwards or futures is ex post alittle cheaper than having used options: the paymentfor the option time value is avoided.Hedging via borrowing and lending: swapsIn the discussion of interest parity in Chapter 8 wepointed out that it is possible to use borrowing,investing, and the spot exchange market to achievethe same result as would be obtained by using theforward market. For example, Aviva can hedge itsimport of £1 million of denim fabric with paymentdue in 3 months by borrowing dollars immediately,buying pounds spot with the borrowed dollars,and investing the pounds for 3 months in a pounddenominatedsecurity. If this is done, then in3 months Aviva has to pay a known number ofdollars – the repayment of its dollar loan – andreceives a known number of pounds. This is thesame as with a forward contract. Let us consider thecost of hedging via borrowing and lending so thatwe can compare it with the cost of the forwardmarket. We will use the notation introduced inChapter 8 and will be careful to distinguish betweenborrowing and lending interest rates on the onehand, and between bid- and ask-exchange rates onthe other.267 &
MANAGING FOREIGN EXCHANGE RISK AND EXPOSUREFor every £1 Aviva wants in n years’ time, wheren ¼ 1 4in our particular example, the company mustpurchase1£ð1 þ r I £ Þnð12:4Þon the spot market. Here r I £ is the interest rate thepounds will earn – the pound investment rate – inthe chosen pound-denominated security. Forexample, if r I £ ¼ 0:12, then if Aviva buys £970,874immediately and invests it at 12 percent, it willreceive £1 million in 3 months. The dollar cost ofthe spot pounds in equation (12.4) is1$Sð$/ask£Þð1 þ r I £ Þnð12:5Þwhere S($/ask£) is the cost of buying pounds spotfrom the bank. If the number of dollars in equation(12.5) has to be borrowed, then in n years Avivawill have to pay for each pound$Sð$/ask£Þ ð1 þ rB $ Þnð1 þ r I £ Þnð12:6Þwhere r B $ is Aviva’s US dollar borrowing rate.17We should recall that this hedging techniqueinvolves:1 borrowing, if necessary, in home currency;2 buying the foreign exchange on the spotmarket;3 investing the foreign exchange;4 repaying the domestic-currency debt.Clearly, if the value in equation (12.6) is the sameas the forward exchange rate for buying the poundsn years ahead, F n ($/ask£), then Aviva will beindifferent to the choices of buying forward andgoing through this borrowing-investment hedging17 If Aviva does not have to borrow because it has the dollars,we use Aviva’s opportunity cost of dollars used to buypounds now, r I $ , in place of rB $ .& 268procedure. Indifference between these two hedgingmethods therefore requires thatorSð$/ask£Þ ð1 þ rB $ Þnð1 þ r I £ Þn ¼ F n ð$/ask£Þð1 þ r B $ Þn ¼ F nð$/ask£ÞSð$/ask£Þ ð1 þ rI £ Þnð12:7Þð12:8ÞEquation (12.8) is one of the forms of the interestparitycondition. We find that when interest parityholds, an importer should not care whether he orshe hedges by buying forward or by borrowingdomestic currency and investing in the neededforeign currency. However, we note that sinceequation (12.7) involves a borrowing-investmentspread – r B $ versus rI £ – interest parity may not holdexactly in this form. Specifically, because, ceterisparibus, r B $ is high relative to rI $ as a result of borrowinginterest rates exceeding investment interestrates, we expect the forward cost F n ($/ask£) to besmaller than S($/ask£)(1 þ r B $ )n /(1 þ r I £ )n . Thiswould favor the use of forwards versus a swap.Borrowing and investing can also be used byan exporter to hedge foreign exchange exposure.The exporter does the reverse of the importer.For example, if Aviva is to receive foreign currencyfor its jeans, it can sell it forward. Alternatively,it can1 borrow in the foreign currency that is to bereceived;2 sell the borrowed foreign currency spot fordollars;3 invest or otherwise employ the dollars athome;4 repay the foreign-currency debt with itsexport earnings when they are received.Since the foreign-currency debt will offset the foreignexchange proceeds on its exports, Aviva willnot have foreign exchange exposure or risk. Theamount borrowed should be such that the amountneeded to repay the debt is equal to the export
HEDGING RISK AND EXPOSURErevenues that are to be received. If, for example, spread, the left-hand side of equation (12.10)between selling them forward and using a swap. Congress of Accountants, Washington, DC, October1992, pp. l3A.l–12.However, as before we note that, ceteris paribus, withr B $ high relative to rI $ from the borrowing-investment 20 The fact that this method has been overlooked became clearfrom a survey of firms conducted by Business <strong>International</strong>.payment is due in n years, Aviva should borrow is likely to be low vis-à-vis the right-hand side ofequation (12.10), that is, F n ($/bid£). 19 Thus, more1£dollars are received from selling the pounds forwardð1 þ r B £ Þnthan by using the swap arrangement.for each pound it is due to receive; this will leaveAviva owing £1 in n years. 18 This number of pounds Hedging via currency of invoicingwill be exchanged forWhile it is usually a simple matter to arrange hedgingvia forwards, futures, options, or swaps, we1$Sð$/bid£Þð1 þ r B £ Þnshould not overlook an obvious way for importersor exporters to avoid exposure, namely, by invoicingof dollars, where we use the bid rate on poundsbecause the borrowed pounds are sold when theyare received. When invested in US dollar securitiesthis will providetrade in their own currency. 20 For example, ifAviva can negotiate the price of its imported denimcloth in terms of US dollars, it need not face anyforeign exchange risk or exposure on its imports.Indeed, in general, when business convention or the$Sð$/bid£Þ ð1 þ rI $ Þnpower that a firm holds in negotiating its purchasesð1 þ r B ð12:9Þ£ Þnand sales results in agreement on prices in terms ofthe home currency, the firm that trades abroad willat the time that payment for the jeans is received.The alternative is to sell the foreign pound receiptson the forward market at F n ($/bid£). Clearly, anexporter will be indifferent between selling theforeign-currency proceeds forward, and borrowingthe foreign-currency and investing in domesticcurrency whenface no more receivables and payables exposurethan the firm with strictly domestic interests.However, even when trade can be denominatedin the importer’s or exporter’s local currency, onlypart of the risk and exposure is resolved. Forexample, an American exporter who charges forhis or her products in US dollars will still find theSð$/bid£Þ ð1 þ rI $ Þnð1 þ r B ¼ F n ð$/bid£Þ£ Þn ð12:10Þlevel of sales dependent on the exchange rate, andhence faces operating exposure and risk. This isbecause the quantity of exports depends on the pricethe foreign buyer must pay, and this is determinedorby the rate of exchange between the dollar andthe buyer’s currency. Therefore, even when allð1 þ r I $ Þn ¼ F nð$/bid£ÞSð$/bid£Þ ð1 þ rB £ Þn ð12:11Þ19 For more on how borrowing-investment spreads andcurrency transaction costs affect costs of alternativeEquation (12.11) is another form of interest parity. hedging techniques, see Maurice D. Levi, ‘‘<strong>International</strong>Again, we conclude that if interest parity holds in Financing: Currency of Issue and Management of Foreignthis form, exporters receiving pounds are indifferent Exposure,’’ World Congress Proceedings, 14th WorldSee ‘‘Altering the Currency of Billing: A Neglected18 You can think of this as the present value of the amountowing.Technique for Exposure Management,’’ Money Report,Business <strong>International</strong>, January 2, 1981, pp. 1–2.269 &
MANAGING FOREIGN EXCHANGE RISK AND EXPOSUREtrade is in local currency, some foreign exchangeexposure – operating exposure – will remain.Of course, only one side of an international dealcan be hedged by stating the price in the importer’sor exporter’s currency. If the importer has his orher way, the exporter will face the exchange riskand exposure, and vice versa.When there is international bidding for a contract,it may be wise for the company calling for bidsto allow the bidders to state prices in their owncurrencies. For example, if Aviva invites bids tosupply it with denim cloth, Aviva may be better offallowing the bids to come in stated in pounds,euros, and so on, rather than insisting on dollarbids. The reason is that the bidders cannot easilyhedge because they do not know if their bids willsucceed (they can use options, but options contractsfrom options exchanges are contingent on futurespot exchange rates rather than the success of bidsfor orders, and so are not ideally suited for thepurpose). When all the foreign-currency-pricedbids are in, Aviva can convert them into dollars atthe going forward exchange rates, choose thecheapest bid, and then buy the appropriate foreigncurrency at the time it announces the successfulbidder. This is a case of asymmetric information,where the buyer can hedge and the seller cannot,and where the seller may therefore add a risk premiumto the bid. When the seller is inviting bids, aswhen equipment or a company is up for sale, theseller knows more than the buyer, and so biddingshould be in the buyer’s currency. The seller canconvert the foreign-currency bids into their owncurrency, choose the highest bid, and then sell theforeign currency forward at the same time as theyinform the successful bidder.When hedging is difficult because tenderingcompanies insist on being quoted in their owncurrency, the shorter is the cycle between quotingprices and contracts being signed, the smaller is thebidder’s risk. The tendering company might bearthis in mind, knowing that a short cycle betweenreceiving quotes and announcing winners couldtranslate into lower prices: the bidding companymay translate lower risk into lower quotes.& 270So far we have considered situations in which allof the exposure is faced by the importer or theexporter. However, another way of hedging, atleast partially, is to mix the currencies of trade.Hedging via mixed-currency invoicingIf the British mill were to invoice its denim at£1 million, Aviva would face the exchange exposure.If instead Aviva agreed to pay the equivalent indollars, for example, $1.5 million, then it would bethe British mill that accepted the exposure. Inbetween these two extreme positions is the possibilityof setting the price at, for example, £500,000plus $750,000. That is, payment could be statedpartly in each of the two currencies. If this weredone and the exchange rate between dollars andpounds varied, Aviva’s exposure would involveonly half of the funds payable – those that arepayable in pounds. Similarly, the British mill wouldface exposure on only the dollar component of itsreceivables.The mixing of currencies in denominating salescontracts can go further than a simple sharingbetween the units of currency of the importer andexporter. It is possible, for example, to express acommercial agreement in terms of a compositecurrency unit – a unit that is formed from manydifferent currencies. A prominent composite unit isthe Special Drawing Right, or SDR. This unit isconstructed by taking a weighted average of five ofthe major world currencies. Another officiallymaintained currency unit is the European CurrencyUnit (ECU), which consists of an average of theexchange rates of all the European Union countries,not just those in the Euro-zone: the ECU includes,for example, the British pound and Swedish crown.Besides the official SDR and ECU units, there areprivate currency baskets, or cocktails, which arealso designed to have a relatively steady value. Theyare formed by various weighted averages ofa number of different currencies.The composite currency units will reduce riskand exposure because they offer some diversificationbenefits. However, they cannot eliminate risk
HEDGING RISK AND EXPOSUREand exposure as can a forward contract, and theythemselves can be difficult to hedge forward. It isperhaps because of this that cocktails and baskets arenot as common in denominating trade, where forward,futures, options, and swaps are frequentlyavailable, as they are in denominating long-termdebt, where these other hedging techniques are notas readily available.A large fraction of the world’s trade is, byconvention and for convenience, conducted in USdollars. This is an advantage for American importersand exporters in that it helps them avoid exchangerateexposure on receivables and payables. 21However, when the US dollar is used in an agreementbetween two non-American parties, bothparties experience exposure. This situation occursoften. For example, a Japanese firm may purchaseCanadian raw materials at a price denominated inUS dollars. Often both parties can hedge, forexample, by engaging in forward exchange contracts.The Japanese importer can buy and theCanadian exporter can sell the US dollars forwardagainst their own currencies. In the case of some ofthe smaller countries where foreign business is oftenexpressed in dollar terms, there may not be regularforward, futures, options, or swap markets in thecountry’s currency. However, the denomination oftrade in US dollars might still be seen as a way ofreducing exposure and risk if the firms have offsettingbusiness in the dollar, or view the dollar asless volatile in value than the currency of eitherparty involved in the trade.Hedging according to predictiveaccuracy of cash flowsWhile we have spoken as if foreign-currencyreceivables or payables are known with certainty,this may not be the case. It may well be that acompany knows with great accuracy what is to bereceived or paid in the next 30 days, because settlementpractices may be to pay invoices within21 As we have repeatedly said, US firms face operatingexposure irrespective of the currency of invoicing.30 days. However, the amount to be received orpaid more than 30 days in the future may not bequite so well known. These amounts will depend onsales and purchases yet to be made. Some sales andpurchases might be relatively certain, being theresult of ongoing discussions: they may be awaitingsettlement of a few technical details or even sittingon a manager’s desk waiting for a final signature. Insuch a case, a company may hedge all the amount tobe paid or received. Other sales or purchases maybe less certain. Perhaps negotiations are ongoing,with the final decision still in some doubt. In such asituation, it may be prudent to nevertheless hedge,but perhaps not 100 percent of what is paid orreceived if the deal is completed. Perhaps the hedgecould be 50 percent or 75 percent depending on thelikelihood that the payable or receivable will occur.A company could consider establishing a hedgingprotocol. This might be to hedge all already contractedamounts, 90 percent of highly likely amounts,75 percent of probable amounts, 50 percent ofreasonable expected amounts, and so on. It shouldbe pointed out, however, that this just applies toreceivables and payables, and really hedging shouldbe based on the effects of exchange rates on thevalue of a company as explained in Chapter 9 – ifindeed hedging is deemed by management to be inthe interest of shareholders.Hedging via selection of supplyingcountry: sourcingA firm that can invoice its inputs in the same currencyas it sells its goods can offset foreign-currencypayables against receivables. This type of hedgingpractice is called sourcing. For example, AvivaCorporation might buy its denim cloth in the currenciesin which it sells its jeans. If about one half ofthe wholesale value of jeans is the value of thematerial, then on each pair of jeans the firm has onlyabout one half of the foreign exchange exposure ofthe jeans themselves. Aviva could buy the denim inthe various currencies in rough proportion to thevolume of sales in those currencies. Sourcing canalso involve the use of local labor. For example,271 &
MANAGING FOREIGN EXCHANGE RISK AND EXPOSURElarge multinational accounting, marketing, andconsulting firms use staff in local offices. Theseemployees are paid in the currency of the projectsand hence reduce foreign exchange exposure.The risk-reducing technique of buying inputs inthe currencies in which outputs are sold has a cleardisadvantage: Aviva should buy its denim where thematerial is cheapest, and it should not pay more forits cloth just to avoid foreign exchange exposure.However, after an input source has been chosen atthe best price, there will be some automatic hedgingoccurring in that currency. For example, if Avivasettles on buying its denim in Britain because thecloth is cheapest there, the total value of the jeansthat it sells in that market should be netted againstits denim purchases.Now that we have explained the different techniquesthat are available for hedging exposure, wecan consider their different consequences. This canbe done most easily by examining payoff profiles,which, as we saw in Chapters 3 and 4, showgraphically the rewards and/or costs of selectingdifferent methods of hedging.FINANCIAL ENGINEERING: PAYOFFPROFILES OF DIFFERENT HEDGINGTECHNIQUESForward profileAs before, let us assume the expected future spotrate is $1.50/£. Then the difference between therealized spot rate and this expected rate is theunanticipated change in the exchange rate, whichwe have previously written as DS u .When the expected spot rate for 3 months aheadis $1.50/£, and the spot rate indeed turns out to be$1.50/£, if Aviva has bought pounds forward at$1.50/£, the forward contract has a value of zero.Let us write this as DV ¼ 0, where we can thinkof DV as the gain or loss by having purchasedthe forward contract. If instead of $1.50/£, therealized spot rate happens to be $1.70/£ so thatDS u ¼ $0.2/£, Aviva’s forward contract to buy£1 million at $1.50/£ is worth $0.2/£ £1million ¼ $0.2 million. Then we can write DV as$0.2 million. Alternatively, if for example, therealized spot rate is $1.30/£ so that DS u ¼ $0.2/£,then Aviva’s $1.50/£ contract has a negativevalue of $0.2/£ £1 million ¼ $0.2 million,because forward contracts, unlike options, mustbe honored. These and other values of DV areshown against the unanticipated changes in spotrates that bring them about in the first column ofTable 12.2.The values of DV and DS u for the £l-millionforward contract at $1.50/£ are plotted againsteach other in the left-hand panel of Figure 12.1a.We find an upward-sloping line because the forwardcontract has positive value when the pound experiencesunanticipated appreciation (DS u > 0) andnegative value when the pound experiencesunanticipated depreciation (DS u < 0).The middle panel of Figure 12.1a shows theunderlying exposure for the £1-million accountpayable. The exposure is represented by a line& Table 12.2 Payoffs from different hedging techniquesV, millions of $S u ($/£) ForwardcontractFuturescontractAt-the-moneyoptionIn-the-moneyoption0.2 0.2 0.2 0.06 0.12 0.020.1 0.1 0.1 0.06 0.12 0.020 0.0 0.0 0.06 0.02 0.020.1 0.1 0.1 0.04 0.08 0.020.2 0.2 0.2 0.14 0.18 0.08& 272Out-of-the-moneyoption
∆V (mn$)∆V (mn$)∆V (mn$)–0.2 –0.10.20.1–0.100.20.1 0.1∆S u ($/£) ∆S u ($/£)∆S u ($/£)0.1 0.2 –0.2 0 0.1 0.2–0.20 0.1–0.1–0.10.2–0.1–0.10.2–0.2–0.2 –0.2Forward contractPayables exposureCombined exposure(a) Forward contracts∆V (mn$)∆V (mn$)∆V (mn$)0.20.10.20.1∆S u ($/£)∆S u ($/£)0.20.1∆S u ($/£)–0.2 –0.1–0.100.1 0.2∆S u –0.2($/£)–0.1 0–0.10.1 0.2–0.2–0.1–0.100.1 0.2–0.2–0.2–0.2Futures contractPayables exposure(b) Futures contractsCombined exposure& Figure 12.1 Payoff profiles, payables exposure, and resulting exposure with forward and futures contractsNotesWhen there is exposure on foreign-currency payables, as in the middle figures of (a) and (b), the exposure can be hedged by buying the foreign-currency forward or bybuying a futures contract. The payoff profiles on the forward and futures contracts are shown in the left-hand figures of a and b. When the exposure profiles are combined,as in the right-hand figures of a and b, we can visualize the effects of hedging. The forward contract removes all exposure and risk, while the futures contract leavesmarking-to-market risk.
MANAGING FOREIGN EXCHANGE RISK AND EXPOSUREwith negative slope, showing a loss if the poundunexpectedly appreciates and a gain if the poundunexpectedly depreciates.The right-hand panel of Figure 12.1a shows theeffect of hedging pound payables with a forwardpurchase of the needed pounds. The figure isobtained by adding the two DV’s from the left-handand middle panels at each DS u . We find thatthe combination of a forward purchase of poundsand the underlying payables exposure produces aline with a zero slope. That is, the forward contracteliminates exposure on the account payable.Figure 12.1 is an example of how to use payoffprofiles to see the effect of different hedging techniques.The approach of adding profiles is calledfinancial engineering.Futures profilesTable 12.2 shows the gains or losses on futurescontracts to purchase £1 million at differentunanticipated changes in the exchange rate. We see,for example, that if the future spot rate had beenexpected to be $1.50/£, but the realized rate turnsout to be $1.30/£, that is, DS u ($/£) ¼ 0.2,then by buying £1 million via pound futures Avivawill find that it has lost approximately $0.2 million.This $0.2 million will have been movedthrough Aviva’s margin account. We note that theexpected loss on futures contracts is the same asthe loss from buying pounds forward. However,in the case of futures we add to the amount lostbecause the actual DV is unknown due to volatilityof interest rates. Other values of DS u also give riseto the same expected DV’s on futures contracts ason forward contracts, but the actual DV’s areuncertain for futures contracts, due to marking-tomarketrisk.The values of DV and DS u for the purchase of£1 million of futures contracts are plottedagainst each other in the left-hand panel ofFigure 12.1b. We show a broadened line becauseof marking-to-market risk. The middle panel ofthe figure shows the underlying exposure on the$1-million account payable. When the two panels& 274are combined by adding the DV’s at each DS u weobtain the right-hand panel. We see that theresulting combined exposure line has zero slope,thereby signifying elimination of exchange rateexposure.Options profilesThe middle column of Table 12.2 shows thevalues of an option to buy £1 million at a strikeprice of $1.50/£ for different realized spotexchange rates. 22 As before, we assume the optionpremium is $0.06/£, so that the option costsAviva $60,000. Table 12.2 shows that if the realizedspot rate is $1.30/£, $1.40/£, or $1.50/£,the option is not exercised, and so by buying theoption Aviva loses $0.06 million. At a realizedspot rate of $1.60/£ the option is worth $0.10million, which, after subtracting the $0.06 millioncost of the option, is a gain of $0.04 million.Similarly, at a spot rate of $1.70/£ the option isworth $0.20 million, or $0.14 million after consideringits cost. These values of DV are plottedagainst the associated DS u ’s, assuming the expectedspot exchange rate is $1.50/£, in the left-handpanel of Figure 12.2a.The middle panel of Figure 12.2a again showsthe underlying exposure of £1-million of payables,and the right-hand panel shows the effectof combining the option and the underlyingexposure. As before, this involves adding the DV’sat each DS u . We find that hedging with thepound call option allows Aviva to gain when thepound ends up somewhat cheaper than expected,because unlike the forward or futures contracts,the option does not have to be exercised if thisoccurs. However, this benefit comes at theexpense of being worse off than by buyingpounds forward when the pound ends up aboveor at its expected value. This is the same conclusionthat we reached earlier, but the payoffprofile gives us a straightforward way of seeing22 This is an at-the-money option if the spot rate at the timethe option is purchased is $1.50/£.
HEDGING RISK AND EXPOSURE∆V(mn$) ∆V(mn$) ∆V(mn$)0.2 0.20.1 0.1∆S u ($/£) ∆S u ($/£)–0.2 –0.1 0 0.1 0.2 –0.2 –0.1 0 0.1 0.2–0.1–0.1–0.2–0.20.20.1–0.2 –0.1 0–0.1–0.2∆S u ($/£)0.1 0.2Options contractPayables exposure(a) At-the-money call option on £Combined exposure∆V(mn$)∆V(mn$)∆V(mn$)0.20.20.20.1∆S u ($/£)0.1∆S u ($/£)0.1∆S u ($/£)–0.2 –0.1 0–0.1–0.20.1 0.2–0.2 –0.1 0–0.1–0.20.1 0.2–0.2 –0.1 0–0.1–0.20.1 0.2Options contract∆V(mn$)Payables exposure(b) In-the-money call option on £∆V(mn$)Combined exposure∆V(mn$)0.20.1∆S u ($/£)–0.2 –0.1 0 0.1 0.2–0.1–0.20.20.1–0.2 –0.1 0–0.1–0.2∆S u ($/£)0.1 0.20.20.1–0.2 –0.1 0–0.1–0.2∆S u ($/£)0.1 0.2Options contractPayables exposure(c) Out-of-the-money call option on £Combined exposure& Figure 12.2 Payoff profiles from option hedgesNotesThe center figures in (a)–(c) show the exposure line for a foreign-currency payable. The left-hand figures in (a)–(c)show the payoff profiles for call options on the foreign currency. In a the option is at-the-money, in (b) the option is in-the-money,and in c the option is out-of-the-money. By combining the profiles for the underlying exposure and the different options thehedges can be visually compared.this, and of comparing the outcomes from differenthedging techniques. 2323 For other examples of payoff profiles for hedging strategiessee ‘‘Why Do We Need Financial Engineering?’’ Euromoney,September 1988, pp. 190–9. Another excellent introductionto the ways different instruments can be ‘‘clipped together’’to form different payoff profiles is Charles W.Smithson, ‘‘ALEGO Approach to Financial Engineering: An Introductionto Forwards, Futures, Swaps, and Options,’’ MidlandCorporate <strong>Finance</strong> Journal, Winter 1987, pp. 16–28.The effects of using in-the-money and out-of-themoneycall options to hedge an underlying shortpound exposure – the need to pay $1 millionpounds – are described in Figure 12.2b and 12.2c.These graphs are based on the values in Table 12.2,which were obtained in the same fashion as thevalues for the at-the-money option. We see from thepayoff profiles that both options allow the hedger tobenefit if the pound is lower than was expected.275 &
MANAGING FOREIGN EXCHANGE RISK AND EXPOSUREHowever, the gain is less for the in-the-moneyoption, because this is more expensive. On the otherhand, if the pound unexpectedly appreciates, the inthe-moneyoption is exercised at a lower price of thepound and so there is a benefit that offsets the higherprice of the option. The choice between options withdifferent strike prices depends on whether the hedgerwants to insure only against very bad outcomes for acheap option premium (by using an out-of-the moneyoption) or against anything other than very goodoutcomes (by using an in-the-money option).The payoff profile for swaps is exactly the same asfor forward contracts, because, as with forwardcontracts, payment or receipt of dollars occurs in thefuture at the time the pounds are received or must bepaid. For example, the borrowing of dollars combinedwith the spot purchase and investment ofpounds produces an upward-sloping payoff profilelike that in the left-hand panel of Figure 12.1a, whichwhen combined with the underlying exposure onpound payables leaves Aviva with zero exposure.Hedging via denominating trade in domesticcurrency eliminates the underlying exposure, givinga flat exposure profile. Mixed-currency invoicingand buying inputs in the currency of exports reducethe slope of the exposure line but leave someexposure and hence some risk. For example, puttinghalf of a contract value in each of the two countries’currencies will halve the exposure and risk.HAVING A COMPANY HEDGING POLICYForeign exchange gains or losses in one division ofa company can spill over to other divisions. Forexample, with capital being constrained, a largeforeign exchange loss by one part of a companycould starve other parts of needed capital for promisingventures. Since the cost of foreign exchangelosses are borne by the entire enterprise, the companypolicy on foreign exchange hedging should beclear to all. The protocol might stipulate the maximumsize of exposure that can go unhedged. It mightalso stipulate the hedging procedure to be used. Aswe shall see in Chapter 14, this is all best coordinatedcentrally so as to avoid hedging overlaps to savecosts. However, before turning to the issue ofinternational cash management, let us consider theopposite activity to hedging, namely speculation.SUMMARY1 There are several reasons why hedging should be performed by the firm rather than by itsshareholders. These include progressive corporate income tax, scale economies inhedging transactions, marketing and employment benefits, lower expected bankruptcycosts, and better internal information.2 An importer or exporter faces exposure and risk because of delay between agreeing ona foreign-currency price and settling the transaction.3 The expected cost of hedging is the difference between the forward exchange rate forbuying/selling and the expected future spot rate for buying/selling.4 The expected cost of hedging can be estimated as one half of the difference between theforward spread and the spot spread. This magnitude can be determined by consultinga bank on what its bid and ask rates would be for spot and forward transactions, withthis amount being unlikely to change much over time, but being dependent on the amountof the transaction and the maturity.5 The decision to use forward hedging does not depend on there being a forward-riskpremium. The premium represents a cost and a benefit.& 276
HEDGING RISK AND EXPOSURE6 The bid-ask spread on short-maturity forward transactions does not substantiallyexceed that on spot transactions, so that the expected cost of forward hedging issmall. Because there are several benefits of forward hedging, it generally pays to usethe forward market.7 Futures-market hedging achieves essentially the same result as forward hedging.However, with futures the foreign exchange is bought or sold at the spot rate at maturity,and the balance of receipts from selling a foreign currency or cost of buying a foreigncurrency is reflected in the margin account. Because interest rates vary, the exact receiptor payment with currency futures is uncertain.8 Foreign-currency accounts payable can be hedged by buying a call option on the foreigncurrency, and accounts receivable can be hedged by buying a put option on the foreigncurrency. Options set a limit on the worst that can happen from unfavorable exchangeratemovements without preventing enjoyment of gains from favorable exchange-ratemovements.9 An importer can hedge with a swap by borrowing in the home currency, buying theforeign-currency spot, and investing in the foreign currency. Exporters can hedge with aswap by borrowing in the foreign currency, buying the home-currency spot, and investingin the home currency: the loan is repaid from the export proceeds.10 Foreign exchange exposure can be eliminated by invoicing in domestic currency.Exposure can be reduced by invoicing in a mixture of currencies or by buying inputs in thecurrency of exports.11 Payoff profiles provide a graphical comparison of the consequence of using differenthedging techniques.REVIEW QUESTIONS1 How is the manager-versus-shareholder hedging choice influenced by progressivity of thecorporate income tax rate?2 How is the manager-versus-shareholder hedging choice influenced by economies of scalewhen buying or selling forward exchange?3 Are there informational gains to managers if they hedge foreign exchange exposure?How might the information be obtained without hedging?4 What types of products might sell better when firms hedge foreign exchange exposure?5 Why might expected bankruptcy costs be higher for firms that do not hedge than for thosethat do?6 How does the expected cost of hedging forward relate to spot versus forward exchangeratespreads?7 Would a typical hedger be willing to pay a risk premium in order to hedge by buyingforeign-currency forward?8 How does the risk of hedging via futures compare to that of hedging via forwardexchange?9 What type of swap would an American importer of Japanese-yen-invoiced products use?10 Can importers and exporters both hedge by selecting the currency of invoicing, and arethere any compromise invoicing currency strategies?277 &
MANAGING FOREIGN EXCHANGE RISK AND EXPOSURE11 What is a composite currency unit?12 Name two composite currency units.13 What is meant by ‘‘sourcing?’’ Should this be used as a method of hedging foreignexchange exposure?14 Why do you think financial engineering has been referred to as a ‘‘LEGO © approach’’ todecision making?ASSIGNMENT PROBLEMS1 In what sense are the forward-risk premium and the bid-ask spread on forwardcontracts both related to risk? Does the fact that the bid-ask spread is always positiveand yet the forward risk premium can be positive or negative suggest that the natureof the two risks is different?2 Suppose that you were importing small electric transformers, that delivery from allsuppliers would take approximately 6 months, and that you faced the situation shown inthe table below:abcUnited States Canada Great Britain Switzerland GermanyLocal $20,000 Can$22,000 £10,000 SFr 22,000 ¤18,000costS($/j) 1 0.84 2.00 0.80 1.20S 1/2 ($/j) 1 0.82 2.05 0.79 1.22F 1/2 ($/j) 1 0.83 2.02 0.81 1.24Where would you buy if you decided on forward hedging?Where would you buy if you decided on being unhedged?If you knew that your own expected future spot rates were also the market’s expectedspot rates, could you deduce from the table if there is a forward-risk premium?3 Why might managers’ motivations to hedge against foreign exchange exposure differfrom those of company shareholders?4 It has been said that expected bankruptcy costs can help explain the use of equity versusdebt in corporate financial structure, even when interest but not dividends are taxdeductible.Can bankruptcy costs also explain hedging practices that on average reduceexpected earnings?5 If a currency can be sold forward for more than the currency’s expected future valuebecause of a risk premium on the currency, do the sellers of that currency enjoy a ‘‘freelunch?’’6 Why is the cost of forward hedging half of the difference between the forward and spotbid-ask spreads?7 Assume that you are importing German transformers and that you face the following:r$ B 6%r¤ I 4%S($/ask¤) 1:2000F 1/2 ($/ask¤) 1:2400& 278
HEDGING RISK AND EXPOSUREa How would you hedge? Would you buy euro forward or would you borrow dollars, buy euro spot, andinvest in euro for 6 months?b Would it make any difference in your choice of hedging technique if you already had dollars that wereearning 5 percent?8 Suppose that as the money manager of a US firm you faced the following situation:r$ B 9:0%r$ I 8:0%rC$ B 10:5%rC$ I 9:5%S(C$/ask$) 1:2400S(C$/bid$) 1:2350F 1 (C$/ask$) 1:2600F 1 (C$/bid$) 1:2550Here, r$ B and rI $are the 1-year interest rates at which you can, respectively, borrow andinvest in the United States, and rC$ B and rI C$are the 1-year borrowing and investinginterest rates in Canada.a If you had funds to invest for 1 year, in which country would you invest?b If you wished to borrow for 1 year, from which country would you borrow?c What might induce you to borrow and invest in the same country?d If you needed Canadian dollars to pay for Canadian goods in 1 year and were not holding US dollars,would you buy forward or use a swap?e If you needed Canadian dollars to pay for Canadian goods in 1 year and already had some US dollars,would you buy forward or use a swap?BIBLIOGRAPHYEuromoney, ‘‘Why Do We Need Financial Engineering?’’ Euromoney, September 1988, pp. 190–99.Khoury, Sarkis J. and K. Hung Chan, ‘‘Hedging Foreign Exchange Risk: Selecting the Optimal Tool,’’ MidlandCorporate <strong>Finance</strong> Journal, Winter 1988, pp. 40–52.Levi, Maurice D., ‘‘Spot versus Forward Speculation and Hedging: A Diagrammatic Exposition,’’ Journal of<strong>International</strong> Money and <strong>Finance</strong>, April 1984, pp. 105–09.Perold, Andre F. and Evan C. Shulman, ‘‘The Free Lunch in Currency Hedging: Implications for Investment Policyand Performance Standards,’’ Financial Analysts Journal, May/June 1988, pp. 45–50.Smithson, Charles W., ‘‘A LEGO Approach to Financial Engineering: An Introduction to Forwards, Futures,Swaps, and Options,’’ Midland Corporate <strong>Finance</strong> Journal, Winter 1987, pp. 16–28.Stulz Rene and Clifford W. Smith, ‘‘The Determinants of Firms’ Hedging Policies,’’ Journal of Financial andQuantitative Analysis, December 1985, pp. 391–405.279 &
Chapter 13Exchange-rate forecastingand speculationThe proportion of (monthly or quarterly) exchange rate changes that current models can explain isessentially zero.Richard MeeseThe topics discussed in this chapter, namely,exchange-rate forecasting and speculation, are bothclosely related to the issue of the efficiency of foreignexchange markets. For example, if speculatorscan profit from forecasting exchange rates marketscannot be efficient. By efficiency we mean here theeffective use of all relevant information by peoplebuying and selling foreign exchange. Because of thecloseness of connections between the issues, thischapter deals first with foreign exchange speculation,then with market efficiency, and finally withforecasting. After explaining the vehicles of foreignexchange speculation, the evidence on marketefficiency is examined. The chapter then turns tothe record on exchange-rate forecasting, including acomparison of chartist versus fundamental forecastingtechniques. The record of chartists versusfundamentalists is linked back to market efficiency,specifically to the ability to earn from speculationusing simple trading rules.It should be mentioned at the outset that opinionsdiffer widely on the topics discussed in this chapter,and by no means do all finance researchers agree thatabnormal speculative returns and market inefficiencieshave been detected. Nevertheless, despitea traditional predisposition against finding abnormalreturns to speculation, market inefficiencies,& 280and chartist-forecasting success, when it comes toforeign exchange markets, traditional notions face achallenge. For example, central banks and internationalorganizations have at times been majorplayers in the foreign exchange market, whereas inmost financial markets such as stock markets, thereare generally no massive players. Some believespeculators may be able to profit from judging theactions of official organizations.SPECULATIONWhen many think of foreign exchange speculators,they have an image of fabulously rich people in largelimousines, wearing vested suits and makinghandsome profits with little regard for the ordinarycitizen. The graphic phrase ‘‘the gnomes of Zurich’’was coined by a former British Chancellor of theExchequer when his country faced what he perceivedas an outright attack on its currency by thoseever-hungry and apparently heartless manipulators.In spite of the images we might have, it can beargued, as we do later in this book, that speculatorsmay play a useful role by stabilizing exchange rates.However, our initial purpose here is not to discussthe possible merits or evils of speculation, butrather to simply describe the different ways to
EXCHANGE-RATE FORECASTING AND SPECULATIONspeculate. As we shall see, these are the same as the That is, the speculator will buy pounds forward ifF n ð$/ask£Þ < S n ð$/bid£Þ ð13:1Þ the future spot price for selling pounds will exceedthe current futures buying rate, that is, if inequalitydifferent ways to hedge, but when actions are takenwithout the offset of an underlying exposure such asa foreign-currency account receivable or payable.the buying price of the forward pounds is less thanher or his expected future spot selling price ofpounds. For example, if the speculator can buypounds 1 year forward for F 1 ($/ask£) ¼ 1.5500,Speculating via the forward marketSpeculating without transaction costsand the speculator thinks that in 1 year the spotrate at which the pounds can be sold will beS 1 ($/bid£) ¼ $1:5580/£, then the speculator willbuy pounds forward in the hope of selling them atIf we write a speculator’s expected spot exchange a profit. The expected profit is ½S rate in n years as S 1 ($/bid£)n ($/£), then, as we indicated in F 1 ($/ask£)Š ¼$0:0080/£ purchased, or $8,000 perChapters 3 and 8, if the speculator is risk neutral £1,000,000. We see that in order to profit, theand we ignore transaction costs, she or he will wantto buy pounds n years forward if 1F n ð$/£Þ < S n ð$/£Þexpected movement of the exchange rate has to besufficient to cover the transaction costs on theforward and spot transactions. Similarly, the riskneutralspeculator will sell pounds n years forward ifOn the other hand, the risk-neutral speculator,ignoring transaction costs, will want to sell poundsF n ð$/bid£Þ > S n ð$/ask£Þð13:2Þn years forward ifF n ð$/£Þ > S n ð$/£ÞFor example, if the speculator can sell pounds1 year forward for F 1 ($/bid£) ¼ 1.5500, and thespeculator thinks the spot rate for buying pounds inHowever, if the speculator is averse to risk, he 1 year will be S 1 ($/ask£) ¼ $1:5420, then theor she will not buy or sell forward unless the speculator will sell pounds forward in the hope ofexpected return is sufficient for the systematic being able to buy the pounds spot when makingrisk that is taken. This risk depends on the correlationof the exchange rate with the values of other profit is ½F 1 ($/bid£) S 1 ($/ask£)Š ¼$0:0080/£delivery on the forward contract. The expectedassets and liabilities. To the extent that exchangeraterisk is not diversifiable, there may be a risk remarks about risk premiums that were made in thesold forward, or $8,000 per £1,000,000. Thepremium in the forward rate. This can cause the context of zero transaction costs also apply whenforward rate to differ from the market’s expected transaction costs exist.future spot rate.Speculating with transaction costsSpeculating via the futures marketThe decision criteria for speculation in the futuresWhen there are transaction costs in the spot and themarket are, not surprisingly, essentially the same asforward foreign exchange market, a risk-neutralthose for the forward market: the risk-neutralspeculator will buy pounds n years forward whenspeculator buys pound futures if he or she believes(13.1) holds where the ‘‘F’’ refers to the futuresprice. The risk-neutral speculator sells pound1 We should distinguish the individual speculator’s expectedfuture spot rate from the market’s expected future spot rate.futures when the reverse is the case, that is, ifIn this current discussion expected future spot rates are inequality (13.2) holds. However, there are twothose of the individual speculator.small differences between the decision to buy or sell281 &
MANAGING FOREIGN EXCHANGE RISK AND EXPOSUREfutures, and the decision to buy or sell forward,namely1 Because of marking-to-market risk on futures,if speculators are risk averse they might want alarger gap between the ask (bid) futures priceand the expected future bid (ask) spot price tocompensate for the extra risk. That is, thereis risk from unanticipated changes both inthe spot exchange rate, as there is on forwards,and in the interest rate, which addsmarking-to-market risk to futures.2 Futures contracts are rarely held to theirmaturity, and the speculator may thereforebe comparing today’s futures price with anexpected futures exchange rate for a date priorto the futures contract’s maturity.Speculating via the options marketA speculator buys an option if the expected payoffexceeds the cost of the option by enough to compensatefor the risk of the option, and for theopportunity cost of money paid for the option. Ofcourse, the value of an option varies with theunderlying asset price which can move the optioninto or out of the money at different times during itsmaturity and by different amounts. 2 Furthermore,each of the different possible extents of being in orout of the money occurs with a different probability.This means that to calculate the expectedpayoff the different possible outcomes must beweighted by the probabilities of these outcomes.Clearly, a speculator will buy an option if he orshe values the option at more than its market price.This may occur if the speculator believes that theoption will be in-the-money with a higher probabilitythan the market in general believes. Forexample, a speculator may buy a call option on thepound with a strike price of $1.60/£ if he or shebelieves the probability of the pound moving above2 The pricing of European options based on put-call paritywas discussed in Appendix A in Chapter 4.& 282$1.60/£ is higher than the probability attached tothis eventuality by the market in general. Similarly,a speculator may buy a put option at $1.40/£ ifhe or she believes the probability of the poundmoving below this ‘‘strike’’ rate is higher thanthe probability attached to this eventuality by themarket.A speculator who is prepared to accept thepossibility of large losses can also sell, or write,currency options. As we saw in Chapter 4, if thespeculator writes a call option on the pound, she orhe gives the buyer the right to buy the pound at thestrike price, and if the speculator writes a putoption, she or he gives the buyer the right to sell thepound at the strike price. Option writing providesan expected return on the risk taken. That is, theexpected payout is less than the premium receivedfor the option. Option writing is a risky speculativestrategy unless, as usually is the case, the speculatorcreates offsetting exposure via other options, forwards,or futures, or by holding the currencyagainst which a call option is written.Speculating via borrowing and lending:swapsWe saw in Chapters 8 and 12 that by borrowingdollars, buying pounds spot, and investing inpound-denominated securities, it is possible toachieve essentially the same objective as buyingpounds forward. That is, at maturity, dollars arepaid on the loan and pounds are received from theinvestment.For each pound a speculator wants to have inn years, he or she must invest in pounds today1£ð1 þ r I £ Þnwhere r I £ is the per annum pound-denominatedsecurity investment return. The dollar cost ofbuying this number of pounds on the spot market,the number that will provide £1 in n years, is$ Sð$/ask£Þð1 þ r I £ Þn
EXCHANGE-RATE FORECASTING AND SPECULATIONIf the speculator borrows the dollars to do this atr B $ , the number of dollars that must be repaid on theloan is$Sð$/ask£Þð1 þ r B $ Þnð1 þ r I £ Þnð13:3ÞIn summary, the amount in expression (13.3) is thedollar amount to be paid in n years in order for thespeculator to receive £1 in n years. The timing ofthe dollar payment and pound receipt is the same aswith a forward purchase of pounds.A risk-neutral speculator would use the swap tospeculate in favor of the pound ifSð$/ask£Þ ð1 þ rB $ Þnð1 þ r I £ Þn < S n ð$/bid£Þð13:4Þwhere S n ($/bid£) is the number of dollars thespeculator expects to be able to sell one pounds forin n years time. That is, the speculator will borrowin the US, buy pounds spot, and invest in pounddenominatedsecurities if he or she thinks thepounds to be received can be sold spot in n years formore dollars than must be repaid on the dollar loanused to buy the pounds. 3Speculating via not hedging tradeWhile it might not seem like speculation, when afirm has a foreign currency receivable or payableand does not hedge this by one of the procedures wehave described, that firm is speculating: by nothedging an exposure the firm accepts the exposure,just as it does when there is no underlying exposureand the firm uses one of the techniques for speculatingthat we have described. For example, a USimporter who receives an invoice in pounds anddoes nothing to hedge the exposure is speculatingagainst the pound: the importer is short pounds.3 The criterion for speculating against the pound byborrowing pounds, buying dollars spot, and investing indollar-denominated securities is left as an exercise forthe reader.This should seem obvious after what we have said inChapter 9, because it should be clear that speculationis synonymous with having an exposure line withnonzero slope. Yet despite the obvious fact that nothedging foreign-currency receivables or payablesmeans speculating, it is remarkable how many firms,when asked if they use the forward, futures, optionsor swap markets to hedge their trade, say, ‘‘Oh no!We don’t speculate!’’ As we have seen, in factthey are unwittingly speculating by not using thesemarkets to hedge exposure. It is also not uncommonto hear an export company, for example, say thatthey sometimes hedge, selling foreign currencyforward only when they think the foreign currencywill depreciate. They are, of course, speculating.Speculating on exchange-rate volatilityIt is possible to speculate, not on whether anexchange rate will unexpectedly increase ordecrease, but rather on the possibility that theexchange rate will change by an unexpectedly largeamount in one direction or the other. That is, it ispossible to speculate on the exchange rate beingvolatile, not on the exchange rate moving in aparticular direction. One way to speculate onvolatility is to simultaneously buy a call option and aput option at the same strike price, or perhaps buya call with a higher price than the put. 4 Then, if thevalue of the foreign currency increases substantially,the call can be exercised for a profit, while the losson the put is limited to the price paid for it. Likewise,if the value of the foreign currency decreasessubstantially, the put can be exercised. Such aspeculative strategy is called a straddle.MARKET EFFICIENCYForeign exchange speculation is worthwhile only ifforeign exchange markets are inefficient. This isbecause in an inefficient market, by definition, thereare abnormal returns from using information when4 The more the call strike price exceeds the put strike price,the cheaper is the strategy.283 &
MANAGING FOREIGN EXCHANGE RISK AND EXPOSUREtaking positions in foreign exchange. 5 An abnormalreturn is equal to the actual return minus the returnthat would be expected, given the level of risk, if allavailable information concerning the asset had beenutilized in the market’s determination of the asset’sprice. Since it is necessary to specify the expectedreturn when evaluating whether markets are efficient,tests of market efficiency are really joint testsof the model used to generate the expected returns,and of market efficiency.Efficiency can take on different meaningsaccording to what we include in the set ofinformation that is assumed to be available todecision makers, and that is therefore reflected in anasset’s market price. If information only on historicalprices or returns on the particular asset isincluded in the set of information, we are consideringweak-form efficiency. That is, withweak-form efficiency, the current asset pricereflects everything relevant in past prices of theasset. (So-called ‘‘technical trading’’ is based on pastpatterns of prices and returns, so any profitability ofsuch a strategy would indicate markets are notweak-form efficient.) With all publicly knowninformation included in the information set, we areconsidering semi-strong efficiency, and with allinformation, including that available to insiders,we are considering strong-form efficiency.Because of central-bank involvement in foreignexchange markets, exchange rates could well proveto be influenced by an important ‘‘insider,’’ and itsinformation. (A possibility that markets could bestrong-form efficient, with prices thereby reflectingeven insider information, can be based on the viewthat if market participants know which traders areinsiders, they may deduce what insiders know fromwhat they do. For example, if insiders are buying anasset, it might suggest they have knowledge of goodnews that is not yet public.)An important aspect of efficiency in the internationalcontext concerns the foreign exchangemarket’s ability to form forecasts of spot exchangerates. As we have seen earlier in this chapter and inChapters 3 and 8, if speculators are risk neutral andwe ignore transaction costs, speculators buy and sellforward untilF n ð$/£Þ ¼S n ð$/£Þthat is, until the forward rate equals the market’sexpected future spot rate. Two questions arise inthis context:1 Do forward rates tend, on average, to equalthe market’s expected future spot rates, or arethey systematically different?2 Is all relevant information used by the marketin determining the forward rate as a predictorof future spot rates, or are there observablefactors which would be helpful in makingpredictions which the market overlooks?The first of these questions relates to possible bias inforward exchange rates, and the second relates tomarket efficiency.It is possible to construct a joint test of possiblebias in the forward rate and of market efficiency byrunning a regression on data for forward exchangerates and the eventually realized spot exchangerates. Specifically, for any value of n we choose, it ispossible to estimate the equation: 6S n ð$/£Þ¼b 0 þ b 1 F n ð$/£Þþ b 2 Z þ mð13:5ÞIn equation (13.5), S n ($/£)istherealizedspotratefor the maturity date of the forward contract, F n ($/£)is the forward rate for the matching maturity date,Z represents any information that may be relevantfor exchange rates, and m is the regressionerror. Values of the forward rate, F n ($/£), therealized spot rate, S n ($/£), and Z exist for each5 On the concept of market efficiency see Stephen F. LeRoy,‘‘Efficient Capital Markets and Martingales,’’ Journal ofEconomic Literature, December 1989, pp. 1583–621.& 2846 We show the regression equation in the context of thedollar–pound exchange rate, but it is naturally extendableto other exchange rates.
EXCHANGE-RATE FORECASTING AND SPECULATIONpoint in time during the period over which theregression equation is estimated. In principle,monthly, weekly, or even daily data could be usedfor the exchange rates, and different n values can beconsidered. For example, we could study weekly ormonthly data for n of 1 month, 3 months and so on.The variable (or variables) that Z representsdepends on the form of market efficiency for whichwe are testing. If Z consists only of past values of thedollar–pound exchange rate – spot or forward –available to the market when forming expectations,the test is of weak-form efficiency; if Z consists of allpublicly available information the test is of semistrongefficiency; and if Z also includes informationavailable only to central bankers and other insiders,the test is of strong-form efficiency.The principal interest in equation (13.5) is with theestimated values of b 0 , b 1 ,andb 2 .Thevalueofb 0is the constant (or intercept) term. b 1 and b 2 representthe partial impacts of F n ($/£) and Z respectivelyon the spot rate, that is, the impacts of each variablewhere the other variable is assumed constant.Let us first consider b 2 , the coefficient onpotentially relevant information for the future spotrate other than that already impounded in the forwardrate. If relevant information were not incorporatedin the forward rate by the market, themarket would be inefficient. In this case, the estimateof b 2 would be significantly different fromzero. Equation (13.5) can be estimated using avariety of alternative variables representing Z. If it isnot possible to find any variables Z for which thenull hypothesis that b 2 ¼ 0 is rejected, then we canconclude that the market is efficient: an absence ofstatistically significant variables means that norelevant matters were ignored by the market informing its expectation of future spot rates asincorporated in forward rates. 7 That is, whether or7 If a 95 percent confidence interval is used for determiningwhether a coefficient is significantly different from zero,then by design, one in 20 variables chosen will be significantjust by chance. It is necessary to check whether variableshelp prediction outside the sample period and to do otherdiagnostic tests of whether statistically significant variablesreally do matter.not we can reject the null hypothesis that b 2 ¼ 0isatest of efficiency.If it could be argued under the null hypothesisthat b 2 ¼ 0, it is possible to estimate equation (13.5)without including Z. This is because if b 2 is indeedzero, then omission of Z should have no effect onthe outcome of the regression in terms of othercoefficient estimates, the extent to which forwardrates predict future spot rates, and so on. Judgingwhether Z can be omitted requires studying thebehavior of the actual regression errors, that is,those based on the actual coefficient estimates for b 0and b 1 . The behavior of the errors through time –called serial correlation,orautocorrelation –suggests whether relevant variables were omitted.If relevant variables were left out when estimatingequation (13.5) excluding Z that is, when estimatingS n ð$/£Þ ¼b 0 þ b 1 F n ð$/£Þþmthen measured regression errors are likely to exhibitpatterns over time. The patterns arise becauseomitted relevant variables usually move throughtime with patterns; if the omitted variables arepurely random, their omission does not create nonrandom behavior of errors. For example, forwardrates may underestimate spot rates again and againfor a period of time if we ignore a relevant variable.There are statistical summaries which indicatewhether significant serial correlation of errors ispresent. One such measure is the Durbin–Watson statistic, D–W. Values of D–W close to2 mean the null hypothesis of zero serial correlationcannot be rejected.Before considering the evidence on whetherb 2 ¼ 0, let us see how b 0 and b 1 are related to thepossible presence of bias in forward exchange rates.The joint null hypothesis concerning the presence offorward-rate bias is whether b 0 ¼ 0 and b 1 ¼ 1.This is because in this situation, from equation (13.5)and continuing to assume that b 2 ¼ 0S n ð$/£Þ¼F n ð$/£Þþmð13:6ÞIf the regression errors, m, average zero, thenequation (13.6) says that on average, forward ratescorrectly predict realized spot rates. On the other285 &
MANAGING FOREIGN EXCHANGE RISK AND EXPOSUREhand if, for example, b 0 ¼ a 6¼ 0, then even ifb 1 ¼ 1 and b 2 ¼ 0S n ð$/£Þ¼a þ F n ð$/£ÞThis means the forward rate is a biased predictor ofthe future realized spot rate. For example, if a > 0then on average the forward price of the pound,F n ($/£), is less than the realized spot value of thepound. Therefore, buying the pound forward, whichmeans selling dollars forward, earns a speculator apositive return on average. This suggests a risk premiumbeing earned by the purchaser of forwardpounds, a premium earned for going long on pounds.On the other hand, if a < 0 there is a premium forgoing short on pounds – or long on the dollar.The empirical evidence suggests there is a riskpremium in the forward rate, and that it does varyover time. 8 However, it appears that the risk premiumis very small. For example, Jeffrey Frankelhas considered the change in risk premium thatwould occur if there were an increase in the supplyof dollar assets of 1 percent of global assets. Theorysuggests that in order to induce people to hold theextra dollar assets the market would have to providea bigger forward premium on dollars: people need8 A by no means exhaustive list of papers reaching thisconclusion includes Richard T. Baillie, Robert E. Lippens,and Patrick C. McMahon, ‘‘Testing Rational Expectationsand Efficiency in the Foreign Exchange Market,’’Econometrica, May 1983, pp. 553–63; Eugene F. Fama,‘‘Forward and Spot Exchange Rates,’’ Journal of MonetaryEconomics, November 1984, pp. 320–38; Lars P. Hansen andRobert J. Hodrick, ‘‘Forward Exchange Rates as OptimalPredictors of Future Spot Rates: An Economic Analysis,’’Journal of Political Economy,October1980,pp.829–53; DavidA. Hsieh, ‘‘Tests of Rational Expectations and No RiskPremium in Forward Exchange Markets,’’ Journal of<strong>International</strong> Economics, August 1984, pp. 173–84; RodneyL. Jacobs, ‘‘The Effect of Errors in the Variables on Tests fora Risk Premium in Forward Exchange Rates,’’ Journal of<strong>Finance</strong>, June 1982, pp. 667–77; Robert A. Korajczck, ‘‘ThePricing of Forward Contracts for Foreign Exchange,’’ Journalof Political Economy, April 1985, pp. 346–68; andChristian C.P. Wolff, ‘‘Forward Foreign Exchange Rates,Expected Spot Rates and Premia: A Signal-ExtractionApproach,’’ Journal of <strong>Finance</strong>, June 1987, pp. 395–406.& 286to be rewarded more to hold extra dollars. Frankelestimates that such a 1-percent increase in dollarassetswould change the risk premium by 2.4 basispoints, that is, by less than 1/40th of 1 percent. 9Moreover, the evidence for there being a significantrisk premium at all was thrown into questionby further research by Jeffrey Frankel and hiscoresearcher Kenneth Froot. 10 Indeed, even someof those who originally identified a risk premiumsubsequently obtained evidence that casts doubt onthe model used to find it. 11Results of one particular joint test of thehypotheses that b 0 ¼ 0; b 1 ¼ 1, which implies azero risk premium in forward rates, and of b 2 ¼ 0,which implies market efficiency, are shown inTable 13.1. The table gives the results from estimatingequation (13.5) under the null hypothesis thatb 2 ¼ 0. Results are shown for the dollar–pound rateas well as for the dollar–mark and dollar–yen rates.The estimates cover the period 1978–87 and arereported in a comprehensive and insightful surveyof foreign exchange market efficiency by Douglas9 See Jeffrey A. Frankel, ‘‘In Search of the Exchange RiskPremium: A Six-Currency Test Assuming Mean-VarianceOptimization,’’ Journal of <strong>International</strong> Money and <strong>Finance</strong>,December 1982, pp. 255–74.10 Jeffrey A. Frankel and Kenneth A. Froot, ‘‘Using SurveyData to Test Some Standard Propositions RegardingExchange Rate Expectations,’’ American Economic Review,March 1987, pp. 133–53.11 Robert J. Hodrick and Sanjay Srivastava, ‘‘An Investigationof Risk and Return in Forward Foreign Exchange,’’ Journalof <strong>International</strong> Money and <strong>Finance</strong>, April 1984, pp. 5–29.Other research that does not support the notion of a riskpremium includes Bradford Cornell, ‘‘Spot Rates, ForwardRates and Exchange Market Efficiency,’’ Journal of FinancialEconomics, August 1977, pp. 55–65; David L. Kaserman,‘‘The Forward Exchange Rate: Its Determination andBehavior as a Predictor of the Future Spot Rate,’’Proceedings of the American Statistical Association, 1973,pp. 417–22; David Longworth, ‘‘Testing the Efficiencyof the Canadian–U.S. Exchange Market under theAssumption of No Risk Premium,’’ Journal of <strong>Finance</strong>,March 1982, pp.43–9; and Alan C. Stockman, ‘‘Risk,Information and Forward Exchange Rates,’’ in JacobA. Frenkel and Harry G. Johnson (eds), The Economics ofExchange Rates: Selected Studies, Addison-Wesley, Boston,MA, 1978, pp. 159–78.
EXCHANGE-RATE FORECASTING AND SPECULATION& Table 13.1 Test of unbiasedness of forward rates as predictors of future spot rates, monthly data 1978–87RateCoefficients/StatisticsS(i/$) ¼ 0 þ 1 F 1/12 (i/$) þ , i ¼ DM, ¥, £ 0 1 R 2 2 D–W(DM/$) 0.013 0.988 0.962 1.71(0.867) (0.667)(¥/$) 0.028 0.995 0.926 1.59(0.197) (0.192)(£/$) 0.002 0.993 0.974 1.57( 0.222) (0.467)Notet-statistics in parentheses below coefficients, based on b 0 ¼ 0; b 1 ¼ 1.Source: Douglas K. Pearce, ‘‘Information, Expectations, and Foreign Exchange Market Efficiency,’’ in Thomas Grennes(ed.), <strong>International</strong> Financial Markets and Agricultural Trade, Westview Press, Boulder, CO, 1989, pp. 214–60.Pearce. 12 The values in parentheses below thecoefficient estimates for b 0 and b 1 are t-statistics,which allow us to see whether the point estimatesare statistically significantly different from zero, forb 0 , and from 1.0, for b 1 , as implied by the nullhypothesis that there is no bias in forward rates; ifthe estimate of b 0 ¼ 0, and b 1 ¼ 1, the forward ratepredicts the realized spot rate correctly on average.Estimated t-statistics less than approximately 2.0indicate insignificance. We see from the numbers inparentheses below the coefficient estimates that b 0is insignificantly different from 0 and b 1 is insignificantlydifferent from 1.0. In addition, theDurbin–Watson statistic is close to 2.0, indicatingthat relevant variables were not overlooked informing expectations. Unfortunately, however, wecan have only limited confidence in these resultsbecause the test statistics are based on the assumptionthat the process generating the data isstationary, which means that the underlyingmodel, including any forward risk premium, is thesame over the time period that is studied. Analysis ofthe data suggests that the process is not stationary. 1312 Douglas K. Pearce, ‘‘Information, Expectations, andForeign Exchange Market Efficiency,’’ in Thomas Grennes(ed.), <strong>International</strong> Financial Markets and Agricultural Trade,Westview Press, Boulder, CO, 1989, pp. 214–60.13 See Richard A. Meese and Kenneth J. Singleton, ‘‘On UnitRoots and the Empirical Modelling of Exchange Rates,’’Journal of <strong>Finance</strong>, September 1982, pp. 1029–35.There is an alternative means of testing forefficiency of foreign exchange markets. This secondmethod also tests whether forecasts of future spotexchange rates are rational; by‘‘rational’’ forecastswe mean forecasts that are on average correctand which do not reveal persistent errors. 14This test replaces the forward rate, F n ($/£), inequation (13.5) with the expected future spotrate as given in surveys of opinions of importantmarket participants. That is, we estimate notequation (13.5), but insteadS n ð$/£Þ¼g 0 þ g 1 S n ð$/£Þþ g 2 Z þ mð13:7Þwhere S n is the average forecasted future spot rateof those who are surveyed. In this case we can stilljudge market efficiency by whether g 2 is significantlydifferent from zero for any variable(s) Z. Furthermore,we can interpret a g 0 that is insignificantlydifferent from zero and a g 1 that is insignificantlydifferent from 1.0 as implying rational forecasts,because under these joint conditions the market’sforecasts are on average correct. Furthermore,if forecasts are rational, then prediction errors in14 The concept of rationality was also used in the contextof the expectations form of PPP in Chapter 7, where weargued that rational people are as likely to overestimate asto underestimate and do not make persistent mistakes.287 &
MANAGING FOREIGN EXCHANGE RISK AND EXPOSUREforecasts should not be related between successivetime periods. 15The evidence from the estimation of equation(13.7) is not supportive of market efficiency.Specifically, other variables do appear to helpforecast future spot rates; in the regression, g 2 issometimes significantly different from zero. Thisis the conclusion of, for example, Peter Liu andG.S. Maddala, and of Stefano Cavaglia, WillemVerschoor and Christian Wolff. 16 However, on thematter of rationality of expectations, the sameresearchers reach different conclusions. Rationalityis supported by Liu and Maddala, but rejected byCavaglia, Verschoor, and Wolff who find consistentbiases in experts’ forecasts. 17EXCHANGE-RATE FORECASTINGForecasting models’ successes and failuresA further, indirect way of testing foreign exchangemarket efficiency and whether speculation offerspositive excess expected returns is to examine theforecasting performance of exchange-rate models.If markets are efficient so that exchange rates reflectall available information, it should not be possibleto make abnormal returns from speculation byfollowing any forecasting model’s predictions;exchange rates should reflect the model’s predictions,with the market behaving ‘‘as if’’ it knew theforecasts implied by the model.In a frequently cited paper, Richard Meeseand Kenneth Rogoff compared the forecastingperformance of a number of exchange-rate15 As we said earlier, this can be judged by the Durbin–Watson statistic, given assumptions about the stationarityof the process generating the data.16 See Peter C. Liu and G.S. Maddala, ‘‘Rationality of SurveyData and Tests for Market Efficiency in the ForeignExchange Markets,’’ Journal of <strong>International</strong> Money and<strong>Finance</strong>, August 1992, pp. 366–81, and Stefano Cavaglia,Willem F.C. Verschoor, and Christian C.P. Wolff,‘‘Further Evidence on Exchange Rate Expectations,’’Journal of <strong>International</strong> Money and <strong>Finance</strong>, February 1993,pp. 78–98. See also Frankel and Froot, op. cit.17 Cavaglia, Verschoor, and Wolff, op. cit.& 288models. 18 The models generally predicted wellduring the period of time over which they wereestimated. That is, when using the estimated equationsand the known values of the explanatoryvariables, these models predicted exchange ratesthat were generally close to actual exchange rates.However, when predicting outside the period used tofit the models to the data, the models did a poorerjob than a naive forecast that future spot rates equalcurrent spot rates. 19 This is despite the fact that theout-of-sample forecasts – those made outside theestimation period – were made using actual, realizedvalues of explanatory variables. (In practice,forecasting would be based on forecast values ofexplanatory variables, adding to the forecast error.)A comparison of the forecasting performances ofthe major macroeconomic models developed sincethe 1970s has been made by Mark Taylor andRobert Flood. 20 Models considered included severalbased on theories discussed later in this book,including the monetary theory of exchange rates,the sticky-price overshooting model, the portfoliobalancemodel, and the asset approach. The authorsused data for 21 industrialized countries for whichexchange rates were flexible. Their results confirmthose of Meese and Ragoff for forecasts of up to1 year, namely that macroeconomic fundamentalsprovide a poor prediction of movements inexchange rates. However, as we might expect,18 Richard A. Meese and Kenneth Rogoff, ‘‘EmpiricalExchange Rate Models of the Seventies: Do They Fit Outof Sample?,’’ Journal of <strong>International</strong> Economics, February1983, pp. 3–24.19 Support for this conclusion with fixed coefficients, but ofimprovements in forecasts when coefficients are allowed tochange, can be found in Garry J. Schinasi and P.A.V.B.Swamy, ‘‘The Out-of-Sample Forecasting Performance ofExchange Rate Models when Coefficients are Allowed toChange,’’ Journal of <strong>International</strong> Money and <strong>Finance</strong>,September 1989, pp. 375–90.20 Mark Taylor and Robert P. Flood, ‘‘Exchange RateEconomics: What’s Wrong with the Conventional MacroApproach?,’’ conference paper in Microstructure of ForeignExchange Markets, sponsored by National Bureau ofEconomic Research, the Centre for Economic PolicyResearch (London), and the Bank of Italy, July 1994.
EXCHANGE-RATE FORECASTING AND SPECULATION& Table 13.2 Correlation coefficients between the yen–dollar spot rate and various possible spot-ratepredictors, 1974–87VariableS(¥/$) (r $ r ¥ ) P US /P JP M US /M JP Y US /Y JPS(¥/$) 1.00(r $ r ¥ ) 0.50 1.00P US /P JP 0.59 0.63 1.00M US /M JP 0.46 0.08 0.72 1.00Y US /Y JP 0.30 0.26 0.88 0.57 1.00Source: Richard Meese, ‘‘Currency Fluctuations in the Post-Bretton Woods Era,’’ Journal of Economic Perspectives,Winter 1990, p. 120.& Table 13.3 Correlation coefficients between the Deutschemark–dollar spot rate and various possiblespot-rate predictors, 1974–87VariableS(DM/$) (r $ r DM ) P US /P GY M US /M GY Y US /Y GYS(DM/$) 1.00(r $ r DM ) 0.20 1.00P US /P GY 0.04 0.42 1.00M US /M GY 0.37 0.25 0.50 1.00Y US /Y GY 0.04 0.51 0.80 0.45 1.00Source: Richard Meese, ‘‘Currency Fluctuations in the Post-Bretton Woods Era,’’ Journal of Economic Perspectives,Winter 1990, p. 120.Taylor and Flood do find that macroeconomicfundamentals have considerably more explanatorypower over longer forecasting horizons.Forward rates offer freely available estimates ofthe market’s expectation of future spot rates sincethey are available by calling a bank or checkinga financial newspaper. Therefore, the test ofefficiency we normally make is whether a model’spredictions outperform the forward exchange rate,not whether the model’s predictions outperformnaive forecasts of future spot rates as being equalto current spot rates. Surprisingly, however, ithas been shown that the current spot rate is oftena better predictor of the future spot rate than isthe forward rate. Therefore, if the models do worsethan predicting future spot rates from current spotrates, they do a fortiori worse than predicting futurespot rates from current forward rates. 2121 See Thomas C. Chiang, ‘‘Empirical Analysis of thePredictors of Future Spot Rates,’’ The Journal of FinancialResearch, Summer 1986, pp. 153–62.The lack of success of forecasting models isreflected in the low correlations between the variableswhich would normally be associated withexchange rates. Indeed, many of the correlationsare opposite to what one would normally expect.The low and sometimes surprising correlations areindicated in Tables 13.2 and 13.3. Table 13.2 showsthe correlations between the level of the Japaneseyen–US dollar exchange rate, S(¥/$), and severalvariables which would be expected to be relatedto the exchange rate. 22 These variables include theUS–Japanese interest rate differential, (r $ r ¥ ),US versus Japanese prices, P US /P JP , US versusJapanese narrowly-defined money supplies, (M US /M JP ), and US versus Japanese industrial production,22 The correlations are provided by Richard Meese,‘‘Currency Fluctuations in the Post-Bretton Woods Era,’’Journal of Economic Perspectives, Winter 1990, pp. 117–34.All data are in logarithms, except interest rates, and coverthe period January 1974–July 1987.289 &
MANAGING FOREIGN EXCHANGE RISK AND EXPOSURE(Y US /Y JP ). Table 13.3 shows the correlations for theequivalent variables for the US versus Germany.The first feature of these tables that is noticeableis the low level of some of the correlations. As Meesehimself concludes, the correlations ‘‘suggest that itmay be challenging to explain exchange-rate fluctuations...with macroeconomic fundamentals.’’ 23The second thing we notice is that some of the correlationshave the opposite sign to what we wouldexpect. For example, relatively rapid US moneysupplygrowth causes the dollar to appreciatevis-à-vis the Deutschemark, the opposite to theprediction of the so-called Monetary Theory ofExchange Rates which suggests a declining currencyvalue from relatively rapid expansion of the moneysupply; the positive correlation in Table 13.3suggests that as M US /M GY goes up, S(DM/$) alsogoes up, which means a dollar appreciation fromrapid money-supply growth. 24 The negative correlationsbetween the interest differentials andexchange rates are even more curious: relativelyhigher US interest rates are associated with a dollardepreciation in both tables.News and exchange ratesWhen events occur that are relevant for exchangerates, but which were widely expected to occur,these events should have no impact on exchangerates. Therefore, in regressions of measures ofexpected events on exchange rates, regression coefficientsshould be zero; when the explanatory variableson the right-hand side of the equation changeas expected, the exchange rate on the left-handside should not change. The situation is different forunexpected events, which are frequently referredto as ‘‘surprises.’’ Examples of surprises are interestrate changes that were not anticipated, money23 Meese, ibid., p. 120.24 However, we should be careful interpreting simplecorrelations when the explanatory variables are correlated.For example, exchange-rate money correlations could reflecteffects of money working indirectly on exchange ratesthrough interest rates and other variables.& 290supply growth that differed from expectations, andso on. These surprise events are the ones that shouldaffect exchange rates. The low correlations andstatistical insignificance of macroeconomic variablesthat have been found could be due to using theactual values of the variables instead of only thesurprise components: in general, a large part ofactual values, especially in the levels of variables,should be expected.Basing his approach on the preceding argument,Jacob Frenkel examined how exchange ratesrespond to surprises in the interest rate differential.25 Specifically, he estimated the regression,stated in dollar–pound form but estimated also forthe Deutschemark and French franc.S n ð$/£Þ ¼b 0 þ b 1 F n ð$/£Þþ b 2 ½ðr $ r £ Þ ðr $ r £ Þ Šþ mð13:8Þwhere (r $ r £ ) is the actual interest differential ondollar- and pound-denominated securities, and(r $ r £ ) is the expected interest rate differential.The surprise is therefore [(r $ r £ ) (r $ r £ ) ].Interest rate expectations are implied in the termstructure of interest rates, based on the principlethat long-term interest rates involve forecasts offuture short-term interest rates. Expected interestrate differentials are also based on forward exchangepremiums/discounts. Frenkel finds a statisticallysignificant b 2 , suggesting that ‘‘news’’ in the formof unexpected interest differentials does relate toexchange rates. However, non-stationarity of the25 Jacob A. Frenkel, ‘‘Flexible Exchange Rates, Prices, andthe Role of ‘News’: Lessons from the 1970s,’’ Journal ofPolitical Economy, August 1981, pp. 665–705. See alsothe summaries of Frenkel’s study in Douglas K. Pearce,‘‘Information, Expectations, and Foreign Exchange MarketEfficiency,’’ in Thomas Grennes (ed.), <strong>International</strong>Financial Markets and Agricultural Trade, Westview Press,Boulder, Co, 1989, p. 241, and Mack Ott and PaulT.W.M. Veugelers, ‘‘Forward Exchange Rates in EfficientMarkets: The Effects of News and Changes in MonetaryPolicy Regimes,’’ Review, Federal Reserve Bank of St. Louis,June/July 1986, pp. 5–15.
EXCHANGE-RATE FORECASTING AND SPECULATIONspot rate limits confidence in the findings. FollowingFrenkel, Sebastian Edwards includes news onmoney supply and national income as well as oninterest rates, and finds, as expected, that unexpectedlyrapid money growth leads to depreciation.26 On the other hand, using vector autoregression – a technique which bases expectationson the best fitted relationship found from a long listof potential factors – Christian Wolff finds no effectof news. 27The role of surprises has also been investigatedusing event study methodology in which specificnews events are related to subsequent changes inexchange rates. This allows implications to bedrawn about the possibility of predicting exchangerates – we can see if exchange rates respond tocertain variables – as well as on market efficiency.(In an efficient market, prices respond immediately,not with a lag.) Craig Hakkio and Douglas Pearcefind that during 1979–82, when the US FederalReserve was trying to achieve target growth rates ofthe money supply, following an announcement thatmoney-supply growth was higher than expected,the dollar appreciated. 28 This appreciation wascompleted within 20 minutes of the release of themoney-supply statistics. This is consistent with anefficient market, and with the market’s view thatexcessive money growth will be curbed in thefuture, forcing interest rates and hence the dollarhigher. (The curbing of money growth in the futureis necessary to keep the longer term money growth26 Sebastian Edwards, ‘‘Exchange Rates and News: A Multi-Currency Approach,’’ Journal of <strong>International</strong> Money and<strong>Finance</strong>, December 1982, pp. 211–24.27 Christian C.P. Wolff, ‘‘Exchange Rates, Innovations andForecasting,’’ Journal of <strong>International</strong> Money and <strong>Finance</strong>,March 1988, pp 49–61.28 Targeting the money-supply involves attempting to keepthe money-supply growth rate within a specific range.For the details see Craig S. Hakkio and Douglas K. Pearce,‘‘The Reaction of Exchange Rates to Economic News,’’Economic Inquiry, October 1985, pp. 621–36. See alsoG.A. Hardouvelis, ‘‘Economic News, Exchange Rates andInterest Rates,’’ Journal of <strong>International</strong> Money and <strong>Finance</strong>,March 1988, pp. 23–5.within the target range. The slower money growthmakes money relatively scarce, and thereby raisesinterest rates. Higher interest rates increase thedemand for the currency and hence its price.)The dollar did not respond to expected changes inthe money supply, just as we would predict. Whilesome effect of surprises in money growth persistedafter the money-supply targeting period ended in1982 – perhaps because the market believed the Fedhad not entirely given up money targeting – theeffect did eventually disappear. This is consistentwith the view that after the market had concludedthat the Fed had finished targeting the money supply,surprises in money had no implication forfuture money supply, and hence no implication forinterest rates or exchange rates. Similar studies ofthe effects of announcements of trade-balance statisticson exchange rates show similar results; tradebalancesurprises have effects which depend on howmarkets expect governments to respond. 29Rather than separating variables into expectedand unexpected components, Martin Evansand James Lothian have separated variables intotransitory (temporary) and permanent components.30 Normally, it would be expected thattransitory shocks would play a small role in variationsin exchange rates. However, contrary toexpectations, Evans and Lothian have shown asignificant role for transitory shocks.29 See Ken Hogan, Michael Melvin, and Dan J. Roberts,‘‘Trade Balance News and Exchange Rates: Is There aPolicy Signal,’’ Journal of <strong>International</strong> Money and <strong>Finance</strong>,supplement, March 1991, pp. S90–S99; Raj Aggarwal andDavid C. Schirm, ‘‘Balance of Trade Announcements andAsset Prices: Influence on Equity Prices, Exchange Ratesand Interest Rates,’’ Journal of <strong>International</strong> Money and<strong>Finance</strong>, February 1992, pp. 80–95; and Keivan Deravi,Philip Gregorowicz, and Charles E. Hegji, ‘‘Balance ofTrade Announcements and Movements in ExchangeRates,’’ Southern Economic Journal, October 1988,pp. 279–87.30 Martin D. Evans and James R. Lothian, ‘‘The Response ofExchange Rates to Permanent and Transitory Shocks UnderFloating Exchange Rates,’’ Journal of <strong>International</strong> Money and<strong>Finance</strong>, December 1993, pp. 563–86.291 &
MANAGING FOREIGN EXCHANGE RISK AND EXPOSUREChanging regimesAs we explained when describing the effects ofmoney-supply surprises on exchange rates duringthe period of money targeting, the nature ofgovernment economic policy plays an importantrole. In particular, we showed that if the Fed isattempting to keep the money-supply growth ratewithin a stated target range, surprise increases in themoney supply should cause a dollar appreciation:the Fed would respond to excessive money growthby restricting the growth of money in the future,thereby increasing interest rates, and in turn, thedollar. On the other hand, if instead of targeting themoney supply the Fed were to target interest rates,which means trying to keep interest rates at agiven level, then a surprise increase in the moneysupply would have a different effect. Specifically,a surprisingly large money-supply growth wouldimply future inflation. This would tend to push upinterest rates, a tendency that the Fed might try tooffset by increasing the money supply even further.The resulting inflation could eventually causea dollar depreciation. 31In reality, market participants do not hold a givenview of the policy regime that is in effect. Rather,there is a probability distribution about themarket’s view of the policy regime behind governmentaction. The probability distribution couldtake the form of some investors believing that it isone policy that the government is following, whileother investors think it is a different policy. Alternatively,the probability distribution could take theform of all investors attaching common probabilitiesto possible different regimes being behindgovernment actions. Whatever the nature of theprobability distribution we have in mind, beliefsabout the underlying policy regime that is in effectchange slowly, and this has important implicationsfor market efficiency. Let us explain this in terms ofthe peso problem, which is one of the earliest31 See Martin Eichenbaum and Charles Evans, ‘‘SomeEmpirical Evidence on the Effects of Monetary PolicyShocks on Exchange Rates,’’ National Bureau of EconomicResearch, Working Paper 4271, 1993.& 292contexts in which the issue of perceived regimechanges was raised. 32When the Mexican peso was under heavy sellingpressure in 1982, beliefs in the willingness of theauthorities to maintain the exchange rate started toshift. More and more market participants began tothink the Mexican government would let the pesodrop, and/or each participant began to reduce theirestimate of the probability the authorities wouldcontinue to prop up the peso. This shifting of beliefstook place gradually over a period of time. However,empirical tests of market efficiency assumethat a given regime is in effect. Estimating modelswhich assume a given regime is in effect when in factbeliefs are shifting gradually over time producessequentially related prediction errors. For example,while the government manages to hold theexchange rate, the prediction of a possible depreciationmeans the market underestimates the valueof the peso time and again. The sequentially relatederrors could be interpreted as a market inefficiency:in an efficient market people do not make sequentiallyrelated (repeated) errors. However, instead ofmarket inefficiency, the errors could representshifting regime beliefs. Unless researchers canmodel the evolution of beliefs about the underlyingpolicy regime, it is not possible to disentangle thealternate hypotheses of market inefficiency versusregime shifting and reach a definitive conclusion. 33In other words, researchers may conclude that foreignexchange markets ignore relevant information32 See William S. Krasker, ‘‘The Peso Problem in Testing theEfficiency of the Forward Market,’’ Journal of MonetaryEconomics, April 1980, pp. 269–76.33 On regime switching see Richard G. Harris and DouglasD. Purvis, ‘‘Incomplete Information and the EquilibriumDetermination of the Forward Exchange Rate,’’ Journalof <strong>International</strong> Money and <strong>Finance</strong>, December 1982,pp. 241–53; René Stultz, ‘‘An Equilibrium Model ofExchange Rate Determination and Asset Pricing withNontraded Goods and Imperfect Information,’’ Journal ofPolitical Economy, October 1987, pp. 1024–40; and KarenK. Lewis, ‘‘The Persistence of the ‘Peso Problem’ whenPolicy is Noisy,’’ Journal of <strong>International</strong> Money and <strong>Finance</strong>,March 1988, pp. 5–21.
EXCHANGE-RATE FORECASTING AND SPECULATION& Table 13.4 The performance of econometric-oriented servicesCurrencyForwardrateBerkeleyConsultingGroupDRIForexResearchPredex Service 5 Service 6 Arithmeticaverage(services only)Share of forecasts for which the exchange rate moved in the indicated direction in the subsequent 3-month periodCanadian dollar 62 83 53 a n.a. 30 31 n.a. 49French franc 37 63 43 a 30 73 27 25 a 44Deutschemark 67 57 77 a 60 73 45 63 63Yen 54 50 67 a 67 47 37 n.a. 54Swiss franc 80 n.a. n.a. n.a. 47 n.a. 10 29Sterling 50 60 63 a 60 43 37 29 a 49Arithmetic average 58 63 61 54 52 35 32 50Share of forecasts in which the predicted rate was closer to the spot rate than was the comparable forward rateCanadian dollar 60 27 a n.a. 13 37 n.a. 34French franc 57 33 a 48 40 38 57 a 46Deutschemark 24 63 a 57 41 33 53 45Yen 37 60 a 62 30 20 n.a. 42Swiss franc n.a. n.a. n.a. 30 n.a. 10 20Sterling 70 33 a 47 47 40 48 a 48Arithmetic average 50 43 54 34 34 42 43Notea Based on part period data.Source: Stephen Goodman, ‘‘No Better than the Toss of a Coin,’’ Euromoney, December 1978, pp. 75–85.because they consistently over- or under-estimatefuture exchange rates, when in fact the model theresearcher is using is the cause of the persistenterrors: the prediction model being used is the samein all periods, when in reality it should allow for agradual change in beliefs over time.The record of forecasting servicesClosely related to the question of market efficiencyis the success of exchange-rate forecasting services.Do they give their users a better idea of whereexchange rates are going than can be obtained bylooking at other generally available sources ofinformation such as the forward rate? The answerappears to be that forecasting services have differentlevels of success, but in general do a poor job. Let usconsider the evidence.Stephen Goodman performed a numberof statistical tests on a large group of forecastingservices. 34 He classified the services according to thetechniques they employ. He separated those thatuse econometric (i.e. statistical) techniques fromthose that use subjective evaluations and thosethat use technical decision rules. The econometricapproach involves estimation of the relation betweenexchange rates and interest rates, inflation differentials,and other explanatory variables. The modelsmentioned earlier would fit in this category. Thetechnical rules are generally based on relating futureto past exchange rates. The subjective approach iswhat you would think it is – forecasting by personalopinion. Goodman compared predictions made bythe forecasting services with what eventuallyoccurred. He examined the accuracy of predictionsmade between January and June in 1978.Table 13.4 summarizes the results for theeconometric forecasts in predicting trends and in34 See Stephen H. Goodman, ‘‘No Better than the Toss of aCoin,’’ Euromoney, December 1978, pp. 75–85.293 &
MANAGING FOREIGN EXCHANGE RISK AND EXPOSUREpredicting actual spot exchange rates (‘‘pointestimates’’). The first column in the top half of thetable on predicting trends shows how often theforward rate was on the correct side of the currentspot rate. Because speculators move the forwardrate towards the expected future spot rate, theforward rate provides a benchmark against which tojudge whether the forecasting services provideinformation in addition to what is readily availablewithout charge: the forward rate can be seen in thenewspaper or obtained from a bank. We see thatexcept in the case of the French franc, the forwardrate is in the correct direction more than 50 percentof the time. On the other hand, the remainder ofthe top half of Table 13.4 shows that forecasters aresometimes correct about trends less than 50 percentof the time. This suggests that the predictive accuracyof forecasting services is weak. The bottom halfof Table 13.4 compares the point estimate predictionsof the forecasting services with the forwardrate‘‘predictions.’’ The table shows that predictedlevels of spot rates are frequently further away fromthe realized rates than forecasts based simply onforward rates.Tables 13.5 and 13.6 show the results of anadditional test that Goodman performed. In orderto compare forecasting success, Goodman computedthe rates of return from following the adviceof the different services. The rates of return fromfollowing the advice of the econometric-based& Table 13.5 Speculative return on capital from following the advice of econometric services (in percentages)CurrencyBuy andHoldBerkeleyConsultingGroupDRIForexResearchPredex Service 5 Service 6 Arithmeticaverage(Servicesonly)Canadian dollar Buy (15.12) 2.52 (2.88) n.a. (4.96) (0.60) n.a. (1.48)Sell 6.88 5.16 a n.a. (2.08) 3.52 n.a. 3.37Total (15.12) 4.40 1.64 a n.a. (3.60) 0.28 n.a. 0.68French franc Buy 3.20 7.32 5.76 a 2.40 7.20 3.24 10.08 a 6.00Sell 2.28 (0.64) a (3.16) 3.68 (2.68) 13.80 a (2.39)Total 3.20 4.20 1.40 a 0.02 5.92 0.08 2.60 a 2.37Deutschemark Buy 6.80 5.72 13.00 a 6.52 7.56 16.08 10.84 9.95Sell (13.92) (1.96) a (7.00) (4.40) (4.04) (4.88) (6.03)Total 6.80 (1.56) 5.80 a (1.60) 4.68 0.64 0.36 1.39Yen Buy 12.52 7.36 15.56 a 12.92 21.08 4.80 n.a. 12.34Sell (16.40) (13.68) a (8.92) (9.56) (15.76) n.a. (12.86)Total 12.52 (5.32) 3.88 6.16 (2.40) (7.96) n.a. (1.13)Swiss franc Buy 9.64 n.a. n.a. n.a. 18.80 n.a. n.a. 18.80Sell n.a. n.a. n.a. (6.12) n.a. n.a. (6.12)Total 9.64 n.a. n.a. n.a. 0.52 n.a. n.a. 0.52Sterling Buy 0.12 14.04 4.56 8.40 2.76 2.16 6.20 a 6.35Sell 10.48 (12.40) a 4.68 2.44 1.12 (9.32) a (0.50)Total 0.12 12.04 (2.24) a 6.04 2.60 1.52 (2.52) a 2.91Arithmetic average 2.86 2.75 2.10 2.66 1.29 (1.09) 0.15 1.12Notesa Based on part period data. Parentheses indicate a negative. The total is the return on all transactions, both buy and sell;it is equal to the weighted average of the return on buys and on sells, where the weights are the share of transactions whichare buys and sells respectively. Totals for arithmetic average column represent horizontal sums; arithmetic average forarithmetic average column represents vertical sum of totals.Source: Stephen Goodman, ‘‘No Better than the Toss of a Coin,’’ Euromoney, December 1978, pp. 75–85.& 294
EXCHANGE-RATE FORECASTING AND SPECULATION& Table 13.6 Speculative return on capital from following the advice of technical services (in percentages)Currency<strong>International</strong>forecastingShearsonHayden, StoneWaldnerArithmeticaverageCanadian dollar Buy 0.99 4.61 2.50 2.70Sell 4.60 5.19 6.22 5.34Total 5.59 9.80 8.72 8.04Number oftransactions/year5 17 11 11French franc Buy (2.42) n.a. 3.82 0.70Sell (3.66) n.a. 0.53 (1.57)Total (6.08) n.a. 4.35 (0.87)Number oftransactions/year5 n.a. 15 10Deutschemark Buy 10.49 8.78 7.53 8.93Sell 2.46 3.02 1.19 2.22Total 12.95 11.80 8.72 11.16Number oftransactions/year5 25 13 14Yen Buy 12.42 10.95 11.78 11.72Sell (1.73) (1.63) (1.52) (1.63)Total 10.69 9.32 10.26 10.09Number oftransactions/year5 21 12 13Swiss franc Buy 9.52 12.99 2.76 8.42Sell 2.07 3.11 (10.28) (1.70)Total 11.60 16.10 (7.52) 6.73Number oftransactions/year5 22 14 14Sterling Buy 6.70 2.62 9.24 6.19Sell 5.55 2.64 9.93 6.04Total 12.25 5.26 19.17 12.23Number of transactions/year 4 24 12 13Arithmetic average Total 7.83 10.46 7.28 7.90Number of transactions/year 5 22 13 13NotesParentheses indicate a negative. Total is the return on all transactions, both buy and sell. Totals for arithmetic average columnrepresent horizontal sums. Arithmetic average column represents vertical sum of totals.Source: Stephen Goodman, ‘‘No Better than the Toss of a Coin,’’ Euromoney, December 1978, pp. 75–85.services are given in Table 13.5. The performanceof the advisory services can be compared with thestrategy of just buying currencies and holding them,a practice which because the US dollar droppedagainst most currencies during the period, offeredgains on every currency other than the Canadiandollar. The econometric forecasters had a poorrecord. However, the technically oriented services,295 &
MANAGING FOREIGN EXCHANGE RISK AND EXPOSUREwhose performances are summarized in Table 13.6,did a good job. Before adjustments for transactioncosts or risk, the total returns from buying andselling according to their advice show an averageyield of almost 8 percent. This means that if theadvice of these services had been followed with themaintenance of a 5 percent margin, the return onthe margin after adjusting for transaction costswould have been 145 percent. However, therewould also have been periods of losses, and a followerof the advice might not have survived to enjoythe profit available to those currency speculatorswho did survive. Stated differently, we do not knowwhether the return of 145 percent is sufficient forthe risk that is involved.Richard Levich has also examined the performanceof the advisory services, but his conclusionsare rather different from the conclusions of StephenGoodman. 35 While Levich also found the subjectiveand technical forecasts to be more accurate thaneconometric forecasts in the short run, he found theopposite for forecasts of a year (a period not checkedby Goodman). Levich did find some gain from followingthe advice of the advisory services. Furtherevidence of success of professional forecasters over1-year and 3-month horizons is described in Exhibit13.1, while Exhibit 13.2 describes the success of arenowned forecaster, George Soros. Unfortunately,as explained earlier, it is difficult to decide whetherthe return from following the forecasters is sufficientto compensate for the risk of taking positionsbased on these forecasts.Success of different forecasting methodsA manifestation of the risk of following the advice ofexchange-rate forecasters is that there is a large dispersionof opinion among them. This is directly35 Richard Levich, ‘‘Analyzing the Accuracy of ForeignExchange Advisory Services: Theory and Evidence,’’ inRichard Levich and Clas Wihlberg (eds), Exchange Risk andExposure: Current Developments in <strong>International</strong> FinancialManagement, D.C. Heath, Lexington, MA, 1980. See alsoRichard J. Sweeney, ‘‘Beating the Foreign ExchangeMarket,’’ Journal of <strong>Finance</strong>, March 1986, pp. 163–82.& 296evident from examination of the expressed opinionsof forecasters, and indirectly from the immensevolume of transactions that occur in foreign exchangemarkets. If all participants agreed on how exchangerates would evolve, transactions would occur onlyfor commercial and investment reasons. Therewould be no transaction due to buyers believinga currency is worth more than what the sellersbelieve if buyers and sellers hold the same opinion.Furthermore, transactions would largely involvenon-financial firms – notably importers, exporters,borrowers and investors – trading with financialfirms, notably banks. However, analysis of foreignexchange transactions data collected biannually bythe Federal Reserve Bank of New York shows thatover 95 percent of foreign exchange changes handsbetween banks and other financial firms. That is, lessthan 5 percent of transactions involve non-financialfirms. In other words, banks and other financialestablishments are trading between themselves,presumably because buyers of a currency believe it tobe worth more than the sellers believe. 36Jeffrey Frankel and Kenneth Froot have examineddata for the British pound, German mark,Japanese yen, and Swiss franc and found that tradingvolume and dispersion of expectations were positivelyrelated in these four currencies. 37 They havealso shown that the volatility of exchange rates isrelated to trading volume.The connection between volatility of exchangerates and dispersion of expectations of forecasterscan be related to one of the explanations ofexchange overshooting discussed later in this book.This explanation involves a choice between followingthe advice of technical forecasters, those36 If the value of a currency is judged in portfolio terms,diversification value would be behind trading as well as theexpected change in the exchange rate. Therefore, it ispossible that both buyer and seller agree on the expectedchange in exchange rate, but differ in terms of the valuefrom diversification.37 Jeffrey A. Frankel and Kenneth A. Froot, ‘‘Chartists,Fundamentalists, and Trading in the Foreign ExchangeMarket,’’ American Economic Review, Papers and Proceedings,May 1990, pp. 181–5.
EXCHANGE-RATE FORECASTING AND SPECULATIONEXHIBIT 13.1THE SUCCESS OF PROFESSIONAL FORECASTERSIt has been said that an economist is a person withone foot in the freezer and the other in the oven whobelieves that on average things are just about OK. Thecynicism behind this comment reflects the view thataverages can hide wide dispersions. Therefore, even ifforecasters were able on average to predict exchangerates better than freely available forward rates, wemight still wonder how this average was formed. Wereall forecasters successful, or were they widely differentand successful only on average? Similarly, weresome forecasters right year after year and otherswrong year after year, or were the successful forecastersthemselves difficult to predict? The summarybelow, which describes the research of Jeffrey Frankeland Menzie Chinn, tells us only of the success offorecasters, on average. We must still ask whether therisk, which would be present if it were different forecasterswho were successful at different times or ifforecasters were widely different and correct only onaverage, is excessive for the returns earned.Banks, multinationals, and anyone else who participatesin international currency markets coulduse more accurate forecasts of foreign exchangerates. Yet predictions in this area have beennotoriously bad. It often has been found thatinvestors would do better to ignore current forecasts.Instead, they could view the exchange rateas an unpredictable random walk, just as likely torise as to fall. Now a new study by NBER ResearchAssociate Jeffrey Frankel and Menzie Chinn findsthat professional forecasts, under certain conditions,can help to predict changes in exchangerates. Frankel and Chinn examine the monthlypredictions from an average of about 45 forecastersregarding the currencies of 25 developedand developing countries between February 1988and February 1991. The data come from CurrencyForecasters’ Digest. Frankel and Chinn alsoexamine monthly predictions for these currenciesbased on the value of their exchange rates inforward markets, where participants promise toexchange currencies in the future at a specifiedprice.In ‘‘Are Exchange Rate Expectations Biased?Tests for a Cross Section of 25 Currencies,’’Frankel and Chinn report that the prediction basedon forward markets is wrong more often than not.Both the three-month-ahead predictions and the12-month-ahead predictions of exchange rateshifts have the wrong sign more than half thetime. The average of the professional forecasterswhen they look either three or 12 months aheadacross the 25 currencies, on the other hand, is rightmore than half the time.Source: ‘‘Forecasting Foreign Exchange Rates,’’ The NBERDigest, National Bureau of Economic Research, November1991.basing views on past exchange rates; and followingthe advice of fundamentalist forecasters, thosebasing views on economic fundamentals. Theexplanation of overshooting assumes a positiveassociation between the success of forecasters andthe numbers of market participants who follow theforecasters. 38 If the chartists who follow trends38 See Jeffrey A. Frankel and Kenneth A. Froot, ‘‘TheDollar as an Irrational Speculative Bubble: A Tale ofFundamentalists and Chartists,’’ National Bureau of EconomicResearch, Working Paper 959, January 1988.happen to be more correct than the fundamentalists,the chartists will gain followers thereby reinforcingthe trend. For example, when a currency is rising,the chartists who base beliefs on extrapolatingthe past will be correct, people will buy according tothe chartists’ recommendations, and therefore thechartists’ forecasts will prove to be correct. This‘‘positive feedback’’ can, according to the theory,cause exchange rates to move well beyond theirvalues based on economic fundamentals. Eventually,however, the rates will be so inappropriate297 &
MANAGING FOREIGN EXCHANGE RISK AND EXPOSUREEXHIBIT 13.2GOOD LUCK OR GOOD JUDGEMENT?In 1992, with the British pound being pummeled byspeculators, one individual was particularly closelyassociated with the huge losses incurred by the Bankof England as it tried to keep the pound within theEuropean Exchange Rate Mechanism (ERM) band.His name is George Soros, and his story is told brieflyin the following paragraphs.While Norman Lamont was dithering last autumn,unable to make up his mind whether to take theU.K. out of the European exchange rate mechanism,the Hungarian-born financier, George Soros,was clear that the pound was overvalued and neededto free itself from its constricting currencystrait jacket. What is more, he was ready togamble $10 billion backing his judgment.Mr. Soros was the one who read the economicrunes correctly. With his now renowned senseof timing, he committed his Quantum Fund,based in the Netherlands Antilles, to selling sterlingshort up to this value (and, in fact, more).The Chancellor countered that he would spendup to $15bn defending his currency. ButMr. Soros’s sales of sterling provided the momentumthat put the pound into an uncontrollablespin. On Black Wednesday, 16 September 1992,Mr. Lamont was ignominiously forced to backtrackand bring sterling out of the ERM. Over theprevious few days, the U.K. had lost around $10bntrying to shore up its currency, while Mr. Sorosmade a cool $1bn for the Quantum Fund out ofhis punt.Today Mr. Lamont is out of his job, while theiconoclastic Mr. Soros is riding on the crest of awave. One up for the hidden hand of the market? Orsimply another dubious achievement for internationalspeculators?His gamble on sterling certainly put Mr. Soroson the world media map. Previously he wasknown to the general public only as the reclusivemillionaire who in 1990 sacked his butler and hiswife after a row involving the use of a £500 bottleof Château Lafite as cooking wine in a goulash.After Black Wednesday he became as a ThamesTelevision documentary dubbed him, The ManWho Broke the Pound . . .Mr. Soros was born in Budapest in 1930. Hisfather was a Hungarian Jewish lawyer who survivedinternment as a prisoner of war in Siberiabetween 1917 and 1921. Similarly George Soros,then known as Dzjehdzhe Shorosh, survived theNazi occupation of Hungary during the SecondWorld War. In 1947 he escaped the communistregime, coming first to Berne and then to London.Still only a teenager, he worked as a farm hand,house painter and railway porter before winninga place to study economics at the London Schoolof Economics in 1949. There he met his intellectualmentor, the Austrian philosopher KarlPopper, whose theories on scientific method andwhose book, The Open Society and its Enemies,deeply influenced the young fugitive fromcommunism . . .Mr. Soros’s break came in 1963 when he washired by Arnhold and S. Bleichroader to adviseAmerican institutions on their European investments.He persuaded his employers to start up twooffshore funds – the First Eagle Fund in 1967 andthe Double Eagle Fund in 1969. By 1973, hewanted more of the action himself. With his thenpartner James Rogers, he took many of the DoubleEagle investors and started up the Soros Fund(later the Quantum Fund) in Curaçao. By the endof the decade the fund was chalking up annualreturns of over 100% and George Soros was upamong the seriously rich.Source: Andrew Lycett, ‘‘Soros: Midas or Machiavelli?’’Accountancy, July 1993, pp. 36–40.& 298
EXCHANGE-RATE FORECASTING AND SPECULATION& Table 13.7 Connection between past changes inexchange rates and median forecasts of futurerates: different forecast horizonsSource of data on forecastsMMS <strong>International</strong> a The Economist b1-week 4-week 3-month 6-month 12-month0.13 c 0.08 0.08 c 0.17 c 0.33 c(4.32) (1.60) ( 2.98) ( 4.98) ( 5.59)Notest-statistics given in parentheses below coefficients.a Period, October 1984–January 1988.b Period, June 1981–August 1988.c Significant at 99 percent confidence level.Source: Jeffrey A. Frankel and Kennett A. Froot,‘‘Chartists, Fundamentalists, and Trading in the ForeignExchange Market,’’ American Economic Review, Papersand Proceedings, May 1990, p. 184.that the chartists’ projections will prove wrong,followers of forecasters will switch to thefundamentalists’ advice, reinforcing the opinion ofthe fundamentalists, causing more to follow thefundamentalists’ advice, and so on.Survey data from a variety of sources indicate alarge and growing influence of chartist-forecastingtechniques, especially for short horizons. Forexample, Table 13.7 shows the result of analysisof forecasts gathered by MMS <strong>International</strong> andThe Economist for overlapping time periods. 39 Thetable shows the extent that a 1 percent increase inthe value of the US dollar in a 1-week period causesforecasters, as measured by the median (middle)forecast, to anticipate a further dollar appreciation.We see that for 1 week horizons a 1 percent dollarappreciation is associated with a median belief ina further 0.13 percent dollar appreciation. Thisdrops to 0.08 percent at the 4-week horizon.However, the longer horizon forecasts using surveydata from The Economist reveal reversions, withforecasters believing that past-week changes inexchange rates will eventually be reversed. Indeed,the median forecast is for a third of past-weekchanges to be reversed within 1 year.The overshooting role of chartists is indirectlysupported by the forecasting techniques used by the39 Jeffrey A. Frankel and Kenneth A. Froot, op. cit.& Table 13.8 Forecasting methods of EuromoneyrespondentsYearNumberusingchartistmethodsNumberusingfundamentals1978 3 19 01981 1 11 01983 8 1 11984 9 0 21985 15 5 31986 20 8 41987 16 6 51988 18 7 6NumberusingbothmethodsSource: Jeffrey A. Frankel, ‘‘Chartists, Fundamentalists,and Trading in the Foreign Exchange Market,’’ NationalBureau of Economic Research, NBER Reporter, February1991.services surveyed by Euromoney. 40 Table 13.8 showsthe shift from economic fundamentals to chartisttechniques in the period 1978–88. The data alsoreveal, however, an increasingly large number offorecasting services using both methods. Theseconclusions are supported by a questionnaire surveyconducted on behalf of the Bank of England in1988. 41 The questionnaire, which solicited theviews of chief foreign exchange dealers based inLondon, revealed that more than 90 percent consideredtechnical – that is, chartist – factors inmaking forecasts over one or more time horizons,with the dependence on technical views being morepronounced over shorter horizons. As with theevidence from MMS <strong>International</strong> versus The Economist,more attention is paid to fundamental analysisthe longer the forecasting horizon.The reliance on technical forecasts has beenreinforced by the success of technical trading rules.These include rules based on past exchange rates40 See Jeffrey A. Frankel, ‘‘Chartists, Fundamentalists, andTrading in the Foreign Exchange Market,’’ National Bureauof Economic Research, Annual Research Conference, 1991.41 See Mark P. Taylor and Helen Allen, ‘‘The Use ofTechnical Analysis in the Foreign Exchange Market,’’Journal of <strong>International</strong> Money and <strong>Finance</strong>, June 1992,pp. 304–14.299 &
MANAGING FOREIGN EXCHANGE RISK AND EXPOSUREsuch as ‘‘buy if the 1-week moving average movesabove the 12-week moving average, and sell whenthe opposite occurs.’’ A popular form of technicaltrading rule involves the use of a so-called filter. Afilter rule might be to buy whenever a currencymoves more than a given percentage above itslowest recent value, and to sell when it moves agiven percentage above its highest recent value. 42The success of a variety of relatively simple ruleshas been reported by several researchers looking atdifferent parts of the foreign exchange market. Forexample, Michael Dooley and Jeffrey Shafer, andalso Dennis Logue, Richard Sweeney, and ThomasWillett, found profits from trading in the spotmarket. 43 These profits persisted even after allowancefor transaction costs, although it is not clearwhether they are sufficient for the risk involved.Trading rules have also been found profitable in theforward market and the futures market. However,there is an indication that trading based on simplerules is becoming less profitable. 44 This is what onewould expect because as the rules become known,they are followed by more speculators, and profitsare then competed away. Therefore, perhaps theinefficiencies found in the various studies discussedabove are a matter of history, a mere artifact offoreign exchange market participants learning aboutthe instruments in which they are trading. Alternatively,perhaps the inefficiencies are the result ofpredictability of central-bank intervention policiesof the past, with central banks shifting to lesspredictable or to less activist behavior.SUMMARY1 In the absence of transaction costs, a risk-neutral forward speculator buys a foreigncurrency forward if the forward price of the currency is below the expected future spotprice. A risk-neutral speculator sells forward if the forward price of the foreign currencyexceeds the expected future spot price.2 With transaction costs, a risk-neutral speculator buys if the forward ask price of theforeign currency is less than the expected future spot bid price, and sells if the forwardbid price exceeds the expected future spot ask price.3 Futures speculation is similar to forward speculation except that the futures contract canbe sold back to the exchange prior to maturity allowing gains and losses to be taken.There is also marking-to-market risk on currency futures.4 A speculator buys a call on a foreign currency if the probability-weighted sum of possiblepayouts based on the speculator’s opinion exceeds the price of the option by enough tocompensate for the opportunity cost and risk involved.42 On forward market trading rules see Paul Boothe, ‘‘Estimating the Structure and Efficiency of the Canadian Foreign ExchangeMarket,’’ unpublished PhD dissertation, University of British Columbia, 1981, and on futures market rules see RichardM. Levich and Lee R. Thomas III, ‘‘The Significance of Technical Trading-Rule Profits in the Foreign Exchange Market:A Bootstrap Approach,’’ Journal of <strong>International</strong> Money and <strong>Finance</strong>, October 1993, pp. 451–74.43 See Michael Dooley and Jeffrey Shafer, ‘‘Analysis of Short-Run Exchange Rate Behavior: March 1973 to November 1981,’’in David Bigman and Teizo Taya (eds), Exchange Rates and Trade Instability, Ballenger, Cambridge, MA, 1983, pp. 43–9; DennisLogue, Richard Sweeney, and Thomas Willett, ‘‘Speculative Behavior of Foreign Exchange Rates During the Current Float,’’Journal of Business Research, 6, 1979, pp. 159–74; and Stephan Schulmeister, ‘‘Currency Speculation and Dollar Fluctuations,’’Quarterly Review, Banca Nationale del Lavoro, December 1988, pp. 343–65.44 See Levich and Thomas, op. cit.& 300
EXCHANGE-RATE FORECASTING AND SPECULATION5 Investment in favor of a foreign currency can be achieved by borrowing domesticcurrency, buying the foreign currency spot, and purchasing an investment instrumentdenominated in the foreign currency. This is a swap and is equivalent to buying theforeign currency forward.6 It is possible to speculate against a foreign currency by borrowing that currency,converting it spot into domestic currency, and investing in the domestic currency.7 Not hedging an exposure that can be avoided is speculation.8 Speculation offers abnormal returns if markets are inefficient. In an efficientforeign exchange market, relevant information is reflected in exchange rates.Weak-form efficiency occurs when relevant information on past exchange rates isreflected in current rates; semi-strong efficiency when all publicly available informationis reflected; and strong-form efficiency when all information, public and private,is reflected.9 A difference between the forward rate and the expected future spot rate is calledforward bias. A joint test of forward bias and of foreign exchange market efficiency is toregress forward rates and other relevant information on realized spot exchange rates.The absence of forward bias is implied by a zero constant and a forward-ratecoefficient of unity. Efficiency is implied by zero coefficients on any other includedvariables.10 Efficiency can also be tested by examining the sequential errors in forward forecasts ofrealized spot exchange rates. Omitted information is likely to cause sequentially related(persistent) prediction errors.11 Forward bias is the risk premium that forward market participants require to compensatethem for taking positions in particular currencies. Others are willing to pay thiscompensation to avoid risk.12 Exchange-rate forecasting models have not generally predicted well outside theestimation period. This is the case even when realized values of variables believed toinfluence exchange rates are used in the formation of predictions.13 Correlations between exchange rates and variables believed to affect exchangerates are generally low and sometimes have the opposite signs to those we wouldexpect.14 While widely expected events should not cause exchange rates to change, surprise eventsshould affect exchange rates. Evidence on the effect of surprises is mixed.15 Slowly changing opinions among market participants about the underlyingpolicy regime governing exchange rates can generate data that appears to supportmarket efficiency, when in fact it is caused by shifting beliefs about the relevant regime.It is important that any model used to judge market efficiency be based on theregime beliefs that market participants hold.16 Exchange-rate forecasting services have a generally poor record of outdoing theforward rate when predicting future spot exchange rates. This is what marketefficiency would imply. However, some forecasts based on chartist techniqueswhich project according to past exchange rates, have allowed speculatorsto make profits. More emphasis seems to have been given to chartist forecastingtechniques based on their success. This could cause exchange-rate volatility in the form ofovershooting exchange rates.301 &
MANAGING FOREIGN EXCHANGE RISK AND EXPOSUREREVIEW QUESTIONS1 In what ways are speculation, market efficiency, and forecasting closely related matters?2 Taking into account transaction costs, what does a speculator compare when decidingwhether to go long in a particular foreign currency via a forward exchange contract?3 Taking into account transaction costs, what does a speculator compare when decidingwhether to go short in a particular foreign currency via a forward contract?4 Are futures more or less liquid than forwards for a currency speculator?5 What is the main advantage of options versus forwards or futures as an instrument ofcurrency speculation?6 What is required to go long in the euros vis-à-vis the US dollar via a swap?7 How would you short the euro via a swap?8 Why is doing nothing when importing or exporting tantamount to speculation onexchange rates?9 What is meant by weak-form, semi-strong form, and strong-form market efficiency?10 Are there any ‘‘insiders’’ in the foreign exchange markets?11 What type of regression equation could you use to simultaneously test the efficiency of theforeign exchange market and the existence of forward bias?12 Is it possible to test for the omission of important factors in the pricing of foreigncurrencies without any measures of these factors?13 What is meant by ‘‘rational’’ forecasts?14 Why might you compare the performance of a spot exchange-rate forecasting model withthe ability of forward exchange rates to predict eventually realized spot rates?15 Is the correlation coefficient between the ratio of US to Japanese prices and the exchangerate of the Japanese yen per dollar, likely to be positive or negative?16 Why might anticipated changes in variables appear statistically insignificant whenrelated to exchange rates?17 What is an ‘‘event study’’ and how could it be applied to learning about what influencesexchange rates?18 What problem is presented by ‘‘changing regimes’’ in a study of market efficiency?19 What type of information is used in ‘‘technical’’ forecasting?20 What might you deduce about what has happened to different peoples’ opinions onexchange rates from an increase in the volume of foreign exchange transactions?ASSIGNMENT PROBLEMS1 Why might a speculator prefer speculating on the futures market to speculating withforward exchange contracts?2 What is the advantage of speculating with options?3 If foreign exchange markets were very efficient, what would this imply about the profitsfrom foreign exchange cash management?& 302
EXCHANGE-RATE FORECASTING AND SPECULATION4 Why might foreign exchange markets be efficient even if it is possible to make a positivereturn from using forecasting techniques?5 Why does forward bias depend on risk aversion?6 How might you speculate on the exchange rate being less volatile than the market as awhole believes?7 Why can we test for market efficiency without including any variables which mightinfluence exchange rates in our test?8 How might low correlations of individual variables with exchange rates hide a strongrelationship of many variables when included together?9 What different interpretations can be given to the shifting of the probability distributionof beliefs about a policy regime?10 Do huge profits by an individual speculator such as George Soros necessarily implymarkets are inefficient?BIBLIOGRAPHYBaillie, Richard and Patrick C. McMahon, The Foreign Exchange Market: Theory and Econometric Evidence,Cambridge University Press, New York, 1989.Boothe, Paul and David Longworth, ‘‘Foreign Exchange Market Efficiency Tests,’’ Journal of <strong>International</strong> Moneyand <strong>Finance</strong>, June 1986, pp. 135–52.Chen, T.J. and K.C. John Wei, ‘‘Risk Premiums in Foreign Exchange Markets: Theory and Evidence,’’ Advances inFinancial Planning and Forecasting, 4, 1990, pp. 23–42.Chiang, Thomas C., ‘‘Empirical Analysis of the Predictors of Future Spot Rates,’’ The Journal of FinancialResearch, Summer 1986, pp. 153–62.Chinn, Menzie and Jeffrey Frankel, ‘‘Patterns in Exchange Rate Forecasts for Twenty-five Currencies,’’ Journal ofMoney, Credit and Banking, November 1994, pp. 759–70.Dunis, Christian and Michael Feeny (eds), Exchange Rate Forecasting, Woodhead-Faulkner, New York, 1989.Everett, Robert M., Abraham M. George, and Aryeh Blumberg, ‘‘Appraising Currency Strengths and Weaknesses:An Operational Model for Calculating Parity Exchange Rates,’’ Journal of <strong>International</strong> Business Studies,Fall 1980, pp. 80–91.Frankel, Jeffrey A. and Kenneth A. Froot, ‘‘Using Survey Data to Test Some Standard Propositions RegardingExchange Rate Expectations,’’ American Economic Review, March 1987, pp. 133–53.Froot, Kenneth A. and Richard H. Thaler, ‘‘Anomalies: Foreign Exchange,’’ Journal of Economic Perspectives,Summer 1990, pp. 179–92.Goodman, Stephen H., ‘‘No Better than the Toss of a Coin,’’ Euromoney, December 1978, pp. 75–85.Hodrick, Robert J., The Empirical Evidence on the Efficiency of Forward and Futures Foreign Exchange Markets,Harwood Academic Publishers, New York, 1988.——and Sanjay Srivastava, ‘‘An Investigation of Risk and Return in Forward Foreign Exchange,’’ Journal of<strong>International</strong> Money and <strong>Finance</strong>, April 1984, pp. 5–29.Koedjik, Kees G. and Mack Ott, ‘‘Risk Aversion, Efficient Markets and the Forward Exchange Rate,’’ Review,Federal Reserve Bank of St. Louis, December 1987, pp. 5–8.Kohers, Theodor, ‘‘Testing the Rate of Forecasting Consistency of Major Foreign Currency Futures,’’ <strong>International</strong>Trade Journal, Summer 1987, pp. 359–70.303 &
MANAGING FOREIGN EXCHANGE RISK AND EXPOSUREKrugman, Paul and Maurice Obstfeld, <strong>International</strong> Economics: Theory and Policy, Harper-Collins, New York,1994.Kwok, Chuck C.Y. and LeRoy D. Brooks, ‘‘Examining Event Study Methodologies in Foreign Exchange Markets,’’Journal of <strong>International</strong> Business Studies, 21, 2, second quarter 1990, pp. 189–224.Levich, Richard M., ‘‘On the Efficiency of Markets for Foreign Exchange,’’ in Rudiger Dornbusch and JacobA. Frenkel (eds), <strong>International</strong> Economic Policy: Theory and Evidence, Johns Hopkins University Press,Baltimore, MD, 1979.——‘‘Analyzing the Accuracy of Foreign Exchange Advisory Services: Theory and Evidence,’’ in Richard Levichand Clas Wihlberg (eds), Exchange Risk and Exposure: Current Developments in <strong>International</strong> FinancialManagement, D.C. Heath, Lexington, MA, 1980.——and Lee R. Thomas III, ‘‘The Significance of Technical Trading-Rule Profits in the Foreign Exchange Market:A Bootstrap Approach,’’ Journal of <strong>International</strong> Money and <strong>Finance</strong>, October 1993, pp. 451–74.Lewis, Karen K., ‘‘Can Learning Affect Exchange Rate Behavior? The Case of the Dollar in the Early 1980s,’’Journal of Monetary Economics, 23, 1989, pp. 79–100.Mark, Nelson C., ‘‘Exchange Rates and Fundamentals: Evidence on Long-Horizon Predictability,’’ AmericanEconomic Review, March 1995, pp. 201–18.Meese, Richard A. and Kenneth Rogoff, ‘‘Empirical Exchange Rate Models of the Seventies: Do They Fit Out ofSample?’’ Journal of <strong>International</strong> Economics, February 1983, pp. 3–24.——, ‘‘Currency Fluctuations in the Post-Bretton Woods Era,’’ The Journal of Economic Perspectives, Winter1990, pp. 117–34.Pearce, Douglas K., ‘‘Information, Expectations, and Foreign Exchange Market Efficiency,’’ in Thomas Grennes(ed.), <strong>International</strong> Financial Markets and Agricultural Trade, Westview, Boulder, CO, 1989, pp. 214–60.Sarno, Lucio and Mark P. Taylor, The Economics of Exchange Rates, Cambridge University Press, New York,2003.Sweeney, Richard J., ‘‘Beating the Foreign Exchange Market,’’ Journal of <strong>Finance</strong>, March 1986, pp. 163–82.Taylor, Dean, ‘‘Official Intervention in the Foreign Exchange Market, or Bet against the Central Bank,’’ Journal ofPolitical Economy, April 1982, pp. 356–68.& 304
Part V<strong>International</strong> investment and financingIf there is any individual factor which commandsprincipal responsibility for the astonishingly rapidglobalization of the world economy, that factor issurely international investment in its various forms.For example, the global flow of foreign direct investment,FDI, which involves managerial control overseasthrough the extent of ownership, grew from under$180 billion in 1991 to approximately $1.5 trillion in2000, an eight-fold increase in a decade. The growthin multinational organizations which has resultedfrom this direct investment is partly responsiblefor the fact that by 2001, over 28 percent of the globalGDP was produced by 200 companies. It is thefactors behind and the consequences of these startlingstatistics that are the focus of Part V of this book.The first three chapters of Part V consider thethree categories of international capital flowsappearing in the balance-of-payments accounts,namely, short-term investments (Chapter 14), portfolioinvestments (Chapter 15), and direct investments(Chapter 16). These categories are identified by balance-of-paymentsstatisticians and presented separatelyin this book because they represent differentdegrees of liquidity, with short-term investmentsbeing the most liquid and direct investments theleast liquid.Chapter 14, which deals with short-term investments,begins with a discussion of the criterion formaking short-term covered investments when thereare costs of transacting in the foreign exchange markets.Since short-term investments are an importantaspect of cash management, the chapter looks also atshort-term borrowing decisions and a number of otheraspects of the management of working capital in amultinational context.Chapter 15, which deals with portfolio investment,considers international aspects of stock and bondinvestment decisions, paying particularly close attentionto the benefits of international portfolio diversification.It is shown that international diversificationoffers significant advantages over domestic diversification,despite uncertainty about exchange rates. Asection is included on the international capital assetpricing model. This model is used to compare theimplications of internationally segmented versus integratedcapital markets. Chapter 15 ends with a discussionof bond investments, again with a focus ondiversification issues.Chapter 16 considers a capital-budgetingframework that management can employ whendeciding whether or not to make FDIs. We shall seethat a number of problems are faced in evaluatingforeign investments that are not present when evaluatingdomestic investments. These extra problemsinclude the presence of exchange-rate and countryrisks, the need to consider taxes abroad as well as athome, the issue of which country’s cost of capital touse as a discount rate, the problem posed by restrictionson repatriating income, and the frequent need toaccount for subsidized financing. The means fordealing with these difficulties are clarified by anextensive example.Chapter 16 includes an appendix in which varioustopics in taxation are covered, some of whichare relevant for the capital-budgeting procedureused for evaluating FDIs. The appendix offers a
general overview of taxation in the internationalcontext, covering such topics as value-addedtax – which is assuming increasing internationalimportance – tax-reducing organizational structures,and withholding tax.It is through FDI that some companies have growninto the giant multi-national corporations (MNCs)whose names have entered every major language –Sony, IBM, Shell, Ford, Nestlé, Mitsubishi, Citibank,and so on. Chapter 17 examines various reasons forthe growth in relative importance of MNCs, as wellas the reasons for international business associationsthat have resulted in transnational alliances. Thechapter also considers some special problems facedby multinational corporations and transnational alliances,including the need to set transfer prices ofgoods and services moving between divisions and theneed to measure and monitor country risk. The difficultiesin obtaining and using transfer prices aredescribed, as are some methods of measuring countryrisk. Clarification is given of the differences betweencountry risk and two narrower concepts, politicalrisk and sovereign risk. Methods for reducing oreliminating country risk are described. Chapter 17concludes with an account of the problems and benefitsthat have accompanied the growth of multinationalcorporations and transnational alliances.This involves a discussion of the power of these giantorganizations to frustrate the economic policies ofhost governments, and of the transfer of technologyand jobs that results from FDI.The final chapter of Part V, Chapter 18, deals withproject financing. The issues addressed include thecountry of equity issue, foreign bonds versus Eurobonds,bank loans, government lending, and mattersthat relate to financial structure. Overall, we shall seein Part V that there are important matters which areunique to the international arena, whether the issueconcerns the uses or the sources of funds. We shall alsosee that substantial progress has been made inunderstanding many of the thornier multinationalmatters.
Chapter 14Cash managementWhere credit is due, give credit. When credit is due, give cash.Evan EsarTHE OBJECTIVES OF CASHMANAGEMENTInflows and outflows of funds are generally uncertain,especially for large multinational corporations withsales and production activities throughout the world.It is therefore important for companies to maintainliquidity. The amount of liquidity and the form itshould take constitute the topic of working-cash(or working-capital) management. Liquidity cantake a number of forms, including coin and currency,bank deposits, overdraft facilities, and short-termreadily marketable securities. These involve differentdegrees of opportunity cost in terms of forgoneearnings available on less liquid investments.However, there are such highly liquid short-termsecurities in sophisticated money markets thatvirtually no funds have to remain completely idle. Insome locations there are investments with maturitiesthat extend no further than ‘‘overnight,’’ and thereare overdraft facilities which allow firms to holdminimal cash balances. This makes part of the cashmanagement problem similar to the problem ofwhere to borrow and invest.The objectives of effective working-capitalmanagement in an international environment are1 to allocate short-term investments and cashbalanceholdings between currencies andcountries to maximize overall corporate returns;2 to borrow in different money markets toachieve the minimum cost.These objectives are to be pursued under the conditionsof maintaining required liquidity andminimizing any risks that might be incurred.The problem of having numerous currency andcountry choices for investing and borrowing, whichis the extra dimension of international finance, isalso faced by firms which deal only in local markets.For example, a firm that produces and sells onlywithin the United States will still have an incentiveto earn the highest yield, or borrow at the lowestcost, even if that means venturing to foreign moneymarkets. There are additional problems faced byfirms that have a multinational orientation ofproduction and sales. These include the questionsof local versus head-office management of workingcapital, and how to minimize foreign exchangetransaction costs, political risks, and taxes. Weaddress these questions in this chapter along withmatters faced by all firms concerned with investmentreturns and borrowing costs. We will alsodescribe some actual international cash managementsystems that have been devised.Let us begin our discussion of cash managementby considering whether a company should invest orborrow in domestic versus foreign currency, whereany foreign exchange exposure and risk is hedged by307 &
INTERNATIONAL INVESTMENT AND FINANCINGusing forward exchange contracts. While thischoice was discussed in Chapter 8, in that chapterwe focused on arbitrage and interest parity, ratherthan hedged investment and borrowing choices withtransaction costs. After discussing the investmentand borrowing criteria we turn to whether a companywith receipts and payments in differentcountries and currencies should manage workingcapital locally or centrally. We shall see that thereare a number of advantages to centralization of cashmanagement, and only a few disadvantages.INVESTMENT AND BORROWINGCHOICES WITH TRANSACTION COSTSInvestment criterion with transaction costsAn investment in pound-denominated securities bya holder of US dollars requires first a purchase of spotpounds. The pounds must be bought at the poundoffer or ask rate, S($/ask£), so that $1 will buy1£Sð$/ask£ÞThis initial investment will grow in n years at theinvestment return of r I £1£Sð$/ask£Þ ð1 þ rI £ ÞnThis can be sold forward at the buying or bid rate onpounds, F n ($/bid£), giving a US investor, after nyears,$ F nð$/bid£ÞSð$/ask£Þ ð1 þ rI £ ÞnThe amount received from $1 invested instead inUS dollar-denominated securities for n years at anannual rate r I $ is $(1 þ rI $ )n . Therefore, the rule for aholder of US dollars is to invest in pound securitieswhenF n ð$/bid£ÞSð$/ask£Þ ð1 þ rI £ Þn > ð1 þ r I $ Þn ð14:1Þ& 308and to invest in dollar securities when the reverseinequality holds.If we had ignored foreign exchange transactioncosts, then instead of the condition (14.1) we wouldhave written the criterion for investing in poundsecurities asF n ð$/£ÞSð$/£Þ ð1 þ rI £ Þn > ð1 þ r I $ Þn ð14:2ÞIn comparing the conditions (14.1) and (14.2)we can see that because transaction costs ensurethat F n ($/bid£) < F n ($/£) and S($/ask£) > S($/£),where F n ($/£) and S($/£) are the middle exchangerates (i.e. the rates half way between the bid andask rates), the condition for advantageous hedgedinvestment in pound securities by a dollar-holdinginvestor is made less likely by the presence oftransaction costs on foreign exchange. That is, theleft-hand side of (14.1), which includes transactioncosts, is smaller than the left-hand side of(14.2), which excludes transaction costs. However,because both interest rates are investment rates,transaction costs on securities represented by aborrowing–lending spread have no bearing on thedecision, and do not discourage foreign versusdomestic-currency investment.For example, suppose we haveS($/bid£) S($/ask£) F 1/2 ($/bid£) F 1/2 ($/ask£) r I $ r I £1.5800 1.5850 1.5600 1.5670 7% 10%where r I $ and rI £ are respectively the dollar andpound interest rates on 6-month securities,expressed on a full year, or per annum, basis. Then,receipts from the dollar investment at the end of the6 months on each dollar originally invested are$ð1 þ r I $ Þn ¼ $ð1:07Þ 1/2 ¼ $1:03441If the investor does not bother to calculate thereceipts from the pound security using the correctside of the spot and forward quotations, butinstead uses the midpoint values half way between‘‘bids’’ and ‘‘asks,’’ that is, S($/£) ¼ 1.5825 and
CASH MANAGEMENTF 1/2 ($/£) ¼ 1.5635, then receipts from the hedgedpound security are$ F 1/2ð$/£ÞSð$/£Þ ð1 þ rI £ Þ1=2 ¼ $ 1:56351:5825 ð1:10Þ1/2¼ $1:03622This amount exceeds the $1.03441 from the dollardenominatedsecurity, making the pound securitythe preferred choice. However, if the correctexchange rates are used, reflecting the fact thathedged investment in pound-denominated securitiesrequire buying pounds spot at the ask price andselling pounds forward at the bid price, then theproceeds from the pound security are calculated as$ F 1/2ð$/bid£ÞSð$/ask£Þ ð1 þ rI £ Þ1=2 ¼ $ 1:56001:5850 ð1:10Þ1/2¼ $1:03227The dollar-denominated security with receipts of$1.03441/$ invested is seen to be better than thepound-denominated security for a dollar-holdinginvestor. That is, the correct choice is the dollarsecurity, a choice that would not be made withoutusing the exchange rates which reflect the transactioncosts of buying and selling pounds. Theexample confirms that inclusion of transaction costson foreign exchange tends to favor the choice ofdomestic-currency investments.Borrowing criterion with transaction costsWhen a borrower considers using a swap to raiseUS dollars by borrowing pounds, the borrowedpounds must be sold at the pound selling rate,S($/bid£). For each $1 the dollar borrower wants heor she must therefore borrow1£Sð$/bid£ÞThe repayment on this number of borrowed poundsafter n years at r B £ per annum is1£Sð$/bid£Þ ð1 þ rB £ ÞnThis number of pounds can be bought forward atthe buying rate for pounds, F n ($/ask£), so that thenumber of dollars paid in n years for borrowing $1today is$ F nð$/ask£ÞSð$/bid£Þ ð1 þ rB £ ÞnAlternatively, if $1 is borrowed for n years in USdollars at r B $ per annum, the repayment in n years is$ð1 þ r B $ ÞnThe borrowing criterion that allows for foreignexchange transaction costs is that a borrower shouldobtain dollars by borrowing hedged British pounds(i.e. via a swap) wheneverF n ð$/ask£ÞSð$/bid£Þ ð1 þ rB £ Þn < ð1 þ r B $ Þn ð14:3ÞBecause F n ($/ask£) > F n ($/£) and S($/bid£)
INTERNATIONAL INVESTMENT AND FINANCINGask exchange rates but instead used mid-point rates,the repayment per dollar borrowed would becomputed from the left-hand side of equation(14.4) as$ F nð$/£ÞSð$/£Þ ð1 þ rB £ Þn ¼ $ 1:55351:5825 ð1:12Þ1/2¼ $1:03891The borrower would choose the pound-denominatedloan because it requires a smaller repayment.However, if the borrower selected the proper bidand ask rates as in the left-hand side of equation(14.3), the repayment on the swap would be$ F nð$/ask £ÞSð$/bid £Þ ð1 þ rB £ Þn ¼ $ 1:55701:5800 ð1:12Þ1/2¼ $1:04289This is larger than the repayment from borrowingdollars. We find that the incentive to venture intoforeign-currency denominated borrowing is reducedby the consideration of foreign exchange transactioncosts, just as is the incentive to invest in foreigncurrency.Unlike the situation with investment, whereborrowing–lending spreads are irrelevant, in thecase of borrowing, foreign-currency borrowingmay be discouraged by borrowing–lending spreads.This is because when foreign funds are raised abroad,lenders may charge foreign borrowers more thanthey charge domestic borrowers because theyconsider loans to foreigners to be riskier. Forexample, the mark-up over the prime interest ratefor dollars facing a US borrower in the United Statesmight be smaller than the markup over prime forthe same US borrower when raising pounds inBritain. This may be due to greater difficultycollecting on loans to foreigners, or to the difficultyof transferring credible information on creditworthinessof borrowers between countries.However, if the pounds can be raised in the UnitedStates, there should be no difference betweendollar–pound investment spreads and borrowingspreads.& 310Firms invest and borrow cash because sometimesthey have net cash inflows and at other times theyhave net cash outflows. While the investing andborrowing criteria that we have given provide a wayof choosing between alternatives, they do notprovide guidance on some of the complexities ofmultinational cash management. For example, howshould a company respond when one subsidiary hassurplus amounts of a currency, while another subsidiarywhich operates independently needs toborrow the same currency? Should a companyhedge all its foreign-currency investments and/orborrowing when it deals in numerous differentforeign currencies and thereby enjoys some naturaldiversification? Good cash management in these andother situations requires some centralization offinancial management and perhaps also centralholding of the funds themselves. As we shall seelater, centralization has several advantages but alsosome disadvantages when the holdings of funds, aswell as management decisions concerning the funds,are centralized.INTERNATIONAL DIMENSIONS OFCASH MANAGEMENTAdvantages of centralizedcash managementNettingIt is extremely common for multinational firms tohave divisions in different countries, each havingaccounts receivable and accounts payable, as wellas other sources of cash inflows and outflows,denominated in a number of currencies. If thedivisions are left to manage their own workingcapital, it can happen, for example, that one divisionis hedging a long pound position while at thesame time another division is hedging a short poundposition of the same maturity. This situation can beavoided by netting, which involves the calculationof the overall position in each currency. Thiscalculation requires some central coordination ofcash management.
CASH MANAGEMENTThe benefit that is enjoyed from the ability to netcash inflows and outflows through centralized cashmanagement comes in the form of reduced transactioncosts. The amount that is saved depends onthe extent that different divisions deal in the samecurrencies and have opposite positions in thesecurrencies. 1 The benefit also depends on the lengthof the period over which it is feasible to engage innetting. This in turn depends on the ability topractice leading and lagging.Leading and lagging involve the movement ofcash inflows and outflows forward and backward intime so as to permit netting and achieve othergoals? 2 For example, if Aviva has to pay £1 millionfor denim on June 10 and has received an order for£1 million of jeans from Britain, it might attempt toarrange payment for about the same date andthereby avoid exposure. If the payment for the jeanswould normally have been after June 10 and thereceivable is brought forward, this is called leadingof the export. If the payment would have beenbefore June 10 and is delayed, this is called laggingof the export. In a similar way it is possible to leadand lag payments for imports.When dealing at arm’s length, the opportunitiesfor netting via leading and lagging are limited by thepreferences of the other party. However, whentransactions are between divisions of the samemultinational corporation, the scope for leading andlagging (for the purpose of netting and achievingother benefits such as deferring taxes by delayingreceipts) is considerable. Recognizing this, governmentsgenerally regulate the length of credit andacceleration of settlement by putting limits on1 Clearly, if all divisions are long in a foreign currency, or alldivisions are short in the foreign currency, the transactioncostadvantage of centralized cash management exists only ifthere are economies of scale in transacting. Of course, thereare in fact such economies of scale.2 Leading and lagging are practised to defer income and therebydelay paying taxes and to create unhedged positions in orderto speculate; cash managers may delay paying out currenciesthey expect to appreciate and accelerate paying out currenciesthey expect to depreciate. Leading and lagging are thereforeused to hedge, speculate, and reduce taxes.leading and lagging. The regulations vary greatlyfrom country to country, and are subject to change,often with very little warning. If cash managers areto employ leading and lagging successfully and notfind themselves in trouble with tax authorities, theymust keep current with what is allowed. 3Currency diversificationWhen cash management is centralized it is possiblenot only to net inflows and outflows in each separatecurrency, but also to consider whether the company’sforeign exchange risk is sufficiently reducedvia natural diversification that the company need nothedge all the individual positions. The diversificationof exchange-rate risk results from the factthat exchange rates do not all move in harmony.Consequently, a portfolio of inflows and outflows indifferent currencies will have a smaller varianceof value than the sum of variances of the values ofthe individual currencies. 4 We can explain thenature of the diversification benefit by consideringa straightforward example.Suppose that in its foreign operations, Aviva buysits cloth in Britain and sells its finished garmentsin both Britain and Germany in the followingamounts:Germany (¤) Britain (£)Denim purchase 0 2,000,000Jeans sales 1,500,000 1,000,000The timing of payments for British denim and thetiming of sales of jeans are the same. (Alternatively,we could think of the revenue from the export ofjeans as receipts from foreign investments, and the3 The regulations governing leading and lagging are describedeach year by Business <strong>International</strong> in its Money Report. Thelarge multinational accounting firms also publish the currentregulations.4 For an account of the size of diversification benefits seeMark R. Eaker and Dwight Grant, ‘‘Cross-Hedging ForeignCurrency Risk,’’ Working Paper, University of NorthCarolina, August 1985.311 &
INTERNATIONAL INVESTMENT AND FINANCINGpayment for imports of cloth as repayment ofa debt.)One route open to Aviva is to sell forward thed1.5 million it is to receive and, after netting itspound position, buy forward £1 million. Avivawould then be hedged against changes in bothexchange rates versus the dollar. An alternative,however, is to consider how the British pound andthe euro move vis-à-vis the dollar and hencebetween themselves. Let us suppose for the purposeof revealing the possibilities, that when the euroappreciates vis-à-vis the dollar, generally the pounddoes so as well. In other words, let us suppose thatthe euro and pound are highly positively correlated.Such a correlation will occur if the source ofexchange-rate movements stems from economicdevelopments in the United States. For example,good news concerning the US currency such as areduced current account deficit would likely increasethe value of the dollar against both the euro andthe pound.With net pound payables of £1 million, euroreceivables of d1.5 million, and spot exchange ratesof, for example, S($/d) ¼ 1.2 and S($/£) ¼ 1.8, thepayables and receivables cancel out: the payable toBritain is £1 million $1.8/£ ¼ $1.8 million at thecurrent rate, and the receivable from Germany isd1.5 million $1.2/d ¼ $1.8 million. The risk isthat exchange rates can change before payments aremade and receipts are received. However, ifthe pound and the euro move together and theUS dollar depreciates against both of the currenciesby, for example, 10 percent to S($/d) ¼ 1.32 andS($/£) ¼ 1.98, then payments to Britain will be£1 million $1.98/£ ¼ $1,980,000, and receiptsfrom Germany will be d1.5 million $1.32/d ¼$1,980,000, which is still the same. The amountthat is lost through extra dollar payments to Britainwill be offset by extra dollar revenue fromGermany. We find in this case that Aviva is quitenaturally unexposed if it can be sure that thecurrencies will always move together vis-à-vis thedollar.In our example, we have, of course, selected veryspecial circumstances and values for convenience.& 312In general, however, there is safety in largenumbers. If there are receivables in many differentcurrencies, then when some go up in value, otherswill come down. There will be some canceling ofgains and losses. Similarly, if there are many payables,they can also cancel. Moreover, as in ourexample, receivables and payables can offset eachother if currency values move together. There aremany possibilities that are not obvious, but it shouldbe remembered that although some canceling ofgains and losses might occur, some risk will remain.A firm should use forward contracts or some otherform of hedging if it wishes to avoid all foreignexchange risk and exposure. However, a firm with alarge variety of small volumes of payables andreceivables (i.e. small volumes in many differentcurrencies) might consider that all the transactioncosts involved in the alternative forms of hedgingare not worthwhile in view of the natural hedgingfrom diversification. The determination of whetherthe diversification has sufficiently reduced the riskcan only be made properly when cash managementis centralized.PoolingPooling occurs when cash is held as well asmanaged in a central location. The main advantageof pooling is that higher returns can be enjoyed dueto economies of scale in returns offered on investmentvehicles such as bank deposits. 5 At the sametime, cash needs can be met wherever they occurout of the centralized pool without having to keepprecautionary balances in each country. Uncertaintiesand delays in moving funds to where theyare needed require that some balances be maintainedeverywhere, but with pooling, a givenprobability of having sufficient cash to meet liquidityneeds can be achieved with smaller cash holdingsthan if holdings are decentralized. The reason5 See Antoine Gautier, Frieda Granot, and Maurice D. Levi,‘‘Alternative Foreign Exchange Management Protocols: AnApplication of Sensitivity Analysis,’’ Journal of MultinationalFinancial Management, February 2002, pp. 1–20.
CASH MANAGEMENTpooling works is that cash surpluses and deficienciesin different locations do not move in a perfectlyparallel fashion. As a result, the variance of totalcash flows is smaller than the sum of the variances offlows for individual countries. For example, whenthere are large cash-balance outflows in Britain, it isnot likely that there will also be unusually largeoutflows in Australia, Japan, Sweden, Kuwait, andso on. If a firm is to have sufficient amounts in eachcountry, it must maintain a large cash reserve ineach. However, if the total cash needs are pooled in,for example, the United States, then when theneed in Britain is unusually high, it can be met fromthe central pool because there will not normallybe unusually high drains in other countries at thesame time.Security availability and efficiencyof collectionsAll of the advantages of centralized cash managementthat we have mentioned so far, which are allparticular aspects of economies of scale, wouldaccrue wherever centralization occurs. However, ifthe centralization occurs in a major internationalfinancial center such as London or New York, thereare additional advantages in terms of a broaderrange of securities that are available and an ability tofunction in an efficient financial system.It is useful for a firm to denominate as manypayments and receipts as its counterparties willallow in units of a major currency and to have billspayable in a financial center. Contracts for paymentdue to the firm should stipulate not only the paymentdate and the currency in which payment is tobe made, but also the branch or office at which thepayment is due. Penalties for late payment can helpensure that payments are made on time. The speedof collection of payments can be increased by usingpost-office box numbers wherever they are available.Similarly, if a firm banks with a large-scalemultinational bank, it can usually arrange for headofficeaccounts to be quickly credited using anelectronic funds transfer system, even if payment ismade at a foreign branch of the bank.Disadvantages of centralized cashmanagementUnfortunately, it is rarely possible to hold all cash ina major international financial center. This isbecause there may be unpredictable delays inmoving funds from the financial center to othercountries. If an important payment is due, especiallyif it is to a foreign government for taxes or to a localsupplier of a crucial input, excess cash balancesshould be held where they are needed, even if thesemean opportunity costs in terms of higher interestearnings available elsewhere. When the cash needsin local currencies are known well ahead of time,arrangements can be made in advance for receivingthe needed currency, but substantial allowances forpotential delay should be made. When one is usedto dealing in North America, Europe, and otherdeveloped areas, it is too easy to believe thatbanking is efficient everywhere, but the delays thatcan be faced in banks in some countries can beexceedingly long, uncertain, and costly.In principle it is possible to centralize the managementof working capital even if some funds do haveto be held locally. However, complete centralizationof management is difficult because localrepresentation is often necessary for dealing withlocal clients and banks. Even if a multinational bankis used for accepting receipts and making payments,problems can arise that can only be dealt with on thespot. Therefore, the question a firm must answer isthe degree of centralization of cash management andof cash holding that is appropriate, and in particular,which activities and currencies should bedecentralized. 6If interest parity always held exactly, the cashmanagement problem would be simplified in that itwould then not matter in which currency orcountry a firm borrowed or invested. However, aswe explained in Chapter 8, there are factors whichdo allow limited departures from interest parityto occur, at least from the perspective of any oneborrower or lender. Let us consider what each of6 Exhibit 14.1 explains how General Electric arrived at itsdecision about currency management centralization.313 &
INTERNATIONAL INVESTMENT AND FINANCINGEXHIBIT 14.1DECENTRALIZING CURRENCY MANAGEMENT ATGENERAL ELECTRICHaving considered the pros and cons ofcentralization of currency management, the US-basedglobal giant General Electric decided to downloadresponsibility. Their reasons are given below.General Electric (GE) is a global company, with13keybusinessoperationsallovertheworld,dealingin dozens of currencies. <strong>International</strong> activitiesinclude export sales, international sourcing, manufacturingand sales affiliates abroad, and jointventures, and other business associations. For someyears now, GE managers have been challenged to‘‘think globally’’ in all aspects of their business, andthis mindset permeates our organization.Management of currency risk goes hand-in-handwith the globalization of today’s business environment.GE’s philosophy of foreign exchangeexposure management is consistent with what werefer to as ‘‘Work-Out’’ – GE shorthand forempowerment of those closest to the action, andthe consequent elimination of layers of staff reviewand bureaucracy. Thus, at GE, foreign exchange isnot a staff responsibility, but an integral part ofmanaging a global business. It is one of a numberof external factors that a business must manage.Businesses are empowered to do it themselves, notonly by the company’s philosophy, but by the realityof the situation. They are closest to thestrategic and tactical decisions which are mostrelevant to FX (foreign exchange) exposuremanagement. They must decide such things as howand where to source materials and components;where to locate manufacturing facilities, and howto manage their working capital. Treasury’s job isto work with the businesses as they go throughtheir analysis and come up with a comprehensivecurrency management plan, but the business itselfis responsible for implementation and results ...Our major objectives for foreign exchangemanagement are earnings and cash flow. Ultimately,we must deliver earnings in dollars to ourshareholders. As such, the businesses are responsiblefor dollar net income, and therefore formanagement of their income-related currencyexposures. The objective is to neutralize exposure,not to take views on the markets. Hedging isencouraged, as a short-term tactical solution, tostabilize near-term net income. It is not seen as asubstitute for a long-term, strategic mindset. Noris it seen as a profit center, either within thebusiness or in treasury.Source: Marcia B. Whitaker, ‘‘Strategic Management ofForeign Exchange Exposure in an <strong>International</strong> Firm,’’ inYakov Amihud and Richard M. Levich (eds), ExchangeRates and Corporate Performance, New York UniversitySalomon Center, New York, 1994, pp. 247–51.the factors discussed earlier – transaction costs,political risk, liquidity preference, and taxes –implies for working-capital management. Weshall see that each factor has slightly differentimplications.Transaction costs, political risk, liquiditypreference, taxes, and cash managementTransaction costs are a reason for keeping funds inthe currency that is received if the funds might beneeded later in the same currency. For example, if& 314a firm receives 2 million won in payment for salesfrom its subsidiary in South Korea and needsapproximately this quantity of won to meet apayment in a month or two, the funds should beleft in Korean won if expected yields are notsufficiently higher in other currencies to cover twosets of transaction costs – out of won and backinto won.Political risk is a reason to keep funds in thecompany’s home country rather than in the countryin whose currency the funds are denominated. Thisis because the home jurisdiction is generally safer
CASH MANAGEMENTfor investors than foreign jurisdictions. 7 Thereduction in political risk that results from movingfunds home must, of course, be balanced against theextra costs this entails. Between most developedcountries, the transaction costs of temporarilymoving funds home are likely to exceed the benefitfrom reduced political risk, and so cash balances aremaintained offshore. However, the political situationin some third-world countries might be consideredsufficiently volatile that only minimalworking balances should be maintained in thosecountries.Liquidity considerations argue in favor of keepingfunds in the currency in which they are most likely tobe needed in the future. This might not be the currencyin which the funds arrive or the company’shome currency. The liquidity factor is hence differentfrom transaction costs, which suggest that fundsshould be kept in the currency in which they arrive,and it is also different from political risk, whichsuggests that funds should be kept at home. We usethe words ‘‘most likely’’ because it is the uncertaintyof cash flows that is responsible for the need tomaintain liquidity. If inflows and outflows were perfectlypredictable, a firm could arrange the maturities,currencies and locations of securities so that securitieswould mature at the precise time, place, and in theneeded currency. Complete certainty would do awaywith the precautionary motive for holding moneybalances. However, even with uncertainty in thetiming and amounts of cash inflows and outflows,extremely liquid money-market investments andoverdraft facilities at banks have allowed firms to keepmost of their funds in interest-bearing instruments.Withholding taxes are a reason to avoid countriesin which withholding tax rates exceed theinvestor’s domestic tax rate, because in such a caseit will not in general be possible to receive fullwithholding tax credit. Lower taxes on foreignexchange gains than on interest income are a reasonto invest in countries whose currencies are at a7 This is not always the case. There are countries whereinvestors would rather hold their funds in an offshorejurisdiction such as the United States or Switzerland thanat home.forward premium if the premium is treated as acapital gain and capital gains face favorable tax rates.However, for firms that are heavily involved indealing in many countries, foreign exchange gainsand interest earnings are likely to face the same taxrates. There is therefore little need to favor anyparticular market. The factors affecting the locationof working capital are summarized in Table 14.1.Examples of cash management systemsIt will be illustrative to end our discussion of cashmanagement by considering the cash managementsystems of two US multinational corporations. Bothof these corporations have undergone name changesand reorganizations as part of mergers and acquisitions,but what they set up illustrates how nettingcan be done, and how centralized cash managementthrough a currency center can be effected.Navistar <strong>International</strong>Navistar was formed in a reorganization of <strong>International</strong>Harvester, the farm and transportationequipment manufacturer. The company establisheda netting system that worked as follows. 8& Table 14.1 Factors affecting working-capitalmanagementFactorAbsence of forwardmarketsTransaction costsPolitical riskLiquidity requirementsTaxesImplicationKeep funds in the currencyreceived if an anticipatedfuture need existsKeep funds in the currencyreceivedMove funds to the domesticmarketKeep funds in the currencymost likely to be needed inthe futureAvoid high withholdingtaxes and keep funds inappreciating currencies8 See ‘‘Multilateral Netting System Cuts Costs, ProvidesFlexibility for <strong>International</strong> Harvester,’’ Money Report,Business <strong>International</strong>, December 20, 1979.315 &
INTERNATIONAL INVESTMENT AND FINANCINGBritishsubsidiarySFr5 million ($4 million)£1 million ($2 million)1.6 million ($2 million)£3 million ($6 million)SwisssubsidiarySFr2.5 million ($2 million)0.8 million ($1 million)Germansubsidiary(a) Receivables and payables reported to currency centerbefore the 15th of the monthOSFr2.5 million ($2 million)Britishsubsidiary£2 million ($4 million)£1 million ($2 million)SwisssubsidiarySFr3.75 million ($3 million)SFr1.25 million ($1 million)Germansubsidiary(b) Net payables/receivables (broken lines) and actual cash flows(solid lines) made on the 25th of the month& Figure 14.1 Example of Navistar <strong>International</strong>’s foreign exchange netting systemNotesIt is assumed that on the 15th of the month S(¤/$) ¼ 0.8, S(£/$ ¼ 0.5), and S(SFr/$) ¼ 1.25. Information on receivablesand payables is provided for the Swiss currency center on or before the 15th of the month. The currency center converts theamounts of foreign exchange into dollars at the going exchange rate (as shown in Figure 14.1(a)) and evaluates the net amountsowed between subsidiaries (as shown by the broken lines in Figure 14.1(b)). Rather than having the German subsidiary pay theBritish subsidiary the equivalent of $4 million while the British subsidiary in turn pays the Swiss subsidiary $2 million, theGerman subsidiary will be instructed to add $2 million onto what it pays the Swiss subsidiary and to reduce what it pays theBritish subsidiary by this amount. The British and Swiss subsidiaries will receive no instructions to pay anybody. The totalnumber of transactions will be reduced from six to only two. Transaction costs will be faced on only $5 million worth oftransactions.The netting system was based at a currencyclearing center, located in a finance company inSwitzerland. Prior to clearing foreign exchange, theSwiss finance company had been responsible fortransactions involving foreign currencies. The nettingscheme worked on a monthly cycle, as illustratedin Figure 14.1. By the 15th day of each& 316month, all participating subsidiaries sentinformation to the currency clearing center onpayables and receivables existing at that time in localcurrencies. The clearing center converted allamounts into dollars at the current spot exchangerate, and sent information to those subsidiaries withnet payables on how much they owed and to whom.
CASH MANAGEMENTThese paying subsidiaries were responsible forinforming the net receivers of funds and forobtaining and delivering the foreign exchange.Settlement was on the 25th of the month or theclosest business day, and the funds were purchasedtwo days in advance so that they were received onthe designated day. Any difference between theexchange rate used by the Swiss center on the 15thand the rate prevailing for settlement on the 25thgave rise to foreign exchange gains or losses thatwere attributed to the subsidiary.The original clearing system was for intracompanyuse and did not include outside firms.After a decade with this system, the companyintroduced a scheme for foreign exchange settlementsfor payments to outsiders. There were twodifferent dates, the 10th and the 25th or thenearest business day, on which all foreignexchange was purchased by and transferred fromthe Swiss center. The payment needs were sentelectronically to the center from the subsidiarymore than 2 days before the settlement date, andthe center netted the amounts of each currency soas to make the minimum number of foreignexchange transactions. The subsidiary which owedthe foreign exchange settled with the clearingcenter by the appropriate settlement date.According to the company, netting cut the totalnumber of transactions with outsiders in half,saving the company transaction costs.More flexibility was given to the cash managementsystem by the use of interdivisional leadingand lagging. If, for example, a subsidiary was a netpayer, it could delay or lag payment for up to twomonths while compensating the net receiver atprevailing interest rates. Net receivers of fundscould at their discretion make funds available toother subsidiaries at interest. In this way the needto resort to outside borrowing was reduced; theSwiss clearing center served to bring differentcompany subsidiaries together. The netting withleading and lagging allowed the company toeliminate intra-company floats and reduce by over80 percent the amount of money that wouldotherwise have been transferred.Compaq (HP)When it was known as Digital Equipment, Compaq,which is now part of Hewlett Packard, centralizedits cash management in two currency centers. 9The cash positions of European subsidiaries weremonitored and managed from the European headquartersin Geneva. Cash management for othersubsidiaries was handled by the company’s principalheadquarters in Acton, Massachusetts. The subsidiariesand appropriate headquarters communicatedelectronically, and the movement of cash wasfacilitated by the use of a limited number of US bankswith offices in many countries. The cash managementsystem worked as shown in Figure 14.2.Foreign exchange positions were established andadjusted on a weekly basis. Every Thursday, allsubsidiaries sent a report to the currency center attheir headquarters. In their statements they gaveprojected cash inflows and outflows in each foreigncurrency for the following week. They also gavetheir bank-account positions. Foreign sales subsidiarieswere generally net receivers of foreignexchange. On the following Monday the subsidiaryborrowed its anticipated net cash inflow via anoverdraft facility and transferred the funds to thecorporate headquarters’ account at the same bankfrom which it drew the overdraft funds. Forexample, if the British sales subsidiary expected netreceipts of £10 million and had no bank balance,it would call its banks for the best exchange rate.If the most favorable rate for buying dollarswas S($/£) ¼ 2.0, it would transfer $20 millionto the Geneva currency center by borrowing£10 million and converting it into dollars. Theselected bank – the one which offered the best rate9 An excellent account of Compaq’s centralized cashmanagement system can be found in ‘‘How DigitalEquipment’s Weekly Cash Cycle Mobilizes Idle Funds,’’Money Report, Business <strong>International</strong>, January 30, 1981. Asimilar system that uses a currency center in London wasoperated by RCA. The company adapted a system availablefrom Citibank for large clients which kept track of currencyneeds and netting. For a full account, see ‘‘Standard NettingSystem Remodeled to Suit RCA’s Own Needs,’’ MoneyReport, Business <strong>International</strong>, July 13, 1979.317 &
INTERNATIONAL INVESTMENT AND FINANCING£10 million receivedMay 6 –10UK subsidiary(net receiver)£10 million borrowed Monday, May 6£10 million + interest repaid, May 6 –10London office ofbankProjected receipts reportedThursday, May 2Projected receipts reportedThursday, May 2$20 million transferredMonday, May 6$6 million transferredFriday, May 10German subsidiary(net payer)Currency center inGeneva5 million + interest repaid, Friday, May 105 million borrowed during week of May 6 –10Money-marketinvestments fromMay 6 –10Frankfurt office ofbank5 million paidMay 6 –10& Figure 14.2 Digital Equipment’s weekly cash cycleNotesWe assume that the UK subsidiary is a net receiver of pounds and that the German subsidiary is a net payer of euros. Bothsubsidiaries send their cash-flow projections to the currency center on Thursday, May 2. On the following Monday the UKsubsidiary borrows its expected cash receipts and then transfers the dollar equivalent to Geneva. (It is assumed thatS($/£) ¼ 2.0.) The debt is repaid in the currency of borrowing during the week of May 6–10. The German subsidiary borrowseuros during the week of May 6–10 as its payments fall due. On Friday, May 10, the Geneva currency center transfer thedollar equivalent to the subsidiary. (It is assumed that S($/¤) ¼ 1.2.) This is used to repay the overdraft on the day. During theweek the currency center has $20 million to invest in the money market.on dollars – debited the British subsidiary’s accountin London by £10 million and, on the same day,credited the Geneva headquarter’s account with$20 million. The British subsidiary would repay the£10 million debt incurred due to the overdraft as thereceipts came in.& 318In order to ensure that it was able to make thesame-day transfers and obtain the overdrafts,Compaq maintained close ties with a limited numberof multinational US banks. The subsidiariesobtained funds only via overdrafts; they did not useother means of borrowing funds. Subsidiaries that
CASH MANAGEMENTwere net users of foreign exchange instead ofnet receivers used the reverse procedure. Thesubsidiary reported its need for cash to the appropriateheadquarters on Thursday, and beginning onthe following Monday, it used overdraft lines aspayments were met. On the following Friday thesubsidiary received funds from the parent companyto pay off the overdraft and make up for anyunanticipated disbursements that had been made.There were occasions when a subsidiary receivedmore funds than it anticipated, with this resulting intransfers to headquarters more than once a week.Alternatively, sometimes a subsidiary faced smallunprojected disbursements or late receipts. It thenused backup overdrafts. If a subsidiary faced unusuallylarge payments it called its parent for extrafunds. Compaq used post-office lock boxes inCanada and the United States in order to speed upthe handling of receivables, and in Europe, itinstructed customers to pay its bank directly ratherthan the local subsidiary itself. All investing orborrowing in currencies other than the US dollarwas hedged on the forward market to reduceforeign exchange exposure and risk.Because the amount of cash handled by the twoheadquarters was so large, it could generally beinvested more favorably than if each separate subsidiaryplaced it. Funds were invested in variousmoney markets. The parent had the total amountof funds from its many subsidiaries to invest fora week. A subsidiary would, however, repay theoverdraft during the week. It follows that theinterest costs on overdrafts were not as large asthe interest earnings of the headquarters.The major advantage of Compaq’s system wasthat there was no foreign exchange exposure forthe subsidiary. This is because the payable on theoverdraft was in the local currency, as was thereceivable against which the funds were borrowed.Local currency was paid out as it arrived. Anadditional advantage was that the currency centershandled large amounts of cash and could thereforeget lower spreads when buying and selling foreignexchange. They could also take a broader perspectiveof investment and borrowing opportunities aswell as enjoy the advantages of netting, currencydiversification, pooling, and financial efficiency thatwe discussed earlier.SUMMARY1 The choice between domestic-currency and foreign-currency investment or borrowingshould be based on spot and forward exchange-rate quotations which reflecttransaction costs.2 The need to buy/sell spot and then sell/buy forward for hedged foreign-currencyinvestment/borrowing tends to favor the domestic-currency alternative.3 Centralized cash management allows netting of long and short positions in each currency,where the positions are those of different divisions of a multinational company. The scopefor netting is enhanced by leading and lagging cash inflows and outflows.4 Centralized cash management provides an ability to consider how exposure to numerousexchange rates provides natural diversification.5 Centralization permits a broad view of investment and borrowing opportunities.6 Centralized cash management reduces the precautionary cash needs via pooling; fundscan be moved from the central location to where they are needed.7 Complete centralization is limited by the need to maintain local personnel to deal withunpredictable delays that can occur when moving funds between countries, and fordealing with local banks and clients.319 &
INTERNATIONAL INVESTMENT AND FINANCING8 The different reasons why interest parity may not hold have different implications for themanagement of working capital. In particular, transaction costs induce keeping fundsin the currency in which cash arrives, political risk induces keeping funds at home, liquidityconsiderations induce holding currencies that are most likely to be needed, and taxesinduce avoiding countries with very high withholding rates and holding appreciatingcurrencies if facing favorable capital gains tax treatment on foreign exchange gains.REVIEW QUESTIONS1 What are the objectives of international cash management?2 Why do transaction costs on spot and forward exchange reduce the incentive to invest inforeign-currency securities?3 Why do transaction costs on spot and forward exchange reduce the incentive to borrow ina foreign-currency?4 What is meant by ‘‘netting?’’5 What is meant by ‘‘leading’’ and ‘‘lagging?’’6 What are the advantages of centralized cash management?7 How can ‘‘pooling’’ provide benefits for international cash management?8 How does liquidity preference affect international cash management decisions?ASSIGNMENT PROBLEMS1 Assume that you face the following money-market and exchange-rate quotations:r $ r C$ S(C$/ask$) S(C$/bid$) F 1/2 (C$/ask$) F 1/2 (C$/bid$)4.20% 6.80% 1.3850 1.3830 1.4000 1.3960a If r $ and r C$ are respectively the per annum 6-month US dollar and Canadiandollar borrowing rates facing a US firm that wishes to remain hedged,should that firm borrow in US or Canadian dollars?b If r $ and r C$ are respectively the per annum interest rates available on 6-monthUS and Canadian treasury bills, in which country should a US firm place its funds?2 Suppose that as the money manager of a US firm you face the following situation:& 320r B $ 9.0%r$ I 8.0%r B C$ 10.5%rC$ I 9.5%S(C$/ask$) 1.2400S(C$/bid$) 1.2350F 1 (C$/ask$) 1.2600F 1 (C$/bid$) 1.2550
CASH MANAGEMENTHere r B $ and r$ I r are the 1-year interest rates at which you can respectively borrow andinvest in US dollars, and r B C$ and rC$ I are the 1-year borrowing and investing interest ratesin Canadian dollars.a If you had funds to invest for 1 year, in which currency would you invest?b If you wished to borrow for 1 year, in which currency would you borrow?3 Suppose that you face the situation in Question 2, except that the effective tax rate oninterest income is 50 percent, and the effective tax rate on capital gains is 30 percent.In which currency-denominated securities would you wish to invest?4 What is the connection between the size of the gain from netting and the nature of longand short positions of the different divisions of a multinational firm?5 Which of the gains from centralization of cash management are related to foreignexchange transaction costs?6 What are the differences and similarities between the gain from centralization of cashmanagement via pooling, and the gain via diversification of different currencies?7 Will allowance for co-movement between currencies allow a firm to eliminate foreignexchange risk or foreign exchange exposure?8 Why might we be suspicious that any apparent covered interest arbitrage opportunitymust be due to not considering transaction costs, political risk, taxes, or liquidity?9 Why do multinational firms tend to use multinational banks, rather than local banks intheir local markets?10 Why do many governments restrict the maximum length of time over which firms canpractise leading and lagging of accounts receivable and payable?BIBLIOGRAPHYBusiness <strong>International</strong>, Automated Global Financial Management, Financial Executives Research Foundation,Morristown, NJ, 1988.Essayyad, Mussa and Paul C. Jordan, ‘‘An Adjusted-EOQ Model for <strong>International</strong> Cash Management,’’ Journal ofMultinational Financial Management, 1 and 2, 1993, pp. 47–62.Shapiro, Alan C. ‘‘Payments Netting in <strong>International</strong> Cash Management,’’ Journal of <strong>International</strong> BusinessStudies, Fall 1978, pp. 51–8.Srinivasan, Venkat and Yong H. Kim, ‘‘Payments Netting in <strong>International</strong> Cash Management: A NetworkOptimization Approach,’’ Journal of <strong>International</strong> Business Studies, Summer 1986, pp. 1–20.——, Susan E. Moeller, and Yong H. Kim, ‘‘<strong>International</strong> Cash Management: State of the Art and ResearchDirections,’’ Advances in Financial Planning and Forecasting, Vol. 4, Part B, 1990, pp. 161–94.321 &
Chapter 15Portfolio investmentEconomic forecasting houses ...have successfully predicted fourteen of the last five recessions.David FehrAs we explained in Chapter 1, the world as a wholebenefits from international investment via a betterallocation of financial capital, and a smoother wealthor consumptive stream from lending and borrowing.Individual investors gain in these same waysfrom engaging in international investment andthereby achieving a more efficient portfolio.Stated in the vernacular of finance, diversifiedinternational investment offers investors higherexpected returns and/or reduced risks vis-à-visexclusively domestic investment. This chapterfocuses on the sources and sizes of these gains fromventuring overseas for portfolio investment, whichis investment in equities and bonds where theinvestor’s holding is too small to provide anyeffective control. (Direct investment, defined inChapter 5 as investment where the investorachieves some control – via 10 percent or moreownership – is discussed separately in Chapters 16and 17.)THE BENEFITS OF INTERNATIONALPORTFOLIO INVESTMENTSpreading risk: correlations betweennational asset marketsBecause of risk aversion, investors demand higherexpected return for taking on investments withgreater risk. It is a well-established proposition inportfolio theory that whenever there is imperfectcorrelation between different assets’ returns, risk isreduced by maintaining only a portion of wealth inany individual asset. More generally, by selecting aportfolio according to expected returns, variancesof returns, and correlations between returns, aninvestor can achieve minimum risk for a givenexpected portfolio return, or maximum expectedreturn for a given risk. Furthermore, ceteris paribus,the lower are the correlations between returns ondifferent assets, the greater are the benefits ofportfolio diversification.Within an economy there is some degree ofindependence of asset returns, and this providessome diversification opportunities for investors whodo not venture abroad. However, there is a tendencyfor the various segments of an economy tofeel jointly the influence of overall domestic activity,and for asset returns to respond jointly toprospects for domestic activity, and uncertaintiesabout these prospects. This limits the independenceof individual security returns, and therefore alsolimits the gains to be made from diversificationwithin only one country.Because of different industrial structures in differentcountries, and because different economiesdo not trace out exactly the same business cycles,there are reasons for smaller correlations of& 322
PORTFOLIO INVESTMENT10.80.6Correlation0.40.20CanHoll UK Switz Sing Norw Fran Ausl Swed Belg Ger HK Den Spain Jap Ital& Figure 15.1 Correlations between US and other countries’ stock markets, US dollars, 1980–90NotesThe US stock market is not very highly correlated with stock markets in other countries: correlation coefficients averageabout 0.5. These relatively low correlations mean a potential gain from holding an internationally diversified portfolio of stocks.Source: Patrick Odier and Bruno Solnik, ‘‘Lessons for <strong>International</strong> Asset Allocation.’’ Copyright 1993, CFA Institute.Reproduced and republished from Financial Analysts Journal with permission from CFA Institute. All rights reserved.expected returns between investments in differentcountries than between investments within any onecountry. This means that foreign investments offerdiversification benefits that cannot be enjoyed byinvesting only at home and means, for example, thata US investor might include British stocks in aportfolio even if they offer lower expected returnsthan US stocks: the benefit of risk reduction mightmore than compensate for lower expected returns.Figure 15.1 graphically illustrates the degree ofindependence of foreign versus US stock marketsduring the period 1980–90 as reported by PatrickOdier and Bruno Solnik. 1 The coefficients in the1 Patrick Odier and Bruno Solnik, ‘‘Lessons for <strong>International</strong>Asset Allocation,’’ Financial Analysts Journal, March/April1993, pp. 63–77. This excellent survey of internationalportfolio investment provides much useful data in additionto that cited in this chapter.figure are based on US dollar values of stockmarkets, and have an average of about 0.5. Thismeans a squared-correlation, called R 2 , of 0.25.The R 2 statistic is an indicator of the extent to whichtwo variables – in this case two countries’ stockmarkets – respond jointly to common factors.Figure 15.1 suggests that different countries’ stockmarkets have substantial idiosyncrasies of returns;with R 2 ¼ 0.25, 75 percent of returns are due tofactors specific to individual countries. In principle,the low correlations that are found could be theconsequence of different economic and politicalevents in different countries, or of different countries’stock-market indexes being formed fromdissimilar mixes of industries. We shall show in thefollowing paragraphs that the latter explanation isnot supported by the empirical evidence.Figures 15.2 and 15.3 show, respectively, thecorrelation coefficients between the Japanese and323 &
INTERNATIONAL INVESTMENT AND FINANCING10.8Correlation0.60.40.20Spain Italy Belg UK Swed Fran Holl Switz Sing HK Ger Can US Den Ausl Norw& Figure 15.2 Correlations between Japanese and other countries’ stock markets, Japanese yen, 1980–90NotesJapan’s stock market follows a path which appears to be quite independent of the stock markets of other countries, withcorrelation coefficients averaging about 0.2. This situation suggests substantial potential benefits for Japaneseinvestors holding an internationally diversified stock portfolio.Source: Patrick Odier and Bruno Solnik, ‘‘Lessons for <strong>International</strong> Asset Allocation.’’ Copyright 1993, CFA Institute.Reproduced and republished from Financial Analysts Journal with permission from CFA Institute. All rights reserved.10.8Correlation0.60.40.20Holl Can US Norw Swed Spain Sing HK Ausl Belg Fran Ger Italy Jap Den& Figure 15.3 Correlations between British and other countries’ stock markets, British pounds, 1980–90NotesThe British stock market is correlated with stock markets of other countries to about the same extent as is the USstock market, with correlation coefficients averaging about or slightly below 0.5. As is the case for investors from theUnited States, Japan, and other countries, British investors stand to benefit for international diversification.Source: Patrick Odier and Bruno Solnik, ‘‘Lessons for <strong>International</strong> Asset Allocation.’’ Copyright 1993, CFA Institute.Reproduced and republished from Financial Analysts Journal with permission from CFA Institute. All rights reserved.& 324
PORTFOLIO INVESTMENTnon-Japanese markets, and between the British andnon-British markets. We see that it is not only theUnited States which has a major idiosyncratic elementin its stock market. Indeed, for Japan in particular,the very low correlation coefficients – averaging lessthan 0.2 – suggest that less than 4 percent of thefactors behind the Japanese stock market are affectingother stock markets. (The R 2 for Japan isapproximately 0.2 0.2 ¼ 0.04, or only 4 percent.)Correlations between a slightly different group ofstock markets, but for a more up-to-date period thanreflected in Figures 15.1, 15.2, and 15.3, are shownin Table 15.1. (Figures 15.1, 15.2, and 15.3 providecorrelations for 1980–90, while Table 15.1, whichwas constructed for this book, provides correlationfor the period 1994–2002). Despite the differenttime periods and consideration of a slightly differentset of countries, the picture that emerges from thetable is similar to that given by the figures. Forexample, the US market correlation is relatively highwith Canada: Canadian and US stock markets movetogether closely which is not surprising, given theirphysical proximity and the fact that US–Canadianbi-lateral trade is the largest trading relationship inthe world. The US market is less closely related tothat of Japan which is at a greater physical distanceand which has a different industrial structure. Franceand Germany, which are close neighbors in Europe,have highly connected markets. The Indian stockmarket moves differently from all the other marketsconsidered in the table, all of which are at a higherlevel of economic development.Country-specific volatility versusindustrial structureAs we have mentioned, two possible explanationsfor the generally low correlations between differentcountries’ stock markets are1 that the countries’ economies evolve differentlyover time with different business cycles;2 that the countries have different industries intheir stock-market indexes.& Table 15.1 Monthly US dollar returns and risks for national stock markets, 1994–2002 aCorrelation coefficientAus Can Fr Ger Ind Ital Jap Holl Sing Swed UK Monthlymeanreturn(%)Risk(Standarddeviation)(%)Australia 0.18 4.38Canada 0.66 0.36 5.50France 0.46 0.59 0.37 6.19Germany 0.50 0.62 0.85 0.39 6.83India 0.43 0.41 0.21 0.21 0.67 7.82Italy 0.37 0.47 0.70 0.68 0.31 0.63 7.05Japan 0.57 0.44 0.37 0.32 0.25 0.28 0.62 6.55Holland 0.54 0.60 0.87 0.88 0.27 0.67 0.37 0.64 6.07Singapore 0.63 0.53 0.40 0.41 0.36 0.28 0.41 0.44 0.23 9.29Sweden 0.59 0.71 0.80 0.83 0.38 0.68 0.39 0.76 0.45 0.31 7.06UK 0.55 0.64 0.75 0.74 0.13 0.50 0.34 0.76 0.49 0.70 0.29 4.26USA 0.57 0.76 0.67 0.74 0.25 0.49 0.43 0.72 0.54 0.71 0.82 0.64 4.71Notea India 1997–2002, Sweden 1996–2002.Source: <strong>International</strong> Monetary Fund, <strong>International</strong> Financial Statistics, December 2003.Yahoo finance websitewww.yahoo.com325 &
INTERNATIONAL INVESTMENT AND FINANCING& Table 15.2 Correlations between US dollar monthly returns in automobile manufacturing, 1986–91GM Ford Chrysler Fiat Volks Peugot Honda NissanGM 1.0000Ford 0.8020 1.0000Chrysler 0.6829 0.6150 1.0000Fiat 0.4909 0.3541 0.3393 1.0000Volkswagon 0.4016 0.3350 0.2604 0.6177 1.0000Peugot 0.4517 0.4105 0.2994 0.5166 0.6347 1.0000Honda 0.2321 0.2195 0.1635 0.4162 0.1755 0.2503 1.0000Nissan 0.2980 0.2505 0.3722 0.3908 0.1974 0.2837 0.5957 1.0000Source: Tania Zouikin, ‘‘Is <strong>International</strong> Investing Losing Its Lustre?’’ Canadian Investment Review, Winter 1992, p. 18.& Table 15.3 Correlations between US dollar monthly returns in the consumer electronics industry,1986–91GE Zenith Phillips Siemens Matsushita SonyGE 1.0000Zenith 0.4816 1.0000Phillips 0.4295 0.3931 1.0000Siemens 0.4938 0.5389 0.5389 1.0000Matsushita 0.2562 0.1915 0.1885 0.1657 1.0000Sony 0.2035 0.1389 0.1108 0.2062 0.8286 1.0000Source: Tania Zouikin, ‘‘Is <strong>International</strong> Investing Losing Its Lustre?’’ Canadian Investment Review, Winter 1992, p. 18.In the latter case, the low correlations betweenoverall stock market indexes could occur despitefirms in a given industry, but in different countries,having highly correlated stock values; high correlationswithin industries might be swamped by lowcorrelations between industries. Evidence suggestingthat the low correlations are not due to differentindustrial compositions of different countries’ marketindexes is shown in Tables 15.2 and 15.3. 2 The tables2 Steven Heston and K. Geert Rouwenhorst have examinedindustrial structure versus country-specific sources of lowcorrelations between country indexes. By considering12 European countries during the period 1978–92,Heston and Rouwenhorst concluded that industrialstructure plays very little role. Rather, low correlationsbetween country indexes are almost exclusively due tocountry-specific factors. See Steven L. Heston and K. GeertRouwenhorst, ‘‘Does Industrial Structure Explain theBenefits of <strong>International</strong> Diversification,’’ Journal ofFinancial Economics, August 1994, pp. 3–27.& 326show correlation coefficients between monthlyreturns measured in US dollars of major firms in givenindustries, but from different countries. We see fromTable 15.2 that correlations between automobilemanufacturers in different countries are low. Forexample, Honda and GM have a correlation coefficientof only 0.23. Table 15.3 shows a similar patternin the consumer electronics industry. With firms ingiven industries but different countries offering suchdifferent return experiences, international portfoliodiversification offers significant potential.The size of the gain from internationaldiversificationGain from stock diversificationAn indication of the size of the gain from includingforeign stocks in a portfolio has been provided by the
PORTFOLIO INVESTMENTresearch of Bruno Solnik. 3 Solnik computed the riskof randomly selected portfolios of n securities fordifferent values of n in terms of the volatility of theseportfolios. For example, a large number of portfoliosof two randomly selected companies were formed,and their return and volatility calculated. Then,portfolios of three randomly selected companieswere formed, with average returns and volatilitiescalculated, and so on. As expected, it was found thatvolatility declines as more stocks are included.Moreover, Solnik discovered that an internationalportfolio of stocks has about half as much risk as aportfolio of the same size containing only US stocks.This result is shown in Figure 15.4. We see that therisk of US portfolios of over 20 stocks is approximately25 percent of the risk of a typical security,whereas the risk of a well-diversified internationalRisk %1008060402011.7US stocks<strong>International</strong> stocks1 10 20 30 40 50Number of stocks& Figure 15.4 The size of the gain frominternational diversificationNotesFor any given number of stocks, an internationallydiversified portfolio typically has less than half the risk of adomestically diversified portfolio.Source: Bruno H. Solnik, ‘‘Why Not Diversify <strong>International</strong>lyRather than Domestically?’’ Copyright 1974, CFA Institute.Reproduced and republished from Financial Analysts Journalwith permission from CFA Institute. All rights reserved.3 Bruno H. Solnik, ‘‘Why Not Diversify <strong>International</strong>lyRather than Domestically?’’ Financial Analysts Journal,July–August 1974, pp. 48–54.portfolio is only about 12 percent of that of a typicalsecurity. When Solnik considered other countrieswhich have far smaller stock markets, he found thatthe gains from international diversification were, notsurprisingly, much larger than for the United States.In smaller countries there is less opportunity todiversify within the country than in larger countries.For example, in the United States it is possible toinvest in most of the world’s industries, somethingyou could not do in a small country such as Denmarkor Egypt. Furthermore, in large countries such as theUnited States and Britain, there are often numerousmultinational corporations trading on their stockmarkets. As we shall see, this means that investorsholding only ‘‘domestic’’ stocks are actually achievinginternational diversification indirectly because ofthe extensive overseas activities of their own countries’companies. However, the evidence indicatesthat there are opportunities for further diversificationby venturing into foreign stock markets even for theUnited States.Risk from exchange ratesWhile there are gains from international diversificationbecause of the independence between foreignand domestic stock returns, there is a possibility ofadded risk from unanticipated changes in exchangerates when foreign stocks are held. Therefore,it is important to consider whether the gains fromimperfect correlations between stock returns whenmeasured in terms of local currency more thancompensate for the risk introduced by exchangerates. As we saw in Chapter 9 when dealing with themeasurement of foreign exchange risk and exposure,the extent to which holding foreign stocks increasesrisk from unanticipated changes in exchange ratesdepends on both the volatility of exchange rates andon the way exchange rates and stock prices are related.The added risk from exchange rates also dependson whether stocks from only one foreign country, orfrom a number of different foreign countries, areadded to a portfolio of domestic stocks.The potential for exchange rates to add risk canbe judged by comparing the volatility of stock values327 &
INTERNATIONAL INVESTMENT AND FINANCING353025% per year201510501970s 1980s 1970s 1980s 1970s 1980sJapanBritainGermany% variation per year in local currency value% variation in dollar values of foreign stocksfrom exchange rate variation& Figure 15.5 Local-market versus exchange-rate components of volatility of US dollar values ofnon-US stocks, 1970s and 1980sNotesMost of the variation in the US dollar value of non-US stocks is the result of volatility in the local-currency value of thestocks, rather than in exchange rates. Typically, exchange rates contribute 10–15% of the US dollar valuation of foreignstock markets.Source: Patrick Odier and Bruno Solnik, ‘‘Lessons for <strong>International</strong> Asset Allocation.’’ Copyright 1993, CFA Institute.Reproduced and republished from Financial Analysts Journal with permission from CFA Institute. All rights reserved.measured in local currencies to the volatility ofstock values measured in US dollars; US dollarvalues involve converting foreign currency valuesinto dollars at the spot exchange rate, with variationsin the spot rate possibly providing volatilitydepending on the covariation between exchangerates and stock prices. The difference between thesetwo volatilities – local-currency value versus USdollar value – is an indication of the volatilitycontributed to the US dollar value by variationsin exchange rates. 4 Figure 15.5 graphically4 Exchange rates contribute to volatility both via the variance ofexchange rates, and via the covariance of exchange rates withlocal-currency values of stocks. The measure we use combinesthese two sources of volatility from exchange rates. So,implicitly, do the results of Solnik in Figure 15.4; Solnik’sportfolio returns and risks involve the use of US dollar values.& 328illustrates the volatility from the currency and localstock-market value components for Japanese,British, and German stocks. While exchangerates contribute risk, the exchange-rate element isseen to be the distinctly smaller of the two riskcontributingfactors.Evidence on exchange-rate risk from investing inone foreign country and in a group of foreign countrieshas also been provided by Cheol Eun andBruce Resnick. 5 Eun and Resnick decompose thevolatility of returns on foreign stocks into the volatilityof stock returns in terms of local currency, the5 Cheol S. Eun and Bruce G. Resnick, ‘‘Exchange RateUncertainty, Forward Contracts and <strong>International</strong>Portfolio Selection,’’Journal of <strong>Finance</strong>, March 1988,pp. 197–215.
PORTFOLIO INVESTMENTvolatility of exchange rates, and the comovementof stock prices in local currency and changesin exchange rates. That is, they separate the twosources of volatility from exchange rates, namelyvolatility of exchange rates themselves, and thevolatility from covariance of exchange rates withlocal-currency stock prices. Specifically, they writethe expected dollar rate of return to a US holder of,for example, British stocks asExpected dollar return on British stocks¼ _S þ r UKð15:1ÞHere, r UK is the expected stock return in terms ofpounds, which consists of the expected dividendreturn plus the expected change in market valuein pounds. _S is the expected rate of change of thedollar value of the pound. This allows Eun andResnick to write the variance of the dollar return onBritish stocks asVar($return on British stocks)¼ varð_SÞþvarðr UK Þþ 2covð_S, r UK Þð15:2ÞThis expression shows that the variance of the USdollar rate of return on British stocks can bedecomposed into the variance of the dollar–poundexchange rate, the variance of the return on Britishstocks valued in pounds, and the covariancebetween the exchange rate and the pound rate ofreturn on British stocks.Table 15.4 shows the percentage composition ofthe US dollar return from holding the stockmarketindexes of six foreign countries, when eachmarket is held on its own. The first column givesvar(_S) as a percentage of the variance of the dollarreturn from each foreign market, the second columngives var(r) as a percentage of the variance ofthe dollar return, and the final column gives twotimes the covariance between the exchange rate andassociated local return as a percent of the dollarreturn. We see that on its own the volatility in theexchange rate can contribute anything from lessthan 5 percent to over 50 percent of the volatility ofdollar returns. We can also see that the covariancebetween exchange rates and local-currency returnscontributes to the variance of US dollar returns.That is, movements in exchange rates are reinforcedby movements in local stock markets. For example,on average, when the pound is declining, so is theBritish stock-market index. This means thatexchange rates add to the volatility both directly inbeing volatile themselves, and indirectly by beingpositively related to local stock-market returns.The situation for a portfolio of stocks from differentcountries is essentially the same as that forstocks from an individual country. According to thesame study referred to in Table 15.4 by Cheol Eunand Bruce Resnick, approximately one-third of thevariance of US dollar returns from holding anequally-weighted portfolio of the stock markets ofseven countries, the United States and the sixcountries in Table 15.4, is directly due to the& Table 15.4 Composition of US dollar weekly returns on individual foreign stock markets, 1980–85CountryPercentage of variance in US dollar returns fromExchange rate Local return 2 CovarianceCanada 4.26 84.91 10.83France 29.66 61.79 8.55Germany 38.92 41.51 19.57Japan 31.85 47.65 20.50Switzerland 55.17 30.01 14.81UK 32.35 51.23 16.52Source: Cheol S. Eun and Bruce G. Resnick, ‘‘Exchange Rate Uncertainty, Forward Contracts, and <strong>International</strong> PortfolioSelection,’’ Journal of <strong>Finance</strong>, March 1988, pp. 197–215.329 &
INTERNATIONAL INVESTMENT AND FINANCINGexchange rate. In addition, about one quarter of thevariance of this equally-weighted internationalportfolio is due to the covariance between exchangerates and local market returns: this is twice thecovariance as described by equation (15.2). Thisleaves just over 40 percent of the variance of dollarreturns as being due to the stock portfolio itself. Wesee the exchange rate contributes a substantialfraction of the volatility of dollar returns via thedirect effect of the exchange-rate volatility, and viathe indirect effect of positive covariance betweenexchange rates and local market returns. It wouldnot appear that diversification among currencies hasa substantial effect in reducing the proportion of riskattributable to changes in exchange rates.With volatility directly or indirectly resultingfrom unanticipated changes in exchange rates, it isimportant to confirm whether this completely nullifiesthe benefits from international diversificationattributable to the presence of some independencebetween stock-market returns in different countries.The answer is no. One reason is that it ispossible to diversify internationally without addingexchange-rate exposure – by hedging in the forwardmarket, by borrowing in the foreign currencies, orby using futures or currency options. The hedgeswould have to be based on the exposure in eachcurrency, as given by regression coefficients accordingto Chapter 9. 6 A second reason internationalportfolio diversification is beneficial despiteexchange-rate variability is that, even without hedging,the variance of the dollar return on an internationallydiversified portfolio of stocks remainslower than the variance of the expected dollar return6 It was explained in Chapter 9 that the exposure on a foreignstock depends on how the stock price covaries with theexchange rate, and, consequently, the exposure is notsimply the market value of the stock. The appropriatehedge would have to take this into account. We should notethat while exposure at a given moment in time canbe eliminated by appropriate hedging, it is not feasible toeliminate exposure indefinitely. This is because the marketvalue of foreign stocks varies, so that the hedge will notalways be the correct amount, unless, of course, the hedgeis changed continuously.& 330from investing in the domestic stock market. Thishas been shown by Bruno Solnik, who compared thevariance of returns on portfolios of US stocks withthe variance of returns on internationally diversifiedportfolios, both when not hedging exchange-rateexposure and when hedging on the forward market.7 Different-sized portfolios of US stocks andinternationally diversified stocks were compared,with the results shown in Figure 15.6. This figurereveals that even though there is exchange-rate risk –given by the gap between the hedged and unhedgedcurves – it is still better to diversify internationallythan to hold only US stocks. It is clear that the gainRisk %10080604020US stocks<strong>International</strong> unhedged<strong>International</strong> hedged1 10 20 30 40 50Number of stocks& Figure 15.6 The advantages of internationaldiversification with and without exchange riskNotesThere are further gains from risk reduction throughinternational diversification if forward markets are used tohedge exchange-rate risk.Source: Bruno H. solnik, ‘‘Why Not Diversify <strong>International</strong>lyRather than Domestically?’’ Copyright 1974, CFA Institute.Reproduced and republished from Financial AnalystsJournal, with permission from CFA Institute. All rightsreserved.7 Solnik, op. cit. Solnik’s hedges on the international portfoliosare not the optimal hedges as given by regression coefficients,but rather are equal to the values of the foreign stocks at thetime of investment. Consequently, Solnik’s results, ifanything, understate the benefits of hedged internationaldiversification.
PORTFOLIO INVESTMENTfrom having independence of returns due to holdingsecurities of different countries in a portfolio morethan offsets any exchange-rate risk that this implies,even when not hedging. And of course, whenhedged, the benefits from international portfoliodiversification are even greater.Many researchers other than Eun and Resnick,and Solnik, have studied the gains from internationaldiversification, and while all agree on the existenceof gains, they differ substantially in the estimatedsize of these gains. 8 One major reason the estimatesof gains are different is that some of the studies usepast returns over different sample periods to formefficient, internationally diversified portfolios,rather than using the distribution of future returns asis called for by the theory. 9 The problem introducedby using past returns and covariances for formingefficient diversified portfolios is that if, for example,the past return in Belgium was very high during theestimation period, Belgian stocks will be heavilyweighted in the internationally diversified portfolio.10 This is the case even though it may have beenjust by chance that Belgian stocks did so well. It isthen little surprise that the internationally diversifiedportfolio with its abnormally high proportionof high-return Belgian stocks outperforms thedomestic portfolio when applied to past data. The8 Earlier, frequently referenced research showing the sizeof gains from international diversification includesDonald Lessard, ‘‘World, Country, and IndustryRelationships in Equity Returns: Implications for RiskReduction through <strong>International</strong> Diversification,’’ FinancialAnalysts Journal, January/February 1976, pp. 2–8, andHaim Levy and Marshall Sarnat, ‘‘<strong>International</strong>Diversification of Investment Portfolios,’’ AmericanEconomic Review, September 1970, pp. 668-75.9 An efficient portfolio is one which is constructed tohave maximum expected return for a given volatility, orminimum volatility for a given expected return. Thestudies by Solnik and by Eun and Resnick are not based onefficient portfolios and consequently are not subject to theproblems we are about to describe.10 Belgian stocks will receive high weighting if their return ishigh relative to the risk they contribute to the internationalportfolio. The risk depends on the covariance betweenBelgian and other returns.problem is that there is an upward bias in theestimated benefits of international diversificationdue to basing international portfolios on past returnsrather than the distribution of future returns. Thisbias can be verified by taking the internationallydiversified portfolio that is formed using past-returndata during a given interval of time and seeing how itperforms out of sample, that is, over other intervals.The results of this type of test suggest that thebenefits of international diversification have indeedbeen overestimated in many studies. 11In an attempt to partially overcome the problemof using past returns to construct portfolios forjudging the gain from international diversification,Philippe Jorion used statistical procedures which‘‘shrink’’ past returns in different countries towardthe mean return for all countries’ markets combined.12 This means, for example, that if theobserved past return for Belgium happened to havebeen very high, a realistic investor is assumed toexpect a future return in Belgium that is less thanthe past return, and somewhere between the pastreturn for Belgium and the past average return forall countries combined. The results from Jorion’sstudy show that the gains from internationaldiversification in earlier studies have been greatlyoverstated. His conclusions are supported by thefact that the portfolios he constructed outperformportfolios based on unadjusted past returns whentheir returns are compared with out-of-sample data.Nevertheless, Jorion shows there is still some gainfrom international portfolio diversification.INTERNATIONAL CAPITAL ASSETPRICINGThe central international financial question concerningthe pricing of assets, and hence theirexpected rates of return, is whether they aredetermined in an integrated, international capitalmarket or in local, segmented markets. If assets11 See Philippe Jorion, ‘‘<strong>International</strong> Diversificationwith Estimation Risk,’’ Journal of Business, July 1985,pp. 259–78.12 See Jorion, op. cit.331 &
INTERNATIONAL INVESTMENT AND FINANCINGare priced in an internationally integrated capitalmarket, expected yields on assets will be in accordancewith the risks of the assets when they are heldin an efficient, internationally diversified portfolio,such as the world-market portfolio. This means thatwhile in such a situation it is better to diversifyinternationally than not to, the expected yields onassets will merely compensate for their systematicrisk when this is measured with respect to theinternationally diversified world portfolio. That is,with internationally integrated capital markets theexpected returns on foreign stocks will be appropriatefor the risk of these stocks in an internationallydiversified portfolio. There will be no ‘‘free lunches’’from foreign stocks due to higher expectedreturns for their risk. On the other hand, if assets arepriced in segmented capital markets, their returnswill be in accordance with the systematic risk of theirdomestic market. This means that if an investorhappens to have an ability to circumvent whatever itis that causes markets to be segmented, this investorwill be able to enjoy special benefits from internationaldiversification. It is consequently importantfor us to consider whether assets are priced ininternationally integrated or in segmented capitalmarkets. However, before doing this it is useful toreview the theory of asset pricing in a domesticcontext, because if we do not understand the issuesin the simpler domestic context, we cannot understandthe international dimensions of asset pricing.The domestic capital asset pricing model,CAPMThe domestic variant of the capital asset pricingmodel (CAPM), familiar from the so-called ‘‘betaanalysis’’ used in security selection, can be writtenas follows 13r j ¼ r f þ bðr m r f Þ ð15:3Þ13 See William Sharpe, ‘‘Capital Asset Pricing: A Theory ofMarket Equilibrium under Conditions of Risk,’’ Journal of<strong>Finance</strong>, September 1964, pp. 424–47. The model isexplained in many finance textbooks and is only stated here.whereb ¼ covðr j, r m Þvarðr m Þand wherer j ¼ equilibrium or required expectedreturn on security or portfolio j,r f ¼ risk-free rate of interest,r m¼ expected return on the marketportfolio m,covðr j , r m Þ¼covariance between securityor portfolio j and the market m,varðr m Þ¼variance of the market portfolio:ð15:4ÞThe essential point of the CAPM is that a securityor portfolio offers an equilibrium expected return,r j , equal to the risk-free interest rate plus a riskpremium. The risk premium, b(r m r f ) is linearlyrelated to the risk that the asset or portfoliocontributes to the market as a whole, cov (r j , r m )/var(r m ).This is the risk which cannot be diversifiedaway, the systematic risk. If a security compensatedfor more than systematic risk, it wouldbe a bargain, and investors would buy it andcombine it with other securities. The buying ofthe security would raise its current market priceand thereby lower its expected return until thesecurity was no longer a bargain, even within adiversified portfolio.The international capital asset pricingmodel, ICAPMWith the domestic variant of the CAPM explained,we can clarify the conclusion stated earlier aboutinternationally integrated versus segmented markets.If assets are priced in internationally integratedcapital markets, expected yields are given byr j ¼ r f þ b w ðr w r f Þ ð15:5Þ& 332
PORTFOLIO INVESTMENTwhereb w ¼ covðr j, r w Þvarðr w Þð15:6Þand where r w ¼ ‘‘world market’’ expected return.Unfortunately, it is difficult in practice to apply theinternational CAPM, orICAPM, becausethisrequires being able to define a world risk-free interestrate, making assumptions about preferences ofinvestors from different countries who face differentreal returns according to the basket of goods theypurchase, and dealing with other thorny problems. 14If the international CAPM as summarized inequations (15.5) and (15.6) is valid, then investorsdo not receive abnormal returns from investing inforeign assets; returns appropriately compensate forthe systematic risk of assets in an internationallydiversified portfolio. 15 On the other hand, if assetsare priced in segmented capital markets, then if aninvestor or firm could overcome the cause of themarket segmentation, perhaps by getting aroundcapital flow regulations, such an investor couldenjoy abnormal returns. (Later we shall explain thatUS multinational corporations appear to be in thissituation, investing where ordinary US investorscannot.)Segmentation versus integration ofcapital markets: a graphical viewThe implications of integrated versus segmentedcapital markets can be viewed graphically in terms14 Notable attempts to determine the conditions required forthe international CAPM, and the implications if theseconditions are satisfied, include those of Bruno Solnik, ‘‘AnEquilibrium Model of the <strong>International</strong> Capital Market,’’Journal of Economics Theory, August 1974, pp. 500–24, andMichael Adler and Bernard Dumas, ‘‘<strong>International</strong>Portfolio Choice and Corporation <strong>Finance</strong>: A Synthesis,’’Journal of <strong>Finance</strong>, June 1983, pp. 925–84. For a summaryof empirical applications and new test results see BrunoSolnik, ‘‘The World Price of Foreign Exchange Risk,’’Working Paper, H.E.C. School of Management, Paris,July 1993.15 Indeed, by not investing internationally, investors facemore risk than is necessary.Expected returnr j*r m*r fof the risk-return framework that is used frequentlyin the domestic context to describe diversificationbenefits. Figure 15.7 shows expected returns on thevertical axis, and total risk, given by the standarderror, s, of expected returns, on the horizontalaxis. The upward-sloping part of the curve, orenvelope, gives the best combinations of expectedreturns and risk that can be achieved with differentportfolios; combinations of risk and return alongthe envelope above the minimum value of s arethose of efficient portfolios. As before, r f is the riskfreeinterest rate, and r m is the expected return onthe market portfolio. Again as before, the interpretationof r f and r m depends on whether we areconsidering integrated or segmented capital markets.We note that r m is the tangency point on astraight line drawn between the risk-free rate andthe envelope of efficient portfolios’ risks andreturns. This line is the capital market line,which gives the expected returns and risks ofcombinations of the risk-free asset and the marketportfolio. It is a well-known proposition in financethat an investor cannot do better than select such a333 &ARisk, σCapital marketline& Figure 15.7 The relationship between expectedreturn and total riskNotesIf assets are priced in segmented markets, it may be possiblefor an investor to enjoy a combination of expected returnand risk above the capital market line for a particular countryif the investor can overcome the causes of segmentation anddiversify internationally. If assets are priced in internationallyintegrated capital markets, then by not diversifyinginternationally an investor will be accepting higher riskand/or lower return than is necessary.
INTERNATIONAL INVESTMENT AND FINANCINGcombination and therefore be somewhere on thecapital market line.If capital markets are internationally integrated,then we can interpret r f in Figure 15.7 as the riskfreerate, and r m as the expected world-marketreturn, r w .16 That is, with integrated capital marketsthe international CAPM is an extension of thedomestic CAPM where we reinterpret r m asthe expected world-market return, r w . Indeed, ifthe capital market is integrated, by not holding theworld-market portfolio the investor will be belowthe capital market line in Figure 15.7; the investorcould reduce risk and increase expected return byholding the world portfolio. On the other hand, ifcapital markets are segmented so that we caninterpret r m as the expected return in the domesticmarket, then by overcoming the obstacles to foreigninvestment an investor might be able to create arisk-return portfolio that is above the domesticcapital market line. For example, the investor mightbe able to reach a point such as A and enjoy gainsfrom international diversification, since these arenot priced by the market due to the segmentation.The potential gain from integrationof capital marketsThe extent to which integration of world financialmarkets could empirically make a difference to theopportunities facing investors in terms of the riskreturnprofile is indicated in Figure 15.8. The figureshows a constructed efficiency frontier, with risk andreturn in US dollars, from combining the stockmarketindexes of different countries. 17 We see, forexample, that an internationally efficient allocation ofassets with a risk of 16.2 percent per annum, same asthe US market, provides a return almost 8 percent16 As we have mentioned, in practice, defining r f and r w is farfrom easy. The risk-free rate r f requires forming a portfolioof different treasury bills plus forward exchange contractsto remove exchange-rate risk, and the expected worldmarketreturn r w and world b require complex calculationsand numerous assumptions.17 See Odier and Solnik, op. cit.& 334Return (% per year)35302520151050USJapanGermanyBritain5 10 15 20 25 30 35Risk, σ (% per year)& Figure 15.8 Efficiency frontier of global stocks,US dollar, 1980–90NotesThe efficiency frontier shows the highest return for a given riskand/or the lowest risk for a given return by optimally combiningthe stock market of different countries. The returns andrisks of the individual countries’ markets are seen to be belowthe efficiency frontier. This indicates the size of potential gainsfrom international diversification if capital markets areintegrated. For example, an internationally efficient allocationwith the same risk as the US market offers approximately8 percent more return per annum than the US market.Source: Patrick Odier and Bruno Solnik, ‘‘Lessons for<strong>International</strong> Asset Allocation.’’ Copyright 1993, CFAInstitute. Reproduced and republished from FinancialAnalysts Journal, with permission from CFA Institute. Allrights reserved.higher than the US market return, that is, 21 percentversus 13.3 percent per annum. The potential gainsfor the riskier but higher return stock markets ofBritain, Germany, and Japan are also indicated. Theperformance of the internationally diversified portfoliocould be further enhanced by periodicallyrevising the asset allocation – the figure uses fixedallocations – and by hedging the risk from exchangerates, but even without such refinements the diversificationbenefits are substantial. But are capitalmarkets integrated so as to offer investors suchbenefits, or are they segmented?The evidence on market segmentation:is there a home-equity bias?The most immediately obvious evidence thatmarkets are segmented in the form of a bias
PORTFOLIO INVESTMENTtowards domestic investments is in data showingthe composition of portfolios held by typicalinvestors. Despite the relatively rapid rate ofexpansion of US and other countries’ overseasportfolio investment in recent years, the level offoreign investment is still low. For example,according to values reported by Ian Cooper andEvi Kaplanis, US investors held 98 percent indomestic equity versus the 36.4 percent proportionof world equity market capitalization representedby the US equity market. 18 For the UnitedKingdom, investors held 78.5 percent domesticequity versus the UK’s 10.3 percent of the worldmarketcapitalization. The average for five continentalEuropean countries was 85 percentdomestic investments versus their 1.9 percentshare of world equity market capitalization. Thesituation for the US is confirmed by Karen Lewiswho shows that US holdings of foreignequities are suboptimal, being below thatfor the minimum-variance portfolio for any setof preferences. 19 The bias towards domesticequity is even more extreme than these numberssuggest if we entertain the argument of MarianneBaxter and Urban Jermann. 20 They suggest thatgiven the exposure investors have on their humancapital which makes them long on their homecountry which is the source of their workingincome, investors might want to actually goshort on domestic equities by borrowing againstthem. Whether or not we go this far, there isclearly an equity home bias puzzle as it hasbecome known. Investors around the globe18 See Ian Cooper and Evi Kaplanis, ‘‘Home Bias in EquityPortfolios, Inflation Hedging and <strong>International</strong> MarketEquilibrium,’’ Review of Financial Studies, Spring 1994,pp. 45–60.19 Karen K. Lewis, ‘‘Trying to Explain Home Bias in Equitiesand Consumption,’’ Journal of Economic Literature, June1999, pp. 571–608. For an alternative view see Exhibit 15.1.20 Marianne Baxter and Urban J. Jermann, ‘‘The<strong>International</strong> Diversification Puzzle is Worse than YouThink,’’ American Economic Review, March 1997,pp. 170–80.are not fully availing themselves of internationaldiversification opportunities: they hold fewerforeign securities than would be representative ofthe world portfolio. 21Possible reasons for home-equity biasSegmentation of capital markets with disproportionateinvestments in the investors’ home marketscan occur for a variety of different reasons. 22 Themost obvious cause of segmentation is the presenceof legal barriers to foreign investment. These barrierscan take the form of outright restrictions oninvesting abroad, or can involve higher rates of taxon income from foreign than domestic investment.23 Transaction costs may also be higher onforeign equities, although according to FrankWarnock, turnover rates on foreign equities arecomparable to domestic turnover rates, thereby notsupporting the transaction-cost based argument. 24Furthermore, even if the majority of investors are21 For discussion of the extent of international diversificationand possible explanations of why a home-country biasoccurs, see Raman Uppal, ‘‘The Economic Determinants ofthe Home Country Bias in Investors’ Portfolios: A Survey,’’Journal of <strong>International</strong> Financial Management and Accounting,4, 1992, pp. 171–89, and ‘‘A General Equilibrium Modelof <strong>International</strong> Portfolio Choice,’’ Journal of <strong>Finance</strong>, June1993, pp. 529–53. For the extent of turnover in foreignstocks, which has been very rapid, see Linda L. Tesar andIngrid M. Werners, ‘‘Home Bias and High Turnover,’’Journal of <strong>International</strong> Money and <strong>Finance</strong>, August 1995,pp. 467–92.22 For a discussion of the possibility that the bias has beenoverstated due to model misspecification see DebraA. Glassman and Leigh A. Riddick, ‘‘Why Empirical<strong>International</strong> Portfolio Models Fail: Evidence that ModelMisspecification Creates Home Asset Bias,’’ Journal of<strong>International</strong> Money and <strong>Finance</strong>, April 1996, pp. 275–312.23 See René Stultz, ‘‘On the Effects of Barriers to<strong>International</strong> Investment,’’ Journal of <strong>Finance</strong>, September1981, pp. 923–34.24 Higher transaction costs would imply low turnover thatdoes not appear to occur. See Frank E. Warnock, ‘‘HomeBias and High Turnover Reconsidered,’’ Journal of<strong>International</strong> Money and <strong>Finance</strong>, November 2002,pp. 795–805.335 &
INTERNATIONAL INVESTMENT AND FINANCINGEXHIBIT 15.1HOME BIAS AND CORPORATE GOVERNANCENormally, the vast majority of shares that have beenissued by American corporations trade freely infinancial markets, with no individual shareholderholding more than a tiny fraction of the stock. Thislimits the amount of control that individual shareholdersor coordinated groups of shareholders canexert on the companies’ management. The situation isnot the same in many other countries. Controllinginterests in some countries, where families or individualshold large amounts of voting stock, can exceed50 percent. According to the paper summarizedbelow, this can explain up to half the apparenthome-equity bias.The fact that domestic companies represent90 percent of the holdings in an average U.S.investor’s stock portfolio – even though U.S.stocks represent only 49 percent of the worldmarket – has prompted a range of theories, but nogenerally accepted explanation of this so-called‘‘home bias.’’ Some analysts have blamed marketbarriers. Others view U.S. investors as lackingsufficient information on foreign equities. Andthen there are those who see in this imbalanceoverly optimistic expectations about the performanceof homegrown assets. But in ‘‘CorporateGovernance and the Home Equity Bias’’ ...LeePinkowitz, Rene Stultz, and Rohan Williamsonassert that at least some of the oft-noted tilt is nota bias at all but simply a reflection of the fact that asizable number of shares worldwide are not forsale to the average investor. They find that comparisonsof U.S. portfolios to the world market forequities have failed to consider that the ‘‘controllingshareholders’’ who dominate many a foreigncorporation do not make their substantial holdingsavailable for normal trading.Take this into account, the authors argue, and asmuch as half of the home bias disappears. A moreaccurate assessment of globally available shares,they say, would show about 67 percent of aproperly balanced U.S. portfolio would be investedin U.S. companies.‘‘We show that the home bias is intricatelylinked to corporate governance,’’ the authorswrite. ‘‘When companies are controlled by largeinvestors, portfolio investors are limited in thefraction of a firm they can hold.’’ For example, inexamining 51 countries they find that, on average,32 percent of the shares are not available fortrading. The United States has the lowestpercentage of controlling shareholders, with only7.9 percent of domestic stocks ‘‘closely held’’followed by the United Kingdom at 9.9 percent.But the authors note that, except for Ireland,Sri Lanka, the United States, and the UnitedKingdom, ‘‘ no country has a ...controlling ownershipof less than 20 percent,’’ and in 23 countries,controlling ownership exceeds 50 percent.Pinkowitz, Stulz, and Williamson observe thatcontrolling shareholders are not interested inselling off their stock at the mere market price.The authors point to previous studies demonstratingthat ‘‘the benefits of control are substantialin most countries,’’ placing the value ofsuch holding above those of ordinary shares andthus not practical for the typical foreign investor.Therefore, the authors believe efforts to makeforeign stocks more attractive to domestic investorsneed to move beyond the current focus on marketbarriers. They conclude that considerably moreattention must be given to how corporate governancerepels investors who might otherwisereplace some of their domestic stocks with foreignequities.Source: ‘‘Why Don’t Americans Hold More ForeignStocks?’’ a summary of Lee Pinkowitz, Rene Stultz, andRohan Williamson Working Paper 8680, National Bureauof Economic Research, Cambridge, MA, in The NBERDigest, May 2002.& 336
PORTFOLIO INVESTMENTsubject to legal barriers and higher transaction costs,assets could still in principle be priced according tointegrated markets. This is because some investors,such as giant multinational firms with operations innumerous countries, might be able to circumventthe legal barriers and avoid costs.A slightly less obvious form of market segmentationoccurs as a result of so-called indirectbarriers. 25 Indirect barriers include the difficultyof finding and interpreting information about foreignsecurities and reluctance to deal with foreigners.As is true for legal barriers, those who canovercome the indirect barriers through, for example,access to better information or freedom fromxenophobia, might be able to enjoy abnormalreturns by diversifying internationally. That is,those who can overcome the barriers might achievea risk-return combination such as that at A inFigure 15.7.When we interpret market segmentation inthe more general terms of having differentexpected returns or risks according to where aninvestor lives, it becomes clear that as well asarising from legal and indirect barriers, segmentationcan arise because prices of what investorsconsume relative to the returns they earn changedifferently in different countries. 26 In such a casethe buying power of returns would depend onwhere investors live. It turns out, however, thatthis cause of segmentation requires that PPP doesnot hold. This is because, for example, if PPPholds and investors in one country, say Canada,happen to earn a lower nominal return thaninvestors elsewhere because of an appreciation ofthe Canadian dollar, then the lower nominalreturn to Canadians is compensated for by lowerinflation in Canada; an appreciation of the25 Philippe Jorion and Eduardo Schwartz, ‘‘Integration vs.Segmentation in the Canadian Stock Market,’’ Journal of<strong>Finance</strong>, July 1986, pp. 603–16.26 For an excellent account of this interpretation ofsegmentation see Michael Adler and Bernard Dumas,‘‘<strong>International</strong> Portfolio Choice and Corporation <strong>Finance</strong>:A Synthesis,’’ Journal of <strong>Finance</strong>, June 1983, pp. 925–84.Canadian dollar is associated with lower prices inCanada. 27 It follows that if PPP holds, securitiesshould be priced according to equation (15.5), inwhich the market return is the global-marketreturn, provided of course there are no legal orindirect causes of segmentation.When PPP does not hold, there is exchange-raterisk, and markets are segmented with different realrates of return for investors according to where theylive; the changes in exchange rates will not beexactly offset by changes in prices. The effect ofhaving exchange-rate risk for the asset pricingrelationship in equation (15.5) is to make theinternational CAPM more complex than a merereinterpretation of the domestic CAPM. 28Evidence on whether securities are priced in anintegrated or a segmented capital market has beenprovided by Philippe Jorion and EduardoSchwartz. 29 They begin by noting that integrationmeans expected returns depend only on internationalfactors, and in particular on the systematicrisk of securities vis-à-vis the world-market portfolio.That is, if markets are completely integrated,the r j ’s of different securities should depend only ontheir b’s calculated vis-à-vis the return on the worldmarket. On the other hand, if markets arecompletely segmented, expected returns willdepend on only domestic factors, and in particularthe b’s vis-à-vis the domestic market return. Byisolating the international and domestic b’s Jorionand Schwartz were able to show that domestic27 The appreciation of the Canadian dollar means that toCanadians, there is a depreciation of the US dollar, thepound, the yen, and so on. This would reduce the return onforeign securities to Canadians but would also reduce theprices of products that Canadians buy.28 For accounts of the international CAPM in the presence ofexchange-rate risk due to deviations from PPP see PietSerçu, ‘‘A Generalization of the <strong>International</strong> Asset PricingModel,’’ Revue Française de <strong>Finance</strong>, June 1980, pp. 91–135,and René Stultz, ‘‘A Model of <strong>International</strong> Asset Pricing,’’Journa of Financial Economics, December 1981, pp. 383–406.See also the excellent survey in Adler and Dumas (1983),op. cit.29 Jorion and Schwartz, op. cit.337 &
INTERNATIONAL INVESTMENT AND FINANCINGfactors are relevant for expected returns onCanadian securities, suggesting some degree ofmarket segmentation. 30Jorion and Schwartz also separated outinter-listed Canadian stocks – those tradingsimultaneously on both US and Canadian stockexchanges – and found the same result, namely, thatCanadian returns are related to systematic risk vis-àvisthe Canadian market. This suggests that thesegmentation is not attributable to reporting ofinformation on Canadian stocks, because Canadiancompanies with shares trading on US exchangesmust report the same types of information as thatreported by US companies.Limited further support for segmentation basedon an examination of inter-listed stocks has beenprovided by Gordon Alexander, Cheol Eun, andS. Janakiramanan. 31 They begin by stating that ifmarkets are segmented, the listing of a securityabroad should reduce the security’s expected rate ofreturn. This should come about as a result of a jumpin the stock price at the time the market learns ofthe additional listing. They find evidence consistentwith a lower expected return after overseas listingfor their sample of non-Canadian firms. However,they do not detect the implied jumps in stock pricesand find insignificant effects for Canadian firms.An alternative, although even more indirect,way of testing whether markets are integrated orsegmented is to see whether securities of companiesthat can overcome segmentation have returns morerelated to systematic risk vis-à-vis the internationalthan vis-à-vis the domestic market. For example, ifUS multinational corporations can invest in countrieswhere private US citizens cannot, then thereturns on US multinationals’ securities should bemore closely related to their b’s vis-à-vis theinternational market than vis-à-vis the US market,whereas returns on non-multinational US securitiesshould not. Indeed, the extent to which the USmultinationals’ securities are priced according tointernational or domestic risk should depend ontheir international orientation, judged, for example,by the fraction of sales made overseas. One testof this was performed by Tamir Agmon and DonaldLessard, who found some weak indication thatmultinationals can achieve something investorscannot achieve themselves. 32 However, it has beenpointed out that the US market index itself containscompanies which earn a substantial fraction of theirearnings overseas – consider, for example, CocaCola, McDonalds, Microsoft, General Electric andGeneral Motors – so that the b’s of securitiesvis-à-vis the US market are not really measuringsystematic risks vis-à-vis the domestic market. Thatis, the r m for the US market includes a substantialamount of the effect of international returns, so thatstudies comparing the use of r m for an internationalindex and a US index understate the role of internationalizationof investment by US multinationals.When US stock indexes are constructed in a waythat removes the international returns in them, theresults show a more significant benefit from theability of multinational corporations to invest30 It has been argued that if investors in the different countriescare about different measures of inflation, so that PPPcannot hold, then the pricing of domestic factors does notnecessarily mean that markets are segmented. See MustafaN. Gultekin, N. Bulent Gultekin, and Alessandro Fenati,‘‘Capital Controls and <strong>International</strong> Capital MarketsSegmentation: The Evidence from the Japanese andAmerican Stock Markets,’’ Paper presented to European<strong>Finance</strong> Association Meetings, Madrid, 1987.31 Gordon J. Alexander, Cheol S. Eun, and S. Janakiramanan,‘‘<strong>International</strong> Listings and Stock Returns; Some EmpiricalEvidence,’’ Journal of Financial and Quantitative Analysis,June 1988, pp. 135–51.& 33832 Tamir Agmon and Donald R. Lessard, ‘‘InvestorRecognition of Corporate <strong>International</strong> Diversification,’’Journal of <strong>Finance</strong>, September 1977, pp. 1049–56. Theresults of Agmon and Lessard disagree with those ofBertrand Jacquillat and Bruno Solnik, ‘‘Multinationals arePoor Tools for Diversification,’’ Journal of PortfolioManagement, Winter 1978, pp. 8–12; H.L. Brewer,‘‘Investor Benefits from Corporate <strong>International</strong>Diversification,’’ Journal of Financial and QuantitativeAnalysis, March 1981, pp. 113–26; and A.J. Senschak andW.L. Beedles, ‘‘Is Indirect <strong>International</strong> DiversificationDesirable?’’ Journal of Portfolio Management, Winter 1980,pp. 49–57.
PORTFOLIO INVESTMENToverseas. 33 This suggests that markets aresegmented for the ordinary US investor. Exhibit 15.2suggests this segmentation has increased.While the preceding arguments try to explainsegmentation taking the form of home-equity bias interms of rational financial arguments, it has beensuggested that what we observe could be the resultsof investor-behavior characteristics. For example,Kenneth French and James Poterba have suggestedinvestors may be relatively more optimistic aboutdomestic versus foreign prospects. 34 They calculatethe extent to which expected returns on domesticinvestments would have to exceed those on foreigninvestments to produce the observed degree ofhome-equity bias. They show, for example, that USinvestors would have to expect about 2.4 percentmore from US equities than Japanese investorsexpect, and about 1 percent more than Britishinvestors. Optimism about domestic prospectssupporting the behavioral line of argument has beennoted in survey data by Norman Strong andXinzhong Xu who investigated the monthly FundManager Survey conducted by Merrill Lynch. 35Investment managers from the United States, theUnited Kingdom, Europe and Japan all showed asignificant relative optimism towards their owndomestic market.BONDS AND INTERNATIONALPORTFOLIO DIVERSIFICATIONWhen considering international investment inbonds, issues arise that are similar to those wehave already discussed concerning stocks, including33 See John S. Hughes, Dennis E. Logue, and RichardJ. Sweeney, ‘‘Corporate <strong>International</strong> Diversification andMarket Assigned Measures of Risk and Diversification,’’Journal of Financial and Quantitative Analysis, November1975, pp. 627–37.34 Kenneth R. French and James M. Poterba, ‘‘InvestorDiversification and <strong>International</strong> Equity Markets,’’ AmericanEconomic Review, May 1991, pp. 222–6.35 Norman Strong and Xinzhong Xu, ‘‘Understanding theEquity Home Bias: Evidence from Survey Data,’’ The Reviewof Economics and Statistics, May 2003, pp. 307–12.the extent to which foreign bonds, unhedged,introduce exchange-rate risk, and the extent towhich bonds further allow investors to improvethe risk-return opportunity set. As for the issue ofthe currency risk associated with bonds, the evidenceindicates that the contribution of exchangerates to the riskiness of bonds is much larger thanit is for stocks. 36 Some difference in this regardwould be expected from the PPP principle.Specifically, if expected income streams and hencestock prices kept pace with inflation, then higherinflation in a country would increase stock pricesat the same time as it caused depreciation of thecountry’s currency: the inflation increases prices,including those of real assets such as stocks,but at the same time causes depreciation. In sucha situation the effect of inflation in the localcurrencystock price is offset by the depreciationwhen the stock price is measured in terms of USdollars. Stated differently, the local-currencystock price and the currency value are negativelycorrelated, at least to the extent PPP holds. Thisreduces volatility measured in US dollars. Ofcourse, factors other than PPP are at workaffecting the correlation, so any reduction instock-price volatility in dollars is against thebackground of these other factors.In the case of bonds, the opposite could beoccurring to the situation for stocks. Currencydepreciation could lead to government action toincrease interest rates in an attempt to prop upthe currency, a practice called ‘‘leaning againstthe wind.’’ Higher interest rates reduce bondprices in local currency, so that depreciation ofthe currency is associated with a decline in thelocal currency value of the bond. In this case,unlike the case with stocks discussed previously,the asset value and exchange-rate movement arereinforcing, making variations in US bond valueshigher; the correlation between the local-currencyasset value and the exchange rate is positive,thereby adding to volatility.36 See Patrick Odier and Bruno Solnik, op. cit.339 &
INTERNATIONAL INVESTMENT AND FINANCINGEXHIBIT 15.2EVOLUTION OF CAPITAL MARKET INTEGRATIONThere is a presumption that international financialmarkets are more open and freer today than they haveever been before. Indeed, we think of hot moneyflowing according to the slightest differential betweencountries’ interest rates, with no loyalty other than tothe rate of return. In other words, it is commonlybelieved that financial markets are more integratedthan at any time in history. This belief is based on theview that legal barriers to investment have all butdisappeared, and that information travels around theglobe at the speed of light. Therefore, it may comes asa surprise to many that evidence indicates capitalmarkets may be less integrated than they were in thelate nineteenth century.How well-integrated have the world’s capitalmarkets been in the modern industrial era? Inrecent decades economic historians have agreedthat capital markets were well-integrated in thelate 19th century, that they disintegrated somewhatin the period between the two world wars,and that they have been reintegrating speedilysince then. Some economists have sought tomeasure capital-market integration by examiningthe correlation between domestic saving andinvestment rates among the developed countries,on the theory that domestic saving would seekout the highest returns in world capital marketsindependent of local investment demand. A keyunexpected finding of this research was thatcapital markets were not well integrated in the1960s and 1970s.Now, in an NBER study, Alan Taylor revisits thequestion and presents a more nuanced picture ofthe evolution of capital markets. He finds that theconventional wisdom seems to be broadly correct,and he develops and extends the more recentThe empirical importance of internationalportfolio diversification of bonds is addressed inFigure 15.9. 37 The figure shows two efficiency37 See Odier and Solnik, op. cit.& 340analyses which have found that the re-integrationof capital markets since World War II has beenslow. He concludes, among other things, thatcapital markets today – despite all the journalisticand anecdotal evidence of ‘‘globalization’’ – arestill less integrated than they were 100 years ago.In ‘‘<strong>International</strong> Capital Mobility in History: TheSaving-Investment Relationship,’’ Taylor assemblesand reviews data for a group of 12 countries(Argentina, Australia, Canada, Denmark, France,Germany, Italy, Japan, Norway, Sweden, the UnitedKingdom, and the United States) over the periodfrom 1850 to 1992. While data are missing forsome countries for some years, this is both a largersample and a longer time span than had been utilizedpreviously. Taylor finds that the average size ofcapital flows in the pre-World War I era was oftenas high as 4 to 5 percent of national income. Flowsdiminished during the 1920s, however, and internationalcapital flows were less than 1.5 percent ofnational income in the late 1930s. But the all-timelow was in the 1950s and 1960s – around 1 percentof national income – and while flows increased in thelate 1970s and 1980s, they still didn’t approach thelevels of a century ago.Taylor also extends the analysis of the correlationsbetween domestic saving and domesticinvestment to analyze the entire 1850–1992 periodfor the 12-country group. The results broadly supportthe conventional view of the late 19th and early20th centuries, and confirm the earlier researchsuggesting that capital mobility was low in thepost-World-War II era.Source: A summary of Alan Taylor’s ‘‘Capital MarketsToday are Less Integrated Today than 100 years Ago,’’ inThe NBER Digest, Working Paper 5743, National Bureau ofEconomic Research, Cambridge, MA, June 1997.frontiers, one for an optimally internationallydiversified portfolio of stocks only, and the otherfor stocks plus bonds. The frontier when bondsare included in the portfolio shows reduced riskfor given returns. This reduction in risk does not,
PORTFOLIO INVESTMENTReturn (% per year)35302520151050Globally efficient frontierincluding bonds5 10 15 20 25 30 35Risk, s (% per year)Globally efficient frontierexcluding bondsUS stocks& Figure 15.9 Contribution of bonds to the globallyefficient frontier, US dollars, 1980–90NotesIncluding bonds as well as stocks in an internationallydiversified portfolio provides an opportunity to reduce risk fora given return vis-à-vis a stock-only portfolio. The benefit fromholding bonds comes despite the relatively high exchange-raterisk on bonds.Source: Patrick Odier and Bruno Solnik, ‘‘Lessons for<strong>International</strong> Asset Allocation.’’ Copyright 1993, CFAInstitute. Reproduced and republished from Financial AnalystsJournal with permission from CFA Institute. All rightsreserved.of course, occur at high rates of return because toachieve such returns it is necessary to hold onlystocks. At lower expected returns the advantage ofincluding bonds is substantial with, for example, avolatility reduction from 12 to 8 percent at a10 percent rate of return. The position of thecombined stock and bond efficiency frontier inFigure 15.9 makes the gains from internationalportfolio diversification very evident.SETTLEMENTS OF INTERNATIONALPORTFOLIO INVESTMENTSWhen an investor acquires a stock or bond in anoverseas market the settlement and exchange of assetsoccur in more than one regulatory environment. Themechanics of such multi-country exchange andsettlement is handled by global custodians.Custodians provide the services of holding securitiesand making payments. For further fees, they alsohandle foreign exchange transactions, collect dividends,handle proxies, forward relevant corporateinformation to asset owners, and arrange to reclaimwithholding taxes. 38 While some countries such asthe US and Canada have so integrated their settlementprocedures that the border does not representmuch of a barrier, in situations where language andregulatory differences exist settlement can be complex.For example, changes in exchange rates as wellas asset prices make the timing of transactions relatedto settlement extremely important. In essence, byovercoming the complexities custodians help tointegrate markets. However, they have clearly notyet made markets a seamless whole, or we wouldnot observe so much evidence supporting marketsegmentation.SUMMARY1 If different countries’ economic performances are not perfectly synchronized, or ifthere are other differences between nations such as in the types of industries theyhave, there are benefits from international diversification of portfolios beyond thosefrom diversification within a single country. Therefore, investments in foreign38 For an account of the growing role of global custodians see ‘‘Global Custody: Speeding the Paperchase,’’ special supplement toEuromoney, March 1989; Keith Martin, ‘‘The Changing Role of the Global Custodian,’’ Benefits and Pensions Monitor, May/June 1994,pp. 12–15; and Jodi G. Scarlata, ‘‘Institutional Developments in the Globalization of Securities and Futures Markets,’’ Review,Federal Reserve Bank of St. Louis, January/February 1992, pp. 17–30. For an alternative procedure for dealing with overseasportfolio investments, see the discussion of American Depository Receipts in Chapter 18.341 &
INTERNATIONAL INVESTMENT AND FINANCINGcountries might be made even if they offered lower expected returns than somedomestic investments; the diversification benefits might more than compensate forlower expected returns.2 The evidence shows considerable independence between different countries’ stockreturns, suggesting large gains from international diversification. Portfolios that areinternationally diversified do indeed prove to have lower volatility than portfolios ofdomestic stocks of the same size.3 Stocks of companies in different countries but in the same industry are not highlycorrelated. This indicates that stock-market indexes have low correlations because ofidiosyncratic economic circumstances, not because the indexes of different countries’markets have different industrial compositions.4 Even if internationally diversified portfolios are not hedged against exchange-raterisk, they show lower volatility than domestically diversified portfolios. This is despitethe fact that exchange rates are an important component of overall volatility offoreign stocks both directly, and indirectly via their covariance with local marketreturns.5 Many early studies of the gains from international diversification overstated the gainsbecause they constructed portfolios on the basis of past actual returns rather thanexpected future returns.6 If assets are priced in internationally integrated capital markets, their returns areappropriate for their risk when combined with the world-market portfolio. Then, bynot diversifying internationally, an investor is accepting more risk than is necessaryfor a given expected return, or lower expected return than is necessary for agiven risk.7 If capital markets are segmented, those who can overcome the cause of segmentationand invest abroad can enjoy abnormal returns for the risk taken. This is becauseassets are then priced only to compensate for the risk in internationally undiversifiedportfolios.8 Evidence indicates that there is some segmentation of capital markets.9 Multinational corporations’ shares appear to be priced according to their systematicrisk vis-à-vis an internationally diversified portfolio. Investors appear to value theability of multinationals to invest abroad, overcoming the barriers which theinvestors themselves face on overseas investments.10 Home-equity bias may be due to people in different countries facing differentconsumption prices, or because domestic investors are more optimistic about their owncountry’s prospects than are foreign investors.11 Exchanges rates add substantially more to the volatility of foreign bonds than they do tothe volatility of foreign stocks. This could be explained by PPP applying to stocks, and tothe policy of ‘‘leaning against the wind’’ on bonds, whereby central banks increaseinterest rates, thereby lowering bond prices, when their currencies are depreciating.12 Despite the exchange-rate risk on bonds, the inclusion of bonds in an internationallydiversified portfolio lowers risk and raises return vis-à-vis a stock-only diversifiedportfolio.13 Global custodians help handle the exchange and settlement of foreign securities. In thisway they help to integrate capital markets.& 342
PORTFOLIO INVESTMENTREVIEW QUESTIONS1 What types of investments are included in ‘‘international portfolio investment?’’2 Why are the correlation coefficients between different countries’ stock markets andstocks relevant for the potential benefit from international portfolio diversification?3 How could different compositions of stock-market indexes reduce the correlationbetween returns on different countries’ markets?4 What are the different components of volatility from investment in stocks of an individualforeign country?5 What do we mean by ‘‘integrated capital markets?’’6 What assumptions must be made to apply the international capital asset pricing model toan explanation of the pricing of securities?7 How would you characterize the gains from international portfolio diversification?8 What is meant by ‘‘home-equity bias?’’9 How can the level of information cause international capital market segmentation?10 How would you interpret the conclusion that returns are more closely related to systematicrisk in the domestic market than to systematic risk in the international market?11 How might multinational firms offer a vehicle for overcoming segmented capitalmarkets?12 What does a global custodian do?ASSIGNMENT PROBLEMS1 Why are the benefits from international diversification overstated if efficient portfoliosare constructed on the basis of past investment returns?2 Why are there gains from international diversification without hedging exchange-raterisk even though exchange rates contribute a substantial proportion of overall risk?3 Could we judge whether markets are segmented or integrated by examining rulesgoverning the international flow of capital?4 Why does the calculation of the risk-free rate for the ICAPM involve the use of forwardcontracts? Could we use any one country’s risk-free rate if covered interest-parity holds?5 What possible reasons exist for the segmentation of capital markets?6 Why might an investor who is able to diversify globally benefit if, for most other investors,capital markets are segmented?7 How might we calculate the importance of currency risk to the total risk ona an individual foreign stock?b a portfolio of foreign stocks?8 Could multinationals provide a vehicle for overcoming market segmentation?9 How is the expected equilibrium return on bonds likely to vary with the covariancebetween the local-currency market value of bonds and the exchange rate?10 What impact might global custodians have on capital markets if they do their job cheaplyand effectively?343 &
INTERNATIONAL INVESTMENT AND FINANCINGBIBLIOGRAPHYAdler, Michael and Bernard Dumas, ‘‘Optimal <strong>International</strong> Acquisitions,’’ Journal of <strong>Finance</strong>, March 1975,pp. 1–19.——, ‘‘<strong>International</strong> Portfolio Choice and Corporation <strong>Finance</strong>: A Synthesis,’’ Journal of <strong>Finance</strong>, June 1983,pp. 925–84.Baxter, Marianne and Urban Jermann, ‘‘The <strong>International</strong> Diversification Puzzle is Worse than You Think,’’American Economic Review, March 1997, pp. 170–80.Cohen, Kalman, Walter Ness, Robert Schwartz, David Whitcomb, and Hitoshi Okuda, ‘‘The Determinantsof Common Stock Returns Volatility: An <strong>International</strong> Comparison,’’ Journal of <strong>Finance</strong>, May 1976,pp. 733–40.Cooper, Ian and Evi Kaplanis, ‘‘Home Bias in Equity Portfolios, Inflation Hedging, and <strong>International</strong> CapitalMarket Equilibrium,’’ Review of Financial Studies, Spring 1994, pp. 45–60.Dimson, Elroy, Paul Marsh, and Mike Staunton, Triumph of the Optimists: 101 Years of Global InvestmentReturns, Princeton University Press, Princeton, NJ, 2002.Eun, Cheol S. and Bruce G. Resnick, ‘‘Exchange Rate Uncertainty, Forward Contracts, and <strong>International</strong> PortfolioSelection,’’ Journal of <strong>Finance</strong>, March 1988, pp. 197–215.Frankel, Jeffery A., ‘‘The Diversifiability of Exchange Risk,’’ Journal of <strong>International</strong> Economics, August 1979,pp. 379–93.French, Kenneth R. and James M. Poterba, ‘‘Investor Diversification and <strong>International</strong> Equity Markets,’’ AmericanEconomic Review, May 1991, pp. 222–6.Grauer, Frederick L., Robert H. Litzenberger, and Richard E. Stehle, ‘‘Sharing Rules and Equilibrium in an<strong>International</strong> Capital Market under Uncertainty,’’ Journal of Financial Economics, June 1976, pp. 223–56.Hughes, John S., Dennis E. Logue, and Richard J. Sweeney, ‘‘Corporate <strong>International</strong> Diversification and MarketAssigned Measures of Risk and Diversification,’’ Journal of Financial and Quantitative Analysis, November1975, pp. 627–37.Jorion, Philippe, ‘‘<strong>International</strong> Diversification with Estimation Risk,’’ Journal of Business, July 1985, pp. 259–78.—— and Eduardo Schwartz, ‘‘Integration vs. Segmentation in the Canadian Stock Market,’’ Journal of <strong>Finance</strong>,July 1986, pp. 603–14.Lessard, Donald R., ‘‘World, Country, and Industry Relationships in Equity Returns: Implications forRisk Reduction through <strong>International</strong> Diversification,’’ Financial Analysts Journal, January–February 1976,pp. 2–8.Levy, Haim and Marshall Sarnat, ‘‘<strong>International</strong> Diversification of Investment Portfolios,’’ American EconomicReview, September 1970, pp. 668–75.Lewis, Karen K., ‘‘Trying to Explain Home Bias in Equities and Consumption,’’ Journal of Economic Literature,June 1999, pp. 571–608.Odier, Patrick and Bruno Solnik, ‘‘Lessons for <strong>International</strong> Asset Allocation,’’ Financial Analysts Journal, March/April 1993, pp. 63–77.Serçu, Piet, ‘‘A Generalization of the <strong>International</strong> Asset Pricing Model,’’ Revue Française de <strong>Finance</strong>, June 1980,pp. 91–135.Solnik, Bruno H., ‘‘Why Not Diversify <strong>International</strong>ly Rather than Domestically?’’ Financial Analysts Journal,July–August 1974, pp. 48–54.——, ‘‘An Equilibrium Model of <strong>International</strong> Capital Market,’’ Journal of Economic Theory, August 1974,pp. 500–24.& 344
PORTFOLIO INVESTMENT——, ‘‘<strong>International</strong> Arbitrage Pricing Theory,’’ Journal of <strong>Finance</strong>, May 1983, pp. 449–57.Stultz, René, ‘‘A Model of <strong>International</strong> Asset Pricing,’’ Journal of Financial Economics, December 1981,pp. 383–406.Uppal, Raman, ‘‘A General Equilibrium Model of Portfolio Choice,’’ The Journal of <strong>Finance</strong>, June 1993,pp. 529–53.——, ‘‘The Economic Determinants of the Home Country Bias in Investors’ Portfolios,’’ Journal of <strong>International</strong>Financial Management and Accounting, Autumn 1993, pp. 171–89.345 &
Chapter 16Capital budgeting for foreigninvestmentsAll the world’s a stage.William ShakespeareAs You Like ItSELECTING PROJECTSThe massive multinational corporations (MNCs),whose names are household words around the globeand which have power that is the envy and fear ofmany governments, grew large by making foreigndirect investment (FDI). A criterion used formaking these investments will be presented in thischapter as we develop the principle of capitalbudgeting that can be used in evaluating foreignprojects.A typical FDI is the building of a plant tomanufacture a company’s products for sale inoverseas markets. The choice of building a plant isone of several alternative ways of selling thecompany’s products in a foreign country. Otheroptions include exporting from domestic facilities,licensing a producer in the foreign market tomanufacture the good, and producing the good ina facility outside the intended market which thefirm already operates. As Exhibit 16.1 explains,the choice is complex and has to be made in aworld in which conditions are continually changing.Nevertheless, as is explained in Exhibit 16.2,increasing competition from globalized trade isforcing companies to seriously consider FDI.& 346Project evaluations, generally referred to ascapital budgeting, are discussed in a domestic contextin almost all introductory corporate financecourses. However, in the international arena,capital budgeting involves complex problems thatare not shared in a domestic context. These include,for example, the dependence of cash flows oncapital structure – the amount of debt versusequity used in company financing – because of cheaploans from foreign governments. This makesthe cost of capital to the corporation different fromthe opportunity cost of capital of shareholders,where the latter is the correct discount rate. Thereare also exchange-rate risks, country risks, multipletiers of taxation, and sometimes restrictions onrepatriating income. We will show the conditionsunder which some of the more complex problemsin the evaluation of overseas direct investments canbe reduced to manageable size.There are several approaches to capital budgetingfor traditional domestic investments, includingnet present value (NPV), adjusted presentvalue (APV), internal rate of return, andpayback period. We shall use the APV technique,which has been characterized as a ‘‘divide and
CAPITAL BUDGETINGEXHIBIT 16.1INVESTMENT STRATEGIES: A DYNAMIC MATTERIn a matter of than less than a decade, GeneralElectric’s rationale for a joint venture to manufactureappliances in Mexico changed several times. As thefollowing excerpt explains, in GE’s case the companywas fortunate that new developments gave furthersupport for the original choice.Our major appliance (white goods) business had amainly domestic focus for many years. In the mid-1980s, GE Appliances decided to enter the NorthAmerican gas range business through a Mexicanjoint venture with a local partner. They built aplant in Mexico to serve both the export marketand eventually, what they foresaw (correctly, as itturns out) as a growing Mexican market formodern domestic appliances. Their initial foreignexchange concern was a 1982-style devaluationand de facto confiscation of dollar-denominatedfinancial assets. The solution had two principalelements: one was an offshore sales company,to minimize locally-held dollar assets to theextent possible, the other was careful managementof working capital and cash flow exposure tomaintain a balanced position. These are classicstrategies in devaluation-prone currencies wherehedging instruments are either unavailable orprohibitively expensive.The strategy worked well throughout the 1980s,but within the last two years, the environment haschanged. First of all, the local Mexican market formajor appliances (including refrigeration andhome laundry products, which the joint venturealso supplies) has expanded, and GE Appliances iswell-positioned to take advantage of the increasedlocal demand. The result, of course, is that we nowhave more peso assets on the books. Also, financingthese assets by borrowing in local currency –a classic hedging technique – remains stubbornlyexpensive. The business did a lot of homework onthe Mexican economic situation and on forecastingcash flows and income statements by currency.Their assessment of the former and their analysisof cash flows and expected returns in the businessled them to a greater degree of comfort withan increased level of Mexican asset exposure.The strategy is working well, and Appliances isvery enthusiastic about the second stage, as itwere, of their Mexican investment.Less than two years after this item was written,Mexico experienced a serious financial crisis.Between December 1994 and March 1995 the pesolost almost half its foreign exchange value. A strategyof having Mexican asset exposure meant resultingtranslation or transaction losses; peso assets, such aspeso accounts receivable, became worth half theirprevious value when converted into dollars. However,to the extent that Mexican facilities produced for theUS market, the peso devaluation meant increasedprofitability; see Chapter 11. A priori, the net result ofthe asset versus operating exposures is difficult todiscern. Nevertheless, the scale of the 1994–95 pesocrisis helps reinforce the importance of maintainingclose scrutiny of foreign direct investments.Source: Marcia B. Whitaker, ‘‘Strategic Management ofForeign Exchange Exposure in an <strong>International</strong> Firm,’’ inYakov Amihud and Richard M. Levich (eds), ExchangeRates and Corporate Performance, New York UniversitySalomon Center, 1994, pp. 247–55.conquer’’ approach because it tackles each difficultyas it occurs. The APV approach involves accountingseparately for the complexities found in foreigninvestments as a result of such factors as subsidizedloans and restrictions on repatriating income.Before we show how the difficulties can be handled,we shall enumerate the difficulties themselves.Our explanations will show why the APV approachhas been proposed for the evaluation of overseasprojects, rather than the traditional NPV approachwhich is generally the preferred choice in evaluatingdomestic projects.347 &
INTERNATIONAL INVESTMENT AND FINANCINGEXHIBIT 16.2COMPETITIVE PRESSURE TO PURSUE FDICompanies in many industries can no longer survive asexclusively domestic operations. Competition fromforeign-based firms which have made FDIs and whichenjoy economies of large-scale production is forcingpreviously inward-looking companies to considerinvesting abroad. In other words, some companies areconsidering FDI because other companies have madeFDIs. The need to pursue FDIs to remain competitiveis discussed in the following excerpt. Other developmentswhich are adding to the global level of directinvestment and the coordination of the resultingmultinational activities are also mentioned.Multinational corporations (MNCs) today not onlyparticipate in most major national markets, butare also increasingly coordinating their activitiesacross these markets to gain advantages of scale,scope, and learning on a global basis. The emergenceof global competition represents a majorthreat, as well as an opportunity, to those Europeanand American companies that gained competitiveadvantage under an older mode ofmultinational competition. Labeled ‘‘multidomestic’’competition by Michael Porter, thisnow passing phase in the development of internationalbusiness was characterized by large MNCswith overseas operations that operated for themost part independently of one another. Whatcentralization existed in this stage of the evolutionof the MNC was typically restricted to areas suchas R&D and finance. With global competition,a much larger proportion of corporate activitiesis coordinated globally, including aspects ofmanufacturing, marketing, and virtually all R&D.The emergence of global competition reflectsthe merging of previously segmented nationalmarkets caused by a variety of forces, includingreductions in trade barriers, a convergence oftastes, and significant advances in product andprocess technologies. New global strategies alsotake advantage of changes in information technologyand increased organizational sophisticationto improve coordination among geographicallydispersed operations ...National financial markets have becomeincreasingly linked into a single global market, as aresult of both deregulation and an increase in themarket power, global reach, and financial skills ofboth corporate and institutional users of financialservices. At the same time, a significant deepening offinancial technology has taken place not only interms of the information, trading, and documentprocessingsystems, but also in the refinement ofanalytical techniques that have given rise to newfinancial instruments, more precise pricing of assets,and new economic risk management approaches.Source: Donald R. Lessard, ‘‘Global Competition andCorporate <strong>Finance</strong> in the 1990s,’’ Journal of AppliedCorporate <strong>Finance</strong>, Winter 1991, pp. 59–72.DIFFICULTIES IN EVALUATINGFOREIGN PROJECTS 1Introductory finance textbooks tend to advise theuse of the NPV technique for capital budgeting1 Our account of the adjusted-present-value technique drawson a paper by Donald Lessard: ‘‘Evaluating <strong>International</strong>Projects: An Adjusted Present Value Approach,’’ inDonald R. Lessard (ed.), <strong>International</strong> Financial Management:Theory and Application, Warren, Gorham and Lamont,Boston, MA, 2nd edn, 1985.& 348decisions. The NPV is defined as followsNPV ¼ K 0 þ XTt¼1CFt ð1tÞð1 þrÞ t ð16:1ÞwhereK 0 ¼ project costCF t ¼ expected before-tax cash flow in year tt ¼ tax rater ¼ weighted average cost of capitalT ¼ life of the project
CAPITAL BUDGETINGThe weighted average cost of capital, r, isinturn defined as followsr ¼EE þ D re þDE þ D rð1 tÞwherer e ¼ equilibrium cost of equity reflecting only thesystematic riskr ¼ before-tax cost of debtE ¼ total market value of equityD¼ total market value of debtt ¼ tax rateWe see that the cost of equity and the cost ofdebt are weighted by the relative importance ofequity and debt as sources of capital, and that anadditional adjustment is made to the cost of debtdue to the fact that interest payments are generally adeductible expense when determining corporatetaxes. The adjustment of (1 t) gives the effectivecost of debt after the fraction t of interest paymentshas been saved from taxes. While not universallyaccepted, this NPV approach has enjoyed a prominentplace in finance textbooks. 2There are two categories of reasons why it isdifficult to apply the traditional NPV technique tooverseas projects and why an alternative frameworksuch as the adjusted-present-value technique ispreferred by many managers. The first category ofreasons involves the difficulties which cause cashflows – the numerators in the NPV calculation – to beseen from two different perspectives: that of theinvestor’s home country and that of the country inwhich the project is located. The correct perspectiveis that of the investor’s home country, which weassume to be the same for all company shareholders. 32 For the traditional textbook account of the NPV approachwith the weighted average cost of capital, see James C. VanHorne, Financial Management and Policy, 12th edn, Prentice-Hall, Englewood Cliffs, NJ, 2002. For an account of thealternative APV approach using an adjusted cost of capital,see Richard Brealey and Stewart Myers, Principles ofCorporate <strong>Finance</strong>, 6th edn, McGraw-Hill, New York, 2001.3 Michael Adler has tackled the challenging problem of havingcompany shareholders from different countries. See MichaelAdler, ‘‘The Cost of Capital and Valuation of a Two-CountryFirm,’’ Journal of <strong>Finance</strong>, March1974,pp.119–32.The second category of reasons involves the degreeof risk of foreign projects and the appropriate discountrate – the denominator of the NPV calculation.We shall begin by looking at why cash flowsdiffer between the investor’s perspective and theperspective of the foreign country in which theproject is located.CASH FLOWS: HOME VERSUSFOREIGN PERSPECTIVESBlocked fundsIf funds that have been blocked or otherwiserestricted can be utilized in a foreign investment,the effective project cost to the investor may bebelow the local project construction cost. From theinvestor’s perspective there is a gain from activatedfunds equal to the difference between the face valueof those funds liberated by pursuing the project, andthe present value of the funds if the next best thing isdone with them. This gain should be deducted fromthe capital cost of the project to find the effectivecost from the investor’s perspective. For example,if the next best thing that can be done is to leaveblocked funds idle abroad, the full value of theactivated funds should be deducted from the projectcost. Alternatively, if half of the blocked funds canbe returned to the investor after the investor paystaxes, or if the blocked funds earn half of a fairmarket interest rate, then half of the value of theblocked funds should be subtracted from the capitalcost of the project.Effects on sales of other divisionsFrom the perspective of the foreign manager ofan overseas project, the total cash flows generatedby the investment would appear to be relevant.However, factories are frequently built in countriesin which sales have previously taken place withgoods produced in other facilities owned andoperated by the same parent company. When theMNC exports to the country of the new project349 &
INTERNATIONAL INVESTMENT AND FINANCINGfrom the home country or some other preexistingfacility, only the increment in the MNC’s corporateincome due to the investment is relevant. Thismeans deducting from the new project’s cash flow,the income lost from other projects due to the newproject. It should be noted that it may not benecessary to deduct all losses of cash flows fromother facilities because sales in the foreign marketwill sometimes decline or be lost in the absence ofthe new project, and this is why the investment isbeing made. For example, the foreign investmentmay be to preempt another company entering theforeign market. What we must do is net outwhatever income would have otherwise beenearned by the MNC without the new project.Remittance restrictionsWhen there are restrictions on the repatriationof newly generated income earned on a foreignproject – the amount that can be remitted to theparent investor’s country – only those cash flowsthat are remittable to the parent company arerelevant from the MNC’s perspective. This is truewhether or not the income is actually remitted.When remittances are legally limited by the foreigngovernment, sometimes the restrictions can becircumvented to an extent by using charges forparent company overhead and so on. If we includeonly the income which is remittable via legal andopen channels, we will obtain a conservative estimateof the project’s value. If this is positive, weneed not add any more. If it is negative, we can addincome that is remittable via illegal transfers, forexample. The ability to perform this two-stepprocedure is a major advantage of the APVapproach. As we shall see, a two-step procedure canalso be applied to taxes.Different levels of taxation<strong>International</strong> taxation is an extremely complexsubject that is best treated separately, as it is inAppendix A. However, for the purpose of evaluatingoverseas direct investment, what matters is& 350the total taxes paid, and not which governmentcollects them, the form of taxes collected, theexpenditures allowed against taxes, and so on. Theessential point is that for a US-based multinational,when the US corporate tax rate is above the foreignrate, the effective tax rate will be the US rate if fullcredit is given for foreign taxes paid. For example,if the foreign project is located in Singapore and thelocal tax rate for foreign-based corporations is22 percent while the US corporate tax rate is40 percent, then after the credit for foreign taxespaid is applied, only 18 percent will be payable inthe United States. If, however, the project is locatedin Japan and faces a tax rate of 42 percent, full creditwill not be available, and the effective tax rate willbe 42 percent. This means that when we deal withforeign projects from the investor’s point of view,we should use a tax rate, t, which is the higher ofthe home-country and foreign rates.Taking t as the higher of the tax rates at homeand abroad is a conservative approach. In reality,taxes are often reduced to a level below t throughthe judicious choice of transfer prices, throughroyalty payments, and so on. These techniques canbe used to move income from high-tax countries tolow-tax countries and thereby reduce overall corporatetaxes. In addition, the payment of taxes canbe deferred by leaving remittable income abroad,and so if cash flows are measured as all remittableincome whether or not remitted, some adjustmentis required since the actual amount of taxes paid willbe less than the cash-flow term suggests. Theadjustment can be made to the cost of capital orincluded as an extra term in an APV calculation. 44 A method for valuing foreign investment that is based onnet present value and the weighted average cost of capitalthat takes care of taxes has been developed by AlanC. Shapiro, ‘‘Financial Structure and the Cost of Capitalin the Multinational Corporation,’’ Journal of Financialand Quantitative Analysis, November 1978, pp. 211–26.In general, the NPV and APV approaches will be equivalentif they take care of all complexities. This has been shown byLawrence D. Boothe, ‘‘Capital Budgeting Frameworks forthe Multinational Corporation,’’ Journal of <strong>International</strong>Business Studies, Fall 1982, pp. 113–23.
CAPITAL BUDGETINGDISCOUNT RATES: CORPORATE VERSUSSHAREHOLDER PERSPECTIVESWhile governments sometimes offer special financialterms and other kinds of help for certain domesticprojects, it is very common for foreign investorsto receive some sort of assistance. This may come inthe form of low-cost land, reduced interest rates ondebt, and so on. Low-cost land can be reflected inproject costs, but concessionary financing ismore problematic in the NPV approach. However,with the APV technique we can add an extra term tothe calculation to reflect the value of the debtsubsidy. As we shall see, the advantage of the APVapproach is due to the fact that special concessionaryloans are available to the corporation but not to theshareholders of the corporation. Concessionaryfinancing also makes the appropriate cost of capitalfor foreign investment projects differ from thatfor domestic projects, which is what happens insegmented capital markets. 5THE ADJUSTED-PRESENT-VALUETECHNIQUEThe APV for a foreign project can be written asfollows:APV ¼ S 0 K 0 þ S 0 AF 0þ XTt¼1ðS t CF t LS t Þð1 tÞð1 þ DR e Þ tþ XT DA t tð1 þ DRt¼1a Þ t þ XT r g BC 0 tð1 þ DRt¼1b Þ t" #X T LR tþ S 0 CL 0ð1 þ DR c Þ tþ XTt¼1þ XTt¼1t¼1TD tð1 þ DR d Þ tRF tð1 þ DR f Þ tð16:2Þ5 Indeed, blocked funds, remittance restrictions, and differentlevels of taxation are also causes of market segmentation.whereS 0S tK 0¼ spot exchange rate, period zero¼ expected spot rate, period t¼ capital cost of project in foreign-currencyunitsAF 0 ¼ restricted foreign funds activated by projectCF t ¼ expected remittable cash flow in foreigncurrency unitsLS t ¼ profit from lost sales, in dollarst ¼ the higher of US and foreign corporate taxratesT ¼ life of the projectDA t ¼ depreciation allowances in dollar unitsBC 0 ¼ contribution of project to borrowing capacityin dollarsCL 0 ¼ face value of concessionary loan in foreigncurrencyLR t¼ loan repayments on concessionary loan inforeign currencyTD t ¼ expected tax savings from deferrals, intersubsidiarytransfer pricingRF t ¼ expected illegal repatriation of incomeDR e ¼ discount rate for cash flows, assuming allequityfinancingDR a ¼ discount rate for depreciation allowancesDR b ¼ discount rate for tax saving on interestdeduction from contribution to borrowingcapacityDR c ¼ discount rate for saving via concessionaryinterest rateDR d ¼ discount rate for tax saving via intersubsidiarytransfersDR f ¼ discount rate for illegally repatriated projectflowsr g¼ market borrowing rate at homeWe can describe each of the terms in the APVequation and show how these terms take care ofthe difficulties in evaluating foreign investmentproject s.S 0 K 0 The cost of the project, K 0 is assumed to bedenominated in foreign currency and incurred inyear 0 only. It is converted into dollars at S 0 .351 &
INTERNATIONAL INVESTMENT AND FINANCINGS 0 AF 0 We reduce the project cost by the value,converted into dollars, of the blocked fundsactivated by the project. AF 0 is the face value of theblockedPfunds minus their value in the next best use.Tt¼1 (S t CF t LS t )(1 t)/(1 þ DR e) t Theterm CFt represents the expected legally remittableproject net cash flows on sales from the new projectin year t, beginning after a year. 6 This is measured inforeign currency and converted into dollars at theexpected exchange rate, S t From this is subtractedthe lost income that was made on sales from otherfacilities which are replaced by the new facility, LS t :If the lost income is measured in US dollars, as itwill be if due to the new foreign plant sales are lostto the US parent company, we do not multiply bythe exchange rate. However, if the lost income ismeasured in units of foreign currency, S t applies toLS t : Other funds remitted via inter-subsidiarytransfer pricing and other illegal means are includedin a later term. The cash flows are adjusted for theeffective tax rate, t, which as mentioned earlier isthe higher of the domestic and foreign corporate taxrates. Any reduction from this level that resultsfrom managing to move income from high-taxcountries to low-tax countries through internaltransfers can be added later. We assume here thatthe same tax rate applies to lost income on replacedsales as well as to income from the new investment.If the lost income would have faced a different taxrate, LS t must be considered separately from CFt :The discount rate is the all-equity cost of capital thatreflects all systematic risk, including unavoidablecountry risk and exchange-rate risk. 7 We use theall-equity cost of capital because the benefit of anytax savings from the use of debt financing is includedin a separate term, discussed later.6 As before in the book, asterisks stand for expected values.Quantities without asterisks are assumed to be known atthe time of the investment decision.7 We are not yet ready to give a full account of country risk,which includes political risk. This will be covered in thenext chapter.& 352P Tt¼1 DA tt/(1 þ DR d ) t Depreciation is anallowable expense when determining corporatetaxes, whether the source of income is from abroador from home. The benefit of the depreciationallowance is the amounts of allowance times thecorporate tax rates against which the allowance isapplied. We have assumed DA t is a dollar amountand therefore have not included S t . This will beappropriate if the higher of the foreign and domestictax rates is the domestic rate; in this case depreciationallowances are deducted against US taxes. Ifthe higher tax rate is the rate in the foreign country,DA t will probably be in foreign-currency units, andwe need to convert at S t .P Tt¼1 r gBC 0 t/(1 þ DR b ) tWhen debt is usedto finance a project at home or abroad, the interestpayments are tax-deductible, providing a taxshield. Whether or not the project in questionfully utilizes the potential borrowing made possibleby the project, the tax savings on the amount thatcould be borrowed should be included as a benefit. 8We use the potential to borrow because if, forexample, a firm does not use the entire borrowingpotential provided by a particular new project, thefirm can use more borrowing elsewhere in itsoperations and enjoy the tax shield from this borrowing.On the other hand, if a firm borrows inexcess of the capacity provided by a particularproject, it will be able to borrow less for otherprojects, losing the tax savings from debt financingon these projects.The annual benefit that is included in the APVequals the tax saving due to the interest paymentsassociated with the borrowing capacity. The interestrate is the market borrowing rate at home. Forexample, if the project has a value of $1 million andthe firm likes to maintain 50 percent of its valuein debt, the project will raise borrowing capacityby BC 0 ¼ $500,000, and the interest payment on8 Borrowing capacity is the amount of borrowing madepossible by investing in a project. This is not a limitimposed on the investor from outside, but rather resultsfrom a firm’s decision on how much debt it wishes to carry.
CAPITAL BUDGETING& Table 16.1 Value of a £1-million concessionary loanYearLoanoutstanding(£)Principalrepayment(£)Interestpayment(£)Totalpayment(£)Present valueof payment(£)1 1,000,000 100,000 100,000 200,000 173,9132 900,000 100,000 90,000 190,000 143,6673 800,000 100,000 80,000 180,000 118,3534 700,000 100,000 70,000 170,000 97,1985 600,000 100,000 60,000 160,000 79,5486 500,000 100,000 50,000 150,000 68,8497 400,000 100,000 40,000 140,000 52,6318 300,000 100,000 30,000 130,000 42,4979 200,000 100,000 20,000 120,000 31,11110 100,000 100,000 10,000 110,000 27,190834,957this amount, that is, r g BC 0 should be included eachyear. The tax saved from the interest cost deductionis this amount times the effective tax rate, that is,r g BC 0 t. As we have said, this is the amount used inthe APV calculation even if the amount borrowed islarger or smaller than $500,000. For example,if only $200,000 is borrowed on the $1 millionproject, an additional $300,000 can be borrowedelsewhere in the corporation, with consequent taxsavings from the interest payments on this$300,000. If $800,000 is borrowed, the projectwill reduce the capacity to borrow for otheractivities by $300,000, and thereby lower the taxsavings on thisPamount of debt.S 0 CL T0 t¼1 LR t/(1 þ DR c ) t The currentvalue of the benefit of a concessionary loan is thedifference between the face value of the loan, CL 0 ,and the present value of the repayments on the loandiscounted at the rate of interest that would havebeen faced in the absence of the concessionaryfinancing. The loan is assumed to be in the foreigncurrency and must be converted into dollars. Sinceit is a present or current amount it is converted atthe current exchange rate. For example, if a 10-yearloan with a 10 percent interest rate and ten equalprincipal repayments is made available when themarket rate would have been 15 percent, thepresent value of the repayment on a £1 million loanis £834,957. This is shown in Table 16.1. The valueof the subsidy from the loan concession is hence£1,000,000 £834,957 ¼ £165,043. This amounthas a dollar value of $330,086 if, for example,S 0 ¼ 2.0. 9P Tt¼1 TD t /(1 þ DR d) t By using the higher ofthe domestic and foreign tax rates for t we havetaken a conservative approach. In practice, a multinationalis likely to be able to move income fromhigh-tax locations to low-tax locations, and mayalso be able to defer the payment of taxes, therebyreducing the effective tax rate to a level below t.Corporate income can be moved by adjustingtransfer prices, head-office overhead, and so on,and the payment of taxes can be deferred by reinvestingin the foreign country rather than remittingany income. 10 The APV technique allows us toinclude an estimate of tax savings as a separate term9 A general account of the valuation of subsidized financingcan be found in Richard Brealey and Stewart Myers,Principles of Corporate <strong>Finance</strong>, 6th edn, McGraw-Hill,New York, 2001.10 Transfer prices are those charged for goods and servicesmoving between divisions of a company. They are discussedmore fully in Chapter 17.353 &
INTERNATIONAL INVESTMENT AND FINANCINGin the calculation. We can evaluate APV withoutTD t and see if it is positive. If it is, we need not doanything else: the project is worthwhile. If it is not,we can see how much of a tax saving will berequired to make APV positive and determinewhether such a saving can reasonably be expected.That is, the APV procedure allows us to take atwo-step approach when necessary.P Tt¼1 RF t /(1 þ DR f ) t The cash flow we usefor CF t is a conservative estimate. CF t includes onlythe flows which are remittable when transferprices, royalties, and so on reflect their legitimate,market values. However, a multinational might tryto manipulate transfer prices or royalty payments torepatriate more income (as well as to reduce taxes asexplained immediately above). Any extra remittableincome from additional (and perhaps illegal) channelsmay be included after the APV from the legalcash flows has been computed, if APV is negative.This two-step procedure can be applied simultaneouslyto extra remittable income and tax savings,both of which involve transfer price tinkering.SELECTING THE APPROPRIATEDISCOUNT RATESAll-equity rates that reflectsystematic riskSo far we have said little about the discount rates.The first important matter involving the choice ofdiscount rates is that since the tax shield from debt isevaluated in a separate term in the APV formula,cash flows should be discounted at an all-equitydiscount rate. Recall that the separate term in APVis the one that reflects the project’s borrowingcapacity. This is different from the NPV approachwhere the tax saving from debt appears in theweighted average cost of capital calculation. Withthe tax shield accounted for separately in APV, theopportunity cost of capital to the shareholder is theexpected return on alternative applications of theirequity. The relevant alternatives are those ofequivalent risk.& 354As we noted in Chapter 15, only the systematiccomponent of total risk matters. To some extentthe additional risks of doing business abroad aremitigated by the extent to which cash flows fromforeign projects are imperfectly correlated andtherefore reduce the variance of corporate income.If there is risk reduction from having some independenceof cash flows from different countries,and the diversification of flows from differentcountries is not directly available to shareholders,the diversification offered by the MNC should bereflected in discount rates as well as in the marketvalue of the stock. 11The risks faced with foreign investments that arenot explicitly faced with domestic investments arefirst foreign exchange risk, that is, currency risk, andsecond, country risk. These are the two ‘‘C’’ wordsthat distinguish international finance from ordinaryfinance. The two risks provide further reason, inaddition to those already mentioned, why the NPVtechnique is difficult to apply to FDI projects. Bothcountry risk and exchange-rate risk can, forexample, make the optimal capital structure changeover time. One possibility is that relatively moredebt is used early on when there is concessionaryfinance. Debt denominated in the currency ofincome might also reduce foreign exchange risk.It is difficult to incorporate dynamic capitalstructure within the weighted average cost ofcapital used in the NPV technique. However, in theAPV technique, where we use the all-equity costof capital, (DR e ), the effect of capital structure on,for example, interest tax shields, is treated in aseparate term.Country risk can be diversified by holdinga portfolio of investments of many different countries.Similarly, currency risk can be diversifiedby holding investments denominated in many differentcurrencies. It is also possible to use debtdenomination in the currency of income, forward11 As we mentioned in Chapter 15, an ability of a multinationalcorporation to do what its shareholders cannot requirescapital market segmentation from the shareholders’perspective, that the corporation can circumvent.
CAPITAL BUDGETINGcontracts, options, and other hedges. This meansthat the risk premium in the discount rate, whichreflects only the systematic risk, may not be verylarge. 12 It follows from our discussion of theICAPM in Chapter15 that knowing the systematicrisk requires that we have a covariance for theproject’s value with the relevant market portfolio.It is extremely difficult to obtain such a projectcovariance because, while a company’s marketvalue may be known, there is no market value ofthe project, and no past data to use to estimate thecovariance with proposed projects. Moreover, therelevant risk premium for the APV approach mustbe for an all-equity investment. This adds evenmore difficulty when any existing risk premiumreflects the company’s debt. But these are onlysome of the problems in selecting appropriate discountrates. We have already mentioned the problemof the shareholder perspective, which isdifficult when different shareholders are from differentcountries and capital markets are segmented.Yet another problem is inflation and the connectedquestion of the currency in which cash flows aremeasured.Inflation and discount rate choiceA question that arises in all capital budgetingapplications, whether the investment projectbeing evaluated is foreign or domestic, concernsthe choice of the ‘‘nominal’’ versus the ‘‘real’’12 Instead of including the country risk in the discount rate,we can incorporate it within the cash-flow term. Thisprocedure, which can also be followed with other types ofrisk, involves putting cash flows into their ‘‘certaintyequivalents.’’ A method of dealing with risk that avoids theneed to find certainty equivalents or risk premiums is todeduct from cash flows the cost of country risk insurance ora foreign exchange risk management program. This is therecommendation of Arthur I. Stonehill and LeonardNathanson in ‘‘Capital Budgeting and the MultinationalCorporation,’’ California Management Review, Summer1968, pp. 39–54. The ability of shareholders to diversifyforeign exchange risk has been examined by JefferyA. Frankel, ‘‘The Diversifiability of Exchange Risk,’’Journal of <strong>International</strong> Economics, August 1979, pp. 379–93.discount rate. (As mentioned in Chapter 8, the realinterest rate is the nominal rate minus expectedinflation.) The answer is that the choice does notmatter provided we are consistent. That is, wereach the same conclusion if we discount nominalcash flows (those not adjusted for inflation) by thenominal discount rate, or real (inflation adjusted)cash flows by the real discount rate. However,if cash flows are easier to forecast in today’s pricesso that the forecasts are of real cash flows, as apractical matter it is easier to use the real flows anddiscount at the real rate. (Companies may find iteasier to forecast quantities of goods they may sellthan to forecast values of goods sold which dependon future prices. Therefore, it is often easier to dealwith real cash flows than try to build inflationaryexpectations into cash flows and then use thenominal discount rate, a far more roundaboutprocedure.)A related question to that of nominal versus realdiscount rates concerns the currency of expectedcash flows. Should we use foreign-currency flowsand discount these at the foreign-currency discountrate, or convert foreign-currency cash flowsinto domestic currency, and then discount atthe domestic-currency discount rate? Again, theanswer is that it does not matter which method weuse provided everything is done consistently. Thatis, if cash flows are measured in foreign currencywe use the foreign-currency discount rate, and ifcash flows are measured in domestic currency weuse the domestic-currency discount rate. Similarly,if we use real cash flows, in terms of either currency,we should use the real discount rate, in thesame currency. These conclusions are not obvious,and are explained in Appendix B. The appendixalso shows that despite the theoretical equivalenceof methods, when foreign-currency cash flows arepredetermined, or contractual, we do not have achoice between real and nominal discount ratesand between current and future expected exchangerates. Examples of contractual cash flows arerevenues from exports sold at fixed prices anddepreciation allowances based on historical costs.The contractual amounts are fixed in nominal355 &
INTERNATIONAL INVESTMENT AND FINANCINGterms and should therefore be converted intodollars at the expected future exchange rate andthen discounted at the nominal dollar discountrate. Contractual flows do not lend themselvesto simplification through the use of today’s cashflows of foreign exchange at today’s exchangerates. It is for this reason that in the cash flowterm in equation (16.2) we convert foreigncurrencycash flows into US dollars, and thendiscount at the nominal US dollar discount rate.However, as we shall show below, the discountrates for other terms in equation (16.2) takedifferent forms.Discount rates for different itemsNow that the methods for handling inflation withthe discount rate have been stated, we are ready todescribe the nature of the different discount rates inthe APV formula.DR e This should be nominal for contractualcash flows resulting from sales made at fixed futureprices. Since the cash flows are converted intodollars at S t the discount rate should be the nominalrate for the United States. DR e should also be theall-equity rate, reflecting the project’s systematicrisk, including the risk from exchange rates. Whenthe cash flows are noncontractual, we can use a realdiscount rate, today’s actual exchange rate, andinitial-period expected cash flows at today’s prices.This is explained in Appendix B.DR a Since in many countries depreciation isbased on historical costs, the depreciation allowance,DA t , will be contractual, and DR a shouldtherefore be the nominal discount rate. Since wehave written DA t directly in dollar terms, we shoulduse the US rate. The only risk premium should befor the chance that the depreciation allowances willgo unused. If the investor feels very confident thatthe project will yield positive net cash flows, thisrisk is small, and then DR a should be the risklessnominal rate of the United States. This is true evenif the depreciation allowance, DA t , is measured inforeign-currency units, provided we convert theminto US dollars.DR b If the project’s contribution to borrowingcapacity is measured in nominal US dollar terms –and it is very likely that it will be – we shoulddiscount at the US nominal rate. The risk is that thetax shield cannot be used, and if this is consideredsmall, we can use the riskless rate.DR c The value of a concessionary loan dependson the interest rate that would otherwise be paid.If the loan repayments will be nominal foreignexchange amounts, we should use the nominalforeign-currency interest rate that would have beenpaid in the absence of the financing concession.DR d and DR f Tax savings, additional repatriatedincome via transfer prices, and the deferment of taxpayments via reinvestment in low-tax countriescould be estimated at either today’s prices or futureprices. If the estimates of TD t and RFt are at today’sprices and are therefore real, we must use a real rate,and if they are at future (inflated) prices, we mustuse a nominal rate. If the estimates are in US dollars,as they probably will be, we must use a US rate.Since the risk is that of not being able to find techniquesfor making these tax savings and additionalremittances, the appropriate discount rate requires arisk premium. Donald Lessard advises the use of thesame rate used for cash flows, DR e . 13With the nature of the terms in the APV formulacarefully defined and the factors influencingthe discount rates also explained, we are ready toconsider an example of capital budgeting. Weconsider whether Aviva Corporation should build ajeans manufacturing factory in Turkey.AN EXAMPLESuppose that as a result of possible admission ofTurkey into the European Union, and concern thatcompetition from new producers in the Turkishmarket will erode sales and profits of its plants13 See Donald R. Lessard, op. cit.& 356
CAPITAL BUDGETINGcurrently supplying Turkey, Aviva is consideringopening a jeans production facility in Turkey. Theconstruction costs of the plant have been estimatedat TL2 trillion (or TL2,000 billion), where TLrepresents the Turkish lira. At the current exchangerate of approximately 1 million Turkish liras to theUS dollar, the construction cost is equivalent toabout $2 million. Suppose the factory is expected toadd about $1 million to Aviva’s borrowing capacity,this being about half the value of the facility andconsistent with the company’s chosen policy offinancing its overall operations with roughly equalamounts of debt and equity. Because of partialretention of earnings from Aviva’s previouslyestablished sales subsidiary in Turkey, the proposedfactory can be partially financed with TL600 billionheld in the country, which, if it had been remitted,would have faced taxes of TL400 billion in Turkey.Of this amount, a tax credit for the equivalent ofonly TL280 billion would have been received in theUnited States.The current exchange rate between the Turkishlira and the US dollar is TL1,000,000/$, and soS 0 ¼ 0.000001 where S ¼ S(TL/$). The spot rate isexpected to move at the rate given by the relativeinflation rates according to PPP. Turkish inflation isexpected to proceed at 25 percent, while USinflation is expected to be 10 percent.Jeans sales, which will begin when the plant iscompleted after a year, are expected to average50,000 pairs per year. At the beginning of the yearof construction, the jeans have a unit price ofTL20,000,000 (TL20 million) per pair, and this isexpected to rise at the general rate of inflation. Theaverage production cost based on material prices atthe time of construction is TL15,000,000 per pair,and this cost is also expected to keep in line withgeneral Turkish inflation.The Turkish market has previously been suppliedby Aviva’s main plant in the United States, andrecent sales to the Turkish market were 10,000pairs per year. The most recent profit on USmanufacturedjeans has been $5 per pair, and futureprofit is expected to keep pace with general USinflation. However, it is expected that in theabsence of a Turkish factory, Aviva would lose9.1 percent per annum of its Turkish sales to new,local entrants. This is one of the reasons why Avivais considering opening the Turkish plant.The factory is expected to require little in theway of renovation for 10 years. The market value ofthe plant in 10 years is extremely difficult to estimate,and Aviva is confident only in the belief that itwill have some substantial value.Aviva has by great art and ingenuity managed toarrive at an all-equity cost of capital that reflectsthe project’s systematic risk (including country riskthat is not covered by insurance, the deviation ofexchange rates from predicted levels, and so on) of20 percent. This allows for the fact that some of therisk can be diversified by the shareholders and/oravoided by insurance, forward cover, and so on.In return for locating the factory in an area ofheavy unemployment, Aviva will receive fromthe Turkish government TL600 billion of theTL1400 billion it needs in addition to the previouslyblocked funds, at the subsidized rate of 10 percent.The principal is to be repaid in equal installmentsover 10 years. If Aviva had been required to borrowcompetitively in Turkey, it would have faced a35 percent borrowing cost, as opposed to its15 percent borrowing cost in the United States.This is a little above the US riskless rate of12 percent. The remaining TL800 billion that isneeded for construction will be provided as equityby Aviva USA. Income on the project is subject to a25 percent tax in Turkey and a 46 percent tax in theUnited States, and Turkish taxes are fully deductibleagainst US taxes.The US Internal Revenue Service (IRS) will allowAviva to write off one-tenth of the dollar equivalentof the historical construction cost each year over10 years. By using carefully arranged transfer pricesand royalties, Aviva thinks it can reduce taxes bydeferrals by $5,000 in the initial year of operation,and it expects this to hold steady in real terms, but itdoes not expect to be able to remit more incomethan the amount declared.357 &
INTERNATIONAL INVESTMENT AND FINANCINGIn summary and in terms of the notation usedin defining APV in equation (16.2), Aviva faces thefollowing situation.K 0 ¼ TL2;000;000 millionBC 0 ¼ $1;000;000AF 0 ¼ TL600;000 millionðTL600;000 TL400;000Þ million¼ TL400;000 millionS 0 ¼ 0:000001S t ¼ 0:000001ð1 0:12ÞtCFt ¼ TL50;000ð20;000;000 15;000;000Þð1þ0:25Þ t þðscrap value when t ¼ 10ÞLS t ¼ $10;000ð5Þð1þ0:1Þt ð1 0:091Þ t¼ $50;000CL 0 ¼ TL600;000 millionLR t ¼ ðsee Table 16:2ÞDA t ¼ $200;000TD t ¼ $5,000ð1þ0:1Þ t 1 for t > 0RF t ¼ 0t ¼ 0:46DR e ¼ DR d ¼ DR f ¼ 0:20DR a ¼ DR b ¼ 0:12DR c ¼ 0:35r g ¼ 0:15We will solve the problem by using all nominalvalues for cash flows and all nominal discount rates.Many of the values attached to the terms ofthe APV formula are self-evident. For example, theconstruction cost is TL2,000,000 million andthe borrowing capacity that the plant contributesis $1,000,000. The value of activated funds, AF 0 ,is their face value minus their value in their nextbest use. If the next best use is to bring themhome and face taxes, the next best value isTL600,000 million TL400,000 million. Weexclude the tax credit in the United States on repatriatedfunds because it is smaller than the taxes paid& 358in Turkey; thus the effective tax rate is the Turkishrate.(Ifthecreditcannotbeappliedagainstotherincome, it has no value.) This means that if theblocked funds had been brought back, TL200,000million would have been received after taxes. Wesubtract this from the TL600,000 million that can beused in the project to find TL400,000 million for AF 0 .The expected exchange rates are obtained fromthe definition S t ¼ S 0 (1 þ _S ) t . We obtain _S fromthe PPP condition; that is,_P TK_S ¼ _S P¼ _ US1 þ _P TK¼ 0:12¼0:10 0:251:25The expected cash flow, CFt , is obtained bymultiplying the expected sales of 50,000 pairs ofjeans per annum by the expected profit per pair.The profit per pair during the plant constructionyear, when prices and costs are known, wouldbe TL20,000,000 TL15,000,000 if productioncould begin immediately, but by the initial yearof operation the profit per pair is expected to riseto (TL20,000,000 TL15,000,000)(1 þ 0.25).The profit is expected to continue to rise at25 percent per annum, with an expected cash flowby year t of(TL20;000;000TL15,000,000Þð1 þ 0:25Þ tfrom each of the 50,000 pairs. The value of this isshown in Table 16.2. The present value of the cashflow at Aviva’s chosen cost of capital of DR e ¼ 0.20is also shown.The scrap value of the project is uncertain. As aresult, we can take a two-step approach to seewhether the project is profitable without estimatinga scrap value, since if it is profitable withoutincluding the scrap value, it is a fortiori profitablewith some scrap value.Sales from the US plant that will be lost due tothe project, LS t , have most recently been producinga profit for Aviva USA of $5 10,000 ¼ $50,000per year. With the profit per unit expected to growat the US inflation rate of 10 percent and the
CAPITAL BUDGETING& Table 16.2 Adjusted-present-value elements for Turkish jeans factoryYear S t CFt S t CF t S t CF t LS t (1 t) S t CF t LS t DA t t(0.000001) (million)(1 þ DR e ) t (1 þ DR a ) t1 $0.8800/TL TL312,500 $275,000 $225,000 $101,250 $82,1432 0.7744 390,625 302,500 252,500 94,688 73,3423 0.6815 488,281 332,764 282,764 88,364 65,4844 0.5997 610,351 366,028 316,028 82,299 62,2035 0.5277 762,939 402,603 352,603 76,520 48,4686 0.4644 953,674 442,886 392,886 71,051 46,6107 0.4087 1,192,092 487,208 437,208 65,889 41,6168 0.3596 1,490,116 535,846 485,846 61,016 37,1579 0.3165 1,862,645 589,527 539,527 56,465 33,17610 0.2785 2,328,306 648,433 598,433 52,191 29,622749,733 519,821Yearr g BC 0 tr g BC 0 t(1 þ DR b )TD tTD t(1 þ DR d ) t Loan balanceTL millionLoan interestTL millionLR tTL millionLR t(1 þ DR c ) tTL million1 $69,000 $61,607 $5,000 $4,167 600,000 60,000 120,000 88,8892 69,000 55,007 5,500 3,819 540,000 54,000 114,000 62,5513 69,000 49,113 6,050 3,501 480,000 48,000 108,000 43,8964 69,000 43,851 6,655 3,209 420,000 42,000 102,000 30,7095 69,000 39,153 7,321 2,942 360,000 36,000 96,000 21,4096 69,000 34,957 8,053 2,697 300,000 30,000 90,000 14,8687 69,000 31,212 8,858 2,472 240,000 24,000 84,000 10,2798 69,000 27,868 9,744 2,266 180,000 18,000 78,000 7,0709 69,000 24,882 10,718 2,077 120,000 12,000 72,000 4,83410 69,000 22,216 11,790 1,904 60,000 6,000 66,000 3,283389,866 29,054 287,788number of units expected to decline by 9.1 percent,expected profits from replaced sales remain at theircurrent level of $50,000 per year; the product of1.10 and (1 0.091) equals unity.The amount of the concessionary loan isCL 0 ¼ TL600,000 million. The repayments of principalare TL60,000 million each year, with interestcomputed on the unpaid balance at 10 percent perannum. LR t in Table 16.2 shows the annual loanrepayments discounted at the market rate in Turkeyof DR c ¼ 0.35. The table also gives the values of thediscounted net-of-tax depreciation allowances of$200,000 per year. This is 10 percent of the historicalcost in dollars, S 0 K 0 . We use the dollar costbecause the depreciation is effectively against UScorporate taxes. These are at the rate t ¼ 0.46. Wehave discounted depreciation allowances at theriskless dollar rate, DR a ¼ 0.12. Use of the risklessrate presumes there will be sufficient income to beable to use the depreciation allowances.The debt or borrowing capacity of the project issuch that Aviva can borrow $1,000,000 (which ishalf the dollar cost of construction) to obtain taxshields somewhere within its operations. The359 &
INTERNATIONAL INVESTMENT AND FINANCINGinterest rate Aviva would pay if it took the taxshields by borrowing more at home is r g ¼ 0.15.This will save taxes on 0.15 $1,000,000 at the taxrate t ¼ 0.46. We have discounted the saving fromthe tax shield at the riskless dollar rate, DR b ¼ 0.12.As with the depreciation allowance, this presumesenough income to enjoy the tax shield.The extra tax benefits, TD t , of $5,000 areassumed to keep pace with US inflation. We havediscounted TD t ¼ $5,000 at Aviva’s cost of equityof 20 percent.We can form an opinion concerning the feasibilityof the jeans factory if we use the values ofthe terms as we have stated them, including thetotals from Table 16.2, in the APV formula,equation (16.2).APV ¼ ð0:000001 2,000,000 millionÞþð0:000001 4,000,000 millionÞþ 749,733 þ 519,821 þ 389,866þ 0:000001 ð600,000 million287,788 millionÞþ29,054 þ 0¼ $400,686We discover that the APV is positive. This meansthat the project is worthwhile. Furthermore, theAPV does not yet include any estimate for themarket value of the factory and land at the end of10 years. If Aviva feels that while it cannot estimatethis value, it should exceed half the original cost inreal terms, it can take an even more confidentposition. Half the original project cost is $1 million,and since this is a real value, it should be discountedat the real interest rate relevant for dollars.Using Aviva’s risky rate, this is DR e minus the USexpected inflation rate of 10 percent; that is,DR e ¼ 0.20 0.10 ¼ 0.10. At this rate the presentvalue of $1 million in 10 years is $385,543, whichmakes the APV clearly positive. The $385,543would be subject to a capital-gain tax if it were to berealized because the entire project has beendepreciated, but even after taxes the project wouldclearly seem to be worthwhile.& 360ACTUAL PRACTICE OF CAPITALBUDGETINGThe adjusted-present-value approach using thecorrect discount rate to reflect the contractual ornon-contractual nature of cash flows and the systematicrisk of the investment project requiresmanagement to take a very scientific view. We canexpect that constraints on the knowledge of managersand the time available to make decisions willresult in approaches that are often more pragmatic –perhaps a simple ‘‘rule-of-thumb’’ – than theapproach we presented. According to a survey ofmultinational corporations this appears to be thecase. The survey was made of 10 US multinationalsby Business <strong>International</strong> to see how they analyzeacquisitions. 14 It showed that only 7 of the 10 corporationsused any sort of discounting method at all.Only one of the respondents in the Business<strong>International</strong> survey said that it looked at synergyeffects, that is, the effects the acquisition wouldhave on other subsidiaries measured by our LS tterm. Five of the 10 firms used the same hurdlediscount rate for all acquisitions, whatever thecountry. Projected exchange rates were used by fiveof the respondents, while two used the projectedrate if they considered a currency to be unstable andthe current rate if they considered it to be stable.The remainder used current rates to convert allcurrency flows, but it was not clear from the surveywhether these flows were measured in current priceterms. At least one company assumed thatexchange-rate movements would be reflected inrelative interest rates and therefore used the USinterest rate on cash flows converted into dollars atthe current exchange rate.A survey of the foreign-investment evaluationpractices of 225 US manufacturing MNCs conductedby Marie Wicks Kelly and George Philippatos14 See ‘‘BIMR Survey Reveals How U.S. MultinationalsAnalyze Foreign Acquisitions,’’ Money Report, Business<strong>International</strong>, November 28, 1980. See also ‘‘Stress onCurrency Fluctuations as MNCs Analyze ForeignAcquisitions,’’ Money Report, Business <strong>International</strong>,November 5, 1980.
CAPITAL BUDGETINGproduced results revealing practices somewhatmore in line with theory than those found in themuch smaller Business <strong>International</strong> survey. 15 Forexample, the majority of companies used cashflow calculations and costs of capital which,while not exactly the kind explained in thischapter, are approximately in line with appropriateprocedures.SUMMARY1 The net-present-value, NPV, technique is difficult to use in the case of foreign investmentprojects. The adjusted-present-value, APV, technique is frequently recommendedinstead.2 Foreign investment projects should be evaluated from the parent company’s perspective.Factors which must be considered include blocked funds (which reduce effectiveproject costs to investors), reduced sales from other corporate divisions, restrictions onremitting earnings, extra taxes on repatriated income, and concessionary loans.These factors can be included in the adjusted present value. The APV approach can alsoinclude the benefit of concessionary finance, effects on the borrowing capacity of thecompany, and so on.3 The APV technique allows a two-step evaluation. The first step involves a conservativeestimate that includes only benefits of the project that are legitimate and for which thereare reasonable estimates. The second step, including other benefits which may not belegitimate or well measured, is needed only if the first step gives a negative estimate.4 Each item in the APV calculation must be discounted at an appropriate discount rate.With the benefits of the debt shield included in a separate term, the discount rates areall-equity rates for a similar amount of risk.5 Discount rates should reflect only the systematic risk of the item being discounted. Doingbusiness abroad can help reduce overall corporate risk when incomes are moreindependent between countries than between operations within a particular country, andthis can mean lower discount rates for foreign projects.6 Discount rates can, however, be higher on foreign investment projects than domesticprojects because of country risk and currency risk. These risks can be diversified byshareholders if they invest in a number of countries/currencies, and this reduces requiredrisk premiums.7 We must be consistent in foreign-project evaluations. We can use domestic or foreigncurrency as long as we use the corresponding discount rates, and we can use real values ofcash flows if we use real interest rates, or nominal cash flows if we use nominal interestrates.8 When we are dealing with noncontractual flows, we can choose the method of handlinginflation that we prefer. However, with contractual flows, which are nominal amounts,we must use nominal discount rates. The choice of approach with noncontractual flowsexists because inflation in cash flows will be offset by movements in exchange rates.15 Marie E. Wicks Kelly and George C. Philippatos, ‘‘Comparative Analysis of the Foreign Investment Evaluation Practices byU.S.-Based Manufacturing Multinational Companies,’’ Journal of <strong>International</strong> Business Studies, Winter 1982, pp. 19–42.361 &
INTERNATIONAL INVESTMENT AND FINANCINGREVIEW QUESTIONS1 It what ways can the view of a foreign investment project differ according to whether it isviewed from the perspective of the investor, or from the perspective of a project managerin the country where investment occurs?2 Which of the two perspectives in Question 1 is the correct perspective for judging foreigndirect investments?3 What does concessionary lending imply for the cost of capital of a corporationenjoying the favorable terms, versus the opportunity cost of capital to shareholders?4 If blocked, or not fully repatriable, funds can be liberated by a new foreign project,how can the value of these funds to the investor be factored into a project’s APV?5 What is meant by ‘‘borrowing capacity’’ or ‘‘debt capacity,’’ and how is the tax shieldfrom this incorporated into a project’s APV?6 How do the levels of corporate tax rates influence whether an investor’shome-country rate or the rate in the country of investment is used for calculatingafter-tax cash flows?7 What amount of risk, total or only systematic, should be included in the all-equitydiscount rate used in the APV calculation?8 What is the nature of the discount rate that is used for cash flows in the APV approach?9 If cash flows are converted into the investor’s domestic currency, and are adjusted forinflation so they are real, what discount rate should be used?10 What is a ‘‘contractual’’ cash flow?11 In what way is the handling of contractual foreign-currency cash flows different from thehandling of noncontractual foreign-currency cash flows?12 What discount rate should be used for calculating the current value of interestpayments on a concessionary loan, where the payments are in terms of the foreign currency?ASSIGNMENT PROBLEMS1 Will withholding taxes that are at rates below domestic corporate tax rates affectdirect investment when full withholding tax credit is available? How will withholding taxrates affect the distribution of total tax revenues between countries?2 A US automobile manufacturer, National Motors, is considering building anew plant in Britain to produce its sports car, the Sting. The estimated construction costof the plant is £50,000,000, and construction should be completed in a year.The plant will raise borrowing capacity by about $40,000,000. National Motors canreinvest £20,000,000 already held in Britain. If these funds were repatriatedto the United States, they would face an effective tax rate of 46 percent. Inflation inBritain is expected to be at 15 percent; in the United States, at 10 percent.The current exchange rate is S($/£) ¼ 2.00, and it is believed that PPP will hold onaverage over the relevant time frame.National Motors expects to sell the Sting with only minor modifications for5 years, and after this period the plant will require remodeling. The value of the plant for& 362
CAPITAL BUDGETINGfuture use is expected to be £40,000,000 in nominal terms after 5 years. The Stingwill have an initial sticker price of about £8,000, and it is expected that 10,000 willbe sold each year. Production costs are estimated at £6,000. These values areexpected to move in line with the general price level in Britain.National Motors also builds a two-seater car in Germany called the Racer andexpects 4,000 Racers to be replaced by the Sting. Since Racers are in short supply,2,000 of the 4,000 Racers can be sold in Japan at the same profit as in Germany.The expected before-tax profit on the Racer during the initial year of producingthe Sting is ¤2,500 per car, with S(¤/£) ¼ 2.00. This is expected to keep in linewith German inflation, and PPP is expected to prevail over the relevant time framebetween Britain and Germany.Because National Motors will be building the Sting in Merseyside, an area of heavyunemployment, the British government has offered the company a loan of £20,000,000at a 10 percent interest rate. The principal is to be repaid in five equal annualinstallments, with the first installment due at the beginning of the initial year ofproduction. The competitive market rate in Britain is 20 percent, while in the UnitedStates, National Motors faces a borrowing rate of 12 percent and the riskless rate is10 percent. The balance of the capital will be provided as equity. The tax rate in Britainis 50 percent, which is higher than the 46 percent rate in the United States. British taxlaw allows car plants to be depreciated over 5 years.The British and US tax authorities are careful that appropriate transfer pricesare used so that no taxes can by saved by using inter-company pricing techniques.National Motors believes a 20 percent discount rate is appropriate for the project.Should the Sting be built?3 Which items in the previous question are contractual and which are noncontractual?Could you discount the cash flows with a real rate of interest?4 Compare the treatments of tax shields from debt in using the NPV and APV approachesto foreign investments.5 How would you allow for lost income due to displaced sales from a subsidiary located inanother foreign country, rather than from domestic, parent operations? Consider bothexchange rate and tax problems.6 How would you include depreciation allowances in the calculation of adjusted presentvalue when the effective corporate income tax is that of the foreign country in which aninvestment is located? Consider both the exchange-rate issue, and the appropriatediscount rate.BIBLIOGRAPHYAdler, Michael, ‘‘The Cost of Capital and Valuation of a Two-Country Firm,’’ Journal of <strong>Finance</strong>, March 1974,pp. 119–32.Booth, Lawrence D., ‘‘Capital Budgeting Frameworks for the Multinational Corporation,’’ Journal of <strong>International</strong>Business Studies, Fall 1982, pp. 113–23.363 &
INTERNATIONAL INVESTMENT AND FINANCINGDinwiddy, Caroline and Francis Teal, ‘‘Project Appraisal Procedures and the Evaluation of Foreign Exchange,’’Economics, February 1986, pp. 97–107.Dotan, Amihud and Arie Ovadia, ‘‘A Capital-Budgeting Decision – The Case of a Multinational CorporationOperating in High-Inflation Countries,’’ Journal of Business Research, October 1986, pp. 403–10.Eaker, Mark R., ‘‘Investment/Financing Decisions for Multinational Corporations,’’ in Dennis E. Logue (ed.),Handbook of Modern <strong>Finance</strong>, Warren, Gorham and Lamont, Boston, MA, 1984, pp. 42-1–42-29.Hodder, James E., ‘‘Evaluation of Manufacturing Investments: A Comparison of U.S. and Japanese Practices,’’Financial Management, Spring 1986, pp. 17–24.Lessard, Donald R., ‘‘Evaluating <strong>International</strong> Projects: An Adjusted Present Value Approach,’’ in Donald Lessard(ed.), <strong>International</strong> Financial Management: Theory and Application, 2nd edn, John Wiley & Sons , New York,1985.Shapiro, Alan C., ‘‘Capital Budgeting for the Multinational Corporation,’’ Financial Management, Spring 1978,pp. 7–16.Stonehill, Arthur I. and Leonard Nathanson, ‘‘Capital Budgeting and the Multinational Corporation,’’ CaliforniaManagement Review, Summer 1968, pp. 39–54.APPENDIX AA survey of international taxation<strong>International</strong> taxation is a complex subject, and we can do little more here than explain variations in the types oftaxes encountered and the methods that can be used to help reduce them. We will view taxation questions in the mostgeneral terms, recognizing that even generalities about tax are subject to unpredictable change.THE DIFFERENT FORMS OF TAXESCorporate taxesIncome taxes are the chief source of revenue for the US government, and the corporate income tax is an importantalthough declining component of the total of income taxes. Income taxes are direct taxes, and the United States isdependent on direct taxes for a greater proportion of its total revenue than most other countries. Members of theEuropean Union collect direct taxes, but these are augmented by a value-added tax,orVAT, which is an indirecttax. 16 Sales taxes in US states have crept up over the years. Many poorer countries have a tax on imports as theirprimary revenue source. Other taxes that are found are based on wealth, inheritance, sales, turnover, employees,and so on.Table 16A.1 shows that standard corporate tax rates are on average around 30 percent, although they varysubstantially between countries. Variations in allowable deductions in determining income subject to tax vary fromcountry to country, and can make effective rates differ even more than the standard rates imply. However, to the extentthat high-tax rate countries have more generous allowances for deductions, the effective rate variations can bediminished. Outside the industrialized countries some nations charge no corporate tax at all. Countries with zero rates16 By definition, direct taxes cannot be shifted and are borne directly by those on whom they are levied. In contrast, indirect taxescan be shifted in part or in full to somebody who is not directly taxed. For example, corporate and personal income taxes arepaid by those on whom they are levied. On the other hand, sales taxes and import duties charged to firms are at least in part paidby consumers. The consumer therefore pays indirectly.& 364
CAPITAL BUDGETING& Table 16A.1 Corporate income tax rates,2003 (Percentages)Australia 30Canada 37Denmark 30Finland 29France 34Germany 40Hong Kong 17Ireland 13Italy 38Japan 42Netherlands 35New Zealand 33Singapore 22Sweden 28United Kingdom 30United States 40NoteRates are principal corporate levels, rounded to thenearest percent.Source: KPMG’s Corporate Tax Rate Survey –January 2003.include the Bahamas and Bermuda. The absence of corporation taxes is designed to encourage multinationals to locateoffices for sheltering income and thereby gain rental and employment income as well as registration and other fees.The United States considers that it has jurisdiction over all the income of its citizens and residents wherever it isearned. However, credit is given for taxes paid elsewhere as long as the credit does not cause taxes to fall below whatwould have been paid had the income been earned in the United States. 17 While citizens and residents of the UnitedStates are taxed on their full income wherever it is earned, nonresidents are taxed only on their income in theUnited States. This is the practice in other countries. The resident versus nonresident status of a corporation isdetermined by where it is incorporated, with some departures from this principle as explained in the followingparagraphs.Some countries that appear to have low national corporate tax rates have more normal rates when localcorporate taxes are added. For example, while Switzerland has federal corporate rates below 10 percent, the localauthorities, called cantons, have tax rates of between 10 and 30 percent. Different provincial rates in Canada canmake rates vary more than 5 percent. Further variation and complication are introduced by the fact that somenational tax authorities give full credit for local taxes, while others do not. In addition, as mentioned earlier, there isconsiderable variation between countries according to what expenditures are deductible in determining taxableincome. Capital cost allowances on expenses such as computers and research and development also vary fromcountry to country, with some countries using rapid write-offs as a stimulus to investment.17 Since the Tax Reform Act of 1986, US-based multinationals have been subject to a minimum corporate tax rate. For the natureof this minimum tax and its consequences, see Andrew Lyon and Gerald Silverstein, ‘‘The Alternative Minimum Tax and theBehavior of Multinational Corporations,’’ National Bureau of Economic Research, Paper No. 4783, 1994.365 &
INTERNATIONAL INVESTMENT AND FINANCINGValue-added tax (VAT)A value-added tax is similar to a sales tax, but each seller can deduct the taxes paid at previous stages of productionand distribution. If, for example, the VAT rate is 25 percent and a company cuts trees and sells $100 worth of woodto a furniture manufacturer, the tax is $25, since there are no previous stages of production. If the wood is made intofurniture that is sold for $240, the furniture manufacturer must pay $60 (25 percent of $240) minus the alreadycollected VAT. Since the wood producer paid $25, the VAT of the furniture manufacturer is $35. Since the eventualeffect is the collection of 25 percent of the final selling price, the VAT is like a sales tax that is collected on the valueadded to a product at each stage of production, distribution, and sale, rather than only at the final retail stage. 18Because each payer receives credit for taxes paid at previous stages of production, there is an incentive to collectcomplete tax records from suppliers. This reduces tax evasion but can give rise to complaints about burdensome,costly paperwork. The value-added tax has partially replaced income taxes on individuals in the European Union.It has been promoted because it is a tax on spending and not on income. Taxes on income are a disincentive to workand invest, while taxes on spending can be considered a disincentive to spend, that is, an incentive to save. Anotheradvantage of VAT to countries promoting exports is that the rules of the World Trade Organization allow rebates ofVAT to exporters, while a potential drawback is that VAT can artificially distort patterns of output when applied atdifferential rates to different products.Import dutiesBefore income tax and value-added tax became primary sources of government revenue, import duties or tariffs(two terms for the same thing) were major sources of fiscal receipts. 19 Since goods entering a country are shipped tospecific ports where policing can be intensive, import duties are a good source of revenue when income or salesrecords are poor. This partly explains why some underdeveloped countries depend heavily on tariffs. Also, tariffscan explain why an automobile or refrigerator can cost five times more in some countries than in others. Becausetariffs can be levied more heavily on luxuries than on necessities, they do not have to be regressive. 20Tariffs explain why some firms move production facilities abroad. For example, if automobiles made in theUnited States and sold in Europe face a tariff and this can be avoided if the vehicles are produced in Europe,a European plant may be opened. Tariffs are used to protect jobs that are believed to be threatened by cheap foreignimports. For example, if sales of imported footwear or automobiles increase while domestically produced goodsface sluggish sales, there may be lobbying to impose tariffs or quantitative restrictions (quotas) on imports. Tariffstend to distort the pattern of international trade because countries may produce goods and services for which theydo not have a comparative advantage, but on which they can make profits behind protective trade barriers. Dutieshave been imposed by the US government in the form of countervailing tariffs when it was believed that foreigncompetitors were dumping (selling at lower prices abroad than at home) or receiving ‘‘unfair’’ export help fromtheir governments.Withholding taxesWithholding taxes are collected from foreign individuals or corporations on income they have received from sourceswithin a country. For example, if a US resident earns dividends in Canada, taxes are withheld by the Canadian18 For more on VAT, see Value Added Tax, Price Waterhouse, New York, November 1979.19 Tariffs are also called excise taxes. They can be based on value (ad valorem) or on the weight of imports.20 With a regressive tax, the poor pay a larger fraction of their income or spending than do the rich. A tax can be regressive even ifthe rich pay a larger absolute amount.& 366
CAPITAL BUDGETINGcorporation and paid to the Canada Revenue Agency. Credit is generally received on taxes withheld, and so the levelof the withholding tax rate primarily affects the amount of taxes received by the respective tax authorities. Forexample, if the US resident has 15 percent withheld in Canada and is in a 25-percent tax bracket in the UnitedStates, the US tax payable will be reduced to 10 percent of the income after credit for the 15 percent is given.Higher withholding rates therefore generally mean that more is collected by the foreign authorities where theincome is being earned.There are some circumstances in which the level of withholding does matter. Clearly, if the rate of withholdingexceeds the effective tax rate at home, full credit may not be obtained. This can happen even if the tax rate at homeis higher than the withholding rate if the definition of income or eligible deductions differs between the countries.For example, if little depreciation is deductible in the foreign country but generous allowances exist at home,the taxable income may differ, and more taxes may be paid abroad than are payable at home even if the foreignrate is lower. In the United States there is an overall limitation on credit for taxes withheld that equals taxespayable in the United States, but when tax returns for a number of countries are combined in a consolidated taxreturn, full credit may be obtained even when on an individual-country basis there would have been unusedwithholding tax credit. 21Branch versus subsidiary taxesAn important element in corporate tax planning is deciding whether to operate abroad with a branch or asubsidiary. A branch is a foreign operation that is incorporated at home, while a subsidiary is incorporatedin the foreign country.If a foreign activity is not expected to be profitable for a number of years, there may be an advantage to startingout with a branch so that negative earnings abroad can be used to offset profits at home in a consolidated tax return.US tax laws and the tax laws of a number of other countries allow branch income to be consolidated. 22 If a companyexpects positive foreign income and this income is not to be repatriated, there may be an advantage to operate as asubsidiary. Foreign branches pay taxes on income as it is earned, while subsidiaries do not pay US taxes until theincome is repatriated. Whether this is sufficient reason to form an overseas subsidiary depends on relative tax ratesand on whether the company wishes to repatriate earnings. 23ORGANIZATIONAL STRUCTURES FOR REDUCING TAXESThe foreign-sales corporation (FSC)The foreign-sales corporation (FSC) is a device for encouraging US export sales by giving a tax break on thegenerated profits. The possibility of establishing a foreign-sales corporation was part of the Tax Reform Act of1984 Prior to this Act, the US Internal Revenue Service (IRS) offered tax breaks to exporters via the operation ofdomestic international-sales corporations (DISCs). While some DISCs still exist, the FSC has effectivelyreplaced the DISC as the preferred tax-saving vehicle of exporters.21 When high levels of withholding are combined with low levels, the unused credit on the low levels of withholding is utilized bythe high levels of withholding within the combined tax return. Even if the combined return does not provide full credit, in theUnited States unused credit can be carried back 2 years or forward 5 years.22 Companies can opt for a country-specific or global basis of filing, with the choice being binding for an indefinite time.23 Withholding tax credits and the taxation of subsidiary income only when it is repatriated have both contributed to FDI of USfirms, according to Alan Auerbach and Kevin Hassett in ‘‘Taxation and Foreign Direct Investment in the United States:A Reconsideration of the Evidence,’’ National Bureau of Economic Research, Paper No. 3895, 1992.367 &
INTERNATIONAL INVESTMENT AND FINANCINGThe main advantage offered by an FSC is that the goods or services ‘‘bought’’ by the FSC for subsequent sale donot have to be priced at arm’s length, that is, at proper market value. Rather the FSC can use an artificial oradministered price to increase its own profit and consequently reduce the profit and tax of the firm producing the USgoods or services for export. For example, if Aviva were to establish an FSC, Aviva itself could ‘‘sell’’ its jeans to itsFSC for a below-market price. Aviva’s FSC could then sell the jeans abroad. Only a portion of Aviva’s FSC’s incomeis then subject to tax, and Aviva’s own taxable income is reduced. That is, there is a shifting of income by using theartificially low prices, from Aviva to its FSC. The tax paid by the FSC is less than the tax saving of Aviva.There are, however, some limitations on the administrative prices and the portion of an FSC’s income whichescapes tax, as well as in the structure of an FSC. Some of the more important of the limitations and requirementsare as follows.1 An FSC must have its office in a possession of the United States or in a country with a tax information exchangeprogram with the IRS. 24 This is to ensure the FSC is an ‘‘offshore’’ corporation.2 Tax and accounting information must nevertheless be available at a location in the United States.3 At least one director must not be a US resident. This is also to ensure the FSC is ‘‘foreign.’’4 An FSC may not coexist with a DISC that is controlled by the same corporation(s). An FSC may serve morethan one corporation, but must have fewer than 25 shareholders.5 Qualifying income is generated from the sale of US ‘‘property,’’ which essentially means goods or servicesproduced or grown in the United States, including leasing, rental property, and management services unrelatedto the FSC.6 The prices ‘‘paid’’ by the FSC to the producer can be set so that the FSC’s income is the largest of the followingthree amounts:a 1.83 percent of the FSC’s revenue.b 23 percent of the combined taxable income of the FSC and related suppliers associated with the exporttransactions.c The FSC’s income that would occur using arm’s-length pricing. (The effect of this is that the worst thatcould happen is that the FSC’s income would be as if the goods were priced at arm’s length. However, ingeneral the FSC can enjoy higher profits than this. These profits are taxed more favorably than if theprofits had been made by the US producer.)7 Only part of the FSC’s income is taxed. If pricing is at arm’s length, all the FSC’s income is called foreign-tradeincome, and 30 percent of this is exempt from tax. If one of the two alternative administrative pricing rules isused, foreign-trade income involves adding the FSC’s operating expenses to the taxable income – excluding thecost of goods sold – and 15=23, or approximately 62.22 percent, of this is exempt. This can be veryadvantageous if expenses are low.8 Domestic corporate shareholders of the FSC receive a 100 percent deduction on dividends received whendisbursements occur, except for the taxable component of income under arm’s-length pricing. 2580–20 subsidiariesIf 80 percent or more of a corporation’s income is earned abroad, dividends and interest paid by the corporation areconsidered foreign-source income by the US IRS. An 80–20 subsidiary is formed to raise capital for the parent,24 The US possessions are Guam, American Samoa, the US Virgin Islands, and the Mariana Islands.25 The alternative minimum tax provisions of the 1986 Tax Reform Act changed the incentives and structure of taxes fromestablishing an FSC. It should be noted that very frequent and often complicated changes of tax regulations make any summaryof taxation, especially international taxation, difficult to keep current. The summary in this appendix is simply to describe howinternational taxation has been structured.& 368
CAPITAL BUDGETINGsince it is considered foreign by the IRS and therefore does not need to deduct withholding taxes. Payments made to80–20 corporations may well be taxed by foreign governments, but when the income is consolidated, credit will beobtained for taxes already paid. If an 80–20 corporation is incorporated in the Netherlands Antilles or in anothercountry with a treaty with the United States permitting no withholding taxes, then when interest is paid by the USparent to the 80–20 subsidiary, the parent can also avoid having taxes withheld. This means that a company canavoid withholding taxes completely by having an 80–20 corporation in a treaty country. However, after the passageof the Deficit Reduction Act of 1984, which removed the need for US corporations to withhold tax on incomes paidto foreigners, the need for 80–20 subsidiaries was reduced.Internal pricingA corporation can save taxes if it is able to shift profits from high-tax countries to low-tax countries by, for example,charging a relatively high price for internally transferred items when they move from a low-tax country to a high-taxcountry. This raises income in the low-tax country and lowers it in the high-tax country. However, the potential forUS corporations to do this is reduced by an important section of the US Internal Revenue Code. Section 482 allowsthe Treasury to reallocate income and/or expenses to prevent evasion of taxes within commonly owned entities.The IRS requires internal prices to be as if they had been determined competitively. Of course, this does not applyto FSCs.Tax havensSome countries charge extremely low corporate taxes to encourage corporations to locate within their jurisdiction,bring jobs, and so on. 26 The jurisdictions are called tax havens. 27 These countries include the Bahamas, Bermuda,Cayman Islands, and Grenada, and they are all endowed with delightful climates. The ability of US corporations totake full advantage of tax havens is limited by Section 882 of the US Tax Code. This says that foreign corporationsdoing business in the United States are taxed at US rates. There is therefore no advantage to locating the corporateheadquarters in the tax haven for doing business at home.APPENDIX BInflation and the choice of discount ratesWe will concentrate on the expected-cash-flow term of equation (16.2), but our conclusions are valid for any term inthe APV formula. The cash-flow term isX Tt¼1S t CF t ð1 tÞð1 þ DR e Þ t26 ‘‘Tax rate competition’’ has led to political disputes when one nation is seen as using ‘‘beggar-thy-neighbor policy’’ to enjoyeconomic expansion at other countries’ expense. For example, the low corporate tax rates of Ireland have caused partners inthe European Union to accuse Ireland of profiting at the expense of other EU members. This is a version of the so-called ‘‘LafferCurve’’ in which more tax revenue is raised at lower tax rates. In this case it is not by extra work and investment by fellowcitizens. Rather, it involves drawing activity from other countries.27 A student of the author inadvertently called these ‘‘tax heavens,’’ an apt term for those who manage to end up there.369 &
INTERNATIONAL INVESTMENT AND FINANCINGThe numerator of this expression consists of the expected cash flow in the foreign currency, CFt , converted intoUS dollars at the expected spot exchange rate, S t . This is put on an after-tax basis by multiplying by (1t). Whatwe show in this appendix is that as an alternative to using the nominal foreign-currency cash flow converted intodollars, and then using the nominal dollar discount rate, we can use a simpler alternative: we can use the real initialperioddollar cash flow and discount this at the real dollar discount rate. However, we shall also show that this doesnot work for contractual cash flows.The exact form of the link between nominal and real interest rates, known as the Fisher equation, can bewritten asð1 þ r US Þ t ¼ ð1 þ DR eÞ tð1 þ _P US Þtorð1 þ DR e Þ t ¼ð1 þ r US Þ t ð1 þ _P US Þtð16B:1ÞHere, r US is the real US discount rate, DR e is the nominal US discount rate, and _P US is the expected US inflationrate. What the Fisher equation does is define the real discount rate as the nominal rate deflated by the expectedinflation rate. We have selected the all-equity US dollar nominal discount rate, DR e , because that is the one ofparticular concern. Consequently, r US is the all-equity real US dollar discount rate.If we think that exchange rates will be changing at a steady forecast rate of _S t we can writeS t ¼ S 0ð1 þ _S t Þt ¼ 1, 2, ...,TIf, in addition, we believe that cash flows in the foreign currency will grow at the foreign rate of inflation, we can writeCF t ¼ CF 1 ð1 þ _P UK Þtt ¼ 1, 2, ...,Twhere _P UK is the annual rate of inflation and CF 1 is the initial cash flow, which we assume is unknown. Using this,our definition of S t and the Fisher equation in equation (16B.l), we haveX Tt¼1S t CF t ð1 tÞ CF1ð1 þ DR e Þ t ¼ S 01 þ _P UKX Tt¼1ð1 þ _S Þ t ð1 þ _P UK Þt ð1ð1 þ r US Þ t ð1 þ _P US ÞttÞð16B:2ÞThe magnitudes S 0 and CF1 /(1 þ _P UK ) have been placed in front of the summation because they do not dependon t. 28 We can reduce equation (16B.2) to a straightforward expression if we invoke the purchasing-power-parity(PPP) condition.We have been writing the precise form of PPP as_P US ¼ _P UK þ _Sð1 þ _P UK Þ28 We remove CF1 /(1 þ _P UK ) rather than just CF 1 because we wish to have all expressions in the summation raised to thepower t. The interpretation of CF1 /(1 þ _P UK ) is that it is the value of the initial foreign cash flow at today’s prices.& 370
CAPITAL BUDGETINGIf the best forecast we can make is that PPP will hold – even though we know that in retrospect we could well bewrong – we can write PPP in the expectations form._P US ¼ _P UK þ _S ð1 þ _P UK ÞBy adding unity to both sides, we getor1 þ _P US ¼ð1 þ _P UK Þþ _S ð1 þ _P UK Þ¼ð1 þ _P UK Þð1 þ _S Þð1 þ _S Þð1 þ _P UK Þð1 þ _P US Þ ¼ 1By using this in equation (16B.2), we can write the APV cash-flow term in equation (16B.2) in the straightforwardformX Tt¼1S t CF t ð1 tÞ CFt ð1 tÞð1 þ DR e Þ t ¼ S 01 þ _P UKX Tt¼11ð1 þ r US Þ tð16B:3ÞIn the special case of a perpetual expected cash flow so that T ¼1; equation (16B.3) becomesX Tt¼1S t CF t ð1 tÞ CF1 ð1 tÞð1 þ DR e Þ t ¼ S 0r US ð1 þ _P UK Þð16B:4ÞAll we need to know to evaluate (16B.3) or (16B.4) is the initial exchange rate S 0 , the initial cash flow at today’sprices, CF 1 /(1 þ _P UK ) the tax rate, t; and the real discount rate that reflects the systematic risk, r US. There is noneed to forecast future exchange rates and foreign-currency cash flows. In reaching this conclusion, we assumedonly that cash flows can be expected to grow at the overall rate of inflation, that PPP can be expected to hold – thatis, hold on average – and that the Fisher equation does hold. Any noncontractual term can be handled in thisstraightforward way which avoids the need to forecast inflation and exchange rates at which to convert theforeign-currency amounts. Our conclusion is based on the view that inflation and changes in exchange ratesare offsetting – requiring PPP – and that local inflation in cash flows and inflation premiums in discount rates arealso offsetting, requiring the Fisher equation.While it is reasonable to expect PPP and the Fisher equation to hold, when events are realized, it is very unlikelythat they will have held. However, the departures from the conditions are as likely to be positive as negative. This ispart of the risk of business. The risk is that realized changes in exchange rates might not reflect inflationdifferentials, and the interest rate might poorly reflect the level of inflation. This risk should be reflected in DR e orr US which should contain appropriate premiums.When we are dealing with contractual values, we cannot use the real interest rate with uninflated cash flows. Thisis because the foreign-currency streams are nominal amounts that must be converted at the exchange rate at thetime of payment/receipt and discounted at the nominal rate. What we have if the cash flows are contractual isX Tt¼1S t CF t ð1 tÞð1 þ DR e Þ t¼ XTt¼1S 0 ð1 þ _S Þ t CFt ð1ð1 þ DR e Þ ttÞ371 &
INTERNATIONAL INVESTMENT AND FINANCINGWe cannot expand CFt in order to cancel terms, since all values are fixed contractually. We are left to discountat the nominal rate of interest, DR e . We discount the nominal CFt converted into the investor’s currency at theforecast exchange rate.When the profiles of cash flows or incremental effects such as tax shields vary in real terms and do not grow at theinflation rate (perhaps they initially increase in real terms and later decline), we cannot use PPP and the Fisherequation to reduce the complexity of the problem, even for noncontractual cash flows. We must instead use the APVformula – equation (16.2) – with forecasted nominal cash flows and the nominal discount rate.& 372
Chapter 17The growth and concerns aboutmultinationals‘‘If everybody minded their own business,’’ the Duchess said in a hoarse growl, ‘‘the world would goround a deal faster than it does.’’Lewis CarrollAlice’s Adventures in WonderlandRegardless of where you live, chances are you havecome across the names of numerous multinationalcorporations (MNCs) such as those listed inTable 17.1. These mammoth organizations, whichmeasure sales by the tens of billions of dollars andemployment by the tens or even hundreds of thousands,have evaluated expected cash flows and risksand decided that foreign direct investment (FDI) isworthwhile. But what makes expected cash flowsand risks what they are? Furthermore, can anythinghe done to influence them? For example, cantransfer prices of goods and services movingwithin an MNC be used to reduce taxes or otherwiseincrease net cash flows from a given project?Can financial structure – the mix between debtand equity for financing activities – be used toreduce political risk? Indeed, can an MNC correctlymeasure the cash flows and political risks of foreigninvestments? Furthermore, do the matters relatingto MNCs apply also to members of transnationalalliances –firms in different countries working incooperation – or are transnational alliances a meansof avoiding problems faced by MNCs? Thesequestions, which are central to the emergence andmanagement of MNCs and transnational alliances,are addressed in this chapter. In addition, we look atthe problems and benefits that have accompaniedthe growth of multinational and transnational formsof corporate organization.THE GROWTH OF MNCsThe growth of the MNC has been a result of FDIswhich have taken place in the past. In the extensiveexample in Chapter 16, Aviva’s overseas directinvestment was a result of the movement of indigenousfirms into its market. Such strategic overseasinvestment is especially important in dynamic andchanging markets, such as publishing and fashionclothing, where overseas subsidiaries must keep inline with local needs or where shipping time is vital.In addition to strategic reasons for direct investment,numerous other reasons have been put forward,and while these are not all strictly financial,they deserve mention in this book.Reasons for the growth of MNCsAvailability of raw materialsIf there are mills producing denim cloth in othercountries, the quality is good, and the price isattractive why should a firm like Aviva Corporation373 &
INTERNATIONAL INVESTMENT AND FINANCING& Table 17.1 The 50 largest nonfinancial MNCs, ranked by total assets, 2000Rank Corporation Home country Industry Totalassets(billion $)Totalsales(billion $)Totalemploymentin thousands1 GE United States Electrical equipments 437 129 3132 GM United States Motor vehicles 303 184 3863 Ford Motor United States Motor vehicles 283 170 3504 VodafoneUnited Kingdom Telecommunications 222 11 29Communications5 VerizonUnited States Telecommunications 164 63 552Communications6 Toyota Motor Japan Motor vehicles 154 125 7097 Exxon/Mobil United States Petroleum 149 206 978 Vivendi Universal France Diversified 141 39 3279 Deutsche Post Germany Transport and storage 139 30 27810 Royal Dutch/Shell United Kingdom Petroleum 122 149 9511 SBC Communications Unites States Telecommunications 98 51 8912 Fiat Italy Motor vehicles 95 53 22313 Hitachi Japan Electrical equipments 92 75 33714 IBM United States Electrical equipments 88 88 31615 Telefonica Spain Telecommunications 87 26 14816 Total Fina Elf France Petroleum 81 105 12317 Wal-Mart Stores United States Retail 78 191 1,30018 Chevron Texaco United States Petroleum 77 117 6919 BP United Kingdom Petroleum 75 148 10720 Volkswagen Germany Motor vehicles 75 79 32421 Matsushita Electric Japan Electrical equipments 72 68 290Industrial22 Sony Japan Electrical equipments 68 63 18123 Mitsui & Company Japan Wholesale trade 64 128 3924 RWE Germany Electricity, Gas 60 44 12525 Hutchison Whampoa Hong Kong Diversified 56 7 4926 Unilever United Kingdom Diversified 52 44 29527 Nissan Motors Japan Motor vehicles 51 48 13328 Daimler/Chrysler Germany Motor vehicles 48 83 2429 Repsol YPF Spain Petroleum 48 42 3730 Honda Motors Japan Motor vehicles 46 57 11231 Peugeot France Motor vehicles 46 42 17232 BMW Germany Motor vehicles 45 34 9333 Eni Italy Petroleum 45 44 6934 Suez France Electricity 43 32 17335 Texas Utility United States Electricity 43 22 16Company36 Roche Switzerland Pharmaceuticals 42 17 6437 Motorola United States Telecommunications 42 37 147& 374
MULTINATIONAL CORPORATIONS& Table 17.1 ContinuedRank Corporation Home country Industry Totalassets(billion $)Totalsales(billion $)38 E. On Germany Electricity 41 83 3939 Itochu Japan Wholesale trade 41 97 86740 Merck & Co. United States Pharmaceuticals 40 40 4941 News Corporation Australia Media 39 14 3342 Nestle Switzerland Food products 39 49 22443 Alcatel France Machinery 39 29 59844 Sumitomo Japan Wholesale trade 39 80 3045 Aventis France Pharmaceuticals 38 20 10246 Diageo United Kingdom Food and beverages 37 18 7247 BASF Germany Chemicals 36 33 10348 Philips Electronics Netherlands Electrical equipments 35 34 21949 DOW Chemicals United States Chemicals 35 29 5350 Procter & Gamble United States Diversified 34 39 48Source: World Investment Report 2002: Transnational Corporations and Export Competitiveness, United NationsConference on Trade and Development, New York and Geneva 2002.Totalemploymentin thousandsbuy the denim material abroad, ship it to the UnitedStates, manufacture the jeans, and then ship the finishedgarments overseas again? Clearly, if the abilityexists to manufacture the jeans in the foreign market,the firm can eliminate two-way shipping costs – fordenim in one direction and jeans in the other – bydirectly investing in a manufacturing plant abroad. 1Many firms, most particularly mining companies,have little choice but to locate at the site of their rawmaterials. If copper or iron ore is being smelted, itoften does not make sense to ship the ore when asmelter can be built near the mine site. The productof the smelter – the copper or iron bars which weighless than the original ore – can be shipped out to themarket. However, even in this rather straightforwardsituation we still have to ask why it would be aforeign firm rather than an indigenous firm thatowned the smelter. With an indigenous firm therewould be no FDI. Thus, to explain FDI, we mustexplain why a multinational corporate organization1 A model of overseas direct investment that considerstransportation costs as well as issues involving stages ofproduction and economies of scale has been developed byJimmy Weinblatt and Robert E. Lipsey, ‘‘A Model ofFirms’ Decisions to Export or Produce Abroad,’’ NationalBureau of Economic Research, Working Paper 511, July 1980.can do things better or cheaper than local firms. Aswe shall see in the following paragraphs, there arenumerous advantages enjoyed by MNCs versuslocal, single country companies.Integrating operationsWhen there are advantages to vertical integration interms of assured delivery between various stages ofproduction and the different stages can be performedbetter in different locations (as with thesmelting of ores and the use of the product of theore), there is good reason to invest abroad. Thisreason for direct investment has been advanced byCharles Kindleberger, who along with RichardCaves did some of the earlier work on FDI. 22 We refer to Charles P. Kindleberger, American Business Abroad,Yale University Press, New Haven, CT, 1969. See alsoRichard E. Caves, ‘‘<strong>International</strong> Corporations: TheIndustrial Economics of Foreign Investment,’’ Economica,February 1971, pp. 1–27. A number of papers on directinvestment are contained in John H. Dunning (ed.),<strong>International</strong> Investment, Penguin Books, Harmondsworth,UK, 1972. For factors affecting the initial decision, thereader may consult J. David Richardson, ‘‘On Going Abroad:The Firm’s Initial Foreign Investment Decision,’’ QuarterlyReview of Economics and Business, Winter 1971, pp. 7–22.375 &
INTERNATIONAL INVESTMENT AND FINANCINGThe advantage of ownership of the various stagesof the supply chain is based on the lower inventorylevels that are required when there is good communicationof information between the differentstages of production: inventory arrival can thenmove closer to just-in-time levels. The advantageof common ownership to achieve this is perhapsless important than it used to be because ofelectronic data interchange that can link separatelyowned companies when the flow of informationbetween stages of the supply chain is mutuallybeneficial.companies that can make mistakes, it is importantfor multinationals to maintain high and homogeneousstandards to protect their reputations. Abad experience in one location can easily spill overto sales and profits in other locations. This is thenature of negative externalities which areinternalized if foreign production is kept withinthe company rather than being licensed out to aseparate corporate entity. We find that there isgood reason for FDI rather than alternative waysof expanding into overseas markets such asgranting foreign licences.Nontransferable knowledgeIt is often possible for firms to sell their knowledgein the form of patent rights, and to license a foreignproducer. This relieves a firm of the need to makeFDI. However, sometimes a firm that has a productionprocess or product patent can make a largerprofit by doing the foreign production itself. This isbecause there are some kinds of knowledge whichcannot be sold and which are the result of years ofexperience. Aviva, for example, might be able tosell patterns and designs, and it can license the useof its name, but it cannot sell a foreign firm itsexperience in producing, and more importantly,marketing the product. This points to anotherreason why a firm might wish to do its own foreignproduction.Protecting reputationsProducts develop good or bad names, and theseare carried across international boundaries. Forexample, people everywhere know the names ofcertain brands of jeans, fast food, soft drinks, andcommercial banks. It would not serve the goodname of a multinational company to have a foreignlicensee do a shoddy job providing the good orservice. Whether we are talking about restaurantchains where people could become sick,accounting firms which might use unlawful orethically questionable practices, or pharmaceutical& 376Exploiting reputationsFDI may occur to exploit rather than protect areputation. This motivation is probably of particularimportance in FDI by banks, and it takes theform of opening branches and establishing orbuying subsidiaries. One of the reasons whybanking has become an industry with mammothmultinationals is that an international reputationcan attract deposits; many associate the size of abank with its safety. For example, a name likeBarclays, Chase, or Citibank in a small, lessdevelopednation is likely to attract deposits awayfrom local banks. Reputation is also important inaccounting, as Exhibit 17.1 explains. This is whymany large industrial nations such as the UnitedStates and Britain have argued in global tradenegotiations for a liberalization of restrictions onservices, including accounting and banking. It isalso the reason why the majority of less-developednations have resisted this liberalization.Protecting secrecyDirect investment may be preferred to thegranting of a license for a foreign company toproduce a product if secrecy is important. Thispoint has been raised by Erich Spitaler, who arguesthat a firm can be motivated to choose directinvestment over licensing by a feeling that, while alicensee may take precautions to protect patent
MULTINATIONAL CORPORATIONSEXHIBIT 17.1COUNTING ON A GOOD NAMEThe economics of information suggests that reputationhas value when a supplier’s reputation is a signal ofgood quality. Reputation is important when quality isdifficult to observe directly, and thus this issue isparticularly relevant with services.One service for which reputation has becomeincreasingly important, especially since the Enron andWorldcom revelations and accusations, is accounting.While there are other reasons for accounting havingbecome multinational, including benefits to multinationalcorporations of maintaining confidentialitywhen dealing with the same accounting firm worldwide,the company’s name has played a central role in thesuccess of many of today’s international accountingfirms. This is all the more incredible in light of the factthat accounting rules vary a great deal from country tocountry, a matter that would tend to favor local firmswith detailed knowledge of the local procedures.Reputation matters because it is very difficult forthose employing accounting services to distinguisha good accountant from a bad one. It is too late ifdiscovery of an accountant’s ‘‘type’’ is determinedonly after the fact. Yes, there have been revelationsinvolving at least one major multinational accountancyfirm which found itself in court for questionablepractices. Furthermore, there are other advantages tomultinationalization in the industry, such as economiesof scale in information technology and economiesof scope with providing consultancy services: aneconomy of scope is where there are advantages todifferent production activities being provided sideby-side.However, the bottom line – something thataccountants pay a lot of attention to – is that thepower of an accountancy firm is in its name. Brand isas important in the sale of international services as itis for familiar manufactures.rights, it may be less conscientious than the originalowner of the patent. 3The product life-cycle hypothesisIt has been argued, most notably by RaymondVernon, that opportunities for further corporateexpansion at home eventually dry up. 4 To maintainthe growth of profits, the corporation must ventureabroad to where markets are not as well penetratedand where there is perhaps less competition. Thismakes direct investment the natural consequence ofbeing in business for a long enough time and havingexhausted possibilities of expansion at home. Thereis an inevitability in this view that has concernedthose who believe that American firms are furtheralong in their life-cycle development than the firmsof other nations and are therefore dominant inforeign expansion. 5 However, even when US firmsdo expand into foreign markets, their activities areoften scrutinized by the host governments. Moreover,the spread of US multinationals has beenmatched by the inroads of foreign firms into theUnited States. Particularly noticeable have beenauto and auto-parts producers such as Toyota,Honda, Nissan, and Michelin. Foreign firms have aneven longer history as leaders in the US food anddrug industry (Nestle, Hoffmann-La Roche); in oiland gas (Shell, British Petroleum – as BP – andso on); in insurance, banking, and real-estatedevelopment; and in other areas.3 See Erich Spitaler, ‘‘A Survey of Recent QuantitativeStudies of Long-Term Capital Movements,’’ IMF StaffPapers, March 1971, pp. 189–217.4 Raymond Vernon, ‘‘<strong>International</strong> Investment and<strong>International</strong> Trade in the Product Life-Cycle,’’ QuarterlyJournal of Economics, May 1966, pp. 190–207.5 Inevitable US domination of key businesses in Europeand the world was a popular view in parts of Europe in the1960s and 1970s. Particularly influential was J.J. Servain-Schreiber’s The American Challenge, Hamish Hamilton,London, 1968.377 &
INTERNATIONAL INVESTMENT AND FINANCINGCapital availabilityRobert Aliber has suggested that access to capitalmarkets can be a reason why firms themselves moveabroad. 6 The smaller one-country licensee does nothave the same access to cheaper funds as the largerfirm, and so larger firms are able to operate withinforeign markets with a lower discount rate. However,Edward Graham and Paul Krugman havequestioned this argument on two grounds. 7 First,even if large multinational firms have a lower cost ofcapital than small, indigenous firms, the form ofoverseas investment does not have to be directinvestment. Rather, it can take the form of portfolioinvestment. Second, the majority of FDI has beentwo-way, with, for example, US firms investing inJapan while Japanese firms invest in the UnitedStates. This pattern is not an implication of thedifferential-cost-of-capital argument which impliesone-way investment flows.Strategic FDIAs we indicated in Chapter 16, companies enterforeign markets to preserve market share when thisis being threatened by the potential entry of indigenousfirms or multinationals from other countries.This strategic motivation for FDI has alwaysexisted, but it may have contributed to the multinationalizationof business as a result of improvedaccess to capital markets. This is different from theargument concerning the differential cost of capital,given previously. In the case of increased strategicFDI, it is globalization of financial markets that hasreduced entry barriers due to large fixed costs.Access to the necessary capital means a wider set ofcompanies with an ability to expand into any givenmarket. This increases the incentive to move andenjoy any potential first-mover advantage.6 RobertAliber,‘‘A Theory of Direct Foreign Investment,’’ inCharles P. Kindleberger (ed.), The <strong>International</strong> Corporation:A Symposium, MIT Press, Cambridge, MA, 1970.7 Graham, Edward M. and Paul R. Krugman, Foreign DirectInvestment in the United States, Institute for <strong>International</strong>Economics, Washington, DC, 1991.& 378Organizational factorsRichard Cyert and James March emphasize reasonsgiven by organization theory, a theme that is extendedto FDI by E. Eugene Carter. 8 The organizationtheoryview of FDI emphasizes broad managementobjectives in terms of the way managementattempts to shift risk by operating in many markets,achieve growth in sales, and so on, as opposed toconcentrating on the traditional economic goalof profit maximization.Avoiding tariffs and quotasAnother reason for producing abroad instead ofproducing at home and shipping the product concernsthe import tariffs that might have to be paid. 9If import duties are in place, a firm might produceinside the foreign market in order to avoid them.We must remember, however, that tariffs protectthe firm engaged in production in the foreignmarket, whether it be a foreign firm or an indigenousfirm. Tariffs cannot, therefore, explain whyforeign firms move abroad rather than use thelicensing route, and yet the movement of firms isthe essence of direct investment. Nor, along similarlines, can tax write-offs, subsidized or even freeland offerings, and so on, explain direct investment,since foreign firms are not usually helped more thandomestic ones. We must rely on our other listedreasons for direct investment and the overridingdesire to make a larger profit, even if thatmeans moving abroad rather than expanding intoalternative domestic endeavors.8 Richard M. Cyert and James G. March give an account oforganization theory in The Behavioral Theory of the Firm,Prentice-Hall, Englewood Cliffs, NJ, 1963. E. EugeneCarter extends the theory to direct investment in ‘‘TheBehavioral Theory of the Firm and Top Level CorporationDecisions,’’ Administrative Science Quarterly, December1971, pp. 413–28.9 A geometrical explanation of the effect of tariffs on directinvestment has been developed by Richard E. Caves inMultinational Enterprise and Economic Analysis, CambridgeUniversity Press, Cambridge, UK 1982, pp. 36–40.
MULTINATIONAL CORPORATIONSThere have been cases where the threat ofimposition of tariffs, or quantitative restrictions onimports in the form of quotas, have prompted directinvestment overseas. For example, a number offoreign automobile and truck producers openedplants, or considered opening plants, in the UnitedStates to avoid restrictions on selling foreign-madecars. The restrictions were designed to protect jobsin the US industry. Nissan Motors built a plant inTennessee, and Honda built a plant in Ohio. For aperiod of time Volkswagen assembled automobilesand light trucks in the United States and Canada.Other companies having made direct investmentsincluded Renault and Daimler-Benz. 10Avoiding regulationsAs is explained in Chapter 19 in our discussion ofthe multinationalization of banking, FDI has beenmade by banks to avoid regulation. This has alsobeen a motivation for foreign investment by manufacturingfirms. For example, a case might be madethat some firms have moved to escape standards setby the US Environmental Protection Agency, theOccupational Safety and Health Administration,and other agencies. Some foreign countries withlower environmental and safety standards offer ahaven to firms using dirty or dangerous processes.The items produced, such as chemicals and prescriptiondrugs, may even be offered for sale back inthe parent companies’ home countries.Production flexibilityA manifestation of departures from purchasingpower parity (PPP) is that there are periods whenproduction costs in one country are particularly lowbecause of a real depreciation of its currency.Multinational firms may be able to relocateproduction to exploit the opportunities that realdepreciations offer. This requires, of course, that10 Offsetting the incentive to produce within a country toavoid import tariffs is the preference that buyers of aproduct may have for imports. For example, it may be thata German car from Germany will be valued more than if thecar is manufactured in the United States.trade unions or governments do not make theshifting of production too difficult. Small manufacturedgoods such as computer components andTVs lend themselves to such shuffling of production,whereas automobile production, with its internationalunions and expensive setup costs, does not. 11Symbiotic relationshipsSome firms follow clients who make FDIs. Forexample, large US accounting firms which haveknowledge of parent companies’ special needs andpractices have opened offices in countries wheretheir clients have opened subsidiaries. These USaccounting firms have an advantage over local firmsbecause of their knowledge of the parent andbecause the client may prefer to engage only onefirm in order to reduce the number of people withaccess to sensitive information; see Exhibit 17.1.The same factor may apply to consulting, legal, andsecurities firms, which often follow their homecountryclients’ direct investments by openingoffices in the same foreign locations. Similarly, it hasbeen shown that manufacturing firms may be drawnto where other manufacturing firms from the samecountry are located. By being in the same regionthey can work together and benefit from theirknowledge of each other. The benefits from being inthe same region as other companies are calledagglomeration economies. 1211 See Victoria S. Farrell, Dean A. DeRosa, and T. AshbyMcCown, ‘‘Effects of Exchange Rate Variability on<strong>International</strong> Trade and Other Economic Variables: AReview of the Literature,’’ Staff Studies, no. 130, Board ofGovernors of the Federal Reserve System, January 1984;Bruce Kogut, ‘‘Designing Global Strategies: Comparativeand Competitive Value-Added Chains,’’ Sloan ManagementReview, Summer 1985, pp. 15–28; John H. Dunning,‘‘Multinational Enterprises and Industrial Restructuring inthe U K,’’Lloyds Bank Review, October 1985, pp. 1–19; andDavid de Meza and Frederick van der Ploeg, ‘‘ProductionFlexibility as a Motive for Multinationality,’’ Journal ofIndustrial Economics, March 1987, pp. 343–55.12 See Keith Head, John Ries, and Deborah Swenson,‘‘Agglomeration Benefits and Location Choice: Evidencefrom Manufacturing Investments in the United States,’’Journal of <strong>International</strong> Economics, 1995, pp. 223–47.379 &
INTERNATIONAL INVESTMENT AND FINANCINGEXHIBIT 17.2MULTINATIONALS: CREATURES OF MARKETIMPERFECTIONSThe numerous reasons given in the text for thegrowth in the relative importance of multinationalcorporations are all aspects of market imperfections.For example, they are based on transportation costs,tariff barriers, quotas, different regulations in differentcountries, protection of industrial or commercialsecrets, and costly information, all of whichrepresent ‘‘frictions’’ to the free international flow ofgoods and services.Some frictions are natural barriers, such as transportationcosts which force companies to operate inmultiple locations or else face the costs of shipping toevery market from a single, central location. This isespecially true for products such as gasoline which isexpensive to move and difficult to handle. Anothernatural friction is perishability which forces companiesto be close to the final consumer when dealingwith food, newspapers, and so on which have to be‘‘fresh.’’ Other frictions are man-made. For example,tariff barriers which force companies to producewhere they sell or else face import duties are the resultof human interventions in what would otherwise befreer trade. Quotas are another means of encouragingcompanies to operate where they sell, and whichare the result of government action, usually at theurging of local interest groups who wish to reducecompetition.Exchange rates represent a friction in that theyintroduce an added cost and uncertainty when doingbusiness across currency areas. Foreign exchangemarkets are human creations, although humans canhardly be blamed for the fact that most countries –those in the Euro zone being an exception – like tohave their own currencies. There is an issue ofsovereignty that works against throwing your lot inwith other countries for a one-size-fits-all exchangerate and monetary policy.When we see what the causes are of multinationalizationof business we can begin to figure outwhat the future might hold. Some natural barriers arebeing reduced, as for example from the reduction intransportation costs and faster, cheaper telecommunications.Even human barriers are comingdown with free-trade agreements and actions such asthe 2004 decision by the World Trade Organizationmembers to eventually abolish subsidies and otherdistortions to trade in agricultural commodities. Thesame forces that enabled multinationals to grow totheir importance at the turn of the twenty-first centurycould be the very same influences that eventually leadto their demise.Source: Based in part on Multinationals, a supplement inThe Economist, March 27, 1993, p. 9.Indirect diversificationWe should not leave our discussion of factorscontributing to the growth of MNCs withoutmentioning the potential for the MNC to indirectlyprovide portfolio diversification for shareholders. 13This service will, of course, be valued only if13 A formal theory of FDI based on indirect provision ofportfolio diversification has been developed by Vihang R.Errunza and Lemma W. Senbet, ‘‘The Effects of<strong>International</strong> Operations on the Market Value of the Firm:Theory and Evidence,’’ Journal of <strong>Finance</strong>, May 1981,pp. 401–17.& 380shareholders are unable to diversify themselves.This requires the existence of segmented capitalmarkets that only the MNC can overcome. Thisargument was mentioned in Chapter 15 in thecontext of international asset pricing. It is alsomentioned in Exhibit 17.2, which argues that all thecauses of growth of MNCs, including that relatingto diversification, depend on market imperfections.Empirical evidence on the growth of MNCsIt should be apparent from glancing down the listof factors that can be responsible for the growth
MULTINATIONAL CORPORATIONSof MNCs that the relative importance of differentfactors will depend on the nature of the MNC’sbusiness. Partly as a result of this, the empiricalevidence we have on MNCs tends to be limited tosome stylized facts about the nature of the industriesin which most direct investment occurs.In an investigation of the characteristics ofapproximately 1,000 US publicly owned companiesinvesting abroad, Irving Kravis and Robert Lipseyfound a number of characteristics of investing firmsvis-à-vis firms not investing abroad. 14 The characteristicswere separated into those that could beattributed to the industry of the investor and thosedistinguishing investing firms from other firmswithin their industry.Investing firms spent relatively heavily onresearch and development (R&D); this was attributableboth to the investors’ industries and to thefirms investing abroad within each industry. Thatis, the industries with heavy investments abroadspent more on R&D than other industries, andthe firms that invested abroad spent more onR&D than the average spending of firms in theirindustries. (This characteristic of FDI is consistentwith the secrecy-protection explanation given earlier:high R&D investors have more intellectualcapital to protect, thereby discouraging productionoverseas through licensees. It is also consistent withthe size of market being a determinant of R&Dinvestments which are often large and risky.)Investors were also more capital intensive thannoninvestors, this being mostly attributable to theindustries investing overseas. (This is consistentwith the capital-availability argument; capitalintensiveinvestors presumably need to raise arelatively large amount of financial capital.) Othercharacteristics of investors were that they werelarge relative to both other industries and otherfirms within their industries (which is consistentwith the life-cycle hypothesis), and that investing14 Irving B. Kravis and Robert E. Lipsey, ‘‘The Location ofOverseas Production and Production for Export of USMultinational Firms,’’ Journal of <strong>International</strong> Economics, May1982, pp. 201–23.firms were more profitable. 15 Profitability is a factoraffecting investment when there are imperfectionsor frictions in capital markets, with internallygenerated funds being lower cost than externalcapital.Kravis and Lipsey also noted that there appearedto be an order of countries when investing overseas.If an investor had made one foreign investment, itwould most likely be in Canada. With two investments,an investor would be in Canada and inMexico or the United Kingdom. After this, investmentswere found in Germany, France, and possiblyAustralia.Evaluation of direct-investment statistics alsosuggests, as we would expect from the proceduresused to evaluate foreign projects, that moreinvestment occurs in those countries that haveoffered investors higher returns. 16 There alsoappears to be a connection between domesticeconomic activity and foreign investment, withgood economic conditions at home discouraginginvestment abroad. Such a situation, that suggeststhat at times profitable overseas investments areavoided when there are profitable domesticinvestments, indicates that there is capitalrationing. When capital is rationed not all positiveNPV or APV projects are pursued. Rationinghappens when a company appropriates a capitalbudget that is fixed irrespective of what theinvestment possibilities are.SPECIAL ISSUES FACING MNCs:TRANSFER PRICINGWhile any firm with multiple divisions must pricegoods and services transferred between its divisionsif it is to be able to judge its profit centers correctly,15 These conclusions are also supported by Irving B. Kravis,Robert E. Lipsey, and Linda O’Connor, ‘‘Characteristics ofUS Manufacturing Companies Investing Abroad and TheirChoice of Production Locations,’’ National Bureau ofEconomic Research, Working Paper 1104, April 1983.16 See <strong>International</strong> Letter, Federal Reserve Bank of Chicago,no. 537, October 19, 1984.381 &
INTERNATIONAL INVESTMENT AND FINANCINGthere are few, if any, political or tax implications oftransfer pricing in the domestic context. Thesituation is very different for the MNC.The measurement of transfer pricesIf correct measures of prices of goods or servicesmoving between corporate divisions are not available,management will have difficulty making APVcalculations for new projects, and will even facedifficulties judging past projects and performancesof corporate divisions: performance is important formonitoring where profits are being made and forallocation of bonuses. But how are managers tocalculate correct transfer prices?The prices managers must determine are those ofintermediate products moving through the valuechain of vertically integrated firms. The mostobvious source for these prices is the market.However, market prices do not always exist forintermediate products. Furthermore, even whenthere are market prices for the goods and servicestransferred between divisions within a firm, usingthese prices may result in incorrect decisions. Let usconsider why. 17The theoretically correct transfer price is equalto the marginal cost. 18 This is because the price paidthen correctly reflects the cost of producing anotherunit. 19 If a good or service transferred betweencorporate divisions is available in the marketplace,where it trades in a textbook-type ‘‘perfectlycompetitive’’ market, the market price will equalthe marginal cost, and this market price can then be17 The background economic analysis behind the points madehere was first provided by Jack Hirschleifer, ‘‘On theEconomics of Transfer Pricing,’’ Journal of Business, July1956, pp. 172–84, and ‘‘Economics of the DivisionalizedFirm,’’ Journal of Business, April 1957, pp. 96–108.18 This assumes constant returns to scale. See Hirschleifer,op. cit.19 The rationale is the same as for selecting the quantity of anyinput that maximizes profits: profits are reduced by usingless or by using more than the quantity of input at which themarginal revenue product of the input equals the input’smarginal cost.& 382used as the transfer price. However, goods andservices moving between divisions are frequentlyavailable only in monopolistic or monopolisticallycompetitive markets. In this case, market prices willtypically exceed marginal costs. This means that bysetting transfer prices equal to market prices abuying division will be paying above marginal costfor inputs. This will induce the use of too few inputsto achieve the profit-maximizing output from thefirm’s overall perspective. The firm’s output of itsfinal product will also be less than the profitmaximizinglevel. In addition, with transfer pricesequal to market prices, and these being higher thanthe firm’s marginal costs of the transferred goodsand services, input combinations will be inappropriatelyintensive in products bought from outsidethe firm. That is, if, instead of setting transfer pricesof intermediate products equal to market prices, thefirm sets them equal to its marginal costs of production,buying divisions would correctly usemore of the firm’s own intermediate products asinputs.While setting transfer prices equal to marginalcosts will maximize the firm’s overall profits, it willmake it difficult to attribute the company’s profittothe correct divisions; marginal costs are typicallylower than market prices, so that divisions supplyingintermediate products will show losses. Thiswill make bonus allocations and expansion budgetsdifficult to determine properly. One way aroundthis is to use marginal costs as the transfer prices thatare paid, but to calculate divisional profitability atmarket prices. This requires, of course, that marketprices of intermediate products are available, andthat marginal costs are known. In reality, neitherrequirement is likely to be satisfied.Strategic considerations in transfer pricingRepatriation of profits by a multinational firm fromits overseas operations can be a politically sensitiveproblem. It is important that host governmentsdo not consider the profit rate too high, or elsethe multinational is likely to face accusations ofprice gouging and lose favor with foreign host
MULTINATIONAL CORPORATIONSgovernments. In order to give an appearance ofrepatriating a lower profit without reducing theactual profit brought home, the multinational mayuse transfer prices. It may set high transfer prices onwhat is supplied to a foreign division by the headoffice or by divisions in environments that are politicallyless sensitive. For example, it can extracthigh payments for parts supplied by other divisionsor for general overheads such as R&D and marketingexpenses. Alternatively, the multinationalcan lower the transfer prices of products which theforeign division sells to the parent company or toother divisions. These methods of reducing foreignprofits while repatriating income are particularlyadvantageous when foreign reinvestment opportunitiesare limited. Unfortunately for the multinational,the misstatement of transfer prices is illegalwith fines and even more serious punishments.Manipulating transfer pricing to reduce overallcorporate taxes can be particularly advantageous.The multinational has an incentive to shuffle itsincome to keep profits low in high-tax countries andrelatively high in low-tax countries. There arecomplications if within a country there are differenttax rates on retained versus repatriated income. Thegains from profit shuffling via transfer pricesare limited by the legal powers of the InternalRevenue Service (IRS), and of taxing authorities insome other countries, which can reallocate incomeand impose fines if it is determined that transferprices have distorted profits. 2020 For a detailed account of the tax implications of transferpricing see Donald R. Lessard, ‘‘Transfer Prices, Taxes, andFinancial Markets: Implications of <strong>International</strong> FinancialTransfers within the Multinational Corporation,’’<strong>International</strong> Business and <strong>Finance</strong>, 1979, pp. 101–35, andJ. William Petty and Ernest W. Walker, ‘‘OptimalTransfer Pricing for the Multinational Firm,’’ FinancialManagement, Winter 1972, pp. 74–87. We might note thatif MNCs are in a position to reduce taxes in waysunavailable to local firms, this provides an additionalreason for the growth of MNCs. See David Harris,Randall Morck, Joel Slemrod, and Bernard Yeung,‘‘Income Shifting in US Multinational Corporations,’’National Bureau of Economic Research, SummerInstitute’s <strong>International</strong> Taxation Workshop, 1991.A multinational firm is likely to be in a betterposition to avoid foreign exchange losses than a firmwith only local operations. There have been times,especially under fixed exchange rates in the periodbefore 1973, when the devaluation of certain currenciesand the revaluation of others were imminent.Because of extensive involvement by centralbanks, the interest-rate differential between countriesdid not always reflect the anticipated changesin exchange rates, and so compensation was notoffered for expected exchange-rate movements.There were incentives for all corporations to reducetheir holdings of the currencies which faced devaluation.However, an attempt to move from thesecurrencies was viewed as unpatriotic when undertakenby domestic firms and as unfair profiteeringwhen undertaken by multinationals. As a result,considerable constraints were placed on movingfunds in overt ways, but multinationals were in abetter position than their domestic counterparts tomove funds disguised as transfer payments.Transfer prices can be used to reduce importtariffs and to avoid quotas. When tariffs on importsare based on values of transactions, the value ofgoods moving between divisions can be artificiallyreduced by keeping down the transfer prices. Thisputs a multinational firm at an advantage overdomestic firms. Similarly, when quotas are based onvalues of trade, the multinational can keep downprices to maintain the volume. Again, the multinationalhas an advantage over domestic counterparts,but import authorities frequently adopt theirown ‘‘value for duty’’ on goods entering trade tohelp prevent tax revenues from being lost throughthe manipulation of transfer prices.Large variations in profits may be a concern toshareholders. In order to keep local shareholdershappy, fluctuations in local foreign profits can bereduced via transfer prices. By raising the prices ofgoods and services supplied by foreign operations orlowering prices on sales to foreign operations,unusually high profits can be brought down so thatsubsequent falls in profits are reduced. Of course,shareholders are normally assumed to be concernedonly with systematic risk and not with total risk, so383 &
INTERNATIONAL INVESTMENT AND FINANCINGthe premise that profit volatility is of concern toshareholders is not universally accepted.To the extent that transfer prices apply tofinancial transactions such as credits grantedbetween corporate divisions, the scope for meetingthe many strategic objectives we have described,such as reducing host-government criticism overprofits and reducing taxes, are substantiallyenhanced. Indeed, when we add discretion overtiming of repayment of credits, the MNC may be ata substantial advantage over non-multinationalcompetitors. 21Practical considerations in transfer pricingTransfer prices can be used to ‘‘window-dress’’ theprofits of certain divisions of a multinational so as toreduce borrowing costs. The gains from havingseemingly large profits by paying a subsidiary hightransfer prices for its products must, of course, bebalanced against the potential scorn of foreign hostgovernments, higher taxes or tariffs that mightresult, and so on.For the long-term prosperity of a multinational,it is important that interdivisional profitability bemeasured accurately. The record of profitability ofdifferent divisions is valuable in allocating overallspending on capital projects and in sharing othercorporate resources. In order to discover the correctprofitability, the firm should be sure thatinterdivisional transfer prices are the prices thatwould have been paid had the transactions beenwith independent companies, so-called arm’slengthprices. This can be particularly difficult inthe international allocation of such items as researchand consulting services or headquarters’ overheads;there is rarely a market price for research or otherservices of corporate headquarters. Profit allocationwill usually be according to the distribution ofcorporate sales, with the sales valued at the ‘‘correct’’exchange rate. The internal managementadvantages of preventing distortions in transferprices must be balanced against the potential gainsfrom using distorted transfer prices to reduce tariffs,taxes, political risks, and exchange losses. Thisbalance requires the attention of the upper tiers ofmanagement.SPECIAL ISSUES FACING MNCs:COUNTRY RISKAs we mentioned in our account of capitalbudgeting in Chapter 16, when making FDIs it isnecessary to allow for risk due to the investmentbeing in a foreign country. In this section we considerboth the measurement and the management ofthis so-called country risk, which, as with transferpricing, takes on special importance in themultinational corporation.The term ‘‘country risk’’ is often used interchangeablywith the terms political risk andsovereign risk. However, country risk is reallya broader concept than either of the other two,including them as special cases. Country riskinvolves the possibility of losses due to countryspecificeconomic, political, and social events, andtherefore all political risk is country risk, but notall country risk is political risk. 22 Sovereign riskinvolves the possibility of losses on claims to foreigngovernments or government agencies, whereaspolitical risk involves the additional possibility oflosses on private claims including direct investments.Sovereign risk exists on bank loans andbonds and is therefore not of special concern toMNCs – unless they are banks. Since our concernhere is with the risk faced on FDI, we are concernedwith country risk and are not particularly interestedin the subcomponent of country risk which consistsof sovereign risk. Nevertheless, much of what wesay about country-risk measurement applies tosovereign risk.21 See Lessard, op. cit. We recall that to some extent, timingdiscretion on credits is reduced by leading and laggingrestrictions discussed in the appendix A to Chapter 16.& 38422 For example, see US Comptroller of the Currency, newsrelease, November 8, 1978.
MULTINATIONAL CORPORATIONSThe measurement of country riskAmong the country risks that are faced on anoverseas direct investment are those related to thelocal economy, those due to the possibility ofconfiscation (which refers to a governmenttakeover without any compensation), and those dueto the possibility of expropriation (which refersto a government takeover with compensation,which at times can be fairly calculated 23 ). As well asthe political risks of confiscation and expropriation,there are political/social risks of wars, revolutions,and insurrections. While these are not the resultof action by foreign governments specifically directedat the firm, they can damage or destroy aninvestment. In addition, there are risks of currencyinconvertibility and restrictions on the repatriationof income beyond those already reflected in thecash-flow term of the APV calculation in Chapter 16.The treatment of these risks requires that we makeadjustments in the APV calculation and/or allowancesfor late compensation payments for expropriatedcapital. The required adjustments can bemade to the discount rates by adding a risk premium,or to expected cash flows by putting theminto their certainty equivalent. 24We know that when we view the adjustmentfor risk in terms of the inclusion of a premium inthe discount rate, only systematic risk needs to beconsidered. Since it is possible by investing in a largenumber of countries to diversify unsystematic risk,the remaining systematic component of economicand political/social risk may be relatively small.Risk diversification requires only a degree of economicand political/social independence betweencountries. Diversification is made even moreeffective if the economic and political/social misfortunesfrom events in some countries providebenefits in other countries. For example, risk ondiversified copper investments are small if war or23 Clearly, when investors can count on timely and faircompensation at market value, there is no added risk due toexpropriation.24 We have already indicated that the two methods areconceptually equivalent.revolution in African countries that produce copperraise the market value of South American producersof copper.Before a company can consider how much of itscountry risk is systematic, it must be able todetermine the risk in each country. Only later can itdetermine by how much its country risk is reducedby the individual country risks being imperfectly oreven negatively correlated. But how can it determineeach country’s risk? The most obvious methodis to obtain country-risk evaluations that have beenprepared by specialists. But this merely begs thequestion how the specialists evaluate countryrisk. Let us consider a few of the risk-evaluationtechniques that have been employed.One of the best known country-risk evaluationsis that prepared by Euromoney, a monthly magazinethat periodically produces a ranking of countryrisks. Euromoney’s evaluation procedure is summarizedin Figure 17.1. 25Euromoney consults a cross section of specialists.These specialists are asked to give their opinions oneach country with regard to one or more of thefactors used in their calculations. There are threebroad categories of factors considered. These areanalytical indicators (50 percent), credit indicators(30 percent), and market indicators (20 percent).Each of these broad categories is further subdividedinto more specific components as shown inFigure 17.1.The analytical indicators consist of economic andpolitical-risk evaluations. The economic evaluationis based on actual and projected growth in GNP.The political-risk evaluation is provided by a panelof experts consisting of risk analysts, insurancebrokers, and bank credit officers. The credit indicatorincludes measures of the ability of the countryto service debt based on debt service versusexports, the size of the current-account deficit orsurplus versus GNP, and external debt versus25 Figure 17.1 is based on a description of the Eurocurrencymethod in ‘‘Country Risk: Methodology,’’ Euromoney,September 1994, p. 380.385 &
Euromoneyrating100%Analyticalindicators50%Creditindicators30%Marketindicators20%Economicgrowth25%Politicalrisk25%Debtindicators10%Defaults orreschedules10%Creditrating10%Access tobank finance5%Access to shorttermfinance5%Access to bonds andsyndicated loans5%Forfeitingdiscount5%Debtservice/ExportsCurrentaccount/GNPExternaldebt/GNP& Figure 17.1 Euromoney’s country-risk rating schemeNotesEuromoney allocates 50 percent of the weight in its country risk evaluation index to analytical indicators, with this 50 percent being divided equally between economic andpolitical factors. The remaining 50 percent of Euromoney’s risk evaluation is based on the credit experience and position of a country, and on risk premia set in financialmarkets.
MULTINATIONAL CORPORATIONSGNP. 26 Market indicators are based on assessmentsof a country’s access to bank loans, short-termcredits, syndicated loans, and the bond market,as well as on the premiums occurring on nonrecourseloans made to exporters. 27 Large premiumsare a sign of market-perceived risk. Ofcourse, the market also considers the other factorsused in Euromoney’s ranking, and so there is doublecounting;the factors considered by Euromoneyappear directly in the computation of the ranking,and also indirectly via the premiums on loans.Euromoney’s country-risk rankings of the safestand riskiest 20 countries in 2003 are shown inTable 17.2.Measures of country risk do not distinguish thedifferent risks facing different industries; they measureonly the risk of countries. Yet a number ofstudies show that some industries, especially thoseinvolving natural resources or utilities, face higherrisks than other industries. 28 Indeed, country riskmay even differ between firms in the same industry.This potential for different country risks can tosome extent be influenced by firms themselves,because there are a number of things firms can doto affect the odds of some political-risk eventsoccurring.26 While the ratio of debt-service payments to export earningsprovides an indication of the foreign exchange earnings thatmay be available for debt service, it does not reflect thediversity of goods and services that earn foreign exchange.Presumably, a country with a single export is a poorer riskthan a country with diversified export earnings, even if thetwo countries have the same ratio.27 Nonrecourse loans to exporters are discussed in Chapter 20under the heading ‘‘Forfaiting: A Form of Medium-Term<strong>Finance</strong>.’’28 See J. Frederick Truitt, ‘‘Expropriation of ForeignInvestment: Summary of the Post World War IIExperience of American and British Investors in LessDeveloped Countries,’’ Journal of <strong>International</strong> BusinessStudies, Fall 1970, pp. 21–34; Robert Hawkins, NormanMintz, and Michael Provissiero, ‘‘Government Takeoversof US Foreign Affiliates,’’ Journal of <strong>International</strong> BusinessStudies, Spring 1976, pp. 3–16; and John Calverly, CountryRisk Analysis, Butterworths, London, 1985.Methods of reducing country riskKeeping control of crucial elements ofcorporate operationsSome companies making FDIs take steps to preventoperations from being able to run without theircooperation. This can be achieved if the investormaintains control of a crucial element of operations.For example, food and soft drink manufacturerskeep secret their special ingredients. Auto companiescan produce vital parts, such as engines, insome other country and can refuse to supply theseparts if their operations are seized. 29 The multinationaloil companies have used refining capacitycoupled with alternative sources of oil to reduce theprobability that their oil wells will be expropriated.Similarly, many companies have kept key technicaloperations with their own technicians, who can berecalled in the event of expropriation or confiscation.This has not always been an effective deterrent,as more mercenary technicians can often befound if the salary is sufficient. Moreover, givensufficient time, local people can pick up theimportant skills.Programmed stages of planned divestmentAn alternative technique for reducing the probabilityof expropriation is for the owner of an FDI topromise to turn over ownership and control to localpeople at a specified time in the future. This issometimes required by the host government. Forexample, the Cartagena Agreement of 1969requires the foreign owners of enterprises in theAndean countries of South America to lower theirownership, over time, to below 50 percent.29 According to Roy E. Pederson, who cited the case of IBM,the risk can be reduced by keeping all research anddevelopment at home. See Roy E. Pedersen, ‘‘PoliticalRisk: Corporate Considerations,’’ Risk Management, April1979, pp. 23–32.387 &
INTERNATIONAL INVESTMENT AND FINANCING& Table 17.2 Euromoney’s country-risk ranking, 2003Top twentyBottom twentyCountry Rating/100 Country Rating/100Luxembourg 99.44 Tajikistan 24.19Switzerland 97.36 Mauritania 23.98United States 95.60 Libya 23.38Norway 95.49 Eritrea 23.14Denmark 94.31 Burundi 21.90Netherlands 93.48 Rwanda 21.87Sweden 93.34 Guinea-Bissau 21.74Austria 92.80 Sierra Leone 20.93United Kingdom 92.57 Myanmar 20.75Finland 92.13 Sao Tome & Principe 20.58Ireland 92.10 New Caledonia 20.51Germany 91.92 Micronesia (Fed. States) 18.70Canada 91.79 Marshall Islands 17.41France 91.40 Dem. Rep. of the Congo (Zaire) 15.92Belgium 90.90 Liberia 15.36Australia 90.36 Cuba 13.44Iceland 89.51 Somalia 12.01Spain 88.46 Iraq 6.39Japan 88.30 Korea North 6.33Italy 87.27 Afghanistan 3.07Source: Euromoney, March 2003.Joint venturesInstead of promising shared ownership in thefuture, an alternative technique for reducing therisk of expropriation is to share ownership withforeign private or official partners from the verybeginning. Such shared ownerships, known as jointventures, have been tried by US, Canadian,European, and Japanese firms with partners inAfrica, Central and South America, and Asia. Chinahas almost exclusively relied on joint ventures inhosting FDI in their country, and as of 2003 becamethe largest recipient of FDI in the world, movingahead of the United States which had previouslyheld that record. Joint ventures as a means ofreducing expropriation risks rely on the reluctanceof local partners, if private, to accept the interferenceof their own government. When the partneris the government itself, the disincentive toexpropriate is the concern over the loss of futureinvestments. Joint ventures with multiple participantsfrom different countries reduce the risk ofexpropriation, even if there is no local participation,if the government wishes to avoid being isolatedsimultaneously by numerous foreign powers.Even if joint ventures with governmentcontrolledenterprises work well while that governmentremains in power, they can backfire if thegovernment is overthrown by the opposition in apolarized political climate. Extreme changes ingovernments have been witnessed so many timesthat the risks of siding with a government that fallsare well known. In addition, even when the localpartner is a private corporation, if expropriationmeans more ownership or control for the partner,there is likely to be muted local opposition at best.& 388
MULTINATIONAL CORPORATIONSIt is these reasons which may explain the observationthat the risk of joint ventures has been greaterthan that of ventures with total US ownership. Astudy of US affiliates in the 1960–76 period showedthat joint ventures with host governments wereexpropriated 10 times more often than fully USownedventures and that joint ventures with privatefirms were expropriated 8 times more often. 30Local debtThe risk of expropriation as well as the losses fromexpropriation can be reduced by borrowing withinthe countries where investment occurs. If the borrowingis denominated in the local currency, therewill often also be a reduction of foreign exchangerisk. These obvious gains from engaging in localdebt are limited by the opportunities. Thosecountries where expropriation is most likely tend tobe the countries with the least developed capitalmarkets and host governments unwilling to makeloans. The opportunities for reducing risk by havinglocal people hold equity in the firm are also limitedby the frequent shortage of middle class shareholdersin the high-risk countries and by the absenceof a viable market in which to sell shares.Despite the techniques for reducing risk, somedanger will remain. Fortunately, something can bedone to reduce or eliminate the harmful consequencesof political developments by purchasinginvestment insurance.The purchase of investment insuranceMany countries will insure their companies thatinvest overseas against losses from political events30 These observations may be biased. It could be that jointventures are used disproportionately in situations whereexpropriation is likely. For the record on what hashappened, see David Bradley, ‘‘Managing AgainstExpropriation,’’ Harvard Business Review, July–August1977, pp. 75–83. For a survey of work on political risks,see Stephen Kobrin, ‘‘Political Risks: A Review andReconsideration,’’ Journal of <strong>International</strong> Business Studies,Spring/Summer 1979, pp. 67–80.such as currency inconvertibility, expropriation,war, and revolution. In the United States thisinsurance is offered by the Overseas PrivateInvestment Corporation (OPIC). This corporationhas been in operation since 1971, having replacedprograms in effect since the Economic CooperationAct of 1948. 31 OPIC will insure USprivate investments in developing nations, wherethere tends to be more risk. Over 60 percent of USnon-oil-related FDIs in underdeveloped countriesare covered by OPIC.In addition to investment insurance, OPIC offersproject financing. This involves assistance in findingsources of funds, including OPIC’s own sources,and assistance in finding worthwhile projects.Reimbursement for losses on loans is also offered.There is no coverage for losses due to changes inexchange rates, but there is also no need for suchcoverage because of the private means that areavailable, such as the forward and futures markets.OPIC charges a fee for complete coverage that isbetween 1 and 2 percent per annum of the amountcovered on the insurance policy. Insurance mustgenerally be approved by host governments and isavailable only on new projects. Since 1980, OPIChas joined with private insurance companies in theOverseas Investment Insurance Group. This hasbeen done to move the insurance into the privatesector of the economy. OPIC is financially selfsustaining.In Canada, foreign-investment insurance is providedby Export Development Canada (EDC). EDCwill insure against losses due to war, insurrection,confiscation, expropriation, and events which preventthe repatriating of capital or the transfer ofearnings. This role of the EDC is similar to the roleof OPIC. EDC also offers insurance against nonpaymentfor Canadian exports, a function performedby the Export–Import Bank in the UnitedStates. The insurance coverage offered in the UnitedKingdom is very similar to the coverage offered byOPIC and the Canadian EDC, and similar programsexist in most other trading nations.31 See www.opic.gov for a description of the work of OPIC.389 &
INTERNATIONAL INVESTMENT AND FINANCINGIf the compensation provided by project insurersis received immediately and covers the full value ofthe project, the availability of insurance means thatthe only required adjustment for country risk is adeduction for insurance premiums from cash flows.We can deduct available premiums even if insuranceis not actually purchased, since the firm will then beself-insuring and should deduct an appropriate costfor this.Some of the country risk that MNCs face and thatforces them to insure or take other steps is a resultof their visibility. This is largely due to theirimmense size and the difficulty of regulating them.However, there are other factors that have madeMNCs the target of criticism and concern. Let usturn our discussion of the growth and special problemsof MNCs to these criticisms and concerns,and explain why so much attention has beenattracted by MNCs. We shall see that while some ofthe common concerns over the power and practicesof MNCs may be well-founded, there are manybenefits that MNCs have brought host countriesthrough the transfer of technology and jobs that canbe attributed to their direct investments.PROBLEMS AND BENEFITS FROM THEGROWTH OF MNCsAs we have mentioned, much of the concern aboutMNCs stems from their size, which can be formidable.Indeed, the profits of some of the larger corporationscan exceed the operating budgets of thegovernments in smaller countries. It is the powerthat such scale can give that has led to the greatestconcern. Can the MNCs push around their hostgovernments to the advantage of the shareholdersand the disadvantage of the citizens of the country ofoperation? This has led several countries and eventhe United Nations to investigate the influence ofMNCs. The issues considered include the following.Blunting local economic policyIt can be difficult to manage economies in whichmultinationals have extensive investments, such as& 390the economies of Canada and Australia. SinceMNCs often have ready access to external sourcesof finance, they can blunt local monetary policy. 32When the host government wishes to constraineconomic activity, multinationals may neverthelessexpand through foreign borrowing. Similarly,efforts at economic expansion may be frustratedif multinationals move funds abroad in search ofyield advantages elsewhere. You do not have to bea multinational to frustrate plans for economicexpansion – integrated financial markets will alwaysproduce this effect – but MNCs are likely to participatein any opportunities to gain profits. Furthermore,as we have seen, multinationals can alsoshift profits to reduce their total tax burden; theycan try to manipulate transfer prices to move profitsto countries with lower tax rates. This can make theMNC a slippery animal for the tax collector, eventhough, on the other side of the ledger, by buyinglocal goods they contribute to tax revenue.Destabilizing exchange ratesIt has been argued that multinationals can makeforeign exchange markets volatile. For example, ithas been claimed that when the US dollar is movingrapidly against the world’s major currencies, theCanadian dollar swings even further. In particular,it has been argued that a declining value of the USdollar against, for example, the euro or sterling, hasbeen associated with an average larger decline of theCanadian dollar against these currencies. Althoughthe existence of this phenomenon has not beenformally verified, MNCs have been blamed for suchan effect. It has been claimed that when US parentcompanies are expecting an increase in the value ofthe euro, sterling, and so on, they buy these foreigncurrencies and instruct their Canadian subsidiaries32 While MNCs may reduce the effectiveness of monetarypolicy, they may also increase the effectiveness of changesin exchange rates on the balance of trade. In particular, theymay speed up the increase in exports from countriesexperiencing depreciations by quickly moving theirproduction to those countries to take advantage of thelower production costs.
MULTINATIONAL CORPORATIONSto do the same. With a thinner market in theDominion currency, the effect of this activity couldbe greater movement in the Canadian dollar thanthe US dollar.Defying foreign policy objectivesConcern has been expressed, especially within theUnited States, that US-based multinationals candefy foreign policy objectives of the US governmentthrough their foreign branches and subsidiaries.This concern has been heightened by the focus onterrorism, especially in the aftermath of the eventsof September 11, 2001. For example, a US MNCmight break a blockade and avoid sanctions byoperating through overseas subsidiaries. This hascaused even greater concern within some hostcountries. Why should companies operating withintheir boundaries have to follow orders of the USgovernment or any other foreign government?Multinational corporations present a potentialfor conflict between national governments. There iseven potential for conflict within international/multinational trade unions. For example, in 1980and 1981 Chrysler Corporation was given loanguarantees to help it continue in operation. The USgovernment insisted on wage and salary rollbacks asa condition. Chrysler workers in Canada did notappreciate the instruction from the US Congress toaccept a reduced wage.Creating and exploiting monopoly powerIt is not uncommon to hear the view that becauseMNCs are so large they have reduced competition.However, the truth may be the opposite. In someindustries such as automobiles, computers, steel,and shipbuilding where a single country mightsupport one or only a few firms in the industry,competition is increased by the presence of foreignMNCs. That is, the MNCs themselves compete ininternational markets, and without them monopolypowers in some sectors might be even greater.Accusations have been made, most notably withregard to the oil industry, that multinationals canuse monopoly power to withhold output to effectprice increases for their products. Because themultinationals have such extensive operations,much of the data on which the governments mustrely are often data collected and reported by theMNCs themselves. There is no guarantee that thedata are accurate, and there is no easy way toenforce controls and punish culprits. This becameone of the leading political issues of the newmillennium.Keeping top jobs at homeMultinationals tend to concentrate and specializetheir ‘‘good’’ and ‘‘bad’’ activities within certainlocations. This can mean doing R&D withinthe home country. Highly trained university andtechnical-school graduates who find their employmentand promotion opportunities diminishedwould prefer locally owned and managed enterprisesin their country to foreign MNCs. This hasbeen a controversial problem in countries thatconsider themselves ‘‘branch plant’’ economies.Canadian and Australian scientists and engineershave been particularly outspoken. 33While MNCs have improved prospects for somebetter-paid workers in their home countries, it hasbeen argued that they have ‘‘exported’’ lower-wagejobs, especially in manufacturing. The evidencedoes not appear to support this claim. Indeed,Exhibit 17.3 argues that the opposite may be true.FDI is frequently motivated by strategic considerations,and it can help investing firms retain33 The data support the claim that multinationals keep adisproportionate share of R & D activity at home. Forexample, according to the US Department of Commerce,in 1977 only 10 percent of US-based multinationals’ R&Dwas spent by foreign affiliates, and these foreign affiliatesemployed only 13 percent of the MNCs’ scientists andengineers. See US Department of Commerce, Bureau ofEconomic Analysis, news release, June 2, 1981. See alsoIrving Kravis and Robert Lipsey, ‘‘The Effect ofMultinational Firms’ Foreign Operations on Their DomesticEmployment,’’ National Bureau of Economic Research,Working Paper 2760, March 1989.391 &
INTERNATIONAL INVESTMENT AND FINANCINGEXHIBIT 17.3DO US MULTINATIONALS EXPORT JOBS?Given that everybody knows American workers earnfar more than their counterparts in newly industrializedand developing countries, it has not beendifficult to convince people that US multinationalshave exported Americans’ jobs. But do firms maketheir FDIs to gain access to ‘‘cheap labor,’’ or is theremore to it than that?The idea that FDI by US multinationals hasexported jobs has arisen largely from some highlypublicized cases, such as the movement of Smith-Corona’s typewriter assembly from Connecticut toMexico and the serious, protracted labor unrestover <strong>International</strong> Harvester’s decision to relocateproduction. However, the data do not support popularopinion. First, statistics show that 85 percent ofmanufacturing output by overseas operations ofUS MNCs is in other relatively high-wage countriessuch as Canada and Britain. Second, exportsfrom US subsidiaries abroad to the United Statesare only 12 percent of the subsidiaries’ production.The rest is sold abroad. Indeed, the need to supplyoverseas subsidiaries with partly-processed inputsand capital equipment and to carry out R&D has beenclaimed to create jobs in the United States. One studyconvincingly supporting this conclusion, by RobertLipsey, found that for US multinationals, the higherthe share of overseas operations in the firm’s totalproduction, the larger the share of employment athome. The same study suggests that without the FDI,the US market share would have been taken by othercountries’ multinationals. In other words, US foreigninvestment has a strategic element and has helped theUnited States retain its share of markets, even thoughthe importance of goods supplied from the UnitedStates itself has declined; foreign subsidiaries havehelped US firms retain markets, and, thereby, R&Dand factor-supply-related jobs at home.Clearly, there is more to production-location decisionsthan wages. Overall unit labor costs can be loweven when wages are high if workers have high productivity.As long as US workers are more productive,jobs will not be exported. Of course, this requiresinvestment in education as well as in physical capital.Therefore, if there is a danger of losing jobs, it comesfrom educational and investment levels in the UnitedStates versus those levels abroad, not from globallysuccessful US multinationals.Source: Based on Robert Lipsey, ‘‘Outward Direct Investmentand the US Economy,’’ National Bureau of EconomicResearch, Paper Number 4691, 1994, and M. Blomströmand Ari Kokko, ‘‘Home Country Effects of Foreign DirectInvestment: Evidence from Sweden,’’ National Bureau ofEconomic Research, Paper Number 4639, 1994.markets threatened by new entrants. In this wayjobs at home – those supplying partly processedinputs and R&D – are protected.Also on the positive side, MNCs have transferredtechnology and capital to less-developed countries(LDCs), and in this way helped accelerate theireconomic development. 34 US- and Japanese-basedMNCs have been particularly active building productionfacilities in LDCs. 35 For example, USmultinationals’ influence in Latin America has been34 However, many have argued that the transferredtechnology is often inappropriate.35 To the extent MNCs provide training, they may also add tothe stock of human capital in LDCs.& 392particularly strong. 36 The Japanese MNCs’ influencehas also risen, particularly in Asian LDCs. 37Homogenization of cultureThere is little doubt that MNCs spread a commonculture. Chain hamburger outlets become the sameon Main Street in Iowa and on the Champs-Elyséesin Paris. Soft drink bottles with a familiar shape can36 Magnus Blomstrom, Irving Kravis, and Robert Lipsey,‘‘Multinational Firms and Manufactured Exports fromDeveloping Countries,’’ National Bureau of EconomicResearch, Working Paper 2493, June 1988.37 See Blomstrom, Kravis, and Lipsey, ibid.
MULTINATIONAL CORPORATIONSwash up on any beach with no way of telling fromwhich country they came. Hotel rooms are alikeeverywhere. The same corporate names andproduct names appear in every major Westernlanguage. Even architecture shows a commoninfluence – the ‘‘international style.’’ Many havedecried this development, complaining that it isrobbing the world of a good deal of its variety andlocal interest. Yet the local people demand theproducts of the MNCs. This is all part of theunending love–hate relationship between concernedpeople everywhere and the MNC.TRANSNATIONAL ALLIANCESMNCs own and control their overseas operations.An alternative to ownership which still allowscompanies to enjoy some of the benefits of multinationalizationis the formation of transnationalalliances. These alliances involve associations offirms in different countries working together toovercome the limitations of working alone. Onemotivation to form a transnational alliance iscooperation over research where costs and risksmay be too high for any one firm, or where differentfirms may possess different abilities. Such alliancesare popular in biotechnology and computers:Quadra Logic of Canada with American Cyanamidein genetic engineering, for example, and IBM withSiemens of Germany in memory-chip development.Cooperation may be between producers and marketers:Chrysler marketed the Colt produced byMitsubishi; GM marketed the Geo produced inKorea. Other cooperations have involved design,product assembly, component production, anddistribution.The extent and complexity of transnationalalliances can be found by writing the names of theglobal members of any industry in matrix form on asheet of paper. Lines can then be drawn to representcontacts, whether these are joint ventures, licensingarrangements, production agreements, or researchconnections. Doing this for computer firms orautomobile manufacturers shows an intimate cobwebof tangled connections. Pharmaceutical, aerospace,telecommunications, and defense industryalliances also reveal a highly complex web.Transnational alliances appear to be formed mostfrequently for three reasons:1 to gain access to foreign markets2 to exploit complementary technologies and3 to reduce the time taken for innovation. 38The alliances are usually for specific purposes,although once formed, they may be used for furtherpurposes. Typically, ownership connections arelimited, unlike the consortia so popular in Japan,called keiretsu, and in South Korea, calledchaebols. Keiretsu and chaebols involve ownershipcross-holdings not usually present with transnationalalliances. Transnational alliances are acompromise between a firm doing everything itself,and dealing with a complete stranger. 39 As such,they are somewhere between independent nationaloperations and multinational corporations.SUMMARY1 MNCs have grown by making FDIs.2 Among the reasons MNCs have made direct investments are to gain access to rawmaterials, to integrate operations for increased efficiency, to avoid regulations, to38 See Multinational, a supplement in The Economist, March 27, 1993, pp. 14–17.39 Ibid.393 &
INTERNATIONAL INVESTMENT AND FINANCINGprotect industrial secrets and patents, to expand when domestic opportunities areexhausted, avoid tariffs and quotas, to increase production flexibility and thereby profitfrom fluctuations in real exchange rates, to preempt others entering a market, to followclient MNCs, and to increase diversification.3 MNCs are generally larger and more R&D-intensive than firms in general. Thesedifferences are characteristic both of the industries in which MNCs are found, and of theMNCs versus other firms within the same industries.4 MNCs face two measurement problems to a greater degree than other firms, namelymeasuring transfer prices and country risks.5 For maximum overall corporate profits and correct buy-versus-make decisions,transfer prices should be set equal to marginal costs. This means that the use of marketprices as transfer prices is appropriate only if the market for intermediate products isperfectly competitive.6 If intermediate-product markets are not perfectly competitive, prices will exceedmarginal costs, and so, by using market prices of intermediate products, less than theoptimal final output will be produced, and suboptimal use will be made of the MNCs ownintermediate products.7 Even if market prices equal marginal costs, so that transfer prices can be set equal tomarket prices, if divisional profits are calculated using these transfer prices, thensupplying divisions may appear to be unprofitable even when they add to overall corporateprofitability.8 Transfer prices can be used to reduce political risk, taxes, foreign exchange losses, theimpact of tariffs and quotas, and shareholder frustration resulting from fluctuatingprofits. Offsetting the gains from distorting transfer prices is the loss from losinginformation on divisional profitability.9 Country risk is a broader concept than either political risk or sovereign risk. Country riskincludes economic and social risk, as well as risk faced on private-sector investments.10 There are a number of published rankings of country risks and political risks which canhelp in evaluations of direct investments.11 Political risk can be reduced by keeping control of essential operations, by havinga program of planned divestment, or by the use of local debt. Joint ventures canalso reduce political risk, but they can backfire with changes in polarized hostgovernments.12 Losses from political events can be reduced or eliminated by buying investmentinsurance. In the United States, this is available from the Overseas Private InvestmentCorporation (OPIC).13 MNCs have brought numerous problems. They can make it difficult to manage aneconomy; they may be able to defy the political directions of their own or foreigngovernments; they can concentrate skilled jobs at home and more menial jobsabroad. MNCs may also be able to manipulate prices and spread a commonculture.14 Transnational alliances are associations of firms from different countries working incooperation. They are particularly common in the computer, biotechnology,pharmaceutical, defense, and automobile industries where they give access to foreignmarkets and/or permit the sharing of technology.& 394
MULTINATIONAL CORPORATIONSREVIEW QUESTIONS1 Why might a producer want to own resources located in another country, rather than buythem in the open market?2 What are the limitations of licences as an alternative to FDI?3 Why are some accounting firms multinationals?4 What role do market imperfections play in FDI?5 What is a transfer price?6 Can a company set any transfer prices that it wishes?7 What is meant by ‘‘country risk,’’ and how does this risk differ from political risk?8 How does country risk differ from sovereign risk?9 How does expropriation differ from confiscation?10 Why does local debt or equity help reduce country risk?11 Is country risk the same for all industries and firms?12 What is a transnational alliance?ASSIGNMENT PROBLEMS1 What examples can you list of foreign multinationals operating in the United States?2 Which of the reasons for the growth of MNCs do you think are the primary reasons for thedevelopment of multinationals in the following industries?a Pharmaceutical development and manufacturingb Automobile manufacturingc Metal refiningd Hotel operatione Commercial bankingf Energy developmentg Fast foodh Fashion clothing.3 Which explanation(s) of the growth of MNCs is/are supported by the evidence that MNCsare relatively capital intensive?4 What are the pros and cons of setting transfer prices equal to marginal costs?5 Under what circumstances are market prices appropriate to use as transferprices?6 How can conflicts exist when a firm sets transfer prices for maximizing overall profits?Could these conflicts arise from differential tax rates, import tariffs, imminent changes inexchange rates, and political risks?7 Why are risk premiums on bonds a useful way of ranking risks for direct investments, butnot very useful for making bond purchasing decisions?8 Why might country risk depend on the diversity of exports as well as on the value ofexports versus debt-service payments?395 &
INTERNATIONAL INVESTMENT AND FINANCING9 In what ways might country risk be influenced by a country’s political and economicassociations and its geography?10 Do you think the standard of living overseas has been raised by the direct investments ofmultinationals? Does this provide a reason for offering MNCs concessionary loans?BIBLIOGRAPHYAliber, Robert Z., The Multinational Paradigm, MIT Press, Cambridge, MA, 1993.Bird, Graham, ‘‘New Approaches to Country Risk,’’ Lloyds Bank Review, October 1986, pp. 1–16.Calverley, John, Country Risk Analysis, Butterworths, London, 1985.Calvet, A. Louis, ‘‘A Synthesis of Foreign Direct Investment Theories and Theories of the Multinational Firm,’’Journal of <strong>International</strong> Business Studies, Spring/Summer 1981, pp. 43–59.Casson, Mark, The Firm and the Market: Studies on the Multinational Enterprise and the Scope of the Firm,MIT Press, Cambridge, MA, 1987.Davidson, William H., ‘‘Location of Foreign Direct Investment Activity: Country Characteristics and ExperienceEffects,’’ Journal of <strong>International</strong> Business Studies, Fall, 1980, pp. 9–22.Dunning, John H. (ed.), <strong>International</strong> Investment, Penguin, Harmondsworth, UK, 1972.——, Economic Analysis and the Multinational Enterprise, Praeger, New York, 1975. The Economist:Multinationals, a supplement, March 27, 1993.Goldberg, Michael, Robert Heinkel, and Maurice D. Levi, ‘‘Foreign Direct Investment: The Human Dimension,’’Journal of <strong>International</strong> Money and <strong>Finance</strong>, forthcoming, 2005.Granick, David, ‘‘National Differences in the Use of Internal Transfer Prices,’’ California Management Review,Summer 1975, pp. 28–40.Kobrin, Stephen J., ‘‘The Environmental Determinants of Foreign Direct Investment: An Ex Post EmpiricalAnalysis,’’ Journal of <strong>International</strong> Business Studies, Fall 1976, pp. 29–42.Magee, Stephen P., ‘‘Information and the Multinational Corporation: An Appropriability Theory of Direct ForeignInvestment,’’ in Jagdish N. Bhagwati (ed.), The New <strong>International</strong> Economic Order, MIT Press, Cambridge,MA, 1977.Melvin, Michael and Don Schlagenhauf, ‘‘A Country Risk Index: Econometric Formulation and an Application toMexico,’’ Economic Inquiry, October 1985, pp. 601–19.Ragazzio, Giorgio, ‘‘Theories of the Determinants of Direct Foreign Investment,’’ IMF Staff Papers, July 1973,pp. 471–98.Reich, Robert B., The Work of Nations, Knopf, New York, 1991.Rummel, R. J. and David A. Heenan, ‘‘How Multinationals Analyze Political Risk,’’ Harvard Business Review,January/February 1978, pp. 67–76.Vernon, Raymond, Storm Over the Multinationals: The Real Issues, Harvard University Press, Cambridge,MA, 1977.Wei, Shang-Jin, ‘‘How Taxing is Corruption on <strong>International</strong> Investors?’’ Review of Economics and Statistics,February 2000, pp. 1–11.& 396
Chapter 18<strong>International</strong> dimensions oflong-term financingLet us all be happy and live within our means, even if we have to borrow the money to do it with.Artemus WardThe integration and associated globalization ofcapital markets has opened up a vast array of newsources and forms of financing. Today’s corporatetreasurers of large multinational as well as domesticcorporations can often access foreign capital marketsas easily as they can access those at home. Thischapter considers these broadened opportunities byexplaining the central international financial issuesinvolved in each of the major methods of raisingfinancial capital, some of which are unique to theinternational sphere. We consider the internationalaspects of raising capital via stocks, bonds, parallelloans between corporations, credit swaps betweenbanks and corporations, and loans from host governmentsand development banks. We shall see theimportance of exchange-rate risk, taxes, countryrisk, and issuance costs for the form of financingchosen. The chapter concludes with a discussionof the appropriate relative amounts of each typeof financing, that is, the appropriate financialstructure.EQUITY FINANCINGThe principal international financial question concerningequity financing is in which country stocksshould be issued. A second question concerns thelegal vehicle that should be used for raising equitycapital; should this be done by the parent companyor by a subsidiary, and if by a subsidiary, whereshould it be registered?The country in which sharesshould be issuedClearly, shares should be issued in the country inwhich the best price can be received, net of issuingcosts. If for the time being we assume the costs ofissue to be the same everywhere, the country inwhich the best price can be received for the shares isthe country in which the cost of equity in terms ofthe required expected rate of return for investors islowest. There is no concern about risk from theequity issuer’s perspective, other than to the extentthat through equity buyer’s concern for systematicrisk, the riskiness of shares issued affects therequired expected rate of return and hence theprice received for the shares; the required expectedrate of return of shareholders is, of course, theexpected rate of return paid by the firm.It should be clear from our discussion of equityinvestment in Chapter 15 that if internationalcapital markets are integrated, the expected cost ofequity financing will be the same in every country.397 &
INTERNATIONAL INVESTMENT AND FINANCINGThat is, the expected return on the company’sshares will be the same everywhere. 1If capital markets are segmented, the expectedreturns on the same security could be different indifferent markets. A company might then be able toreceive more for its shares in some markets thanothers. Of course, when a company’s shares arelisted simultaneously in different countries, theshare price measured in a common currency willhave to be the same everywhere up to the transactioncosts of arbitrage. Otherwise, the shares willbe bought in the cheaper market and sold inthe more expensive market until the price differencehas been eliminated. However, the cause of thecapital-market segmentation may prevent arbitrage.Furthermore, a company may not be consideringsimultaneous issue in different countries, butrather, a single country in which to float an issue.Ceteris paribus, when capital markets are segmented,the higher the savings rates relative toinvestment rates in a particular country, the loweris the cost of capital in that country. This means,for example, that a country such as Japan, whichhas a high savings rate, should have a lower costof financial capital than the United States, whichhas a low savings rate, provided that investmentopportunities are similar. Of course, if marketsare integrated, we shall not see these differentcosts of capital, because those countries whichwould have had low costs of capital in segmentedmarkets would have outflows of capital until therates of return are the same as elsewhere: theoutflows reduce the supply of funds, therebyforcing up rates of return. Similarly, those countrieswhich would have had high costs of capitalwith segmentation would have inflows of capitaluntil their rates of return are the same as elsewhere:the inflows add to the supply of funds and1 The expected return must, of course, be in terms of a givencurrency. For example, the expected average annualUS-dollar rate of return on shares trading in, forexample, Britain includes the expected appreciation/depreciation of the pound as well as the expected changein the pound price of the shares and the expected dividendyield.& 398bring down the cost. 2 This was seen graphically inAppendix B in Chapter 1.EuroequitiesSometimes, as a result of capital-market segmentation,it can be advantageous for a company to issueshares in one or more foreign markets at the sametime as it issues shares at home. The reason is thateach individual market can absorb only a limitedamount of the new share issue. In other words,there is a downward-sloping demand curve for theshares in any one country, so selling more requiresa lower share price which in turn implies a higherexpected return. Share issues involving sales of newshares outside the home country are calledEuroequity issues. In the 1980s, the number ofEuroequity issues grew rapidly and has continuedto grow as globalization of financial markets hasproceeded. For example, in May 1988, OccidentalPetroleum floated $212 million of Euroequities,this being 18 percent of the company’s total shareissue. In May 1987, US Air floated $90 million ofEuroequities, 20 percent of its total issue, and inSeptember 1986 Home Shopping Network sold$56.1 million of shares in the Euromarket, 50 percentof its share offering. Euromoney Magazine documentsthese and further issues on a regular basis.What is the source of market segmentation thathas prompted so many companies to raise equitycapital by sales in foreign equity markets, ratherthan issue all the shares at home and allow foreignshareholders to buy their shares in that market?In other words, what is limiting the ability orwillingness of foreign investors to buy shares inthe company’s home market instead of in theEurodollar market? As Exhibit 18.2 explains, onepossible explanation is the preference of manynon-American investors for the anonymity enjoyed2 Claims have been made that costs of capital in the UnitedStates and Japan have not moved together from internationalfinancial flows, with Japanese firms facing lower financingcosts. However, as Exhibit 18.1 explains, borrowing costdifferences may be smaller than many people believe.
LONG-TERM FINANCINGEXHIBIT 18.1OVERSTATING DIFFERENCES: US–JAPANESE BORROWINGCOSTS MORE SIMILAR THAN IT SEEMSTheory suggests that borrowing costs, or moregenerally, the costs of capital, should be equal indifferent markets after allowance for exchange rates.Indeed, Chapter 8 was devoted to showing this, in theform of the interest-parity principle. Nevertheless,many people have claimed that vital differences incosts of capital exist, especially between Japan andthe United States, with Japanese capital costs wellbelow those faced by Americans. Were this to be so, itwould give an advantage to Japanese firms, especiallyin capital-intensive industries. However, as the itembelow argues, the appearance of a lower cost ofcapital in Japan than the United States, specificallyfor bank borrowing, may be due to an incompleteunderstanding of institutional arrangements in thesetwo countries.Few subjects in international economics havetouched as many political nerves in recent years asthe comparison of relative financing costs in differentcountries. The apparent financing advantageenjoyed by Japanese firms over their U.S.competitors in past decades – short-term realbank loan rates 1 percent to 2.8 percent lower,according to some research – even has been citedas evidence of ‘‘unfair trade’’ that should beredressed by changes in U.S. policy. But a newNBER (National Bureau of Economic Research)study by Richard Marston shows that bankfinancing costs in Japan were underestimatedsystematically, and those in the United Statesoverestimated, in the past. In any event, Marstonfinds, most of the reported gap in financing costsbetween the two countries can be traced to featuresof national markets that have largely disappeared.In ‘‘Determinants of Short-Term Real InterestDifferentials Between Japan and the United States’’(NBER Working Paper No. 4167), Marston focuseson bank loan financing, which continues to be themost important source of external finance forJapanese firms. He finds that interest rates in Japanwere governed by market conventions and regulationsthat often obscured the true cost of funds. Priorto 1989, the most widely reported lending rate wascalled the ‘‘standard rate.’’ This was defined as therateon loans of ‘‘especially high credit standing’’ andwas tied through informal guidelines to the Bank ofJapan’s discount rate. The cost of borrowing at thisrate was understated because Japanese banks typicallyrequired that borrowers maintain compensatingbalances on deposit, raising the effective cost ofthe loan. For most of the 1970s, the only short-termrate free to reflect monetary conditions was the‘‘gensaki’’ rate, paid on repurchase agreements.Between1973and 1991, the standardrateaveraged5.96 percent while the gensaki rate averaged 6.99percent: more than one percentage point higher.Measuring the true cost of bank loans in theUnited States is also difficult. The meaning of thewidely quoted ‘‘prime rate’’ (the rate at which bankstraditionally lent to their most creditworthy customers)has changed fundamentally as borrowersgained greater access to direct financing from the1970s onward. Marston finds that, from 1973 to1991, the average gap between the prime rate andthe rate at which creditworthy firms could borrow onthe commercial paper market was 1.57 percent.Source: ‘‘Japan and U.S. Real Interest Rates Converge,’’The NBER Digest, February 1993.with bearer shares. (US shares sold in Euromarketsare bearer shares, which means that they donot carry the name of the owner. US shares sold inUS markets are all registered in the owners’ names,with the registration changed when the shares areexchanged.)Investor protection and disclosurerequirementsJust as US firms have found it beneficial to sell sharesabroad, non-US firms have found it beneficial to sellshares in US stock markets. What is the cause of399 &
INTERNATIONAL INVESTMENT AND FINANCINGEXHIBIT 18.2GOING ABROAD: THE APPEAL OF EUROEQUITIESIf capital markets are integrated it does not matter inwhich country a company issues shares; people willbuy them wherever they live. The fact that US companieshave sold some of their shares overseas is evidencethat markets are not fully integrated, posing theimportant question of why this is so. In a survey of theChief Financial Officers (CFOs) of large firms issuingEuroequities during 1985–88, Wayne Marr, JohnTrimble, and Raj Varma found an answer. As theexcerpt below indicates, they found that the preferencefor bearer shares by non-US investors and therequirement of the US Securities Exchange Commission(SEC) that US-based shares be registered inthe owners’ names has encouraged some large UScompanies to sell shares in the Euromarket.On more than 200 occasions since 1985, Americancorporations have raised capital with a new kind ofequity offering made available simultaneously toU.S. and foreign investors. Such ‘‘Euroequity’’issues have also been considerably larger, onaverage, than traditional domestic offerings duringthe same period. It’s true that U.S. companies havelong had the option of listing their stock on foreignexchanges, and thus expanding the potential marketfor their securities. But, for all except a handfulof the American firms, such listings have not proveda cost effective method of raising new equity.What is behind the rise and rapid growth ofthese overseas equity sales? In an informal surveyof the CFOs of U.S. issuers, we found the mostcommon reason for choosing Euroequity was ‘‘totake advantage of our good name in overseasmarkets.’’ But what does this mean? The financingadvantages of having a ‘‘good name in overseasmarkets’’ may be various and thus difficult toquantify. But presumably chief among them is thatEuropean investors are willing to pay a higherprice for the company’s shares – or, alternatively,their added demand enables the issuer to sell agreater quantity of its shares than otherwisewithout being forced to drop the price.For financial economists, however, such analleged financing bargain is puzzling. The existenceof a price differential large enough to influence thefinancing decisions of U.S. corporations appears torun counter to the conventional economic wisdomthat international capital markets are becomingprogressively more ‘‘integrated.’’ And such integrationin turn implies that the free flow of capitalacross international boundaries should erase allbut minor and momentary differences in capitalcosts. How, therefore, does one explain the suddenpopularity of Euroequity? And are there genuineequity cost savings for corporate issuers?[T]he findings of our recently completed studyof 32 Euroequity issues by non-financial firmsbetween 1985 and 1988 [reveal] market-basedevidence of significant savings by issuers ...[A]nexplanation for these savings – one that centers onrecent changes in U.S. tax laws and TreasuryDepartment regulations – [is] that Euroequitiesallow overseas investors to hold bearer shares inU.S. corporations. Thanks to new registrationprocedures cleared by the SEC, such bearer sharescan often be made as liquid as the registered sharestraded in U.S. capital markets.Source: Wayne Marr, John L. Trimble, and Raj Varma,‘‘Innovation in Global Financing: The Case of EuroequityOfferings,’’ Journal of Applied Corporate <strong>Finance</strong>, Spring1992, pp. 50–4.segmentationthatpreventsordiscouragesAmericansfrom buying shares of non-US firms in foreign stockmarkets? One possible explanation is US reportingrequirements that, in accordance with the SecuritiesExchange Act of 1934, require all companies listingon US exchanges to disclose information conforming& 400to US Generally Accepted Accounting Principles(GAAP). If investors value the security provided bythe disclosure requirements, then more shares maybe sold by issuing shares in the United States. Inother words, it is probably because US reportingrules are more stringent than those of some foreign
LONG-TERM FINANCINGstock exchanges that so many foreign firms havefound it necessary to list in the United States to tapthe huge US equity market; American and othernationals would otherwise be more wary aboutbuying the stocks.The relevance of disclosure requirements andassociated shareholder protection has been studiedin a series of papers by Rafael La Porta and hisco-researchers. 3 By examining the financial marketdevelopment and investor protection levels in asample consisting of 49 countries, it was shown thatthe presence of legally enforceable rules protectingshareholders and the quality of enforcement areimportant determinants of external finance. Specifically,countries with weaker rules and poorerenforcement were found to have smaller and narrowerfinancial markets: poor investor protection,by limiting funds coming to financial markets, forcesfirms to use their own income to finance furtherexpansion. The conclusions concerning externalfinance were true for debt as well as equity. Thestudy also showed that common law countries, suchas the United States and United Kingdom, havestronger investor protection and more developed,broader capital markets, especially when comparedto countries operating on the Napoleonic Code.Indeed, the relevance of investor protection issufficiently strong that it has been associatedwith variations across countries in their rates ofeconomic growth: better investor protection isassociated with faster economic growth. 4 On the3 See Rafael La Porta, Florencio Lopez-De-Silanes, AndreiShleifer, and Robert W. Vishny, ‘‘Legal Determinantsof External <strong>Finance</strong>,’’ Journal of <strong>Finance</strong>, July 1997,pp. 1131–50.4 See, for example, Ross Levine and Sara Zervos, ‘‘StockMarkets, Banks, and Economic Growth,’’ AmericanEconomic Review, June 1998, pp. 537–58, and, AsliDemirgue-Kunt and Vojislav Maksimovic, ‘‘Law,<strong>Finance</strong>, and Economic Growth,’’ The Journal of <strong>Finance</strong>,December 1998, pp. 2107–37. See also the survey by RossLevine, ‘‘Financial Development and Economic Growth:Views and Agenda,’’ Journal of Economic Literature, June1997, pp. 688–726, and Raghuram Rajan and LuigiZingales, ‘‘Financial Dependence and Growth,’’ AmericanEconomic Review, June 1998, pp. 559–86.other hand, it has also been argued that, at least inprinciple, when investors are better protected theymay feel the need to save less, and this could workagainst economic growth since less savings meansless available to borrow. 5 The empirical evidence,however, supports the positive association of fastergrowth with better investor protection.American Depository Receipts (ADRs)While some non-US firms have listed on US stockexchanges – mostly the New York Stock Exchangeand NASDAQ – the shares of many more foreignfirms trade indirectly as American DepositoryReceipts (ADRs). The idea of trading ADRsoriginated with the Morgan Guarantee Bank, butnumerous other US banks, including Citibank,Chase Manhattan, and the Bank of New York, havebecome involved. What happens is that the bankholds the foreign shares, receives dividends,reports, and so on, but issues claims against theshares it holds. 6 These claims – the ADRs – thengenerally trade in the relatively unregulatedover-the-counter market. This has the advantage forforeign firms of reducing listing fees and the informationthat they must report.Issue costsWhen we mentioned that the highest price a firmcould obtain for its shares, net of issuance costs, is inthe market with the lowest required rate of return,we assumed that the costs of issue are the sameeverywhere. The correct rule for where to issueshares is that they should be sold where the price netof issue costs is the highest.In fact, issue costs do vary from country tocountry and can be an important consideration. Thecosts of underwriting can be several percent of5 See Michael B. Devereux and Gregor W. Smith,‘‘<strong>International</strong> Risk Sharing and Economic Growth,’’<strong>International</strong> Economic Review, August 1994, pp. 535–50.6 In the terminology of Chapter 15, the bank acts as theglobal custodian.401 &
INTERNATIONAL INVESTMENT AND FINANCINGthe value of funds raised and can vary significantlybetween different countries’ markets. Generally,the lowest costs are faced in large equity marketssuch as those of the United States. This may explainwhy a substantial number of foreign companies havesold shares on the New York Stock Exchange andNASDAQ. Indeed, the competitiveness of the USfinancial markets has increased since 1991 when theFederal Reserve Board allowed a subsidiary of JPMorgan to underwrite an initial public offering(IPO) – the first commercial bank underwrittenIPO since the passing of the Glass–Steagall Act of1933. By 1997 the commercial bank share of theIPO market had grown to almost 30 percent. Then,in 1999 the Gramm–Leach–Bliley Act effectivelyremoved the distinction between commercialbanking and investment banking – where the latterwas the traditional equity underwriting institution –meaning even more competition and presumablyeven lower costs by US equity issuing institutions. 7The vehicle of share issueA firm that has decided to issue shares abroad mustdecide whether to issue them directly, or to do soindirectly via a subsidiary located abroad. There isfrequently a motive to use a specially establishedfinancing subsidiary to avoid the need to withhold taxon payments made to foreigners. For example, manyUS firms established subsidiaries in the NetherlandsAntilles and other tax havens to avoid having towithhold 30 percent of dividend or interest incomepaid to foreigners. As was explained in Appendix A ofChapter 16, the US financing subsidiaries tookadvantage of a ruling of the US Internal RevenueService that if 80 percent or more of a corporation’sincome is earned abroad, then dividends and interestpaid by the corporation are considered foreignand not subject to the need to withhold. To theextent that foreign creditors or shareholders of7 See Paige Fields, Donald Fraser, and Rahul Bhargava,‘‘A Comparison of Underwriting Costs of Initial PublicOfferings of Investment and Commercial Banks,’’ Journal ofFinancial Research, December 2003, pp. 517–34.& 402US companies are unable to receive full credit fortaxes withheld, they may be willing to pay more forsecurities issued by US subsidiaries than for thesecurities of the parent company in the United States.BOND FINANCINGThe same two issues arise with bond financing aswith equity financing, namely, (1) the country ofissue and (2) the vehicle of issue. The conclusionsconcerning these matters with bonds are also verysimilar to those we have described above in connectionto equities. In particular, companies tend toissue in markets with relatively full disclosure rulesand strong investor protection because these are themarkets which attract investors. Companies alsochoose markets with relatively low issue costs ofdebt, just as they do when issuing equity. 8 However,an extra international issue does arise withbond financing, namely the currency of issue.The currency of issue is not the same as thecountry of issue, although the two may coincide.For example, if a US company sells a pounddenominatedbond in Britain, the currency of issueis that of the country of issue. However, if a UScompany sells a US-dollar-denominated bond inBritain, the currency of issue is not that of thecountry of issue. In the former of these situationsthe bond is called a foreign bond; in the latter it iscalled a Eurobond. Let us provide a more generaldescription of foreign bonds and Eurobonds.Foreign bonds versus EurobondsA foreign bond is a bond sold in a foreign country inthe currency of the country of issue. The borrower is8 See Darius P. Miller and John J. Puthenpurackal, ‘‘TheCosts, Wealth Effects, and Determinants of <strong>International</strong>Capital Raising: Evidence from Public Yankee Bonds,’’Working Paper 445, Kelley School of Business, IndianaUniversity, October 2001. A Yankee bond, which is aUS-dollar-denominated bond issued in the United States bya foreign bank or corporation, is a form of a ‘‘foreignbond’’ which is described in the section Foreign bondsversus Eurobonds.
LONG-TERM FINANCINGforeign to the country of issue, hence the name. Forexample, a Canadian firm or a Canadian provincialgovernment might sell a bond in New Yorkdenominated in US dollars. Similarly, a Braziliancompany might sell a euro-denominated bondin Germany. These are examples of foreign bonds,also referred to as Yankee bonds. A Eurobond, onthe other hand, is a bond that is denominatedin a currency that is not that of the country in which itis issued. For example, a US-dollar-denominatedbond sold outside of the United States – inEurope or elsewhere – is a Eurobond, a Eurodollarbond. Similarly, a sterling-denominated bond soldoutside of the United Kingdom is a Eurobond, aEurosterling bond.Foreign bonds are usually underwritten and soldby brokers who are located in the country in whichthe bonds are issued. Eurobonds, on the other hand,are sold by international syndicates of brokersbecause they are generally sold simultaneously in anumber of countries. The syndicates will normallyhave a lead manager which underwrites the largestproportion of the issue, and a number of smallermembers, although some syndicates have co-leadmanagers. The lead managers include MerrillLynch, Goldman Sachs, Union Bank of Switzerland(UBS), Morgan Stanley, Deutsche Bank, JP Morgan,and others. Eurobond issues tend to be very large,and their existence is an indication in itself thatcapital markets are segmented. This is because ifthere was no capital market segmentation, big bondissues could take place in a single market withforeign bond buyers purchasing what they want inthat market. The need to sell parts in differentcountries’ markets suggests that in any individualmarket there is a downward-sloping demand curvefor any particular issue.Selecting the currency of issueWhether a firm issues a foreign bond, a Eurobond,or an ordinary domestic bond it must decide on thebond’s currency of denomination. Of course, withforeign bonds the currency of denomination is thatof the country of issue, so deciding on the currencyof denomination is the same as deciding on thecountry of issue; with Eurobonds the currency andthe country or countries of issue must both bedecided.Suppose that Aviva is neutral to exchange-raterisk and is choosing between denominating a bondin pounds or in dollars. 9 For simplicity, let usassume all payments are made at maturity. 10Writing r $ for the annual interest cost of a dollardenominatedbond, Aviva’s eventual payment on ann year bond per dollar raised is$ð1 þ r $ Þ nEach $1 raised by selling a pound-denominatedbond means raising £1/S($/£). Assuming again thatall payments are made at maturity, Aviva’s paymentin terms of pounds per dollar raised on an n yearbond is1£Sð$/£Þ ð1 þ r £Þ nwhere r £ is the annual interest cost on a pounddenominatedbond. The expected dollar cost of thispayment is$ S n ð$/£ÞSð$/£Þ ð1 þ r £Þ nwhere S n ($/£) is the expected exchange rate at theend of year n. 11 Aviva will prefer issuing the pounddenominatedbond if the eventual expected cost isless, that is, ifS n ð$/£ÞSð$/£Þ ð1 þ r £Þ n < ð1 þ r $ Þ nð18:1Þ9 Later we drop the assumption of risk neutrality and showhow having pound receivables can make pound borrowingpreferred on grounds of foreign exchange exposure and riskreduction.10 lf we drop this assumption and allow for periodic coupons,the algebra is more complex but the conclusion is the same.11 We use the expected future spot rate rather than theforward rate because forward cover may not be availablefor the maturity of a long-term bond. Of course, so farwe have assumed Aviva is neutral to any exchange-raterisk involving the bond.403 &
INTERNATIONAL INVESTMENT AND FINANCINGWritingS n ð$/£Þ Sð$/£Þ ½ 1 þ _S ð$/£ÞŠ nwhere _S ($/£) is the expected average annual rateof change of the spot exchange rate, inequality(18.1) becomes½1 þ _S ð$/£ÞŠ n ð1 þ r £ Þ n < ð1 þ r $ Þ nTaking the nth root of both sides,½1 þ _S ð$/£ÞŠð1 þ r £ Þ < ð1 þ r $ ÞExpanding the left-hand side, canceling the ones,and ignoring the cross-product term _S ($/£) r £ ,gives 12r £ þ _S ð$/£Þ < r $ð18:2ÞThat is, if inequality (18.2) holds and the company isrisk neutral, Aviva should denominate its bond inthe pound rather than the dollar. (If Aviva sells apound bond in Britain, the bond is a foreign bond,and if it sells the pound bond in some country otherthan Britain, it is a Eurosterling bond.) Alternatively,if interest rates and expected exchangerates are such thatr £ þ _S ð$/£Þ > r $ð18:3ÞAviva should sell a US-dollar-denominated bond,whether this be sold in the United States, making itan ordinary domestic bond, or outside the UnitedStates, making it a Eurodollar bond.For example, suppose as before that Aviva is riskneutral and the borrowing costs and Aviva’sexpected change in the exchange rate are as follows.r $ r £_S ($/£)10% 14% 5%That is, Aviva sees a higher borrowing cost for thefirm on pound-denominated bonds, but also expects12 As we have noted before, the cross-product term istypically very small: it is a percent of a percent.& 404a decline in the foreign exchange value of the poundagainst the dollar of 5 percent per annum over thelife of the bond. It would be advantageous todenominate in terms of pounds, assuming Aviva isnot averse to risk involving exchange rates, becausein the exampler $ > r £ þ _S ð$/£ÞEx post, the actual exchange rate will often change bya considerable amount over the life of a bond,creating a potential for sizable gains or losses. Inother words, actual changes can deviate markedlyfrom the changes which had been expected by thefirm. History is full of examples of currencies whichhave changed in value against the dollar by substantialamounts. Even some of the major currencieshave moved considerably in value over a number ofyears. Relatively small annual changes in exchangerates build up into very large changes over the life oflong-term bonds.To show how great the mistake can be, we canexaminetheresultsofasurveybyWilliamR.Folks,Jr,and Josef Follpracht. These results are shown inTable 18.1. Folks and Follpracht examined the costof a number of foreign-currency denominatedbonds issued by US-based multinational firms overthe period July 1969–December 1972. The tableallows us to compare the coupon rates with theeventual effective annual costs computed as ofMarch 1976 or at the bonds’ maturities. We can seethat the appreciation of the German mark, Swissfranc, Dutch guilder, and Luxembourg franc madethe borrowing costs of bonds considerably higherthan the rates given by the coupons. We cannot tellwhether the costs were high compared with thedollar rates that were available when the bondswere originally sold, but there is reason to believethat they were. The only foreign-currency bondwhich turned out to offer a lower cost than thecoupon rate as of the end of the study was thepound-sterling bond issued by Amoco. The fall invalue of the pound reduced the effective dollarrepayment cost by over 2.7 percent per annum. Theconclusion of any study like this depends on where
LONG-TERM FINANCING& Table 18.1 Costs of foreign-currency bondsCurrency Issue Coupon rate%/yearDeutschemark Studebaker-Worthington 7 1 414.69<strong>International</strong> Standard Electric 7 12.31TRW 7 1 212.38Tenneco 7 1 212.33Tenneco 7 3 412.77Kraftco 7 1 212.27Continental Oil 8 15.83Transocean Gulf 7 1 212.50Firestone 7 3 411.83Philip Morris 6 3 49.87Goodyear 7 1 410.44Teledyne 7 1 410.44Swiss franc Burroughs 6 1 412.31Standard Oil (California) 6 1 412.42Goodyear 7 13.69American Brands 6 1 213.08Texaco 6 3 413.37Cities Services 7 1 419.27Dutch guilder General Electric 8 1 420.08GTE 8 1 419.44IBM 8 16.46Cities Service 8 17.65<strong>International</strong> Harvester 8 17.65Philip Morris 7 1 212.67Sperry Rand 6 1 210.44Holiday Inns 6 1 210.62Teledyne 6 1 410.27Standard Brands 6 1 210.85Textron Atlantic 6 3 411.21Pound Sterling Amoco 8 5.29Luxembourg franc <strong>International</strong> Standard Electric 6 1 27.85Before-tax cost ofborrowing, %/yearSource: William R. Folks, Jr, and Josef Follpracht, ‘‘The Currency of Denomination Decision for Offshore Long-Term Debt:The American Experience,’’ Working Paper, Center for <strong>International</strong> Business Studies, University of South Carolina, 1976.the examination ends, but it does show that whatmay appear to be a cheap debt may end up beingexpensive.Because of the potential for large unanticipatedcosts when borrowing by issuing bonds in currenciesthat rapidly appreciate, some nontrivialadvantage may be required before any addedexposure by foreign-currency borrowing is consideredworthwhile. In such a case, our criteria(18.2) and (18.3) need some modification. Forexample, if management determines that any addedforeign exchange exposure and risk will be worth405 &
INTERNATIONAL INVESTMENT AND FINANCINGtaking only with an expected 2 percent saving, wemust revise condition (18.2) to the following.r $ > r £ þ S ð$/£Þ þ0:02ð18:4ÞOnly when (18.4) holds will the expected borrowingcost be sufficiently lower in pounds towarrant borrowing in that currency. For example,if r $ is 10 percent, r £ is 14 percent, and _S ($/£)is 5 percent (a 5-percent-per-annum expecteddepreciation of the pound), then the exposure andrisk of borrowing in pounds will not be warranted,for although the criterion (18.2) is met, the revisedcriterion (18.4) is not.When foreign-currency bonds do add to exposureand risk, the required risk premiums will haveto be established by management. During times ofgreater economic uncertainty and potential volatilityin foreign exchange markets, higher premiumsshould generally be required to compensate for thegreater risk. Borrowing in a foreign currencyinvolves risk because the actual rate of change of theexchange rate, Ṡ($/£) in the dollar–pound case,will in general differ from the ex ante expectation,_S ($/£). If _S($/£) > _S ($/£) this will make theex post borrowing cost greater than the ex ante cost.Forexample,if asbeforewehaver $ ¼ 10percent,r £ ¼ 14 percent, and Ṡ ($/£) ¼ 5 percent, thenby using the straightforward ex ante criteria ininequalities (18.2) and (18.3), we know that the USborrower facing these particular conditions shouldborrow in pounds. Suppose that this is done and thatex post we discover that Ṡ($/£) ¼ 2 percent. Theactual cost of borrowing pounds will ber £ þ _Sð$/£Þ ¼0:14 0:02¼ 0:12, or 12% per annumHaving borrowed in pounds will in retrospect turnout to have been a bad idea vis-à-vis the 10 percentdollar interest rate.In general, if it turns out that, Ṡ($/£) the actualper annum change in the exchange rate, has beensuch thatr £ þ _Sð$/£Þ > r $& 406then we know that borrowing in pounds was amistake. We see that it is necessary to comparethe actual, not the expected, per annum changein the exchange rate with the interest differential.A management-determined risk premium such asthe 0.02 premium we used in writing the revisedcriterion in inequality (18.4) will help to ensurethat correct decisions are made. The larger therequired premiums, the more often the decisionwill in retrospect appear correct, but largerpremiums also mean missing many opportunities,and they will never guarantee ex post correctdecisions.Borrowing with foreign-source incomeThere may be less foreign exchange exposure andrisk involved in foreign-currency borrowing than indomestic-currency borrowing when the borroweris receiving income in foreign exchange and is facinga long exposure in the foreign currency. That is,foreign-currency receivables can require a negativepremium when borrowing in foreign exchangebecause exposure is reduced. We have alreadypointed out in Chapters 9 and 12 that firmsreceiving foreign income can hedge by borrowingforeign funds in the money market. The point iseven more valid with long-term borrowing and isextremely important for firms which have sizableforeign operations. When a steady and predictablelong-term income is received in foreign currency, itmakes sense from a hedging perspective to denominatesome long-term payments in that samecurrency. The amount of debt that should bedenominated in each foreign currency will dependon the size of income in that currency, and also onthe extent that the firm’s income is exposed. As weshowed in Chapter 11, the exposure depends on theelasticity of demand, the flexibility of production,the proportion of inputs that are tradable, and soon. That is, it is not simply a matter of borrowingenough in a foreign currency so that debt paymentsmatch income in the currency, although that wouldbe the case when the foreign-currency income iscontractual.
LONG-TERM FINANCINGAn example of a situation where the sale of bondsdenominated in foreign exchange will reduceforeign exchange exposure and risk involves aCanadian firm that sells Canadian resources inworld markets at contracted amounts in USdollars. 13 If lumber or coal is sold by the Canadianfirm to, for example, the US or Japanese market atprices stated in US dollars, then the firm faces a longexposure in US dollars, and it makes good sensefor the firm to borrow in New York, Europe, orCanada in US dollars. Then the repayments on thedebt can come out of the firm’s US dollar revenues.Alternatively, losses on the dollars earned after aUS dollar depreciation are matched by a gain in theform of reduced debt when this is translated intoCanadian dollars. Similarly, if an Australian manufactureris selling to Japan in yen, it makes sense toborrow with yen-denominated bonds, or if aVenezuelan oil exporter is selling to Chile indollars, it makes good sense to borrow by sellingUS-dollar-denominated bonds in the Eurobondmarket or in the United States.Tax considerationsBond buyers who pay a lower tax rate on capital gainsthan on interest income prefer a dollar of capital gainfrom foreign-currency appreciation to a dollar ofinterest income. This means that if, for example, thedollar-bond interest rate was equal to the yen-bondrate plus an expected appreciation of the yen, the yenbond would be preferred by lenders because itprovides expected capital gain from an appreciationof the yen. Ceteris paribus, bondbuyerswhopayalower tax rate on capital gains than on interestincome prefer bonds denominated in strong currencies– those that the market expects to appreciate.Such bonds provide a higher after-tax return. On theother hand, bond issuers who can deduct the full costof their bonds as an expense of doing business will be13 Most natural-resource exports – oil, coal, gas, minerals,and lumber – are sold at US dollar prices. This reduces theforeign exchange problem for US-based firms that sell orbuy natural resources when compared to foreign firms.indifferent between interest rates and expectedchanges in exchange rate. This will lead to borrowingin strong currencies. Let us explain this byan example. The example assumes a particular taxsituation to illustrate one possibility. Other assumptionswill produce different outcomes.Suppose thatr $ ¼ 12% r ¥ ¼ 5% _S ð$/¥Þ ¼6%t K ¼ 0:2 t Y ¼ 0:4where _S ($/¥) is the expected appreciation of theJapanese yen by both bond issuers and buyers, r ¥ isthe interest rate on yen bonds, t K is the tax rate onforeign exchange gains of bond buyers, and t Y is thetax rate on ordinary income, including interestincome, of both bond buyers and bond issuers. Theafter-tax expected returns from US dollar and yenbonds to bond buyers areDollar bond: ð1 t Y Þr $ ¼ð1 0:4Þ0:12¼ 7:2%Yen bond: ð1 t Y Þr ¥ þð1 t K Þ_S ð$/£Þ¼ð1 0:4Þ0:05 þð1 0:2Þ0:06¼ 7:8%The buyers therefore prefer yen bonds to dollarbonds; they yield more after tax. However, toborrowers who can deduct the full cost of bondfinancing – interest plus exchange-rate movements –against income, the after-tax costs areDollar bond: ð1 t Y Þr $ ¼ð1 0:4Þ0:12¼ 7:2%Yen bond: ð1 t Y Þr ¥ þð1 t Y Þ_S ð$/£Þ¼ð1 0:4Þ0:05 þð1 0:4Þ0:06¼ 6:6%Bond issuers therefore also prefer yen bonds. Wesee that tax factors can explain the popularity ofstrong-currency-denominated bonds – those widelyexpected to appreciate – among bond buyers andbond sellers.407 &
INTERNATIONAL INVESTMENT AND FINANCINGOther bond-financing considerationsIssue costAs is the case with equities, bond flotation costs arelower in some financial markets than in others.Because flotation costs are nontrivial, the differencesin costs between financial markets can influencethe country in which bonds are floated. 14Firms should approach a number of bond underwriterssituated in different countries beforedetermining where to issue bonds. With markets inmost of the European financial centers, as well as inAsia and North America, and with considerablevariation in the flotation costs within and betweenthese financial centers, the benefits of shoppingaround can be substantial.Issue sizeAnother factor bond issuers should consider whenissuing bonds is the size of the issue relative tothe sizes of issues handled in different markets.The New York and London capital markets canhandle very large individual bond issues. In manyof the other capital markets of the world, a $200million bond issue would be considered large, anda $500 million bond issue would be huge. In NewYork or London, such issues are not uncommon.Indeed, the volume of funds handled by some ofthe bigger institutions such as the pension fundsand insurance companies is such that these institutionscan often buy an entire bond issue that isprivately placed with them. Private placementsoffer one the means of reducing issue costs of anintermediary, although of course, an intermediary14 Rodney Mills and Henry Terrell have shown that front-endfees on Eurobonds on an interest-equivalent basis accountfor an average of approximately 20 percent of 1 year’sannual return, and vary between 9 percent and 43 percent.See Rodney H. Mills and Henry S. Terrell, ‘‘TheDetermination of Front-End Fees on SyndicatedEurocurrency Credits,’’ <strong>International</strong> <strong>Finance</strong> DiscussionPaper Number 250, Board of Governors of the FederalReserve System, Washington, DC, undated.& 408will be required to bring the borrowing andlending partners together. The bond-issue sizethat the New York and London markets canhandle and the lower costs of issuing bonds underprivate placement make New York and Londonattractive markets for large American and foreignborrowers, even when the interest cost is a littlehigher than elsewhere. 15Multicurrency bondsTypes of multicurrency bondsNot all Eurobonds are denominated in a singlecurrency. Rather, some Eurobonds are multicurrencybonds. Some multicurrency bonds givethe lender the right to request repayment in one ortwo or more currencies. The amounts of repaymentare often set equal in value at the exchange rates ineffect when the bond is issued. If, during the life ofthe bond, exchange rates change, the lender willdemand payments in the currency that has appreciatedthe most or depreciated the least. Thisreduces the risk to the lender in that it can help himor her avoid a depreciating currency. It does,however, add to the borrower’s risk.A variant of the multicurrency Eurobondusing pre-established fixed exchange rates is theunit-of-account bond, such as the EuropeanCurrency Unit (ECU) bond. The ECU is aweighted ‘‘basket’’ of the fifteen European currenciesthat existed before twelve of the countriesadopted the euro, with interest in the ECU havingbeen greatly diminished by the new commoncurrency. The idea of denominating bonds in a‘‘cocktail’’ of currencies is to reduce the risk fromindividual exchange-rate changes; the currencyunit is a portfolio of currencies and enjoys15 The importance of transaction costs and the size ofborrowing in encouraging Canadian borrowers to look atthe U.S. capital market is examined by Karl A. Stroetmannin ‘‘The Theory of Long-Term <strong>International</strong> Capital Flowsand Canadian Corporate Debt Issues in the United States,’’unpublished PhD dissertation, University of BritishColumbia, 1974.
LONG-TERM FINANCINGEXHIBIT 18.3SPECIAL DRAWING RIGHTS (SDRs)The <strong>International</strong> Monetary Fund describes thevaluation and role of SDRs as follows.The value of the SDR was initially defined asequivalent to 0.888671 grams of fine gold-which,at the time, was also equivalent to one U.S. dollar.After the collapse of the Bretton Woods systemin 1973, however, the SDR was redefined as abasket of currencies, today consisting of the euro,Japanese yen, pound sterling, and U.S. dollar.The U.S. dollar-value of the SDR is posted dailyon the IMF’s website. It is calculated as the sumof specific amounts of the four currencies valuedin U.S. dollars, on the basis of exchange ratesquoted at noon each day in the London market.The basket composition is reviewed every fiveyears to ensure that it reflects the relativeimportance of currencies in the world’s tradingand financial systems. In the most recent regularreview that took place in October 2000, themethod of selecting the currencies and theirweights was revised in light of the introductionof the euro as the common currency for anumber of European countries, and the growingrole of international financial markets. Thesechanges became effective on January 1, 2001.Source: <strong>International</strong> Monetary Fund, Washington, DC.Item is available at http://www.imf.org/external/np/exr/facts/sdr.htmdiversification advantages. Another unit-ofaccountthat is still in use today is SpecialDrawing Rights (SDRs). The SDR is based on thevalue of the US dollar, the euro, Japanese yen,and British pound – the four most widely tradedcurrencies. It is described in Exhibit 18.3.Currency cocktails can offer significantsavings. For example, in January 1981 the rateon a 5-year SDR-denominated bond offered byNordic Investment Bank was approximately11.5 percent, while at the same time the rate ona straight 10-year US dollar bond offered by DuPont of Canada was 13.69 percent, and the rateon a 7-year bond offered by GM’s offshorefinance subsidiary, General Motors AcceptanceCorporation (or GMAC) Overseas <strong>Finance</strong> N.V.,was 12.87 percent. While the rates are notstrictly comparable, the lower rate on the SDRbond shows that investors value the diversificationof individual currency exchange-rate risk providedby currency cocktails. They will be particularlydesirable during unstable times. 1616 For more on SDR bonds, see ‘‘Slimmed-Down SDRMakes Comeback: Techniques Include Opening UpMarket for Negotiable SDR CDs,’’ Money Report, Business<strong>International</strong>, January 16, 1981.The rationale for multicurrency bondsBond buyers can form their own multicurrencybond portfolios by combining different bonds, eachof which is denominated in a single currency.Because this is possible, it is worth asking why somefirms have found it advantageous to issue multicurrencybonds. The answer must be that there arelimitations faced by some bond buyers in formingtheir own portfolios. One possible limitation is thatthe total wealth they have to allocate to bonds is toosmall to achieve significant diversification, which inturn depends on there being economies of scalewhen buying bonds; if the costs do not increase assmaller amounts of bonds are bought, the bondbuyers can form diversified portfolios of separatebonds as cheaply as buying multicurrency bonds.This size-of-wealth limitation may be a major considerationwith bonds, which are frequently soldonly in very large minimum denominations.An example of multicurrency denomination of alease contract rather than a bond involved theAustralian carrier Qantas Airlines. In 1980 Qantasarranged to lease two Boeing 747s from an ownerwho was willing to accept multicurrency payment.The lease required payment in German marks,Dutch guilders, Australian dollars, and pounds409 &
INTERNATIONAL INVESTMENT AND FINANCINGsterling – all currencies that the airline received inits business. With this arrangement, Qantas couldmatch the multicurrency nature of its income withthe payments on the lease. If Qantas had boughtrather than leased the planes, it could have matchedthe currencies of incomes and payments by financingthe planes with a currency-cocktail Eurobondrequiring repayment in the various currencies ofincome.The vehicle of bond issueWhether the bond that is issued is a Eurobond,foreign bond, or domestic bond, and whether it isdenominated in a single currency or in severalcurrencies, a decision must be made either to issuethe bond directly as a liability of the parent company,or to issue it indirectly through a financingsubsidiary or some other subsidiary. Companiesissue bonds via an overseas subsidiary if they do notwant the bonds to be an obligation of the parentcompany. This has the additional advantage ofreducing country risk if some of the subsidiary’sbonds are held locally (see Chapter 17). However,because the parent is almost invariably viewed asless risky than subsidiaries, the reduction in theparent’s liability and also in country risk must betraded off against the fact that the interest rates thatmust be paid are generally higher when having asubsidiary issue bonds.BANK FINANCING, DIRECT LOANS,AND THE LIKESo far we have examined international aspects ofequity and bond financing. We have stated thatgains on selling equity in one market rather thananother or simultaneously in several markets –Euroequities – depend on the segmentation versusintegration of markets. We have also statedthat bonds may be sold in a foreign-currencydenomination in the country using that currency(foreign bonds) or in countries not using thedenomination currency (Eurobonds). The abilityto select the currency of issue can lower& 410borrowing costs but can also introduce foreignexchange exposure and risk because forwardmarkets are not always available for hedging onbonds with long maturities. However, a firmmight actually reduce foreign exchange exposureand risk by borrowing in a foreign currency if ithas an income in that currency.A large part of the financing of foreign subsidiariesof MNCs involves neither bonds norequity. According to a survey of foreign directinvestors by the US Department of Commerce,approximately half of the financing of US-basedMNCs was generated inside the corporation. 17The results of the survey are summarized inTable 18.2. If anything, the true percentage ofinternally generated funds is probably larger thanthe percentage shown because, according to adifferent survey by Sidney Robbins and RobertStobaugh, lending and borrowing by differentsubsidiaries net out in the Commerce Department’sfinancial survey. 18 Robbins and Stobaughestimated that the total for outstanding loans was$14 billion. This amount is much larger than theamount quoted for loans outstanding to the parentcompanies in the Commerce Department’ssurvey. We can note from Table 18.2 that subsidiariesraise little equity. The debt incurred bysubsidiaries is almost 20 times the equity theythemselves raise.When a subsidiary borrows from its parent,because this is a transfer within the MNC, there isno increase in the expected cost of bankruptcywhich is usually considered to be a factor limitingthe debt/equity ratio of a firm. (Firms prefer debtto equity because interest on debt is tax deductible,but too much debt means a higher chance of17 US Department of Commerce, Office of Foreign DirectInvestments, Foreign Affiliate Financial Survey, 1966–69, July1971. This study has not been revised, because the officethat prepared it was eliminated; but the proportion of fundsgenerated within the corporation has probably not changedgreatly.18 Sidney M. Robbins and Robert B. Stobaugh, ‘‘FinancingForeign Affiliates,’’ Financial Management, Winter 1973,pp. 56–65.
LONG-TERM FINANCING& Table 18.2 Sources of funds for subsidiariesBillions of dollarsPercentageFrom within the multinational enterprise 6.1 60Internally generated by affiliate 4.7 46Depreciation 2.9 29Retained earnings 1.7 17From parent 1.4 14Equity 1.0 9Loans 0.5 5From outside the multinational enterprise 4.0 40Loans 3.9 39Equity 0.2 2Total 10.1 100Source: US Department of Commerce, Office of Foreign Direct Investments, Foreign Affiliate Financial Survey, 1966–1969,July 1971, p. 34.bankruptcy.) A subsidiary is able to deduct itsinterest payments from income when computingcorporate tax, while the parent treats the interest asincome. This has an advantage if the subsidiary’s taxrate is higher than that of the parent. However, theincentive to use all intra-MNC debt to finance asubsidiary is limited by the need to rationalize theinterest rate charged to the subsidiary. Accordingto Bhagwan Chowdhry and Vikram Nanda, subsidiariesuse some external debt to justify theinterest rate charged on internal debt. 19According to the survey by Robbins andStobaugh mentioned above, most MNCs prefer touse intra-company credit rather than discretionaryloans. This is because credit requires less documentationthan does a discretionary loan andbecause there are potential gains from avoidance ofwithholding tax on credit advances, whereas withholdingby the foreign government is likely oninterdivisional loans.Some of the earliest work in financing subsidiaries,done by Edith Penrose, revealed a varying19 Bhagwan Chowdhry and Vikram Nanda, ‘‘Financing ofMultinational Subsidiaries: Parent Debt vs. ExternalDebt,’’ Journal of Corporate <strong>Finance</strong>, August 1994,pp. 259–81.financial structure as MNCs’ subsidiaries grewlarger. 20 Penrose argued that after receiving initialhelp from the parent company, subsidiaries moveonto an independent growth path using funds fromretained earnings and local borrowing. James Hineshas suggested that the motivation to provide initialhelp from the parent is limited by the rationalexpectation that rather than repatriate futureincome and pay taxes, multinationals will prefer toreinvest subsidiary income in further expansion. 21This view is consistent with that of Penrose: subsidiaryself-financing expands with time. Hinesargues that the incentive to minimize initial help inorder to preserve future investment opportunitiesfor a subsidiary is highest when foreign corporateincome tax rates are low vis-à-vis parent rates.Some of the debt raised outside companies takeson a character which is peculiarly international. Forexample, only in the international arena do we findthe so-called ‘‘back-to-back’’ or parallel loans.20 Edith T. Penrose, ‘‘Foreign Investment and the Growth ofthe Firm,’’ Economic Journal, June 1956, pp. 220–35.Reprinted in John H. Dunning (ed.), <strong>International</strong>Investment, Penguin Books, Harmondsworth, UK, 1972.21 James R. Hines, Jr, ‘‘Credit and Deferral as <strong>International</strong>Investment Incentives,’’ National Bureau of EconomicResearch, Working Paper w4574, May 1994.411 &
INTERNATIONAL INVESTMENT AND FINANCINGBrazilUSsubsidiaryrealsBrazilianparentUSUSparentdollarsBraziliansubsidiary(a) Parallel loanBrazilUSsubsidiaryrealsUS banksubsidiaryUSUSparentdollarsUSbank(b) Credit swap& Figure 18.1 Parallel loans and credit swapsNotesA parallel loan involves two companies, whereas a credit swap involves one company and a bank. In both cases thecompanies and/or banks are located in two countries. Both types of financing avoid money flows between the countries.Parallel loans are more difficult to arrange than credit swaps because the parties must find each other. In the case ofa credit swap, the parent or its subsidiary contacts a bank.Parallel loansA parallel loan involves an exchange of fundsbetween firms in different countries, with theexchange reversed at a later date. For example,Figure 18.1a shows a situation in which a UScompany’s subsidiary in Brazil needs Brazilian realswhile a Brazilian company’s subsidiary in the UnitedStates needs dollars. The Brazilian firm can lendreals to the US-owned subsidiary in Brazil while itborrows an approximately equivalent amount ofdollars from the US parent in the United States. 22After an agreed-upon term, the funds can be repaid.There is no exchange-rate risk or exposure foreither firm, because each is borrowing and repayingin the same currency. Each side can pay interest22 The loan agreement could just as well involve subsidiariesof the Brazilian and US firms in a different country. Forexample, the US firm might lend the Brazilian firm dollarsin New York, while a German subsidiary of the Brazilianfirm lends euros to a German subsidiary of the US firm.& 412within the country where funds are lent accordingto the relevant going market rates.The advantages of parallel loans over bank loansare that they can circumvent foreign exchangecontrols and that they help avoid banks’ spreads onborrowing versus lending and on foreign exchangetransactions. The problem with parallel loans islocating the two sides of the deals. As in otherbarter-type deals, the needs of the parties must beharmonious before a satisfactory contract can beachieved. While the banks might well know offinancing needs which are harmonious, they havelittle incentive to initiate a deal which avoids theirspreads. Consequently, a large portion of parallelloans are arranged by brokerage houses ratherthan banks.Credit swapsA credit swap involves the exchange of currenciesbetween a bank and a firm rather than between two
LONG-TERM FINANCINGfirms. It is an alternative method of obtaining debtcapital for a foreign subsidiary without sendingfunds abroad. In a credit swap the parent makesfunds available to a bank at home. For example,aUSfirm may place US dollars in an account inNew York. The US bank then instructs one of itsforeign subsidiaries to lend foreign currency to asubsidiary of the parent that made the deposit. Forexample, an office of the US bank in Rio de Janeiromight lend reals to a subsidiary of the US firmoperating in Brazil: see Figure 18.1b. As with parallelloans, a major advantage of credit swaps is thatthey allow firms (and banks) to circumvent foreignexchange controls. In addition, they allow theparent and subsidiary to avoid foreign exchangeexposure: the parent deposits and receivesUS dollars in our example, while the subsidiaryborrows and receives Brazilian reals.GOVERNMENT AND DEVELOPMENT-BANK LENDINGIt is not at all uncommon for financing to be providedby governments or development banks. Becausegovernment and development-bank financing isgenerally at favorable terms, many corporationsconsider these official sources of capital beforeconsidering the issue of stock, the sale of bonds,loans from commercial banks, or parallel loans fromother corporations.Host governments of foreign investments providefinancing when they believe projects willgenerate jobs, earn foreign exchange, or providetraining for their workers. There are numerousexamples of loans being provided to MNCs by thegovernments of, for example, Australia, Britain,Canada, and Spain, to attract manufacturing firms tomake investments in their countries. Sometimes thestate or provincial governments also offer financing,perhaps even competing with each other withina country to have plants built in their jurisdiction.Several US states have provided cheap financing andother concessions to induce Japanese and otherforeign firms to establish operations. Canadianprovincial and Australian state governments havealso used special financing arrangements to attractinvestors.Even though the governments of poorer countriesdo not usually have the means to offer concessionaryfinancing to investors, there are anumber of development banks which specialize inproviding financing for investment in infrastructure,for irrigation, and for similar projects.While this financing is usually provided to the hostgovernment rather than to corporations involved inthe construction of the projects, the corporationsare indirectly being financed by the developmentbankloans to the host governments.A leading provider of financial assistance is the<strong>International</strong> Bank for Reconstruction and Development(IBRD), commonly known as the WorldBank. The World Bank, which was established in1944, is not a bank in the sense of accepting depositsand providing payment services on behalf of countries.Rather, it is a lending institution that borrowsfrom governments by selling them its bonds, andthen uses the proceeds for development in undeveloped(or developing) nations. World Bank orIBRD loans have a maturity of up to 20 years.Interest rates are determined by the (relative low)cost of funds to the bank.Many developing countries do not meet theconditions for World Bank loans, so in 1960an affiliated organization, the <strong>International</strong>Development Agency (IDA), was establishedto help even poorer countries. Credits, as theloans are called, have terms of up to 50 years andcarry no interest charges. A second affiliate ofthe World Bank is the <strong>International</strong> <strong>Finance</strong>Corporation (IFC). The IFC provides loans forprivate investments and takes equity positionsalong with private-sector partners.OTHER FACTORS AFFECTING THEFINANCING OF SUBSIDIARIESWe have presented a number of internationalfinancial considerations affecting bond and equitydecisions and decisions involving bank loans, parallelloans, and credit swaps. There are, however,413 &
INTERNATIONAL INVESTMENT AND FINANCINGa number of other factors which can affect thefinancing decision. Frequently these are based onthe politically sensitive nature of a large amountof FDI. Sometimes, however, they are based onconcern for exchange-rate risk or on restrictionsimposed by host governments. We shall quicklymention some of the more notable factors.The freezing or seizing of assets by inhospitablegovernments should not be a worry to those whoborrow abroad. Instead, it should be a concern tothe investors whose assets are lost. It might thereforebe thought that while political risks areimportant in the investment decision, they arerelatively inconsequential in the borrowing decision.However, some firms may borrow abroad inthe countries of investment because they fear confiscationor expropriation. If assets are seized, thesefirms can refuse to repay local debts and therebyreduce their losses. Furthermore, the probability ofconfiscation or expropriation may be reduced byhaving foreign private bondholders or shareholders.Unfortunately, as we have noted, it may be difficultto raise equity or even debt from local privatesources.Generally, the more financing is denominated inlocal currency of income, the lower the dangerfrom changing exchange rates. This supports the useof debt. Reinforcing the tendency toward usingdebt is the greater political sensitivity with regard torepatriating income on equity than with regard toreceiving interest on debts. However, offsetting thefactors leading to more debt is the fact that if equityis kept small, profits can look unreasonably high onthe equity invested in foreign operations. The profitrate on equity can be used in claims of exploitationby foreign governments.Certain governments require that a minimumequity/debt ratio be maintained, while some banksalso set standards to maintain the quality of debt.According to Sidney Robbins and Robert Stobaugh,US firms have generally kept their equity well abovethat required by local regulations. 23 However, this23 Robbins and Stobaugh, op. cit.& 414does not mean that local regulations are notbinding. Firms may keep their equity higher thannecessary as a cushion against any future need toborrow.When earnings are retained abroad, US corporationscan postpone the payment of US corporateincome taxes and foreign withholding taxes onincome from subsidiaries. According to WalterNess, the saving from the deferral of tax paymentslowers the cost of equity capital for multinationalcorporations and induces the corporations to havea lower debt/equity ratio in financing foreignsubsidiaries. 24 However, according to Ian Giddyand Alan Shapiro, the alternatives for repatriatingincome via pricing of inter-subsidiary trades,royalties, and interdivisional fees override anyadvantage from deferred tax payments encouragingthe use of equity capital. 25FINANCIAL STRUCTURESubsidiary or parent determination offinancial structureIf the success or failure of an overseas subsidiary haslittle or no effect on the ability of the parent orother subsidiaries to raise capital, decisions onfinancial structure can be left to subsidiaries. 26A subsidiary can then weigh the various economicand political pros and cons of different sources offunds and adopt a financial structure that is appropriatefor its own local circumstances. However, if24 Walter L. Ness, Jr, ‘‘U.S. Corporate Income Taxation andthe Dividend Remittance Policy of MultinationalCorporations,’’ Journal of <strong>International</strong> Business Studies,Spring 1975, pp. 67–77.25 Alan C. Shapiro, ‘‘Financial Structure and the Cost ofCapital in Multinational Corporations,’’ Journal of Financialand Quantitative Analysis, June 1979, pp. 211–26;Ian H. Giddy, ‘‘The Cost of Capital in the MultinationalFirm,’’ unpublished paper, Columbia University, 1976.26 By financial structure we mean the composition of a firm’ssources of capital. That is, financial structure involves theamount of equity, versus bond debt, versus bank debt,versus credit swaps, and so on.
LONG-TERM FINANCINGthere are spillovers from the failure of a subsidiarywhich reduce the financing opportunities of theparent or its other subsidiaries, decisions on subsidiaryfinancial structure should be made by theparent. Full consideration should be given to theimplications of a default by one subsidiary for globaloperations. Because spillovers will exist if theparent is legally or morally bound to supportsubsidiaries, we should consider the evidence oncorporate responsibility for subsidiary debt.Survey evidence shows clearly that even whennot bound by legal guarantees on subsidiaryincurreddebt, parent firms rarely if ever admit theywill allow a subsidiary to default. For example, in asurvey by Robert Stobaugh, all 20 of the largeMNCs in the sample, and all but one of the smallerMNCs, said they would not allow a subsidiaryto default whatever the circumstances. 27 Similarresponses were received in later surveys conductedby Business <strong>International</strong>. 28 This evidence suggeststhat multinationals realize that a default in a subsidiarywill affect operations elsewhere. There is noother obvious explanation for the almost universalwillingness to support subsidiaries.With a parent company having a de facto obligationto honor debt incurred by its subsidiaries, theparent must monitor its subsidiaries’ debt/equityratios as well as the corporation’s overall debt/equity ratio. This does not, however, mean thata parent should keep its subsidiaries’ debt/equityratios equal to its own overall preferred debt/equity ratio. For example, subsidiaries facing highcountry risk and no ability to raise local equitycapital might be allowed to take on relatively highdebt loads. Similarly, subsidiaries in countries withrelatively high tax savings from deducting interestbut not dividend payments should be allowed to27 Robert B. Stobaugh, ‘‘Financing Foreign Subsidiaries ofU.S.-Controlled Multinational Enterprises,’’ Journal of<strong>International</strong> Business Studies, Summer 1970, pp. 43–64.28 See ‘‘Policies of MNC’s in Debt/Equity Mix,’’ MoneyReport, Business <strong>International</strong>, 1979, and ‘‘DeterminingOverseas Debt/Equity Ratios,’’ Money Report, Business<strong>International</strong>, 1986.take on relatively large amounts of debt to exploitthe tax shield that debt provides. All the time,however, a parent company should make compensatingadjustments to the capital structure of itselfand its other subsidiaries so that the company’sglobal debt/equity ratio is maintained at the level itdeems appropriate. (Recall from Chapter 16 thatborrowing capacity is a firm-level choice variable,and incurring higher or lower levels in one project/country requires compensation in debt levelselsewhere in the company’s operations.)Capital structure in different countriesFinancial structure varies from country to country.This is seen in Table 18.3. Possible reasons for the& Table 18.3 Mean and standard deviation of debtto asset ratios, sorted by type of legal system:group mean in parentheses.Mean Standard deviationGerman Civil Law (0.61)Austria 0.65 0.34Germany 0.41 0.36Japan 0.62 0.28Korea 0.80 0.17French Civil Law (0.56)France 0.56 0.34Netherlands 0.49 0.29Italy 0.65 0.35Spain 0.57 0.26Scandinavian Civil Law (0.49)Denmark 0.57 0.32Finland 0.55 0.26Norway 0.47 0.27Sweden 0.43 0.29English Common Law (0.42)Australia 0.54 0.33Canada 0.39 0.27United Kingdom 0.56 0.34United States 0.39 0.26Overall (0.46)Source: Joon Y. Song and George C. Philippatos, ‘‘RevisitingVariations in <strong>International</strong> Capital Structure: EmpiricalEvidence from 16 OECD Countries,’’ Conference of theEastern <strong>Finance</strong> Association, Mystic, CT, 2004.415 &
INTERNATIONAL INVESTMENT AND FINANCINGvariations can be found in explanations of capitalstructure commonly advanced in a domestic context.These explanations hinge on the tax deductibilityof interest payments but not dividends, andon bankruptcy and agency costs.Countries in which interest payments aredeductible against corporate taxes will, ceterisparibus, have relatively high debt/equity ratios.However, if interest rates are particularly highbecause borrowers can deduct interest and lendersmust pay tax on interest, this will militate againstthe advantage of debt. 29The risk and expected cost of bankruptcy increasewith the amount of debt. 30 If expected costs ofbankruptcy are lower in some countries than others,debt/equity ratios will, ceteris paribus, be higher inthe countries with low expected bankruptcy costs.In countries where banks are both providers of debtand holders of companies’ equity, the probability ofbankruptcy is relatively low because the banks arelikely to help in times of trouble. It follows that incountries such as Japan and Germany, where bankshold considerable amounts of equity, debt/equityratios are higher than in countries such as the UnitedStates and Canada, where banks provide debt butlittle or no equity. Indeed, Table 18.3 shows Canadaand the United States as having low debt ratios.Lenders know that once they have made loans tofirms, the managers of the firms will be more29 An account of the effect of differential tax shields thatconsiders the role of both corporate and individual incometax rates has been provided by Moon H. Lee and JosefZechner, ‘‘Debt, Taxes, and <strong>International</strong> Equilibrium,’’Journal of <strong>International</strong> Money and <strong>Finance</strong>, December 1984,pp. 343–55. Lee and Zechner point out that in order tohave an advantage in debt, corporate tax rates relative toindividual tax rates must be higher in one country than inother countries. This is because high individual tax rateson interest earnings push up interest rates and therebyreduce the attractiveness of debt. For debt to be attractivethe corporate deductibility needs to be high relative to theextent interest rates are pushed higher by individual taxrates.30 The expected cost of bankruptcy depends on theprobability that bankruptcy will occur as well as on legaland other costs if it does occur.& 416concerned with taking care of their own and theirshareholders’ well being than with protecting thelenders’ interests. This is one of the agency costs ofdebt, and because lenders are aware of this cost,they demand corresponding high interest rates ontheir loans. These high interest rates reduce typicaldebt/equity ratios. The greater is the agency costof debt, the lower is the typical debt/equityratio. Agency costs are reduced when banks holddirectorships in firms, because they can thenvery directly represent their interests as creditorswhen attending board meetings. The high degreeof horizontal integration in Japan, where banksand manufacturers are frequently subdivisions of thesame giant MNC, has greatly reduced agencycosts, and this, combined with reduced expectedbankruptcy costs, probably explains Japan’s highdebt-to-equity ratio.Even though there does seem to be differencesbetween countries in financial structure, with thesehaving been attributed to tax deductibility as well asthe country’s legal system and other factors, it hasbeen suggested that these differences are smallcompared to the variations across industries withcountries, and idiosyncratic variations across firmswithin industries. 31 An indication of this is evidentfrom Table 18.3 which shows the standard deviationsof debt ratios in OECD countries as well astheir means. Recalling that 95 percent of a normaldistribution is between approximately two standarddeviations either side of the mean, the distributionof debt ratios in every country is extremely broad.In many cases, the 95-percent interval includeszero and extends beyond twice the mean. This isimmediately suggestive that within each country,industry and firm-specific effects are more importantthan country effects. 3231 See the paper by Joon Y. Song and George C. Philippatos,‘‘Revisiting Variations in <strong>International</strong> Capital Structure:Empirical Evidence from Sixteen OECD Countries,’’Conference of the Eastern <strong>Finance</strong> Association, Mystic,CT, 2004.32 See Joon Y. Song and George C. Philippatos, op. cit. forthis line of argument.
LONG-TERM FINANCINGSUMMARY1 If capital markets are internationally integrated, the cost of capital should be the samewherever the capital is raised.2 If capital markets are segmented, it pays to raise equity in the country in which the firmcan sell its shares for the highest price. It may also pay to consider selling equitysimultaneously in several countries; such shares are called Euroequities.3 Low issuance costs may make some markets better than others for selling shares.Generally, the costs of selling shares are lowest in big financial markets such asNew York.4 Firms must decide on the best vehicle for issuing equity and raising other forms of capital.In particular they must determine whether capital should be raised by the parent companyor a financing subsidiary.5 A foreign bond is a bond sold in a foreign country and in the currency of that country.A Eurobond is a bond in a currency other than that of the country in which it is sold.6 Firms must decide on the currency of issue of bonds. All foreign-pay bonds are bydefinition in a foreign currency for the firm, and many Eurobonds are also in a foreigncurrency for the firm.7 Large gains or losses are possible from denominating bonds in currencies that are notpart of a firm’s income. For this reason a risk premium may be demanded beforespeculating by issuing foreign-currency-denominated bonds.8 When a firm has foreign-currency income, foreign-currency borrowing reducesexchange-rate exposure. Therefore, a firm may be prepared to pay higher interest on aforeign-currency-denominated bond than on a bond denominated in domestic currency.9 When bond buyers face lower tax rates on foreign exchange gains than on interestincome, it may pay to issue strong-currency bonds. These will have relatively low interestrates because they offer bond buyers part of their return as capital gain.10 Bond issuers should consider costs and sizes of bond issues when determining the countryof issue.11 Bonds denominated in two or more different currencies, called multicurrency orcurrency-cocktail bonds, will appeal to lenders if there are costs associated with formingportfolios of bonds denominated in single currencies.12 A substantial proportion of financing of overseas subsidiaries is provided from withinmultinational corporations.13 Parallel loans are made between firms. They are particularly useful when there areforeign exchange controls.14 Credit swaps are made between banks and firms. They are also a way of avoiding foreignexchange controls.15 Political risk can be reduced by borrowing in countries in which investment occurs; thistends to increase debt/equity ratios of subsidiaries.16 Because parent companies tend to honor subsidiaries’ debts whether legally obligated todo so or not, a parent company should monitor subsidiaries’ debt/equity ratios as well asits own global debt/equity ratio. Nevertheless, parent companies should allow variationsin debt/equity ratios between subsidiaries to take advantage of local situations.417 &
INTERNATIONAL INVESTMENT AND FINANCING17 If a country has a high debt/equity ratio, this can be because of high tax shields on debt, orlow bankruptcy or agency costs.18 The links between banks and corporations in Japan, Germany, and some othercountries may explain the high debt/equity ratios in these countries. However, it doesappear in general from the within-country variations in financial structure thatindustry- and firm-specific influences on financial structure are more important thancountry effects.REVIEW QUESTIONS1 What do integrated capital markets imply for the decision of where to raise capital?2 What is a Euroequity?3 What is an American Depository Receipt?4 What is a foreign bond?5 What is a Eurobond?6 Under what condition will a risk-neutral borrower borrow pounds?7 Why might some borrowers pay more to borrow foreign rather than domestic currency?8 Why are strong-currency bonds preferred by lenders facing lower tax rates on capitalgains than on interest income?9 What is the advantage of a multicurrency bond to lenders?10 What is a parallel loan?11 What is a credit swap?12 How does country risk affect parent versus subsidiary borrowing?13 How does liability for debt affect parent versus subsidiary borrowing?14 How might the extent of equity ownership by banks in different countries affect financialstructure differences between countries?ASSIGNMENT PROBLEMS1 Why might a firm want to issue shares simultaneously in a number of financial centers?2 How can the availability of savings and the opportunities for investment influence the costof capital in different countries?3 Is a US dollar bond sold by a British firm in the United States a foreign bond ora Eurobond? How about a pound bond sold by a British firm in the United States?4 Why do Canadian firms borrow so heavily in US dollars?5 When lenders are more optimistic about the future value of a currency than borrowers,what do you think this implies about the likelihood of debt denomination in that currency?6 How is the tax shield on debt mitigated by a high tax rate on interest earnings, therebymaking debt/equity ratios in different countries depend on individual income versuscorporate tax rates?& 418
LONG-TERM FINANCING7 With r $ ¼ 12.50 percent, r £ ¼ 14.00 percent, S($/£) ¼ 2.25, and S 10 ($/£) ¼ 1.50,in which currency would you borrow? What is the expected gain on each $1 millionborrowed from making the correct choice?8 If r $ ¼ 12.50 percent, r £ ¼ 14.00 percent, and S($/£) ¼ 2.25, what must the actualexchange rate after 10 years, S 10 ($/£), be in order to make borrowing in pounds a goodidea?9 Why does having an income in foreign currency reduce required borrowing riskpremiums? What type of risk – translation/transaction risk or operating risk – isreduced?10 What determines whether you would issue a Eurosterling bond or a sterling bond(i.e. a foreign bond) in Britain?BIBLIOGRAPHYBrown, Robert L., ‘‘Some Simple Conditions for Determining Swap Feasibility,’’ unpublished, Monash University,Australia, 1986.Chowdhry, Bhagwan, and Vikram Nanda, ‘‘Financing of Multinational Subsidiaries: Parent Debt vs. ExternalDebt,’’ Journal of Corporate <strong>Finance</strong>, August 1994, pp. 259–81.Edwards, Franklin R., ‘‘Listing of Foreign Securities on U.S. Exchanges,’’ Journal of Applied Corporate <strong>Finance</strong>,Winter 1993, pp. 28–36.Hodder, James E., ‘‘Hedging <strong>International</strong> Exposure: Capital Structure under Flexible Exchange Rates andExpropriation Risk,’’ unpublished, Stanford University, Stanford, CA, 1982.—— and Lemma W. Senbet, ‘‘<strong>International</strong> Capital Structure Equilibrium,’’ unpublished, Stanford University,Stanford, CA, 1988.Lee, Moon H. and Josef Zechner, ‘‘Debt, Taxes, and <strong>International</strong> Equilibrium,’’ Journal of <strong>International</strong> Moneyand <strong>Finance</strong>, December 1984, pp. 343–55.Lessard, Donald R. and Alan C. Shapiro, ‘‘Guidelines for Global Financing Choices,’’ Midland Corporate <strong>Finance</strong>Journal, Winter 1983, pp. 68–80.Marr, Wayne, John L. Trimble, and Raj Varma: ‘‘Innovation in Global Financing: The Case of EuroequityOfferings,’’ Journal of Applied Corporate <strong>Finance</strong>, Spring 1992, pp. 50–4.Nauman-Etienne, Rudiger, ‘‘A Framework for Financial Decisions in Multinational Corporations – A Summary ofRecent Research,’’ Journal of Financial and Quantitative Analysis, November 1974, pp. 859–75.Ness, Walter L., Jr, ‘‘A Linear Approach to Financing the Multinational Corporation,’’ Financial Management,Winter 1972, pp. 88–100.Remmers, Lee, ‘‘A Note on Foreign Borrowing Costs,’’ Journal of <strong>International</strong> Business Studies, Fall 1980,pp. 123–34.Shapiro, Alan C., ‘‘Financial Structure and the Cost of Capital in the Multinational Corporation,’’ Journal ofFinancial and Quantitative Analysis, June 1978, pp. 211–26.——, ‘‘The Impact of Taxation on the Currency-of-Denomination Decision for Long-Term Foreign Borrowing andLending,’’ Journal of <strong>International</strong> Business Studies, Spring 1984, pp. 15–25.Stonehill, Arthur, Theo Beekhuisen, Richard Wright, Lee Remmers, Norman Toy, Antonio Pares, Douglas Egan,and Thomas Bates, ‘‘Financial Goals and Debt Ratio Determinants: A Survey of Practice in Five Countries,’’Financial Management, Autumn 1975, pp. 27–41.419 &
INTERNATIONAL INVESTMENT AND FINANCINGToy, Norman, Arthur Stonehill, Lee Remmers, Richard Wright, and Theo Beekhuisen, ‘‘A Comparative<strong>International</strong> Study of Growth, Profitability, and Risk as Determinants of Corporate Debt Ratios in theManufacturing Sector,’’ Journal of Financial and Quantitative Analysis, November 1974, pp. 875–86.Wihlborg, Clas, ‘‘Economics of Exposure Management of Foreign Subsidiaries of Multinational Corporations,’’Journal of <strong>International</strong> Business Studies, Winter 1980, pp. 9–18.& 420
Part VIInstitutional structure of internationaltrade and financeThe theory and practice of international financedescribed in the preceding chapters are built on aninstitutional framework which is shaped and definedby important private and government institutions.This part of the book describes these institutions andthe functions they serve.The first of the two chapters in Part VI deals withmultinational banking. While banks are frequentlyignored when considering multinational corporations –for example, Table 17.1, which is a standard table ofMNCs, lists only nonfinancial corporations – bankingis the epitome of an industry that is multinational innature. When we focus on, for example, the countriesin which operations occur and where foreign directinvestments have been made, banks are more widespreadthan firms from just about any other industry,and their effects are as pervasive as their territorialcoverage.An important activity of banks is the acceptance ofdeposits, and here the multinational dimension is bothfascinating and controversial. Chapter 19 begins bylooking at ‘‘offshore deposits,’’ often simply butinaccurately called ‘‘Eurodollars,’’ and explains whatthey are, where they come from, and what they implyfor regulatory agencies. After describing alternativeviews of the creation and relevance of offshoredeposits, the chapter deals with the organization ofinternational banking. We then explain why bankinghas become multinational, and conclude with a discussionof anxieties that have been expressed aboutthe fragility of international banking due to ‘‘derivatives’’trading and a discussion of the ‘‘deregulationwars’’ that have radically changed the activities inwhich banks are engaged.Chapter 20 looks at the structure, instruments, andinstitutions of international trade. No course ininternational finance is complete without an explanationof the nature and role of letters of credit, billsof exchange, payments drafts, bills of lading, waybills,and other such documents. The chapter explains howmethods of payment and trade credit have evolved tomeet the special needs of international trade. Severalforms of export financing are explained, includingshort-term credits involving delayed payment dates onbills of exchange, and medium-term credits involvingforfaiting. We also discuss a form of trade calledcountertrade and why it is used.Chapter 20 ends with a description of the institutionsthat monitor and regulate international trade,such as the World Trade Organization (WTO), whichreplaced the General Agreement on Tariffs and Trade(GATT) in January 1995. Since a substantial portionof international trade is between partners of freetradepacts such as the members of the EuropeanUnion and the NAFTA, a brief overview of free-tradearrangements is given.
Chapter 19Multinational bankingThink global, act local.Theodore LevittCurrencies have leaped beyond their traditionalboundaries, so that today it is possible to writechecks in US dollars against bank accounts in Tokyo,or to write checks in Japanese yen against bankaccounts in New York. Indeed, bank accounts indifferent currencies exist side by side in just aboutevery financial center, so that in, for example,London, we find bank accounts in dollars, yen,euros, Swiss francs, and every other major currency.Similarly, it has become possible to arrangeloans in US dollars in Hong Kong or in eurosin Sydney. The growth rate of these so-called‘‘offshore currency’’ deposits and loans has beennothing short of startling, and is part of theincreased globalization of financial markets, ingeneral, and of the banking industry, in particular.Spearheading the growth of offshore currenciesand loans was the appearance of Eurodollars inthe 1950s. Despite several decades of study of thecauses and consequences of the emergence ofEurodollars, there are few topics in internationalfinance that have attracted as much controversyand disagreement. The most important parts ofthis disagreement center on the extent banks cancreate Eurodollars and the danger Eurodollarcreation involves. We shall attempt to give abalanced view of these issues and shall also explainthe many aspects of Eurodollars, and more generallyof offshore currencies, on which there isconsensus. Then we shall describe the nature ofthe banks which deal in the offshore currencymarket. However, before we begin, we shoulddefine what we mean by ‘‘Eurodollars’’ and‘‘offshore currencies.’’THE EURODOLLAR AND OFFSHORECURRENCY MARKETSWhat are Eurodollars and offshorecurrencies?Here is a short, accurate definition:A Eurodollar deposit is a US-dollar-denominatedbank deposit outside the United States.Hence, a dollar-denominated bank deposit inBarclays Bank in London or in Citibank in Singaporeis a Eurodollar deposit, while a dollar deposit inBarclays or Citibank in New York is not. 1 Offshorecurrency deposits are a generalization of Eurodollarsand include other externally held currencies.For example, a Eurosterling deposit is a pounddenominatedbank deposit held outside Britain, and1 The Singapore market is also referred to as part of theAsiadollar market that includes Hong Kong, Tokyo, andother centers.423 &
INSTITUTIONAL STRUCTURE OF TRADE AND FINANCEa Euroyen deposit is a Japanese-yen deposit heldoutside Japan.The existence of the offshore currency marketmeans that in making hedged or covered investmentand borrowing decisions such as those described inChapter 8 or Chapter 14, there is no need to go tothe different currency centers to arrange deals. Forexample, an American investor could comparecovered 3-month yields on dollars, sterling, euros,yen, and various other currencies in London andarrange for investment or borrowing in the currencyof his or her choice in that single market.Moreover, as we shall see later in this chapter, themultinational nature of banks means that thisAmerican, dealing in London in foreign currencies,might well be trading with an American bank. Thelarger US, British, Japanese, French, German, andSwiss banks, along with many others, maintainsizable operations in the larger money-market offshorecurrencycenters.AsweexplainedinChapter8,the ease of comparing yields on different currencydenominateddeposits with banks and their depositsside-by-side in many centers has resulted in coveredyields being very similar: see Table 8.1.Why did Eurodollar deposits develop?In order to explain why Eurodollars developed andwhy later other offshore currency deposits becamepopular, we must explain why holders of US dollarspreferred to keep them in banks located outside theUnited States rather than in the United States. Wemust also explain why borrowers of US dollarsarranged their loans with banks located outside theUnited States rather than with banks in the UnitedStates.The original establishment of Eurodollaraccounts is usually credited to the former SovietUnion, although in reality its role was probablyrather small. 2 During the 1950s, the Soviet Unionfound itself selling gold and some other products inorder to earn US dollars. These dollars were to be2 See especially Gunter Dufey and Ian Giddy, The <strong>International</strong>Money Market, Prentice-Hall, Englewood Cliffs, NJ, 1978.& 424used to purchase grain and other western products,many of which came from the United States. Whatwere the Moscow Narodny bank and its fellowfinancial institutions to do with dollars between thetime they were received and the time they would beneeded? Of course, banks in New York were willingto take them on deposit. This, however, was generallyunacceptable to the Soviets because of the riskthat the dollars might be frozen if the cold warbecame hotter. Also, placing dollars in New Yorkbanks would have meant that the Soviet governmentwas ‘‘making loans’’ to capitalist banks, whichwould channel the funds to other capitalist enterprises.So instead of using New York banks as theplace of deposit for their dollars, the Soviets madetheir dollars available to banks in Britain and France.In turn, the British and French banks took the Sovietdollars and lent them out at interest. This partlyinvolved making loans in the United States bybuying US treasury bills, private commercial andfinancial paper, and so on. 3 With the interest earnedon these investments, the dollar-accepting banks inEurope were able to pay interest on the Sovietdeposits.As intriguing as the covert Soviet role in thecreation of Eurodollars may sound, in reality thedevelopment and expansion of the offshore currencymarket had its roots in more overt events.We can classify these events as affecting the supplyof deposits moving to the Eurodollar market oraffecting the demand for loans from Eurodollarbanks.The supply of Eurodollar depositsThe role of bank regulationDuring the 1960s and 1970s, US banks and otherdeposit-taking institutions were subject to limitationson the maximum interest rates they couldoffer on deposits. The most notable of these3 The truth, therefore, is that the Soviet governmentwas, via British and French banks, making loans to theUS government, defense manufacturers, and so on.
MULTINATIONAL BANKINGlimitations came from the US Federal ReserveBoard’s Regulation Q. Banks in London and otherglobal financial centers were not subject to suchinterest limitations, and so were able to pay moreon US dollar deposits than US-based banks could.With higher interest rates offered on dollarsdeposited in London and other financial centers thanin the United States, there was an obvious incentiveto deposit dollars outside the United States. Thiswas particularly true for large deposits such as thoseof US multinational corporations. Several US banksopened overseas offices to receive these funds. MostUS interest-rate restrictions were removed afterthe mid-1970s, but to the extent that limitationswere effective before that time, they contributed tothe flow of US dollars abroad. The dollars placedabroad to avoid US interest ceilings on depositswere reinvested, often back in the United States.The supply or availability of Eurodollar depositsalso grew from the advantage for US banks inmoving operations overseas to avoid FederalReserve Regulation M. This regulation required thekeeping of reserves against deposits. Until 1969, thisregulation did not apply to deposits of overseasbranches of US banks (and since 1978 this regulationhas not applied to such deposits). Since reservesmean idle funds, the cost of operations overseas wasreduced vis-à-vis the cost of operations in the UnitedStates. This encouraged US banks to move some oftheir depositors’ accounts, including the accounts ofmany Americans, to the relatively unregulatedoverseas market, principally to London and otherlarge European financial centers. Also, the absenceof reserve requirements and other troublesomeFederal Reserve regulations, such as the need to payfor deposit insurance on deposits held in the UnitedStates, has allowed US banks operating overseas tooffer higher interest rates on dollar deposits. 44 Banks operating in tax havens such as the Cayman Islandsand the Netherlands Antilles had an additional advantage ofpaying low corporate income taxes. This allowed them tocover operating costs with a lower spread between depositand lending rates.The role of convenienceSince the late 1960s, growth in Eurodollars hascome from sources other than Federal Reserveand US government regulations. For example,Eurodollars are more convenient for some depositorsthan dollars that are in the United States.Europeans and other non-Americans have unevencash flows in US dollars. On some occasions,they have dollar inflows, and on others, they havedollar outflows. They could, of course, sell thedollars for their home currency when their inflowsare large and repurchase dollars with the homecurrency when outflows are large. However, thisinvolves transaction costs. Alternatively, thesenon-Americans could leave their dollars in banksin the United States. However, this means dealingwith bankers who are thousands of miles awayand possibly unfamiliar with the customers’ problems.It is easier to keep the dollars in a bankwith offices close by which can respond quicklyto the customers’ needs. Therefore, the offshorecurrency market has expanded at a rapid rate. Theconvenience of Eurodollars is, of course, augmentedby the higher yields available on them dueto the absence of reserve requirements and depositinsurance mentioned earlier.The demand for Eurodollar loansBorrowing regulationsEurodollars could have developed without a localdesire to borrow the funds left on deposit, but thebanks would have been required to recycle theirEurodollar holdings back into the US money market.However, as a result of limitations in the 1960sand 1970s on obtaining loans within the UnitedStates that did not apply overseas, a demand forborrowing US funds outside the United States wascreated. This encouraged the growth of Eurodollarson the asset side of the overseas banks’ balancesheets. The controls and restrictions on borrowingfunds in the United States for reinvestment abroadbegan with a voluntary restraint program in 1965.425 &
INSTITUTIONAL STRUCTURE OF TRADE AND FINANCEThis was followed by mandatory controls in 1968.These controls forced many borrowers to seeksources of loans in the Eurodollar market, and theloans were often arranged with US banks.Another regulation affecting foreign demand forEurodollar loans was the US interest equalizationtax, introduced in 1963 and in effect until 1974.This was a tax on US residents’ earnings on foreignsecurities. To encourage US residents to lend toforeign borrowers, the foreigners were forced tooffer higher yields in order to cover this tax. Bychanneling funds via Eurodollars, the interest equalizationtax was avoided, and this allowed lowerinterest rates to be offered by the Eurobanks.With deposits going abroad to escape RegulationQ, banks going abroad to escape Regulation M and USFederal Reserve requirements such as deposit insurance,and with borrowing going abroad to escape theinterest equalization tax and credit and directinvestment controls, the Eurodollar market expandedvery rapidly. Furthermore, despite the removalof most of the regulations, taxes, and controls in the1970s the Eurodollar market continued to grow.Convenience againConsiderations of convenience affected the demandfor Eurodollars as well as the supply of Eurodollars.Taking Eurodollar loans is often more convenientthan taking loans in the United States. The same istrue for other currency loans; it is sometimes moreconvenient to arrange for them locally instead of ina currency’s home market. Local bankers know thecreditworthiness and talents of local borrowers in away that is rarely possible for distant bankers. Consequently,instead of taking dollar loans in New York,sterling loans in London, and so on, borrowers takeloans in the different currencies in their local market.The role of narrow spreadsIn the final analysis, the most important factoraffecting the supply of and demand for Eurodollarsis the desire of dollar depositors to receive thehighest yield and the desire of dollar borrowers to& 426pay the lowest cost. Because of the absence ofreserve requirements, deposit-insurance requirements,and other costly regulations, the Eurobankscan offer higher yields on dollar deposits than canUS banks. At the same time, the Eurobanks cancharge lower borrowing costs. The lower interestrates on loans are made possible by the absence ofsevere regulations and by the sheer size and numberof informal contacts among the Eurobanks. Thesefactors are important advantages in making largeloans. Higher rates to depositors and lower costs toborrowers mean operating on narrower spreads.Nevertheless, the Eurobanks are left with profitsdespite the lower spreads because of their lowercosts. While the growth of the Eurodollar market isbest attributed to the ability of the Eurobanks tooperate on a narrow spread, this has not alwaysbeen the accepted explanation.The role of US deficitsDuring the early period of development of theEurodollar market, the market’s growth was oftenattributed to US trade deficits. A trade deficit doesmean that dollars are being received and accumulatedby non-Americans. This does not, however,have much to do with the expansion of Eurodollardeposits. The dollars being held by non-Americanscould be placed in banks within the United States orinvested in US financial securities. Eurodollardeposits will grow only if the dollars are kept inoverseas banks. Similarly, the Eurodollar marketwill not disappear if the United States runs tradesurpluses. We need the reasons given above, such asconvenience and liberal offshore banking regulations,for the Eurodollar market to exist. As long asbanks located outside the United States offer greaterconvenience and/or operate on smaller spreadsthan banks operating within the United States, theywill continue to prosper.Markets for other EurocurrenciesThe same factors that are behind the emergence andgrowth of the Eurodollar market are behind the
MULTINATIONAL BANKINGemergence and growth of the markets in otherEurocurrencies. For example, Japanese-yen depositsand loans are found in London and New Yorkbecause British and American businesses have foundit more convenient to make yen deposits andarrange yen loans locally than in Japan, and becausebanks in London and New York can avoid restrictionsfaced by banks in Tokyo. Similarly, the marketfor euro-denominated securities in London is vast.The restrictions that are avoided by operatingoverseas vary from country to country and havegenerally become less important in recent yearswith the global trend towards the deregulation ofbanking. The role of convenience has increased as aresult of the growth in importance of internationaltrade versus domestic trade. As more internationaltrade comes to be denominated in the Japanese andEuropean currencies, we can expect more depositsand loans to be denominated in these currencies inoffshore currency market.Determination of offshore currencyinterest ratesOffshore currency interest rates cannot differmuch from rates offered on similar deposits in thehome country. If this were not so there would bearbitrage, with borrowing in the low interest-ratelocation and lending in the high interest-ratelocation. As a result of the potential for arbitragethe rate offered to Eurodollar depositors is onlyslightly higher than in the United States, and therate charged to borrowers is only slightly lower.Each country’s market interest rates influence theoffshore currency interest rates and vice versa.The total supply of each currency in the globalmarket, together with the total demand, determinesthe rate of interest. As a practical matter,however, each individual bank bases its rates onthe rates it observes in the market in which itcompetes.The interest rates charged to borrowers ofEurocurrencies are based on London InterbankOffer Rates (LIBOR) in the particular currencies.LIBOR rates are those offered in interbanktransactions (i.e. when banks borrow from eachother) and are the base rates for non-bank customers.LIBOR rates are calculated as the averagesof the lending rates in the respective currenciesof leading London banks. Non-bank borrowersare charged on a ‘‘LIBOR-plus’’ basis, with theinterest premium based on the creditworthinessof the borrower. For example, a corporationmight be offered a loan at LIBOR plus 2 percent.With borrowing maturities of over 6 months, afloating interest rate is generally charged. Every6 months or so, the loan is rolled over, andthe interest rate is based on the current LIBORrate. This reduces the risk to both the borrowerand the lender (the bank) in that neither will beleft with a long-term contract that does not reflectcurrent interest costs. For example, if interestrates rise after the credit is extended, the lenderwill lose the opportunity to earn more interest foronly 6 months. If interest rates fall after a loan isarranged, the borrower will lose the opportunityto borrow more cheaply for only 6 months. Withthe lower interest-rate risk, credit terms frequentlyreach 10 years.Different types of offshore currencyinstrumentsOffshore currency deposits are primarily conventionalterm deposits, which are bank deposits witha fixed term, such as 30 days or 90 days. Theinterest rate is fixed for the term of the deposit, andthis keeps the maturity of deposits short.Not as important as any of the individualoffshore currency denominations, but neverthelessof some importance, are the offshore currencydeposits denominated in Special Drawing Rights(SDRs). As mentioned in Chapter 18 and explainedin Exhibit 18.3, SDRs were originally introducedas central-bank reserve assets by the <strong>International</strong>Monetary Fund. SDR term deposits werefirst offered by Chemical Bank in London. Likethe bulk of other offshore deposits, SDRdenominateddeposits are mostly nonnegotiableterm deposits.427 &
INSTITUTIONAL STRUCTURE OF TRADE AND FINANCEA relatively small proportion of the liabilities ofoffshore banks are not term deposits, but insteadtake the form of certificates of deposit (CDs).Unlike offshore currencies in the form of termdeposits, the CDs are negotiable instruments thatcan be traded in a secondary market. This makesthe CDs more liquid than term deposits, which havea penalty on early withdrawal. In the case of USdollars approximately 20 percent of offshore bankliabilities are CDs, the balance being conventionalterm deposits. Since 1981, some London-basedbanks have offered SDR-denominated CDs as wellas conventional deposits. The banks that firstoffered the SDR-denominated CDs were BarclaysBank <strong>International</strong>, Chemical Bank, Hong Kong andShanghai Bank (HSBC), Midland Bank (now part ofHSBC), National Westminster Bank, and StandardChartered Bank. 5An expansion of offshore currency operationswithin the United States has been made possible byrules allowing the establishment of internationalbanking facilities (IBFs). The IBFs are, in effect,a different set of accounts within an existing bank;they date back to 1981. The facilities can acceptforeign-currency deposits and are exempt fromboth US reserve requirements and insurance premiumson deposits as long as the deposits are usedexclusively for making loans to foreigners. Twodays’ notice for withdrawals is required. Thesefacilities compete with other countries’ offshorecurrency banks and have brought some of theoffshore business back to the United States.Offshore banks generally remain well hedged.They accept deposits in many different currencies,and they also have assets in these same currencies.When they balance the two sides of their accountswith equal volumes and maturities of assets andliabilities in each currency of denomination, theyare perfectly hedged and therefore unaffected bychanges in exchange rates. Sometimes it is difficultto balance the maturities of assets and liabilities, and5 See ‘‘Slimmed-Down SDR Makes Comeback; TechniquesInclude Opening Up Market for Negotiable SDR CDs,’’Money Report, Business <strong>International</strong>, January 16, 1981.& 428until 1981 this situation involved banks in risk.However, since 1981 banks have been able to avoidrisk from unbalanced maturities in US dollarsby using the Eurodollar futures market at the<strong>International</strong> Monetary Market operated by theChicago Mercantile Exchange. Since the early 1980sbanks and other financial institutions have also beenable to use the Eurodollar futures markets of theChicago Board of Trade, the New York FuturesExchange, the London <strong>International</strong> FinancialFutures Exchange, and the Singapore Exchange. Itis worthwhile to explain the risk from unbalancedmaturities and the way this can be avoided withEurodollar futures.Suppose that a bank accepts a 3-month Eurodollardeposit of $1 million on March 1 at 4 percentand at the same time makes a Eurodollar loan for6 months at 5 percent. In June, when the 3-monthdeposit matures, the Eurobank must refinance the6-month loan for the remaining 3 months. If by Junethe deposit rate on 3 month Eurodollars has risenabove 4 percent, the spread on the remaining periodof the loan will be reduced. To avoid this risk, onMarch 1, when making the 6-month loan, the bankcould sell a 3-month Eurodollar future for June.(On the <strong>International</strong> Monetary Market in Chicago,contracts are traded in $1 million denominations forMarch, June, September, and December.) If byJune the Eurodollar rates have gone up, the bankwill find that it has made money on the sale of itsEurodollar future. This follows because, as in thebond market, purchases of interest-rate futures(long positions) provide a profit when interest ratesfall, and sales (short positions) provide a profit wheninterest rates rise. The profit made by the bank inselling the Eurodollar future will offset the extracost of refinancing the 6-month Eurodollar loan forthe remaining 3 months.Offshore banks perform ‘‘intermediation’’ whenthey convert offshore currency deposits into, forexample, commercial or government loans. Thisterm is used because the banks are intermediariesbetween the depositors and the borrowers. If thetwo sides of the offshore bankers’ accountsare equally liquid – that is, if the IOUs they
MULTINATIONAL BANKINGpurchase are as marketable as their offshore currencydeposits – then according to the view of someresearchers, the banks have not created any extraliquidity or ‘‘money.’’ 6 However, it could happenthat the original foreign currency that was depositedin a bank is redeposited in other banks beforefinding its way back to the home country. In thisway we can have a total of offshore currencydeposits that is a multiple of the original deposit.Before demonstrating how we can have an offshorecurrency multiplier we should state that thisremains a topic of considerable controversy, andthere is even some dispute over whether Eurodollarmultipliers can be defined at all. 7Redepositing and multiple offshorecurrency expansionLet us construct a situation in which a multipleexpansion of offshore deposits does occur. Assumethat a British exporter, Britfirm A, receives a $100check from an American purchaser of its productsand that this check is drawn against a US bank. Thisis an original receipt of dollars in Europe. Assumethat Britfirm A does not need the dollars immediatelybut that it will need them in 90 days. The $100is held in Britfirm A’s account in a British bank as6 This is the view in Jurg Niehans and John Hewson, ‘‘TheEuro-Dollar Market and Monetary Theory,’’ Journal ofMoney, Credit and Banking, February 1976, pp. 1–27.7 The controversy began after the publication of MiltonFriedman’s article ‘‘The Euro-Dollar Market: Some FirstPrinciples,’’ (Morgan Guarantee Survey, October 1969,pp. 4–14, reprinted with clarifications in Review, FederalReserve Bank of St. Louis, July 1971, pp. 16–24). Friedmantreated the Eurodollar multiplier as a conventional domesticbanking multiplier, and this prompted a criticism from FredH. Klopstock (‘‘Money Creation in the Euro-Dollar Market:A Note on Professor Friedman’s Views,’’ Monthly Review,Federal Reserve Bank of New York, January 1970,pp. 12–15). The controversy expanded with the publicationof Niehans and Hewson’s paper (see note 6).Gunter Dufey and Ian H. Giddy have introduced a varietyof multipliers (The <strong>International</strong> Money Market, Prentice-Hall,Englewood Cliffs, NJ, 1978). We will use the conventionalmultiplier and treat the question in the conventional way.a dollar term deposit, that is, a Eurodollar. TheBritish bank will, after accepting the check fromBritfirm A, send the check to the US bank withwhich it deals. The British bank will be creditedwith $100.The $100 deposit in the British bank probablywill not be removed during the term of the deposit,since removing it would involve a substantialinterest penalty for Britfirm A. The British bankwill therefore look for an investment vehicle thatapproximately matches the term of Britfirm A’sdeposit. Suppose that the British bank decides tomaintain a cash reserve of 2 percent with anAmerican bank and discovers a British firm, BritfirmB, which wishes to borrow the remaining $98 for90 days to settle a payment with an Italian supplier,Italfirm A. The British bank will give to Britfirm Ba check for $98 drawn against the British bank’saccount at the US bank and payable to Italfirm A.We have the situation in the top part of Table 19.1.(If the dollars are loaned to a US borrower, as theycould well be, the effects end here with the Britishbank merely intermediating, that is, serving asgo-between for the depositor and the borrower.)On receiving the check from Britfirm B, ItalfirmA will deposit it in its account at an Italian bank,which will in turn send it for collection to theUnited States. If the Italian bank deals with the sameUS bank as the British bank, all that will happen inthe United States is that $98 will be removed fromthe British bank’s account and credited to the Italianbank’s account. The British bank’s account with theUS bank will be reduced to $2. The British bank’saccount will have the entries shown in Table 19.1;it will show the $100 Eurodollar deposit offsetby a $2 reserve and a $98 IOU. (If the Britishand Italian banks maintain reserves at differentUS banks, the outcome will be the same afterUS interbank clearing.) We see that the clearing ofEurodollars takes place in New York, with thebanks in the United States merely showing differentnames of depositors after Eurodollars have beentransferred. Originally, they showed the owner ofthe dollars who paid Britfirm A. Afterwards, the USbanks showed the British bank and then the Italian429 &
INSTITUTIONAL STRUCTURE OF TRADE AND FINANCE& Table 19.1 Change in balance sheets from $100 of primary depositsBank Assets LiabilitiesBritish Deposit in US bank þ $2.00 Term deposit ofLoan to Britfirm B þ $98.00 Britfirm A þ $100.00þ $100.00 þ $100.00Italian Deposit in US bank þ $1.96 Term deposit ofLoan to Italfirm B þ $96.04 Italfirm A þ $98.00þ $98.00 þ $98.00Dutch Deposit in US bank þ $1.92 Term deposit ofLoan to Dutchfirm B þ $94.12 Dutchfirm A þ $96.04þ $96.04 þ $96.04Canadian Deposit in US bank þ $1.88 Term deposit ofLoan to Canafirm B þ $92.24 Canafirm A þ $94.12þ $94.12 þ $94.12bank as the depositor. Since only the names change,nothing happens inside the United States to increaseor decrease the number of loans.After Italfirm A deposits the check in the Italianbank, the Italian bank will have a $98 deposit at theUS bank to offset its Eurodollar liability to ItalfirmA. Like its British counterpart, it will not leavethe funds idle. Let us suppose that it maintains 2percent, or $1.96, in the US bank, and lends thebalance of $96.04 to Italfirm B. The loan will beeffected by the Italian bank’s drawing a check for$96.04 against its US bank account on behalf ofItalfirm B. We assume that this check is madepayable to Dutchfirm A.If Dutchfirm A deposits the check in a DutchEurodollar term account, the Italian bank will beleft with $1.96 in reserves in the US bank. TheDutch bank will be credited with $96.04. We nowassume that the Dutch bank keeps 2 percent ofthe $96.04 deposit, that is, $1.92, as a cash reserve,and lends the balance of $94.12 to Dutchfirm Bby drawing a check on Dutchfirm B’s behalf toCanafirm A. After Canafirm A deposits the check,the Dutch bank will have $1.92 in reserves, andthe Canadian bank with which the check is depositedwill have $94.12. If the Canadian banklends Canafirm B 98 percent of this, or $92.24, andCanafirm B pays an American company that banks& 430in the United States, then the process of Eurodollarcreation will end. The Canadian bank will have itsaccount in its US bank reduced by $92.24 and willbe left with 2 percent, or $1.88, against its Eurodollardeposit of $94.12. The books are balanced,and every bank is in its desired position of havinga 2-percent reserve backing its Eurodollar deposit,with the remaining 98 percent out as loans. By thetime the Eurodollar creation comes to an end, thereis a total of $100.00 þ $98 þ $96.04 þ $94.12, or$388.16, in Eurodollars. The original deposit of$100 has grown 3.8816 times, and this might becalled the Eurodollar multiplier vis-à-vis the original$100 base. However, the $388.16 in Eurodollarsvis-à-vis the reserves still remaining in Eurobanks – thatis, $2 þ $1.96 þ $1.92 þ $1.88, or $7.76, gives adeposit ratio of 50. That is, $388.16 is 50 timesthe remaining dollar reserves of $7.76. This is whatwe would expect with a reserve ratio of 0.02, sinceeach $1 of reserves supports $50 of deposits.The interesting magnitude is not the depositratio but rather the multiplier, which is the expansionon the base of the original deposit. Only if thereare no leakages back to the United States will themultiplier be as large as the deposit ratio. If fundsdeposited in the Euromarket are loaned back in theUnited States at the outset, the leakage is immediateand the Eurobank is merely intermediating.
MULTINATIONAL BANKINGThe rate of leakage depends on how extensively USdollars are used for settling payments betweenparties outside the United States. The more anycurrency is used between offshore parties, the largerthe multiplier is likely to be.When dollar loans offered by commercial banksoutside the United States are made to central banks,a leakage back to the United States is almost certainto occur. Central banks tend to hold their dollarsin US banks or place them in US treasury bills.This will drain any extra dollar reserves back intothe US banking system. However, when manycentral banks kept dollars at the Bank for <strong>International</strong>Settlements (BIS) in Basle, Switzerland, inthe 1960s, the leakage back to the United Statesdid not occur. The BIS frequently reinvested in theEurodollar market and thus contributed to theexpansion of Eurodollars.Estimates of the value of the Eurodollar multipliervary. As we have seen, the value of the multiplierdepends on the definition and on the speedwith which funds return to the United States. FredKlopstock estimates that the leakage back to theUnited States is so rapid that the multiplier is about1.05–1.09. Alexander Swoboda gives a value ofabout 2.00, which is close to the estimates ofBoyden Lee. John Hewson and Eisuke Sakakibarafind a range of 3–7, whereas John Makin has producedestimates from 10.31 to 18.45. 8 Clearly, thelarger estimates must refer to deposits-to-reserveratios rather than the Eurodollar multiplier andare incorrect as multiplier estimates.8 These estimates are found in Boyden E. Lee, ‘‘TheEurodollar Multiplier,’’ Journal of <strong>Finance</strong>, September1973, pp. 867–74; John Hewson and Eisuke Sakakibara,‘‘The Eurodollar Multiplier: A Portfolio Approach,’’ IMFStaff Papers, July 1974, pp. 307–28; Fred H. Klopstock,‘‘Money Creation in the Euro-Dollar Market: A Note onProfessor Friedman’s Views,’’ Monthly Review, FederalReserve Bank of New York, January 1970, pp. 12–15;John H. Makin, ‘‘Demand and Supply Functions forStocks of Eurodollar Deposits: An Empirical Study,’’Review of Economics and Statistics, November 1972,pp. 381–91; and Alexander K. Swoboda, The EurodollarMarket: An Interpretation, Essays in <strong>International</strong> <strong>Finance</strong>,no. 64, Princeton University Press, Princeton, NJ, 1968.MULTINATIONAL BANKINGThe multinationalization of bankingOffices of foreign-owned banks are becomingcommonplace in financial districts of larger citiesand towns. In the United States, for example, 547foreign banks had offices in 2004. US foreign bankassets in 2004 topped $1.3 trillion. Banks arecompeting in each others’ markets for the share ofdeposits and loans. For example, as Figure 19.1shows, foreign banks’ share of US deposits is above15 percent, while the share of assets is about20 percent. Measured by loans to businesses, thepresence of foreign banks is even more pronounced,with more than a quarter of such loans in the UnitedStates in 2001 coming from foreign banks (seeFigure 19.2).<strong>International</strong> banks are linked together in variousformal and informal ways, from simply holdingaccounts with each other – correspondent accounts –to common ownership. As we shall see, the types ofconnections affect the nature of the business that thebanks conduct.Organizational features ofmultinational bankingExhibit 19.1 describes the different forms ofbanking offices in the United States and theirimportance in the supply of financial capital. Thevarious forms of banking organization are describedin the following paragraphs.Correspondent bankingAn informal linkage between banks in differentcountries is set up when banks maintain correspondentaccounts with each other. Large bankshave correspondent relationships with banks inalmost every country in which they do not have anoffice of their own. The purpose of maintainingforeign correspondents is to facilitate internationalpayments and collections for customers. The term‘‘correspondent’’ comes from the mail or cablecommunications that the banks used to use for431 &
INSTITUTIONAL STRUCTURE OF TRADE AND FINANCEShare of foreign banks (%)252015105DepositsAssets01990 1995 2000 2001& Figure 19.1 Deposit and asset shares of foreign banks in the United States, 1990–2001Source: US Department of Commerce, Bureau of Census, Statistical Abstract of the United States, 2001.4035Total loansBusiness loans30Share of US loans (%)25201510501990 1995 2000 2001& Figure 19.2 Share of loans by foreign banks in the United States, 1990–2001Source: US Department of Commerce, Bureau of Census, Statistical Abstract of the United States, 2001.settling customer accounts. Today, these communicationshave largely been replaced by SWIFTmessages, and the settling between banks occurs viaCHIPS or CLS. 9 For example, if Aviva wants to pay9 SWIFT, CHIPS, and CLS were discussed in Chapter 2. Formore on how correspondent banking has been rationalizedand reorganized through these message and banksettlementsystems see ‘‘On Correspondent Banking,’’Euromoney, December 1988, p. 115.a Canadian supplier, it will ask its US bank, whichwill communicate with its Canadian correspondentbank via SWIFT. The Canadian bank credits theaccount of the Canadian firm, while Aviva’s bankdebits Aviva’s account. The US and Canadian banksthen settle through CHIPS, with the Canadianbank being credited with US dollars and Aviva’sbank in the United States being debited the USdollars.& 432
MULTINATIONAL BANKINGEXHIBIT 19.1FOREIGN BANK OPERATIONS IN THE UNITED STATESThe following description of foreign bank operationsin the United States, including their importance to theUS financial system, is provided under the heading,‘‘What is a Foreign Bank?’’ by the Conference ofState Bank Supervisors.Foreign banks most often come to the UnitedStates to provide services to U.S. subsidiaries ofclients in their home countries. Once here, however,they provide a wide range of wholesalebanking services to U.S. businesses and individuals.In fact, foreign banks make almost 40% ofall loans to American businesses. As of December31, 2002 state-licensed foreign banks held morethan $1.15 trillion in assets, accounting for about86% of all foreign bank assets in the UnitedStates. Consequently, foreign banks play a criticalrole in the economy and the U.S. banking systems.Foreign banking organizations can acquire orestablish freestanding banks or bank holdingcompanies in the United States. These entities areregulated and supervised as domestic institutions.For most foreign banking organizations, however,it is more cost-effective and productive to operateas one of several other available structures:branches, agencies, loan production offices,representative offices, Edge Act or agreementcorporations. Each structure has a different set ofregulatory requirements and powers.Branches and agencies are the most commonstructures for commercial lending by foreignbanking organizations in the United States. Of the547 foreign banks in America, 300 are branches oragencies. The major difference between these twotypes of banking offices is that branches mayaccept deposits, but agencies generally may not.Both structures can make and manage loans,conduct foreign exchange activities, and trade insecurities and commercial paper. These officesmay conduct most of the activities a domestic bankperforms. The primary exception is that foreignbranches and agencies may not accept deposits ofless than $100,000 unless they had FDIC insurancebefore December 19, 1991 ...The FederalReserve serves as the federal regulator of statelicensedforeign bank branches and agencies, ina system similar to that for domestic banks.Foreign banks may also establish representativeoffices, which have more limited powers thanbranches or agencies. Foreign banks often openrepresentative offices as a first step to establish apresence in the United States. These offices serve asliaison between the parent bank and its clients andcorrespondent banks in the United States. Theymay develop relationships with prospective clients,but they cannot conduct any banking transactionsthemselves. Representative offices must registerwith the Federal Reserve, and may be licensed bythe states as well.Edge Act and agreement corporations are foreignbank offices chartered by the Federal Reserve(Edge Act) or the states (agreement corporations)to provide financing for international trade.Domestic banking organizations may also establishEdge Act or agreement corporations. Theseoffices have a broader range of powers than otherbanking organizations, but all their activities mustrelate to international trade. Other structuresavailable to foreign banks are commercial lendingcompanies, licensed by New York State, andexport trading companies.To protect American consumers and the overallstability of the U.S. financial system, the statesand the Federal banking agencies regulate andsupervise foreign banking operations in the UnitedStates. The major Federal laws affecting foreignbanks in the United States are the <strong>International</strong>Banking Act (IBA) of 1978 and the Foreign BankSupervision Enhancement Act (FBSEA) of 1991.The Riegle–Neal Interstate Banking and BranchingEfficiency Act of 1994 also addresses foreignbanks’ operations in the United States ...433 &
INSTITUTIONAL STRUCTURE OF TRADE AND FINANCEIn short, foreign banks in the United States arevaluable corporate citizens, and an essential partof the American financial system.Source: ‘‘What is a Foreign Bank?’’ Conference ofState Bank Supervisors, www.csbs.org/international/intl_foreign_bank.htmCorrespondent banking allows banks to helptheir customers who are doing business abroad,without having to maintain any personnel or officesoverseas. This relationship is primarily for settlingcustomer payments, but it can extend to providinglimited credit for each other’s customers and tosetting up contacts between local businesspeopleand the clients of the correspondent banks.Resident representativesIn order to provide their customers with help fromtheir own personnel on the spot in foreign countries,banks open overseas business offices calledrepresentative offices. These are not bankingoffices in the sense of accepting local deposits orproviding loans. The primary purpose of theseoffices is to provide information about local businesspractices and conditions, including the creditworthinessof potential customers and the bank’sclients. The resident representatives will keep incontact with local correspondent banks and providehelp when needed. Representative offices are generallysmall; they have the appearance of an ordinarycommercial office rather than a bank.Bank agenciesA bank agency is like a full-fledged bank in everyrespect except that it does not handle small retaildeposits. The agencies deal in the local moneymarkets and in the foreign exchange markets,arrange loans for businesses, clear bank drafts andchecks, and channel foreign funds into financialmarkets helping finance businesses and governments.Agencies are common in New York; forexample, Canadian and European banks keep busyoffices there, with perhaps several dozens of personneldealing in the short-term credit markets andin foreign exchange. Agencies also often arrange& 434long-term loans for customers and act on behalf ofthe home office to keep it directly involved in theimportant foreign financial markets.Foreign branchesForeign branches are operating banks just likelocal banks, except that the directors and ownerstend to reside elsewhere. Generally, foreign branchesare subject to both local banking rules andthe rules at home, but because they can benefitfrom loopholes, the extra tier of regulations is notnecessarily onerous. The books of a foreign branchare incorporated with those of the parent bank,although the foreign branch will also maintainseparate books for revealing separate performance,for tax purposes, and so on. The existence of foreignbranches can mean very rapid check clearingfor customers in different countries, because thedebit and credit operations are internal and can beinitiated by fax or electronic mail. This can offera great advantage over the lengthy clearing that canoccur via correspondents. The foreign branch alsooffers bank customers in small countries all theservice and safety advantages of a large bank, whichthe local market might not be able to support.There would probably be far more extensiveforeign branch networks of the large internationalbanks were it not for legal limitations imposed bylocal governments to protect local banks fromforeign competition. Britain has traditionally beenliberal in allowing foreign banks to operate and hasgained in return from the reciprocal rules that arefrequently offered. On the other hand, until the1980 Canadian Bank Act was passed, the openingof foreign bank subsidiaries within Canada wasprohibited, and branches of foreign banks are stillrestricted. The United States selectively allowsforeign banks to operate. The regulation and
MULTINATIONAL BANKINGsupervision of foreign banks within the UnitedStates is provided for in the <strong>International</strong> BankingAct of 1978. This act allows the US Comptroller ofthe Currency to grant foreign banks a license toopen branches (or agencies). The foreign banks canopen wherever state banking laws allow them to.The banks are restricted to their declared ‘‘homestate’’ and are subject to federally imposed reserverequirements when they are federally chartered. 10They have access to services of the Federal Reserveand can borrow from its discount window. Since1980, the foreign banks that accept retail depositshave been required to provide deposit insurance forcustomers. The foreign banks are relatively moreimportant in providing commercial and industrialloans than in other investment activities.Foreign subsidiaries and affiliatesA foreign branch is part of a parent organization thatis incorporated elsewhere. A foreign subsidiaryis a locally incorporated bank that happens to beowned either completely or partially by a foreignparent. Foreign subsidiaries do all types of banking,and it may be very difficult to distinguish them froman ordinary locally owned bank.Foreign subsidiaries are controlled by foreignowners, even if the foreign ownership is partial.Foreign affiliates are similar to subsidiaries inbeing locally incorporated and so on, but they arejoint ventures, and no individual foreign owner hascontrol (even though a group of foreign ownersmight have control).Consortium banksConsortium banks are joint ventures of thelarger commercial banks. They can involve a halfdozen or more partners from numerous countries.They are primarily concerned with investment,arrange large loans, and underwrite stocks andbonds. Consortium banks are not concerned with10 Foreign as well as domestic banks can, however, operateoutside their declared home states by establishing Edge Actsubsidiaries. These are discussed later in this chapter.taking deposits, and deal only with large corporationsor perhaps governments. They will take equitypositions – part ownership of an investment – aswell as make loans, and they are frequently busyarranging takeovers and mergers.Edge Act and agreement corporationsWhile US banks can participate in investment-bankconsortia and may operate branches overseas, theycannot themselves have equity – direct ownership –in foreign banking subsidiaries. However, becauseof a 1919 amendment to the Federal Reserve Actinitiated by Senator Walter Edge, US banks areable to establish subsidiaries for doing business‘‘abroad.’’ These subsidiaries, which are federallychartered, can have equity in foreign banks and areknown as Edge Act corporations. They profitboth from holding stock in subsidiaries overseasand by engaging in investment banking whichinvolves borrowing and investing. Edge Actcorporations engage in almost all the activities ofbanking: accepting deposits, making loans, exchangingcurrencies, selling government and corporatesecurities, and so on. They can invest in equity,while domestic banks are not allowed to. 11 A majorimpetus to the growth of Edge Act corporations hasbeen that they enable a bank to open an officeoutside of its home state. The <strong>International</strong> BankingAct of 1978 allows foreign banks to open Edge Actcorporations and accept deposits directly related tointernational transactions. There is no longer a rulethat states that foreign-bank-owned Edge Act corporationswill be permitted only if the directors ofthese corporations are US citizens. These changes inthe <strong>International</strong> Banking Act were made to putforeign and US banks on a more equal footing.11 In February 1988, the Federal Reserve Board made anexception when it allowed US banks to swap loans togovernments of heavily indebted developing countriesinto equity investments. This was done to help the debtorcountries and the US banks deal with the third-worlddebt crisis.435 &
INSTITUTIONAL STRUCTURE OF TRADE AND FINANCEAgreement corporations are a little differentfrom Edge Act corporations. The authority toestablish agreement corporations dates from a 1916amendment to the Federal Reserve Act. This allowsbanks that are members of the Federal ReserveSystem to enter into an agreement with that organizationto engage in international banking. Agreementcorporations, unlike Edge Act corporations,can be chartered by a state government, but theycan only engage in international banking, not ingeneral investment activities. There are very fewagreement corporations.US international banking facilities (IBFs)We have already mentioned IBFs in connection withthe Eurodollar market. Since 1981, US banks, EdgeAct corporations, foreign commercial banksthrough branches and agencies in the United States,savings and loan associations, and mutual savingsbanks have been allowed by the Board of Governorsof the Federal Reserve System to establish IBFs asadjunct operations. 12 The motive for this permissionis to allow banks in the United States to participatein the lucrative offshore currency market.IBFs are not subject to domestic banking regulations,including reserve requirements and interestceilings, and escape some local and state taxes. IBFscan accept deposits only from non-Americans andwith a minimum size of $100,000. Withdrawalsare also subject to a $100,000 minimum. Depositscannot be withdrawn without at least 2 days’ notice.However, overnight deposits can be offered tooverseas banks, other IBFs, and the IBF’s parentbank. Funds obtained by IBFs cannot be useddomestically; they must be used overseas. Toensure that US-based companies and individualssatisfy this requirement, borrowers must sign astatement when they begin taking loans. Severalhundred IBFs have been established, the majority inNew York and California.12 For more on IBFs see K. Alec Chrystal, ‘‘<strong>International</strong>Banking Facilities,’’ Review, Federal Reserve Bank ofSt. Louis, April 1984, pp. 5–11.& 436Why banking has become multinationalThrough the opening of representative offices,agencies, and branches and through the acquisitionor establishment of subsidiaries, bankinghas become a truly multinational enterprise.While reputation, regulation, and the other factorscontributing to the multinationalization of businessin general apply to banking, there are special factorsthat apply to banking alone. These include marketinformation, borrower information, serving clients,custodial services, and regulation, all of which arediscussed below. 13Market informationIt might seem that with the rapid dissemination ofinformation via modern subscription services suchas Bloomberg, Reuters, Dow Jones Newswires, andMoneyline Telerate, which flash up prices and newsdevelopments on video screens at the speed of light,there is no need to have operations in expensivemoney centers such as London and New York.However, it is one thing to be plugged into thelatest developments, but quite another to be able tointerpret or even anticipate events. For being ableto interpret what is happening and to get a sense ofwhere markets are going there is nothing like havingpersonnel on the spot in the big markets whereimportant events are unfolding. For this reason wefind a vast number of foreign banks with offices inthe large money-market centers, especially Londonand New York. Many of these offices may not beprofitable on their own, but by acting as eyes andears for their parent banks, they improve theprofitability of overall operations.13 For empirical evidence on the importance of some differentfactors for the evolution of multinational banking seeMichael A. Goldberg, Robert W. Helsley, and MauriceD. Levi, ‘‘On the Development of <strong>International</strong> FinancialCenters,’’ The Annals of Regional Science, February 1988,pp. 81–94. For the evolution of the structure of internationalbanking see Robert L. Heinkel and Maurice D. Levi, ‘‘TheStructure of <strong>International</strong> Banking,’’ Journal of <strong>International</strong>Money and <strong>Finance</strong>, June 1992, pp. 251–72.
MULTINATIONAL BANKINGBorrower informationWhen making loans abroad, banks could in theorytake the word of a foreign bank such as a correspondentabout the financial stability of a borrower,or send bank personnel to the borrower’s country andreview the borrower’s finances on the spot. It can,however, be cheaper and more efficient to maintainlocal offices to gather ‘‘street talk,’’ not only at thetime of making a loan, but afterwards when theborrower’s circumstances may suddenly deteriorate.The importance of reliable information aboutborrowers has played a significant role in bankinghistory and, in particular, in the relative success ofearly family banking houses. For example, it wasno accident that the Rothschild bank did so well in thenineteenth century, after the founder, MayerRothschild of Frankfurt, posted his sons in the capitalsof Europe. Mayer Rothschild could trust the reportscoming from his sons about the quality of sovereignborrowers in a way that banks without ‘‘in house’’overseas representation could not. Thus, in competitionwith banks with less reliable information, familybanking houses such as the Rothschilds, Warburgs,and others did extremely well. Indeed, we canmeaningfully consider the family banking houses ofEurope as the precursors of today’s multinationalbanks, their success being based on the same factors. 14Serving clientsProfit-maximizing banks do not open overseasoffices merely to provide services for clients.Usually, correspondents could do most of what an14 The House of Rothschild in particular knew the valuenot just of information about borrowers, but also aboutevents which could affect financial markets. For example,by using pigeons, runners, horsemen, and rowers, NathanRothschild, the London-based member of the Rothschildfamily, knew before others that the Duke of Wellingtonhad defeated Napoleon in the battle fields of Waterloo in1815. Rothschild capitalized on his superior information byselling British bonds. This triggered panic selling, because itwas known that Rothschild would be the first in London toknow the outcome of the battle. Rothschild profited byemploying others to buy the heavily discounted bondsbefore word finally arrived that Wellington had won.overseas office can do to serve customers.However, it may be better for a bank to serve itsdomestic customers in their foreign operations thanto allow its customers to develop strong ties withforeign banks or competing domestic banks that dohave overseas offices. Some overseas banking officesmay therefore follow the trade of domestic clientsfor strategic reasons rather than to earn from theservices provided to clients.Of course, it may be that the services that areprovided by overseas banking offices are profitable.For example, the handling of collections and paymentsfor domestic clients engaged in foreign tradecan be lucrative and serve as reason for having anoffice, such as a representative office, in a country inwhich important clients are doing business. Indeed,for many banks the fees from services provided tocustomers that are connected to international tradehave become an increasingly important component oftheir earnings. For example, the sale of letters ofcredit, the discounting of bills of exchange, the provisionof collection services, and the conversion ofcurrencies have become increasingly important incomparison with accepting deposits and making loans.Custodial servicesOne fee-for-service activity of multinational banksthat was mentioned in Chapter 15 is the provision ofcustodial services. These services are provided toclients who invest in securities overseas. As we haveseen, global custodians take possession of foreignsecurities for safekeeping, collect dividends or offerup coupons, and handle stock splits, rights issues,tax reclamation, and so on. The custodians aretypically banks. It is clear that custodial servicesrequire that banks have overseas offices, that is, thatthey be multinational.Avoiding regulationsIn the list of reasons why banks have become somultinational we should not overlook the role ofregulations. As we saw in our discussion of theevolution of the offshore currency market, banks437 &
INSTITUTIONAL STRUCTURE OF TRADE AND FINANCEhave frequently moved abroad to avoid reserverequirements, deposit insurance, onerous reportingrequirements, corporate taxes, interest-rateceilings, and other hindrances to their operations.For example, many US banks opened offices inLondon and in tax-havens to avoid US regulationsand taxes. Similarly, many Japanese banks haveopened offices in New York and London to avoiddomestic restrictions and to exploit special opportunities.Indeed, over the years, the activitieswhich are open to foreign banks have becomeincreasingly similar to those open to domesticbanks. This is made clear in Table 19.2, whichshows by the similarity of the ‘‘yes’’ and ‘‘no’’entries for functions in different centers that,with a few exceptions, there is little discrimination& Table 19.2 Activities open to different institutions in different centersActivity Location a Permitted to bUSBankHolding Co.JapaneseCity BankUKClearingBankUSSecuritiesFirmJapaneseSecuritiesFirmBanking NY Yes Yes Yes S S SLicense LO Yes Yes Yes Yes Yes YesTO Yes Yes Yes No No NoDealing in NY No No No Yes Yes Yescorporate LO Yes Yes Yes Yes Yes Yessecurities TO S No S Yes Yes YesForeign- NY Yes Yes Yes Yes Yes Yesexchange LO Yes Yes Yes Yes Yes Yesdealing TO Yes Yes Yes No No NoDealing in NY Yes Yes Yes Yes Yes YesUS treasuries LO Yes Yes Yes Yes Yes YesTO No No No Yes Yes YesDealing in NY No No No Yes Yes YesUK gilts LO Yes Yes Yes Yes Yes YesTO No No No Yes Yes YesDealing in NY No No No Yes Yes YesJapanese LO Yes Yes Yes Yes Yes Yesgovernment bonds TO Yes Yes Yes Yes Yes YesTrust bank NY Yes Yes Yes S S SLO Yes Yes Yes Yes Yes YesTO Yes No Yes No No NoAccount at NY Yes Yes Yes S S Sthe central LO Yes Yes Yes Yes Yes Yesbank TO Yes Yes Yes Yes Yes YesNotesaNY¼ New York; LO ¼ London; TO ¼ Tokyo.b Yes ¼ full license permitted; No ¼ not generally permitted; S ¼ permitted only through special-purpose companies,such as a 50-percent-owned affiliate or a ‘‘near bank.’’Source: E. Gerald Corrigan, ‘‘A Perspective on the Globalization of Financial Markets and Institutions,’’Quarterly Review, Federal Reserve Bank of New York, Spring 1987, pp. 1–9.& 438UKMerchantBank
MULTINATIONAL BANKINGbetween foreign and domestic banks in theimportant financial centers – New York, London,and Tokyo.While overseas offices may make banks moreprofitable by avoiding domestic regulations, atthe same time they make banks and the bankingindustry more vulnerable and subject to crisisthrough ‘‘contagion.’’ It is worthwhile consideringthis as well as other problems that can accompanythe multinationalization of banking.The problems of multinational banking‘‘Deregulation wars’’Banking can be risky business. Evidence of the risk ofmultinational banking has been provided by a stringof failures and other crises including the failure ofFranklin National Bank and Bankhaus Herstatt;major losses by the Union Bank of Switzerland,Westdeutsche Landesbank, Lloyds <strong>International</strong>,Anglo Irish Bank, and Barings; the upheaval at theBanco Ambrosiano; and the banking crisis of the 1980s,which occurred after Mexico, Brazil, Argentina, andover 20 other borrowers announced they were unableto meet scheduled repayments on their debts.The major cause of the risk of multinationalbanking is also a major cause of the development ofmultinational banking. In particular, the openingof overseas offices to avoid domestic regulations suchas reserve requirements, reporting of asset positions,and payment for deposit insurance has at the sametime made banks more vulnerable to deposit withdrawals.Furthermore, the acceptance of default andother risks from overseas lending has made banks’domestic depositors subject to greater risks. Whilethere has been some easing of anxiety of depositors inthe twenty-first century, it is worthwhile consideringwhy the problem developed.Banking provides a country with jobs and prestige.Consequently, each country has an incentive tomake its regulations just a little more liberal thanother countries’ and thereby attract banks fromother locations. For example, if London can be alittle less regulated than New York, it can gain atNew York’s expense. Then, if the Cayman Islands,Bermuda, the Netherlands Antilles, or Liechtensteincan be less regulated than London, they can gain atLondon’s expense. The attractiveness of banking inthis way can draw more and more countries intocompetitive deregulation, with special advantagesbeing offered by Cyprus, Jersey, Guernsey, Malta,Madeira, Gibraltar, Monaco, the Isle of Man, andother new entrants. Traditional centers like Londonand New York may be forced to respond to avoidlosing their niche. Indeed, there was a wave offinancial deregulations in the 1990s that left morethan a few regulators feeling extremely uneasy.One approach to help prevent ‘‘deregulationwars’’ is international cooperation. Some effortshave been made in this regard. For example,the Basle Committee was established after theHerstatt and Franklin bank failures for the purpose of‘‘better co-ordination of the surveillance exercisedby national authorities over the international bankingsystem ...’’ This committee has had some success insharing information on banks and their subsidiaries sothat national regulators can learn more quickly aboutdifficulties occurring outside the country that couldadversely affect bank safety at home. For example,for the situation of a subsidiary experiencingserious loan losses, the 1975 and 1983 ConcordatAgreements among the Basle Committee membersprovide a procedure for relaying this information tothe parent bank’s regulators.With the world’s financial system so intricatelyconnected and with deregulations having taken ona competitive element, those responsible for overseeingthe international banking system soundedthe alarm and swung into action. The leading rolewas taken by the Bank for <strong>International</strong> Settlements(BIS), which set new global standards for banksafety. 15 The most important step was the establishmentof a recommended capital requirement of8 percent, meaning that banks should maintain a networth, or equity, of at least 8 percent of depositsand other liabilities. While banks in many countries15 The Bank for <strong>International</strong> Settlements is discussed inChapter 23. See especially Exhibit 23.4.439 &
INSTITUTIONAL STRUCTURE OF TRADE AND FINANCEEXHIBIT 19.2DERIVATIVES: DIFFERENTIATING THE HYPERBOLEDebate over the potential benefits and dangers of theexplosive growth in derivatives trading hasbeen raging without any resolution. Nothing highlightedthe debate more than the dramatic eventssurrounding the financial crisis that followed the lossesof Long-Term Capital Asset Management, LTCM,which led to investigations by the United StatesGeneral Accounting Office and other internationalbodies.Do banks that buy and sell currency or interestfutures and options put themselves, their depositors,and even taxpayers at risk, or are they reducing riskfor themselves and everybody else by hedging theirbusiness exposures? As the great British economistJohn Maynard Keynes is reported to have said: ‘‘Ifyou lose a thousand pounds you have a problem. If youlose a million pounds the bank has a problem.’’ Wemight extend this to say that if you lose a billionpounds, we all have a problem. Do the banks or do weeven all have a problem, or are derivatives as DavidMullins, a former Vice President of the US FederalReserve said, ‘‘one of the most dramatic successstories in modern economic history?’’There is no doubt that derivatives can reduce risk,with futures, currency options and other instrumentswell designed to eliminate or at least greatly reducedangers from involvement in foreign exchange.However, this is a complex matter, and the instrumentsthemselves can be complex. They also linkmany different markets, with potential spilloverbetween them. One of the dangers is so-called counterpartyrisk whereby failure of one party to cover lossescould have a domino effect as others counting onpayment from the failed party find themselves in turnunable to pay their creditors.Regulation is difficult in the derivatives markets,and it is hard to do anything without knowing theexposures faced by the different parties, especiallythe banks. At the very least we can expect greaterreporting requirements and higher capital adequacystandards.Source: Based in part on ‘‘Long-Term Capital Management:Regulators Need to Focus Greater Attention on SystemicRisk,’’ Report of the United States General AccountingOffice, October 29, 1999, and ‘‘A Survey of <strong>International</strong>Banking,’’ The Economist, April 30, 1994, p. 40.were at or above this capital standard at the time itwas recommended, other banks, especially in Japan,were below it. This required banks with inadequatecapital to issue shares and/or reduce their liabilitiesin order to move toward the new BIS standard.Derivatives tradingOne problem which has occupied the attention ofthe BIS and the G-8 members is the increasedactivity of banks in the derivatives markets. 16The concern is the risk that some banks face that isnot reflected in traditional measures of bank safety,such as the reserve-deposit and capital-deposit16 We refer to the G-8, consisting of the G-7 plus Russiawhich has been given a seat at the periodic G-7 financeministers’ meeting. The Group of Seven, G-7, is the UnitedStates, Britain, Japan, Germany, France, Italy, and Canada.& 440ratios. Concern over bank trading in derivativesreached crisis proportions after the massive lossesof Barings from trading in Japanese stock marketindex futures by a 28-year-old trader at the bank’sSingapore office. (Losses, revealed in 1995, exceeded$1 billion.) Losses at Anglo-Irish, a bank inBaltimore, were also due to losses in derivativestrading. While it is true that trading derivatives suchas currency and interest-rate futures and options canbe risky, as Exhibit 19.2 points out, derivatives canbe used to reduce risk as well as to take risk. It alldepends on other business exposures that a companyfaces. This is what makes the issue of derivativesso difficult for regulators to resolve. Thematter is still a burning issue for policymakers, andwe can expect further changes in standards in thefuture, especially in the requirements for disclosureof derivative positions of banks.
MULTINATIONAL BANKINGSUMMARY1 Eurodollars are US-dollar bank deposits held outside the United States. Includedwithin the Eurodollar market are the Asiadollar market and other markets outsideEurope.2 Offshore currencies are bank deposits held outside the home countries of thecurrencies.3 Offshore currency markets allow investors and borrowers to choose among differentcurrencies of denomination at the same location.4 The commonly held view is that Eurodollars came into existence initially as the result ofthe preferences of Soviet holders of dollar balances. For safety and ideological reasons,they preferred to hold their dollars in Europe. Perhaps more important were the USFederal Reserve System regulations on maximum levels of interest rates on deposits, andon holding reserves. These regulations encouraged a flow of dollars to Europe. Theborrowing of these dollars was stimulated by credit and capital-flow restrictions in theUnited States.5 The convenience of holding deposits in and negotiating loans with local banks, as well asthe lower spreads on offshore currencies from the absence of severe regulation, resultedin the later expansion of Eurodollars and other offshore currencies.6 Offshore currencies result in potential multiple expansions of bank deposits. The size ofthe multiplier depends on the speed with which funds leak to a currency’s home market.7 Banks can do business abroad via holding deposits with foreign banks, calledcorrespondents. They can also post representatives abroad to help clients. If theywish even greater involvement overseas, they can consider opening an agency, whichdoes not solicit deposits, open a foreign branch, or buy or establish a subsidiary.Banks can venture abroad as part of a consortium. In the United States, banks canestablish an Edge Act subsidiary to invest in foreign subsidiary banks or otherwiseinvest outside the home state or abroad, or they can establish an international bankingfacility.8 Banks are among the most multinational of firms. The benefits of being multinationalinclude more timely and meaningful information on financial markets and events, betterinformation on borrower quality, keeping domestic clients from using other banks whendoing business overseas, earning fees from custodial and other services, and avoidingonerous regulations.9 The opening of overseas offices to avoid domestic regulations on required reserves, onreporting assets, and on paying deposit insurance premiums may have increased theriskiness of banks. That is, the major factors making banks multinational are also themajor factors contributing to their riskiness.10 Countries have to some extent competed with each other by progressivelyderegulating banking. Banking regulators have tended to match the deregulations ofother countries to make their countries attractive to banks, but as a result, banking hasbecome more risky.441 &
INSTITUTIONAL STRUCTURE OF TRADE AND FINANCEREVIEW QUESTIONS1 What is a Eurodollar?2 What is an offshore currency?3 How did the US Federal Reserve contribute to the supply of Eurodollar deposits?4 What contributed to the demand for Eurodollar loans?5 Did US trade deficits contribute to the growth of Eurodollars?6 What is meant by ‘‘LIBOR?’’7 Why do banks trade Eurodollar futures?8 What is the Eurodollar multiplier?9 How do leakages of dollars back to the United States affect the size of the Eurodollarmultiplier?10 Why do banks have correspondent relationships with other banks?11 How does a foreign bank agency differ from a branch?12 Why have some banks set up Edge Act corporations?13 What is an IBF?14 In what ways has information contributed to the multinationalization of the bankingindustry?ASSIGNMENT PROBLEMS1 Since a person can open an offshore sterling account with dollars – by converting thedollars into pounds – or open a dollar account with sterling, what yield differences canexist between different (forward-hedged) offshore currency deposits?2 Why do you think Eurodollars are the major offshore currency? Does it have to do withthe amount of business transacted in US dollars?3 Given the relatively extensive use of dollars in denominating sales contracts ininternational trade, are Eurodollar multipliers likely to be larger than multipliers forother offshore currencies? (Hint: Recall that the value of a multiplier has to do with thespeed with which funds return to their home.)4 a What is the Eurodollar creation from a deposit of $2 million when the offshorebanks maintain a 5 percent reserve? Assume that the $2 million is deposited in aLondon office of Barclays Bank, which makes a loan to British Holdings Ltd, whichuses the funds to pay for goods from British Auto Ltd, which in turn places theproceeds in Citibank in London. Assume that Citibank uses its extra dollars to makea loan to Aviva Corporation, which uses the dollars back in the United States.b Recompute the change in Eurodollars in 4a assuming instead that a 10 percentreserve-deposit ratio is maintained.c Recompute the change in Eurodollars in 4a with the 5 percent reserve ratio,assuming that five banks are involved before leakage occurs.d What do you think is more important in affecting the size of the Eurodollarmultiplier – the size of reserve ratio or the time before a leakage occurs?& 442
MULTINATIONAL BANKING5 Give a reason (or reasons) why each of the following might open a Eurodollar accounta The government of Iranb A US private citizenc A Canadian university professord A European-based corporatione A US-based corporation.6 Does it make any difference to the individual bank that makes a loan whether the loanedfunds will leak to the United States? In other words, does the individual bank lose thefunds no matter who borrows the dollars?7 What is the difference between a foreign branch, a foreign subsidiary, a foreign affiliate,and a foreign agency? Which type(s) of foreign banking will make banks multinational?8 If the object of US banks moving overseas had been purely to help customers, could theyhave used only correspondent relationships and representative offices? Why then do youbelieve they have opened branches and purchased subsidiaries?9 In what way does Table 19.2 suggest little discrimination against foreign financial firms?Can you find any apparent examples of discrimination?10 Empirical evidence suggests that banks tend to locate near importers rather thanexporters. What do you think is responsible for this?BIBLIOGRAPHYAliber, Robert Z., ‘‘<strong>International</strong> Banking: A Survey,’’ Journal of Money, Credit and Banking, Part 2, November1984, pp. 661–78.Baker, James C. and M. Gerald Bradford, American Banks Abroad, Edge Act Companies and MultinationalBanking, Frederick A. Praeger, New York, 1974.Bhattacharya, Anindya, The Asian Dollar Market, Frederick A. Praeger, New York, 1977.Corrigan, E. Gerald, ‘‘Coping with Globally Integrated Financial Markets,’’ Quarterly Review, Federal ReserveBank of New York, Winter 1987, pp. 1–5.Debs, Richard A., ‘‘<strong>International</strong> Banking,’’ Monthly Review, Federal Reserve Bank of New York, June 1975,pp. 122–9.Dufey, Gunter and Giddy, Ian, The <strong>International</strong> Money Market, Prentice-Hall, Englewood Cliffs, NJ, 1978.Einzig, Paul A., The Euro-Dollar System, 5th edn, St. Martin’s Press, New York, 1973.Freedman, Charles, ‘‘A Model of the Eurodollar Market,’’ Journal of Monetary Economics, April 1977,pp. 139-61.Friedman, Milton, ‘‘The Euro-Dollar Market: Some First Principles,’’ Morgan Guarantee Survey, October 1969,pp. 4–44.Goldberg, Michael A., Robert W. Helsley, and Maurice D. Levi, ‘‘On the Development of <strong>International</strong> FinancialCenters,’’ The Annals of Regional Science, February 1988, pp. 81–94.Heinkel, Robert L. and Maurice D. Levi, ‘‘The Structure of <strong>International</strong> Banking,’’ Journal of <strong>International</strong> Moneyand <strong>Finance</strong>, June 1992, pp. 251–72.Henning, Charles N., William Pigott, and Robert H. Scott, <strong>International</strong> Financial Management, McGraw-Hill,New York, 1977.443 &
INSTITUTIONAL STRUCTURE OF TRADE AND FINANCEKlopstock, Fred H., ‘‘Money Creation in the Euro-Dollar Market: A Note on Professor Friedman’s Views,’’ MonthlyReview, Federal Reserve Bank of New York, January 1970, pp. 12–15.Lees, Francis A., <strong>International</strong> Banking and <strong>Finance</strong>, John Wiley & Sons, New York, 1974.McKenzie, George W., The Economics of the Euro-Currency System, John Wiley & Sons, New York, 1976.McKinnon, Ronald I., The Offshore Currency Market, Essays in <strong>International</strong> <strong>Finance</strong>, no. 125, PrincetonUniversity Press, Princeton, NJ, 1977.Ricks, David A. and Arpan, Jeffrey S. ‘‘Foreign Banking in the United States,’’ Business Horizons, February 1976,pp. 84–7.Robinson, Stuart W., Jr, Multinational Banking, A. W. Sijthoff <strong>International</strong>, Leiden, The Netherlands, 1972.& 444
Chapter 20Instruments and institutionsof international tradeIn war as in love, to bring matters to a close, you must get close together.NapoleonEXTRA DIMENSIONS OFINTERNATIONAL TRADEIn ordinary domestic commercial transactions,there are reasonably simple, well-prescribed meansof recourse in the event of nonpayment or othercauses of disagreement between parties. Forexample, the courts can be used to reclaim goodswhen buyers refuse to pay or are unable to pay.The situation is substantially more complex withinternational commercial transactions, which bynecessity involve more than one legal jurisdiction.In addition, a seller might not receive payment, notbecause the buyer does not want to pay, butbecause, for example, the buyer’s country has aninsurrection, revolution, war, or civil unrest anddecides to make its currency inconvertible intoforeign exchange. In order to handle these and otherdifficulties faced in international transactions,a number of practices and institutional arrangementshave been developed, and these are explainedin this chapter.In addition to different practices and institutionsfor ensuring payment and delivery in internationalversus domestic trade, national and internationalinstitutions have been established to finance andmonitor international trade. This chapter willdescribe the roles of these institutions as well asexplain practices such as forfaiting and countertradethat are unique to the international arena.INTERNATIONAL TRADE INVOLVINGLETTERS OF CREDIT: AN OVERVIEWOF A TYPICAL TRANSACTIONIn order to give a general introductory overview ofthe documentation and procedures of internationaltrade, let us suppose that after considering costs ofalternative suppliers of cloth, Aviva has decided tobuy cloth from the British denim manufacturerBritish Cotton Mills Ltd. An order is placed for1 million yards at £4 per yard, with Aviva to receivethe shipment in 10 months, and pay 2 months afterdelivery.Assume that after having made the agreementwith British Cotton Mills, Aviva goes to its bank,Citibank, N.A., in New York and buys forward(12 months ahead) the £4 million. Assume that atthe same time Aviva requests a letter of credit,which is frequently referred to as an L/C, or simplyas a credit. 1 An example of a letter of credit1 If Aviva frequently does business with British Cotton Mills,or if Aviva has had problems paying in the past, a differentprocedure is likely to be used. This is described later in thechapter.445 &
INSTITUTIONAL STRUCTURE OF TRADE AND FINANCEapplication and agreement issued by Citibank,N.A., in New York is shown in Figure 20.1. 2 Theletter of credit is a guarantee by Aviva’s bank that ifall the relevant documents are presented in exactconformity with the terms of the letter of credit,the British exporter will be paid. Aviva Corporationwill have to pay Citibank, N.A., a fee for the letterof credit. Citibank will issue the letter only if it issatisfied with the creditworthiness of AvivaCorporation. If it is unsure, it will require somecollateral.A copy of the letter of credit will be sent toCitibank, N.A., in London. That bank will informthe British exporter’s bank, Britbank Ltd., whichwill in turn inform British Cotton Mills of the creditadvice. In our example, Citibank is both the‘‘opening bank’’ and the ‘‘paying bank,’’ as shownby the ‘‘drawn on’’ entry in the letter, while Britbankis the ‘‘advising bank.’’ On receiving the letterof credit advice, British Cotton Mills Ltd. can beginproducing the denim cloth, confident that even ifAviva Corporation is unable to pay, payment willnevertheless be forthcoming from Citibank, N.A.The actual payment will be made by means of adraft (also called a bill of exchange), and thiswill be drawn up by the exporter or the exporter’sbank after receipt of the letter of credit. The draftstipulates that payment is to be made to theexporter at the exporter’s bank, and therefore it isdifferent from conventional checks, which aredrawn up by those making the payment rather thanby those who are to receive payment.The draft corresponding to the letter of credit inFigure 20.1 is shown in Figure 20.2a. It was drawnup by the exporter, British Cotton Mills Ltd., andspecifies that £4,000,000 is to be paid at theexporter’s bank, Britbank. This is a time or usance2 The format of the letter of credit application andagreement shown in Figure 20.1 follows the standardrecommended by the <strong>International</strong> Chamber ofCommerce. The letter in Figure 20.1 was kindlyprovided by Citibank, N.A. Examples of letters of creditand other documents can be found in An Introduction toLetters of Credit, Citibank, New York 1991. The letter ofcredit we have presented is for a straightforward situation.& 446draft, because the exporter, British Cotton Mills, isallowing a 60-day credit period. 3 The draft will besent directly or via Britbank Ltd. to Citibank, N.A.,in London, and that bank will accept the draft ifthe draft and other relevant documents that arepresented to the bank are in exact conformity withthe letter of credit. If the draft is stamped and signedby an officer of Citibank, it becomes a banker’sacceptance. A banker’s acceptance looks like thespecimen in Figure 20.2b. 4British Cotton Mills Ltd. can sell the accepteddraft at a discount which reflects the interest cost ofthe money advanced but not any risk associated withpayment by Aviva Corporation because the draft hasbeen guaranteed. The draft is sold in the banker’sacceptance market at a discount related to thequality of the accepting bank, Citibank. Since thedraft is in pounds, it will be discounted at a poundrate of interest and will probably be sold in theLondon money market. Alternatively, instead ofselling the draft, British Cotton Mills Ltd. can waituntil payment is made to Britbank Ltd. and itsaccount with the bank is credited. This will occuron June 30 – 2 months after the date on which thedraft was accepted (April 30) and a year after thedate of the sales contract.Citibank in London will forward the documentsto New York. Citibank in New York will requirepayment from Aviva Corporation on June 30 of thedollar amount in the forward contract agreed to inthe previous year for the purchase of £4 million. Atthe same time that Aviva’s account is debited byCitibank in New York, Citibank will give thedocuments to Aviva. The New York and Londonoffices of Citibank will then settle their accountswith each other. British Cotton Mills will have beenpaid via Britbank; Aviva will have paid Citibank inNew York; Citibank in New York will have paidCitibank in London; and Citibank in London will3 The maturity of a time or usance draft is also sometimesreferred to as its tenor.4 Citibank in London is the accepting bank because the draftis in pounds. If the draft were denominated in dollars, itwould be accepted by Citibank in New York.
FINANCIAL INSTRUMENTS AND INSTITUTIONS& Figure 20.1 Application and agreement for documentary letter of creditSource: Citibank N.A. Reproduced by permission.447 &
INSTITUTIONAL STRUCTURE OF TRADE AND FINANCE(a) Bank draft& Figure 20.2 The draft and banker’s acceptanceSource: Citibank N.A. Reproduced by permission.(b) Banker’s acceptancehave paid Britbank. Aviva will have the papers toreceive the cloth. The transaction is complete. Thesteps are summarized in the numbered sequence inFigure 20.3.Because the letter of credit in Figure 20.1requires that certain documents be presented, it isa documentary credit. This is shown at the topof the letter. The accompanying draft (Figure 20.2a)is referred to as a documentary draft. Acleandraft does not require a letter of credit or othersupporting documents and is used only when there& 448is complete trust – for example, when goods areshipped between subsidiaries of the same multinational.If the documents are delivered upon theacceptance of a draft, the draft is an acceptancedraft, and if the documents are delivered upon thepayment of a draft, the draft is a payment draft. 55 When payment is made upon the presentation of a draft,the draft is a sight draft. When payment is made after sight,the draft is a time draft (as in Figure 20.2a)
FINANCIAL INSTRUMENTS AND INSTITUTIONSCitibank New York2Application forletter of creditand forwardpounds sterling9Aviva debiteddollar amount offorward pounds;receives documentsAviva Corporation3Citibankissues letterand advisesBritbankPartiesagree onprice, etc.110Aviva presentsdocuments andcollects goods8Documents sentto New York;Citibank Londondebits CitibankNew York forpounds sterlingBritish Cotton Mills Ltd.Beforeshipmentdraft drawnfor paymentfor goodsAdvice5 of letterof credit47Britbank Ltd.CitibankLondonDraft accepted,and paid after 60 days;British Cotton creditedpounds sterlingBritbank forwards6 draft and otherdocuments& Figure 20.3 The steps in international tradeSource: Leonard A. Back, Introduction to Commercial Letters of Credit, Citicorp, New York, undated.The most important document that is requiredbefore a bank will accept a draft is the bill oflading. The bill of lading, or B/L, isissuedbythecarrierandshows thatthecarrier hasoriginated theshipment of merchandise. The B/L can serve as thetitle to the goods, which are owned by the exporteruntil payment is made. Then, via the participatingbanks, the bill of lading is sent to the importer to beused for claiming the merchandise. An order bill oflading is a bill which gives title to a stated party. Itcan be used by that party as collateral for loans.When goods are sent by air, the equivalent of thebill of lading is called an air waybill. This servesthe same purpose as a bill of lading, being requiredfor release of the goods and transferring ownershipfrom seller to shipper to final buyer. A logisticaldifficulty with air waybills is ensuring they reachbuyers before the goods which are to be claimed.The waybill may accompany the goods, but forreasons of safety – to ensure the right party receivesthe goods – waybills are better sent separately.Today, waybills can also be sent electronically.449 &
INSTITUTIONAL STRUCTURE OF TRADE AND FINANCEALTERNATIVE PAYMENT ANDGUARANTEEING PROCEDURESOpen-account and consignment salesIf Aviva and British Cotton Mills have been doingbusiness with each other for many years and Avivahas established a reputation for prompt payment,the company may try to avoid the expense of a letterof credit, for which banks charge a fee according tothe credit rating of the importer and the value of thecredit. Instead, Aviva might ask British Cotton Millsif it can order cloth on an open account basis,whereby the value of cloth shipped is added tothe account Aviva keeps at British Cotton Mills.An invoice might be sent at the end of each monthwhen transactions are frequent, or after each shipmentwhen they are infrequent, allowing Aviva topay by buying a clean draft, or simply by writinga check on an account denominated in the invoicecurrency. This saves collection fees as well as thecost of the letter of credit.In situations of trust, goods are sometimessupplied on a consignment basis. In this case,payment is not made until after the buyer has soldthe goods, and in the meantime the goods remainthe property of the supplier.Cash in advance and confirmed creditsWhen there is little or no trust, as after a firm hasdeveloped a bad reputation for settling its accounts,perhaps having been late settling previous transactionswith the supplier, payment may be requiredin advance. In this situation, cash is sent to thesupplier’s bank before the goods are shipped.When an exporter’s lack of trust concerns theimporter’s bank or the importer’s government –perhaps the importer’s bank is poorly capitalized, orperhaps the importer’s government might freezeforeign exchange payments – and when theimporter cannot pay cash in advance, the exportercan ensure payment by having a letter of creditguaranteed by a domestic bank. What usuallyhappens in this situation is that the exporter asksthe importer for a letter of credit, even though this& 450will be issued by a bank in the importer’s country.The exporter then takes this letter to a bank athome and pays the domestic bank to guarantee,or confirm, the letter of credit. The result willbe a foreign letter of credit with a domesticconfirmation. The exporter will then be paidregardless of what happens to the importer’s bankor in the importer’s country. Nonpayment due tothe failure of the importer’s bank or action taken bythe importer’s government is the problem of theconfirming bank and not the exporter, providedthat the exporter has delivered the goods.Export insuranceLetters of credit must be purchased by the importer,and while the cost is not high – usually a few percentat most if the importer’s credit is good – obtainingthe letter may be inconvenient, and will reduce theimporter’s remaining available credit for otherpurposes. For these reasons, an exporter may findthat a sale may not occur if they insist on a letter ofcredit. Indeed, pressure from other exporters whoare not requiring letters of credit frequently meansexporters can assume that any talk of letters ofcredit will mean no sale. In such a case exporterscan buy what can be considered an imperfect substitutefor a letter of credit, namely export creditinsurance. Credit insurance is arranged and paidfor by the exporter and can cover a variety of risks.It is possible to buy credit insurance againstcommercial risk only, or against both commercialand political risk. Insurance against both commercialand political risk serves rather like a confirmedletter of credit in that the exporter will be paidwhether the importer pays or not, and whether theimporter’s country allows payment or not. Insuranceagainst commercial risk alone serves rather likean unconfirmed letter of credit in that the exporterwill not be paid if the importer’s government preventspayment. However, there are some importantdifferences between letters of credit and exportcredit insurance, which is why export insurance isonly an imperfect substitute for an L/C. One ofthese differences is the presence of a deductible
FINANCIAL INSTRUMENTS AND INSTITUTIONSportion on insurance, whereas letters of credittypically cover 100 percent of credit. 6 The deductiblemeans the exporter loses something if theimporter does not pay. The uninsured portion of acredit is a contingent liability of the exporter. Aswith insurance in general, the deductible is a meansof reducing moral hazard. 7 Clearly, the presenceof a deductible makes credit insurance less desirableto exporters than confirmed letters of credit. So, ofcourse, does the need to pay for credit insurance;the importer pays for a letter of credit, while theexporter has to pay for export credit insurance. 8Typically, there are two forms of export creditinsurance. One form provides automatic coverageup to a stated limit on exporters’ receivables frombuyers whose credit the insurers have approved.This type of insurance is well suited to exporterswho must quote commodity prices over the telephoneand accept orders if the buyers agree to theseprices. For example, exporters selling lumber orwheat can buy credit insurance which covers allsales to approved buyers. This type of creditinsurance is variously called continuous, wholeturnover,orrollover insurance.A second form of credit insurance covers onlyspecific contracts and specific risks. For this, anexporter must apply for coverage of the specificexport credit. For example, if a firm receives anorder for six large passenger planes, the exporterwill have to apply to the credit insurer and state thespecifics of the sale. This type of insurance is usuallycalled specific commodities export creditinsurance.6 The deductible may be 10 percent or more of the amountinsured. There are also other differences between letters ofcredit and credit insurance when an exporter is unable todeliver goods, when goods are damaged or lost in transit,and so on: credit insurance typically provides broadercoverage than a letter of credit.7 Moral hazard involves changes in behavior after insurance hasbeen provided. Specifically, insurance increases the chance ofbad events covered by the insurance due to a lack of care.8 For a more detailed treatment of the pros and cons ofletters of credit and credit insurance see Dick Briggs andBurt Edwards, Credit Insurance: How to Reduce the Risks ofTrade Credit, Woodhead-Faulkner, Cambridge, UK, 1988.The rationale for government-providedcredit insuranceEven though export credit insurance can be purchasedfrom private-sector insurance companiessuch as the large British-based insurance companyTrade Indemnity and the horizontally integratedtrade facilitating company, Coface, most governmentsprovide export credit insurance themselves,usually through an especially established agency. Forexample, in the United States export credit insurancecan be purchased from the Export-Import Bank(‘‘Ex-Im Bank’’), in Britain from the Export CreditsGuarantee Department, in Sweden from the ExportCredits Guarantee Board, in China from the ChinaExport and Credit Insurance Corporation, and inCanada from Export Development Canada. Sincegovernments do not typically provide fire, life,disability, automobile, and accident insurance, it isworth asking why in the case of insurance of exportcredits it has become the norm for governments toarrange coverage. That is, why do governments stepin to insure export credits rather than allow privateinsurance companies to provide the insurance at acompetitively determined premium? Even apartfrom trying to subsidize exports because of thejobs and incomes they generate, there are ‘‘marketfailures’’ which might warrant government involvement.There are also arguments that the governmentmay be able to provide the insurance morecheaply. Let us consider these arguments.Natural economies of scaleCredit insurance requires the insurer to keepcurrent on the situation in different countries andin different companies. For private insurancecompanies to assess risks they all need to maintainoverseas offices around the world. 9 It might be thatthe market in each country could support only one9 Alternatively, the insurance companies might buyinformation from a country-risk-evaluating company.However, the risk-evaluating company would need tomaintain offices abroad if it were to be current on thesituations in different countries.451 &
INSTITUTIONAL STRUCTURE OF TRADE AND FINANCEcredit insurer, resulting in a monopoly. Then thegovernment might have to regulate the industry if itdid not provide the credit insurance itself. That is,from the economies of scale insurers enjoy, creditinsurance may be a natural monopoly. It isnormal to either regulate the pricing of naturalmonopolies, or for governments to provide theproduct itself.Economies of scopeAnother reason why governments may be bettersuited to provide export credit insurance than privateinsurance companies is that a governmentinsurer can provide a trade representative with adesk and staff within its existing embassies andconsular offices. The addition of the trade office isrelatively low cost given that the infrastructure isalready in place. A further advantage comes fromthe ability of government to use political muscle andthereby reduce risk of nonpayment of trade credits.For example, if a borrower decided they are notgoing to pay foreign creditors, a government exportcredit agency might ask its government to threatenwithdrawal of aid to the delinquent country. Theseare examples of economies of scope. Economiesof scope are a result of the range of activities performedor products produced, not the level ofactivity or production. In this case, governmentsenjoy economies of scope by being in a variety ofactivities, ambassadorial duties, and foreign aid, inaddition to providing export credit insurance.Positive spilloversA factor which supports official credit insuranceagainst private credit insurance, and which appliesto export financing as well as to export insurance, isthat there may be benefits to other firms in theexporting country if one of that country’s companiesmakes an export sale. For example, if a USengineering company wins a contract to supplymachinery to China, there may be improved prospectsfor other US companies to sell to China.Perhaps an American company that services theproduct might win a long-term contract. This is& 452not uncommon with complex equipment such ascommercial aircraft and central telecommunicationsequipment. That is, there may be positiveexternalities or spillovers that derive from anexport contract. These positive externalities willnot be considered by private export credit insurersin a competitive market, but a government agencycan take them into account when deciding whetherto provide export insurance or export financing.That is, export insurance and financing have elementsof a public good, and as is generally thecase for public goods, they will be underprovidedby private profit-maximizing firms.THE FINANCING OFINTERNATIONAL TRADEShort-term financing: banker’sacceptancesWhen an exporter gives credit to a foreign buyer byissuing a draft that is dated for settlement some timein the future, the draft itself can be used by theexporter for short-term financing. As explainedearlier, when the draft is stamped ‘‘accepted’’ bya bank and signed by an officer of the bank, it becomesa banker’s acceptance. The exporter can sell thebanker’s acceptance in the money market at a discountthat is related to the riskiness of the acceptingbank. If the exporter’s draft is drawn without a letterof credit from the importer’s bank, the draft is atrade draft. This can be sold in the money market,but because it is only a commercial rather than abank obligation, the draft will face a higher discountthan would a banker’s acceptance. However, theexporter can pay a bank to accept the draft, and thensell this at a lower discount. The acceptance chargecan be compared to the extra value received on theaccepted draft, with the acceptance path being usedonly if this costs less than the extra value received forthe accepted draft. All documents, including shippingdocuments, will normally be provided to thebank accepting the draft.When an exporter draws up a time draft, theexporter is granting the importer credit which the
FINANCIAL INSTRUMENTS AND INSTITUTIONSEXHIBIT 20.1JUST-IN-TIME INVENTORY SYSTEMS: TOO LATEFOR THE MERCHANT OF VENICEThe Merchant of Venice in Shakespeare’s play withthe same title faced a trade-financing problem. Formerchants of his day, goods would arrive from afar inlarge loads, in fact shiploads. Paying immediately forimported goods was difficult because of the sheer sizeof the amount that would arrive by ship, perhaps onceor twice in a year, and because sales from the largeinventories occurred continually through the year.Financing was needed to bridge the gap betweenlumpy arrival and steady sales, that is, financing wasneeded for the inventory stocks that the nature oftrade forced upon merchants.A just-in-time inventory system, were this to havebeen possible in the merchant’s Venice, would haveavoided the trade-financing problem. If goods couldhave arrived at the same rate as they were sold tocustomers in the area, the cash flow from sales wouldhave paid for the imports. Clearly, the nature of ships,which cannot be made small enough to deliver oneday’s worth of sales, prevented the use of just-in-timeinventories at that time, just as it does today. Betterpredictions of arrival of goods and of sales can reducethe required inventory levels, but they cannot eliminateinventories of imports and the need to financethem. However, instruments such as letters of credithave been developed to ensure payment, allowingtrade to be based on more acceptable collateral thanthe merchant’s pound of flesh. That is, if the Merchantof Venice had at his disposal a bank that could guaranteehis credit for an L/C fee, he could have guaranteedhis payment for imports with paper instead ofblood. Late arrival of payment for the imported productwould have forced the L/C-issuing bank to payShylock, lifting the merchant’s burden but stealingPortia’s poetic appeal for all-round compassion.The quality of mercy is not strain’d;It droppeth as the gentle rain from heavenUpon the place beneath. It is twice blest:It blesseth him that gives and him that takes.The Merchant of Venice, Act 4, Scene 1exporter may finance by selling the signed draft.When an exporter draws up a sight rather than atime draft, the exporter is not granting credit to theimporter; there is no delay in payment. Nevertheless,a banker’s acceptance may be created in thissituation. This will happen if the importer is in needof credit, and draws up a time draft in favor of abank, signs the draft, and has it accepted by thebank. The banker will immediately pay the importerthe discounted value of the draft. The bank will theneither sell the draft or hold it for collection. Animporter might take this step to finance goodspurchased from abroad before they are sold. 10The time after sight on a banker’s acceptance,whether created by the exporter or by the importer,is typically 30, 60, 90, or 180 days. Consequently,10 These means of financing trade and providing paymentguarantees are an alternative to historical procedures suchas those used by the Merchant of Venice. See Exhibit 20.1.bankers’ acceptances are only a mechanism forshort-term trade financing.Forfaiting: a form of medium-termfinanceForfaiting explainedForfaiting is a form of medium-term financing ofinternational trade. 11 It involves the purchase by theforfaiting bank, of a series of promissory notes,typically due at 6-month intervals for 3–5 years,signed by an importer in favor of an exporter. 1211 In French it is called a forfait, and in German, Forfaitierung.12 Of course, the language of these promissory notes must bein accordance with legal requirements. These requirementsare spelled out in the Geneva Convention of 1930, whichhas been signed by numerous countries, and the Bill ofExchange Act of 1882, which governs international tradepractice in Britain.453 &
INSTITUTIONAL STRUCTURE OF TRADE AND FINANCE(6) Machine delivery(3) Guaranteed notesUS jeansmachinemaker(4) Guaranteed notes(5) CashMoscowmanufacturerForfaitingbank(8) Payments made(2) Notes returned(1) Notes sent for guaranteeCurrentexchangesFutureexchangesNarodnybank(9) Payments made(7) Notes presented& Figure 20.4 The steps involved in forfaitingNotesForfaiting is a means of providing medium-term import credits. The importer prepares promissory notes that are guaranteedby a bank. These are sent to the exporter, who then sells them for cash to a forfaiting bank which may then sell the notes.The holder of the notes has no recourse to the exporter. The credit risk is entirely borne by the note holder.These notes are frequently avalled, or guaranteed,by the importer’s bank. The promissory notes aresold by the exporter to the forfaiting bank at adiscount. The forfaiting bank pays the exporterimmediately, allowing the exporter to finance theproduction and if necessary the transportation of thegoods for export, and for the importer to pay later.The notes may be held by the forfaiting bank or theymay be sold to an investor. The notes are presentedfor collection as they come due, without recourseto the exporter in whose favor the notes wereoriginally drawn. This absence of recourse distinguishesthe forfaiting of promissory notes fromthe discounting of trade drafts, for which theexporter is open to recourse in the case of nonpayment.13 All this can be summarized in thefollowing short definition.13 The lack of recourse explains the origin of the term‘‘forfaiting’’; the buyer of the promissory notes forfeits theright of recourse.& 454Forfaiting is medium-term non-recourse exporterarrangedfinancing of importers’ credits.The nature of forfaiting is also summarized inFigure 20.4. The figure shows what happens, andthe order of events, when a US jeans-machinemanufacturer sells its machines to a Russian jeansmanufacturer. The lightly shaded arrows show theexchanges occurring at the time the export deal ismade, while the dark arrows show subsequentsettlements.Some forfaiting banks hold the promissory notesthemselves and collect payments as they come due.Others buy notes for investors who have expressedinterest in taking up the high-yielding paper, andstill others arrange forfaiting and then trade thenotes in the secondary market. 1414 Forfaiting yields are relatively high because there is norecourse in the event the goods are not delivered, theimporter does not pay, and so on.
FINANCIAL INSTRUMENTS AND INSTITUTIONSThe discount rates that apply to forfaiting dependon the terms of the notes, the currencies in whichthey are denominated, the credit ratings of thebanks avalling the notes, and the country risks of theimporting entities. The spreads between forfaitingrates and offshore currency deposit rates, withwhich forfaiting rates move, are typically aboutone-and-a-half times the spreads between straightoffshore currency loans and deposits. 15 The higherspreads reflect the lack of recourse and interest-raterisk; the typical 5-year term of forfaiting dealsmeans forfaiters have difficulty matching creditmaturities with the typically much shorter maturityoffshore currency deposits and futures contracts.Although there have been some floating-rateagreements which have reduced interest-rate risk,fixed-interest-rate deals predominate.Forfaiting banks have shown considerable flexibilityand often quote rates over the telephone oncethey know the name of the importer or the avallingbank. 16 This allows exporters to quote their sellingprices after working out what they will net fromtheir sales after forfaiting discounts. Anotheradvantage to the exporter is that because there is norecourse, the promissory notes are not carried onthe exporter’s books as a contingent liability. Yetanother is that there is no need to arrange creditinsurance. Of course, the advantage of forfaiting toimporters is that they receive credit when it mightnot otherwise be offered or not be offered on thesame terms.the former Soviet Union wanted to hold US dollars,but not to hold them in the United States.) Thepractice of forfaiting dates back to the 1960s withthe placing of orders by eastern-bloc Comeconcountries for capital equipment and grain. Many ofthese orders were placed with German firms whichwere not in a position to supply trade creditthemselves, or to arrange financing with banks orofficial lending agencies. That is, the exporters wereunable to offer supplier credits, and they wereunable to arrange buyer credits through lendinginstitutions. Instead, they found banks which werewilling to purchase the importers’ promissory notesat a discount. One of the first banks to recognize theopportunity was Credit Suisse through its subsidiary<strong>Finance</strong> A.G. Zurich. 17 The original deals involvedthe sale of US grain to Germany, which resold thegrain to eastern European countries. Forfaitingallowed the US exporters to be paid immediatelyand the eastern European buyers to receive medumtermtrade credit. 18While originally viewed as ‘‘lending of lastresort,’’ forfaiting grew in popularity, spreadingfrom Switzerland and Germany, where it began, toLondon, later to Scandinavia and the rest of Europe,and eventually to the United States. Forfaiting is stillnot as important as payment by traditional time orusance bills of exchange or credit from officialexport financing agencies, but it has neverthelessbecome a potential source of financing, especiallyfor medium-term maturities. 19The history of forfaitingAs with the introduction of Eurodollars, the developmentof forfaiting probably owes its origins, butnot its subsequent popularity, to the difficultiesfaced in east-west trade. (We recall that it has beenargued that the Eurodollar market started because15 See Donald Curtin, ‘‘The Unchartered $4 Billion World ofForfaiting,’’ Euromoney, August 1980, pp. 62–70.16 The forfaiter may charge a commitment fee for thisservice.Financing by government export agenciesBecause of the jobs and income that derive from ahealthy export sector, it has become standardpractice for governments around the world to help17 See Werner R. Rentzman and Thomas Teichman,‘‘Forfaiting: An Alternative Technique for ExportFinancing,’’ Euromoney, December 1975, pp. 58–63.18 See Donald Curtin, op. cit.19 As we have seen, time drafts typically provide only shorttermfinancing. Clearly, time drafts are a form of suppliercredit.455 &
INSTITUTIONAL STRUCTURE OF TRADE AND FINANCEtheir exporters win contracts by offering exportfinancing. This financing can be of short-, medium-,or long-term maturity, and takes a number ofdifferent forms.A large part of official export financing takes theform of loan guarantees to exporters. For example,the US Export-Import Bank (‘‘Ex-Im Bank’’) helpssmall businesses obtain working capital to financeexports. The bank does this by guaranteeingthe principal and interest on working capital loansby commercial lenders to eligible US exporters.The funds can be used for producing the goods forexport, buying raw materials, holding inventory, ormarketing. The guarantees help companies raisesupplier credits. Buyer credits, that is, loans or loanguarantees to the buyers of a country’s exports, arealso offered in many countries. For example, theExport Credits Guarantee Department offers buyercredits to purchasers of British exports, and ExportDevelopment Canada provides buyer credits tobuyers of Canadian products.Official export financing also takes the form ofloans to domestic or foreign financial institutions,which in turn make loans to the importers. Sometimesonly a portion of the funds required by theimporter is made available to the financial institutions,the balance being provided by other lenders.In some countries, the export finance agency providesits component of the shared financing on a‘‘first in, last out’’ basis. This means that the exportagency commits its money before the privatefinancial institution makes its contribution, and thatthe export agency gives the private financial institutionthe first claim on repayments. This and otherfinancing practices have given rise to claims ofhidden assistance and subsidies to exporters and to anumber of disputes. Accusations that financingconstitutes a subsidy have been especially commonover interest rates charged on buyer credits. Somecountries have tried to hide their subsidies byoffering mixed credits, which are a combinationof export credits at market interest rates and whatthe export agencies call ‘‘foreign aid.’’ That is,some export agencies say that they are able to offervery low interest rates on export credits as a result& 456of contributions by their countries’ developmentaid agencies. 20It is not uncommon for official export agencies tooffer guarantees to banks in the exporter’s countryif the banks offer buyer credits. This substantiallyreduces the risk to the banks, thereby reducingthe interest rates they charge. In the United States,the Ex-Im Bank guarantees export credits thatare offered by the Private Export FundingCorporation (PEFCO). PEFCO is a privatelending organization that was started in 1970 bya group of commercial banks and large exportmanufacturers. PEFCO raises its funds through thesale of the foreign repayment obligations which ithas arranged and which have been guaranteed by theEx-Im Bank. PEFCO also sells secured notes on thesecurities market.The need for export financing, the need forspecial trade documents, such as letters of creditand trade drafts, and the need for export insurance,are all greatly reduced or eliminated when internationaltrade takes the form of countertrade. Thereare different variants to countertrade, and it is wellworth considering what these variants are and whycountertrade occurs.COUNTERTRADEThe various forms of countertradeCountertrade involves a reciprocal agreement forthe exchange of goods or services. The partiesinvolved may be firms or governments, and thereciprocal agreements can take a number of formsincluding the following.BarterThe simplest form of countertrade involves thedirect exchange of goods or services from one20 The bickering over interest rates on export credits wasreduced in 1983 when the OECD countries agreed to linkinterest rates to a weighted average of government-bondyields and to all charge the same rate. See <strong>International</strong>Letter, no. 515, Federal Reserve Bank of Chicago,December 16, 1983.
FINANCIAL INSTRUMENTS AND INSTITUTIONScountry for the goods or services of another. Nomoney changes hands, so that there is no need forletters of credit or drafts. Furthermore, since thegoods or services are exchanged at the same time,there is no need for trade financing or creditinsurance. An example of a barter deal was thetrading of the Polish soccer star Kazimierz Deynafor photocopiers and French lingerie. 21CounterpurchaseBarter requires a ‘‘double coincidence of wants’’ inthat the two parties in the transaction must eachwant what the other party has to provide, and wantit at the same time and in the same amount. Becausesuch a coincidence is unlikely, a form of countertradecalled counterpurchase is substantiallymore common than barter. With counterpurchasethe seller agrees with the buyer either to1 make purchases from a company nominated bythe buyer (the buyer then settles up with thecompany it has nominated) or2 take products from the buyer in the future(i.e. the seller accepts credits in terms ofproducts).Counterpurchase can also involve a combination ofthese two possibilities. That is, the seller agrees toreceive products at a future date from a companynominated by the buyer.Counterpurchase frequently involves only partialcompensation with products, and the balance incash. These types of countertrade deals are calledcompensation agreements.Industrial offsetA large portion of countertrade involves reciprocalagreements to buy materials or components fromthe buying company or country. For example, anaircraft manufacturer might agree to buy engines ornavigation equipment from a buyer of its aircraft.21 See Euromoney, September 1988, p. 54.The components may not be only for the aircraftsold to the company or country. For example,a military aircraft manufacturer might agree to buyengines for all its planes from a foreign producer ifthe engine manufacturer’s country agrees to buy asubstantial number of its aircraft.BuybackThis form of countertrade is common with capitalequipment used in mining and manufacturing. In abuyback agreement the seller of the capitalequipment agrees to buy the products made withthe equipment it supplies. For example, the makerof mining equipment might agree to buy the outputof the mine for a given period, perhaps 10 or15 years. This is a guarantee to the equipment buyerthat it can pay for the capital equipment whateverhappens to the price of what it produces, provided,of course, it can ensure continued production.When the equipment buyer pays partly in terms ofits product and partly in cash, then, as in the case ofother counterpurchase agreements of this kind, thearrangement is called a compensation agreement.Switch tradingSwitch trading occurs when the importer hasreceived credit for selling something to anothercountry at a previous time and this credit cannot beconverted into financial payment, but has to be usedfor purchases in the country where the credit isheld. The owner of the credit switches title to itscredit to the company or country from which itis making a purchase. For example, a British firmmight have a credit in Poland for manufacturingequipment it has delivered. If a firm finds a productin France that it wishes to purchase, the British firmmight pay the French firm with its Polish credit. TheFrench firm might agree to this if it wishes to buysomething from Poland. Because it is difficult forthe various parties to locate each other for a switchdeal, most of them are arranged by brokers. Manyof these brokers are based in Austria. The reasonAustria plays such a large role is that it sits between457 &
INSTITUTIONAL STRUCTURE OF TRADE AND FINANCEBarter4%Switch trading8%Buyback9%Offset24%Counterpurchase55%& Figure 20.5 The different forms of countertradeSource: Willis A. Bussard, in Christopher M. Korth (ed.), <strong>International</strong> Countertrade, Quorum Books,New York, 1987, p. 18.east and west Europe, and in the past many of thedeals were between the two sides of Europe.The relative importance of the different forms ofcountertrade that we have described is shown inFigure 20.5. The figure shows clearly that counterpurchaseis the dominant form and that barter isrelatively unimportant.Before leaving a description of the forms ofcountertrade we might mention that in the 1980s,in response to the deepening third-world debt crisis,some countries began to substitute commoditiesfor debt payments. For example, in 1985 Perurepaid part of its foreign debt with broiler chickens,shoes, and a variety of other products. Mexico alsotried to arrange an oil-for-debt swap. Thesearrangements are a form of countertrade in thatthey circumvent the use of convertible currencies.Reasons why countertrade occursGiven that countertrade has at some time or otherbeen estimated to have constituted up to 10 or20 percent of world trade, we might ask why& 458trading agreements that are so difficult to arrangehave assumed such importance. 22 That is, whyhave so many firms and countries chosen not to selltheir products for a convertible currency and usethe convertible currency to pay for what theybought?A common reason for circumventing the use of aconvertible currency and instead practicing countertradeis that a buyer in the countertrade does nothave access to convertible currency. It is no accidentthat countertrade occurs where at least one partycannot obtain convertible currency to make paymentsfor imports. If one party cannot pay withconvertible currency, then it must pay with goods,which is barter; with other companies’ goods,which is counterpurchase; with credits, which couldbe a switch trade or a counterpurchase; and so on.Many LDCs (less-developed countries), restrictaccess to convertible currency, and therefore22 See the surveys of countertrade summarized in ChristopherKorth (ed.), <strong>International</strong> Countertrade, Quorum, NewYork, 1987.
FINANCIAL INSTRUMENTS AND INSTITUTIONSmany of the countertrades that occur involve anLDC. 23Countertrade is also encouraged when prices arekept artificially high or low. For example, if theofficial OPEC oil price is above the market price,an oil seller might arrange a countertrade in whichthe oil is implicitly valued at the market price.The alternative of selling the oil at market price andusing the proceeds for purchases is more likely tocause anger among other members of the cartel.More generally, countertrade allows goods to beexchanged internationally in specific transactions atrelative prices which reflect genuine market values,while allowing non-market prices to be chargeddomestically. That is, countertrade is a way ofcircumventing problems caused by mispriced goodsor currencies. 24It has been argued that countertrade can promoteexports. Rolf Mirus and Bernard Yeung havesuggested that countertrade transactions constitutea sale of domestic goods for a ‘‘bundle’’ consistingof foreign goods plus marketing services. 25 Theforeign firm will not ‘‘shirk’’ in its marketing effortbecause it stands to benefit fully; it takes ownershipof the goods. The alternative of finding an independentfirm to market the product on behalf of theproducer offers a weaker incentive to work hard. Byaligning the marketing firm’s interest with that ofthe exporter, it is possible that exports are largerthan they would have been otherwise. 26With many countries abandoning restrictions oncurrencies, especially former eastern European23 See Rolf Mirus and Bernard Yeung, ‘‘Countertrade andForeign Exchange Shortages: A Preliminary Investigation,’’Weltwirtschaftliches Archiv. 123, 3, 1987, pp. 535–44.24 A denial of access to foreign currency can be considereda mispricing, in this case of the exchange rate; implicitly,the price of foreign currency is infinite if it cannot bepurchased at any exchange rate.25 Rolf Mirus and Bernard Yeung, ‘‘Economic Incentivesfor Countertrade,’’ Journal of <strong>International</strong> Business Studies,Fall 1986, pp. 27–39.26 See Jean-Francis Hennart, ‘‘The Transaction-Cost Rationalefor Countertrade,’’ Journal of Law, Economics and Organization,Spring 1989, pp. 127–53.countries, the need for countertrade has beenreduced. However, it has not been eliminated.THE INSTITUTIONS REGULATINGINTERNATIONAL TRADEA glance along the shelves at the vast range ofgoods we purchase from abroad, and a moment’sreflection on the number of jobs which dependon export sales, should amply convince us thatinternational trade is vital to our well-being andthat protectionism could do more to harm thatwell-being than almost any other development.Recognition of the potential damage that protectionismcan bring has resulted in a number ofpost-Second World War institutional arrangementsdesigned to reduce protectionism and allow usto more fully exploit the benefits of trade. Weshall quickly review the more important ofthese institutional arrangements in concludingour discussion of the organization of internationaltrade. The two most important arrangementsinvolve the regulation of the conduct of tradeby the World Trade Organization (WTO)(and formerly by the General Agreement on Tariffsand Trade, GATT), and by the establishment offree-trade areas.The World Trade Organization and GATTThe World Trade Organization, which beganoperation in 1995 and which has reached 146members, was created to replace the GeneralAgreement on Tariffs and Trade. The WTO differsfrom GATT in that1 the WTO is a chartered trade organization, notjust a secretariat as was GATT;2 the WTO has enhanced coverage vis-à-visGATT. Most important, the WTO coversservices, including trade-related aspects ofintellectual property rights (TRIPs);3 the WTO has a more compelling disputesettlement function than GATT because agreementcannot be blocked by a failure to achieveconsensus.459 &
INSTITUTIONAL STRUCTURE OF TRADE AND FINANCEHowever, despite these differences, the WTOcontinues the work of GATT to limit harmful tradepractices, just as the IMF is designed to limitharmful financial practices such as competitivedevaluations. 27 In its role as trade regulator, GATThad some notable successes in reducing the level ofdamaging trade practices.The two central principles of GATT were1 trade relations could not be discriminatory;2 export subsidies were not permitted.The nondiscriminatory principle was effected viathe most favored nation clause, which disallowedoffering better trade treatment to anycountry than was given to other GATT signatories.This meant that all GATT members were treated inthe same way as the most favored nation was treated.An exception was made to allow free-tradeareas, or customs unions, to exist, wherebymembers of the area or union could all be treatedmore favorably than nonmembers. The prohibitionon export subsidies meant that no benefits could beoffered to domestic producers which would givethem an advantage in foreign markets. Again, anexception was made, this time for agriculturalproducts. Where subsidies were shown to existoutside agriculture, countries were permitted toapply discriminatory tariffs to counteract tradesubsidies; these are referred to as countervailingtariffs.GATT managed to broker some general reductionsin tariffs under the so-called Kennedy-,Tokyo-, and Uruguay rounds. Completed in1994, the Uruguay round represented major progressin dealing with services and various non-tarifftrade barriers. The success of the WTO and itspredecessor GATT can be measured by the factthat compared to the situation before them,developed-country tariffs have fallen from anaverage of approximately 40 percent to just4 percent. Also, the proportion of industrialproducts entering developed countries duty-free has27 The IMF is discussed in Chapter 23.& 460more than doubled, increasing from 20 percent to43 percent. 28Along with the reduction or even completeelimination of import tariffs achieved by GATT andthe WTO has came an agreement to eventuallyeliminate hundreds of billions of dollars of subsidiesprovided to farmers in the world’s richest countries,notably the United State and the EuropeanUnion. The landmark agreement to do this came inAugust 2004 at WTO meetings in Geneva, with thepurpose being to help poor nations whose farmerswere unable to compete in world markets. Inreturn, developing nations agreed to open theirmarkets to manufactured goods. The hotly debatedtrade reform governing agricultural products cameafter failure to reach agreement on subsidies at ameeting in Cancûn, Mexico in 2003. The meetingsin Geneva and Cancûn were both part of the socalledDoha Round of trade discussions by theWTO, launched in 2001.Free-trade areas and customs unionsA free-trade agreement is in some ways thelowest level of economic integration. 29 While tariffsare removed on trade among members, each nationretains the freedom to set its own tariffs and othertrade restrictions to outsiders. The North AmericanFree Trade Agreement (NAFTA) has this characteristic.The next level of economic integration isa customs union. Customs unions have no tariffsamong members, as in a free-trade agreement, butin addition have common tariffs for outsiders. TheEuropean Union (EU) has been a customs unionsince January 1993. A customs union has operationaladvantages because outside goods can betraded freely between members once the tariffs28 See Don Macnamara, ‘‘Peter Sutherland’s GATT,’’Acumen, September/October 1994, pp. 18–24.29 While not multilateral in nature, free-trade zones, whichare sometimes called foreign trade zones and which have beenan important element of China’s economic reforms, are astep below free-trade agreements. Exhibit 20.2 discussesthe economics of free-trade zones in the US context.
FINANCIAL INSTRUMENTS AND INSTITUTIONSEXHIBIT 20.2US FREE-TRADE ZONESThe United States has had free-trade zones (FTZs),also called ‘‘foreign-trade zones,’’ since 1934. However,little use was made of them until the 1980s,which is the same time that other nations from Britainto China opened such zones within their borders.As the excerpt below explains, while the motivationfor FTZs is to improve international trading competitiveness,the benefits of FTZs are largely financial,stemming from less money being tied up in customsduties, defective products, and so on.Foreign trade zones (FTZ) are areas locatedwithin U.S. boundaries, but outside of its customsterritory. Foreign goods can be imported duty-freeinto an FTZ and then either re-exported withoutduties or formally imported into the U.S. marketaccompanied by payment of U.S. import duty.Foreign trade zones consist of two types ofzones: general purpose zones and subzones. Inpractice, general purpose zones and subzones areused for different activities. The general purposezone is created before any of its subzones and isnormally located at a port of entry such as ashipping port, border crossing, or airport. A generalpurpose zone usually consists of a distributionfacility or industrial park.Space is leased in a manner similar to any otherindustrial park or shared warehousing facility.Activities in general purpose zones typically consistof inspecting, storing, repackaging, and distributingmerchandise, and destroying defective merchandise,prior to re-export. For example, theMiami FTZ acts as a distribution center forEuropean and Asian companies exporting into SouthAmerica and the Caribbean. Manufacturing activitiestake place in only a few general purpose zones.Subzones are areas that are physically separatefrom the general purpose zone but are legally andadministratively attached. Subzones allow new orexisting facilities that are located outside of thegeneral purpose zone to take advantage of FTZbenefits. For example, subzones allow spaceintensivefacilities, such as assembly plants, tobecome part of an FTZ without using expensiveport space. A subzone is used by a single companyand is typically created around a manufacturingplant.FTZs potentially provide firms with a wide arrayof benefits. Firms can repackage or assembleimported merchandise along with domestic componentsfor re-export without having to pay a customsduty on the imported components. This benefitmakes it competitive for exporters to operate withinU.S. boundaries and was the original goal of theFTZs. However, many firms have found it to bemore convenient and cost effective to avoid dutieson re-exported goods by alternative means such asbonded warehouses or duty drawback programs,which return tariffs on re-exported goods.Another benefit of FTZs is that custom duties andtaxes on goods for domestic consumption are notpaid until the merchandise leaves a foreign tradezone and enters U.S. customs territory. In fact,while in a zone, merchandise is not subject to taxesof any kind. Furthermore, defective imports can bediscarded before tariffs are paid, so that tariffs arenot paid on unusable products. In practice, thedeferral of both tariffs and domestic taxes until theimported merchandise leaves the trade zone is themajor benefit enjoyed by current users of generalpurpose zones. Most of these establishments arerepackaging and distribution centers.A third benefit of FTZs is that firms may keepmerchandise in a zone indefinitely. This allowsfirms to weather periods of poor sales withoutpaying import duties and to defer import quotas.If import quotas have been met for the year,the merchandise can be stored in the FTZ until thenext year so that it will not be included in the currentyear’s quota.Source: David Weiss, ‘‘Foreign Trade Zones: Growth AmidControversy,’’ Chicago Fed Letter, Federal Reserve Bank ofChicago, no. 48, August 1991.461 &
INSTITUTIONAL STRUCTURE OF TRADE AND FINANCEhave been collected for the goods to enter the unionvia any member of the union. The level of integrationabove the customs union involves zero tariffsbetween members, common tariffs to outsiders,and the integration of trade policy, fiscal policy,monetary policy, and perhaps even political policyto outside bodies. Such economic and politicalintegration within the European Union is the goal ofthe Maastricht Treaty.Since its establishment in the 1950s, theEuropean Union has expanded in stages fromthe original six members to 25 members after theadmission of ten additional countries on May 1,2004. Trade being an important component ofeconomic activity within and between thesenations, the EU is the largest customs union thatexists. As a customs union, companies operatingoutside the EU have to face competition from firmsinside the EU that sometimes have favorable termswithin the union. For example, US-manufacturedcars selling in Britain face tariffs, whereas German-,Italian-, and French-made cars do not.The United States, which has traditionally been astaunch supporter of freer trade even if its rhetorichas sometimes been sharper than its actions, madeits own entry into trading agreements when,in January 1989, it signed the Free Trade Agreement(FTA) with Canada. This agreement wasthen superseded in January 1994 by the NorthAmerican Free Trade Agreement (NAFTA)between Canada, Mexico and the United States.Although often overlooked, the fact is that UStrade with Canada is larger than US trade withJapan, Germany, or any other single nation, andindeed, US–Canadian trade is the largest bilateraltrading relationship on Earth. US–Mexican trade isnot far behind, and has been growing at a rapid rate.The comprehensive and detailed arrangements ofthe NAFTA therefore mean that each country gainsimproved access to its largest foreign markets. Inaddition, each country obtains greater freedom toinvest in the other. For the United States, one of themost important features of the NAFTA is Canada’sagreement to give US energy producers and consumersthe same treatment given to Canadians. TheNAFTA operates within the rules of the WTO.Procedures have been put in place to resolve disputes,with the United States retaining its rightto levy countervailing tariffs when it believes USindustry is being damaged by unfair tradingpractices.NAFTA provides a market of almost 400 millionpeople. It was agreed to reduce tariffs over a15-year period to create a borderless trading area,at least as far as tariffs and other explicit traderestrictions are concerned. Fear of job losses andenvironmental damage hindered acceptance of theNAFTA in the United States even though at theagreement’s inception the United States enjoyed alarge trade surplus with Mexico, and even thoughmany people felt that if Mexico were a signatory ofthe NAFTA, Mexico’s environmental standardscould be more easily raised than if the country wereleft outside the agreement. Subsequent supplementaryarrangements concerning the environmentas well as labor standards in Mexico have beendesigned to increase acceptance of the NAFTA inthe United States and Canada.With trading agreements existing in NorthAmerica, Europe, and Asia (in the form of theAssociation of South East Asian Nations, ASEAN),some people have come to fear the consequences ofa world that is divided into a limited number oftrading blocs. The pattern of localized freer tradingarrangements with unchanged or even increasedprotectionism against outsiders does not correspondto the principles envisioned by those whoestablished GATT and its successor, the WTO. Thedanger is that the large trading blocs have constituencieswhich would prefer restricted trade. Thebigger the bloc, the more types of constituenciesthat are present, and the less they need to tradewith outsiders. Big trading blocs could thereforeultimately threaten globally free trade.& 462
FINANCIAL INSTRUMENTS AND INSTITUTIONSSUMMARY1 Special procedures have evolved for dealing with the extra risks of international trade,and national and international institutions have been established to finance and regulateinternational trade.2 Before shipping goods to foreign buyers many exporters require buyers to provide a letterof credit from a reputable bank. This is a guarantee that the exporter will be paid if thegoods are supplied in good order.3 Payment is made by a bill of exchange, or draft, which is sent by the exporter to theimporter or to the importer’s bank. The importer or the importer’s bank signs the draft.If the draft is payable on presentation, it is a sight draft. If it is payable at a futuredate, it is a time draft.4 The shipper gives the exporter a bill of lading, the original copy of which is requiredfor collection of the goods. The bill of lading is forwarded to the importer forthe goods to be released.5 When an exporter is confident an importer will pay, goods may be sold on an openaccount, and a bill presented after shipment. When an exporter suspects thatan importer may not pay, cash may be demanded before shipment occurs.6 When an exporter lacks trust in the importer’s bank or country, the exporter can have theimporter’s letter of credit confirmed. A confirmed letter of credit is one way ofavoiding country risk.7 Export credit insurance is an alternative to letters of credit for avoiding commercialand/or country risks. Export insurance, however, typically involves a deductibleportion of coverage and differs from letters of credit in other ways that aresometimes important.8 Credit insurance may be a natural monopoly, and be more effectively offered byan official rather than a private institution, because a government may havemore success avoiding nonpayment and because a government may consider positivespillovers of trade deals.9 Official export financing agencies often provide direct buyer credits, as well as guaranteeson credits to buyers granted by domestic or foreign financial institutions.10 When an exporter’s time draft is accepted by a bank, the resulting accepteddraft is called a banker’s acceptance.11 Banker’s acceptances are a means of short-term trade financing, typicallyup to 6 months. Forfaiting is a means of medium-term trade financing,with a typical term of 5 years.12 Forfaiting involves the sale by an exporter of promissory notes issued byan importer and usually avalled by the importer’s bank. The forfaiter has norecourse to the exporter in the event that, for whatever reason, the importer does not pay.13 Forfaiting is a particularly useful means of financing the sale of capital goods.The exporter is paid immediately, while the importer can make paymentsout of revenue generated by the products of the capital goods.463 &
INSTITUTIONAL STRUCTURE OF TRADE AND FINANCE14 Some international trade is countertrade. This may involve barter, an agreement topurchase products at a later date or from a designated supplier, an agreement to provideparts or to buy goods produced with capital equipment that has been supplied,or an agreement to switch credits for future product purchases.15 Countertrade is motivated by foreign exchange controls and mispricing of products,and often involves less developed countries.16 The conduct of international trade is governed by the World Trade Organization (WTO),which has succeeded GATT. Members of the WTO agree to have nondiscriminatorytariffs by accepting the ‘‘most favored nation’’ principle, and they agree to not subsidizeexports.17 The WTO offers exceptions to its tariff policy. These exceptions are to permit theestablishment of free-trade areas and customs unions and to exempt agriculture from theprohibition on export subsidies.18 The trend towards the establishment of trading blocs could threaten globally free trade byraising barriers between the blocs.REVIEW QUESTIONS1 What purpose is served by a letter of credit?2 What purpose is served by a bill of exchange?3 How does a time draft differ from a sight draft?4 What is a banker’s acceptance?5 What is a ‘‘clean draft’’?6 What purpose is served by a bill of lading or air waybill?7 Why might a company have a letter of credit confirmed?8 Are letters of credit and export credit insurance perfect substitutes?9 List the market failures that support government export credit insurance.10 What is forfeited with forfaiting?11 What forms does countertrade take?12 Why does countertrade occur?13 How does the WTO differ from its predecessor, the GATT?14 What is the difference between a free-trade agreement and a customs union?ASSIGNMENT PROBLEMS1 Why are letters of credit less often used in domestic trade?2 Why does the exporter provide the importer with the check for payment that the importersigns, rather than just allow the importer to send a check?3 Why are banks willing to accept time drafts, making them bills of exchange, and why doimporters and exporters arrange for banks to accept drafts?& 464
FINANCIAL INSTRUMENTS AND INSTITUTIONS4 Are cash terms likely when an importer can arrange a letter of credit?5 Why is export credit insurance typically offered by government agencies?6 Why do you think promissory notes used in forfaiting deals are avalled by the importer’sbank?7 What is the similarity between an aval and an acceptance?8 Is forfaiting a form of factoring?9 What form of trade financing is an exporter likely to seek first, and how would the choicedepend on the export deal?10 Why is counterpurchase so much more common than barter in countertrade?11 How can a customs union or common market such as the EU hurt a US exporter?12 Under what conditions might the emergence of a limited number of free-trade blocslower standards of living?BIBLIOGRAPHYCitibank, An Introduction to Letters of Credit, Citibank, New York, 1991.Harrington, J.A., Specifics on Commercial Letters of Credit and Bankers’ Acceptances, Scott Printing Corp.,Jersey City, NJ, 1974.Hennart, Jean Francis, ‘‘Some Empirical Dimensions of Countertrade,’’ Journal of <strong>International</strong> Business Studies,Summer 1990, pp. 243–70.Korth, Christopher (ed.), <strong>International</strong> Countertrade, Quorum, New York, 1987.Krugman, Paul R. and Maurice Obstfeld, <strong>International</strong> Economics: Theory and Policy, Chapter 9, Scott-Foresman,Glenview, IL, 1988.Lecraw, Donald, ‘‘The Management of Counter trade: Factors Influencing Success,’’ Journal of <strong>International</strong>Business Studies, Spring 1989, pp. 41–60.Rentzmann, Werner F. and Thomas Teichman, ‘‘Forfaiting: An Alternative Technique of Export Financing,’’Euromoney, December 1975, pp. 58–63.Sodersten, Bo, <strong>International</strong> Economics, 2nd edn, Chapter 17, Macmillan, London, 1980.Watson, Alasdair, <strong>Finance</strong> of <strong>International</strong> Trade, Institute of Bankers, London, 1976.465 &
Part VIIThe international macroeconomic environment:theories and practicesChapter 6 in Part II considered the determinationof exchange rates when they are flexible, meaningthat they are determined by the forces of privatesupply and demand. The supplies and demands werethe result of imports and exports that appear inthe balance of payments on current account, and hencewere flows.In Part VII we consider alternative theories ofexchange rates that are based on stocks of currenciesand demands to hold these stocks. These theories areexplained in Chapter 21, where we begin with themonetary theory of exchange rates. This theory isbased on the requirement that the demands and suppliesof currencies must be in equilibrium. This leadsto reasonable predictions such as the following: anincrease in the supply of Country A’s currency relativeto the demand for A’s currency, by more than theincrease in supply of B’s currency relative to thedemand for B’s currency, will cause A’s currency todepreciate vis-à-vis B’s currency. We show that whilethis prediction of the monetary theory sounds reasonable,predictions of the theory concerning economicgrowth and interest rates are different from thepredictions of the flow supply and demand theory inChapter 6. We also explain the portfolio-balancetheory that considers a wider range of assets than themonetary theory, and the so-called ‘‘asset approach.’’The asset approach emphasizes the forward-lookingnature of financial markets and in this way provides anexplanation of why exchange rates may deviate fromcurrent PPP levels.Chapter 22 moves from consideration of flexibleexchange rates to a discussion of fixed-exchange-ratesystems including the classical gold standard thatlasted into the twentieth century, the Bretton WoodsSystem roughly spanning the period 1944–73, theEuropean Monetary System operating between 1972and 1993, and the cooperative system operated by theGroup of Seven, G-7 – now expanded to provide Russiawith an observer’s seat – since the mid-1980s. Thefocus is both on the mechanics of these systems of fixedexchange rates, and on how imbalances in privatecurrency supplies and demands were corrected. Themechanisms for correcting imbalances of currencysupplies and demands with fixed-exchange-rate systemsare compared with the balance of paymentsadjustment mechanism under flexible exchange rates.Indeed, the chapter includes an account of the manyarguments used in favor of or against fixed and flexibleexchange rates.Armed with an understanding of the different waysthe international financial system can be organized,and with an appreciation of the pros and cons of thedifferent systems, we are able to consider why internationalfinancial history has weaved the path it has.We describe the flaws in the classical gold standard,the Bretton Woods System and the European MonetarySystem that eventually brought about the collapseof each. This historical review of the internationalfinancial system brings us to the present time,including an account of the creation of the Europeancommon currency, the euro, which became fully
operational at the opening of the twenty-first century.We show that the advantages of dealing with a singlecurrency in terms of a reduction in the costs and risksof international trade, are offset by losses in monetaryindependence of member countries: a common currencymeans a common monetary policy. The size ofthe downside of sharing a common monetary policy isshown to depend upon how synchronized are membercountries’ business cycles, and on the mobility offactors of production between member countries. Wealso examine some of the problems the internationalfinancial system has had to cope with, from recycling‘‘petrodollars,’’ to foreign exchange reserve shortages,to widely different inflation and employmentexperiences, to massive debts of developing nations, tothe contemporary problems of trade imbalances andshifting economic power. We shall see how internationalinstitutions such as the <strong>International</strong> MonetaryFund (IMF) and World Bank have been devised andadapted to deal with these problems.Part VII is designed to provide readers with awider understanding of the ever-changing internationalfinancial environment in which corporate andindividual decisions must be made. The twists andturns of the twentieth century, from gold, to BrettonWoods, to flexible rates, to cooperative intervention,to the euro, tell us that if anything is predictable, it isthat change in the international financial system canbe counted on continuing into the future. Only byconsidering where we have been, and analyzing howprevious international financial systems have worked,can we understand whatever new and untried systemswe might some day face. A limited attempt is made tolook into the future to see what today’s burning,global issues might imply for the future path of theinternational financial system.
Chapter 21Asset-based theories ofexchange ratesWe first survey the plot, then draw the model ...Then must we rate the cost of the erection;Which if we find outweighs ability,What do we then but draw anew the model ...William ShakespeareHenry IVSTOCK VERSUS FLOW THEORIES OFEXCHANGE RATESThe supply-and-demand view of exchange rates inChapter 6 considered flows of currencies – amountsper period of time. An alternative way of viewingexchange-rate determination is in terms of the stocksof currencies relative to the willingness of people tohold these stocks. Several variants of stock-basedtheories of exchange rates have been developed inrecent years, where these theories differ primarilyin the range of different assets that are considered,and in how quickly product prices can adjust tochanges in exchange rates. We begin with thesimplest stock-based model which considers onlythe stocks of different countries’ monies versus thedemands for these monies, and which assumes allprice adjustments are instantaneous. This ‘‘monetaryapproach to exchange rates’’ is extended to the‘‘asset approach’’ by considering how expectationsabout future prices can affect current exchangerates. The asset approach is followed by a morecomplete model which considers equilibrium indifferent countries’ bond markets as well as theirmoney markets. The chapter concludes with adiscussion of models which extend the stock-basedtheories in order to explain exchange-rate volatility,where volatility takes the form of exchange-rate‘‘overshooting’’: exchange rates can initially go toofar, and then move back to equilibrium. Theovershooting is the result of some product pricesresponding slowly to exchange rates.THE MONETARY THEORY OFEXCHANGE RATESIntuitive viewThe fundamental idea of the monetary theory ofexchange rates is that a change in the demand relativeto the supply of one currency versus anotherwill change the exchange rate. Consider, forexample, US dollars versus euros, and think of thesupply of a currency as the money supply. 1 We have1 Money supply is the sum of coins, paper currency, andbank deposits. Inclusion of different types of bank depositsresults in different definitions of the money supply, but forsimplicity you can think of checking accounts only,providing what is generally called money supply, M1.469 &
THE INTERNATIONAL MACROECONOMIC ENVIRONMENTa demand for dollars, largely by Americans who usedollars for everyday purchases, and a demand foreuros by Europeans who make their payments intheir own currency, the euro. 2 We also have moneysupplies of these two currencies. Suppose theEuropean Central Bank, the ECB, increases thesupply of euros relative to the demand for euros bymore than the proportion in which the US FederalReserve increases the supply of dollars relative tothe demand for dollars. What do you think willhappen to the exchange rate? According to themonetary theory of exchange rates, ceteris paribus,the euro will fall in value relative to the US dollar.What occurs is that the relatively rapid expansion ofthe euro supply versus the demand to hold theeuro – this being relative to the dollar – causesinflation in the Euro zone, making the euro worthless in terms of buying power. This is what is behindthe fall in foreign exchange value of the euro in thissupply expanding circumstance.A currency will increase in value if the demandfor it were to increase, relative to its supply, bymore than happens to demand versus supply inanother currency. For example, if the demand foreuros were to increase versus the euro supply bymore than the demand for dollars increased versusthe dollar supply, the euro would go up in value interms of dollars. Anything which can change theamount of a nation’s money that people want tohold would have an effect on exchange rates throughaffecting demand versus supply of one country’scurrency versus another. Money demand is affectedby economic growth: fast growing economies havegrowing demands for money for transactions purposes.In this way economic growth, ceteris paribus,can contribute to an appreciation of a country’scurrency. The demand for money also depends oninterest rates, since they affect the opportunity costof holding money: high interest rates on bonds2 Some of the demand for US dollars is actually by foreignerswho like the dollar. This raises the demand for dollarsand, ceteris paribus, raises the foreign exchange value of thedollar. For simplicity of exposition at this point, we ignoreforeign demand for a nation’s currency.& 470decrease the amount of money people want to hold.Money demand could also be affected by theprice level in a country and other factors includingpolitical and economic concerns about the future. Inthis way economic growth, interest rates, pricelevels, political uncertainty, and other mattersinfluence exchange rates through affecting moneydemand, just as do relative changes in countries’money supplies.Formal viewAs the preceding discussion would suggest, centralto the monetary theory of exchange rates areequations specifying the demand for money in eachcountry. Among other influences, one of the mostimportant factors affecting the demand for money isthe price level. If, for example, the prices of everythingin a country were to double, ceteris paribus, theamount of money people would want to hold, thatis, demand, would also double. If morning coffee,the newspaper, bus tickets, lunch, and so on wereto suddenly cost twice as much, people wouldwant to head off to work or school in the morningwith approximately twice as much money in theirwallets or pocket books as before the price increaseoccurred. We are assuming that the only thingwhich has changed is the price level. This ceterisparibus assumption means that we are holding allother things constant, such as real incomes andwealth, so people are not poorer because of higherprices: constant real incomes and wealth mean thatnominal incomes and wealth increase at the samerate as prices.If the demand for money varies by the sameproportion as the price level, then we can thinkin terms of the ‘‘real demand for money.’’ Forexample, if a 10 percent price level increase causesa 10 percent increase in money demand, we wouldhave the same real money demand, where the realmoney demand for the US dollar and the pound canbe written as M US /P US and M UK /P UK respectively.(Division of any nominal variable by the price levelconverts it into a real variable. For example,dividing the nominal GDP, usually written as Y, by
THEORIES OF EXCHANGE RATESthe price level, P, gives the real GDP, usuallywritten as Q ¼ Y/P.)Equations (21.1) and (21.2) show respectivelythe real demands for money in two countries, theUnited States and United Kingdom:M US¼ Q US a P r bUSUSM UK¼ Q UK a P r bUKUKð21:1Þð21:2ÞThe real money demands are on the left-handsides of the equations, being the nominal amountsdemanded divided by the respective price levels.The first term on the right-hand side of eachequation shows that the real demand for money ineach country depends on the country’s real GDP,respectively shown as Q US and Q UK . This is becausethe real GDP equals the real amount of goods andservices people buy, and the more goods and servicespeople buy, the more money they need tohave for making purchases. The extent that the realquantity of money demanded varies with the realGDP is shown to depend on a. If, for example,a ¼ 1, then the real demand for money goes up anddown by the same amount as the GDP: if the realGDP goes up 10 percent, real money demand alsogoes up 10 percent. If a > 1 the real demand formoney goes up by more than the real GDP, and ifa < 1 the real demand for money goes up by lessthan real GDP. 3 For simplicity we assume the valueof a is the same in the two countries.Equations (21.1) and (21.2) also show that thequantity of money demanded in each countrydeclines as that country’s nominal (or market)interest rate increases. This is because the opportunitycost of holding money (cash) rather thanbuying bonds or some other interest-bearing asset isthe nominal interest that would otherwise beearned.3 The parameter a is the real income elasticity of the realdemand for money. When this exceeds 1.0 we say thatmoney is a ‘‘luxury,’’ and when it is less than 1.0 we saymoney is a ‘‘necessity.’’ Empirical evidence suggests thatthe income elasticity of money demand is close to 1.0.The assumption that the real demand for eachcountry’s money depends on real income andinterest rates only in that particular country implicitlyassumes that different countries’ monies arenot substitutable. The alternative assumption, thatdifferent countries’ monies are substitutable, wouldmean, for example, that the British view US dollarsas satisfying their demand for money: perhaps theycan use these dollars in some circumstances to makepayments. We could accommodate this situation bymaking the demand for US dollars in equation (21.1)a function of British economic variables as well as theUS variables. Such an extension of the monetarytheory would be helpful to explain why, forexample, the US money supply could grow relativelyfast without causing a US dollar depreciation:the demand for US dollars could keep pace with thesupply if foreigners are also demanding the extradollars. Dollarization, which refers to the growinguse of the US dollar as the de facto internationalmoney during the last part of the twentieth century,could in this way explain the value of the dollaragainst many currencies during this period. A reduceddemand for dollars by foreigners switchingto alternative currencies starting in late 2003could explain the subsequent drop in the dollar.The monetary approach to exchange ratesassumes that people adjust their money holdingsuntil the quantity of money demanded equals thequantity of money supplied. The way this occurs isas follows. If, for example, the supply of moneyexceeds the demand for money, the public attemptsto spend the excess supply of money by buyinggoods and bonds. Of course, money does not disappearwhen it is spent, but rather ends up insomebody else’s hands – or more precisely, in somebodyelse’s bank account. However, an attempt toget rid of money does restore equilibrium betweenmoney supply and demand. This occurs because thebuying of goods causes an increase in the price level,and the buying of bonds causes higher bond prices,which in turn mean lower interest rates. The higherprice level and lower interest rates increase thequantity of money demanded: higher prices meanpeople need more money to make their normal471 &
THE INTERNATIONAL MACROECONOMIC ENVIRONMENTpurchases, and lower interest rates reduce theopportunity cost of holding money, thereby raisingthe quantity of money demanded. The processcontinues until the demand for money has risen tomatch the higher supply. Similarly, an excess demandfor money causes reductions in spending ongoods and bonds as the public tries to restore theirmoney holdings to desired amounts: by not spendingthey hope to have some money left from theirincome to add to their money holdings. The lack ofspending on goods and bonds lowers prices andraises interest rates – due to lower bond prices –and the lower prices of goods and higher interestrates reduce the quantity of money demanded. Thiscontinues until money demand has been reducedsufficiently to match the lowered money supply.If it seems odd that money demand adjusts toequal money supply, think of what would happenif helicopters flew overhead dropping money oneverybody. This would not make countries richer.What it would do, since people had chosen theamount of the wealth to hold as money before thehelicopters came, is cause an excess supply ofmoney. With people holding ‘‘too much money,’’they would attempt to restore balance by eitherspending the money – increasing prices – orby investing it, raising bond prices, that is loweringinterest rates. The higher prices of goods wouldincrease the demand for money. Lower interestrates would also raise the demand for moneybecause it would reduce the opportunity cost ofholding it. The price increase and interest decreasewould eventually raise money demand so thatpeople want to hold the money that was dropped bythe helicopters.If the money demand equals the money supply,as we have just argued, then we can interpret M USand M UK as the two countries’ money supplies aswell as their money demands. If we also rearrangeequations (21.1) and (21.2) to put the moneysupplies on the right-hand sides, we haveP US ¼ M USQP UK ¼ M UK Q& 472aUS rb USaUKr b UKð21:3Þð21:4ÞRemember that M US and M UK and are to beinterpreted as money supplies. Equations (21.3)and (21.4) show that, ceteris paribus, price levels inthe two countries vary in proportion with thecountries’ money supplies. Prices also vary inverselywith real GDP, and in the same direction asnominal interest rates.According to the monetary theory of exchangerates, the ratio of prices in two countries is relatedto the exchange rate between the two countries’currencies. In particular, in the context of theUnited States and the United Kingdom, themonetary theory assumes the PPP principle in staticform as described in Chapter 7, namely thatSð$/£Þ ¼ P USð21:5ÞP UKSubstituting equations (21.3) and (21.4) intoequation (21.5) we findSð$/£Þ ¼ M USM UK Q aUK r USQ US bð21:6Þr UKEquation (21.6) captures the essential features ofthe monetary approach to exchange rates.An examination of equation (21.6) shows thatthe first and most distinctive implication of themonetary approach is that the US dollar value ofthe pound, S($/£), increases if, ceteris paribus, theUS money supply increases more than the Britishmoney supply. The reason is that if the US moneysupply is rising faster than the British money supply,US inflation will be higher than British inflation, sothat according to the PPP principle, the dollar mustfall vis-à-vis the pound.The second prediction of the monetary approachcharacterized by equation (21.6) is that, ceterisparibus, the value of the pound increases if theBritish real GDP increases faster than the US realGDP. This occurs because a higher real GDP meansa higher quantity of money demanded. This is seenin equations (21.1) and (21.2). For a given supply ofmoney, a higher quantity of money demandedmeans an excess demand for money. When there isan excess demand for money people reduce theirspending on goods and services in an effort to add to
THEORIES OF EXCHANGE RATEStheir money holdings. It is not possible for peoplecollectively to add to the nominal amount of moneythey collectively hold: the money supply is determinedby the central bank in conjunction with thecommercial banks, not the general public. However,the effort to add to money holdings byspending less lowers the price level, which doesincrease the real money supply. 4 According to thePPP principle as in equation (21.5), a lower pricelevel means an appreciation of the exchange rate,which in this case of more rapid real GDP growth inBritain than the United States means an appreciationof the pound.The prediction that faster real economic growthcauses currency appreciation is different from whatmight be predicted from the flow supply anddemand view of exchange rates in Chapter 6. Theflow theory we explained in Chapter 6 might beinterpreted as suggesting that faster growth of realGDP would lead to faster growth of spending,including the purchase of imports. Higher importswould increase the supply of currency in the foreignexchange markets and cause a depreciation of theexchange rate. Monetarists argue that the simpleflow supply-and-demand models overlook the linkbetween the goods and services market on the onehand, and the financial market on the other, that is,the link between GDP and the demand for money.The prediction of the monetary approach, that currencyappreciation is associated with faster economicgrowth, tends to be supported by the data.Another prediction of the monetary approach isthat, ceteris paribus, the higher is the US interest raterelative to the British interest rate, the higher isthe US dollar value of the pound. In terms of4 As well as buying fewer goods, people may attempt to addto their money holdings by selling bonds. This lowers bondprices and raises their yields. This reduces the demandfor money because lower bond yields mean a loweropportunity cost of holding money. This helps eliminatethe excess demand for money, along with lower prices.The simple monetary approach focuses on the price levelrather than bond yields, while the more sophisticatedtheories, such as the overshooting theory explained later,consider both.equation (21.6), the higher is r US , the higher isS($/£) because b is positive. It follows that anunexpected jump in a country’s nominal interestrate will cause its currency to depreciate. The reasonfor this prediction of the monetary approach is thatthe higher is a country’s nominal interest rate, thelower is the real quantity of money demanded: ahigh interest rate means a high opportunity cost ofholding money. For a given money supply, a lowerquantity of money demanded means an excesssupply of money. This leads to an increase in theprice level as people spend the money they do notwish to hold. The PPP condition, equation (21.5),shows that if the US price level increases, the USdollar loses value against the pound. Therefore, wereach the conclusion that the higher is the USinterest rate relative to the British interest rate, thelower is the value of the dollar. Flow theories ofexchange rates such as that outlined in Chapter 6 andconventional wisdom suggest otherwise, predictingthat higher US interest rates – or more precisely USdollar interest rates – will increase the demand forUS interest-bearing securities, thereby increasingthe demand for dollars and the value of the dollar. 5A prediction of the monetary approach with whichmany economists will agree concerns the effect ofexpected inflation on the exchange rate. It is generallyaccepted that, ceteris paribus,higherexpectedinflationleadstohighernominalinterestrates. 6 We have just5 The evidence supports the prediction of the flow theory inthat appreciations (depreciations) of the dollar areempirically associated with increases (decreases) in USnominal interest rates. See Brad Cornell and AlanC. Shapiro, ‘‘Interest Rates and Exchange Rates: SomeNew Empirical Results,’’ Journal of <strong>International</strong> Money and<strong>Finance</strong>, December 1985, pp. 431–42, and GikasA. Hardouvelis, ‘‘Economic News, Exchange Rates andInterest Rates,’’ Journal of <strong>International</strong> Money and <strong>Finance</strong>,March 1988, pp, 23–35.6 For the theory behind expected inflation and interest ratessee Maurice D. Levi and John H. Makin, ‘‘AnticipatedInflation and Interest Rates: Further Interpretation ofFindings on the Fisher Equation,’’ American EconomicReview, December 1978, pp. 801–12. For the empiricalevidence, see Maurice D. Levi and John H. Makin, ‘‘Fisher,Phillips, Friedman and the Measured Impact of Inflation onInterest,’’ Journal of <strong>Finance</strong>, March 1979, pp. 35–52.473 &
THE INTERNATIONAL MACROECONOMIC ENVIRONMENTseen that a relatively higher nominal interest ratecauses a currency to depreciate. Therefore, themonetary approach predicts that relatively higherexpected inflation causes depreciation. Becausehigher expected inflation suggests a future depreciationvia the PPP condition (a higher future pricelevel means a lower future currency value), whatthe monetary approach tells us is that the effectoccurs immediately rather than later: we do nothave to wait for the expected inflation to occur. Theidea that expected future events are reflectedimmediately in spot exchange rates is an importantingredient of the asset approach to exchangerates considered in the next section.The interest rate that represents the opportunitycost of holding money is the nominal interest rate,not the real rate: money is a contractual asset thathas the same nominal value whatever the inflationrate, so what is given up by holding money is thenominal interest rate. The nominal interest rate isequal to the real rate plus the anticipated rate ofinflation. Large swings in nominal interest rates arelikely to be more the result of changes in anticipatedinflation than they are the result of variations inreal interest rates. Hence high nominal interestrates are likely to reflect high expected inflationwhich in turn is likely to mean a depreciation inthe future via PPP. This conforms with the predictionof the monetary theory of exchange rates,that high interest rates are associated with a currencydepreciation. The asset approach tells usthis happens immediately. What we find is thatit is important to distinguish between real andnominal interest rates when considering implicationsfor exchange rates. Relatively high real interestrates are likely to be associated with currencyappreciations while relatively high nominal interestrates are likely to be associated with currencydepreciations.Before leaving the monetary approach it isworth recalling that while the money demandequations (21.1) and (21.2) show each country’smoney demand depending on the country’s owneconomic conditions, this is not necessarily thecase. In particular, the demand for the US dollar& 474could well depend on economic conditions in othercountries due to the widespread use of the dollar fortransactions and savings. This is an aspect of dollarizationmentioned earlier. This means that rapidgrowth in world trade and overall economic conditions,and especially in countries where the USdollar is held in high regard as a ‘‘safe haven,’’ couldlead to an appreciation of the US dollar. Thestrength of the US dollar in the 1990s might betraced to the world economic growth of that decadeand the rapid economic progress of China, Russia,and other economies where US dollars were widelyheld by ordinary citizens.THE ASSET APPROACH TOEXCHANGE RATESExchange rates are relative prices of two assets:monies. The current value of an asset depends onwhat that asset is expected to be worth in thefuture. For example, the more valuable a stock isexpected to be worth, the more it is worth now.Similarly, the more a currency is expected to beworth in the future, the more it is worth now. Itfollows that today’s exchange rate depends onthe expected future exchange rate. In turn, theexpected future exchange rate depends on whatis expected to happen to all the factors mentionedso far as affecting currency demands or supplies.The asset approach to exchange rates, which hasbeen articulated most clearly by Michael Mussa,looks at the current spot exchange rate as a reflectionof the market’s best evaluation of what is likelyto happen to the exchange rate in the future. 7 Allrelevant available information about the future isincorporated into the current spot rate. Becausenew information is random, and could as easily be7 Michael Mussa, ‘‘A Model of Exchange Rate Dynamics,’’Journal of Political Economy, February 1982, pp. 74–104.This paper follows an earlier statement of the assetapproach in Jacob A. Frenkel and Michael L. Mussa,‘‘The Efficiency of Foreign Exchange Markets andMeasures of Turbulence,’’ American Economic Review,Papers and Proceedings, May 1980, pp. 374–81.
THEORIES OF EXCHANGE RATESgood or bad news for one currency versus the other,the time path of the exchange rate should containa random component. This random componentfluctuates around the expected change in exchangerate. The expected change can reflect the implicationsof PPP – with more rapid inflation thanelsewhere implying depreciation – or any otherinfluence on exchange rates that is reflected in assetsupplies or demands or in the balance-of-paymentsaccounts.The asset approach holds implications for theeffect of fiscal policy as well as monetary policy. Forexample, it predicts that high fiscal deficits canresult in an immediate depreciation. This wouldhappen if the fiscal deficit caused people to expectfuture expansion of the money supply as the governmentallowed money to expand in the course ofmaking interest payments on its growing debt.Higher future money supply implies higher futureprices, and according to the PPP principle, thisimplies a future depreciation. The future depreciationtranslates into an immediate depreciation viathe forward looking nature of the asset approach.The predictions of the asset approach concerningthe effect of a fiscal deficit are different from thosethat arise from the flow theory based on currencysupplies and demands in the balance-of-paymentsaccount. In particular, suppose a country has agrowing fiscal deficit, but that savings in thatcountry and other demands for funds by businessesand consumers are given. The growing fiscal deficittherefore means more capital imports or smallerexports. The capital imports represent a demand forthe currency of the country with the fiscal deficit.The bigger the deficit, ceteris paribus, the higher thecapital imports and hence the higher the demand forthe currency. Ceteris paribus, this should cause thecurrency to appreciate. We find the somewhatsurprising conclusion that a fiscal deficit can cause acountry’s currency to strengthen in value. However,this is likely to be a temporary phenomenonas borrowing from abroad might mean a currentdemand for the country’s currency, but it alsomeans a future supply. This is because interestpayments on the debt mean a supply of currency onthe current account. Indeed, the asset approachmight suggest the deficit has a muted immediateeffect at best because people will look forward andimpute some present value to the future interestpayments.The asset approach offers an explanation fordepartures from PPP. Because expectations aboutthe future are relevant to the current exchange rate,there is no necessity for the spot exchange rate toensure PPP at every moment. For example, ifa country is expected to experience rapid futureinflation, poor trade performance, or somethingelse leading to future depreciation, the currentexchange rate of that country’s currency is likely tobe below its PPP value. However, because theexpected future exchange rate could be based on atendency for PPP to be restored, the asset approachis not inconsistent with PPP as a long-run tendency.Nor, therefore, is the asset approach necessarilyinconsistent with the long-run implications of themonetary approach.THE PORTFOLIO-BALANCE APPROACHTO EXCHANGE RATESThe simple monetary approach to exchange ratesassumes that people want to hold their owncountry’scurrency but not the foreign country’scurrency. 8 The portfolio-balance approachrecognizes that people might want to hold bothmonies, although they are likely to hold relativelymore of one money, their own. The portfoliobalanceapproach to exchange rates makes thesame argument for bonds. That is, it assumes thatpeople demand domestic and foreign bonds or,more generally, that people prefer diversifiedportfolios of securities. Furthermore, the portfoliobalanceapproach also recognizes that supplies anddemands for monies and bonds must be in equilibriumor balance, that is, all financial markets must8 We mentioned earlier that the monetary approach can beadapted to consider foreign demand for a country’scurrency, as has been the case for the US dollar.475 &
THE INTERNATIONAL MACROECONOMIC ENVIRONMENTclear. 9 (The fact that the approach is based ondiversification of portfolios and has a requirementthat markets balance explains its name, theportfolio-balance approach.)In the monetary approach each country’s bondmarket is assumed to clear, whatever happens to thesupply of or demand for any country’s bonds. Thisassumption is implicit in the absence of equationsfor bond supplies and demands, and in the absenceof any conditions for bond markets to clear; withoutthere being conditions showing when the bondmarkets clear, by implication they are assumed toalways clear. It is possible to rationalize this assumptionof the monetary approach if it is argued thatone country’s bonds are perfectly substitutable foranother country’s bonds. This is because then, if thesupply of one country’s bonds is increased, theextra bonds will be held by residents or foreignerssubstituting these for other countries’ bonds theycurrently hold. Changes in the supply of just onecountry’s bonds are of such insignificance in thecontext of the entire world market for bonds thatthe global demand for bonds equals the globalsupply without any noticeable effect on interestrates or exchange rates.When we add bond demand equations andequilibrium conditions for bond demands to equalbond supplies for each country’s bonds, as we do inthe portfolio-balance approach, the implications aredifferent from the monetary approach. In particular,we find effects of bond supplies and demandson exchange rates and interest rates as well as effectsof money supply and money demand.In order to illustrate the consequences ofbond supplies and bond demands for interest rates9 Therefore, the portfolio-balance model consists of demandand supply equations for money and bonds in all countries,as well as equations setting money and bond demandsequal to supplies. We do not need to write downthese equations in order to appreciate the essentialfeatures of the approach. However, for a comprehensivetreatment of the approach see Pentti J. K. Kouri andMichael E. Porter, ‘‘<strong>International</strong> Capital Flows andPortfolio Equilibrium,’’ Journal of Political Economy, May/June, 1974, pp. 443–67.& 476US interest rate, r USr 1r 2E 1E 2 E9 1Exchange rateMM 1MM 2BB 1S 1 S 2 S9 2BB 2S($/£)& Figure 21.1 The portfolio-balance theory: effectof open-market operationsNotesMM 1 represents initial equilibrium in the US money market.The line slopes upwards because higher r US reduces moneydemand, while higher S($/£) increases moneydemand via increasing wealth due to an increase in thedollar value of British bonds and currency. BB 1 representsinitial equilibrium in the US bonds, market. The line slopesdown because lower r US reduces demand for US bonds,while a higher S($/£) raises demand for US bonds byincreasing wealth via making British bonds and currencymore valuable in dollars. When the US money supplyincreases via the Fed’s buying of bonds, MM 1 shifts to theright to MM 2 , and BB 1 shifts to the left to BB 2 . Bothmovements reduce r US ; compare E 2 to E 1 . Note thatthe bond supply reduction reduces the depreciation ofthe dollar; compare E 2 to E 0 1where the latter is theequilibrium when the money supply is increased withoutthe Fed buying bonds.and exchange rates we can use the diagrammaticrepresentation of the portfolio-balance theory inFigure 21.1. The figure shows the US interestrate, r US , on the vertical axis, and the exchange rate,S($/£), on the horizontal axis, where a movementto the right along the horizontal axis is a depreciationof the dollar/appreciation of the pound.The curve labeled MM 1 represents all of theinterest rate/exchange rate combinations consistentwith initial equilibrium in the US money market;along MM 1 the demand to hold US money equals theUS money supply. MM 1 assumes a given, initial
THEORIES OF EXCHANGE RATESmoney supply. MM 1 slopes upward because a higherUS interest rate reduces the quantity of money thatpeople demand; higher interest rates increase theopportunity cost of holding money. Because thesupply of money is assumed constant, a lowerquantity of money demanded represents an excesssupply of money if nothing else is changed. However,by increasing S($/£) as r US increases, the valueof Americans’ holdings of British bonds is increased;the pound values of British bonds and money heldby Americans translate into more US dollars. Thatis, a higher value of S($/£) increases the wealth ofAmericans via an increase in the dollar value of theirholdings of British bonds and money. Higher wealthincreases the demand for US money; money is acomponent of wealth, and ceteris paribus, as wealthincreases the demand for money increases. Thehigher demand for US money from a higher S($/£)offsets the lower quantity of US money demandedfrom a higher, r US , so the demand for money canremain equal to the unchanged money supply.Therefore, the US money market can remain inequilibrium if S($/£) increases as r US increases,meaning an upward-sloping line, MM 1, the linealong which US money supply and demand are inequilibrium.The line BB 1 represents all of the interest rate/exchange-rate combinations consistent with initialequilibrium in the US bond market, which is wherethe demand to hold US bonds equals the bondsupply. The line slopes downwards because, ceterisparibus, as r US decreases the fraction of wealthAmericans want in US bonds decreases: lowerreturns on US bonds makes them less attractive thanBritish bonds or holding money. However, the BB 1line takes the US bond supply as given, so withAmericans wanting less US bonds there is disequilibrium:US bond supply exceeds demand.Equilibrium can be maintained if the demand for USbonds can be increased to offset the lower demandat lower values of r US . In order to achieve this, itis necessary to have an increased value of S($/£)which increases the US dollar value of US-heldBritish bonds and money; the pounds translate intomore US dollars. This makes Americans richer,which among other things increases their demandfor US bonds. Therefore, in order to maintain USbond market equilibrium it is necessary to increaseS($/£) as r US is decreased, which means adownward-sloping line BB 1 : recall that the BB 1 lineis the combination of the variables on the twoaxes maintaining bond market equilibrium.The diagrammatic framework in Figure 21.1 canshow how the implications of the portfolio-balancetheory differ from those of the monetary theory.Consider, for example, the effect of an increase inthe US money supply, M US , brought about by openmarketoperations. The money supply is expandedby the Fed buying bonds in the open market,thereby reducing the supply of bonds available tothe US public. 10 The monetary approach summarizedby equation (21.6) predicts, ceteris paribus, thatan increase in M US will cause a depreciation of theUS dollar by the same percentage as M US increases.The portfolio-balance theory recognizes that inaddition to the direct effect of the money supply,there is also an effect of the excess demand forbonds caused by the central bank’s purchase ofbonds, since as we have said, the supply of bondsavailable to the public is reduced.In terms of Figure 21.1, the increase in M USshifts the money market equilibrium line fromMM 1 to MM 2 . This follows because at a given r US onthe initial money market equilibrium line MM 1 ,there is an excess supply of money after the USmoney supply has been increased. This excesssupply can be reduced by a lower r US , whichincreases the quantity of money demanded via alower opportunity cost. This means a downwardshift from MM 1 to MM 2 ; equilibrium occurs everywhereat a lower r US . The excess supply of moneycould also be reduced by an increase in S($/£)which increases Americans’ wealth; British bondsand money are more valuable when translated into10 In an open-market operation to expand the US moneysupply, the Fed buys Treasury bills and bonds in the openmarket, paying by crediting bill and bond sellers’ accountsat the Fed. When spent, the sellers’ deposits at the Fedbecome commercial bank reserves, permitting more bankloans and thus an expansion of the money supply.477 &
THE INTERNATIONAL MACROECONOMIC ENVIRONMENTUS dollars with more dollars to the pound. Thehigher American wealth increases Americans’demands for money, especially their own. Thismeans a rightward shift from MM 1 to MM 2 .Whichever way we view the shift of MM – asdownward or as rightward – the MM 1 curve hasshifted to MM 2 . The intersection of MM 2 with BB 1is at a lower US interest rate and a depreciated valueof the dollar: compare E 0 1 with E 1 in Figure 21.1,where we see that E 0 1 is at a higher value of S($/£).However, this is not yet the new equilibrium becausewe have not yet accounted for the effect of thereduced supply of bonds available to the US publicbrought about by the Fed’s open-market purchaseof bonds used to increase the money supply.Fewer US bonds in the hands of Americans,meaning a smaller US bond supply, also means anexcess demand for US bonds. This can be preventedif r US is lower or if S($/£) is lower. (A lower USinterest rate reduces the quantity of US bondsdemanded, helping match the reduced bond supply.Similarly, less of Americans’ wealth in British bondscaused by a lower S($/£) helps achieve the preferredrelative increase in US versus British bondholdings.) Whether it be via r US being reduced orvia S($/£) being reduced, the effect of the reducedsupply of US bonds is to shift BB 1 down and to theleft to BB 2 : the new equilibrium points correspondingto each previous equilibrium point is at a lowerr US or at a lower S($/£). With the shift of MM 1 toMM 2 and of BB 1 to BB 2 we see what the portfoliobalancetheory predicts. Specifically, an increase inthe US money supply causes less of a depreciation ofthe dollar when the bond supply is reduced, as it iswith open-market operations, than when the moneysupply is increased but the bond supply is notreduced; compare E 2 , where BB 2 intersects MM 2 ,with E 0 1 , which is the equilibrium with constant bondsupply. 11 That is, unlike the monetary approach, theportfolio-balance approach predicts that the effectof changes in money supplies on exchange ratesdepends on how money supplies are changed. Also,11 In Figure 21.1 we assume that the effect of the shift in MMdominates the shift of BB so that the dollar depreciates.& 478we no longer have a depreciation in the sameproportion as the relative growth in the moneysupply as indicated by the monetary theory inequation (21.6).As a second example of the predictions of themonetary theory versus the prediction of theportfolio-balance theory, consider the effect of ahigher US real GDP. Equation (21.6) shows that themonetary theory predicts an appreciation of the USdollar by proportion a. The effect of higher US realGDP via the portfolio-balance theory is shown inFigure 21.2. The figure shows that MM 1 has shiftedto MM 2 . (The higher income increases the demandfor money which can be offset by a higher r US orlower wealth. The latter is achieved by a reductionin S($/£) making British bonds and money lessUS interest rate, r USr 1r 2E9 2E 2E 1MM 2MM 1BB 1S 2 S 1BB 2S($/£)Exchange rate& Figure 21.2 Real income growth and theportfolio-balance theoryNotesHigher US income increases the demand for money in theUnited States and shifts MM 1 to MM 2 ; money equilibriumcan be maintained via higher, r US , reducing the quantity ofmoney demanded, or via lower S($/£), reducing wealthfrom a lower dollar value of British bonds and currency.Higher US income also increases savings and the demandfor US versus British bonds. This causes BB 1 to shift left toBB 2 ; lower r US and S($/£) reduce the demand for US bonds.The new equilibrium from income growth involves anappreciated dollar.
THEORIES OF EXCHANGE RATESvaluable in Americans’ portfolios.) Higher incomealso increases Americans’ savings and therebyAmericans’ demands for US bonds relative to Britishbonds; Americans prefer US bonds to British bonds.A balance with the fixed supply of US bonds can beachieved via a lower r US – shifting BB 1 down to BB 2 –or via a lower S($/£), shifting BB 1 left to BB 2 .Figure 21.2 shows that the leftward shift of MM 1 toMM 2 and of BB 1 to BB 2 both cause an appreciation ofthe US dollar. 12 This is the same qualitative conclusionas following from the monetary theory.However, we see that the exchange-rate appreciationis the result of adjustments in both the moneyand bond markets, and therefore is larger than theexchange-rate appreciation occurring only viathe money market; compare E 2 with E 0 2 , where E 2 isthe equilibrium with adjustments in the money andbond markets.THEORIES OF EXCHANGE-RATEVOLATILITYThe Dornbusch sticky-price theory 13In the monetary approach presented earlier, weassumed that the PPP condition holds for the overallprice level; P US and P UK in equation (21.5) are theprices of baskets containing all goods and services.If this assumption about PPP is relaxed, themonetary approach can generate exchange-rateovershooting, which occurs when exchange ratesgo beyond their new equilibrium level beforereturning to it.Let us suppose that PPP holds for internationallytraded goods but not for products that are nottraded internationally, such as land and many services.Let us suppose prices of nontraded goods are12 In Figure 21.2 we assume the shift in MM dominates BB sothat at E 2 are higher than at E 1 .13 More complete accounts of the Dornbusch sticky-pricetheory can be found in Rudiger Dornbusch, ‘‘Expectationsand Exchange Rate Dynamics,’’ Journal of Political Economy,December 1976, pp. 1161–76, and in Rudiger Dornbusch,Open Economy Macroeconomics, 2nd edn, Basic Books,New York, 1988.‘‘sticky,’’ that is, they move slowly toward theirnew equilibrium after a disturbance. On the otherhand, countries that are price takers pay the worldprice for internationally traded goods multiplied bytheir exchange rate, and so we can assume thatprices of these goods are flexible, changing as thecountry’s exchange rate changes. In these circumstances,if the exchange rate falls in proportion tothe percentage increase in a country’s money supply,as suggested by the monetary approach, therestill remains an excess supply of money. This isbecause prices of traded goods increase in proportionto the country’s money supply because theymove directly with the exchange rate as given byequation (21.6), but prices of nontraded goodsincrease only slowly. Therefore, the overall pricelevel increases less than the money supply, leavingthe demand for money lower than the supply: recallthat the demand for money increases in the sameproportion as the overall price level. Eventually, theexcess supply of money is eliminated via risingprices of nontraded goods, but in the interim theexcess supply of money causes increased spendingon goods and bonds.The theory of overshooting exchange rates concentrateson the effect of the increased spending onbonds, arguing that this causes higher bond pricesand, consequently, lower interest rates. If a country’sinterest rates are lower than rates inother countries, capital leaves the country until thecountry’s currency is low enough that it is expectedto appreciate by the extent to which its interest rateis below that of other countries. 14 In order for thecurrency to be expected to appreciate, the exchangerate must overshoot, going lower than its eventualequilibrium level. This means that prices of tradedgoods, which move with the exchange rate, increaseby even more than the increase in the money supply,thereby augmenting the increase in the price index.14 This is because as we saw in Chapter 8, the return frominvesting in a country consists of two components: theinterest rate, and the change in the value of the country’scurrency between the time of the investment and maturity.Therefore, an expected appreciation of a country’s currencycompensates for lower interest rates in that country.479 &
THE INTERNATIONAL MACROECONOMIC ENVIRONMENTThis increases the demand for money, as does thelow interest rate, helping to maintain the equality ofsupply and demand for money in the short run.In the long run, prices of nontraded goodsincrease in the same proportion as the increase in themoney supply: they increase slowly due to theirstickiness, but do eventually catch up. This meansthat, in the long run, the exchange rate needs todepreciate only in the same proportion as theincrease in the money supply. Therefore, afterovershooting beyond the new (lower) long-runequilibrium level, the exchange rate appreciatesback to its new equilibrium. This appreciationreduces prices of traded goods, so that in the end,prices of traded and nontraded goods have bothincreased in the same proportion as the moneysupply. Therefore, the overshooting is temporary,lasting only as long as the prices of nontradedgoods lag behind the increase in the money supply.Furthermore, the appreciation of the currency backto equilibrium is consistent with the temporaryreduction in the interest rate: the expectedappreciation actually occurs.Figure 21.3 illustrates the overshooting we havedescribed. The ray from the origin in the top righthandquadrant shows the PPP principle for agiven level of British prices. The line reflects thePPP condition, P US ¼ S($/£) P UK : The upwardslopingline shows that for a given P UK , higher USprices are associated with a dollar depreciation ofthe same proportion; a higher S($/£) is a dollardepreciation.r USGBr 1CMM 2MM 1P 2EP 1 ADS 2r 2 0 S 1 S eS 1S 2FF 1FF 2S eP USPPPS($/£)45°S($/£)& Figure 21.3 Exchange-rate overshootingNotesWith the initial US money supply the equilibrium price level is P 1 and the exchange rate is S 1 . An increase in the moneysupply shifts the money market equilibrium line from MM 1 to MM 2 , and at the sticky price P 1 , r US falls to r 2 and the dollardepreciates from S 1 to S 2 . As prices increase, the equilibrium P US and S($/£) move to E. At E the price level is, P 2 , and r USreturns to r 1 . The higher price level shifts FF 1 to FF 2 ; higher US prices must be offset by a depreciated dollar. The newexchange rate is S e which is on the PPP line at price P 2 .& 480
THEORIES OF EXCHANGE RATESThe downward-sloping line MM 1 in the topleft-hand quadrant represents initial equilibrium inthe US money market for a given money supply.Higher prices increase the demand for money, andthis is offset by an increase in the interest rate whichreduces the quantity of money demanded byincreasing the opportunity cost of holding it. Theline FF 1 in the bottom left-hand quadrant representsinitial equilibrium in the foreign exchange market.It shows a higher US interest rate associated witha dollar appreciation. (A higher r US attracts capitaland improves the capital account. For balance in theforeign exchange market, we need to offset this bya more expensive US dollar which worsens thecurrent account. Hence, equilibrium in foreignexchange requires that dollar appreciation be associatedwith a higher interest rate.) FF 1 is drawn forthe US price level P 1 . 15Suppose that the US money supply is initiallysuch that for a given British price level, the US is atpoint A on the PPP line, with price level P 1 andexchange rate S 1 . Drawing a horizontal line frompoint A to point B on MM 1 shows the associatedinterest rate, r 1 , where the US money market is inequilibrium: recall that along MM 1 US moneydemand equals money supply. Next, drawing a linefrom B on MM 1 down to C on the FF 1 line gives thespot rate S 1 on the vertical axis where the foreignexchange market is in equilibrium: the line FF 1shows the combinations of interest rate andexchange rate providing foreign exchange marketequilibrium. The 45-degree line in the bottomright-hand quadrant allows us to trace the spotrate over to the horizontal axis, where we have S 1 ,the initial spot rate, consistent with the initial USprice level P 1 ; the 45-degree line simply allows us totransfer the vertical axis to the horizontal axis. Nowlet us consider what happens after an increase in theUS money supply.15 The 45-degree line in the bottom right-hand quadrant issimply to move between the goods market equilibrium inthe upper right-hand quadrant and the foreign exchangemarket equilibrium in the bottom left-hand quadrant.An increase in the US money supply shifts MM 1to MM 2 ; to induce people to demand the extramoney it is necessary to have a higher P US or lowerr US . If prices are sticky at P 1 , the new equilibriuminterest rate is r 2 , given off MM 2 at P 1 . The line FF 1 ,which is drawn for price level P 1 , shows the newspot rate S 2 associated with r 2 . This spot rate isshown also on the horizontal axis; we transfer axesvia the 45-degree line. With the current sticky pricelevel P 1 , and the spot rate S 2 , we are at point D inthe top-right quadrant, where point D is below thePPP line. This is a temporary disequilibrium, withthe US dollar undervalued relative to PPP: there aremore dollars per pound than for PPP.Eventually prices of nontraded goods begin toincrease. We can show that a new equilibrium iseventually attained at E. This is because at E theprice level is P 2 , and the US interest rate, given offMM 2 at point G is r 1 . With prices higher at P 2 , theforeign exchange market equilibrium line shiftsfrom FF 1 to FF 2 . (Higher prices would cause acurrent account deficit unless there was a depreciationof the dollar. Therefore, as the price levelincreases, foreign exchange market equilibriumrequires a higher value of S($/£), which means adownward shift from FF 1 to FF 2 , where FF 2 is theforeign exchange market equilibrium line at USprice level P 2 .) At r 1 and with FF 2 the spot rate is S e .When S e is transferred to the horizontal axis via the45-degree line, the value of S e and P 2 coincide at E,the new equilibrium exchange rate and price levelsatisfying PPP, with this being at the new, higher USmoney supply.Figure 21.3 shows the spot rate going from S 1 toS 2 to S e , an overshooting of the eventual equilibriumS e . The US dollar appreciation from S 2 to S e occursafter the interest rate has temporarily declined to r 2 ,with the expected appreciation of the dollar compensatingfor the lower r US . As the appreciationceases – the equilibrium value S e is attained – r USmoves to its initial level, r 1 ; there is no reason forthe interest rate to change when the stock of moneychanges to a new level and then remains constantbecause inflation should return to zero. We shouldrecall that the overshooting of the exchange rate is481 &
THE INTERNATIONAL MACROECONOMIC ENVIRONMENTcaused by some prices being sticky, in this case thoseof the nontraded goods. Exchange-rate volatilitythat has occurred has heightened interest in thisovershooting theory, with Dornbusch’s theoryhaving been cited by the The Economist as one of theten most influential economics papers of thetwentieth century. 16Varying elasticitiesAs we saw in Chapter 6, if the demand for importsis inelastic in the short run, then depreciation canincrease the value of imports; import prices increaseby more than the quantity of imports declines, sothat the value (price quantity) of importsincreases. This means that the amount of a country’scurrency supplied can increase with a depreciation.If the demand for the currency does not increase byas much as the supply because export demand is alsovery inelastic in the short run, a depreciation causesan excess supply of the currency. An excess supplymeans further depreciation. Therefore, whileinelasticities persist there is depreciation, furtherexcess supply, further depreciation, and so on.However, eventually, as elasticities of importdemand and export supply increase, stabilityreturns to the exchange rate. Therefore, it ispossible for exchange rates to overshoot.A particular variant of the varying elasticitiesexplanation of overshooting that has been advancedby Steven Magee is that previously agreed-uponexport contracts make demand and supply elasticitieseffectively zero in the short run. 17 Forexample, if a given, contracted quantity of wheat ispurchased by Britain at a contracted US dollar price,then a depreciation of the pound increases poundpayments for the wheat in proportion to thedepreciation, causing an excess supply of poundsand further depreciation. What happens is that the16 ‘‘Why Exchange Rates Change,’’ The Economist, SchoolsBrief, November 24, 1984, pp. 66–7.17 Steven Magee, ‘‘Contracting and Spurious Deviations fromPurchasing Power Parity,’’ in Jacob A. Frenkel and HarryG. Johnson (eds), The Economics of Exchange Rates: SelectedReadings, Addison-Wesley, Reading, MA, 1978.& 482British demand for imports has an elasticity ofzero during the contract period. Only when thecontract expires can the quantity purchased declineas a result of the higher pound price. In the interim,the exchange rate can overshoot.Stock adjustment and flow fluctuationsOvershooting of exchange rates can also beexplained by arguments akin to those of theaccelerator model. 18 Let us do this with the helpof an example.Suppose British investors save £10 billion eachyear and divide it evenly between British and USinvestments. Suppose that they have accumulated£100 billion of investments in each country fromtheir investments during previous years, but thatsuddenly, perhaps because of the election of apopular US president or an unpopular British PrimeMinister, British investors decide to increase theirUS investments from 50 to 60 percent of theirportfolios.After their portfolios have been adjusted, theBritish will purchase £6 billion of US investment (60percent of their annual savings of £10 billion) andtherefore £6 billion of US dollars per year to pay forthis investment. However, in order to readjust theiraccumulated portfolios, the British must purchaseanother £20 billion of US investments and thenecessary US dollars; with £100 billion in eachcountry, having 60 percent of the portfolio in USassets requires having £120 billion of US assets, andhence the extra $20 billion. If the readjustment ofthe accumulated portfolios occurs during one year,the path of the annual British demand for dollarsgoes from £5 billion during the year before theadjustment to £26 billion during the readjustmentyear, and then back to £6 billion per year afteradjustment. Therefore, the demand for dollars is18 The accelerator model offers an explanation of the businesscycle – an overshooting of the GDP – based on assumingthe stock of capital is proportional to the GDP. As GDP isrising investment is positive. When GDP stops risinginvestment drops to zero. This decline in investment causesa decline in GDP. The consequence is swings in GDP.
THEORIES OF EXCHANGE RATESabnormally high during the period in whichaccumulated portfolios are being readjusted, andthis can cause the value of the US dollar to overshoot.The basic reason is that accumulated portfolios arelarge relative to annual additions to portfolios, thatis, stocks are large relative to flows. 19A reason why large shifts in desired portfoliosmight occur is that some forms of money do not payinterest. Normally, interest rates increase to makeup for expected depreciations, so that investors donot switch assets because they anticipate a depreciation.Without interest being paid on money, thiscompensation is not possible. Consequently, largeadjustments between different countries’ moniescan occur, causing large flow demands andexchange-rate overshooting. 20Other theories of overshootingWe have by no means exhausted the theories ofovershooting. For example, Jeffery Frankel andKenneth Froot have offered a theory of ‘‘speculativebubbles’’ in exchange rates, based on changes inthe amount of attention currency managers payto chartists, who extrapolate recent trends, andfundamentalists, who consider the fundamentalssuch as long-run adherence of exchange rates toPPP. 21 Frankel and Froot argue that portfoliomanagers attach more weight to the predictions ofthe group of forecasters that has been more accuratein the recent past. If chartists happen to be correctfor a while possibly just by chance, their predictionsare followed, making their predictions correct,causing even greater attention to be paid to them,and so on. Because the chartists’ predictions areself-reinforcing, it is only when exchange rates havebecome completely out of line with fundamentalsthat the chartists are likely to falter, making portfoliomanagers switch their attention to the adviceof fundamentalists. When this shift in attentionoccurs, exchange rates move back from their disequilibriumlevels. Eventually, even if just bychance, the chartists are likely to be more correctthan the fundamentalists, which with self-realizingeffects, causes another bout of overshootingexchange rates.SUMMARY1 Several theories of exchange rates have been advanced which are based on the stocks ofcountries’ monies versus the demands to hold these monies.2 Asset-based theories differ according to the assets they consider, and whether theyinvolve rational expectations of the future.3 The monetary approach to exchange rates is based on the need for money supplies andmoney demands to be equal, where money demands depend on price levels, real GDPs andinterest rates, and money supplies are determined by banks, especially the central bank.19 This explanation for exchange-rate overshooting has been advanced by Robert M. Dunn, Jr, The Many Disappointments of FlexibleExchange Rates, Essays in <strong>International</strong> <strong>Finance</strong>, 154, Princeton University, Princeton, NJ, December 1983.20 For variants of this explanation of volatility of exchange rates see Lance Girton and Donald Roper, ‘‘Theory and Implication ofCurrency Substitution,’’ Journal of Money, Credit, and Banking, February 1981, pp. 12–30, and Ronald I. McKinnon, ‘‘CurrencySubstitution and Instability in the World Dollar Market,’’ American Economic Review, June 1982, pp. 302–33.21 Jeffrey A. Frankel and Kenneth A. Froot, ‘‘The Dollar as an Irrational Speculative Bubble: A Tale of Fundamentalists andChartists,’’ National Bureau of Economic Research, working paper 959, 1988. For an earlier model of overshooting based ondifferent market players see Richard G. Harris and Douglas D. Purvis, ‘‘Diverse Information and Market Efficiency in aMonetary Model of Exchange Rates,’’ Economic Journal, December 1981, pp. 829–47.483 &
THE INTERNATIONAL MACROECONOMIC ENVIRONMENT4 The monetary approach predicts an exchange rate will depreciate by the excess ofmoney supply versus demand in one country over another. It also predicts that fastergrowth of real GDP will cause an appreciation, and that higher interest rates andexpected inflation will cause a depreciation.5 The asset approach to exchange rates suggests that the current exchange rate dependson the expected future exchange rate. Since the expected future rate can depend onexpected inflation or anything appearing in the balance-of-payments accounts oraffecting asset supplies and demands, the asset approach is consistent with othertheories of exchange rates.6 The portfolio-balance approach assumes different countries’ bonds are not perfectsubstitutes. As a result, changes in preferences for bonds of one country over another, orchanges in bond supplies, can affect exchange rates.7 If prices are sticky, exchange rates may overshoot their equilibrium. Other explanationsof exchange-rate overshooting include elasticities of import demand and export supplythat vary over time, and portfolio readjustment causing jumps in currency supplies ordemands during the readjustment period.REVIEW QUESTIONS1 What are the essential components of the monetary theory of exchange rates?2 What does the monetary theory of exchange rates assume about the substitutability ofdifferent countries’ monies and bonds?3 What does the monetary theory of exchange rates imply fora Relatively rapid growth in a country’s money supply?b Relatively rapid growth in a country’s national income?c An increase in a country’s interest rates versus interest rates in another country?4 Does the asset approach to exchange rates consider expectations about future exchangerates?5 What does the portfolio-balance approach to exchange rates assume about thesubstitutability of different countries’ monies and bonds?6 What is meant by exchange-rate overshooting?7 What does the Dornbusch overshooting theory assume about the speed of adjustment ofdifferent prices?8 What happens in the Dornbusch overshooting theory to interest rates after exchangerates have overshot their eventual equilibrium?ASSIGNMENT PROBLEMS1 Why does the monetary approach imply that higher expected inflation causes a currencyto depreciate?& 484
THEORIES OF EXCHANGE RATES2 Suppose thatM US ¼ $500 billionM Can ¼ C$50 billionQ US ¼ $7; 000 billionQ Can ¼ C$600 billiona ¼ 1b ¼ 0and that PPP holds. What exchange rate is implied by the monetary theory of exchangerates?3 Assume in the previous question that all magnitudes are unchanged except the Canadianmoney supply which increases from C$50 billion to C$55 billion. What happens to theimplied exchange rate, and how does this compare to the percentage change in theCanadian money supply?4 Assume that all data in Question 2 are unchanged except the US GDP, Q US , whichincreases from $7,000 billion to $7,700 billion? What happens to the exchange rate, andhow does this compare in magnitude to the change in US GDP?5 What does the asset approach imply about the ability to make money by speculating inforeign exchange?6 How can the asset approach explain deviations from PPP based on current price indexes?7 What are the principal differences and similarities between the monetary and portfoliobalanceapproaches to exchange rates?8 What is the crucial assumption required for exchange-rate overshooting in the Dornbuschmodel? Do you think this assumption is valid?9 Why does the foreign exchange equilibrium line FF move downwards in Figure 21.3 whenthere is an increase in the US price level?10 How does the portfolio-balance approach differ in its predictions of the effect of amoney supply expansion via open-market operations and a money supply expansion viaa reduction in reserve requirements? Use a figure such as Figure 21.1 to reach yourconclusions.11 Is the long-run equilibrium of Dornbusch’s overshooting theory consistent with themonetary theory of exchange rates?12 Why does the interest rate return to its initial level in the Dornbusch overshooting theoryafter an increase in the stock of money to a new level?BIBLIOGRAPHYBilson, John F.O., ‘‘The Monetary Approach to the Exchange Rate: Some Empirical Evidence,’’ Staff Papers,<strong>International</strong> Monetary Fund, March 1978, pp. 48–75.Chen, Chau-Nan, Ching-Chong Lai, and Tien-Wang Tsaur, ‘‘The Loanable Funds Theory and the Dynamics ofExchange Rates: The Mundell Model Revisited,’’ Journal of <strong>International</strong> Money and <strong>Finance</strong>, June 1988,pp. 221–9.485 &
THE INTERNATIONAL MACROECONOMIC ENVIRONMENTDooley, Michael P. and Peter Isard, ‘‘The Portfolio Balance Model of Exchange Rates,’’ <strong>International</strong> <strong>Finance</strong>Discussion Papers, Board of Governors of the Federal Reserve, no. 141, May 1979.Dornbusch, Rudiger, ‘‘Expectations and Exchange Rate Dynamics,’’ Journal of Political Economy, December1976, pp. 1161–76.——, Open Economy Macroeconomics, 2nd edn, Basic Books, New York, 1988.The Economist, ‘‘Why Exchange Rates Change,’’ Schools Brief, November 24, 1984, pp. 66–7.Hooper, Peter and John Morton, ‘‘Fluctuations in the Dollar: A Model of Nominal and Real Exchange RateDetermination,’’ Journal of <strong>International</strong> Money and <strong>Finance</strong>, April 1982, pp. 39–56.Stultz, René M., ‘‘Currency Preferences, Purchasing Power Risks and the Determination of Exchange Ratesin an Optimizing Model,’’ Journal of Money, Credit and Banking, August 1984, pp. 302–16.& 486
Chapter 22Alternative systems ofexchange ratesAs science joins with technology to reduce man’s ignorance and appease his wants at appallingspeed, human institutions lag behind, the victim of memory, convention and obsolete educationin man’s life cycle. We see the consequences of this lag ...at the nerve center of nationalsovereignties; international economic arrangements.Robert MundellWhen exchange rates are flexible, as they wereassumed to be in Chapters 6 and 21, they aredetermined by the forces of market supply anddemand. When exchange rates are fixed, theyare determined by governments or governmentcontrolledauthorities such as central banks whichprovide residual supply and demand to preventrates from changing.During the last two centuries, several methodshave been employed for fixing exchange rates. Ourpurpose in this chapter is to describe the main fixedexchange-rate systems that have been in effect atvarious times since the early nineteenth century,not to provide a history of international financialarrangements, but rather to explain how the differentsystems involved mechanisms which automaticallyhelped correct deficits and surpluses in thebalance of payments. This is a function that is performedby exchange rates themselves when they arefree to adjust. We shall also see that internationalfinancial arrangements change through time, usuallyin response to deficiencies in the adjustment processes.Fixing one problem often highlights newones which in turn need to be addressed. Thissuggests that while at this time the predominantexchange-rate system is one of flexible exchangerates, there is no guarantee that things will remainthis way, and furthermore, many countries eventoday persist in fixing rates. Some importantcountries, such as China, have limited convertibilityof their currencies into foreign exchange, and withpermitted conversions being done at a fixed rate. 1Understanding how the international financial systemhas evolved and the variations that persist in thissystem is important for acquiring a comprehensiveunderstanding of the international businessenvironment.One automatic balance-of-payments adjustmentmechanism which has received particularlyclose attention is that involving the price level.We shall explain the so-called automatic priceadjustmentmechanism in the context of theclassical gold standard. 21 China has to decide first whether to make the yuan freelyconvertible into foreign currencies, and second, if it is madeconvertible, whether to convert at an official fixed exchangerate or at a market determined exchange rate.2 Two other adjustment mechanisms, one involving nationalincome and the other interest rates, are explained inAppendix A in this chapter.487 &
THE INTERNATIONAL MACROECONOMIC ENVIRONMENTTHE CLASSICAL GOLD-STANDARDSYSTEMThe gold standard and arbitrageThe essential feature of the gold standard is thateach country stands ready to convert its paper orfiat money into gold at a fixed price. 3 This fixingof the price of gold fixes exchange rates betweencurrencies. For example, if the US Federal Reserveagrees to buy and sell gold at $400/oz., and theBank of England agrees to buy and sell gold at£250/oz., the exchange rate between the poundand dollar in the form of paper currency or bankdeposits will be $1.6/£ ($400 £250). If theexchange rate is not $1.6/£, the foreign exchangemarket will not balance because it will be used forconverting one currency into the other, but not viceversa. For example, if the exchange rate in theforeign exchange market is $1.50/£, the marketwill be used for converting dollars into pounds, butnot for converting pounds into dollars. This isbecause it is cheaper for people converting poundsinto dollars to buy gold from the Bank of Englandwith pounds (one pound buys 1/250 oz. of gold at£250/oz.), ship the gold to the US, and sell it to theFederal Reserve for dollars; for 1/250 oz. the Fedpays $1.60 ($400/oz. 1/250 oz.). This roundaboutexchange gives more dollars per pound tothose converting pounds into dollars, than the$1.50/£ received in the foreign exchange market.However, people converting dollars into poundspay $1.50/£ on the foreign exchange market versus$1.60/£ via buying, shipping, and selling gold.(Each pound requires selling 1/250 oz. of gold tothe Bank of England. To buy 1/250 oz. of gold fromthe Federal Reserve costs $400 1/250 ¼ $1.60.)Since people are converting dollars into pounds,but not pounds into dollars at the exchange rate of$1.50/£ there is a demand for pounds on the foreignexchange market, but no supply of pounds. Thisexcess demand for pounds will increase the price of3 Fiat money is money whose face or stated value is greaterthan its intrinsic value. Its value comes from the edict, or fiat,that it must be accepted in discharge of financial obligations.& 488the pound to $1.60/£. Similarly, if we begin withan exchange rate of $1.70/£, the foreign exchangemarket will be used by people converting poundsinto dollars, but not by people converting dollarsinto pounds; the latter group will instead buy goldfrom the US Fed with dollars, ship the gold to Britain,and sell the gold for pounds. With people sellingpounds and not buying pounds, the dollar value ofthe pound will fall from $1.70/£ until it reaches$1.60/£. That is, if the price of gold is $400/oz. in theUS and £250/oz. in Britain, the equilibrium exchangerate on the foreign exchange market is $1.60/£.We have based our argument on one-wayarbitrage, that is, by considering people who plan toexchange currencies and are looking for the cheaperof two methods: exchange via the foreign exchangemarket, or exchange via buying, shipping, andselling gold. This is the type of arbitrage we consideredwhen discussing cross exchange rates inChapter 2 and covered interest parity in Chapter 8.An alternative way of reaching the same conclusionis with round-trip arbitrage, which involves showingthat if the exchange rate in our example is not$1.60/£, people can profit by buying gold withdomestic money, shipping the gold to the othercountry, selling the gold for foreign currency, andthen selling the foreign currency for domesticmoney. This is a round trip, starting and endingwith domestic currency. When there are no transactioncosts, one-way and round-trip arbitrageproduce the same result. However, when it is costlyto exchange currencies as well as costly to ship,buy, and sell gold, round-trip arbitrage implies anunrealistically large possible range in the exchangerate. Appendix B derives the possible range inexchange rates based on the correct, one-wayarbitrage argument. The end points of the possibleexchange rate range are called gold points.Exchange rates must be between these points.Price adjustment and the gold standardDifferent exchange-rate systems involve differentmechanisms for adjusting to imbalances in internationalpayments and receipts. One of these
ALTERNATIVE SYSTEMS OF EXCHANGE RATESmechanisms involves changes in the price level. Theprice-level adjustment mechanism under the goldstandard is known as the price-specie automaticadjustmentmechanism, where‘‘specie’’ is justanother word for precious metal. This mechanismwas described as early as 1752. 4 In order to explainthe mechanism, let us continue to assume that gold is$400/oz. in the US and £250/oz. in Britain and thatthe resulting exchange rate is $1.60/£. Let us alsoassume that Britain buys more goods and servicesfrom the United States than the United States buysfrom Britain, that is, Britain has a trade deficit withthe United States. The price-specie adjustmentmechanism explains how the British deficit and theUS surplus are automatically corrected.With Britain buying more goods and servicesfrom the United States than the United States isbuying from Britain, there is an excess supply ofpounds; more pounds are supplied by residents ofBritain than are demanded by residents of theUnited States. With flexible exchange ratesthis would reduce the value of the pound below$1.60/£, but with a gold standard this will nothappen because nobody will sell pounds in theforeign exchange market for less than $1.60.Rather, as soon as the pound dips even slightlybelow $1.60, people will sell pounds to the Bank ofEngland in return for gold, ship the gold to the US,and sell the gold to the Federal Reserve for dollars.This gives people $1.60 for each pound. Therefore,the result of the British balance-of-payments deficitis the movement of gold from the Bank of Englandto the US Federal Reserve.An alternative way of reaching this conclusion isto assume that while all domestic transactions aresettled with paper money, international transactionsare settled in gold. Therefore, if Britain buysmore goods and services from the United Statesthan the United States buys from Britain, more goldleaves Britain than arrives in Britain, with thereverse being the case for the United States.4 David Hume, ‘‘Of the Balance of Trade,’’ in Essays on Money,Political Discourses, London, 1752, reprinted in RichardCooper,<strong>International</strong><strong>Finance</strong>,Penguin,Baltimore,MD,1969.Whatever way we view it, we have gold leaving thedeficit country, Britain, and arriving in the surpluscountry, the United States.The movement of gold from the deficit country,Britain, to the surplus country, the United States,has effects on both countries’ money supplies. This isbecause in standing ready to exchange gold for papermoney at a fixed price, central banks have to makesure they have sufficient gold on hand for those whowish to exchange paper money into gold. Prudentbanking requires that a minimum ratio of goldreserves to paper money be held, and indeed, thisused to be mandated in many countries, includingthe United States where a minimum gold reserveequal to 25 percent of circulating currency used tobe required. The maintenance of a minimum reserveratio means that as the Bank of England loses gold itneeds to reduce the amount of its paper money incirculation. At the same time, the increase in theFederal Reserve’s gold reserves allows it to putmore paper money into circulation.In fact, the changes in paper money in circulationoccur automatically as people buy and sell gold forinternational settlement. The British take papercurrency to the Bank of England when buying gold.This reduces the amount of paper pounds in circulation.At the same time Americans take gold tothe Fed and receive paper money in return. In otherwords, as a result of the British trade deficit and UStrade surplus the British money supply shrinks andthe US money supply expands. In the minds ofthe eighteenth-century classical economists whodescribed the working of the gold standard, the fallin the money supply in the deficit country wouldcause a fall in the country’s price level. At thesame time, the increase in the money supply inthe surplus country (in the two-country world weare describing, one country’s deficit is the othercountry’s surplus) would cause an increase in thecountry’s price level. The link between the moneysupply and prices the classical economists had inmind was the quantity theory of money. Thistheory predicts that prices change in proportion tochanges in the money supply. With prices falling inthe deficit country, Britain, and increasing in the489 &
THE INTERNATIONAL MACROECONOMIC ENVIRONMENTsurplus country, the United States, there is a declinein British prices versus US prices. The relativelycheaper British goods makes British exports morecompetitive in the United States, helping themincrease. At the same time, US goods in Britainbecome less competitive than Britain’s own importsubstitutes, so that British imports decline. 5 WithBritish exports increasing and imports decreasing,Britain’s deficit declines. Indeed, until the deficithas been completely eliminated there will be anexcess supply of pounds, a sale of pounds to theBank of England, a shipment of gold to the US, adecrease in the British money supply, an increase inthe US money supply, lower British prices, higherUS prices, increasing competitiveness of Britishproducts at home and abroad, and a continuedreduction in the British trade deficit.The price-specie adjustment mechanism worksnot only via changes in relative prices betweencountries, but also via changes in relative priceswithin each country. In the deficit country, forexample, the prices of nontraded goods willdecline, but the prices of goods which enter internationaltrade will remain unchanged. This isbecause prices of traded goods are determined byworld supply and demand, not by local marketconditions. The fall in the relative price of nontradedversus traded goods in the deficit countrywill encourage local consumers to switch fromtraded to nontraded goods. At the same time, localproducers will find it relatively more profitable toproduce traded goods. The switch in consumerspending will free more tradable goods to beavailable for exports and at the same time producerswill produce more tradable goods. These effectswill be reinforced by developments in the surpluscountries: the prices of nontraded goods in thesecountries will rise relative to the prices of tradedgoods, switching consumers toward traded goodsand producers away from them. Altogether, we5 However, we showed in Chapter 6 that, even if Britain buysa smaller quantity of imports from the United States becauseUS goods become more expensive, there could be anincrease in the value of imports. This would occur if theBritish demand for imports were inelastic.& 490shall find exports of the deficit country increasingand imports decreasing, thereby improving thetrade balance. 6Unfortunately for the effectiveness of the pricespecieautomatic-adjustment mechanism of the goldstandard, governments were often tempted toabandon reserve ratios between gold and papermoney when the maintenance of those ratios rancounter to other objectives. If a deficit is notallowed to reduce the money supply because, forexample, the government thinks this will raiseinterest rates or unemployment to intolerablelevels, the price-adjustment process cannot work tocorrect the trade deficit. If, at the same time, surpluscountries with rising gold reserves do not allowtheir money supplies to grow from surplusesbecause, for example, of a fear of inflation, thenboth causes of a relative price adjustment betweencountries are lost; we lose lower prices in the deficitcountry and higher prices in the surplus country.The policy of not allowing a change in reserves tochange the supply of money is known as sterilizationor neutralization policy. As goals offull employment became common in the twentiethcentury, many countries abandoned their effort tomaintain reserve ratios and focused on theirdomestic economic problems.As a result of neutralization, the gold standardwas not allowed to work. This is perhaps the mostpowerful criticism of the system. But that does notexplain whether it could have worked. Some economists,most notably Robert Triffin, have said thatit could not work. 7 Central to this view is thenotion that prices are rigid downward (a featureof Keynesian economics) and that therefore trade6 For an account of this and other fixed-exchange-rateadjustment systems, see Rudiger Dornbusch, Open EconomyMacroeconomics, 2nd edn, Basic Books, New York, 1988, orLeland Yeager, <strong>International</strong> Money Relations: Theory, History,and Policy, 2nd edn, Chapter 5, Harper & Row, New York1976.7 Robert Triffin, ‘‘The Myth and Realities of the So-calledGold Standard,’’ The Evolution of the <strong>International</strong> MonetarySystem: Historical Reappraisal and Future Perspective, PrincetonUniversity Press, Princeton, NJ, 1964; reprinted in RichardCooper,<strong>International</strong><strong>Finance</strong>,Penguin,Baltimore,MD,1969.
ALTERNATIVE SYSTEMS OF EXCHANGE RATESdeficits from gold outflows cannot be self correctingvia the automatic price-specie adjustment mechanism.Critics of the gold standard support this withevidence on the parallel movement of prices insurplus and deficit countries, rather than the reverseprice movement implied by the gold standard.It is true that without a decline in absolute prices,improving a trade deficit is made more difficult.However, it is relative prices which arerelevant (including those of nontraded versus tradedgoods within each country), and relative pricescould decline if surplus countries’ prices rose to agreater extent than those of deficit countries.If, therefore, prices are flexible upward and surpluscountries’ prices rise faster than those ofdeficit countries, we still have an automatic priceadjustmentmechanism, although it is weaker thanthe mechanism that might have existed if absoluteprices could fall. The other common criticism ofthe gold standard – that gold flows were frequentlysterilized – is a valid criticism, but it is as much acriticism of the government for not allowingthe gold standard to operate as it is of the goldstandard itself.A number of twentieth-century economistsand politicians have favored a return to the goldstandard. What appeals to the proponents of thissystem is the discipline that the gold standardplaced on the expansion of the money supply and thecheck that this therefore placed on inflation. 8 Theeconomists who prefer a return to the gold standardinclude Jacques Rueff and Michael Heilperin. 98 In the nineteenth century, rather than favoring the goldstandard because it kept inflation under control, there weremany who opposed it on the grounds it was deflationary. AsExhibit 22.1 explains, the political debate over ending thegold standard and replacing it with a bimetallic standardwas sufficiently intense to inspire the writing of a famousallegorical children’s classic, The Wonderful Wizard of Oz.9 See Jacques Rueff, ‘‘Gold Exchange Standard: A Danger tothe West,’’ The Times (London), June 27–29, 1961,reprinted in Herbert G. Grubel (ed.), <strong>International</strong>Monetary Reform: Plans and Issues, Stanford UniversityPress, Palo Alto, CA, 1963, and Michael Heilperin, ‘‘TheCase for Going Back to Gold,’’ Fortune, September 1962,also reprinted in Grubel, ibid.The politicians include the late French PresidentCharles de Gaulle and former New York CongressmanJack Kemp. A return to the gold standard,or some standard based on gold, would makeexchange-rate forecasting a relatively straightforwardtask. The exchange rate in normal times wouldvary within the gold points which are set by thebuying or selling prices of gold at the central banksand by the cost of shipping gold from country tocountry. Larger changes in exchange rates wouldoccur when countries changed the price of theircurrency in terms of gold, and this would be areasonably predictable event. Countries that wererunning out of gold reserves would be forced to raisethe price of gold, while countries which weregaining reserves might lower it.THE BRETTON WOODS AND DOLLARSTANDARDSThe mechanics of the BrettonWoods systemWith a gold standard, exchange rates, or at leasttheir ranges of potential variation, are determinedindirectly via the conversion price of each currencyvis-à-vis gold. When the gold standard came to anend with the depression of 1929–33 – after temporaryabandonment during the First World War –the exchange-rate system which eventually replacedit in 1944 offered direct determination of exchangerates vis-à-vis the US dollar. The system adopted in1944 is called the gold-exchange standard.Itisalso called the Bretton Woods system after thetown in New Hampshire at which its outlines wereworked out. This direct method of determiningexchange rates allowed movement in exchangerates between support points. Support pointswere the exchange rates at which foreign centralbanks purchased or sold their currency for USdollars to ensure that the exchange rate did notmove beyond these points. In return for foreigncentral banks fixing, or pegging, their currenciesto the US dollar, the United States fixed the price of491 &
THE INTERNATIONAL MACROECONOMIC ENVIRONMENTEXHIBIT 22.1THE WONDERFUL WIZARD OF OZ: A MONETARY ALLEGORYL. Frank Baum, author of the fanciful children’s taleThe Wonderful Wizard of Oz, first published in 1890,may well have received his inspiration at the Democraticconvention in Chicago in 1896. It was at thisconvention that Presidential candidate William JenningsBryan brought the cheering delegates to theirfeet with his rousing ‘‘Cross of Gold’’ speech.Declaring ‘‘Thou shalt not crucify mankind upon across of gold,’’ Bryan campaigned on the promise torid the US of the gold standard by adding silver tothe money base at a fixed ratio of seventy ounces ofsilver per ounce of gold. The motive was to expandthe US money supply which had grown far slowerthan national output since 1850, causing deflation ofapproximately 50 percent in the second half ofthe nineteenth century. This deflation had hit grainprices particularly badly, affecting Kansas and itsneighboring states, which is where the story of theWonderful Wizard begins.The Wonderful Wizard of Oz opens in Kansas, thecenter of the ‘‘free silver’’ movement, where a cyclone,a metaphor for the discontent that swept the depressedUS prairie states, carries Dorothy and her dogToto to the Land of Oz. The abbreviation oz is,of course, a form of writing ‘‘ounce,’’ as in, goldcosting $400/oz, and Toto happens to connect to the‘‘Teetotalers,’’ the Prohibition Party which gave itssupport to the silver forces in return for support onliquor prohibition. Dorothy is informed by theMunchkins who inhabit Oz that her landing has killedthe Wicked Witch of the East – a reference to theEastern establishment or President McKinley whosupported the gold standard. In order to return toKansas, Dorothy is told to follow the Yellow BrickRoad – a clear reference to the gold bricks in whichofficial gold was held – and to take with her theWitch’s silver slippers, the silver that Bryan’s supporterswanted added to the money supply. (Hollywoodlater changed the silver slippers to ruby slippersin the movie version of Baum’s work.)On her way along the Yellow Brick Road Dorothyfirst encounters the Scarecrow who represents theagricultural workers who supported moving from thegold standard to a gold–silver based bimetallic standard.Then she meets the Tin Woodsman who representsthe industrial unions that joined the movementto end the gold standard. The Cowardly Lion who tagsalong is Presidential candidate Bryan himself – whosededication to reaching the Emerald City becomes asmuch in doubt as Bryan’s commitment to end the USattachment to gold. Numerous other references togold and silver line the road the strange foursome –Dorothy, the Scarecrow, the Tin Woodsman, and theCowardly Lion – follow, including the golden platecapping the pot of courage, the gold buckle thatthreatened to lock them up for ever, and the goldhandledaxe with a blade that glistened like silver. TheWicked Witch of the West grabs one of the silverslippers; divided, the silver forces would not reach theirgoal. It was to be several years after The WonderfulWizard of Oz was published before the gold standardwas finally abandoned.Source: Hugh Rockoff, ‘‘ ‘The Wizard of Oz’ as a MonetaryAllegory,’’ Journal of Political Economy, August 1990,pp. 739–60.the US dollar to gold. Therefore, the gold-exchangestandard involved1 the United States being willing to exchange USdollars for gold at an official price;2 other countries being willing to exchange theircurrencies for dollars around an official, orparity, exchange rate.We shall deal with the history of the internationalfinancial system in the next chapter, but wecan note that the ability to convert foreign privatelyheld gold to dollars by the United States lasted until1968, and the ability to convert foreign officiallyheld gold lasted until 1971. With only the secondpart of the gold-exchange standard remaining ineffect after 1968 – that part involving the exchange& 492
ALTERNATIVE SYSTEMS OF EXCHANGE RATESof foreign currencies for dollars – the fixedexchange system from 1968 until the end of theBretton Woods system in 1973 is best described asa dollar standard.Under the gold-exchange standard and the dollarstandard, countries which pegged their exchangerates to the US dollar were required to keep theactual rate within 1 percent of the selected parityvalue. In order to ensure that the exchange vis-à-visthe dollar remained within the required 1 percent ofofficial parity, it was necessary for central banks tointervene whenever free-market forces would havecreated an exchange rate that was outside the range.This intervention took the form of buying and sellingthe local currency for US dollars at the upper andlower support points around the official par value.The support points meant adding to or reducingcentral-bank official reserves whenever the uncontrolledexchange rate would have moved beyond theofficial limits. We can illustrate the way these fixedexchange standards operated by using a diagram.Suppose that the Bank of England has decided, asit did from 1949 to 1967, to peg the value of thepound at a central value of $2.80. The upper andlower support points that the bank must maintainare $2.8280/£ and $2.7720/£. These are shown onthe vertical axis of Figure 22.1, which gives the spotprice of pounds in terms of dollars. The horizontalaxis gives the quantity of pounds, and so the diagramhas the price and quantity axes familiar from thetheory of supply and demand. We have added to thediagram conventionally sloping supply and demandcurves for pounds drawn against the price of pounds(measured in dollars). We have drawn the initialprivate demand curve for pounds, D 1 (£), intersectingthe private supply curve of pounds, S(£), withinthe 1 percent range allowed under the goldexchangeand dollar standards.Suppose that for some exogenous reason there isan increase in demand for British exports. Thismight, for example, be because of a general economicexpansion outside of Britain, a change in tastetowards British goods, or the discovery of more oiland gas in the North Sea. This will shift the privatedemand curve for pounds to the right, from D 1 (£)to D 2 (£), and the private demand for pounds willPrivatedemand, D 2 (£)D 1 (£) (fromexports fromBritain)Private supply, S(£)(from imports to Britain)Upper supportpoint and totalsupply of poundsSpot exchange rate S($/£)2.82802.80002.7720D9 2 (£)Lower supportpoint and totaldemand for pounds0 Q 3 Q 4 Q 1 Q 2Quantity of pounds per period of time& Figure 22.1 The workings of the gold-exchange and dollar standardsNotesThe Bank of England stood ready to buy pounds at the lower support point and sell pounds at the upper support point.This made the demand curve for pounds perfectly elastic at the lower support point and the supply curve of pounds perfectlyelastic at the upper support point, ensuring that the exchange rate was never outside the allowable range.493 &
THE INTERNATIONAL MACROECONOMIC ENVIRONMENTthen intersect the private supply curve at anexchange rate above the allowed ceiling. In order toprevent this, the Bank of England must, accordingto the gold-exchange and dollar standards, interveneat the upper support point of $2.8280/£ andsupply, in exchange for dollars, the pounds necessaryto keep the rate from moving above this level.In terms of Figure 22.1, the Bank of England willsupply Q 1 Q 2 pounds for dollars. This, with theprivate supply of OQ 1 pounds and the demand curveof D 2 (£), would leave the exchange rate at $2.8280.Because the Bank of England will supply whatevernumber of pounds is required at the upper supportpoint, the total supply curve of pounds becomesflat at this point, like the heavily drawn line inFigure 22.1. This is a feature of the gold-exchangeand dollar standards; the total supply curve of thelocal currency – consisting of private and officialsupply – becomes perfectly elastic at the uppersupport point.While the Bank of England supplies Q 1 Q 2pounds in Figure 22.1, it will be buying Q 1 Q 2 times2.8280 of US dollars, which is the shaded area aboveQ 1 Q 2 . The amount Q 1 Q 2 is the gain in the Bank ofEngland’s foreign exchange reserves (its balance-ofpaymentssurplus) valued in terms of pounds, andthe shaded area above Q 1 Q 2 is the gain in foreignexchange reserves, valued in terms of dollars.Suppose that instead of rising to D 2 (£), thedemand for pounds falls to D2(£) 0 as a result of,perhaps, a general slowdown in economic activityoutside of Britain or a decline in prices Britainreceives for its oil exports. According to privatesupply and demand, the price of the pound will fallbelow the lower support point, and to prevent thisfrom happening, the Bank of England has to enterthe market and purchase pounds. It will purchaseQ 3 Q 4 pounds with 2.7720 Q 3 Q 4 US dollars. Thedollar amount is given by the shaded area aboveQ 3 Q 4 ; it represents the decline in dollar reservesof the Bank of England. It is hence the deficit inthe balance of payments, measured in terms ofUS dollars. Because the Bank of England mustdemand whatever number of pounds is not wantedby private buyers, the total demand for pounds that& 494includes both private and official demand ishorizontal at the lower support point, $2.7720/£.This is another feature of the gold-exchange anddollar standards: the total demand curve for localcurrencies becomes perfectly elastic at the lowersupport point.Price adjustment under the gold-exchangeand dollar standardsTo explain the price-level adjustment mechanism ofthe gold-exchange and dollar standards, we refer toFigure 22.2. Suppose that after starting with S 1 (£)and D 1 (£) and a privately determined exchange ratewithin the allowed range, there is an increase inprivate demand for pounds to D 2 (£). As before,the Bank of England will be required to supplyQ 1 Q 2 pounds. These pounds will increase themoney supply in Britain; this occurs as theBank of England sells pounds for dollars. If we againassume that prices vary with the money supply, theincrease in the number of pounds in circulation willraise British prices. At each exchange rate on ourvertical axis, this will lower the competitiveness ofBritish goods. Exports will fall, assuming thedemand for exports is elastic so that quantitydeclines more than export prices increase, andimports will increase. The decline in British exportswill mean a lower demand for pounds. Therefore,the demand curve for pounds will move to the left.We assume that it moves to D 0 2 (£). The increasein British imports will mean a larger supply ofpounds to the foreign exchange market, and so theprivate supply curve moves to the right. We moveit to S 2 (£). With the demand and supply curves atD 0 2 (£) and S 2(£), the privately determined exchangerate will return to the allowed range.We find that intervention by a central bankaffects the supply of money, local prices, andexports and imports and thus restores equilibriumbetween private supply and demand. Of course, ifthere is sterilization of the balance-of-paymentssurplus or deficit and the money supply is notallowed to change, the price-level adjustmentmechanism will not work. Sterilization will result
ALTERNATIVE SYSTEMS OF EXCHANGE RATESSpot exchange rate S($/£)D9 2 (£)D 1 (£) D 2 (£)S 1 (£)S 2 (£)Upper supportLower support0Q 1 Q 2Quantity of pounds per period of time& Figure 22.2 The price-level adjustment mechanism of the gold-exchange and dollar standardsNotesIf the demand for pounds moves to D 2 (£) and the quantity of pounds demanded exceeds the quantity supplied at the uppersupport point, the Bank of England must sell pounds in exchange for dollars. Ceteris paribus, this increases the Britishmoney supply and prices. Higher prices make British exports decline, shifting the demand curve for pounds back toward D 0 2 (£).Higher prices also increase imports into Britain, and the currency demand supply curve shifts from S 1 (£) towards S 2 (£).Shifts in currency demand and supply curves move equilibrium exchange rates toward their allowable limits.in a continued change in foreign exchange reservesand a need to eventually revise the parity exchangerate. This makes exchange-rate forecasting apotentially highly rewarding activity since theneed to change the parity value becomes clearlyapparent in foreign exchange reserve statistics. Itis worthwhile to consider how exchange-rateforecasting can be done.We have already noted that when exchange ratesare determined on a gold standard, changes inexchange rates will follow large changes in goldreserves. For example, countries which are losingreserves will eventually be forced to raise the priceof gold in terms of their own currency. This meansa fall in the foreign exchange value of the currency.To take an example, if Britain were losing gold andraised its gold price from £250/oz. to £300/oz.while the US price remained fixed at $400/oz., theexchange rate would change fromSð$/£Þ ¼ $400/oz:£250/oz: ¼ $1:60/£toSð$/£Þ ¼ $400/oz:300/oz: ¼ $1:33/£This is a devaluation of the pound.By keeping track of gold reserves, a speculatorcould see when a central bank was under pressure toraise the price of gold, that is, to devalue. The exactdate would be difficult to predict, but actions basedon such an assumption would be unlikely to resultin losses. A country that is losing reserves mightmanage not to devalue, but it certainly would notrevalue, that is, raise the value of its currency byreducing the official price of gold. This means thata speculator would discover either she was correctand a devaluation did occur, or that the exchangerate remained as before. Thus, there is an opportunityfor a one-way bet, and the worst that is likelyto happen is that no speculative gain will be made.Indeed, widespread speculation that a devaluationwill occur is likely to make it occur. Speculation495 &
THE INTERNATIONAL MACROECONOMIC ENVIRONMENTagainst a currency causes the central bank to buy itsown currency, reducing foreign exchange reserves,thereby making devaluation appear even morelikely. For example, prior to the devaluations of theMexican peso in December 1994, speculators haddecided that a peso devaluation was imminent. Theytherefore sold pesos, and the Mexican authoritieswere required to purchase them at the lowersupport point. The pesos were purchased withUS dollars and hence the Mexican reserves werelowered. Eventually, reserves were so muchreduced that the Mexican government was forced todevalue. The speculators’ beliefs were vindicated.In a sense, their expectations were self fulfilling.The need to reduce the value of a currency in acountry experiencing deficits and declining reservesdepends on the ability of the central bank to borrowadditional reserves. There are arrangementsbetween central banks for exchanging currencyreserves, and procedures for borrowing frominternational institutions such as the <strong>International</strong>Monetary Fund (which is discussed in Chapter 23).The borrowing arrangements include centralbankswaps. Central-bank swaps involve, forexample, the US government making US dollarsavailable to the Bank of Canada when Canadianforeign exchange reserves are low. The Bank ofCanada temporarily swaps these US dollars forCanadian dollars. The swap is reversed later,according to the original agreement. Often theswap is reversed only after a number of years toallow the borrowing country to correct its balanceof payments. Central banks also frequently borrowfrom private banks. The Bank of Canada, forexample, borrowed heavily from both Canadian andUS commercial banks during the early- and mid-1980s despite the fact that the exchange rate wassupposed to be flexible. The ability of central banksto borrow from other central banks, from privatebanks, and from international institutions makes theforecasting of exchange rates more difficult; revisionsof par values can be delayed many years.Another factor adding to the difficulty of forecastingchanges in ‘‘fixed’’ rates is the differencein the need to react to surpluses and deficits.& 496Countries that are facing a deficit and losing reserveswill ultimately be forced to devalue because theirreserves and ability to borrow will eventually begone. On the other hand, the countries enjoyingsurpluses will be under little pressure to revalue theircurrencies and may instead allow reserves to keepgrowing. This represents one of the major problemswith the gold-exchange and dollar standards, namelythat the responsibility for adjustment, whether thisbe via a change in the exchange rate or via an automaticchange in money supplies and prices, fallson deficit countries more heavily than on surpluscountries. This problem of asymmetric need foradjustment between deficit and surplus countriesunder the Bretton Woods system is one of the majordifferences between this fixed-exchange-rate systemand the European Monetary System.THE EUROPEAN MONETARY SYSTEM(EMS)The structure of the EMSAt the same time as the Bretton Woods system wascollapsing, a new fixed-exchange-rate system wasemerging among the European Community (EC)countries. This new system began in 1972 as thesnake, which was designed to keep the EC countries’exchange rates within a narrower band thanhad been adopted as part of a last minute attemptto salvage the dollar standard. The snake involvedexchange rates being maintained within 1 and1/8 percent of either side of selected par values,compared to 2 1 4-percent deviations allowed as part ofa revision to the dollar standard in 1971. The snakewas so-called after the shape of the time path of ECcountries’ exchange rates ‘‘wiggling’’ within thewider band allowed for other exchange rates. Thesnake, with some refinements including a wideningof the band to 2 1 4percent deviations, became theExchange Rate Mechanism (ERM) of theEuropean Monetary System (EMS) in 1979.A central feature of the ERM was a grid thatplaced an upper and lower limit on the possibleexchange rates between each pair of member
ALTERNATIVE SYSTEMS OF EXCHANGE RATEScurrencies. The grid took the form of a matrixshowing for each pair of currencies the par value aswell as the highest and lowest permitted exchangerates, these being 2 1 4percent above and below thepar rates. That is, the matrix which listed the currenciesacross the columns and down the rows, hadthree exchange rates in each element: the par value,an upper limit, and a lower limit. If an exchange ratewas at either limit, both countries were supposed tointervene. For example, if the Belgian franc was atits lower support point vis-à-vis the German mark,the Belgian authorities were required to buy Belgianfrancs and the German authorities were also supposedto buy francs. The fact that the Germans werealso supposed to buy francs made the ERM fundamentallydifferent from the Bretton Woods system.As we have seen, under Bretton Woods, if, forexample, the pound was at its lower support point,Britain was required to buy pounds with dollars,but the United States was not required to cooperateby buying pounds too. Under the ERM, Germanywas supposed to buy francs, which meant sellingDeutschemarks, if the mark was at its upper limitagainst the Belgian franc, whether or not Germanyliked the implications of the increasing moneysupply the sale of Deutschemarks brought about.Partly because of the no-fault nature of the ERM,a divergence indicator was designed to identifyif, for example, the Belgian franc was at its lowersupport point vis-à-vis the Deutschemark because ofoverly expansive Belgian monetary policy or overlyrestrictive German monetary policy. The divergenceindicator was based on the value of the EuropeanCurrency Unit (ECU). 10The ECU was an artificial unit defined as aweighted average of each of the EC currencies. EachEMS country was required to maintain its exchangerate within a specified range of the ECU, as well aswithin a specific range vis-à-vis the other individualEMS currencies. This served to indicate whichcountry was at fault when a currency approached alimit vis-à-vis another currency, because the country10 The acronym of the European Currency Unit, ECU, or écu,is the name of a silver coin that once circulated in France.at fault would also be close to its limit vis-à-vis theECU. For example, if it was inflationary Belgianpolicy that forced the Belgian franc down vis-à-visthe German mark, the Belgian franc was also likelyto be low against other currencies, and hence againstthe ECU. The country that was at fault was requiredto take corrective action or explain to other EMSmembers why it should not. Par values were tobe realigned only as a last resort, although thishappened on several occasions.The ECU served an additional role in denominatingloans among the EMS countries. For example,if Belgium borrowed from Holland to defend itsexchange rate vis-à-vis the Dutch guilder or againstthe ECU, the loan could be denominated in ECUs.Private loans could also be denominated in ECUs.This reduced foreign exchange risk to the borrowerand lender because the value of the ECU was likelyto be more stable than the value of individual currencies;the ECU was like a portfolio of currencies,and as such, offered some diversification benefits.The ECU was also used to denominate loans madeby the European Monetary Co-operationFund,orEMCF. The EMCF made short-term andmedium-term readjustment loans to EMS membersout of a pool of funds at the Bank For <strong>International</strong>Settlements located in Basle, Switzerland.These lending arrangements as well as other detailedaspects of the EMS are dealt with in Exhibit 22.2.The EMS ran into trouble during 1992. Britainwas in severe recession with unemployment rateshigher than at any other time since the GreatDepression, 1929–33. Despite the recession,inflation had been relatively high, certainly vis-à-visinflation in Germany during the several years priorto 1992. Italy was also experiencing recession andhigh inflation. These conditions in Britain and Italyoccurred while Germany was experiencing itscostly reunification. This required unprecedentedoffshore borrowing, and this in turn put Germaninterest rates up; the need to attract capital meantGerman rates were above those in, for example, theUnites States – a stark reversal of traditional interestrate differentials. The high German interest ratesput upward pressure on the Deutschemark, forcing497 &
THE INTERNATIONAL MACROECONOMIC ENVIRONMENTEXHIBIT 22.2ALPHABET SOUP: ERM, EMS, ECU, AND ALL THATThe European Monetary System was an attempt toimprove upon Bretton Woods, keeping some of itsfeatures and adding new ones where necessary. Thefollowing article succinctly summarizes the importantsimilarities and differences.Like Bretton Woods, the EMS was based on a setof fixed parties called the Exchange RateMechanism (ERM). Each country was to establisha central parity of its currency in terms of ECU, theofficial unit of account. The ECU consisted of abasket containing a set number of units of eachcurrency. As the value of currencies varied, theweights of each country in the basket wouldchange. A parity grid of all bilateral rates couldthen be derived from the ratio of members’ centralrates. Again, like Bretton Woods, each currencywas bounded by a set of margins of 2.25 percent oneither side of parity, creating a total band of4.5 percent (for Italy, and later the United Kingdom,when it joined the ERM in 1990, the marginwas set at 6 percent on either side of parity). Themonetary authorities of both the depreciating andappreciating countries were required to intervenewhen a currency hit one of the margins. Countrieswere also allowed, but not required, to undertakeintramarginal intervention. The indicatorof divergences, which measured each currency’saverage deviation from the central parity, wasdevised as a signal for the monetary authorities totake policy actions to strengthen or weaken theircurrencies. It was supposed to work symmetrically.Intervention and adjustment was to be financedunder a complicated set of arrangements. Thesearrangements were designed to overcome theweaknesses of the IMF during Bretton Woods. Thevery short-term financing facility (VSTF) was toprovide credibility to the bilateral parties byensuring unlimited financing for marginal intervention.It provided automatic unlimited lines ofcredit from the creditor to the debtor members.The short-term monetary support (STMS) wasdesigned to provide short-term finance for temporarybalance of payments disequilibrium. Themedium-term financial assistance (MTFA) wouldprovide longer-term support.Unlike Bretton Woods, where members (otherthan the United States) could effectively decide tounilaterally alter their parities, changes in centralparities were to be decided collectively. Finally,like Bretton Woods, members could (and did)impose capital controls.Source: Michael D. Bordo, ‘‘The Gold Standard, BrettonWoods and Other Monetary Regimes: A Historical Appraisal,’’Review, Federal Reserve Bank of St. Louis, March/April 1993, p. 180.Britain and Italy to raise interest rates if they were tokeep their exchange rates within the EMS limits.Speculators doubted they would do this, and soldBritish pounds and Italian lire hoping to gain fromeventual devaluation. Germany refused to make anymajor concession by lowering interest rates, eventuallyforcing Britain and Italy to withdraw from theEMS in September 1992.The European currency crisis of 1992 wasmatched in the following summer by a run onthe French franc that eventually brought about acollapse of the EMS in August 1993. Only Germanyand Holland decided to keep their currencies& 498closely linked. The others agreed to a 15 percentdeviation either side of EMS agreed par values.With a 30-percent range of variation, in effect theEMS fixed-rate era was over. Nevertheless, theEuropean Community ministers continued to clingto the Maastricht Agreement which committedthe Community members to a common currency.A common currency would mean truly fixedrates, because with all European member countriesusing the same currency, exchange rates couldnever change. Also, as we shall see, all countriessharing the common currency would have acommon monetary policy.
ALTERNATIVE SYSTEMS OF EXCHANGE RATESPrice adjustment under the EMSOur explanation of the price-level adjustmentmechanism of the gold-exchange and Bretton Woodssystem applies also to the EMS, with the one majordifference that with the EMS, both countries’ moneysupplies were influenced by official intervention. Forexample, if the Belgian franc was at its lower supportpoint versus the Deutschemark, the Belgian moneysupply declined and the German money supplyincreased. Ceteris paribus, this reduced the Belgianprice level and increased the German price level.This improved Belgium’s trade in comparison withGermany’s because of the lowering of Belgian versusGerman prices. Because prices in both countriescontributed to the automatic adjustment, rather thanone country as with the Bretton Woods system, theEMS price-adjustment mechanism was in principlerelatively more effective. Furthermore, the requirementthat both countries intervene helped overcomethe problem of asymmetric needs for adjustment, aproblem that detrimentally affected the functioningof Bretton Woods.The EMS did allow for realignment of centralvalues of the parity grid, and indeed there wereseveral realignments. Forecasting when realignmentwould occur was made difficult by thecooperation built into the EMS in terms of jointforeign exchange market intervention, intercountryshort-term lending, and loans from the EMCF.Nevertheless, as with the gold-exchange and dollarstandards, it became evident to speculators when acurrency urgently needed to be realigned, not leastbecause of the currency’s value vis-à-vis the ECU.This meant that speculators could guess which waythe realignment would go. Indeed, as we haveexplained, pressure from speculators eventuallyhelped bring about the collapse of the EMS.HYBRID SYSTEMS OF EXCHANGERATESFixed and flexible exchange rates are only twoalternatives defining the extremes of exchange-ratesystems. In between these extremes are a numberof other systems which have been practiced atvarious times.Dirty floatCentral banks sometimes intervene in the foreignexchange markets even when they have declaredthat exchange rates are flexible. For example,Canada, which practiced floating exchange ratesthroughout the 1950s and has floated its currencysince 1970, frequently intervenes (via the Bankof Canada) to ‘‘maintain order’’ in the foreignexchange markets. The Canadian central bank’spolicy is to try to prevent sharp changes in itsexchange rate, but to allow market forces tooperate over the long run. The purpose of thispolicy is to reduce short-run exchange-rate uncertainty,but to nevertheless allow the exchange rateto reflect differential rates of inflation and otherfundamental forces over the long run. The Bankof Canada combines foreign exchange marketintervention with interest-rate policy to stabilizeCanada’s exchange rate. This model of a so-calledmanaged float or dirty float is a compromisebetween fixed and flexible exchange rates, and hasbeen adopted by numerous countries at some timeor other. Examples include Mexico, Singapore,Japan, Sweden, and Australia. 11Wider bandAnother compromise between fixed and flexibleexchange rates was tried for a very short whileafter December 1971, when the <strong>International</strong>Monetary Fund members decided at a meeting at theSmithsonian Institution in Washington, DC, toallow the range of fluctuation of exchange rates to be2 1 4percent on either side of the official value. Thisgave a 4 1 2-percent total range of variation before thecentral bank would intervene, compared with the11 Those who favor exchange rate flexibility and who thinkintervention of any kind is a bad idea call it a dirtyfloat. Those who think it is a good idea tend to call ita managed float.499 &
THE INTERNATIONAL MACROECONOMIC ENVIRONMENT2-percent range that existed from 1944 to 1971.The intention was to reduce the uncertainty aboutfuture exchange rates and at the same time allowmore adjustment. The wider the band, the closer thesystem came to being a flexible-rate system.The wider band was not tried by many of themajor countries. Canada had opted for a floatingrate before the Smithsonian meeting, and Britainand the other major European countries floatedtheir currencies (some of which remained fixed toeach other) shortly afterwards. 12Crawling pegThe crawling peg is an automatic system forrevising the par or central value – the value aroundwhich the rate can fluctuate. This system can becombined with a wider band. The crawling pegrequires the central bank to intervene whenever theexchange rate approaches a support point. However,the central value, around which the support pointsare set, is periodically revised according to theaverage exchange rate over the previous weeks ormonths, or perhaps according to inflation vis-à-vis ananchor currency. If the rate tends to remain at ornear, for example, the lower support point, the newcentral value will be revised downwards. In this waythe rate can drift up or down gradually, giving somedegree of certainty without completely frustratinglong-term fundamental trends.Figure 22.3 illustrates a crawling peg. Starting attime t 0 , intervention points are defined which areabove and below a middle or par exchange rate. Theintervention points are shown by parallel lines. Ifthe actual exchange rate hovers at the lower end ofits allowed range, then at the next setting of theintervention points the middle value is set at theaverage actual value during the previous period. Ifthe actual exchange rate moves to the lower end ofthe new allowable trading range, the interventionpoints are again lowered at the next setting of thesepoints. In this way the exchange rate can drift12 For more on the wider band see John Williamson,‘‘Surveys in Applied Economics: <strong>International</strong> Liquidity,’’Economic Journal, September 1973, pp. 685–746.& 500Exchange ratet 0& Figure 22.3 Crawling pegt 1according to fundamental forces such as inflationrates and terms of trade, but importers andexporters can be reasonably sure about exchangerates applying to short-term foreign-currencyreceivables and payables.An alternative way of readjusting the band withinwhich a currency can trade is according to therecent rate of inflation. For example, the centralvalue of the band vis-à-vis the US dollar could bechanged by the country’sinflation rate minus the USinflation rate. This keeps exchange rates movingdirectly according to economic fundamentals overlong periods of time, but keeps them predictable inthe short term. A crawling peg can also be based onbalance-of-trade statistics or changes in the size ofexternal debt. Most examples of crawling pegs haveinvolved countries experiencing very rapid inflation.Several South American countries have atsome time tried a crawling peg.Mixed fixed and flexible ratesAnother compromise between fixed and flexibleexchange rates that has been tried is to have fixedexchange rates for some transactions, such as thoset 2t 3TimeNotesUnder a crawling-peg system, the support points areperiodically revised according to a formula typically basedon economic fundamentals such as inflation differentials, oraccording to past behavior of the exchange rate within itspermissible band.
ALTERNATIVE SYSTEMS OF EXCHANGE RATESon the current account of the balance of payments,but to have flexible rates for other transactions, suchas those on the capital account. This division ofsystems would be motivated by a desire not to exertinfluence over international trade, but to maintaincontrol over capital flows. Such a dual exchangeratesystem was practiced by Belgium, which hada commercial exchange rate for imports and exportsof goods and services, and a financial exchangerate for trading in financial assets. The commercialexchange rate was fixed, and the financial exchangerate was flexible. Only authorized banks werepermitted to trade in the commercial market, whilethe financial market was open to all participants.The two tiers of the foreign exchange market wereseparated by a prohibition on buying foreignexchange in one market and selling it in the other.Britain operated with two exchange rates formore than a quarter century while functioningunder the Exchange Control Act of 1947. This actwas designed to restrict capital outflows andrequired those making foreign investments to buyforeign currency from a currency pool. Funds inthe pool came only from sales of securities tradingin a currency or from occasional authorized additions.As a result the size of the pool of each currencywas determined by the value of investmentswhen the pool was established, subsequent realizedgains on the value of investments, and specialauthorized additions. Exchange rates for investmentfunds from the pool were flexible and traded ata premium over exchange rates for noninvestmenttransactions. The exchange rates for other transactionswere fixed over most of the years the currencypoolsystem was in effect.Numerous other mixed exchange-rate systemshave been tried, such as different exchange rates forimports versus exports, different exchange rates fordifferent categories of imports, and so on, but theseother systems are combinations of different fixedrates, not mixtures of fixed and flexible rates. Thoseinterested in the other types of arrangements canconsult the Annual Report on Exchange Arrangementsand Restrictions, published by the <strong>International</strong>Monetary Fund.Cooperative intervention indisorderly marketsAfter a period of considerable volatility in exchangerates, involving a substantial appreciation of theUS dollar from its 1980 level and an equally sharpfall after 1985, a new compromise exchange-ratesystem was agreed to at an economic summitheld in Paris at the Louvre Museum in 1987. Thisagreement, which became known as the LouvreAccord, represented a shift from a completelyflexible exchange-rate system to a dirty float in whichthe leading industrial powers would cooperate.The Louvre Accord followed the PlazaAgreement of 1985 – named after the Plaza Hotelin New York where it was worked out – in whichthe United States accepted the need to intervene inthe foreign exchange markets during unstable times.The other leading industrial powers had recognizedthis need somewhat earlier, but knew that interventionwould not work without close cooperation,given the very large size of private speculative capitalflows. The Plaza Agreement was later confirmed atthe 1986 Tokyo economic summit and reconfirmedat other economic summits, most notably the1987 meeting in Paris that resulted in the LouvreAccord. These meetings took place against a backgroundof immense exchange-rate instability, andresulted in a new compromise between completelyflexible and completely fixed exchange rates. Themeetings up to and including the 1986 Tokyo summitinvolved the United States, Japan, UnitedKingdom, West Germany, and France – the socalledGroup of Five, or G-5. Subsequent meetingswere expanded to include Canada – the US’s largesttrading partner – and Italy, and became known as theG-7 summits. Even more recently Russia has hadobserver status. The system that has emerged is notunlike Canada’s approach of flexibility with interventionto achieve orderly markets, but because itinvolves cooperation, it is a little different from theCanadian dirty float.The international financial system that emergedfrom the Louvre Accord can be characterizedas a floating-exchange-rate system within target501 &
THE INTERNATIONAL MACROECONOMIC ENVIRONMENTzones that are periodically revised, but where theintervention levels are not precisely specified. Theacceptable ranges of fluctuation have to be deducedfrom official communiqués released after summitmeetings, or from statements by senior officials of thenations involved. For example, it might be stated aftera G-7 meeting that the leaders are satisfied withexchange rates in their recent trading range. Alternatively,after a substantial movement of exchangerates, the governor of a central bank or a treasuryofficial might say she believes the dollar is too low ortoo high, and that if the markets do not adjust therecould be intervention. Market participants react tothese statements according to how credible theybelieve them to be, and, for example, buy currenciesthe authorities say are too cheap. This can help reducethe need for intervention and has been described as‘‘talking’’ exchange rates in the desired direction.TARGET ZONESThe fixed exchange rate and compromise systemsthat have been described in this chapter can becharacterized as involving, at least in part, a targetzone for the exchange rate. For example, the zonein the gold-exchange standard was a 2-percent bandaround parity, in the EMS it was a 4 1 2percent band,and so on. Having a credible target zone, which isone that private foreign exchange market participantsbelieve is a government commitment, canhelp keep exchange rates within the declared zone –not at the outer limits – even if governments neveractually intervene in the markets. Indeed, even ifthere is a less-than-total commitment to a declaredtarget zone, the presence of the zone can be selfrealizing.These conclusions have been reached inresearch by Paul Krugman. 1313 See Paul R. Krugman, ‘‘Target Zones and Exchange RateDynamics,’’ Quarterly Journal of Economics, August 1991,pp. 669–82, and the papers in Paul R. Krugman andMarcus Miller (eds), Exchange Rate Targets and CurrencyBands, Cambridge University Press, New York, 1992. For asurvey of target-band research, see Lars E.O. Svensson, ‘‘AnInterpretation of Recent Research on Exchange Rate TargetZones,’’ Journal of Economic Perspectives, Fall 1992, pp. 119–44.& 502The stabilizing role of target zones can bedescribed with the help of Figure 22.4. The actualexchange rate, taken as S($/£), is shown on thevertical axis, while economic fundamentals affectingexchange rates are shown on the horizontal axis.Krugman assumed the fundamentals to consist offactors outside the control of government whichevolve randomly, plus a factor – Krugman uses themoney supply – that is under government control.Indeed, Krugman assumed that by appropriateadjustments of the money supply the governmentcould counter any realization of the random factors,keeping the combined effects of the fundamentals –random factors plus money supply – such that theexchange rate would remain within the target zone.Krugman further assumed that the money supply ischanged only if the exchange rate is at the ceilingor floor of the target zone, and not in between. Thatis, exchange rate intervention occurs only at themargins, with the money supply increasing at theceiling, declining at the floor, and otherwise beingconstant. (An increase in money supply would causehigher inflation or lower interest rates pushingthe currency down, while a decrease would achievereduced inflation or higher interest rates pushingthe currency up.)The line showing the combined effect of thefundamentals on S($/£) is the straight upwardslopingbroken line in Figure 22.4. However, itis assumed that by adjusting the money supply asnecessary at the margins – the target zone ceilingand floor – so that the combined fundamentals arewithin the limits F L and F U , the exchange rate can bekept within the target zone S L to S U .Krugman realized that as well as fundamentals,a further factor affecting current exchange ratesthrough the actions of speculators is expectationsabout changes in exchange rates in the future. Thatis, actual current exchange rates depend on currentfundamentals plus speculators’ exchange rateexpectations. Expectations of changes in the futureexchange rate depend on how close the currentexchange rate is to the intervention levels. Specifically,the closer the exchange rate is to the upperlevel, S U , the more likely is intervention, in this case
ALTERNATIVE SYSTEMS OF EXCHANGE RATESExchange rate, S($/£)S UTarget ceilingTF LF UFundamentalsTTarget floorS L& Figure 22.4 Target zones for exchange ratesNotesThe horizontal axis measures fundamentals, which consist of random uncontrolled factors, and the money supply, which ischanged only at the target-zone edges to keep exchange rates within the zone. Exchange rates depend on fundamentals plusexpectations about the future exchange rate. To the right of the midpoint along the horizontal axis there is expected pounddepreciation – the probability of S($/£) being pushed down is higher than the probability of S($/£) increasing – and to the leftof the midpoint there is expected pound appreciation. The combined effect of fundamentals and expectations is curve TT. This istangential to the lines at the zone edges, implying no effect of fundamentals on exchange rates at the edges of target zones.consisting of the Bank of England increasing themoney supply to keep the pound from exceedingS U . Similarly, the closer is S($/£) to S L , the morelikely is a reduction in the British money supply tokeep S($/£) from moving below S L . This means thatas the exchange rate approaches S U the probabilityof action to depreciate the pound makes the probabilityof depreciation exceed the probability offurther appreciation. Therefore, there is an expecteddepreciation, where we use the term ‘‘expected’’in the statistical sense: the probability-weightedoutcomes that constitute the expected change inexchange rate are tilted toward an expected depreciation.As the exchange rate moves closer to S L thereverse occurs, with the probability of official actionto cause appreciation of the pound being relativelyhigh. That is, to the right of the mid point on thehorizontal axis of Figure 22.4 there is expecteddepreciation of the pound in the statistical sense,and along the left there is expected appreciation.Furthermore, the more we are to the right or left,the greater is the expected pound depreciation orexpected pound appreciation.Recall that the actual exchange rate is the resultof fundamentals plus exchange-rate expectations,where the latter is due to the actions of speculators.While within the target zone the fundamentals followrandom patterns – intervention via moneysupply occurs only at the intervention points – theother component of exchange rate determination,the expectation of change in the exchange rate,pushes the rate to within the target zone. In termsof Figure 22.4, the effect of the combined fundamentalson their own (including the money supply)is for the exchange rate to follow the upwardslopingdashed line until the ceiling or floor isreached, and then to follow the horizontal lines atthe ceiling or floor as the official intervention occurs.However, the other element of exchange-ratedetermination, namely the actions of speculatorsbased on their expectations about exchange rates,works toward lowering current exchange rates to503 &
THE INTERNATIONAL MACROECONOMIC ENVIRONMENTthe right of the vertical axis in Figure 22.4, and toraising exchange rates to the left of the vertical axis.(Speculators sell pounds when their value is high,and buy when their value is low.) The aggregateeffect of the two forces working together –the fundamentals and speculators – is the elongatedS-shaped curve, TT. This curve is always flatter thanthe dashed line, and makes it clear that via speculatorsacting according to the prospect of intervention,the exchange rate follows a path within thetarget zone, even if the possible intervention doesnot occur. In some sense, stability is achievedwithout the government doing anything, other thanpromising to intervene if necessary.There is a further conclusion to Krugman’smodel in addition to the ‘‘free stabilizing’’ conclusionwe have just reached: it is free because ithappens even when the government does nothing.The second conclusion is that at the edges of thetarget zone the exchange rate is insensitive to therandom fundamentals. This conclusion follows byfirst noting that at the target zone edges theexpected values on the horizontal axis whichinclude the random fluctuations and the actions ofthe government are not continuous and random,but rather take ‘‘jumps.’’ Specifically, at themoment the upper edge S U is reached there is anupward jump in money supply, causing an expectednegative change along the horizontal axis: the totalfundamentals include the money supply. Similarly,the very moment S L is reached there is a downwardjump in the money supply, causing an expectedpositive change along the horizontal axis. Whileexpected fundamentals themselves jump at theedges of the zone, the expected exchange ratecannot have jumps or there would be profitopportunities; jumps would allow one-wayexchange-rate bets. It follows that if expectations offundamentals jump at the target zone edges, butthere is no corresponding jump in exchange rates atthe target zone edges, then at the edges the fundamentalscannot be affecting exchange rates. Thismeans that TT is horizontal and tangent to the targetzone edges S L and S U ; with TT horizontal, changesin the fundamentals have no effect on S($/£).The preceding assumes that intervention alwaysoccurs at the target zone edges. While relaxation ofthe assumption that intervention always occurs doesaffect the preceding conclusions, there is still somestabilizing of exchange rates, even if interventionoccurs only sometimes. 14In this account of the many possible compromisesbetween truly fixed and truly flexibleexchange rates and the way they work, we havegiven a rather patchy history of internationalfinance. In order to provide a more systematicoverview, in the next chapter we present achronology of international financial developmentsduring the twentieth century. This chronologyhas been deferred so that we would beequipped with an understanding of the systemsand events we describe. Our chronology shouldserve to give a historical perspective on theinternational financial system, and demonstratethat the international financial system is not static,but something that continues to evolve. Possibledirections of this evolution are also sketched inChapter 23.SUMMARY1 A gold standard involves the settlement of international transactions in gold and theopen offer to exchange domestic paper money for gold at a fixed official price. Adeficit means an outflow of gold. The reduction in gold reserves reduces the localmoney supply and puts downward pressure on prices in the deficit country. The fall14 See Krugman and Miller, op. cit.& 504
ALTERNATIVE SYSTEMS OF EXCHANGE RATESin prices stimulates exports and lowers imports. In the surplus countries, the moneysupplies increase, raising prices in these countries. This causes a further reduction ofrelative prices in the deficit country. In addition, changes in relative prices of tradedversus nontraded goods and services within each country help eliminate a deficit orsurplus.2 The price-specie adjustment mechanism can be frustrated by a neutralization policy. Thispolicy severs the link between gold flows and money supplies, so that the automaticadjustmentmechanism is unable to function.3 Critics of the gold standard argue that prices in surplus and deficit countries showedparallel movement rather than the reverse movement implied by the gold standard.Downward price rigidity could be responsible. However, an adjustment of relative priceswill still occur if prices go up by more in surplus countries than in deficit countries.Another criticism of the gold standard is that governments did not allow it to work. This isas much a criticism of government as of the gold standard.4 The gold-exchange standard required the US to fix its exchange rate to gold, and othercountries to fix to gold or to the US dollar. This system operated from 1944 to 1968.From 1968 to 1973, the US dollar was not fixed to gold, but most other currencies werestill fixed to the dollar. This was called a dollar standard. The entire period from 1944 to1973 is the Bretton Woods era.5 To maintain the fixed exchange rate in terms of the dollar, central banks must purchaseor sell their local currency at the support points on either side of the parity value. Ifthe free-market exchange rate would be above the upper support point, the central bankmust sell its currency and purchase dollars. This raises official reserves and means asurplus in the balance of payments. It also raises the supply of money. At the lowersupport point, the central bank must purchase its currency with dollars, which reducesofficial reserves and results in a deficit in the balance of payments. It also lowers themoney supply. Therefore, under fixed exchange rates, surpluses raise money supplies anddeficits lower money supplies.6 Because deficit countries which run out of foreign exchange reserves are eventuallyforced to devalue, it is possible to identify which currencies face devaluation. The need torevalue is less urgent than the need to devalue, making the timing of forecasts ofrevaluations more difficult than devaluations.7 The European Monetary System (EMS) was a fixed-exchange-rate system in whichcountries cooperated to maintain exchange rates. Exchange rates were fixed within limitsset by a parity grid, which involved an upper and lower point for each exchange rate.Exchange rates were also maintained within limits vis-à-vis the European Currency Unit,ECU. This helped identify which country was at fault for any difficulties in maintainingexchange rates. With both deficit and surplus countries being supposed to intervene underthe EMS, it was intended that the burden of adjustment would be shared.8 Alternatives to fixed-rate systems and flexible-rate systems include a fixed rate with awide band, a crawling peg, fixed rates for some transactions and flexible rates for others,and a dirty float with intervention to maintain orderly markets. These combine attributesof both fixed-rate systems and flexible-rate systems.9 The credible announcement of target zones helps to keep exchange rates within the zones.10 At the edges of target zones, fundamentals have no effect on exchange rates.505 &
THE INTERNATIONAL MACROECONOMIC ENVIRONMENTREVIEW QUESTIONS1 What is the essential feature of the gold standard concerning the exchange of papermoney into gold?2 What are the ‘‘gold points?’’3 What does the price-specie automatic-adjustment mechanism assume about theconnection between the gold reserves of a country and that country’s trade balance?4 What does the price-specie adjustment mechanism assume about the connection betweenthe trade balance and a country’s money supply?5 How are the money supply and prices linked according to the price-specie adjustmentmechanism?6 What is sterilization or neutralization policy in the context of the functioning of the goldstandard?7 What is meant by support points in the Bretton Woods system?8 What is the difference between the dollar standard and the gold-exchange standard?9 If a country increases its official price of gold, ceteris paribus, does that constitutea devaluation or revaluation of its currency?10 Why might speculation be profitable in a gold-standard system?11 What is a central-bank swap?12 What exchange-rate system evolved from the snake?13 What is the European Currency Unit?14 To what type of exchange-rate system did the Maastricht Agreement commitparticipating European Community member countries?15 What is a dirty float?16 What is a crawling peg?17 What was the Louvre Accord?18 According to target zone research, does the establishment of a target zone for exchangerates increase or decrease the range within which exchange rates typically fluctuate?ASSIGNMENT PROBLEMS1 Assume the following gold prices have been declared by the central banks:a Bank of England £300b Federal Reserve System $475c European Central Bank d500d Reserve Bank of Australia A$700e Bank of Canada C$600.Calculate all possible exchange rates between the currencies.2 What assumptions have you made in Question 1?3 How can government objectives such as the maintenance of full employment hinder thefunctioning of the gold standard?& 506
ALTERNATIVE SYSTEMS OF EXCHANGE RATES4 Why might historical patterns of prices show parallel movements between deficit andsurplus countries? Could gold discoveries and common movements in national incomescause this?5 Use Figure 22.2 to show the effect of a fall in demand for British goods in terms of(a) the balance of payments measured in terms of pounds and (b) the balance ofpayments measured in terms of US dollars. Show also the movements of curves that thedeficit and associated contraction in the money supply will create in restoringequilibrium.6 Why can speculators make profits with less risk under fixed rates? From whom do theymake their profits?7 Why do we observe deficits or surpluses under ‘‘flexible’’ rates? Does this tell ussomething of the management of the rates?8 Do you think that the collapse of the Bretton Woods system would have been lesslikely had surplus countries expanded their economies to ease the burden ofadjustment on the countries with deficits?9 Why have central bankers frequently intervened in the foreign exchange market undera system of flexible exchange rates? If they have managed to smooth out fluctuations,have they made profits for their citizens?10 Does a crawling peg system lend itself to profitable speculation?BIBLIOGRAPHYBarro,RobertJ.,‘‘MoneyandthePriceLevelUndertheGoldStandard,’’ Economic Journal,March1979,pp.13–33.Belongia, Michael T., ‘‘Prospects for <strong>International</strong> Policy Coordination: Some Lessons for the EMS,’’ Review,Federal Reserve Bank of St. Louis, July/August 1988, pp. 19–27.Bordo, Michael D., ‘‘The Gold Standard, Bretton Woods, and Other Monetary Regimes: A Historical Appraisal,’’Review, Federal Reserve Bank of St. Louis, March/April 1993, pp. 123–87.Dornbusch, Rudiger, Open Economy Macroeconomics, 2nd edn, Basic Books, New York, 1988.Harberler, Gottfried,Money in the <strong>International</strong> Economy, Harvard University Press, Cambridge, MA, 1965.Hume, David, ‘‘Of the Balance of Trade,’’ in Essays on Money, Political Discourses, London, 1752.Krugman, Paul R. and Marcus Miller (eds), Exchange Rate Targets and Currency Bands, Cambridge UniversityPress, New York, 1992.Meltzer, Allan H., ‘‘U.S. Policy in the Bretton Woods Era,’’ Review, Federal Reserve Bank of St. Louis, May/June1991, pp. 54–83.Mills, Terence C. and Geoffrey E. Wood, ‘‘Does the Exchange Rate Regime Affect the Economy,’’ Review, FederalReserve Bank of St. Louis, July/August 1993, pp. 3–20.Rockoff, Hugh, ‘‘Some Evidence on the Real Price of Gold, its Costs of Production, and Commodity Prices,’’ inMichael D. Bordo and Anna J. Schwartz, (eds), A Retrospective on the Classical Gold Standard, 1821–1931,University of Chicago Press, Chicago, IL, 1984, pp. 613–44.——, ‘‘The Wizard of Oz as a Monetary Allegory,’’ Journal of Political Economy, August 1990, pp. 739–60.Solomon, Robert, The <strong>International</strong> Monetary System, 1945–81, Harper & Row, New York, 1982.Svensson, Lars E.O., ‘‘An Interpretation of Recent Research on Exchange Rate Target Zones,’’ Journal ofEconomic Perspectives, Fall 1992, pp. 119–44.507 &
THE INTERNATIONAL MACROECONOMIC ENVIRONMENTAPPENDIX AOther fixed-exchange-rate automatic-adjustment mechanismsNational incomeThe price-level adjustment mechanism requires flexibility of prices in order to operate. The macroeconomicrevolution marked by the publication of The General Theory of Employment, Interest and Money by John MaynardKeynes, while focusing on a closed economy, spilled over into international finance and introduced an alternativeadjustment mechanism that works if price flexibility does not exist. 15 This mechanism, popularized by the followersof Keynes, involves automatic adjustment via changes in national income. Like the price-level adjustmentmechanism, the Keynesian income adjustment mechanism operates on the current account. The most straightforwardway of describing Keynesian adjustment is to employ a Keynesian income-expenditure model and show howvariations in national income work to correct incipient balance-of-payments surpluses and deficits.A straightforward model which will reveal the important features of income adjustment consists of the followingequations:Y C þ I 0 þðEx 0 ImÞ ð22A:1ÞC ¼ C 0 þ cYIm ¼ Im 0 þ mYð22A:2Þð22A:3ÞIn these equations, Y is the national income, or GDP, C is aggregate consumption of goods and services, I 0 is thegiven amount of aggregate investment or capital formation, Ex 0 is the given amount of exports, and Im is imports.The national-income accounting identity is given by equation (22A.1), where, because it is not relevant for ourpurposes, we have omitted government spending. The GDP, Y, is the total value of domestically produced goods andservices. Because it is difficult for government statisticians to separate consumption and investment of domesticgoods from consumption and investment of imported goods, especially when domestic goods have imported components,C and I refer to the total consumption and investment of goods and services. That is, C and I includeimported products as well as domestically produced products. In addition, exports, Ex 0 , include re-exports, that is,items from abroad that are resold after reprocessing or are used as inputs in exported products. Because Y refers todomestic production only, as the relevant output/income of a nation, and because C, I 0 , and Ex 0 include imports, wemust subtract imports, Im, to ensure the national income accounting identity (22A.1). This is the most convenientapproach from the viewpoint of a national-income statistician, because records of imports exist with customsagents, and records of consumption and investment reveal total amounts and do not show imported componentsseparated from domestic components.Equation (22A.2) is the consumption function. The intercept, C 0 , is the part of consumption that does notdepend on income. The effect of national income on consumption is given by the marginal propensity to consume,c, which will be between zero and unity. Since C represents all consumption, it includes imports (Im), where theimport equation itself is equation (22A.3). We assume that investment and exports are exogenous, or at leastexogenous in relation to national income in the economy we are examining.In order to discover how automatic adjustment via national income works, we can begin with an intuitiveexplanation. Suppose the balance of payments is initially in balance and that there is an exogenous increase in15 John Maynard Keynes, The General Theory of Employment, Interest and Money, Macmillan, London, 1936.& 508
ALTERNATIVE SYSTEMS OF EXCHANGE RATESexports, Ex. This means an increase in national income via equation (22A.1), which itself indirectly furtherincreases income via the extra induced consumption in equation (22A.2). The higher national income will increaseimports via equation (22A.3). We find that the initial increase in exports that moved the balance of payments intosurplus will induce an increase in imports, which will tend to offset the effect of exports on the balance of trade. Thisis an automatic adjustment working via income. It is not apparent from our intuitive explanation that thisadjustment, while tending to restore balance, will not be complete. We can see this by employing our model.If we substitute equations (22A.2) and (22A.3) into the national-income accounting identity, equation (22A.1),we obtainY ¼ C 0 þ cY þ I 0 þ Ex 0 Im 0 mY ð22A:4ÞBy gathering terms, we can write Y as a function of exogenous termsY ¼11 c þ m ðC 0 þ I 0 þ Ex 0 Im 0 Þ ð22A:5ÞThe factor 1/(1 c þ m) is the multiplier. We can note that the larger the marginal propensity to import, m, thesmaller will be the multiplier. The multiplier depends on the leakages from the circular flow of income, and byhaving imports, we add a leakage abroad, m, to the leakage into savings given by the marginal propensity to save,(1 c). The more leakages we have, the smaller the increase in income from any exogenous shock.Let us allow exports to increase exogenously from Ex 0 to Ex 0 þ DEx and the corresponding increase in GDP tobe from Y to (Y þ DY). We can therefore writeY þ DY ¼11 c þ m ðC 0 þ I 0 þ Ex 0 þ DEx Im 0 Þ ð22A:6ÞSubtracting each side of equation (22A.5) from equation (22A.6), we haveDY ¼1DEx ð22A:7Þ1 c þ mThe value of DY in equation (22A.7) gives the effect on national income of an exogenous change in exports. To findthe induced effect on imports of this change in national income, we can use DY from equation (22A.7) in the importequation (22A.3). Putting equation (22A.3) in terms of the new level of imports, Im þ DIm, after an increase inincome to Y þ DY, we haveIm þ DIm ¼ Im 0 þ mðY þ DYÞð22A:8ÞSubtracting equation (22A.3) from equation (22A.8) on both sides givesDIm ¼ mDYð22A:9Þand substituting DY from equation (22A.7) in equation (22A.9) givesDIm ¼mDEx ð22A:10Þ1 c þ mEquation (22A.10) tells us that the automatic adjustment working via national income will raise imports bym/(1 c þ m) times the initial increase in exports. The value of m/(1 c þ m) is, however, below unity. This followsbecause the marginal propensity to consume, c, is below unity, that is, c < 1, so that (1 c) > o. We hence havem divided by itself plus the positive number (1 c). When a number is divided by a total larger than itself, the resultis below unity. For example, if c ¼ 0.8 and m ¼ 0.2, imports will increase by only half of any exogenous increase inexports. If c ¼ 0.4 and m ¼ 0.2, the offset is only a quarter. What we have is an adjustment process via national509 &
THE INTERNATIONAL MACROECONOMIC ENVIRONMENTincome that is not complete. While an exogenous change in exports will change imports in the same direction,imports will change by less than the initial change in exports, and so initial effects persist.Income and income adjustment are relevant to the financial manager who is trying to forecast movements inexchange rates. If a country’s national income is growing more rapidly than that of others as a result of growth inexports, then the country’s foreign exchange reserves will increase, and eventually the currency will probablyincrease in value. Induced increases in imports resulting from export growth will only partially dampen the growthof reserves and the need to eventually revalue the currency. When a nation’s income is growing from a growth inconsumption (C 0 ), then foreign exchange reserves will shrink, and eventually the foreign exchange value of thecurrency will have to be reduced. The growth in income will raise imports but not exports, since exports aredetermined by the incomes of other nations.There is an additional force, also working via changes in national income, which will help complete theautomatic-adjustment process. This force is induced changes in the money supply, which in turn affects interestrates, the rate of investment, national income, and imports. The process works as follows. If we start in balance andan exogenous increase in exports does not induce a sufficient rise in imports to offset the increase in exports, a tradesurplus will remain. Ceteris paribus, under fixed exchange rates this will require the central bank to supply itscurrency to prevent its exchange rate from appreciating. This means an increase in the money supply. A moneysupplyincrease tends to lower the interest rates. Lower interest rates stimulate investment, I, which will in turn bothdirectly and indirectly work towards raising the national income, Y. Higher income will raise imports, Im, viaequation (22A.3) and thereby help close the trade imbalance.The force that we have just described involves a lowering of interest rates working via capital investment, income,imports, and the current account. In addition, interest rates have an effect on capital flows and the capital account.Interest ratesThe automatic interest-rate adjustment mechanism relies on the effect of the balance of payments on the moneysupply. We have seen that if the effects are not sterilized, a balance-of-payments deficit will reduce the moneysupply and a surplus will increase it. With a gold standard this occurs because a deficit means a gold outflow and ashrinking money supply, and a surplus means a gold inflow and an increasing money supply. In the gold-exchangeand dollar standards, and in the EMS, the money supply also declines after deficits and increases after surpluses. Inthese cases the money supply changes because of intervention in the foreign exchange market. A deficit requires thelocal monetary authority to purchase its currency to keep the value up. Thus, money is withdrawn from circulation.Similarly, a surplus requires the central bank to sell its currency and hence increase the money supply. With thiswe can explain the interest-rate adjustment mechanism which works via the capital account.The interest-rate adjustment mechanism via the capital account involves the following. If a deficit occurs, it willreduce the money supply and raise the interest rate. 16 The deficit means surpluses elsewhere; therefore, the moneysupplies of other countries will be rising, which will reduce their interest rates. For both reasons there is a rise ininterest differentials in favor of the deficit country. This will make investment (in securities, and so on) in thatcountry appear relatively more attractive. The resultant inflows on the capital account should improve the balanceof payments, thereby correcting the original deficit.Because capital flows are highly responsive to interest-rate differentials when capital can flow withoutrestriction, the interest-rate adjustment mechanism working via the capital account is likely to be the most effective16 The interest rate will not increase as a result of a reduction in the money supply if there is a liquidity trap, which occurs if thedemand for money is perfectly elastic. If they have ever existed, liquidity traps are probably limited to serious recessions andwill not hinder the interest-rate adjustment process in normal times.& 510
ALTERNATIVE SYSTEMS OF EXCHANGE RATESmechanism in the short run. However, it is necessary that adjustment eventually occur via prices or national incomeand the current account. This is because capital inflows must be serviced. That is, there will be payments of interestwhich will appear as a debit in the invisibles part of the current account as income imports. This means that in thefuture, the current-account deficit will increase.APPENDIX BGold pointsGold points are the extreme values between which the exchange rate can vary in a gold-standard world. Thewidth of the zone defined by the extreme values within which exchange rates can vary is determined by the cost ofexchanging currencies in the foreign exchange market and the cost of shipping gold between central banks. The goldpoints arising from the gold standard allowed exchange rates to vary within a zone of approximately 1 or 2 percentof the middle value. This idea of a zone was carried into the Bretton Woods system and the European MonetarySystem. We hence obtain a historical perspective by a study of gold-point determination.Suppose that the US Federal Reserve and the Bank of England both offer to exchange their paper money for goldat fixed prices. Let us define these prices as follows.PGUSPGUSPGUKPGUKðaskÞ ¼Federal Reserve selling price of gold, in dollarsðbidÞ ¼Federal Reserve buying price of gold, in dollarsðaskÞ ¼Bank of England selling price of gold, in poundsðbidÞ ¼Bank of England buying price of gold, in poundsLet us also define c G as the cost of shipping gold between the United States and the United Kingdom. We can think ofc G as the fraction of the total value of gold shipped between the United States and the United Kingdom that is paidfor shipping the gold. For example, c G ¼ 0.01 if shipping costs are 1 percent of the value of the cargo. Finally, letus define the bid and ask exchange rates as in the text, namelyS($/bid£) is the number of dollars received from the sale of pounds in the foreign exchange market, andS($/ask£) is the number of dollars required to buy pounds in the foreign exchange market.Consider first a person wanting to buy dollars with pounds. For each pound, that person will receive S($/bid£)dollars in the foreign exchange market. Alternatively, he or she can use their pounds to buy gold from the Bank ofEngland, ship the gold to the United States, and sell it to the Federal Reserve for dollars. The number of dollarsreceived per pound this way is calculated as follows.Each pound buys 1/PGUK (ask) oz. of gold from the Bank of England. Shipping this to the United States involvesa cost of c G /oz. so that after shipping1PGUK ð1c G Þ oz:arrive in the United States. This can be sold to the Federal Reserve for$ PUS GðbidÞPG UKðaskÞð1 c GÞ ð22B:1Þ511 &
THE INTERNATIONAL MACROECONOMIC ENVIRONMENTThe value in equation (22B.1) is the number of dollars received for one pound via buying, shipping, and sellinggold. Since we are going from pounds to dollars and not back again, the choice between this and exchanging via theforeign exchange market involves one-way arbitrage.People buying dollars with pounds will use the foreign exchange market if they receive at least as many dollarsfor their pounds in that market as via one-way arbitrage. That is, for the exchange market to be used it is necessarythatSð$/bid£Þ PUS GðbidÞPG UKðaskÞð1 c GÞ ð22B:2ÞThe amount on the right-hand side of equation (8A.12) is the lower gold point, and it is the minimum exchangerate for dollars to pounds in the foreign exchange market in a gold-standard world.A person who wants to buy pounds for dollars could do this via the foreign exchange market and pay S($/ask£)for each pound or alternatively, could use one-way arbitrage and use dollars to buy gold from the Federal Reserve,ship the gold, and sell it to the Bank of England. If this person chooses to use one-way arbitrage, the number ofdollars he or she will pay per pound is calculated as follows.Each pound requires selling to the Bank of England 1/PGUK (bid) oz. of gold. In order to have this amount of goldin Britain it is necessary to buy in the United States1PG UKðbidÞ 1ounces ð22B:3Þð1 c G Þbecause only (1 c G ) of gold that is purchased remains after shipping costs. The amount that must be paid to theFederal Reserve for the amount of gold in equation (22B.3) is$ PUS GðaskÞPG UKðbidÞ 1ð1 c G Þð22B:4ÞThe value in equation (22B.4) is the number of dollars that must be paid for one pound via buying, shipping, andselling gold.People buying pounds with dollars will use the foreign exchange market rather than one-way arbitrage if theypay no more dollars via the foreign exchange market than via one-way arbitrage, that is, ifSð$/ask£Þ PUS GðaskÞPG UKðbidÞ 1ð1 c G Þð22B:5ÞThe amount of the right-hand side of equation (22B.5) is the upper gold point, and it is the maximumexchange rate of dollars for pounds if the foreign exchange market is to be used. We find that when each centralbank offers to buy and sell its currency for gold, a range of values will be established in the foreign exchange marketwithin which the exchange rate can vary. The bid and ask exchange rates can vary between the limits of S($/bid£)in (22A.12) and S($/ask£) in (22B.5). No exchange-rate quotation at which transactions occur can lie outside thisrange. That is, the exchange rate in the foreign exchange market must be in the rangePGUSðbidÞPG UKðaskÞð1 c GÞSð$/£Þ PUS GðaskÞPG UKðbidÞ 1ð1 c G Þð22B:6Þ& 512
ALTERNATIVE SYSTEMS OF EXCHANGE RATESwhere S($/£) stands for the exchange rate, whether it be a bid rate or an ask rate. For example, if the gold prices ofthe central banks arePG US ðaskÞ ¼$402PG US ðbidÞ ¼$400PG UK ðaskÞ ¼£251PG UK ðbidÞ ¼£250and c G ¼ 0.01, the exchange rate must be in the range1:58 Sð$/£Þ 1:62The ends of the range are the gold points; in this case the gold points are $1.58/£ and $1.62/£. We find that the goldpoints result from both the bid-ask spreads on gold prices charged or paid by the central banks, and the cost ofshipping gold between the two countries.513 &
Chapter 23The international financial system:past, present, and futureAnd Jesus entered the Temple of God and drove out all who sold and bought in the temple, and heoverturned the tables of the money-changers ... He said to them, ‘‘It is written, ‘My House shall becalled a house of prayer’, but you make it a den of robbers.’’Mathew 21:12In this chapter we follow a time line of theinternational financial system as it functioned fromthe latter half of the nineteenth century until today.This takes us on a journey through the four principaltypes of financial system we have experienced:gold standard; Bretton Woods standard; flexibleexchange rates; and cooperative intervention. Ourtravels take us through some remarkable territory,including the radical experiment of the creationof a new currency shared by many nations – theeuro. Many crises on different continents, in Asia,Central and South America, are visited alongthe way.After the historical tour, we extend the timeline into the future by looking at the problems theinternational financial system faces, and howthese are likely to affect the evolution of internationalfinancial arrangements. We focus on themounting debt of some key economic players, andshifting economic power from the industrial leadersof the twentieth century to a broader base of successfultrading nations. We also review the pros andcons of alternative arrangements for determiningexchange rates. By analyzing the advantages anddisadvantages of fixed and flexible exchange rates& 514we are forced to conclude that despite extensiveexperimentation with different international financialarrangements during this century, there is noobvious, dominant solution. Instead, differentcountries are likely to prefer different arrangementsdepending on their circumstances.THE PASTThe classical gold standard, 1870–1914For almost half a century before the First WorldWar of 1914–18, the international financial systemran according to the rules of the classical goldstandard. The success of this system has been tracedto the credible commitment represented by theunconditional guarantee to convert paper moneyfor gold at a fixed price. As we have seen in thepreceding chapter, such a commitment is the essentialelement of the classical gold standard. Few if anydoubted the willingness of governments to continueto exchange gold for fiat money, even after temporarysuspensions during periods of war. Not onlydid participating countries such as the United Statesand France gain the confidence of others, but
THE INTERNATIONAL FINANCIAL SYSTEMeverybody could count on Britain to do whateverwas necessary to underwrite the system. 1The criticality of credibility to the success of arule-based system such as the gold standard has beencast in modern game theory terms, following thesuccessful application of game theory to domesticmonetary policy. 2 The key insight is that withoutrules and a credible commitment to maintain astable price level, governments can be counted onsaying they intend fighting inflation to inducepeople to lend to them at low interest rates, andthen afterwards to abandon their promise. Thegovernment-induced inflation, if unexpected,reduces the government’s real borrowing costs;interest rates which reflect anticipated inflationwould not compensate for realized inflation. However,with rational expectations, it is not possiblefor governments to play this game successfully.Lenders know that the government will misrepresentits intentions, pursuing inflationary policy despite itspromises. This drives the economy to an inefficientequilibrium – one in which the public expects thegovernment to defect (i.e. to cheat) by inflating, thegovernment knows that the public expects this, anddoes indeed cheat. Therefore, interest rates are highto reflect the expected, and actual, inflation. This is aso-called Nash equilibrium: expectations areconsistent and ultimately vindicated, and each‘‘player’’ chooses the best available action given theseexpectations. All this follows if governments take nocostly steps to gain credibility.1 See, for example, Alberto Giovannini, ‘‘Bretton Woodsand its Precursors: Rules versus Discretion in the History of<strong>International</strong> Monetary Regimes,’’ in Michael D. Bordoand Barry Eichengreen(eds), A Retrospective on the BrettonWoods System, University of Chicago Press, Chicago, IL,1993, pp. 109–55, and Michael D. Bordo, ‘‘The GoldStandard, Bretton Woods and Other Monetary Regimes:A Historical Appraisal,’’ in Review, Federal Reserve Bank ofSt. Louis, March/April 1993, pp. 123–99.2 See Finn E. Kydland and Edward C. Prescott, ‘‘Rules Ratherthan Discretion: The Inconsistency of Optimal Plans,’’Journal of Political Economy, June 1977, pp. 473–91, andRobert J. Barro and David B. Gordon, ‘‘Rules, Discretionand Reputation in a Model of Monetary Policy,’’ Journal ofMonetary Economics, July 1983, pp. 101–21.Knowing how the ‘‘game’’ unravels when thereis nothing to constrain government behavior, itbecomes optimal for the government to agree to aconstraint on its behavior. The promise to convertfiat money for gold is just such a constraint andsignal of its sincerity. In this way gold serves as anominal anchor – a credible commitment to astable value of fiat money. The public reasons thatthe government would not agree to a fixed priceof gold – or a fixed price of currency versus theUS dollar under the Bretton Woods system – if itintended defecting. The government knows this andindeed, does not want to defect, instead preferringto keep inflation low even after it has borrowed. Inthis way the government keeps interest rates low;low inflationary expectations mean low nominalinterest rates. 3Flexible rates and controls, 1914–44The credibility that the gold standard brought togovernment policy was eroded somewhat by theFirst World War which began in 1914. As is usual inwartime, governments imposed currency controlsand abandoned the commitment to convert theirpaper currencies into gold. Immediately after theFirst World War ended in 1918, rather than returnto gold, there was a period of flexible exchangerates that lasted until 1926, during which time manycountries suffered from hyperinflation. The goldstandard was eventually readopted in 1926 in aneffort to bring inflation under control and to helpcure a number of other economic ills such as sweepingprotectionism, competitive devaluation, and soon. However, for the gold standard to retain credibility,it is necessary that deficit countries allow theinfluence of deficits on their gold reserves to slowmonetary growth. It is also necessary that surpluscountries allow their increased gold reserves to3 See Michael D. Bordo and Finn E. Kydland, ‘‘The GoldStandard as a Rule,’’ National Bureau of Economic Research,Working Paper 3367, May 1990, and G. de Kock andVittorio U. Grilli, ‘‘Endogenous Exchange Rate RegimeSwitches,’’ National Bureau of Economic Research, WorkingPaper 3066, August 1989.515 &
THE INTERNATIONAL MACROECONOMIC ENVIRONMENTliberalize their monetary policies. After the FirstWorld War, the burden of both types of adjustmentwas considered so great that there was reluctanceto behave in this way. Many countries began tomanipulate exchange rates for their own domesticobjectives. For example, the French devalued thefranc in 1926 to stimulate their economy, and theundervalued currency contributed to problems forBritain and the pound sterling. Then in 1928, theFrench government decided to accept only gold andno more foreign exchange. When in 1931 theFrench decided that they would not accept anymore pounds sterling and also that they wouldexchange their existing sterling holdings for gold,there was little Britain could do other than makesterling inconvertible into gold. This they did in1931. With the ability to exchange currenciesfor gold being the central feature of the gold standard,and with Britain having been the nucleus ofthe gold standard, this marked the end of theera. Indeed, when other countries found theirholdings of pounds no longer convertible, theyfollowed Britain. By 1934 only the US dollar couldbe exchanged for gold.Since a full recovery from the Great Depressionof 1929–33 did not take place until the onset ofthe Second World War the conditions for a formalreorganization of the international financial orderwere not present. The Depression had provided anenvironment in which self-interested beggar-thyneighborpolicies – competitive devaluations andincreased tariff protection – followed the modelestablished earlier by France. Since no long-lastingeffective devaluations were possible and the greatinterruption of world trade eliminated the gainsfrom international trade, such an environmenthindered global economic growth: all countriescannot simultaneously devalue by raising goldprices, with collective action doing nothing morethan devaluing money by causing inflation. Whenthe war replaced the Depression, no cooperationwas possible. It was not until July of 1944 that, withvictory imminent in Europe, the representatives ofthe United States, Great Britain, and other alliedpowers met at the Mount Washington Hotel in& 516Bretton Woods, New Hampshire to hammer outa new international financial order to replace thefailed gold standard.Bretton Woods and the <strong>International</strong>Monetary Fund (IMF), 1944–73Of paramount importance to the representatives atthe 1944 meeting in Bretton Woods was the preventionof another breakdown of the internationalfinancial order, such as the one which followed thepeace after the First World War. From 1918 untilwell into the 1920s the world had witnessed a rise inprotectionism on a grand scale to protect jobs forthose returning from the war, competitive devaluationsdesigned for the same effect, and massivehyperinflation as the inability to raise conventionaltaxes led to use of the hidden tax of inflation:inflation shifts buying power from the holders ofmoney, whose holdings buy less, to the issuers ofmoney, the central banks. A system was requiredthat would keep countries from changing exchangerates to obtain a trading advantage and to limitinflationary policy. This meant that some sort ofcontrol on rate changes was needed, as well as areserve base for deficit countries. The reserves wereto be provided via an institution created for thispurpose. The <strong>International</strong> Monetary Fund (IMF)was established to collect and allocate reserves inorder to implement the Articles of Agreementsigned in Bretton Woods. 4The Articles of Agreement required membercountries (of which there were 184 as of May2004) to1 promote international monetary cooperation2 facilitate the growth of trade3 promote exchange-rate stability4 establish a system of multilateral payments5 create a reserve base.The reserves were contributed by the membercountries according to a quota system (since then4 Exhibit 23.1 describes the competing views that had to beresolved before agreement was reached.
THE INTERNATIONAL FINANCIAL SYSTEMEXHIBIT 23.1SEEING THE FOREST THROUGH THE TREES:THE BRETTON WOODS VISIONThe two principal plans presented to the delegates atthe Bretton Wood Conference in July 1944 were thoseof Britain, proposed by Lord John Maynard Keynes,and of the United States, proposed by Harry DexterWhite. Representatives from 44 countries or authoritieswere determined to work together to ‘‘win thepeace,’’ and it is a remarkable testimony to theirresolve that an agreement was reached that overcamethe self-interest of countries; representatives agreedto forgo a measure of economic sovereignty for thecommon good. The following excerpt describes thetwo plans which dominated discussion.The planning that led to Bretton Woods aimed toprevent the chaos of the interwar period. Theperceived ills to be prevented included (1) floatingexchange rates that were condemned as subject todestabilizing speculation; (2) a gold exchangestandard that was vulnerable to problems ofadjustment, liquidity and confidence, whichenforced the international transmission of deflationin the early 1930s; and (3) the resort tobeggar-thy-neighbor devaluations, trade restrictions,exchange controls and bilateralism after1933. To prevent these ills, the case for anadjustable-peg system was made by Keynes,White, Nurkse and others. The new system wouldcombine the favorable features of the fixedexchange rate gold standard – stability ofexchange rates – and of the flexible exchange ratestandard – monetary and fiscal independence.Both Keynes, leading the British negotiatingteam at Bretton Woods, and White, leading theAmerican team at Bretton Woods, planned anadjustable-peg system to be coordinated by aninternational monetary agency. The Keynes plangave the <strong>International</strong> Currency Union substantiallymore reserves and power than the United NationsStabilization Fund proposed by White, but bothinstitutions would have had considerable controlover the domestic financial policy of the members.The British plan contained more domestic policyautonomy than did the U.S. plan, whereas theAmerican plan put more emphasis on exchange ratestability. Neither architect was in favor of a rulebasedsystem. The British were most concerned withpreventing the deflation of the 1930s, which theyattributed to the constraint of the gold standard ruleand to deflationary U.S. monetary policies. Thusthey wanted an expansionary system.The American plan was closer to the gold standardrule in that it stressed the fixity of exchangerates. It did not explicitly mention the importanceof rules as a credible commitment mechanism, butthere were to be strict regulations on the linkagebetween UNITAS (the proposed internationalreserve account) and gold. Members, in the event ofa fundamental disequilibrium, could change theirparities only with approval from a three-quartersmajority of all members of the Fund.The Articles of Agreement of the <strong>International</strong>Monetary Fund incorporated elements of both theKeynes and White plans, although in the end, U.S.concerns predominated. The main points of thearticles were: the creation of the par value system;multilateral payments; the use of the fund’sresources; its powers; and its organization.Source: Michael D. Bordo, ‘‘The Gold Standard, BrettonWoods and Other Monetary Regimes: A Historical Appraisal,’’Review, Federal Reserve Bank of St. Louis, March/April 1993, pp. 163–64.many times revised) based on the national incomeand importance of trade in different countries. Ofthe original contribution, 25 percent was in gold –the so-called gold tranche position – and theremaining 75 percent was in the country’s owncurrency. A country was allowed to borrow upto its gold-tranche contribution without IMFapproval and an additional 100 percent of its total517 &
THE INTERNATIONAL MACROECONOMIC ENVIRONMENTcontribution in four steps, each with additionalstringent conditions established by the IMF. Theseconditions were designed to ensure that correctivemacroeconomic policy actions would betaken. The lending facilities have been expandedover the years. Standby arrangements were introducedin 1952, enabling a country to have fundsappropriated ahead of the need so that currencieswould be less open to attack during the IMF’sdeliberation of whether help would be made available.Other extensions of the IMF’s lending abilityhave taken place over the years to deal with urgentcircumstances such as rising oil prices and risinginterest rates on mounting debts. These extensionsin lending ability were supplemented by the 1980decision allowing the IMF to borrow in theprivate capital market when necessary, and theextension of borrowing authority in the 1990General Arrangements to Borrow whichallows the IMF to lend to nonmembers. The scopeof the IMF’s power to lend was further expanded in1993, when new facilities to assist in exchange-ratestabilization were made available.As we have seen, the most important feature ofthe Bretton Woods Agreement was the decision tohave the US dollar freely convertible into gold andto have the values of other currencies fixed in USdollars. The exchange rates were to be maintainedwithin 1 percent on either side of the official parity,with intervention required at the support points.This required the United States to maintain areserve of gold, and other countries to maintain areserve of US dollars. Because the initially selectedexchange rates could have been incorrect forbalance-of-payments equilibrium, each country wasallowed a revision of up to 10 percent within a yearof the initial selection of the exchange rate. In thisbasic form the system survived until 1971.The central place of the US dollar was viewedby John Maynard Keynes as a potential weakness.Keynes preferred an international settlement systembased on a new currency unit, the bancor.However, the idea was rejected, and it was notuntil the 1960s that the inevitable collapse of theBretton Woods arrangement was recognized by& 518a Yale economist, Robert Triffin. 5 According to theTriffin paradox, in order for the stock of worldreserves to grow along with world trade, the providerof reserves, the United States, had to runbalance-of-payments deficits. These deficits wereviewed by Triffin as the means by which othercountries could accumulate dollar reserves. Althoughthe US deficits were needed, the more theyoccurred, the more the holders of dollars doubtedthe ability of the United States to convert dollarsinto gold at the agreed price.Among the more skeptical holders of dollars wasFrance, which began in 1962 to exchange dollars forgold despite the objection of the United States. Notonly were the French doubtful about the futurevalue of the dollar, but they also objected to thepivotal role of the United States in the BrettonWoods system. Part of this distaste for a powerfulUnited States was political, and part was based onthe seigniorage gains that France believed accruedto the United States by virtue of the US role as theworld’s banker. Seigniorage is the profit from‘‘printing’’ money and depends on the ability tohave people hold your currency or other assets ata noncompetitive yield. Every government whichissues legal-tender currency can ensure that it isheld by its own citizens, even if it offers no yieldat all. For example, US citizens will hold FederalReserve notes and give up goods or services forthem, even though the paper the notes are printedon costs very little to provide. The United States wasin a special position because its role as the leadingprovider of foreign exchange reserves meant thatit could ensure that foreign central banks as well asUS citizens would hold US dollars.In reality, most reserves of foreign central bankswere and are kept in securities such as treasury billswhich earn their holders interest. If the interest thatis paid on the reserve assets is a competitive yield,then the seigniorage gains to the United States fromforeigners holding US dollar assets is small. Indeed,with sufficient competition from (1) alternative5 Robert Triffin, Gold and the Dollar Crisis, Yale UniversityPress, New Haven, CT, 1960.
THE INTERNATIONAL FINANCIAL SYSTEMreserves of different currencies and (2) alternativedollar investments in the United States, seignioragegains would be competed away. 6 Nevertheless,the French continued to convert their dollar holdingsinto gold. This led other countries to worryabout whether the United States would have sufficientgold to support the US dollar after the Frenchhad finished selling their dollars: under a fractionalreserve standard, gold reserves are only a fraction ofdollars held.By 1968, the run on gold was of such a scale thatat a March meeting in Washington, DC, a two-tiergold-pricing system was established. While theofficial US price of gold was to remain at $35/oz.,the private-market price of gold was to be allowedto find its own level.After repeated financial crises, including adevaluation of the pound from $2.80/£ to $2.40/£in 1967, some relief came in 1970 with the allocationof Special Drawing Rights (SDRs). 7 TheSDRs are book entries that are credited to theaccounts of IMF member countries according totheir established quotas. They can be used to meetpayments imbalances, and they provide a net additionto the stock of reserves without the need forany country to run deficits or mine gold. From 1970to 1972, approximately $9.4 billion worth of SDRs(or paper gold as they were sometimes called) werecreated. However, there was no further allocationuntil January 1, 1979, when SDR 4 billion was created.Similar amounts were created on January 1,1980, and on January 1, 1981, bringing the total toover SDR 20 billion. No allocations of SDRs haveoccurred since 1981. A country can draw on itsSDRs as long as it maintains an average of morethan 30 percent of its cumulative allocation, and6 For an account and estimates of seigniorage gains, see thepapers in Robert Mundell and Alexander Swoboda (eds),Monetary Problems of the <strong>International</strong> Economy, University ofChicago Press, Chicago, IL, 1969.7 See Fritz Machlup, Remaking the <strong>International</strong> MonetarySystem: The Rio Agreement and Beyond, Johns HopkinsPress, Baltimore, MD, 1968, for the background to thecreation of SDRs. For more recent developments seehttp://www.imf.org/external/np/exr/facts/sdr.htma country is required to accept up to three times itstotal allocation. Interest is paid to those who holdSDRs and by those who draw down their SDRs,with the rate based on an average of money-marketinterest rates on dollars, pounds, euros, and yen.The SDR was originally set equal in value to thegold content of a US dollar in 1969, that is,0.888571 grams or 1/35 oz. The value was laterrevised, first being based on a weighted basket of16 currencies, and subsequently being simplifiedto five currencies. The currency basket and theweights are revised every 5 years according to theimportance of each country in international trade.The value of the SDR is quoted daily.If the SDR had arrived earlier, it might haveprevented or postponed the collapse of the BrettonWoods system, but by 1971, the fall was imminent.After only two major revisions of exchange rates inthe 1950s and 1960s – the floating of the Canadiandollar during the 1950s and the devaluation ofsterling in 1967 – events suddenly began to rapidlyunfold. On August 15, 1971, the United States respondedto a huge trade deficit by making the dollarinconvertible into gold. A 10-percent surcharge wasplaced on imports, and a program of wage and pricecontrols was introduced. Many of the major currencieswere allowed to float against the dollar,and by the end of 1971 most had appreciated, withthe German mark and the Japanese yen both up12 percent. The dollar had begun a decadeof decline.On August 15, 1971, the United States made itclear that it was no longer content to support asystem based on the US dollar. The costs of being areserve-currency country were perceived as havingbegun to exceed any benefits in terms of seigniorage.The ten largest countries were called togetherfor a meeting at the Smithsonian Institution inWashington, DC. As a result of the SmithsonianAgreement, the United States raised the price ofgold to $38 oz. (i.e. devalued the dollar). Each ofthe other countries in return revalued its currencyby up to 10 percent. The band around the newofficial parity values was increased from 1 percentto 2 1 4percent on either side, but several EEC519 &
THE INTERNATIONAL MACROECONOMIC ENVIRONMENTcountries kept their own exchange rates within anarrower range of each other while jointly allowingthe 4 1 2-percent band vis-à-vis the dollar. As we haveseen, the ‘‘snake,’’ as the European fixed-exchangeratesystem was called, became, with some minorrevisions, the Exchange Rate Mechanism (ERM) ofthe European Monetary System (EMS) in 1979.The dollar devaluation was insufficient to restorestability to the system. US inflation had become aserious problem: see Exhibit 23.2. By 1973 thedollar was under heavy selling pressure even at itsdevalued or depreciated rates, and in February1973, the price of gold was raised 11 percent, from$38 to $42.22 oz. By the next month most majorcurrencies were floating. This was the unsteadystate of the international financial system as itapproached the oil crisis of the fall of 1973.The flexible-exchange-rate period, 1973–85The rapid increase in oil prices after the oil embargoworked to the advantage of the US dollar. Since theUnited States was relatively self-sufficient in oil atthat time, the US dollar was able to weather theworst of the storm. The strength of the dollarallowed the United States to remove controls oncapital outflows in January 1974. This opened theway for large-scale US lending to companies andcountries in need – and came just in time. Thepractice of paying for oil in US dollars meant that thebuyers needed dollars and that the sellers – principallythe members of the Organization of PetroleumExporting Countries (OPEC) – needed to investtheir dollar earnings. And so the United States beganto recycle petrodollars, taking them in from OPECcountries and then lending them to oil buyers.It was not until 1976, at a meeting in Jamaica,that the system that had begun to emerge in 1971was approved, with ratification coming later, inApril 1978. Flexible exchange rates, alreadyextensively used, were deemed to be acceptable toIMF members, and central banks were permitted tointervene and manage their floats to prevent unduevolatility. Gold was officially demonetized, andhalf of the IMF’s gold holdings returned to the& 520members. The other half was sold, and the proceedswere to be used to help poor nations. Individualcountries were allowed to sell their gold holdings,and the IMF and some other countries began sales.IMF sales were completed by May of 1980.The Presidential election of 1980 and the subsequentadoption of supply-side economics bythe Reagan Administration was followed by a periodof growing US fiscal and balance-of-trade deficits.Nevertheless, the US dollar experienced a substantialappreciation, further adding to the US tradedeficit. This took place against the backdrop of theworsening third-world debt crisis which wasaggravated by the high-flying dollar; since most ofthe debt was denominated in dollars, it was moreexpensive for the debtor nations such as Brazil,Mexico, Poland, and Venezuela to acquire dollars tomeet debt service payments. Adding to the difficultiesof the debtor nations was a general disinflationwhich was particularly severe for resourceexports, including oil, that were the source of muchof their revenue. Furthermore, because they had tomeet debt payments, the debtors could not reduceoil and other resource production as they wouldnormally do at low prices. Indeed, some debtornations had to increase production to make up forlower prices, and this put even more downwardpressure on their export prices. That is, declining oiland other prices caused producers to produce moreto meet debt payments, further lowering resourceprices, thereby causing a further increase in output,and so on. While the third-world debt crisis whichaccompanied this resource deflation overlaps theperiod of flexible rates and the subsequent cooperativeintervention period, it is worth singling outthe debt crisis years because the crisis helpedtransform international financial arrangements.The third-world debt crisis, 1982–89The backgroundThe high interest rates on loans to developingnations, and the rapid economic growth someof these countries had enjoyed in the 1970s, led
THE INTERNATIONAL FINANCIAL SYSTEMEXHIBIT 23.2BRETTON WOODS FACES THE AXEInflation is a hidden tax; it reduces the value of fixedface-value assets such as currency. The United Statesresorted to the inflation tax to fight the unpopularVietnam War, knowing that more explicit taxes, suchas those on sales or incomes, would not be receivedfavorably by the American public. The inflation taxwas applied via accelerated growth in the moneysupply. The resulting inflation was ‘‘shipped’’ via theBretton Woods system in the following way: USinflation with fixed exchange rates caused US tradedeficits and corresponding trade surpluses elsewhere.In order to prevent appreciation of exchange rates inthe surplus countries, their central banks were forcedto increase the supplies of their currencies. Thiscaused inflation among the US trading partners. Thefollowing explains how the inflation brought downthe quarter-century old Bretton Woods system aftera brief period, 1971–73, with a dollar standard.After the establishment of the two-tier arrangement,the world monetary system was on a de factodollar standard. The system became increasinglyunstable until it collapsed with the closing of thegold window in August 1971. The collapse of asystem beset by the fatal flaws of the gold exchangestandard and the adjustable peg was triggered byan acceleration in world inflation, in large partthe consequence of an earlier acceleration ofinflation in the United States. Before 1968, theU.S. inflation rate was below that of the GNPweighted inflation rate of the Group of Sevencountries excluding the United States. It beganaccelerating in 1964, with a pause in 1966–67.The increase in inflation in the United States andthe rest of the world was closely related to anincrease in money growth and in money growthrelative to the growth of real output ...The key transmission mechanism of inflationwas the classical price specie flow mechanismaugmented by capital flows. The BrettonWoods system collapsed because of the laggedeffects of U.S. expansionary monetary policy.As the dollar reserves of Germany, Japan andother countries accumulated in the late 1960sand early 1970s, it became increasingly moredifficult to sterilize them. This fostered domesticmonetary expansion and inflation. In addition,world inflation was aggravated by expansionarymonetary and fiscal policies in the rest of theGroup of Seven countries, as their governmentsadopted full employment stabilization policies.The only alternative to importing U.S. inflationwas to float – the route taken by all countriesin 1973.The U.S. decision to suspend gold convertibilityended a key aspect of the Bretton Woods system.The remaining part of the system – the adjustablepeg – disappeared 19 months later.The Bretton Woods system collapsed for threebasic reasons. First, two major flaws underminedthe system. One flaw was the gold exchange standard,which placed the United States under threatof a convertibility crisis. In reaction it pursuedpolicies that in the end made adjustment moredifficult.The second flaw was the adjustable peg. Becausethe costs of discrete changes in parities weredeemed high, in the face of growing capitalmobility, the system evolved into a reluctant fixedexchange rate system without an effective adjustmentmechanism. Finally, U.S. monetary policywas inappropriate for a key currency. After 1965,the United States, by inflating, followed an inappropriatepolicy for a key currency country.Though the acceleration of inflation was lowby the standards of the following decade, whensuperimposed on the cumulation of low inflationsince World War II, it was sufficient to triggera speculative attack on the world’s monetarygold stock in 1968, leading to the collapse of theGold Pool. Once the regime had evolved into ade facto dollar standard, the obligation of the521 &
THE INTERNATIONAL MACROECONOMIC ENVIRONMENTUnited States was to maintain price stability.Instead, it conducted an inflationary policy, whichultimately destroyed the system.Source: Michael D. Bordo, ‘‘The Gold Standard, BrettonWoods and Other Monetary Regimes: A Historical Appraisal,’’Review, Federal Reserve Bank of St. Louis, March/April 1993, pp. 175–78.even some of the most conservative banks fromindustrialized countries to make substantial fractionsof their loans to developing countries. Forexample, for the largest 15 US banks, developingcountryloans at the outset of 1982 amounted to7.9 percent of their assets and 150 percent of theircapital. This meant that default on all these loanswould place the banks in technical insolvency.However, since many of the loans were made togovernments or guaranteed by governments – socalledsovereign loans – few bankers seemedaware that defaults were possible. A commonlyvoiced opinion was that ‘‘countries don’t go bankrupt,only companies go bankrupt.’’ What wasoverlooked by the bankers in their complacency wasthat countries can go bankrupt in terms of US dollars,and the vast majority of third-world debt wasdenominated in US dollars. Clearly, if countriesborrowed in their own currencies they could alwaysrepay debts; they have unlimited power to ‘‘print’’their currencies. Of course, bankers would havebeen very wary of loans denominated in the borrowers’currencies, knowing that on repayment thecurrencies they received would probably have littlevalue. It is worth noting that if the debtor nationshad issued bonds rather than arranged bank loans,the inability to pay would have meant outrightdefault, not rescheduling. For example, in asimilar international debt crisis of the 1930s involvingbonds, defaults occurred on the majority offoreign-issued US dollar bonds. 8The debt crisis first became obvious whenin August 1982, Mexico announced it couldnot meet scheduled repayments on its almost8 See Barry Eichengreen, ‘‘Resolving Debt Crises: AnHistorical Perspective,’’ National Bureau of EconomicResearch, Working Paper 2555, April 1988.& 522$100 billion of external debt. Within one year ofthat announcement, 47 debtor nations were negotiatingwith their creditors and international organizationssuch as the IMF and World Bankto reschedule payments. The negotiations involvedpossible changes in magnitude, maturity, and currencycomposition of debt. Talk of a ‘‘debtors,cartel’’ and default by debtors was matched againstthe threat of denial of future credits by thecreditor banks and their governments. This was thebackground to the intense bargaining betweendebtors and creditors which stretched on throughoutthe 1980s. The creditors knew that debtorswould repudiate if the value of repudiated debtexceeded the present value of the cost of repudiationin the form of denied access to future credit. 9The causesNumerous factors combined to make the crisisas severe as it was. Taking developments in noparticular order, we can cite the following:1 In the two years 1979 and 1980 there was a27-percent decline in commodity prices, anda recession began in developing and developednations alike. This meant that export revenuesof debtor nations which depended on commodityexports were plunging, and yet it wasfrom these export revenues that they had toservice debts. The loans had been sought andgranted based on an expectation of increasing9 The problem of creditor–debtor bargaining clearly fits inthe paradigm of non cooperative game theory, and indeed,the debt crisis spawned numerous papers in this vein. See,forexample,JonathanEatonandMarkGersovitz,‘‘DebtwithPotential Repudiation: Theoretical and Empirical Analysis,’’Review of Economic Studies, April 1981, pp. 289–309.
THE INTERNATIONAL FINANCIAL SYSTEMcommodity prices and export revenues, andyet the very opposite occurred.2 The debts were denominated in US dollars,and in 1980 the US dollar began a spectacularclimb that by 1985 had almost doubled itsvalue against the other major currencies.Bankers and borrowers had not anticipatedthis surge in the dollar.3 Interest rates experienced an unprecedentedincrease after a switch to anti-inflationarymonetary policy in October 1979, with theUS prime rate topping 20 percent. This madethe payment of interest difficult for manyborrowers, and the repayment of principal justabout impossible.4 A substantial component of borrowed fundshad not been devoted to investment whichwould have generated income to help servicedebts. Rather, much of the debt had beenused to subsidize consumption. Furthermore,due to political pressures it was difficult toremove these subsidies, and so borrowingcontinued. Many debtor nations were on aknife edge, risking riots or revolution if theyreduced subsidies, but risking isolation fromcreditor nations if they maintained them. Atthe height of the debt crisis in the mid-1980s,visits by IMF officials to debtor nations toencourage reduced consumption-subsidizationwere frequently met with protests. In itsefforts to force economic reorganization ondebtors by making help contingent on a returnto market forces, the IMF became a villain inthe eyes of the poor in many developingnations.The fearThe principal fear of officials was the consequenceof bank failures brought about by outright defaults.This fear was based on the view that losses wouldexceed the capital of many banks, so that effectswould not be limited to bank shareholders. Rather,losses would spill over to depositors. Therecould be runs on banks if governments did not bailthem out by purchasing bad debts. Bank bailoutswere viewed by many as inflationary. 10 Manyargued, therefore, that the consequences of thedebt crisis would be financial panic and runawayinflation.The handling of the crisisThe fact that the 1980s ended without widespreadbank failures and financial chaos reflects the step-bysteprescheduling that occurred, the almost twodecades of economic growth, and a number of stepstaken by international organizations and banks.Some of the more notable of the actions taken wereextensions of stand-by credits by the key internationalfinancial institutions, rescheduling of paymentsover extended intervals, further private banklending to avoid realizations showing on balancesheets, the forgiving of some old loans and reducedinterest rates on other loans.The experience with the third-world debt crisisshows how financially and economically interdependentwe have become. Nations have come torecognize that failure of other countries’ banks willspill over to their own banks, and economic setbacksamong their customers will hurt their ownfirms that supply these customers. Through regulareconomic summits among national leaders, andthrough even more frequent contact among centralbankers and other senior officials, countries havebeen cooperating. As with the physical environment,it has become recognized that the global goodcan no longer be achieved through independent,competitive action. The same conclusion emergesfrom considering the shift in thinking that promptedthe Plaza Agreement in 1985.10 This view is difficult to support if all that thegovernments did was prevent a collapse of their moneysupplies. In fact, failure of governments to preventlosses on deposits would almost certainly have beendeflationary, as it was in the 1930s, and the maintenanceof deposit levels, if done properly, should have beena neutral action.523 &
THE INTERNATIONAL MACROECONOMIC ENVIRONMENTCooperative intervention: the PlazaAgreement era, 1985–Throughout the run-up in the value of the dollar inthe early 1980s, the US Administration repeatedlyargued that the appreciating dollar was a sign ofconfidence in the US economy, and that the freemarket would take care of exchange rates if theywere seriously out of line. However, many economistsargued otherwise, saying that the soaring USdollar was the result of an exploding US fiscal deficitthat was too large to be financed by bond salesto Americans. Instead, the fiscal deficit requiredborrowing from foreign savers such as those ofJapan and Germany. Bond purchases by Japanese,German, and other foreign investors meant ademand for US dollars when paying for the bonds,and this pushed up the dollar’s value. Furthermore,many economists argued that because a flexibleexchange rate results in a balanced balance ofpayments, the capital inflow and resulting capitalaccountsurplus required a matching currentaccountdeficit, and this in turn was achieved by anovervalued US dollar that itself was the result of thedemand for dollars to purchase US debt instruments.As the US capital inflows and current-accountdeficits rose in tandem, the US response was toleave fiscal policy in place, and instead push thedollar down by foreign exchange market intervention.The decision to take this tack was made at ameeting in the Plaza Hotel in New York in 1985.The Plaza Agreement marks a turning point in thatphase in the fortunes of the US dollar. During thefollowing several years the US dollar lost its earliergains in value against the other leading currencies,with the decline often very rapid. Despite thisspectacular depreciation, the US trade balanceworsened further.With the plight of the dollar grabbing newspaperheadlines, attention became focused on how toprevent the dollar falling further. Economic summitsof the world’s leaders were organized in whichthe volatility of exchange rates became a centralissue. These summits culminated in the LouvreAccord reached in Paris in 1987, in which the G-7& 524industrial countries decided to cooperate onexchange-rate matters to achieve greater stability.This agreement marked a shift towards an orchestrateddirty, or managed, float. The reason forcoordinating the management of the float wasthat the size of private capital flows had become solarge that it had become difficult for the countrywhose currency was falling to muster sufficientexchange reserves to keep its exchange rate steady.However, since countries never run out of theirown currencies, they can indefinitely prevent theirexchange rates from increasing. Therefore, byagreeing to manage exchange rates cooperatively, itwas felt that the authorities could keep them stable,even in the face of very heavy private speculation.The agreement to intervene jointly in foreignexchange markets came in conjunction with anagreement for greater consultation and coordinationof monetary and fiscal policy. This coordinationwas needed because, as indicated in Exhibit 23.2,when countries work to maintain exchange rates,inflation starting in one country can be shipped tothe others. For example, there was fear that if theUnited States maintained its very expansionarymonetary and fiscal policy, the US dollar woulddrop, forcing other countries to buy dollars andhence sell their currencies, thereby increasing theirmoney supplies. Japan, West Germany, and theother G-7 countries were afraid the US fiscal deficitwould eventually force the United States to expandits money supply, and therefore the agreement tocooperate with the United States was linked to USefforts to reduce its deficit.The system that emerged from the LouvreAccord, which has been reaffirmed in subsequenteconomic summits, is one that is based on flexibleexchange rates, but where the authorities periodicallylet it be known what trading ranges ofexchange rates they believe are appropriate. Interventionis used to try to maintain orderly marketswithin stated target zone. However, as we showedin Chapter 22, the threat of intervention helpsprovide stability, because the closer are exchangerates to the limits of their target zones, the greater isthe probability of official intervention. For example,
THE INTERNATIONAL FINANCIAL SYSTEMthe more the dollar drops toward the bottom endof the target zone, the greater is the probabilityof official dollar buying, and this leads speculatorsto buy dollars before the intervention occurs.This helps keep the dollar within the target zone.Nevertheless, despite the prediction of target zonesresearch that intervention would not have to occur,intervention has occurred on many occasions,including, for example, the extensive US dollarbuying during the spring and summer of 1994.Despite the foreign exchange market intervention,the dollar fell to post war lows by April 1995,falling to just 80 Japanese yen. (In 1985, the dollarwas worth more than 250 yen.) A further exampleof intervention that failed is the ‘‘peso crisis’’ ofDecember 1994, when despite large peso purchases,the Mexican peso plunged almost 40 percent.The Asian Financial Crisis, 1997–98While the seriousness and pervasiveness of theAsian Financial Crisis did not become clear untilthe devaluation of the Thai baht in July 1997, thebankruptcies in the region and the global contagionthat followed can be traced back at least to January1997. 11 The first major event was the collapse of alarge Korean chaebol, Hanbo Steel, under $6 billionof debt. This was shortly followed by the failure ofthe Thai company Somprasong to meet a foreigndebt payment. Further debt overload problemsquickly followed in Malaysia and the Philippines,with currencies coming under pressure as largecompanies in these countries were unable to paytheir creditors, many of whom were large westernbanks. The final trigger for the full-fledged crisiswas pulled on July 2, 1997, when Thailand devaluedthe baht. The rush to sell other regional currenciesswept the area, with the meltdown reaching panic11 For an exhaustive chronology of the Asian financialcrisis, see ‘‘Chronology of the Asian Crisis and its GlobalContagion’’ compiled by the Stern School of Businessfrom Reuters, Wall Street Journal, New York Times, CNNfn,Financial Times, Bloomberg and other sources, at http://www.stern.nyu.edu/globalmacro/AsiaChronology1.htmlproportions by the end of July 1997. One of theworst affected currencies was the Indonesian rupiahwhich, because of the economic importance of thecountry in overseas markets, spread contagion toSouth America, Russia, and other countries competingwith Indonesian producers in export markets.The only currencies to weather the stormwere the Hong Kong dollar, with the peg to the USdollar being maintained only by large run-ups ininterest rates and support by the People’s Bank ofChina, and the Chinese riminbi. The riminbi washelped by the fact that it was not freely tradable,denying speculators of something to sell.The cause of the Asian financial crisis has beenlinked to a number of circumstances, and indeed,this may be a case where it was the confluence ofmany conditions which made the crisis so severe.Most commentators attribute the crisis to poorlyregulated financial markets. 12 Unlike the thirdworlddebt crisis which involved problems withsovereign debt, in Asia it was mainly private debtto companies, especially companies involved inmajor construction projects. Paradoxically, theconstruction projects themselves boosted economicgrowth and this served only to further the investmentin projects and the willingness of banks to lendon these projects. Unfortunately, few lendersreflected on the scale of the accumulation of all theconstruction projects, and what this might mean forthe return on each additional project. There is onlyso much room at any one time for successful constructionprojects. As the earliest ones were completedand remained unsold, other projects werehalted mid-stream. In some cities in the region,decades of housing supply sat unfinished, with megaprojects such as sports stadiums in limbo. Thoseblaming financial regulation blame those whoshould have seen the result of the separate privatedecision makers’ over-supply problem. It is difficultto imagine what regulators could have been12 For a commentary on the possible causes of the Asianfinancial crisis see http://www.twnside.org.sg/title/back-cn.htm525 &
THE INTERNATIONAL MACROECONOMIC ENVIRONMENTexpected to do, other, perhaps, than those grantingdevelopment permits for construction projects.An alternative although not mutually exclusivecause of the crisis is cronyism or nepotism. Thisinvolves the favoring of friends’ or family members’projects in the allocation of financing or developmentlicences. When fund or licence allocation isbased on the market, those with the projects withhighest expected marginal returns are the oneslikely to attract the financing or receive the licences.Any other allocation is likely to result in a lowerexpected return: the selection of projects will besub-optimal. While the return is lower with fundallocation according to cronyism or nepotism, thecost of funds is not reduced if capital is being raisedin global financial markets. With the same costof funds, and lower expected returns, failure ismore likely.There were also external forces at work in theAsian crisis. One of these was the pegging of manyof the troubled currencies to the US dollar. Thestrong dollar at the time of the crisis negativelyimpacted profitability of export industries. A furtherfactor was the glut of products produced by theAsian economies. This glut in consumer electronics,sporting goods, clothing, houseware, and so on hasbeen good for consumers who have enjoyed deflationin a large range of products from the region.However, it has made it difficult to service debtpayments. We can think of what has happened as aparadox of composition. Any one country, such asKorea or Thailand, had they expanded productionof these products on their own, could have sold theproducts without lowering prices. The problem isthat very many countries at the same time expandedproduction, along with other nations from EasternEurope to the Americas. The result of their collectivesuccess at producing consumer products hasbeen to lower their prices. That is, these countrieshave worsened their own terms of trade – theirexport prices versus import prices – by their ownsuccess. Indeed, we can think of them as victims oftheir success.Our list of factors behind the Asian crisis has notincluded the role of currency speculators. Blame in,& 526at times, extreme, vitriolic language has been aimedat speculators such as George Soros by the MalaysianPrime Minister, Mahathir Mohammed. Wesave our discussion of speculation until later whenwe shall argue that speculation is unlikely to bedestabilizing, at least in a flexible-exchange-rateenvironment. The fixed rates of the currencies inthe region might, however, have been very much toblame for the financial crisis.The Argentine Banking Crisis, 2000–02After decades of poor fiscal and monetary managementand periods of rapid inflation, Argentinadecided to adopt an exchange-rate system that hadworked well for Honk Kong and other generallysmall economies, namely a currency board. Theboard began its work on April 1, 1991, with thepeso pegged to the US dollar at one peso to the USdollar. It was hoped that this would herald a new eraof stability for Argentina, a country blessed withabundant natural resources and an educated population.As we shall see, the actual result was almostunprecedented instability.Calling the Argentine exchange rate arrangementa currency board stretches the meaning of theterm because some of the elements behind such asystem were not present. It has been suggested thata successful currency board needs to possess atleast three features. First, the currency must befreely convertible into the anchor currency, in thiscase the peso versus the US dollar. Second, theconversion rate must be fixed. Finally, in order forthe convertibility to be guaranteed at the officialexchange rate, the country’s money must be fullybacked with hard currency. 13 Only in this way canholders of the currency feel confident in their abilityto convert into the anchor currency at the statedprice. 14 At some time or other during 1991–200213 These are also key conditions for a successful gold standard,where the anchor is gold.14 This list of key characteristics of a currency board areprovided in Steve Hanke and Kurt Schuler, ‘‘What WentWrong in Argentina?’’ Central Banking, 12, 3, 2002.
THE INTERNATIONAL FINANCIAL SYSTEMwhen the currency board existed, some or all ofthese elements were absent.Perhaps the most important of the key conditionsfor a successful currency board that was missing inthe case of Argentina was the absence of backingwith hard foreign currency. Instead, the charter ofthe board allowed it to hold domestic assets suchas Argentine government securities. The excessof money creation over the backing is calledthe fiduciary issue, and at times this reached20 percent. The currency board also made loans tobanks, particularly during the Mexican peso crisiswhen bank deposits were withdrawn. In this waythe board was involved in monetary policy, somethingthat exceeds the foreign exchange role that isnormally the focus of a successful board.An external factor that contributed to theeventual demise of the Argentine currency boardexperiment was the large fiscal deficit that thecountry suffered. 15 In an effort to deal with thedeficit the government raised income taxes in 2000,and applied a tax on financial transactions. Theseefforts did not work, but instead may have contributedto a worsening recession that in turncontributed to the fiscal deficit. By early 2001 therewas a flood of money leaving the country, to whichthe government responded by raising interest ratesto over 50 percent. This made the fiscal deficit evenworse by increasing debt service costs, and withmoney still leaving the country despite the highreturns offered on pesos, the conversion into dollarswas suspended.A second external factor, one that is common toall fixed exchange-rate regimes, and especially toones that involve great rigidity, was the globalstrengthening of the anchor currency, the US dollar.The rise in the dollar was the result of circumstancesin the United States, but yet Argentina’scurrency, by necessity, also rose along with thedollar vis-à-vis the world’s major currency.15 For a discussion of the factors contributing to the failure ofthe board, see ‘‘Argentina’s Currency Board: Lessons forAsia,’’ Economic Letter, Federal Reserve Bank of SanFrancisco, August 23, 2002.The stronger the dollar became the weaker becamethe Argentine economy as sales declined in its traditionalexport markets. By the end of 2001 thecountry was forced to shift to a new policy, initiallyone with dual exchange rates, a regime thatinvolved a lowered exchange rate for exports. Thisdid not work, and so in January 2002 the countryadopted a floating exchange rate. The economiccrisis, that had banks close their doors other thanfor short periods each week, and with only tinymoney withdrawals allowed when they were open,was severe. An economy cannot function withouta medium of exchange, and with banks closedand bills going unpaid, the economy sank into adepression.The introduction of the euro:completed 2002The news about international financial developmentsis not always about serious financial crises,with nations on the brink of collapse. One developmentwhich can be viewed in a positive light,certainly by those favoring economic integration asa means of economic and political harmony, is theestablishment of the euro.The idea of the euro can be traced back at least tothe Delors Report of 1989. Jacques Delors, whowas President of the European Commission,introduced a three-stage plan. Stage 1, which beganon July 1, 1991, removed all controls on themovement of capital within the European Union.Stage 2, which began on January 1, 1994, involvedestablishment of the European Monetary Institutewhich coordinated the separate national centralbanks in an effort to steer the Union towards acommon currency. The last step, Stage 3, began inJanuary 1999, and involved the establishment of‘‘irrevocably fixed exchange rates.’’ At first theeuro was used in credit and banking statements andfor electronic transfers, with the euro amountsshowing on invoices, receipts, and so on, but theold monies were still in use for cash settlements.However, by 2002, the old monies had beenentirely withdrawn, and the euro was in widespread527 &
THE INTERNATIONAL MACROECONOMIC ENVIRONMENTEXHIBIT 23.3THE COST OF CHANGE: CONVERSION TO THE EUROEstimates of the cost of switching from the previouscollection of a dozen different currencies to the newEuropean common currency, the euro, vary, but generallyplaced this cost in US dollar terms as somewherein the region of $20 billion to $50 billion.Compared to the size of the new Euro-zone’s economy,this is of the order of one half of 1 percent to1 percent of the area’s combined GDP.One of the main costs was producing 50 billion newcoins and 14.5 billion new notes, and exchanging thisfor the old coins and notes. On top of the cost ofchanging the money that people carry around withthem were the costs faced by commercial banks. Thishas been estimated as 20–50 percent of the totalcost, consisting of changing operational bankingsystems and information technology. All vendingmachines also had to be reconfigured, a total ofapproximately 3.5 million of them. Storefront currencyexchanges also felt the cost. A very largenumber of these, measured in the tens of thousands,went out of business. Some foreign currencies are stillchanged into and out of euros – US dollars, poundsetc. – but there is no longer a need to change moneywhen traveling through the bulk of the Europeancontinent.A cost that is difficult to compute is the re-writingof financial and other business contracts. Leases,mortgages, pensions, wage agreements, long-termsupply contracts, wills, corporate bonds, and so on allhad to be re-written in terms of the new money. Thisinvolved no small change. Old documents such asbond certificates had to be replaced with new certificates,and care taken to ensure all the replaced contractswere duly destroyed. The dangers of accidentalor even criminal duplications of contracts werevery real.The potential benefits are probably as large, orlarger, than the costs. No more visits to the bank whentraveling over a very large continent, just as it hasbeen for Americans traveling in the United States. Nomore uncertainties about the cost when ordering orselling goods to another Euro-zone member. A retireefrom one country can retire in another and simplymove their money to a new bank. The pension checksare in the same money wherever they are cashed.With all the costs incurred, this now representsa major barrier to any reversal of the change to theeuro. It would costs at least as much to go back as hasnow been borne in creating this brand new money. Ofcourse there are costs and disadvantages of a commoncurrency. Most importantly, monetary policy is thesame everywhere irrespective of the economic circumstances.However, it would take remarkable circumstancesto image a reversal of this unprecedentedexperiment.Source: In part based on estimates in a CNN specialitem at http://edition.cnn.com/SPECIALS/2001/euro/stories/euro.costs/use, making it much easier and cheaper to travel anddo business throughout the Euro-zone.The withdrawal of a dozen European currenciesand replacement with a single, common currencywas not a simple enterprise. For one thing it cost upto 1 percent of a year’s GDP, and this estimate doesnot include all the pre-existing private contracts,financial and otherwise, that had to be re-written. 16Another complication was the establishment ofthe conversion rates for the pre-existing currencies16 Exhibit 23.3 reviews some of the conversion costs.& 528into the euro. This job was given to the GeneralCouncil of the European Central Bank, ECB, whichwas established in 1998. After reviewing pricelevels and other pertinent factors, the conversionrates were established in January 1999. The rateswere the following number of units of currencyper euro.“ 40.3399 Belgian franc“ 340.750 Greek drachma“ 6.55957 French franc“ 1936.27 Italian lira
THE INTERNATIONAL FINANCIAL SYSTEM“ 2.20371 Dutch guilder“ 200.482 Portuguese escudo“ 1.95583 Deutsche mark“ 166.386 Spanish peseta“ 0.787564 Irish punt“ 40.3399 Luxembourg franc“ 13.7603 Austrian schilling“ 5.94573 Finnish markka.Establishing proper values is very important,because if a country overprices its currency it wouldmake the country uncompetitive initially, and tounderprice the currency would damage the wealthof the country’s citizens: they would receiveinadequate amounts of euros in their bank accountsin exchange for their old money.The euro has important implications for theconduct of monetary policy, with the single currencymeaning that monetary policy is ‘‘one size fitsall.’’ The damage done by such a limitation ofmonetary policy depends on issues such as themobility of factors of production and the convergenceof economic conditions in the membercountries. However, this is not the best place todeal with these matters. They are better discussedunder the topic of the pros and cons of fixed versusflexible exchange rates later in this chapter. Asshould be evident, adopting a common currencysuch as the euro is the adoption of a fixed exchangerate, with no chance to ever turn back.late 1960s and early 1970s, the rigidity of BrettonWoods could not provide the adjustment neededbetween oil-using and oil-producing nations, andso there followed after 1973 a period of exchangerateflexibility. With the increasing financial andeconomic interdependence spawned by financialderegulation and the growth in trade, and withmassive structural imbalances of trade and fiscaldeficits, the unfettered flexibility of the 1970s andearly 1980s was replaced by the more cooperativearrangements of the Plaza Agreement, 1985, andLouvre Accord, 1987. The obvious question withimportant implications for the future conduct ofinternational business is: where do we go fromhere? Since the direction we take is again likely tobe a response to current conditions, the answerrequires that we identify the problems faced today.These include1 shifting global economic importance of countriesand regions2 growing trade imbalances associated with theshift in economic importance3 increasing environmental concerns relating tointernational financial and trade flows4 need to select an appropriate degree ofexchange-rate flexibility.Let us consider each matter, and how it mightinfluence the future.THE PRESENTIf anything is clear from our description of keyevents in the history of the international financialsystem, it is that it evolves in response to theenvironment it serves. For example, the shift fromthe gold standard to the standard adopted at BrettonWoods came in response to the beggar-thyneighborand protectionist exchange-rate policies ofthe Great Depression and Second World War.In reaction to these competitive devaluations, thesystem that was chosen was characterized by extremerigidity of exchange rates. With the oil shock of theTHE FUTUREShifting global economic importanceAt the end of the Second World War, the UnitedStates was the dominant economic power of the freeworld, and it is therefore little surprise that theinternational financial system adopted at BrettonWoods in July 1944 was in large measure the USplan, with the US dollar playing a central role.As would be predicted by an application of gametheory, in situations involving an overwhelminglydominant player, solutions invariably unravelaccording to the dominant player’s preferences.529 &
THE INTERNATIONAL MACROECONOMIC ENVIRONMENT0.70.6US GDPJapan GDP1993 European Union GDP a0.50.4GDP (%)0.30.20.101955 1960 1965 1970 1975 1980 1985 1990 1995 2000Year& Figure 23.1 Post-war changes in economic importanceNotesThe size of the US economy substantially exceeded that of Japan and Europe combined until the early 1960s. By thetwenty-first century the European economy, based on the same countries as in earlier years, had grown larger than the USeconomy. If decisions on international financial matters are based on economic importance, Japan has similar influenceas the United States and Europe, because by forming a coalition with either entity, it can effect the balance of economicpower.a All data for EU based on the 12 members as of December 31, 1993.Source: <strong>International</strong> Monetary Fund Yearbook, 1993, plus Energy Information Administration, Washington DC,http://www.eia.doe.gov/emeu/iea/tableb2.htmlThe ‘‘golden rule’’ is that ‘‘he who has the goldmakes the rules,’’ and in 1944 the United Statesheld the majority of the free world’s official goldreserves, approximately 75 percent of the total.Therefore, the United States was the only countryin a position to fix its currency to gold.The economic hegemony enjoyed by the UnitedStates at the end of the Second World War has beeneroded by the phenomenal economic performanceof South East Asian countries, most particularly thePeoples’ Republic of China, Japan, and the ‘‘fourtigers,’’ Hong Kong, Singapore, Taiwan, and SouthKorea, and also by the growing strength of anincreasingly integrated Europe. The EuropeanUnion with its 25 members between the Baltic andthe Mediterranean, and Aegean and Atlantic, is considerablylarger than the United States in combined& 530GDP and population. The change in the balance ofeconomic power is clear from Figure 23.1. Whatthe figure reveals is that today there is a muchmore even sharing of economic power between theUnited States, Europe, and Japan. 17 This means thatwe can no longer predict important economicchanges, such as in the organization of the internationalfinancial system, simply by studying thepreferences of any one country. In any situationinvolving three players who can form coalitions,outcomes are difficult to predict. [The G-7 can bethought of as three groups: North America (UnitedStates plus Canada), Europe (Germany, Britain,France, and Italy) and Japan.] Indeed, if we associate17 We focus on GDP, not trade. China would warrant inclusionwere we to base importance on trade.
THE INTERNATIONAL FINANCIAL SYSTEMpower with economic output, a country with20 percent of the power, roughly Japan’s share, hasequal power to the other two players – NorthAmerica and Europe with 40 percent of the countries’combined outputs. This is because by forminga coalition with either larger economic unit, thesmall country holds the balance of power. So whatcan we say about the likely evolution of the internationalfinancial and economic system in the face ofthis changed economic reality?One clear consequence of the new balance ofpower is a need for each party to consult with theothers. No single power can take the chance oftriggering actions by the other two. This recognitionof the need to cooperate has manifested itself inthe G-7 summits, in the cooperative exchange-rateintervention policy of the Plaza Agreement andLouvre Accord, in the frequent meetings of leadingcentral bankers under the aegis of the Bank for<strong>International</strong> Settlements – see Exhibit 23.4 – in therenewed attention paid to tariff negotiations, andin numerous matters involving taxation, interestrates, and other policies. It seems likely that withincreasing financial and economic interdependence,the evolving international financial system willinvolve even closer cooperation.One of the consequences of the more evensharing of economic power is the potential emergenceof three trading blocs of currencies, a dollarbloc based on the Americas, a yen or perhapseventually a yuan bloc centered around Japanese orChinese trade, and a euro bloc centered on theEuropean Union. The pattern of international tradeshows increasing regionalism with associated risksof increased protectionism. Indeed, the largerthe regional trading blocs become, the greater isthe danger of rising trade protectionism. This isbecause the blocs believe there is less to lose fromtrade restriction, and because in larger tradingareas, more industrial constituencies are representedwhich have an interest in keeping competitionfor their own products more restricted.For example, without Spain and Portugal inthe EU the lobby to restrict citrus fruits into theEuropean market was weaker than when thesecitrus producers joined the EU.EXHIBIT 23.4THE BANK FOR INTERNATIONAL SETTLEMENTSThe Bank for <strong>International</strong> Settlements (BIS) is theworld’s oldest international financial institution. Thefollowing account of the BIS, excerpted from adescription by the Federal Reserve Bank of New York,highlights the important work that has been done andis being done by the ‘‘Central Bankers’ Bank.’’Established in 1930 in Basel, Switzerland, theBank for <strong>International</strong> Settlements (BIS) is abank for central banks. It takes deposits from, andprovides a wide range of services to, central banks,and through them, to the international financialsystem. The BIS also provides a forum for internationalmonetary cooperation, consultation, andinformation exchange among central bankers;conducts monetary, economic, and financialresearch, and acts as an agent or trustee forinternational financial settlements.Organizational StructureAs of March 2000, the BIS had 49 shareholdingcentral banks from around the world. As ofMarch 2000, the Bank’s assets were $145 billion,including $5.8 billion of its own funds ...Board of DirectorsThe BIS Board of Directors elects a chairmanfrom among its members and appointsthe president of the Bank. There are three typesof Board members: ex officio, appointed, andelected.The ex officio members are the heads of thecentral banks of Belgium, France, Germany, Italy,the United Kingdom, and the United States.Appointed directors, who are from those sixcountries, hold office for three years and areeligible for reappointment ...531 &
THE INTERNATIONAL MACROECONOMIC ENVIRONMENTBasel Capital AccordIn 1988, the Basel Committee on BankingSupervision developed the Basel Accord, whichsets minimum capital standards for internationallyactive banks. The Committee believed that theframework would strengthen the soundness andstability of the international banking system byencouraging international banking organizationsto increase their capital positions. Furthermore,the Committee believed that a standard approachapplied to banks in different countries wouldreduce competitive inequalities ...In June 1999, the Basel Committee on BankingSupervision proposed a new capital adequacyframework to replace the current Basel Accord.The proposed framework focuses on three‘‘pillars’’: (1) minimum capital requirements,(2) supervisory review, and (3) market discipline.Together, the changes to the current Accord aredesigned to differentiate degrees of risk moreaccurately and to improve the risk managementpractices of banks. Also, the Committee is seekingto expand capital requirements beyond creditand market risks to include interest rate andoperational risks ...Center for Economic, Financial, andMonetary ResearchThe Monetary and Economic Department of theBIS conducts research and market analysis. Forexample, the BIS and central banks compile andanalyze data on developments in internationalbanking and financial markets. They collect dataon activity in international securities markets,foreign exchange, and over-the-counter derivativesmarkets ...Financial OperationsThe BIS offers a wide range of banking servicesto assist central banks in managing their externalreserves. About 120 central banks and internationalfinancial institutions have deposits with theBIS. As of March 1999, currency deposits totaled$112 billion dollars, or about seven percent ofworld foreign exchange reserves. Most of thesefunds are in the form of investments with largecommercial banks and purchases of short-termgovernment securities. The BIS also conductsforeign exchange and gold operations for itscustomers ...Agency and Trustee FunctionsThe BIS assists in the execution of internationalfinancial agreements as trustee or fiscalagent. From 1986 to 1998, for example, theBIS was an agent for the European CurrencyUnit (ECU) Clearing and Settlement System ...Source: Bank for <strong>International</strong> Settlements, Fedpoints 22,Federal Reserve Bank of New York, 2004.Trade imbalancesWhile there have always been imbalances of trade,there has been a growing concern since the mid-1980s that trade imbalances have become largerand more persistent. For example, Figure 23.2shows the overall imbalances of trade for the UnitedStates and Japan. It shows growing US trade deficitswith persistent, although diminishing, tradesurpluses in Japan. Nothing seems to stop thetrade imbalances in the world’s two largest economies.All the automatic-adjustment mechanisms& 532we have described, whether they involves exchangerates, price levels, incomes or interest rates,seem incapable of narrowing the imbalances oftrade.Even when countries have balanced trade overall,bilateral surpluses and deficits are bound toexist. A surplus a country enjoys with one nationor region may be offset by a deficit with anothernation or region. For example, the United Statesmight have a deficit with Japan and China and anoffsetting surplus with South America. Similarly,
Deficit/surplus (US$ billions)2001000–100–200–300–400–50019651967USAJapanTHE INTERNATIONAL FINANCIAL SYSTEM196919711973197519771979198119831985198719891991199319951997Year19992001& Figure 23.2 US and Japanese trade balances, 1965–2002NotesThe US trade deficit has grown larger over the years while Japan’s trade surplus has persisted. In terms of the AbsorptionPrinciple, the United States is living above its means while Japan is living below its means.Source: United States Bureau of the Census, Washington DC, 2004, and Statistical Handbook of Japan, Bureau of theMinistry of Public Management. Tokyo, 2003.Japan’s surplus with the United States could offsetadeficit with South America or countries supplyingoil. All countries could, at least in principle, havebalanced trade. Nevertheless, substantial attentionhas been paid to particular bilateral imbalances,particularly those between the United Statesand Japan and the United States and China. 18Figure 23.3 shows that the bilateral imbalancewith Japan has persisted while that with China hasgrown very rapidly. The imbalances have been anirritant in US–Japan and US–China relations. Thedanger is that even though bilateral imbalances areinevitable, if they are perceived to result from18 See, for example, Alison Butler, ‘‘Trade Imbalances andEconomic Theory: The Case for a U.S.-Japan TradeDeficit,’’ Review, Federal Reserve Bank of St. Louis,March/April 1991, pp. 16-31.unfair trade practices they can prompt trade actionsthat interfere with the international flow of goodsand services.Environmental damage andinternational financeWhile the natural environment and internationalfinance might appear to be unconnected, the twomatters come together around the actions of animportant international financial institution, theWorld Bank. Also known as the <strong>International</strong>Bank for Reconstruction and Development,the World Bank has been assisting developingnations since its creation out of the Bretton Woodsagreement of 1944. Today, the World Bank raisesabout $20 billion per year that goes into helping533 &
THE INTERNATIONAL MACROECONOMIC ENVIRONMENT4020ChinaJapanDeficit/surplus (Billions US $)0–20–40–60–801985 1986 1987 1988 1989 1990 1991 1992 1993 1994 1995 1996 1997 1998 1999 2000 2001 2002 2003Year–100–120–140& Figure 23.3 US bilateral trade balance with China and Japan, 1985–2003NotesIn less than 20 years the US trade deficit with China has gone from close to zero to in excess of $100 billion. Indeed,by 2000 the US trade deficit with China exceeded the US trade deficit with Japan.Source: US Bureau of the Census, Washington DC, http://www.census.gov/foreign-trade/balance/c5700[/c5880].htmlfinance activities in poor countries. They also providepolicy advice and technical assistance. Despiteseveral attempts to incorporate environmentalconsiderations into World Bank lending policies, ithas been argued that the Bank has contributed toenvironmental and social damage on a massive scale.By funding dams that have flooded prime agriculturallands and ancient villages, and financinghighways into forests that have provided access tominers and farmers who have plundered the tropicalrain forests, the Bank has been accused of assistingwidespread global environmental destruction. 1919 For a scathing attack on World Bank lending practices, seeBruce Rich, Mortgaging the Earth, Beacon Press, Boston,MA, 1994. See, however, Exhibit 23.5 which argues thatinternational trade has, if anything, been good for theenvironment.& 534For example, in a 1993 internal review it was foundthat over 37 percent of recently evaluated projectsdid not even meet the Bank’s own social andenvironmental performance goals. 20 With increasingconcern over the environment we can expectmounting pressure on international institutions andnational governments to have ‘‘greener’’ lendingand/or trading practices. For example, embargoescould be placed on nonrenewable resources, just asthey have been on ivory and endangered animals.While thus far action against countries has beenlimited mostly to public-interest organizations, thestage is set for wider actions, some of which is likelyto involve official agencies.20 See Emily T. Smith ‘‘Is the World Bank a World Menace?’’Business Week, March 21, 1994.
THE INTERNATIONAL FINANCIAL SYSTEMEXHIBIT 23.5INTERNATIONAL TRADE AND THE ENVIRONMENTThe desire to attract foreign direct investment bymultinationals for their job creating and incomegenerating effects could, in principle, lower environmentalstandards. That is, there could be a ‘‘race tothe bottom.’’ On the other hand, if multinationalsimprove incomes where they invest and operate, localpeople may have a propensity to consume some oftheir extra income in the form of cleaner air andwater. That is, the effect of the activities of multinationalcorporations could contribute to a cleaneror to a dirtier environment. The following paragraphsprovide a summary of one study that has tried todetermine how globalization in the form of internationaltrade and investment has impacted on countries’air quality. Contrary to what is commonly believed, itwould appear from the study that globalization has, ifanything, been beneficial for the environment.Opponents of globalization claim that internationaltrade harms the environment. They believethat in open economies a ‘‘race to the bottom’’in environmental standards will result fromgovernments’ fears that enhanced environmentalregulation will hurt their international competitiveness.In ‘‘Is Trade Good or Bad forthe Environment: Sorting out the Causality’’ ...Jeffrey Frankel and Andrew Rose examine theenvironmental effects of openness to trade in astatistical cross-section of countries in 1995. Theyfind that the impact of trade on at least three kindsof air pollution appears to be, if anything, beneficial,not adverse, for a given level of income.Openness, measured as the ratio of trade toincome, appears to reduce air pollution. The levelof significance is high for Sulfur Dioxide (SO 2 ),and moderate for Particulate Matter and NitrogenOxides (NO x ).Correlations need not prove causation. Theobserved correlation between trade and pollutioncould arise in other ways. It is possible thatcountries that are more democratic tend to be bothmore open to trade and more responsive to environmentalconcerns. Also, higher levels of incomecan interact with trade and the environment in allsorts of ways. This paper tries to disentangle thecausality between trade and the environment byfirst testing for the effect of openness on theenvironment while controlling for income. Thenthe authors focus on exogenous variation in tradeattributable to geography (for example, distancefrom major trading partners), and on variationin income per capita attributable to standardgrowth determinants (for example population,investment and education).How could trade be good for the environment?Trade allows countries to attain more of what theywant, including environmental protection (theauthors call this proposition the gains-from-tradehypothesis). Trade might lead to internationalpressures to increase environmental standards, orto beneficial technology and managerial innovations.Multinational corporations tend to bringclean state-of-the-art production technologiesfrom higher-standard countries of origin to hostcountries where such standards are not yet known.Furthermore, trade economists believe that opennessto trade encourages continual innovation bothin technology and in management practice; suchinnovation likely will be applied to environmentalconcerns as well as to pure economic goals. Inother words, Frankel and Rose suggest, environmentalimprovements may well accompanyglobalization.Source: ‘‘Is Trade Good or Bad for the Environment?’’ asummary of Jeffrey Frankel and Andrew Rose, WorkingPaper No. 9201, National Bureau of Economic Research,Cambridge, MA, in The NBER Digest, November 2002.535 &
THE INTERNATIONAL MACROECONOMIC ENVIRONMENTDEGREE OF EXCHANGE-RATEFLEXIBILITY: FIXED VERSUSFLEXIBLE EXCHANGE RATESDuring the last century the pendulum has swungback and forth between fixed and flexible exchangerates. Rather than end this chapter by speculating onthe next experiment in international financialarrangements, let us list the pros and cons of flexibleversus fixed exchange rates. The arguments welist seem likely to circulate continuously as debatecontinues over the ‘‘ideal’’ system. It shouldbecome clear from the arguments we present thateither system has its weaknesses. The reader canreach her or his own judgment on whether we willmove towards more or less exchange-rate flexibilityfrom our current managed, or dirty float system.First, let us consider the arguments favoring flexibleexchange rates.Arguments favoring flexibleexchange rates 21Better adjustmentOne of the most important arguments for flexibleexchange rates is that they provide a less painfuladjustment mechanism to trade imbalances than dofixed exchange rates. For example, an incipientdeficit with flexible exchange rates will merelycause a decline in the foreign exchange value ofthe currency, rather than require a recession toreduce income or prices as fixed exchange rateswould. We should note, however, that the declinein the value of a nation’s currency still cures a tradedeficit by reducing real (price-level-adjusted)income and wages. A country’s products canbecome more competitive either by a reductionof local-currency prices or by a reduction in the21 The classic case for flexible exchange rates has been madeby Milton Friedman in ‘‘The Case for Flexible ExchangeRates,’’ in Essays in Positive Economics, University of ChicagoPress, Chicago, IL, 1953, and by Egon Sohmen in FlexibleExchange Rates: Theory and Controversy, University of ChicagoPress, Chicago, IL, 1969.& 536foreign exchange value of its currency. For politicaland social reasons it may be impractical to reducelocal-currency wages, so instead it may be necessaryto reduce the international value of the country’scurrency.We can see how a currency devaluation ordepreciation reduces real wages in two ways. First,it means more expensive imports and domesticallyproducedtradable goods, which raises the cost ofliving and thereby reduces the buying power ofgiven local wages. Second, when the wages orincomes of the workers in different countries areranked in terms of a common currency, the fall inthe value of a currency will mean that wages andincomes in that country fall vis-à-vis those in othercountries. It should hence be clear that a decline inthe value of a currency via flexible exchange rates isan alternative to a relative decline in local-currencywages and prices to correct payments deficits.The preference for flexible exchange rates on thegrounds of better adjustment is based on thepotential for averting adverse worker reaction byonly indirectly reducing real wages.Better confidenceIt is claimed as a corollary to better adjustment thatif flexible exchange rates prevent a country fromhaving large persistent deficits, then there will bemore confidence in the country and the internationalfinancial system. More confidence meansfewer attempts by individuals or central banks toreadjust currency portfolios, and this gives rise tocalmer foreign exchange markets.Better liquidityFlexible exchange rates do not require centralbanks to hold foreign exchange reserves, since thereis no need to intervene in the foreign exchangemarket. This means that the problem of havinginsufficient liquidity (international foreign exchangereserves) does not exist with truly flexible rates, andcompetitive devaluations aimed at securing a larger
THE INTERNATIONAL FINANCIAL SYSTEMshare of an inadequate total stock of reservesshould not take place.Gains from freer tradeWhen deficits occur with fixed exchange rates,tariffs and restrictions on the free flow of goodsand capital invariably abound. If, by maintainingexternal balance, flexible rates avoid the need forthese regulations which are costly to enforce, thenthe gains from trade and international investmentcan be enjoyed.Avoiding the so-called ‘‘peso problem’’During the 1980s and 1990s, Mexico fought to keepthe peso fixed to the US dollar despite widespreadopinion that it would eventually be forced todevalue. To discourage investors from withdrawingfunds from Mexico to avoid losses when the devaluationeventually occurred, the Mexican governmenthad to maintain high interest rates. These highrates were the indirect consequence of fixedexchange rates and stifled investment and jobcreation. Interest rates had to be kept high as longas a necessary devaluation was deferred. After thedevaluation happened, interest rates could return tonormal if the devaluation was successful in restoringan appropriate exchange rate. In such a circumstancefurther devaluation would be unlikely.Because of the situation where it was identified, theproblem of high interest rates due to the possibilityof a devaluation with fixed exchange rates hasbecome known as the peso problem.Increased independence of economic policy:optimum currency areasMaintaining a fixed exchange rate can force acountry to follow the same economic policy as itstrading partners. For example, as we have seen, ifthe United States allows a rapid growth in themoney supply, this will tend to push up US pricesand lower interest rates (in the short run), theformer causing a deficit or deterioration in thecurrent account and the latter causing a deficit ordeterioration in the capital account. If the Canadiandollar is fixed to the US dollar, the deficit in theUnited States will most likely mean a surplusin Canada. This will put upward pressure on theCanadian dollar, forcing the Bank of Canada tosell Canadian dollars to maintain the fixed exchangerate, and hence increase the Canadian money supply.We see that due to fixed exchange rates an increasein the US money supply causes an increase in theCanadian money supply. However, if exchangerates are flexible, all that will happen is thatthe value of the US dollar will depreciate against theCanadian dollar. 22The advantage of flexible rates in allowingindependent policy action has been put in a differentand intriguing way in the so-called optimumcurrency-areaargument, developed by RobertMundell and Ronald McKinnon. 23 A currencyarea is an area within which exchange rates arefixed. An optimum currency area is an area withinwhich exchange rates should be fixed. We canexplain what constitutes an optimum currency areaby considering the consequences of the adoption ofthe euro by twelve of the European Union countries.We can begin by asking what would happen ifone of the euro countries – let us consider Italy forthe purpose of discussion – suffers a fall in demandfor its exports with resultant high unemployment,22 For more on the theory and evidence of the linkagebetween the United States and other countries’ moneysupplies under fixed and flexible exchange rates see RichardG. Sheehan, ‘‘Does U.S. Money Growth DetermineMoney Growth in Other Nations?’’ Review, Federal ReserveBank of St. Louis, January 1987, pp. 5–14. For an alternativeview, see Edgar L. Feige and James M. Johannes, ‘‘Wasthe United States Responsible for Worldwide Inflationunder the Regime of Fixed Exchange Rates?’’ Kyklos, 1982,pp. 263–77.23 See Robert Mundell, ‘‘A Theory of Optimum CurrencyAreas,’’ American Economic Review, September 1961,pp. 657–65, and Ronald McKinnon, ‘‘Optimum CurrencyAreas,’’ American Economic Review, September 1963,pp. 717–25. See also Harry Johnson and AlexanderSwoboda (eds), Madrid Conference on Optimum CurrencyAreas, Harvard University Press, Cambridge, MA, 1973.537 &
THE INTERNATIONAL MACROECONOMIC ENVIRONMENTwhile the economies of the remainder of theEuro-zone countries continue to grow.In order to use monetary policy to offset the fallin demand and ease the unemployment in Italy, themonetary authorities would need to expand themoney supply. With the common currency, this canonly be done by the European Central Bank whichwould raise the Euro-zone’s money supply. Thiswould involve the risk of inflation in the Euro-zoneeconomies with full employment. We see that Italycannot have an independent monetary policy with acommon currency. If, however, Italy had still hadits own currency, then the money supply could havebeen expanded to take care of Italy’s unique problem.Moreover, even if the discretionary monetarypolicy action were not taken, having a separatecurrency with a flexible foreign exchange valuewould have meant that this adjustment would havebeen achieved automatically; the fall in demand forItalian exports would have lowered the externalvalue of the Italian lira, and the lower value wouldthen have stimulated export sales. In addition, alower lira encourages investors to build plants inItaly and take advantage of the cheap Italian wagesvis-à-vis wages elsewhere.The optimum-currency-area argument can betaken further. Why not have a separate currencywith a flexible exchange rate just for northern Italy?Then a fall in the demand for manufactured goods,produced largely in the north of Italy, would cause afall in the value of this hypothetical northern Italiancurrency, stimulating other industries to locate inthe same region. A separate currency would alsoallow discretionary policies to solve the economicdifficulties specific to the region. And if northernItaly, then why not Milan, or even parts of Milan?Extending the argument to the United States, whyshouldn’t there be a separate northeastern dollar ora separate northwestern dollar? Then if, for example,there is a fall in the demand for the lumber ofthe northwest, the northwestern dollar can declinein value, and other industries would be encouragedto move to the northwest. But what limits this?We can begin our answer by saying that there isno need to have a separate northwestern dollar if the& 538people in the northwest are prepared to move towhere opportunities are plentiful so that unemploymentdoes not occur. We need a separatecurrency for areas from which factors of productioncannot move or prefer not to move. This promptedRobert Mundell to argue that the optimum currencyarea is the ‘‘region.’’ A region is defined asan area within which factors of production aremobile and from which they are immobile. Mundellargued that if currency areas are smaller thanexisting countries, then there is considerableinconvenience in converting currencies, and there isexchange-rate risk in local business activity. Thisrisk might be difficult to avoid with forward contractsand the other usual risk-reducing devicesbecause the currency area is too small to supportforward, futures and options markets. That is, theoptimum currency area, like so many other things,is limited by the size of the market. In addition, thincurrency markets can experience monopolisticspeculation whereby powerful interests might try tomanipulate prices. Mundell therefore limited theoptimum currency area to something larger than anation. This makes the problem one of asking whichcountries should have a common currency, oralternatively, truly fixed exchange rates.Another factor affecting the extent of an optimumcurrency area is the degree to which economicactivity is correlated throughout the area. Forexample, if all of the European Union countriesfollowed the same business cycle, they could allhave a common currency without having locallyspecific problems from rigid exchange rates. Theywould all need easier or tighter monetary policy, orhigher or lower exchange rates, at the same time,meaning little or no conflicts on preferences foreconomic policy.Britain opted out of the first round of euroadoption, even though the country met the criteriaestablished in the Maastricht Agreement which wasdesigned to make countries converge in the sizes oftheir debts and deficits, and in their inflation rates.(Without similar conditions in these key dimensionsit would be very difficult or impossible to operatea common currency.) One reason is obviously
THE INTERNATIONAL FINANCIAL SYSTEMhistory, with great nostalgia for the pound, which inthe nineteenth century was the monarch of theworld’s monies. Another is the design to remainsovereign. But in terms of the optimum currencyarea argument, this decision could rationally bebased on a lack of factor mobility across the EnglishChannel, and the absence of a high correlation ofBritain’s business cycle with that of the Continent ofEurope. Some countries that did join the euro alsoviewed mobility as lacking due to language andcultural barriers. They also doubted the correlationthat would be needed for success. However, therewas a feeling that taking the brave step of adoptingthe common currency could itself bring about thenecessary conditions. That is, with a commoncurrency people are more likely to be mobile,changing jobs across national borders. The differenteconomies would also be more likely to movetogether in their business cycles.Finally, it should be mentioned that transfersbetween areas can reduce the harmful effects offixed exchange rates. Money can be paid to areassuffering from a high currency caused by strongdemand elsewhere in the area. 24The notion that the minimum feasible size ofa currency area is limited by the greater risk andinconvenience of smaller areas is closely relatedto one of the leading arguments against flexibleexchange rates: that they cause uncertainty andinhibit international trade. Let us begin withthis in our discussion of the negative side of theflexible-exchange-rate argument.the future exchange rate, they are more likely tostick to local markets. This means less enjoyment ofthe advantages of international trade and of overseasinvestments, and it is a burden on everyone.To counter this argument, a believer in a flexiblesystem can say the following:1 Flexible rates do not necessarily fluctuatewildly, and fixed rates do change – oftendramatically. 25 There have been numerouswell-publicized occasions when so-called fixedexchange rates have been changed by 25 percentor more. Many changes have taken place inthe fixed value of British pounds, Israelishekels, French francs, and Mexican pesos. Inaddition, there have been periods of relativestability of flexible exchange rates. Forexample, the Canadian dollar varied within arange of about 2 percent for a large part of the1970s.2 Even if flexible exchange rates are morevolatile than fixed exchange rates, there areseveral inexpensive ways of avoiding or reducinguncertainty due to unexpected changes inthem. For example, exporters can sell foreigncurrencyreceivables forward, and importerscan buy foreign-currency payables forward.Uncertainty can also be reduced with futurescontracts, currency options, and swaps.Furthermore, the cost of these uncertaintyreducingtechniques is typically small. 26Arguments against flexible exchange ratesFlexible rates cause uncertainty and inhibitinternational trade and investmentIt is claimed by proponents of fixed exchange ratesthat if exporters and importers are uncertain about24 Transfers between US states have helped the United Statesmaintain a common currency. See Jeffrey Sachs and XavierSala-i-Martin, ‘‘Fiscal Federalism and Optimum CurrencyAreas:EvidenceforEuropefromtheUnitedStates,’’NationalBureau of Economic Research, Working Paper 3855, 1991.Flexible rates cause destabilizing speculationAs mentioned earlier in this chapter in the contextof the highly charged volley of statements exchangedbetween George Soros and Prime MinisterMuhathir of Malaysia during the Asian financial25 Occasionally, proponents of fixed exchange rates refer toflexible rates as ‘‘fluctuating exchange rates.’’ There is nosuch thing as a system of fluctuating rates.26 There are, however, limits on the ability to hedgeexchange-rate risk, especially when tendering on overseascontracts. Such matters are discussed in Chapter 12.539 &
THE INTERNATIONAL MACROECONOMIC ENVIRONMENTAA DestabilizingspeculationWithoutspeculationSpot exchange rate S($/£)A B BB StabilizingspeculationTime, t& Figure 23.4 Stabilizing and destabilizing currency speculationNotesDestabilizing speculation occurs if variations in exchange rates are larger than they would otherwise be withoutspeculation. Profitable speculation involving buying low and selling high should, however, reduce variability.crisis, there are people who believe that speculatorscause wide swings in exchange rates. These swingsare attributed to the movement of ‘‘hot money.’’This expression is used because of the lightningspeed at which money can move in response tonews items. There are two counterarguments thatcan be made:1 To be destabilizing, speculators as a whole willhave to make losses. The argument goes likethis. To cause destabilization, speculators as awhole must buy a currency when the price ishigh to make it go higher than it would havegone, and sell when it is low to make it golower than it would have gone. In this waythe variations in exchange rates will be higherthan they would otherwise have been, as isillustrated in Figure 23.4. If the rate withoutspeculation would have followed the pathshown, then for speculators to make the ratevary by more than this, speculators as a wholemust be buying pounds when S($/£) is at A,making S($/£) rise to A 0 ; speculators mustsell when S($/£) is at B, making S($/£) fall& 540to B 0 ; and so on. But this means buying highand selling low, which is a sure recipe forlosses. If speculators as a whole are to make aprofit, they must sell pounds when S($/£) is atA, forcing S($/£) toward A 00 , and buy poundswhen S($/£) is at B, forcing S($/£) towardB 00 . 27 In this way speculators dampen variationsin exchange rates and stabilize the market. 282 Speculation with fixed exchange rates is destabilizing,and it can be profitable too. When a27 The fact that speculators as a whole lose money does notmean all speculators lose.28 It has been argued that if there is an imperfect signal thatdemand for a currency will be high in the next period,speculators may buy the currency even though they knowthe signal may not be correct. Then, if there is not anotherhigh-demand signal next period, speculators might selltheir currency holdings, pushing the exchange rate lowerthan it would have gone. This is claimed to be destabilizingand, it is argued, may also be profitable. See Oliver D. Hartand David M. Kreps, ‘‘Price Destabilizing Speculation,’’Journal of Political Economy, October 1986, pp. 927–52.For other special circumstances for which it is claimedthat destabilizing speculation can be profitable see RobertM. Stern, The Balance of Payments, Aldine, Chicago, IL, 1973.
THE INTERNATIONAL FINANCIAL SYSTEMcountry is running out of foreign exchangereserves, its currency is likely to be underselling pressure, with the exchange rate at itslower support point. When speculators seethis, they will sell the currency. Under fixedrates the central bank will purchase thecurrency sold by the speculators at the lowersupport price and use up foreign exchangereserves. This will make the shortage ofreserves even worse, causing other holders ofthe troubled currency to sell. This will furtherlower foreign exchange reserves and eventuallyforce the central bank to reset the rate at alower level. This is highly destabilizing speculation.It is also profitable for the speculatorswho make money at the expense of the centralbank, and thereby indirectly at the expense oftaxpayers. This is because the central bank isbuying before the price of the currency falls.With fixed exchange rates speculators know inwhich direction an exchange rate will move, if it isto move. For example, when the pound sterling waspegged to the Deutschemark within the EMS duringthe early 1990s, a revaluation of the pound versusthe mark was exceedingly unlikely. By sellingpounds the worst that could have happened to aspeculator was that the pound would not fall invalue. If there was to be a change in the exchangerate it would be a pound devaluation, and if thathappened, the speculator who shorted the poundwould profit. And so fixed-rate speculation isdestabilizing, and because it provides one-way bets,may be profitable for speculators (and costly forcentral banks and taxpayers).Flexible rates will not work forsmall open economiesAn argument against flexible exchange rates forcurrencies of small, open economies such asHong Kong has been made by a number of economists,including Robert Mundell. The argumentbegins by noting that a depreciation or devaluation ofcurrency will help the balance of trade if it reducesthe relative prices of locally produced goods andservices. However, a depreciation or devaluationwill raise prices of tradable goods. This will increasethe cost of living, which in turn will put upwardpressure on wages. If, for example, a 1-percentdepreciation or devaluation raises a country’s pricelevel by 1 percent, then if real wages are maintainednominal wages must rise by the amount of depreciationor devaluation. If wages rise 1 percent whenthe currency falls by 1 percent, the effects are offsetting,and changes in exchange rates, whether inflexible or pegged values, will be ineffective. In sucha case the country may as well fix the value of itscurrency to the currency of the country with whichit trades most extensively.Flexible rates are inflationaryRigid adherence to the gold standard involved aconstraint on monetary authorities. They had tokeep their money supplies and inflation undercontrol. It is claimed by proponents of fixed ratesthat the Bretton Woods and dollar standards alsoinvolved discipline, since inflation would eventuallyforce devaluation. This, it is said, motivated thecentral bank to keep inflation under control. On theother hand, according to this argument, flexibleexchange rates allow inflation to occur without anyeventual crisis. Therefore, there is less reason forgovernments to combat inflation.It has alternatively been argued that flexibleexchange rates have an inherent inflationary biasbecause depreciations increase prices of tradedgoods, but appreciations do not cause parallelreductions in prices. This argument is based ona ratchet effect that is avoided with fixed rates;with fixed rates there are fewer changes in exchangerates to be subject to a ratchet. However, theempirical evidence does not support the existence ofa ratchet. 29 Economists who believe that prices are29 Morris Goldstein, ‘‘Downward Price Inflexibility, RatchetEffect and the Inflationary Impact of Import PriceChanges,’’ Staff Papers, <strong>International</strong> Monetary Fund,November 1976, pp. 509–44.541 &
THE INTERNATIONAL MACROECONOMIC ENVIRONMENTrelated to the money supply are not surprised. Thisis because they believe that higher and higherprice levels resulting from fluctuations in exchangerates would cause an excess demand for moneythat would reduce spending unless the higherprices were accommodated by the central bankexpanding the money supply in line with higherprices.Flexible rates are unstable because ofsmall trade elasticitiesIf import demand or export supply elasticities aresmall, the foreign exchange market may be unstablein the sense that small disturbances to exchangerates can grow into large disturbances. 30 Instabilityis possible because, for example, a depreciationcan increase the value of imports by increasingimport prices more than it decreases the quantity ofimports. A depreciation can therefore increasethe currency supply more than it increases the valueof exports and currency demand. Consequently,depreciation can cause an excess supply of currency,further depreciation, and so on. If this is the case,and other factors influencing currency supply anddemand such as speculation do not limit themovements in exchange rates once they begin,the government might wish to limit exchangeratemovements itself by fixing exchange rates.Of course, then the country must depend onthe potentially painful price-level, income, andinterest-rate adjustment mechanisms of fixedexchange rates.Flexible rates can cause structuralunemploymentAfter the discovery and development of vastsupplies of natural gas off the Dutch coast, theDutch guilder appreciated substantially. This madetraditional Dutch exports expensive, causing30 This was shown in Chapter 6.unemployment in these industries. The gas industryis far less labor intensive than the traditionalDutch export industries making it difficult for thedisplaced workers to find alternative employment.This problem of structural unemployment due toexchange rate changes has become known as theDutch disease. 31We can see that there are valid arguments onboth sides of the ledger for fixed and flexibleexchange rates. For one thing, the appropriateexchange rate depends on the size of a country. Asmall country is likely to have low import elasticitiesof demand for imports because the possibilitiesof import substitution are very limited: a smallcountry is likely to have few industries in itsindustrial mix, so when foreign goods become moreexpensive after depreciation, there are limiteddomestic substitutes. Low import demand elasticities,as we have explained, contribute to unstableforeign exchange markets. In addition, a smalleconomy is likely to experience inflation afterdevaluation, undoing the trade improvement thatnormally accompanies currency depreciation. Thisexplains why most small, open countries have fixedexchange rates to the currency of their majortrading partner. In Europe, for example, several ofthe smaller states that are not in the Euro-zone havefixed their exchange rates to the euro.As far as the international financial system as awhole is concerned, in the absence of any approachthat dominates in every dimension, we can expect itto evolve in response to circumstances. Rising tradeimbalances could push the system towards flexibilitywhile increased volatility from politicalevents could push the system in the other direction.The compromise of the Louvre Accord in placesince 1987 might continue to serve us well, butjudging from the shifting systems of the twentiethcentury, further change seems likely.31 It has been argued that Britain suffered from the Dutchdisease too. See K. Alec Chrystal, ‘‘Dutch Disease ofMonetarist Medicine? The British Economy underMrs. Thatcher,’’ Review, Federal Reserve Bank ofSt. Louis, May 1984, pp. 27–37.& 542
THE INTERNATIONAL FINANCIAL SYSTEMSUMMARY1 The classical gold standard was in effect for the half century before the First WorldWar, and again during 1926–31. The guarantees by governments to convert papermoney to gold provided a credible commitment that inflationary policy would not bepursued.2 The 1930s were marked by ‘‘beggar-thy-neighbor’’ policies of competitive devaluations.During the Second World War there were controls on currency convertibility.3 The Bretton Woods system of 1944 was a response to the conditions between the wars.Exchange rates were fixed to gold or the US dollar, and the <strong>International</strong> MonetaryFund, IMF, was established to administer the system.4 The IMF still functions after having gone through many changes, but the BrettonWoods system ended in 1973 when many major countries moved to flexible exchangerates. It has been argued that the collapse of the gold-exchange standard wasinevitable because growing reserves required continuing US deficits that reduced theacceptability of US dollars as reserves.5 Exchange rates were flexible from 1973 to 1985, with only infrequent interventions bycentral banks to maintain order. After September 1985 and the Plaza Agreement actionwas taken to force down the dollar, and a dirty-float period began.6 An agreement to coordinate foreign exchange market intervention and domesticeconomic policies was reached in Paris in 1987. This became known as the LouvreAccord, and marked a change to cooperative intervention by the G-7 within impreciselyspecified target zones.7 The third-world debt crisis reached a head in the early 1980s, when several LatinAmerican borrowers were unable to meet scheduled payments. The causes of the crisisincluded worsening terms of trade of debtor nations, a rapid appreciation of the USdollar, high interest rates, and the use of debt for subsidizing consumption rather than forinvestment.8 The much-feared bank failures due to the debt crisis did not occur because internationalinstitutions and private banks cooperated to provide credits. This cooperation wasnecessary to prevent panic in an interdependent financial and economic environment.9 The Asian financial crisis was due to poor financial regulation, worsening terms of tradeand cronyism that resulted in poor project selection. The Argentine financial crisis wasdue to inadequate backing of the currency board.10 The global balance of economic power has shifted from US dominance to a more evendistribution of power between Europe, Japan, and the United States. Stability requirescooperation among these economic powers, helped by periodic economic summitmeetings.11 Trade imbalances have widened and been persistent since the 1980s raising the danger ofprotectionist policies.12 Environmental consequences of trade in, for example, lumber from rainforests, and oflarge-scale projects financed by the World Bank, have become, and are likely to remain,major issues in the international financial system.543 &
THE INTERNATIONAL MACROECONOMIC ENVIRONMENT13 Arguments for flexible rates include better adjustment to payments imbalances, betterconfidence, more adequate foreign exchange reserves, and increased economic policyindependence.14 The case against flexible exchange rates includes the argument that they causeuncertainty and thereby inhibit international trade. Counterarguments are that fixedrates, as they have worked in practice, have also been uncertain, and that forward, futuresand options contracts allow exporters and importers to avoid exchange risk at a low cost.15 Another argument against flexible rates is that they allow destabilizing speculation.However, this requires that speculators incur losses, and in any case, speculation withfixed rates is destabilizing as well as profitable.16 A valid argument against flexible rates is that they will not work for small economiesbecause wages are likely to be forced up along with prices of imports, offsetting the effectof depreciation, and that import demand elasticities are likely to be small due to lack ofimport substitution possibilities. Another argument is that flexible rates are inflationary.17 An optimum currency area is an area within which exchange rates ought to be fixed. Theoptimum-currency-area argument provides an alternative viewpoint with regard to thedebate on fixed versus flexible exchange rates.18 Having many small currency areas improves automatic adjustment and allows localmonetary policy to be tailored to local needs. However, it adds to uncertainty andintroduces costs of exchanging currencies in local trade. The optimum currency area isthe region, which is the area within which there is factor mobility. It is generally claimedthat this area is at least as large as a country.REVIEW QUESTIONS1 What role did commitment play in the successful functioning of the gold standard?2 What events helped shape the Bretton Woods system?3 How did the <strong>International</strong> Monetary Fund, IMF, help implement the Bretton Woodssystem?4 What are Special Drawing Rights?5 What is meant by ‘‘seigniorage?’’6 What is a ‘‘sovereign loan,’’ and what error did some bankers make when considering therisk of such loans?7 What factors contributed to the third-world debt crisis?8 How has economic power shifted in recent years?9 What type of bank is the Bank for <strong>International</strong> Settlements?10 What type of bank is the <strong>International</strong> Bank for Reconstruction and Development, orWorld Bank?11 What is the ‘‘peso problem?’’12 What is an ‘‘optimum currency area?’’13 What counterarguments can be made to the claim that flexible rates contribute touncertainty and thereby inhibit trade?14 What is the ‘‘Dutch disease?’’& 544
THE INTERNATIONAL FINANCIAL SYSTEMASSIGNMENT PROBLEMS1 How can government objectives such as the maintenance of full employment hinder thefunctioning of the gold standard? Would adjustment via income or via interest rates beinhibited in the same way?2 Why might historical patterns of prices show parallel movements between deficit andsurplus countries? Could gold discoveries and common movements in national incomescause this?3 In what ways did Bretton Woods require countries to sacrifice economic sovereignty forthe public good?4 Why can speculators make profits with less risk under fixed rates? From whom do theymake their profits?5 Assume that you are going to poll the following groups:a. Central Bankersb. Business executivesc. ConsumersHow do you think each group would weigh the arguments for and against flexible rates?What does each group have to gain or lose from more flexibility?6 Why do we observe deficits or surpluses under ‘‘flexible’’ rates? Does this tell ussomething of the management of the rates?7 Should Appalachia have its own currency? Under what conditions should the Hong Kongdollar be pegged to the Chinese yuan rather than the US dollar?8 Will revaluations or appreciations work for small, open economies? Why is thereasymmetry in the effect of revaluation and devaluation?9 Do you think that the collapse of the Bretton Woods system would have been less likelyhad surplus countries expanded their economies to ease the burden of adjustment on thecountries with deficits?10 How would you go about trying to estimate the seigniorage gains to the United States?(Hint: They depend on the quantity of US dollars held abroad, the competitive rate ofinterest that would be paid on these, and the actual rate of interest paid.)11 Why do you think some European countries maintained pegged exchange ratesafter the collapse of the Bretton Woods system? Relate your answer to optimumcurrency areas?12 Do you think that coastal China and western China should have separate currencies?13 Do you think North America should adopt a common currency?14 Why have central bankers frequently intervened in the foreign exchange market under asystem of flexible exchange rates? If they have managed to smooth out fluctuations, havethey made profits for their citizens?15 Which argument for fixed exchange rates do you think would be most compelling forFiji? (Hint: Fiji’s major ‘‘export’’ is tourism, and most manufacturers and otherconsumer goods are imported.)16 Do you think that problems might arise out of a difficulty for Americans to accept arelative decline in economic power? What form might these problems take?545 &
THE INTERNATIONAL MACROECONOMIC ENVIRONMENTBIBLIOGRAPHYAlogoskoufis, George S., ‘‘Monetary Accommodation, Exchange Rate Regimes and Inflation Persistence,’’Economic Journal, May 1992, pp. 461–80.Archer, Clive, <strong>International</strong> Organisations, Routledge, London, 2001.Bardo, Michael D., ‘‘The Gold Standard, Bretton Woods and Other Monetary Regimes: A Historical Appraisal,’’Review,Federal Reserve Bank of St. Louis, March/April 1993, pp. 123–99.—— and Barry Eichengreen (eds), A Retrospective on the Bretton Woods <strong>International</strong> Monetary System,University of Chicago Press, Chicago, IL, 1993.Bayoumi, Tamin and Barry Eichengreen, ‘‘Shocking Aspects of European Monetary Unification,’’ National Bureauof Economic Research, Working Paper 3949, January 1992.Berg, Andrew, and Eduardo Borensztein, Full Dollarization: The Pros and Cons, Economic Issues No. 24,<strong>International</strong> Monetary Fund, Washington, DC, December 2000.Black, Stanley W., ‘‘<strong>International</strong> Monetary Institutions,’’ New Palgrove Dictionary of Economics, Macmillan,London, 1987 pp. 665–73.Drysdale, Peter (ed.), Reform and Recovery in East Asia, Routledge, London, 2000.Dunn, Robert M. Jr and John H. Mutti, <strong>International</strong> Economics, 5th edn, Routledge, London, 2000.Feldstein, Martin, ‘‘The Case Against EMU,’’ The Economist, June 13, 1992, pp. 19–22.Friedman, Milton, ‘‘The Case for Flexibility Exchange Rates,’’ in Essays in Positive Economics, University ofChicago Press, Chicago, IL, 1953.Giavazzi, Francesco and Marc Pagano, ‘‘The Advantage of Tying One’s Hands: EMS Discipline and Central BankCredibility,’’ European Economic Review, June 1988, pp. 1055–75.Grubel, Herbert G., <strong>International</strong> Economics, Richard D. Irwin, Homewood, IL, 1977.Heller, H. Robert, <strong>International</strong> Monetary Economics, Prentice-Hall, Englewood Cliffs, NJ, 1974.Johnson, Harry G., ‘‘The Case for Flexible Exchange Rates, 1969,’’ in George N. Halm (ed.), Approaches toGreater Flexibility of Exchange Rates: The Burgenstock Papers, Princeton University Press, Princeton, NJ,1970; reprinted in Robert E. Baldwin and J. David Richardson, <strong>International</strong> Trade and <strong>Finance</strong>: Readings,Little-Brown, Boston, MA, 1974.McKinnon, Ronald I., ‘‘Optimum Currency Areas,’’ American Economic Review, September 1963, pp. 717–24.—— ‘‘The Rules of the Game: <strong>International</strong> Money in Historical Perspective,’’ Journal of Economic Literature,March 1993, pp. 1–44.Mundell, Robert A., <strong>International</strong> Economics, chapter 12, Macmillan, New York, 1968.Schardax, Franz, ‘‘An Early Warning Model for Currency Crises in Central and Eastern Europe,’’ UnpublishedThesis, Donau University, Krems, Austria, 2002.Sohmen, Egon, Flexible Exchange Rates: Theory and Controversy, rev. edn, University of Chicago Press, Chicago,IL, 1969.Willett, Thomas D. and Edward Tower, ‘‘The Concept of Optimum Currency Areas and the Choice Between Fixedand Flexible Exchange Rates,’’ in George N. Halm (ed.), Approaches to Greater Flexibility of ExchangeRates: The Burgenstock Papers, Princeton University Press, Princeton, NJ, 1970.Yeager, Leland B., <strong>International</strong> Monetary Relations: Theory, History and Policy, 2nd edn, Harper & Row,New York, 1976.& 546
Glossary80–20 subsidiary A specially established wholly owned company used to raise capital for a US-basedcorporation. The subsidiary must earn 80 percent or more of its income abroad. Up to 20 percent ofincome may be earned in the United States. 80–20 subsidiaries do not need to withhold tax (seewithholding tax) and therefore are useful for raising funds from foreigners who would not receivefull credit for tax withheld.absolute advantage A country has an absolute advantage in products it can produce at lower cost thanother countries. See comparative advantage.absolute form of the purchasing-power-parity condition The form of the purchasingpower-parityprinciple stated in terms of levels of prices and levels of exchange rates, rather than interms of inflation and changes in exchange rates. See relative form of the purchasing-powerparityprinciple.absorption approach Interpretation of the balance of trade in terms of the value of goods andservices produced and the value of goods and services ‘‘absorbed’’ by consumption, investment, orthe government. The absorption approach views the balance of payments from the perspectiveof the national-income accounting identity.accelerator model Theory which links the demand for capital goods to the level of GDP, and hencethe rate of investment in capital goods to the growth rate of the GDP.accept Willingness of a bank to guarantee a draft for payment of goods and services.acceptance draft Check or draft for which documents such as the bill of lading are delivered uponacceptance of the draft by the payee’s bank. See clean draft, documentary draft, and paymentdraft.accommodation Situation in which a central bank expands the money supply to prevent a reduction inspending after a jump in the price level, thereby supporting the higher price level.accounting exposure The amount of foreign exchange exposure reflected in a company’sfinancial statements.adjusted present value (APV) A technique for capital budgeting that is similar to net presentvalue but which considers difficult matters, if necessary, after dealing with easy-to-handlematters.administered prices Prices set by firms, often for internal purposes or to reduce taxes, not by themarket. See arm’s-length pricing.agency cost The cost that may be faced by shareholders, and perhaps also by the economy at large,when managers do not own the companies they manage. The cost occurs when managers pursue theirown interests instead of the interests of shareholders.547 &
GLOSSARYagglomeration economies Mutual benefits firms enjoy from being in the same location.agreement corporation A means for a US-based bank to engage in international banking. Can beestablished with permission of the Federal Reserve Board or a state government.air waybill The document issued by a carrier showing details of the merchandise being transported byair. See bill of lading.American Depository Receipts (ADRs) Claims issued against foreign shares and traded in the overthe-countermarket. ADRs are used so that the foreign shares can trade in their home market butnevertheless be sold in the United States.American options Options contracts that can be exercised on any date up to and including thematurity date of the option. See European options.appreciation An increase in the foreign exchange value of a currency when exchange rates areflexible. See depreciation, devaluation, and revaluation.arbitrage Simultaneously buying and selling for the purpose of profiting from price differences.arbitrager A person or institution engaging in arbitrage.arbitrage profit The profit from simultaneously buying and selling the same item.arm’s-length pricing Prices set according to proper market values. See administered prices andtransfer prices.Articles of Agreement (Bretton Woods) The principles signed at the Bretton Woods conferencewhich helped define the Bretton Woods system.Asian Crisis, 1997–98 Starting with the Thai bhat, several Asian currencies fell precipitously after debtpayments were missed. The crisis has been attributed to poor financial regulation, cronyism, andworsening terms of trade. The spread of crisis conditions from country to country has been calledcontagion.ask rate The price at which a bank or broker is willing to sell. See bid rate.asset approach to exchange rates A theory which emphasizes that monies are assets andtherefore have values according to what market participants think the monies will be worth in thefuture.Association of South East Asian Nations (ASEAN) The economic membership organizationbetween countries of South East Asia working towards tariff reductions and easier access of membersto each others’ markets. The ASEAN is less formalized and covers a narrower range of concerns thandoes the European Union or the North American Free Trade Agreement.at-the-money option An option with a strike price or exercise price equal to the current marketprice of the underlying asset. For example, an option on spot pounds is ‘‘at the money’’ if the US dollarstrike price equals the US dollar spot value of the pound. See in-the-money options and out-ofthe-moneyoptions.autarky Having no trade relations with other countries.autocorrelation The situation in which successive regression errors are systematically related, indicating,for example, that relevant variables may be missing from a regression equation. Also calledserial correlation, autocorrelation causes a bias towards finding that included variables aresignificant.automatic price-adjustment mechanism The built-in way that deficits and surpluses in thebalance-of-payments account are self-correcting via changes in countries’ price levels, with theprice-level changes caused by changes in money supplies. Money supplies are changed by central-bankresponses to balance-of-payments surpluses and deficits. See price-specie automaticadjustment mechanism.& 548
GLOSSARYavalled Guaranteed time drafts provided by an importer’s bank in association with forfaiting.balance-of-payments account A statistical record of the flow of payments into and out of a countryduring an interval of time. Provides a record of the sources of supply of and demand for a country’scurrency.balance-of-payments on capital account The difference between the value of a country’s assetssold to nonresidents and the value of assets bought from nonresidents during an interval of time.balance-of-payments on current account The balance on goods, services, and income, plusnet unilateral transfers.balance-of-payments deficit Usually applied to the decline in a country’s foreign exchange reserves.balance-of-payments surplus Usually applied to the increase in a country’s foreign exchangereserves.balance of trade A commonly used abbreviation for the balance on (merchandise) trade, and equalto merchandise exports minus merchandise imports.balance-of-trade deficit The extent to which the value of merchandise imports exceeds the valueof merchandise exports during an interval of time. See balance-of-trade surplus and balanceon (merchandise) trade.balance-of-trade surplus The extent to which the value of merchandise exports exceeds thevalue of merchandise imports during an interval of time. See balance-of-trade deficit andbalance on (merchandise) trade.balance on goods, services, and income The difference between the value of exports ofmerchandise, services, and investment income received from abroad and the value of importsof merchandise, services, and investment income paid abroad.balance on (merchandise) trade The difference between the value of merchandise exports andthe value of merchandise imports during an interval of time.bancor Name given by John Maynard Keynes to a proposed form of international money which was tobe used for international settlements.bank agency A bank’s operation in a foreign country which is like a full-fledged bank except that it doesnot handle retail deposits.bank draft A check issued by a bank promising to pay the stated amount of a currency. See draft andtime draft.banker’s acceptance A time draft which has been guaranteed by a bank stamping it as accepted sothat the draft can be sold at a bank-related discount rate, not at a rate related to the risk of the issuer ofthe draft.Bank for <strong>International</strong> Settlements (BIS) An organization of central bankers and bank regulators,located in Basle, Switzerland. The BIS is a ‘‘bank for central banks’’ and serves as a forum for centralbankers to discuss international banking regulatory standards and coordinate central-bank policies.bank note The paper currency of a nation, such as the US ‘‘greenback’’ or Bank of England papermoney. Bank notes are frequently referred to as ‘‘cash.’’bank-note wholesaler A company that buys currency in the form of bank notes from banks orcurrency dealers and sells the notes to other banks or currency dealers, usually in the home country ofthe currency.Basle Committee A bank-safety surveillance organization which provides information to bankregulators about the financial condition of banks and their subsidiaries.bearer shares Equities which are not registered in an owner’s name. This is the form of many equitiessold in the Euroequity market.549 &
GLOSSARYbeggar-thy-neighbor policy Policy of devaluation that attempts to help exporters and create jobsbut which hurts other countries whose exports compete with those of the devaluing country.Therefore, the policy shifts unemployment to other countries.bid rate The price which a bank or broker is willing to pay. See ask rate.bilateral trade Trade between two nations.bill of exchange A check used for payment between countries, that is, an intercountry form ofbank draft.bill of lading (B/L) Document issued by a shipper (or carrier) to show the details of merchandise thatis to be transported. The bill of lading can serve as title to the merchandise and is needed to obtain themerchandise when it arrives at its destination.bimetallic standard An exchange rate system in which exchange rates are faced by central banksexchanging their currencies for either of two precious metals, gold or silver.blocked funds Funds that cannot be repatriated.borrowing capacity The amount of debt a company feels it can carry on a new project, where the debtprovides a tax shield.branch A foreign office of a bank or other company that is domestically incorporated and integratedwith domestic operations. See foreign (bank) branch.Bretton Woods system The procedure for fixing exchange rates and managing the internationalfinancial system, worked out in Bretton Woods, New Hampshire, in 1944. The system involved fixingforeign currencies to the US dollar, and the US dollar to gold. The Bretton Woods system was in effectuntil the early 1970s. Also called the gold-exchange standard.brokers Agents who help arrange the trading of currencies between banks by assembling buy and sellorders and showing the inside spread, which is the lowest selling (ask) rate and highest buying(bid) rate.buyback agreements countertrade Where the seller of equipment agrees to buy some or all of theproducts made with the equipment.buyer credits Loans to buyers, especially importers, from banks. See supplier credits.call option Gives the buyer the right, but not the obligation, to buy an asset such as a foreign currencyat the stated strike price or exercise price. See put option.calling (margin) Situation in which a bank or broker demands that additional funds be placed in amargin account.canton Local area in Switzerland which collects taxes from residents and provides services.capital asset pricing model (CAPM) An economic model which gives the equilibrium expectedreturn on an asset or a portfolio of assets in terms of the risk-free interest rate and a risk premiumrepresenting the systematic risk of the asset or asset portfolio.capital budgeting A technique for deciding whether to incur capital expenditures such as building anew plant or purchasing equipment.capital gains tax A tax paid on the increase in value of an asset between its purchase and sale.capital market line The line tracing the expected returns and risks associated with different combinationsof a risk-free asset (treasury bills) and the market portfolio (the portfolio of all securitiesexisting in the market).capital rationing When it is not possible to pursue all investments which add value to a company sothat choices must be made among alternatives.capital structure The amount of debt versus equity in a firm’s financing.Cartagena Agreement, 1969 A free-trade agreement among South American countries.& 550
GLOSSARYcentral-bank swaps Arrangements between central banks for exchanging currency reserves to assist insupporting a country’s exchange rate, where reserve exchanges are reversed later.certificate of deposit (CD) A negotiable claim against a deposit at a bank.chaebol Consortium of Korean companies.CHIPS See Clearing House Interbank Payments System.clean draft A check providing payment without the need to present any other documents.clearing corporation A corporation that pairs orders to buy futures or options contracts with ordersto sell, and which guarantees all resulting two-sided contracts.clearing house An institution at which banks keep funds that can be moved from one bank’s account toanother bank’s account in order to settle interbank transactions.Clearing House Interbank Payments System (CHIPS) The clearing house used to settleinterbank transactions which arise from foreign exchange purchases and sales settled in US dollars.CHIPS is located in New York and is owned by its members.closed economy An economy without trade of goods or capital with other nations. The assumption ofa closed economy is used as a means of simplifying economic models.clusters Geographical areas that contain related and supporting industries.coefficient of variation A statistical measure of volatility consisting of the standard deviation dividedby the mean. Can be used to compare the volatility of exchange rates in different time periods.cointegration techniques Statistical procedures involving the comparison of the path followed by thedifference between two economic variables over time and the paths followed by the variablesthemselves.commercial drafts Post-dated checks issued by companies for sale in order to provide financing. Theyare sold at a discount in the money market.commitment fee A charge by a forfaiting bank for quoting a rate for accepting (buying) paymentsfrom an exporter.commodity arbitragers Those who attempt to profit from differences in prices in different locations,buying commodities where they are cheap and selling them where they are more expensive. Theiractions help bring about the law of one price.common currency Situation, as in the United States, where the same currency is used everywhere.The European Union has adopted a common currency; the euro.comparative advantage A relative efficiency in producing something, indicated by having a loweropportunity cost of one product versus another product that occurs in some other country. Countriesgain from international trade by producing products for which they have a comparative advantage. Seeabsolute advantage.compensation agreement countertrade In which some payment is in cash.competitive advantage A term coined by Michael Porter to reflect the edge a country enjoysfrom dynamic factors affecting international competitiveness. Factors contributing to a competitiveadvantage include well-motivated managers, discriminating and demanding consumers,and the existence of service and other supportive industries, as well as the necessary factorendowments.composite currency unit A unit formed by combining a number of different currencies. Examplesare Special Drawing Rights and the European Currency Unit. Composite currency units arealso called currency baskets and currency cocktails.concessionary financing Below market interest rates provided to companies for selecting a particularlocation. The low interest rates are used as an inducement to attract companies to a particular area.551 &
GLOSSARYConcordat Agreements 1975 and 1983 agreements for host countries to provide information to aparent bank’s home regulators when an overseas subsidiary of the parent bank is experiencing seriousloan losses.confirm (letter of credit) Occurs when an exporter obtains a guarantee from a local bank of a letterof credit issued by a foreign bank.confiscation The seizure of assets without compensation. See expropriation.consignment sales The basis of payment whereby the producer is paid by an intermediary only afterthe intermediary has sold the goods.consortium banks Joint ventures of large banks.constant returns to scale The situation where average cost of production remains the same when allfactors of production are varied in amount to produce more or less of a product. For this to occur,output must change in the same proportion as the inputs employed, and input prices must remainconstant. See increasing returns to scale.consumption function A relationship between consumption and the value of national income. Seemarginal propensity to consume.contagion The spread of financial crisis from country to country.continuous (export) insurance Insurance of credits granted by exporters where exporters do nothave to inform the insurer of each credit that is to be insured. Also called whole turnover androllover insurance.continuous linked settlement A procedure for banks to settle accounts between themselves thatcredits and debits accounts simultaneously. It is designed to reduce the chance of risk in the financialsystem.continuous market A market in which quotations of prices are continuously available.contractual assets or cash flows Assets or cash flows with a fixed face value. See noncontractualassets and contractual liabilities.contractual liabilities Payment obligations with a fixed face value. See contractual assets or cashflows, and noncontractual assets.cooperative intervention Situations whereby G-7 central banks work together to stabilize exchangerates. Agreement to cooperate reached in the Plaza Agreement, 1985, and effected after theLouvre Accord, 1987.corporate governance The structure in the corporate control system, particularly as it relates tothe integrity of the system of ownership and control.correspondents Banks which maintain accounts with each other against which checks can be drawn onbehalf of customers.counterpurchase countertrade In which the return exchange is delayed, or in which some otherparty is nominated to receive the return exchange.countertrade A reciprocal agreement for the exchange of goods or services.countervailing tariffs Taxes applied to offset measures that other countries have taken to make theirgoods artificially cheap, such as export subsidies or dumping.country risk Uncertainty surrounding payment from abroad or assets held abroad due to the possibilityof war, revolution, asset seizure, or other similar political, social, or economic event. See politicalrisk and sovereign risk.cover To take steps to isolate assets, liabilities, or income streams from the consequences of changes inexchange rates. See hedge.& 552
GLOSSARYcovered interest arbitrage Borrowing and investing with foreign exchange exposure hedgedin order to profit from differences in yields/borrowing costs on securities denominated in differentcurrencies.covered interest-parity condition The situation whereby, ceteris paribus, interest rates on differentcurrencies are equal when exchange-rate risk has been eliminated by the use of forward exchangecontracts.covered interest-parity principle An aspect of the law of one price that occurs in financialmarkets, namely, that if foreign exchange exposure is covered by a forward contract, yieldsand borrowing costs are the same irrespective of the currency of investment or borrowing. Takes theform of a mathematical condition that the difference between interest rates on different currencydenominatedsecurities equals the forward premium or discount between the currencies.covered margin The advantage, if any, from engaging in covered interest arbitrage.covered yield The return on an investment when the foreign exchange risk has been hedged.crawling peg An automatic system for revising the parity (par) exchange rate, typically basing the parvalue on recent experience of the actual exchange rate within its support points. The crawling pegallows exchange rates to move towards equilibrium levels in the long run while reducing fluctuations inthe short run.credit Short form of letter of credit.credit swap An exchange of currencies between a bank and a firm, with the exchange reversed at a laterdate. See parallel loan.cronyism Favoritism in the allocation of projects or financing. Said to be a possible factor in the AsianCrisis, 1997–98.cross forwards A forward contract between two currencies, neither of which is the US dollar.cross (exchange) rate An exchange rate between two currencies, neither of which is the US dollar.currency area An area, consisting of a country or set of countries, in which exchange rates are fixed.currency basket A unit of measurement for international transactions formed by combining a numberof different currencies, such as Special Drawing Rights and the European Currency Unit. Alsocalled a composite currency unit and a currency cocktail.currency center The central location where a multinational corporation manages cash flows.currency cocktail A unit of measurement for international transactions formed from a combination ofdifferent currencies, such as Special Drawing Rights and the European Currency Unit. Alsocalled a composite currency unit and a currency basket.currency futures Standardized contracts for the purchase or sale of foreign currencies that trade likeconventional commodity futures on the floor of a futures exchange. Unlike forward contracts,currency futures are for standardized amounts, they trade for a limited number of maturity dates,and gains or losses are settled every day between the contract holder and the futures exchange. Seemarking to market.currency option A contract which gives the buyer the opportunity, but not the obligation, to buy orsell at a pre-agreed price, the strike price or exercise price.currency per US dollar The method of quoting exchange rates as the amount of foreign currency perUS dollar. See US dollar equivalent and European terms.currency pool In Britain after the Exchange Control Act of 1947, those wishing to make foreigninvestments were required to buy foreign currency out of a pool of currencies. The amount in the poolwas limited by the British government.553 &
GLOSSARYcustoms union An association between countries in which tariffs are low or zero between membersof the association, and in which all members impose common tariff levels on outsiders. Seefree-trade area.debtors’ cartel Title given to a feared collusion of debtor countries collectively refusing to repay loans.debt-service exports Investment income earned from abroad during an interval of time. Seedebt-service imports.debt-service imports Investment income paid to nonresidents during an interval of time. Seedebt-service exports.decentralized, continuous, open-bid, double-auction market The organizational form of theinterbank market for foreign exchange. See decentralized market, open-bid market anddouble-auction market.decentralized market A market which does not have a centralized location but which instead involvesbuyers and sellers linked by telephone or similar means.defect To opt for a noncooperative action, usually involving cheating.deposit ratio The ratio of bank deposits to bank reserves.depreciation A decline in the foreign exchange value of a currency when exchange rates are flexible.See appreciation, devaluation, and revaluation.derivative A financial asset such as a futures or options contract, the value of which is derived from theclaim it makes against some underlying asset, such as a foreign currency.derivatives markets Markets in which assets whose values derive from underlying securities aretraded. Examples are options and future markets.Deutschemark (DM) The former currency of the united Germany, before being replaced by theeuro.devaluation A decline in the foreign exchange value of a currency on fixed exchange rates. It occurswhen the parity rate is set at a lower level. See appreciation, depreciation, and revaluation.direct investment Short version of foreign direct investment, which is overseas investment wherethe investor has a measure of control. For accounting purposes, control is defined as holding 10 percentor more of a company’s voting shares.direct taxes Taxes, such as income taxes, paid directly by the persons or companies taxed. Seeindirect tax.dirty float Occurs when governments attempt to influence exchange rates which are otherwiseflexible and allowed to float. Also called a managed float.discount rate The percentage interest rate used for converting future incomes and costs into current,or present, values. Usually set equal to the opportunity cost of funds, which is what shareholders couldotherwise earn on an alternative investment of equal risk.divergence indicator A mechanism based on the European Currency Unit for determining whichcountry is at fault for a currency being at the upper or lower support of its permissible range within theExchange Rate Mechanism of the European Monetary System.divest Selling off past investments.documentary credit A credit guarantee which requires that certain documents be presented beforesettlement. Letters of credit are documentary credits.documentary draft A check providing payment subject to certain documents being presentedand usually associated with a documentary credit. See acceptance draft, clean draft, andpayment draft.& 554
GLOSSARYdollarization The increased role of the US dollar outside the United States, with the dollar being usedto settle transactions. When the dollar replaces another country’s currency for all transactions it is fulldollarization. The term is also sometimes used to refer to the adoption of another country’scurrency when this is not the US dollar. For example, some countries in eastern Europe use the euro.dollar standard The exchange-rate system in effect during 1968–73 when foreign currencies werefixed to the US dollar as they were with the Bretton Woods system, but the US dollar was no longerfreely convertible into gold.domestic international-sales corporation (DISC) A device for encouraging US firms to export byoffering low corporate income tax rates. Since 1984, DISCs have largely been replaced by foreignsales corporations.domestic reporting currency The currency in which a firm reports its income and in which itproduces its financial statements. Usually the currency of the country in which a corporation’s headoffice is located.Dornbusch sticky-price theory Explanation advanced by Rudiger Dornbusch as to why exchangerates might overshoot. The theory emphasizes that because some goods’ prices change slowly,exchange rates must overadjust to keep the demands and supplies of monies in balance throughout theadjustment process.double-auction market A market in which the participants on both sides of a transaction could beeither buyers or sellers. For example, when two banks are in contact with each other about tradingcurrency, both banks may show prices at which they are willing to buy or sell.double-entry bookkeeping Accounting procedure in which every debit is matched by a creditelsewhere in the account.draft A check used for payment, also called a bill of exchange when the payment is betweencountries.dumping Selling goods or services abroad at a lower price than at home. Done to attract customersaway from local producers.Durbin–Watson statistic (D–W) A statistical measure indicating whether serial correlation ispresent in a regression equation.Dutch disease Problem associated with flexible exchange rates and originally identified after thediscovery of natural gas off the Dutch coast, and the associated appreciation of the Dutch guilder. Theincrease in the value of the guilder hurt traditional Dutch exporters and employment in the traditionalindustries.dynamic capital structure Systematic changes in the amount of debt versus equity in a firm’s idealcapital structure over time in response to changed circumstances of the firm.EC See European Community.economic exposure A more complete title for exposure, with the word ‘‘economic’’ added todistinguish true economic effects of exchange rates from effects which appear in financial statements.Effects in financial statements involve accounting exposure.economic risk An alternative title for exchange-rate risk, with the word ‘‘economic’’ added todistinguish true economic risk from risk that might be evident upon evaluation of financial statements.economy of scope Cost savings associated with the range of items being produced.Edge Act corporations A means by which US banks can engage in overseas investment banking.EEC See European Economic Community.efficient market A market in which prices reflect available information. See weak-form efficiency,semi-strong-form efficiency, and strong-form efficiency.555 &
GLOSSARYefficient markets form of the purchasing-power-parity principle The statement of thepurchasing-power-parity principle in terms of expected inflation in two countries and the expectedchange in the exchange rate between their currencies. Also called the expectations form of thepurchasing-power-parity principle.efficient portfolio A collection of assets, the amounts of which are designed to have maximumexpected return for a given volatility, or minimum volatility for a given expected return.envelope (of efficient portfolios) The upward-sloping part of the curve giving the best combinationsof expected return and risk that can be achieved with different portfolios.equity home bias puzzle The strong tendency of people to hold a disproportionate fraction of theirequity portfolio in their own country’s companies. It is a puzzle because the bias occurs even whenthere are no obvious barriers to foreign investment.escrow account An account which a bank holds at a clearing house for settling interbanktransactions.EU See European Union.euro The new common currency used by many countries in the European Union, and which hascompletely replaced the countries’ previous currencies.Eurobond A bond denominated in a currency that is not that of the country in which it is issued; oftensold in several countries simultaneously. See foreign bond and Eurodollar bond.Eurocurrency deposits Deposits at financial institutions denominated in currencies other than thoseof the countries in which the deposits are located. A generalization of Eurodollar deposits.Eurocurrency multiplier The multiple by which Eurocurrency deposits increase from an originalincrease in foreign exchange reserves.Eurodollar bond A US-dollar-denominated bond sold outside of the United States. A particular typeof Eurobond.Eurodollar deposit A US-dollar-denominated bank deposit at a financial institution located outside theUnited States. See Eurocurrency deposits.Eurodollar market The market outside of the United States in which US-dollar-denominated loans aremade and in which US dollars are deposited in financial institutions.Eurodollars A commonly used abbreviation for funds held in the form of Eurodollar deposits.Euroequity (issues) Shares sold simultaneously in two or more countries’ stock markets.European Central Bank The central bank of the European Union countries.European Community (EC) The successor of the European Economic Community andpredecessor of the European Union.European Currency Unit (ECU) An artificial unit defined as a weighted average of each of theEuropean Monetary System currencies and used as a divergence indicator as well as fordenominating loans.European Economic Community (EEC) The association of European countries which limited itsactivities largely to economic matters, mainly tariffs and trade conditions, and which became theEuropean Community and eventually the European Union as its domain of interest expandedbeyond economic concerns.European Monetary Cooperation Fund (EMCF) A central pool of money and source of help,advice, and policy coordination for the members of the European Monetary System.European Monetary System (EMS) The procedure involving the Exchange Rate Mechanismfor fixing exchange rates among the European Union countries. The EMS was intended to be aprecursor to a common currency.& 556
GLOSSARYEuropean options Options contracts that can be exercised only on the maturity date of the option andnot before this date. See American options.European terms The quotation of exchange rates as the amount of foreign currency per US dollar. SeeUS dollar equivalent and currency per US dollar.European Union (EU) The association of countries formerly called the European Community(EC), and prior to that known as the European Economic Community (EEC). The EEC becamethe EC when the issues handled in common moved from solely economic matters to social and politicalmatters. The EC became the EU when common tariff levels were applied by all members to outsidecountries. The EU is a customs union.Eurosterling bond A British-pound-denominated bond sold outside of Britain.even-dated contracts Standard-length forward contracts with, for example, 3-month maturity,1-year maturity, etc.event study A statistical approach examining the situation before, after, and at the same time somethinghappens. The purpose is to check if conditions are normal or unusual surrounding the event.Exchange Rate Mechanism (ERM) The procedure used for fixing exchange rates within theEuropean Monetary System from 1979 to 1993. The ERM involved establishing a grid whichprovided upper and lower support points for each member’s currency versus each other member’scurrency. When an exchange rate between two currencies approached a support point, the centralbanks of both countries were required to take action. Assistance to maintain exchange rates was alsoavailable from the European Monetary Cooperation Fund.exchange-rate risk The variance of the domestic-currency value of an asset or liability attributable tounanticipated changes in exchange rates.excise tax Another word for a tariff. A tax on imports, usually based on value, ad valorem or on weight.exercise price The price at which an options contract buyer has the right to purchase or sell. See strikeprice and currency option.expectations form of the purchasing-power-parity principle The form of the purchasingpower-parityprinciple stated in terms of the expected inflation in two countries and the expectedchange in exchange rate between the countries’ currencies. Also called the efficient markets formof the purchasing-power-parity principle.Export Credit Insurance Insurance coverage providing compensation to exporters in the event theyare not paid for products they have delivered.Export-Import (Ex-Im) Bank US export promotion agency which guarantees loans by private banksto US exporting firms.export insurance Guarantee of payment to an exporter when credit has been extended to a foreignbuyer.export subsidy An action designed to make a country’s exports artificially inexpensive.exposure A commonly used abbreviation for foreign exchange exposure.exposure line A plot of the systematic relationship between changes in values of assets or liabilities andunanticipated changes in exchange rates.expropriation The seizure of assets with compensation. See confiscation.FAS 8 The now-abandoned reporting system of the US Financial Accounting Standard Board whichrequired companies to show all foreign exchange translation gains or losses in the current-periodincome statement. Replaced by FAS 52.FAS 52 The reporting system of the US Financial Accounting Standards Board which replaced FAS 8 andwhich allows companies to include foreign exchange translation gains and losses in a separate557 &
GLOSSARYshareholder-equity account. This reduces income volatility and allows income tax to be deferred ontranslation gains.FASB Financial Accounting Standards Board that helps to establish and improve standards of financialaccounting and reporting.Fedwire A way of making payments or transferring money very quickly in the United States, whichavoids the usual delays of debiting and crediting accounts.fiat money Money, the acceptability of which is required by an order or edict of government. Papermoney is fiat money.filter A selection rule for decision making.financial engineering A technique that uses payoff profiles to show the consequences of differentfinancial strategies. The profiles can be combined to show the outcomes of different strategies.financial structure Composition of capital raised by a firm – for example, the mix between debt andequity.Fisher equation An equation which states that interest rates observed in the market consist of the realinterest rate plus the expected rate of inflation.Fisher-open condition The mathematical condition that real interest rates are equal in differentcountries.fixed asset As asset such as real estate or plant and equipment. Fixed assets are often called real assets.fixed exchange rates A system of exchange-rate determination in which governments try to maintainexchange rates at selected official levels. See flexible exchange rates, floating exchange rates,and pegged exchange rates.flat The situation where the forward exchange rate equals the spot exchange rate.flexible exchange rates A system of exchange rates in which exchange rates are determined by theforces of supply and demand without any interference by governments or official bodies. See fixedexchange rates, floating exchange rates, and pegged exchange rates.floating exchange rates Another way of referring to flexible exchange rates.flow Value per period of time. See stock.foreign (bank) affiliate Similar to a foreign (bank) subsidiary in being locally incorporated andmanaged, but a foreign (bank) affiliate is a joint venture in which no individual owner has control.foreign (bank) branch A bank similar to local banks in appearance and operations except thatincorporation and ownership are in the parent bank’s country. Operations of foreign branches areintegrated with those of the parent bank.foreign (bank) subsidiary Locally incorporated bank owned completely or partially by a foreignparent.foreign bond A bond sold by a foreign issuer and denominated in the currency of the country of issue.For example, a US-dollar-denominated bond of a Canadian firm issued in the United States is a foreignbond. See Eurobond.foreign direct investment (FDI) Investment in a foreign country in which the investor has a measureof control of the investment, usually taken as holding 10 percent or more of voting shares of a publiccompany. See direct investment.foreign exchange exposure The sensitivity of changes in the real domestic-currency value of assetsor liabilities to unanticipated changes in exchange rates. Exposure can be measured by the slope of aregression equation which relates changes in values of assets or liabilities to unanticipated changesin exchange rates.foreign exchange market (forex) The market in which foreign currencies are traded.& 558
GLOSSARYforeign-pay bond A bond denominated in a foreign currency.foreign resident withholding tax A tax applied to nonresidents at the source of their earnings. Seewithholding tax credit.foreign sales corporation (FSC) A device made available in 1984 for promoting US exports byoffering low corporate tax rates to companies primarily engaged in exporting. Replaced domesticinternational-sales corporations.foreign-trade income The income of a foreign sales corporation that is subject to a preferredtax rate.forex A contraction of ‘‘foreign exchange.’’forfaiting A form of medium-term nonrecourse export financing. Involves a series of avalled timedrafts.forward bias A systematic difference between the forward exchange rate and the expected futurespot exchange rate.forward discount The situation when the price of a currency for forward delivery is lower than thecurrent spot exchange rate. It indicates that the market expects the currency to fall in value in thefuture. Countries with currencies which trade at a forward discount tend to have relatively high interestrates to compensate for the expected loss of holding the currency. See forward premium.forward (exchange) contract An agreement to exchange currencies at a specified exchange rate on afuture date. See outright forward contract.forward exchange market The market within which forward exchange contracts are traded. Theparticipants are primarily banks.forward exchange rate The rate that is contracted today for the exchange of currencies at a specifieddate in the future. See forward contract.forward-forward swap Purchase/sale of a currency offset by a subsequent sale/purchase of the samecurrency, where both transactions are forward transactions.forward premium The extent that the forward price of a currency exceeds the spot price. Seeforward discount.Four Tigers The rapid-growth economies of South East Asia: Hong Kong, Singapore, Taiwan, andSouth Korea.free-trade agreement An official agreement between countries that their goods move betweenthemselves without tariffs or quotas. See free-trade area.free-trade area An area within which trade between members is not subject to tariffs or quotas.However, member countries can have their own tariff levels against outsiders. On the other hand acustoms union has free trade between members and common tariffs to outsiders. This means thatin a free-trade area foreign goods cannot move freely between members, whereas in a customs unionthey can.free-trade zone An area within a country in which import tariffs are not paid. Often used as a devicefor reexporting products.full dollarization The complete adoption of the US dollar in place of a county’s own currency.functional currency The primary currency in which a subsidiary operates. This is the currency in whicha subsidiary reports its income; such reporting may involve translating foreign-currency amounts intothe functional currency. US parent companies convert functional currency magnitudes into US dollars.futures contract A standardized agreement to buy or sell a given amount of a commodity or financialasset, including currencies, at a given date in the future.futures exchange The exchange where futures contracts are traded.559 &
GLOSSARYfutures option An option to buy a futures contract at a stated price. See spot option.G-7 See Group of Seven.game theory The paradigm that views actions in terms of each player’s or agent’s expectation aboutthe actions of other players or agents.GATT See General Agreement on Tariffs and Trade.General Agreement on Tariffs and Trade (GATT) A multicountry framework dating back to the1940s to restrict tariffs and other impediments to international trade. Replaced by the World TradeOrganization in 1995.General Arrangements to Borrow 1990 extension of the <strong>International</strong> Monetary Fund’slending authority to permit loans to nonmember countries.global custodians Financial firms, typically banks, which hold and handle transactions involvingsecurities on behalf of overseas owners of these securities.globalization The movement from local, segmented markets to multinational, integrated markets.gold-exchange standard Also known as the Bretton Woods system, the gold-exchange standardinvolved fixing exchange rates of foreign currencies to the US dollar, and the US dollar to gold. Thegold-exchange standard was in effect from 1944 to 1968, after which time it became the dollarstandard.gold points The upper and lower limits on the range within which exchange rates can move whencurrencies are fixed to gold. The size of the range within the gold points depends on the costs ofshipping gold and of exchanging currencies for gold. See lower gold point and upper gold point.gold standard The system of fixing exchange rates between currencies by fixing the price of thecurrencies to gold. The gold standard lasted well into the twentieth century.gold tranche The part of the original contributions that countries made to the <strong>International</strong>Monetary Fund (IMF) that took the form of gold and against which IMF members could borrowwithout conditions.grid The matrix of upper and lower support points of the exchange rates among the EuropeanMonetary System currencies.Group of Seven (G-7) Consists of government leaders from the United States, Japan, Germany,Britain, France, Canada, and Italy. Holds ‘‘summit’’ meetings at least once each year to discusseconomic matters of mutual interest. Russian leaders are invited as observers, resulting in reference togroup G-8.hedge The action of reducing or eliminating effects from, for example, changes in exchange rates. Seecover.hedged yield The yield on a foreign investment after foreign exchange risk has been removed.home-country bias Holding a disproportionately large fraction of domestic assets vis-à-vis anefficiently diversified international asset portfolio.hot money Short-term funds which move easily between countries or currencies in response to smallchanges in interest rates.IMF See <strong>International</strong> Monetary Fund.imperfect competition The situation in which there are a large number of firms with free entry intoand out of an industry but different firms’ products are not exactly the same.import duty A tax or tariff on imported products.import quota A limit on the quantity of a good that can be imported.import substitutes Goods or services produced at home that may be purchased instead of similarforeign goods or services.& 560
GLOSSARYincreasing returns to scale The situation where average cost of production decreases when inputs ofall factors of production are increased to produce more of a product. For this to occur, output mustincrease by a greater proportion than the inputs employed. See constant returns to scale.indirect barriers Factors, such as difficulties in obtaining information on foreign firms, that causecapital markets to be segmented.indirect tax A tax which is ultimately paid by somebody other than the person or firm being taxed. Forexample, a sales tax is remitted by a firm, but if the tax is fully added to the amount paid by theconsumer, it is actually paid by the consumer, not the firm.industrial offset countertrade Involving reciprocal agreements to buy materials or componentsfrom the buying company or country.inflation risk The result of uncertainty in the buying power of an asset in the future due to uncertaintyabout the future price level.inside spread The lowest selling (ask) price and the highest buying (bid) price on the books of abroker. These are the best prices available, constituting the smallest difference between buying andselling prices.integrated international capital market Situation when the connection between countries’ capitalmarkets is seamless. Occurs when markets are not segmented.interbank Between banks. Term used to distinguish the part of the foreign exchange market in whichbanks deal directly with each other from the part involving brokers.interbank market The currency market in which banks trade with each other over the telephone or viaother electronic means. Central banks as well as commercial banks trade currencies in the interbankmarket.interest arbitrage Simultaneously borrowing and lending for the purpose of gaining from (covered)interest rate differences.interest-rate adjustment mechanism Automatic tendency for deficits and surpluses in thebalance-of-payments account to be self-correcting under fixed exchange rates, and operatingvia changes in interest rates. For example, deficits cause declines in money supplies, higher interestrates, and improvements in the balance of payments on capital account and the balance ofpayments on current account.internal rate of return The discount rate that makes the net present value equal zero.<strong>International</strong> Bank for Reconstruction and Development (IBRD) Also known as the WorldBank, the IBRD assists developing nations by granting loans and providing economic advice. Origindates to the start of the Bretton Woods system.international banking facilities (IBFs) Adjunct operations of US banks which raise funds and makeloans outside the United States but which operate in the United States without having to meet normalregulatory requirements of US banks.international capital asset pricing model (ICAPM) An extension of the capital asset pricingmodel to the international context.<strong>International</strong> Development Agency (IDA) An organization (affiliated with the World Bank) thatprovides very long-term loans at a zero interest rate to poor countries.<strong>International</strong> <strong>Finance</strong> Corporation (IFC) An organization (affiliated with the World Bank) thatprovides loans for private investments and sometimes takes equity positions along with private-sectorpartners.<strong>International</strong> Monetary Fund (IMF) Membership organization of over 180 countries, originallyestablished as part of the Bretton Woods system in 1944. The IMF holds foreign exchange reserves561 &
GLOSSARYof members, makes loans, provides assistance and advice, and serves as a forum for discussion ofimportant international financial issues.international-investment-position account The record of a country’s foreign assets and itsliabilities to nonresidents.in-the-money option An option which, if exercised immediately, would provide the holder ofthe option with some value. For example, a call option on spot pounds is ‘‘in the money’’ if the spotvalue of the pound is above the strike price. See intrinsic value, out-of-the-money option,and at-the-money option.intrinsic value The extent to which an option is in the money See time value.investment banks Institutions which raise funds in capital markets and then provide financing, oftenin the form of equity. Edge Act corporations are established by US commercial banks to engage ininvestment banking.invisibles Service imports and exports including tourism, royalties, licences, consulting fees, andbusiness services.J-curve (effect) The path of the balance of trade over time after a change in exchange rates. Thepath of the balance of trade after a devaluation may have the appearance of the letter J.joint venture Shared ownership of an investment, instituted because of need for a large amount ofcapital or to reduce the risk of confiscation or expropriation.keiretsu Consortium of Japanese companies.Kennedy round General tariff reductions arranged by the General Agreement on Tariffs andTrade in the 1960s.law of one price The rule resulting from actions of arbitragers that a given item will cost the sameeverywhere, whether this be a commodity or a financial asset. The law of one price means that prices ofthe same item in different currencies reflect the exchange rates between the currencies. See coveredinterest-parity condition and purchasing-power-parity principle.leading and lagging The practice of netting receivables and payables over a period of time forward,called leading, and backward, called lagging.‘‘leaning against the wind’’ The practice of some central banks to try to reduce fluctuations in thevalue of their currency by raising interest rates to prevent depreciations and lowering interest rates toprevent appreciations.letter of credit (L/C) An irrevocable guarantee from a bank that a seller’s credit to a buyer will behonored provided the seller fulfils her or his part of a specified agreement, such as the delivery of goodson time and in good condition. Also called a credit.limit orders Orders given to brokers to buy or sell limited, specified amounts of currency at specifiedprices on behalf of clients.liquidity preference The value asset holders attach to being able to cash in assets cheaply and at apredictable value. Liquidity preference may induce investors to hold domestic- currency assets insteadof hedged foreign-currency assets.liquidity trap Situation where increasing the money supply does not reduce interest rates.London Interbank Offer Rate (LIBOR) Interest rate charged on interbank loans in London. Theaverage of rates charged by large, London banks on a given currency is often used as the basis foradjusting interest rates on floating-rate loans.long Having agreed to buy more of a currency than one has agreed to sell. Alternatively, holding more ofa currency than is needed. See short, long position, and short position.& 562
GLOSSARYlong exposure Situation when, for example, a company or individual gains when the foreign exchangevalue of a currency increases. See short exposure.long position Having contracted to buy a currency on the forward market or on a futuresexchange. See long, short, short position.Louvre Accord An agreement reached at the Louvre Museum in Paris in 1987 for the leading industrialpowers to cooperate in stabilizing exchange rates. The Louvre Accord followed the Plaza Agreement,which accepted the need to periodically intervene in foreign exchange markets.lower gold point The lowest possible value of an exchange rate when currencies are fixed to gold. Seegold points and upper gold point.Maastricht Agreement An agreement between European Union countries, signed in Maastricht,Holland, to work towards common economic, social, and political policies, including achievement ofa common currency.maintenance level The minimum amount in a margin account below which the account must besupplemented by buyers and sellers of futures or options contracts.managed float Flexible-exchange-rate System in which central banks occasionally intervene in theforeign exchange markets to prevent extreme changes in exchange rates. Also called a dirty float.margin Money posted at a brokerage house, bank, or clearing corporation to help ensure that contractsare honored.marginal efficiency of investment The rate of return enjoyed on an additional, or incremental,investment. It is the return from increasing the amount of capital formation during a given interval bya small amount.marginal propensity to consume The percent of extra, or incremental, income spent onconsumption, representing the slope of the consumption function.marginal propensity to import The percentage of extra, or incremental, income spent on imports.marginal utility The increase in utility, or satisfaction, from a small, incremental increase in the rate ofconsumption.market-makers Agents who continuously stand ready to buy and to sell assets, including currencies.marking to market Adjustment of margin accounts to reflect daily changes in the values of contractsagainst which margins are held.marking-to-marking risk Risk from variability in interest rates on funds in a margin account. Risk isdue to a possible difference between funds in a margin account and the gain or loss on an asset orliability.Marshall–Lerner condition The requirement concerning the elasticities of demand for imports andexports in order for foreign exchange markets to be stable. Named after the co-discoverers of thecondition, Alfred Marshall and Abba Lerner.maturity date The date of expiry of a bond, option, or forward contract.Mercantilists Adherents to the view that the objective of international trade is to earn gold and runbalance-of-trade surpluses. Mercantilism was popular from the sixteenth century to the eighteenthcentury.merchandise exports Sales of tangible items to foreign buyers.merchandise imports Purchases of tangible items from abroad.merchandise trade Imports and exports of tangible items, as distinct from services.mixed credits A procedure used to calculate an interest rate for credit provided to an importer, wherethe interest rate is an average of rates on different credit sources.563 &
GLOSSARYmonetary theory of exchange rates The theory that bases the value of a country’s currency inforeign exchange markets on the supply of that currency (money supply) relative to the demand to holdthe currency (money demand).money market The market in which short-term borrowing and investment occur (with ‘‘short term’’usually meaning less than one year).moral hazard The tendency of people to behave in ways that are in their self interest and against theinterest of others. Used in the context of insurance, where people are less careful after they insure.most favored nation (clause) The clause in the General Agreement on Tariffs and Trade whichdisallowed offering better trade terms to any country than those terms given to the most favoredcountry.multicurrency bond A bond which gives the owner repayment in two or more currencies. Also calleda currency cocktail bond. See unit-of-account bond.multinational corporation A company which has made direct investments overseas and whichthereby has operations in many countries.multiple regression equation The fitted relationship between three or more variables. Seeregression equation.multiplier The change in the national income relative to the size of the underlying, original cause of thischange.NAFTA See North American Free Trade Agreement.Nash equilibrium The situation in game theory where expectations of different players areconsistent and where the expectations are borne out.national-income accounting identity A statement of national income divided into four components:consumption, investment, government spending, and exports minus imports.natural monopoly A situation in which a supplier faces a declining average cost over a very largerange of output relative to market demand, and thereby becomes the sole supplier of a good orservice.negative externalities Adverse effects of others of an activity.net present value (NPV) The income from a capital project minus the cost of the project stated interms of the current (or present) value of the income and project cost. A technique for capitalbudgeting. See adjusted present value and internal rate of return.netting Calculating the overall situation for payables and receivables in a currency that faces a firm.Amounts to be paid are subtracted from amounts to be received so that hedging can be limited to thenet amount of the currency coming in or going out. See leading and lagging.neutralization policy A policy of not allowing changes in foreign exchange reserves to affect acountry’s money supply, frustrating the automatic price-adjustment mechanism. Also calledsterilization policy.nominal anchor Something linked to the money supply, such as gold, which serves to maintain a stableprice level.nominal interest rate The interest rate observed in the market. See real interest rate.noncontractual assets Assets without a fixed face value, such as real estate or equities. Seecontractual assets and contractual liabilities.noncontractual liabilities Liabilities without a fixed face value.nondeliverable forward contracts Forward exchange agreements where only the differencebetween the forward price and the realized price is settled in a deeply traded currency. These types ofcontracts are used when currency delivery is difficult.& 564
GLOSSARYnontariff trade barriers Restrictions on imports, such as size restrictions and red tape, that interferewith international trade. Nontariff barriers are often less obvious but just as harmful as explicit importrestrictions such as tariffs and quotas.North American Free Trade Agreement (NAFTA) The 1993 treaty between the United States,Canada, and Mexico containing provisions for the reduction or elimination of trade barriers betweenthe countries. In late 1994, Chile signed its intent to join the NAFTA.OECD See Organization for Economic Cooperation and Development.offer rate Price or exchange rate at which there is a willingness to sell. Also called ask rate.offshore currencies Bank deposits which are denominated in a currency different from that of thecountry in which the deposits are held. A generalization of Eurodollar deposits.one-way arbitrage The process of choosing the best way to exchange one currency for another orchoosing the best currency in which to invest or borrow. See arbitrage, round-trip arbitrage, andtriangular arbitrage.open account (sales) The basis of sales where the amount due is added to the buyer’s account, and thebalance owed is settled periodically. A payment method used when the seller trusts the buyer’s credit.open-bid market A market in which participants quote both buying (bid) and selling (ask) prices.open economy An economy with trade of goods and capital with other nations. See closed economy.open interest The number of outstanding two-sided futures or options contracts at any given time.operating exposure The sensitivity of changes in the real domestic-currency value of operatingincomes to unanticipated changes in exchange rates. Also called residual foreign exchangeexposure.operating risk Related to the volatility of real domestic-currency operating incomes due to unanticipatedchanges in exchange rates. Usually measured by the variance in operating incomes fromunanticipated changes in exchange rates.optimum currency area An area within which exchange rates should be fixed. Coverage of areadepends on the mobility of factors of production and the similarity of the economies of componentcountries. See region.option premium The amount paid per unit of foreign currency, when buying an options contract.order bill of lading A bill of lading which gives title (ownership) of goods that are being shipped toa stated party and which may be used as collateral against loans.Organization for Economic Cooperation and Development (OECD) A Paris-based governmentlevelorganization providing information and advice on the economies of its 24 member nations, whichinclude the United States and most of Western Europe.out-of-the-money option An option which, if exercised immediately, would not provide the holderwith any value. For example, a call option on spot pounds is ‘‘out of the money’’ if the spot value ofthe pound is below the strike price. See in-the-money option and at-the-money option.outright forward contract An agreement to exchange currencies at an agreed exchange rate at afuture date. See swap.Overseas Private Investment Corporation (OPIC) Insures US private investments in developingnations.overshooting of exchange rates The situation whereby exchange-rate changes are larger in the shortrun than in the long run. Occurs when exchange rates go beyond their eventual equilibrium level. SeeDornbusch sticky-price theory.over-the-counter (OTC) option An option sold by a bank to a customers as opposed to the type ofstandardized option that trades on an options exchange.565 &
GLOSSARYparallel loan An exchange of funds between firms in different countries, with the exchange reversed ata later date. See credit swap.parity (exchange rate) The officially determined exchange rate under fixed exchange rates.payback period The length of time before the capital cost of an investment project has been recovered.payment draft Check or draft for which documents such as the bill of lading are delivered uponpayment of the draft by the payee’s bank. See acceptance draft and clean draft.payoff profile A plot of the gains or losses on an asset against unexpected changes in price. Forexample, a forward exchange contract payoff profile shows the gains or losses on the forward contractagainst unexpected changes in the spot exchange rate.pegged exchange rates Another term for fixed exchange rates, which are rates set bygovernments at selected, official levels.perfectly competitive market A market in which there are so many buyers and sellers that eachbuyer and seller can take the price of a given, homogeneous product as given. Also involves free entryand exit of new firms and perfect information on prices.perfectly substitutable (monies) The situation in which people are equally prepared to hold onecountry’s currency as to hold that of another country.permanent A change in an economic variable that persists, such as a long-lasting increase in income oran exchange rate. See transitory.peso problem Problem of having high interest rates when there is a possibility of a devaluation, withinterest rates remaining high while the devaluation is delayed.Plaza Agreement An agreement among the G-7 leaders reached at the Plaza Hotel in New York in1985 that accepted the need to intervene in foreign exchange markets. Led to the Louvre Accord of1987 which involved cooperative intervention.point The last digit in traditional exchange rate quotations.political risk Uncertainty surrounding payment from abroad or assets held abroad because of politicalevents. A special case of country risk, which includes economic and socially based uncertainty aswell as political uncertainty.pooling The practice of holding (and managing) cash in a single location.portfolio-balance approach to exchange rates A theory basing exchange rates on the supply ofand demand for money and bonds. The situation for money/bond supply and demand in one countryversus another country determines the exchange rate between the two countries currencies. Peopleare assumed to hold both countries’ money and bonds but prefer to hold their own. Exchange rates aresuch that all money and bonds are held.portfolio investment Investment in bonds, and in equities where the investor’s holding is too small toprovide effective control.positive externalities Benefits or cost savings enjoyed by others which are in addition to benefits orcost savings of those taking an action.price-specie automatic-adjustment mechanism The built-in way that deficits and surpluses areself-correcting via movements of precious metals between countries and consequent changes in moneysupplies and price levels. The gold standard is said to exhibit the price-specie automatic-adjustmentmechanism.Private Export Funding Corporation (PEFCO) A private US organization providing loans to USexporters.probability distribution The relationship between possible outcomes and their probability ofoccurrence.& 566
GLOSSARYproduct life-cycle hypothesis Theory that companies follow a similar evolutionary path, going fromdomestic to multinational orientation.public good Something that nonpayers cannot be excluded from enjoying.purchasing-power-parity (PPP) principle The idea that exchange rates are determined by theamounts of different currencies required to purchase a representative bundle of goods.pure exchange gain That part of the overall gain from trade which arises from the exchange ofproducts without any specialization of production.put-call (forward) parity A procedure for pricing European options based on arbitrage.put option A put option gives the buyer the right to sell an asset such as a foreign currency at the statedstrike price or exercise price. See call option.quantity theory of money The view that inflation is caused by money supply growth being in excessof the growth rate of output.quasi-centralized market A market in which brokers in several different locations help to facilitatetransactions.quasi-centralized, continuous limit-book, single-auction market A market in which brokersin several locations take limit orders and show the resulting inside spread occurring at any time toprospective clients.quota (import) A restriction on the quantity of a good that can be imported.ratchet effect Effect attributed to flexible exchange rates concerning the impact they have oninflation. The ratchet refers to jumps in prices from depreciations without fully offsetting declines inprices during appreciations.rational forecasts Forecasts which are on average correct and which do not reveal persistent errors.real asset An asset such as real estate for which the market price tends to go up and down with inflation.Sometimes called fixed assets.real change in exchange rates A change that produces a difference between the overall rate of returnon domestic versus foreign assets/liabilities or in the profitability of export-oriented, import-using, orimport-competing firms.real interest rate The nominal interest rate minus expected inflation.reference currency The official currency of measurement of values of assets, liabilities, or operatingincomes.regime A period during which a particular policy, for example, towards regulating exchange rates,is in effect.region Term used by Robert Mundell to describe an optimum currency area, being an area withinwhich factors of production are mobile and from which they are not mobile.regression coefficient An estimate of the magnitude of the impact of a variable on some othervariable. An element of a regression equation.regression equation A statistically calculated relationship between two or more variables. Seemultiple regression equation.regression error The difference between the actual value of a variable and the value predicted froma regression equation.relative (or dynamic) form of the purchasing-power-parity principle The form ofthe purchasing-power-parity principle stated in terms of inflation and changes inexchange rates: a country’s currency depreciates by the excess of its inflation over that ofanother country. See absolute form of the purchasing-power-parity condition (orprinciple).567 &
GLOSSARYrelative-price risk Risk due to the possibility of changes in the price of an individual asset vis-à-vis assetprices in general.repatriation Bringing funds home from abroad.representative (bank) office An office maintained by a bank in a foreign country to facilitate contactwith local banks and businesses and to provide services for clients.rescheduling Arranging for delay in the repayment of interest or principal on loans. Occurred frequentlyduring the third-world debt crisis.residual foreign exchange exposure Another term for operating exposure which reflects thedifficulty companies have hedging their operating exposure.revaluation An increase in the foreign exchange value of a currency on fixed exchange rates. Itoccurs when the parity rate is set at a higher level. See appreciation, depreciation, anddevaluation.reversion to the mean A tendency for above and below average values of variables to eventually moveback to their average when they deviate from the average.risk premium (forward) The difference between the forward exchange rate and the expectedfuture spot foreign exchange rate.rollover (swap) A swap where the purchase/sale and subsequent sale/purchase of a currency areseparated by 1 business day.rollover export insurance Where sellers do not have to inform the insurer of each credit that is to beinsured. Also called continuous and whole-turnover insurance.round-trip (triangular) arbitrage Borrowing in one currency, lending in another, and thenselling the second currency back into the first so as to end up back in the first currency. See arbitrage,one-way arbitrage, and triangular arbitrage.scenario approach The consideration of how exchange rates might impact a company by calculatingwhat would happen to key magnitudes from different possible increases and decreases of exchange rates.segmented international capital market Situation where different countries’ capital markets arenot integrated because of implicit or explicit factors inhibiting the free movement of capital betweenthe countries.seigniorage The profit from creating money. Said to have occurred from the need for countries to holdUS dollar foreign exchange reserves under the Bretton Woods system.semi-strong-form efficiency The situation where all publicly available information is reflected inmarket prices. See efficient market, weak-form efficiency, and strong-form efficiency.serial correlation A situation in which successive regression errors are systematically related,indicating, for example, that relevant variables may be missing from a regression equation. Alsocalled autocorrelation.short Having agreed to sell more of a currency than one has agreed to purchase. Alternately, holding lessof a currency than is needed. See long, long position, and short position.short exposure Situation where, for example, a company or individual faces a loss when the foreignexchange value of a currency increases. See long exposure.short position Having contracted to sell a currency on the forward market or on a futures exchange.sight draft A draft payable not on some stated future date, as with a time draft, but rather payable onpresentation to the issuing bank. It can be cashed immediately.signal An action which indicates credibility to others. Credibility is usually achieved by taking an actionwhich is costly and which therefore would not be taken unless the agent was in the situation implied bythe signal.& 568
GLOSSARYsingle-auction market A market where the agent being approached, but not the person making theapproach, quotes buying and selling prices.Smithsonian Agreement Agreement of <strong>International</strong> Monetary Fund members reached inDecember 1971 to raise the US dollar price of gold and to create a wider band within whichexchange rates could float before central bank intervention.snake The fixed-exchange-rate system designed to keep the European Community (EC)countries’ exchange rates with a narrower band vis-à-vis each other’s currencies rather than vis-à-visnon-EC currencies, such as the US dollar.Society for Worldwide <strong>International</strong> Financial Telecommunications (SWIFT) Satellitebasedinternational communications system for the exchange of information between banks, used, forexample, to convey instructions for the transfer of deposits.sourcing A hedging technique involving the invoicing of input prices and other cost items in thecurrency of sales.sovereign loans Loans to governments or guaranteed by governments.sovereign risk Uncertainty involving loans to foreign governments or government agencies.Special Drawing Rights (SDRs) Reserves at, and created by, the <strong>International</strong> Monetary Fund(IMF) and allocated by making ledger entries in countries’ accounts at the IMF. Used for meetingimbalances in the balance of payments and assisting developing nations.specific (commodities) export credit insurance Export insurance for a particular stated item.speculation Taking an exposed position, consciously or unconsciously.spot exchange rate The exchange rate between two currencies where the exchange is to occur‘‘immediately,’’ meaning usually the next business day or after 2 business days.spot foreign exchange market The market in which currencies are traded and where delivery is‘‘immediate,’’ meaning usually the next business day or after 2 business days.spot option An option to buy or sell spot exchange. See futures option.spread The difference between the buying (bid) and selling (ask) prices of a currency, or the differencebetween borrowing and lending interest rates.stationary The situation where the process, or statistical model, generating data is not changingover time.statistical discrepancy The adjustment required to balance the balance-of-payments account due toerrors in the measurement of items included in the account.sterilization policy A policy of not allowing changes in foreign exchange reserves to affect a country’smoney supply, frustrating the automatic price-adjustment mechanism. Also calledneutralization policy.sterling Another name for the British pound, written as £.stock Value or quantity at a point in time. See flow.straddle The purchase of a put option and a call option at the same strike price. Used as a meansof speculating on high volatility.strike price The price at which an option can be exercised. For example, the exchange rate at which acall option buyer can purchase a foreign currency. See currency option and exercise price.strong-form efficiency The situation where all information, including that available to insiders, isreflected in market prices. See efficient market, weak-form efficiency, and semi-strong-formefficiency.subsidiary A foreign operation that is incorporated in the foreign country but owned by a parent company.supplier credits Financing provided by the seller, usually by issuing time drafts.569 &
GLOSSARYsupply-side economics An economic philosophy popular after the 1980 US presidential election,based on the view that production (supply) in the economy would be increased by lower tax rates.support points The upper and lower limits of an exchange rate band at which central banks step in toprevent the exchange rate from going outside the band. Central banks buy at the lower support pointand sell at the upper support point in a fixed-exchange-rate system.swap (currency) A sale/purchase of a currency combined with an offsetting purchase/sale for a latertime, or borrowing and lending in the same currency. The initial purchase/sale might be aspot transaction, with the offsetting sale/purchase being a forward transaction. This is a spotforwardswap. However there are also forward-forward swaps involving offsetting purchases andsales where all transactions occur in the future. See outright forward contract, swap-in, andswap-out.swap-in Term used to indicate the currency being purchased and subsequently sold in a swaptransaction. See swap-out.swap-out Term used to indicate the currency being sold and subsequently bought back in a swaptransaction. See swap-in.swap points The number of points to be added to or subtracted from the spot exchange rate in orderto calculate the forward exchange rate.SWIFT See Society for Worldwide <strong>International</strong> Financial Telecommunications.switch trading countertrade Where a title to a credit is transferred to another party.symbiotic relationship Connection of mutual benefit, for example, between firms which movetogether into a foreign market.systematic relationship Situation where two variables change in more or less predictable waysvis-à-vis each other. For example, if on average dollar values of assets go up with the foreign exchangevalue of the dollar, there is a (positive) systematic relationship.systematic risk The part of risk that cannot be diversified away.target zone The range within which an exchange rate is to be kept.tariff A tax on imports. See excise tax.tax arbitrage Attempt to profit from pricing or interest rate situations due to the existence of taxes.For example, borrowing in one currency and investing in another currency which is at a forwardpremium. This can be profitable when forward (exchange) premiums face a low capital gainstax rate.tax haven A country with low tax rates that attracts companies or individuals fleeing higher tax rateselsewhere.tax shield Tax saving due to the deductibility of interest payments from income subject to tax.technical forecasts Forecasts of a variable based on the pattern of past values of the variable.temporal distinction Different accounting treatment of operating income and expenses than of fixedassets and liabilities.tenor The maturity of a time draft or usance draft.term structure The pattern of interest rates or forward rates of different maturities. How the rates onaverage vary with maturity.terms of trade The price of exports in terms of imports determining the amount of imports a countrycan receive per unit of exports. An improvement in terms of trade occurs when a country can obtainmore imports per unit of its exports.thinness A market is thin when the volume of transaction is low, that is, when transactions are relativelyinfrequent.& 570
GLOSSARYthird-world debt crisis Serious concern in financial markets during 1982–89 that developing nationswould be unable to meet scheduled payments on loans from developed-country-based banks. Seerescheduling.tick The minimum price change on a futures or options contract.time draft A check, or draft, payable at a future date and used as a form of credit. Also called a usancedraft.time value The part of an option premium that comes from the possibility that an option mighthave higher intrinsic value in the future than at the moment.Tokyo round General tariff reductions arranged by the General Agreement on Tariffs and Tradein the 1970s.tradable inputs Inputs that are traded internationally or could be traded internationally.trade draft An exporter’s draft that is drawn without an importer’s letter of credit and which istherefore a commercial rather than a bank obligation.trading pit The floor of an exchange where traders callout prices and make transactions.transaction cost The amount paid in brokerage or similar charges when making a transaction. Oncurrencies, transaction costs are represented by the spread between the bid and ask exchange rates.transaction exposure The sensitivity of changes in realized domestic-currency values of assets orliabilities when assets or liabilities are liquidated with respect to unanticipated changes in exchange rates.transaction risk The uncertainty of realized domestic-currency asset or liability values when the assetsor liabilities are liquidated due to unanticipated changes in exchange rates.transfer prices Prices used for goods and services moving within a multinational corporation fromone division to another. Rules typically require that transfer prices be arm’s-length prices.transitory A change in an economic variable that is short-lived, such as a once-and-for-all increase inincome or an exchange rate. See permanent.translated value The value of an asset, liability, or income after it has been converted into another currency.For example, the value of a foreign-currency asset converted into the owner’s domestic currency.translation Conversion of the value of an asset, liability, or income from one currency to another.translation exposure The sensitivity of changes in real domestic-currency asset or liability valuesappearing in financial statements with respect to unanticipated changes in exchange rates.translation risk The uncertainty appearing in financial statements due to unanticipated changes inexchange rates.transnational alliance Separately owned corporations from different countries working in cooperationfor such purposes as research and development or marketing.triangular arbitrage Simultaneously buying and selling for the purpose of profiting from differencesbetween cross rates and direct exchange rates vis-à-vis the US dollar. Such arbitrage involves threecurrencies and transactions.Triffin Paradox Problem that for the Bretton Woods system to succeed the United States must run atrade deficit to provide dollars, but by running deficits the system would eventually collapse.US dollar equivalent The quotation of the price of a currency in terms of its value in US dollars. SeeEuropean terms and currency per US dollar.US official reserve assets Liquid foreign assets held by the US Federal Reserve or Department of theTreasury. Includes gold, foreign currencies, and short-term investments.uncovered interest-parity condition The situation, analogous to the covered interest-paritycondition, in which foreign exchange exposure is not covered with a forward (exchange)contract. Takes the form of a mathematical condition that the difference between interest rates on571 &
GLOSSARYdifferent currency-denominated securities equals the expected rate of change of the exchange ratebetween the two currencies.unilateral transfers Payments from one country to another in the form of gifts and foreign aid.unit-of-account bond A bond making payments based on pre-established fixed exchange rates.upper gold point The highest possible value of an exchange rate when currencies are fixed to gold. Seegold points and lower gold point.Uruguay round General tariff reductions agreed to in 1994 resulting from many years of negotiationcentered in Uruguay and under the auspices the General Agreement on Tariffs and Trade.usance draft Another term for a time draft. A check payable at a future date and used as a form ofsupplier credit.value-added tax (VAT) A tax on the difference between the amount received from the sale of an itemand the cost of acquiring or making it.value date The date on which currency is to be received. See maturity date.vector auto regression A statistical technique which selects variables and combinations of variablesfor inclusion in a regression equation according to how strong a statistical relationship theyprovide.waybill (air) Another term for bill of lading, used particularly for goods being transported by aircargo or courier.weak-form efficiency The situation when information only on historical prices or returns ona particular asset are reflected in market prices. See efficient market, semi-strong-formefficiency, and strong-form efficiency.weighted average cost of capital The per annum cost of funds raised via debt (bank borrowing,bonds) and equity (selling shares), where the two items are weighted by their relative importance.whole turnover insurance Export insurance where sellers do not have to inform the insurer ofeach credit that is to be insured. Also called continuous and rollover insurance.wider band A compromise between fixed and flexible exchange rates which allows exchange rates tofluctuate by a relatively large amount on either side of an official value. Tried during 1971–73 afterapproval by <strong>International</strong> Monetary Fund members as part of the Smithsonian Agreement.wire transfer The movement of money with instructions being sent by electronic means, such as viaSWIFT.withholding tax A tax applied to nonresidents at the source of their earnings. See withholding taxcredit.withholding tax credit Allowance made for taxes withheld by foreign governments in order to avoiddouble taxation.World Bank Also known as the <strong>International</strong> Bank for Reconstruction and Development,the World Bank assists developing nations by granting loans and providing economic advice. Origindates back to the early 1940s.World Trade Organization (WTO) The World Trade Organization took over from the GeneralAgreement on Tariffs and Trade in 1995. The WTO’s objective is to expand international tradeand resolve trade disputes.writer (option) The person selling an option, who must stand ready to buy (when selling a putoption) or to sell (when selling a call option).Yankee bond A bond denominated in US dollars, issued in the United States by foreign banks andcorporations.& 572
Name indexAbler, Ronald 4Abuaf, Niso 150Adler, Michael 192, 201, 204, 333, 337, 349Aggarwal, Raj 291Agmon, Tamir 338Alexander, Gordon J. 338Aliber, Robert Z. 171, 180, 378Allen, Helen 299Allyannis, George 204Amihud, Yakov 203, 209–10, 314, 347Auerbach, Alan 367Babbel, David 81Bachetta, Phillippe 26Back, Leonard A. 449Backus, David K. 134Baillie, Richard T. 286Barro, Robert J. 515Baum, L. Frank 492Baxter, Marianne 335Beedles, W. L. 338Betton, Sandra 152Bhargava, Rahul 402Bigman, David 300Bilson, John 209–10Black, Fischer 71, 79, 105, 171Black, Stanley W. 49Bleichroader, Arnhold 298Bleichroader, S. 298Blejer, Mario 149, 152Blomstrom, Magnus 392Boothe, Lawrence D. 350Boothe, Paul 300Bordo, Michael D. 498, 515, 517, 521–2Bradley, David 389Brander, James A. 22Brealey, Richard 25, 349, 353Brennan, Michael J. 25Brewer, H. L. 338Briggs, Dick 451Bryan, William Jennings 492Bussard, Willis A. 458Butler, Alison 22, 533Butler, Samuel 216Carroll, Lewis 373Carter, E. Eugene 378Cassell, Gustav 143Cavaglia, Stefano 288Caves, Richard E. 375, 378Chacholiades, Miltiades 138Chiang, Thomas C. 289Chinn, Menzie 297Chowdhry, Bhagwan 411Chrystal, K. Alec 22, 111, 436, 542Clinton, Kevin 179Connix, Raymond G. 60Cooper, Ian 335Cooper, Richard 489, 490Cornell, Bradford 286, 473Corrigan, E. Gerald 438Coughlin, Cletus C. 22Cox, John C. 80Curtin, Donald 455Cyert, Richard M. 378Deardorff, Alan V. 178Delors, Jacques 527Demirgue-Kunt, Asli 401Deravi, Keivan 291DeRosa, Dean A. 379Devereux, Michael B. 401Dimson, Elroy 10Dooley, Michael 300Dornbusch, Rudiger 479–82, 490, 555Dufey, Gunter 424, 429573 &
NAME INDEXDumas, Bernard 192, 201, 204, 333, 337Dunn, Robert M. Jr 483Dunning, John H. 375, 379, 411Eaker, Mark R. 311Eaton, Jonathan 522Edwards, Burt 451Edwards, Sebastian 291Eichenbaum, Martin 292Eichengreen, Barry 515, 522Einzig, Paul 60Errunza, Vihang R. 380Esar, Evan 159, 307Eun, Cheol S. 328–9, 338Evans, Charles 292Evans, Martin D. 291Fama, Eugene F. 286Farrell, Victoria S. 379Fehr, David 322Feige, Edgar L. 537Feldstein, Martin 26Fenati, Alessandro 338Fields, Paige 402Fisher, Irving 171Flood, Mark D. 34, 36, 40, 61Flood, Robert P. 288–9Folks, William R. Jr 150, 404, 405Follpracht, Josef 404, 405Frankel, Jeffrey A. 49, 286, 288, 296–7, 299,355, 483, 535Fraser, Donald 402French, Kenneth R. 339Frenkel, Jacob A. 150–1, 286, 290–1, 474, 482Friedman, Milton 536Froot, Kenneth 207, 286, 288, 296, 297, 299, 483Garman, Mark B. 79de Gaulle, Charles 491Gautier, Antoine 312Genberg, Hans 149Gersovitz, Mark 522Giddy, Ian H. 414, 424, 429Giovannini, Alberto 515Girton, Lance 483Glassman, Debra A. 335Goldberg, Michael A. 436Goldstein, Morris 540Goodman, Stephen H. 293–6Gordon, David B. 515Grabbe, J. Orlin 79Graham, Edward M. 378Granot, Frieda 312Grant, Dwight 311Grauer, F. L. A. 171Gregorowicz, Philip 291Grennes, Thomas 287, 290Grilli, Vittorio U. 515Grossman, Gene M. 22Grubel, Herbert G. 491Gultekin, Mustafa N. 338Gultekin, N. Bulent 338Hakkio, Craig S. 153, 291Hanke, Steve 526Hansen, Lars P. 286Hardouvelis, Gikas A. 291, 473Harris, David 383Harris, Richard G. 292, 483Hart, Oliver D. 540Hassett, Kevin 367Hawkins, Robert 387Head, Keith 379Hegji, Charles E. 291Heilperin, Michael 491Heinkel, Robert L. 436Hekman, Christine R. 192Helpman, Elhanan 22Helsley, Robert W. 436Hennart, Jean-Francis 459Heston, Alan 151Heston, Steven 326Hewson, John 429, 431Hillman, Ayre 152Hines, James R. Jr 411Hipple, F. Steb 13Hirschleifer, Jack 382Hodgson, John 150Hodrick, Robert J. 286Hogan, Ken 291Horne, James C. Van 349Howson, John 431Hsieh, David A. 286Hughes, John S. 339Hume, David 489Hunt, H. L. 97Husted, Steven 153Ihrig, Jane 204Isard, Peter 148Jacobs, Rodney L. 286Jacquillat, Bertrand 338Janakiramanan, S. 338& 574
NAME INDEXJanelle, Donald 4Jermann, Urban J. 335Johannes, James M. 537Johnson, Harry G. 286, 482, 537Jorion, Philippe 150, 331, 337–8Kaplanis, Evi 335Kaserman, David L. 286Kearney, A. John 259Kehoe, Patrick J. 134Kemp, Jack 491Kenessey, Zoltan 151Keynes, John M. 440, 508, 517–18, 549Kim, Yoonbai 153–4Kindleberger, Charles P. 375, 378Klopstock, Fred H. 429, 431Kobrin, Stephen 389de Kock, Gabriel 515Kogut, Bruce 379Kohlhagen, Steven W. 79Kohn, Meir G. 22Kokko, Ari 392Korajczck, Robert A. 286Korth, Christopher M. 458Kouri, Pentti J. K. 476Krasker, William S. 292Kravis, Irving B. 148–9, 151–2, 381, 391, 392Kreps, David M. 540Krugman, Paul R. 22, 378, 502, 504Kubarych, Roger 60Kulatilaka, Nalin 82Kupferman, Martin 181Kydland, Finn E. 134, 515Lamont, Norman 298La Porta, Rafael 401Lee, Boyden E. 431Lee, Moon H. 416Lerner, Abba 563LeRoy Stephen F. 284Lessard, Donald R. 338, 348, 356,383, 384Levi, Maurice D. 152, 153, 178, 181,182, 203, 263, 269, 312, 436, 473Levich, Richard M. 203, 209–10, 296,300, 314, 347Levine, Ross 401Levinsohn, James 21Levitt, Theodore 423Lewent, Judy C. 259Lewis, Karen K. 292, 335Lippens, Robert E. 286Lipsey, Richard E. 148–9, 152Lipsey, Robert E. 375, 381, 391, 392Litzenberger, R. H. 171Liu, Peter C. 288Logue, Dennis E. 300, 339Longworth, David 286Lopez-De-Silanes, F. 401Lothian, James R. 291Lycett, Andrew 298Lyon, Andrew 365McCown, T. Ashby 379Machlup, Fritz 519McKinley, William 492McKinnon, Ronald I. 483, 537McMahon, Patrick C. 286Macnamara, Don 460McNown, Robert 154Maddala, G. S. 288Magee, Steven 482Mahathir Mohammed 526Makin, John H. 431, 473Maksimovic, Vojislav 401March, James G. 378Marcus, Alan J. 82Marion, Nancy P. 22Marr, Wayne 400Marsh, James 378Marsh, Paul 10Marshall, Alfred 563Marston, Richard 399Martin, Keith 341Meese, Richard A. 280, 287, 288,289, 290Melvin, Michael 291de Meza, David 379Miller, Darius P. 402Miller, Marcus 502, 504Mills, Rodney H. 408Mintz, Norman 387Mirus, Rolf 459Moffett, Michael H. 134Morck, Randall 383Mullins, David 440Mundell, Robert 487, 519, 537–8,541, 567Mussa, Michael 150–1, 474Muth, John F. 148Myers, Stewart 25, 349, 353Nanda, Vikram 411Nathanson, Leonard 355575 &
NAME INDEXNess, Walter L. Jr 414Niehans, Jurg 429Obstfeld, Maurice 25, 149–50O’Connor, Linda 381Odier, Patrick 323–4, 328, 334, 339,340, 341Ott, Mack 107, 290Oxelheim, Lars 192, 201Pearce, Douglas K. 286–7, 290, 291Pederson, Roy E. 387Penrose, Edith T. 411Perold, Andre F. 262Petty, J. William 383Phelps, Patricia 150Philbrick, Allen 4Philippatos, George C. 360–1, 415, 416Pinkowitz, Lee 336Pippenger, John 152van der Ploeg, Frederick 379Popper, Karl 298Porter, Michael E. 5, 348, 476, 551Poterba, James M. 339Prescott, Edward C. 515Pringle, John P. 218, 249Protopapadakis, Aris A. 148Provissiero, Michael 387Purvis, Douglas D. 292, 483Puthenpurackal, John J. 402Raghuram Rajan 401Reagan, Ronald 520Rentzman, Werner R. 455Resnick, Bruce G. 328–30Ricardo, David 19Rich, Bruce 534Richardson, J. David 148, 375Riddick, Leigh A. 335Ries, John 379Robbins, Sidney M. 410–11, 414Roberts, Dan J. 291Robinson, Joan 138Rockoff, Hugh 492Rogalski, Richard J. 150Rogers, James 298Rogoff, Kenneth 288Roll, Richard 147Roper, Donald 483Rose, Andrew 535Rothschild, Mayer 437Rouwenhorst, K. Geert 326Rubenstein, Mark 80& 576Rueff, Jacques 491Rush, Mark 153Sachs, Jeffrey 539Sakakibara, Eisuke 431Sala-i-Martin, Xavier 539Sarnat, Marshall 147Scarlata, Jodi G. 341Schinasi, Garry J. 288Schirm, David C. 291Scholes, Myron 79Schuler, Kurt 526Schulmeister, Stephan 300Schwartz, Eduardo 337–8Senbet, Lemma W. 380Senschak, A. J. 338Serçu, Piet 337Servain-Schreiber, J. J. 22, 377Shafer, Jeffrey 300Shakespeare, William 346, 469Shapiro, Alan C. 256, 350, 414, 473Sharpe, William 332Sheehan, Richard G. 537Shleifer, Andrei 401Shulman, Evan C. 262Silverstein, Gerald 365Singleton, Kenneth J. 287Slemrod, Joel 383Smith, Adam 143Smith, Clifford W. 256Smith, Emily T. 534Smith, Gregor W. 401Smithson, Charles W. 275Solnik, Bruno 25, 323–4, 326–7, 328,330, 333, 334, 338, 339, 340, 341Sommer, John 4Song, Joon Y. 415, 416Soros, George 296, 298, 526, 539–40Spencer, Barbara 22Spitaler, Erich 376–7Srivastava, Sanjay 286Stansell, Stanley R. 150Staunton, Mike 10Stehle, R. E. 171Stern, Robert M. 540Stobaugh, Robert B. 410–11, 414–15Stockman, Alan C. 286Stoll, Hans R. 148Stonehill, Arthur I. 355Stroetmann, Karl A. 408Strong, Norman 339Stultz, René M. 256, 292, 335, 336, 337Summers, Robert 151
NAME INDEXSvensson, Lars E. O. 502Swamy, P. A. V. B. 288Sweeney, Richard J. 296, 300, 339Swenson, Deborah 379Swoboda, Alexander K. 431, 519, 537Szegö, George 147Taya, Teizo 300Taylor, Alan 340Taylor, Mark 288–9, 299Teichman, Thomas 455Terrell, Henry S. 408Tesar, Linda L. 335Thomas III, Lee R. 300Thygesen, Niels 150Tobin, James 71Triffin, Robert 490, 518Trimble, John L. 400Truitt, J. Frederick 387Uppal, Raman 152, 335Varma, Raj 400Vernon, Raymond 377Verschoor, Willem F. C. 288Veugelers, Paul T. W. M. 290Vinso, Joseph D. 150Vishny, Robert W. 401Walker, Ernest W. 383Wallace, Myles S. 154Ward, Artemus 397Warnock, Frank E. 335Wei, Shang-Jin 49Weinblatt, Jimmy 375Weiss, David 461Werners, Ingrid M. 335Whitaker, Marcia B. 314, 347White, Harry Dexter 517Wicks Kelly, Marie E. 360–1Wihlborg, Clas G. 192, 201, 296Willett, Thomas 300Williamson, John 500Williamson, Rohan 336Wolff, Christian C. P. 286,288, 291Wood, Geoffrey E. 22, 111Xu, Xinzhong 339Yeager, Leland 490Yeung, Bernard 383, 459Zechner, Josef 416Zervos, Sara 401Zingales, Luigi 401Zouikin, Tania 326577 &
Subject indexabnormal returns 284, 333absorption approach to balance of payments 113accelerator model 482acceptance drafts 448accounting exposure 216accounting principles 189, 216–20accounting services 377, 379adjusted present value (APV) technique 346–7, 350–6, 372, 385agency cost of debt 416agglomeration economies 379agreement corporations 433, 436agricultural products: trade in 460air waybills 449airline industry 209–10all-equity discount rate 354alliances, transnational 13, 373, 393American Airlines 209–10American Cyanamide 393American depository receipts 401American options 77, 79–80anchor currencies 515, 526–7Anglo-Irish Bank 440appreciation of currency 57, 97, 135, 250, 276, 474, 479,481, 520arbitrage 44–9, 141–4, 151–2, 166, 172–8, 182, 398, 488Argentina 5, 526–7arm’s-length prices 384Asian financial crisis 11, 525–6Asian options 82Asian tigers 530ask rates 38, 42–3, 48–9, 54‘‘asset approach’’ to exchange rates 467, 474–5asset pricing 331–9Association of South East Asian Nations 4, 462asymmetric information 270at-the-money options 78–9Australia 413autocorrelation 285avalled notes 454& 578back-to-back loans, see parallel loansBahamas, the 364–5, 369balance of payments 95, 97, 119–20; absorptionapproach to 113; accounting identity 108–11;capital account 108–11; current account 103, 109–10;data difficulties for 107; entries in 99–108; long- andshort-run implications of imbalances 110;underlying principles of 98–9bank agencies 434bank drafts 32bank failures: fear of 523Bank for <strong>International</strong> Settlements 431, 439–40,497, 531–2bank-note market 29–32bank-note wholesalers 31bankers’ acceptances 446, 448, 452–3Bankers Trust 81banking, see multinational bankingbankruptcy costs 257, 265, 410, 416Barings Bank 440barter 456–7Basel Accord (1988) 532Basel Committee 439, 532beggar-thy-neighbor policies 516–17, 529Belgium 497, 501Bermuda 364–5, 369beta analysis 332bid rates 38, 43, 48–9, 54bidding for contracts 270bills of exchange, see draftsbills of lading 449Black Wednesday 298blocked funds 349BOC (company) 8bonds 197–8, 207, 339–41, 402–10, 475–9; cost ofissue 408; currency of issue 403–6; multicurrency408–10; option-linked 82; size of issues 408; vehiclesfor issue of 410borrower information held by banks 437
SUBJECT INDEXborrowing: determining currency of 164–5; differences incost of 399; with foreign-source income 406–7Bretton Woods system 49, 109, 491–4, 497–9, 511,515–21, 529, 541brokered trading 39bubbles 483business cycles 468, 539buyback agreements 457buyer credits 456call options 77–80, 283; payoff profiles 83–4Canada 203, 325, 338, 365–7, 381, 390–1, 413, 416,451, 456, 462, 496, 499–500, 519, 539capital account of balance of payments 108–11capital asset pricing model 332; international 332–4, 337capital availability 378, 381capital budgeting 346; actual practice of 360–1; hypotheticalexample of 356–60capital flows, benefits from 22–6capital gains tax 180–3capital markets: integration of 334, 340; segmentation of332–9, 398capital rationing 381capital structures in different countries 415–16Cartagena Agreement (1969) 387cash flows 349–50; predictive accuracy of 271cash management: centralization of 310–14; objectives of307–8; systems for 315–19Cayman Islands 369central-bank swaps 496centralization of financial management 308, 310–14certificates of deposit 428chaebols 393‘‘chartist’’ forecasting techniques 280, 297, 299, 483Chemical Bank 427–8Chicago Mercantile Exchange 68–70, 76–7, 80, 428China 16, 114, 191, 262, 388, 451, 487, 525, 530–4CHIPS (Clearing House Interbank Payments System)37, 432Chrysler Corporation 391, 393clean drafts 448clearing corporations 68–9CLS (Continuous Linked Settlement) 37–8, 432clusters 5Coface 451cointegration techniques 153–4commodity prices 522–3Compaq 317–19comparative advantage 5, 19competitive advantage 5competitive devaluation 516, 529, 536–7concessionary financing 351–3Concordat Agreements (1983) 439confidence 536confiscation of assets 385, 414consignment sales 450consortium banks 435construction projects 525–6consumption: subsidization of 523consumption function 508consumption smoothing 24–6contagion 11, 439, 525contractual assets and liabilities exposure on 193–4controlling shareholders 336cooperative action in exchange markets 501–2,523, 531corporate governance 216, 336correspondent banking 38, 431–4counterparty risk 440counterpurchase 457countertrade 16, 456–9countervailing tariffs 460, 462country risk 7, 11–12, 15, 354; Euromoney rankings 388;measurement of 385–7; for multinational corporations384–90; reduction of 387–90cover for risk, see hedgingcovered interest arbitrage 166, 173covered interest-parity condition 14, 141–2, 159, 166–73;lack of precision in 171–2covered margin 168‘‘crawling peg’’ system 500credit insurance 450–1; government provision of 451–2Credit Suisse 455credit swaps 412–13cronyism 526cross exchange rates 27, 45–9cross forwards 60C.T. Bowring and Company 81culture 392–3currency: of bond issue 403–6; of borrowing 164–5;of investment 160–6; of invoicing 244–8,269–71, 276currency areas 537–9currency board system 526–7currency cocktails 408–9currency diversification 311–12, 497currency futures, see futurescurrency options, see optionscurrency pool system 501currency units: for analysis 238–43; composite 270–1current account of balance of payments 103,109–10custodial services 437custodians 341customer drafts 38customs unions 4, 460579 &
SUBJECT INDEXdebit transactions 99debt/equity ratios 415debt-service exports 101debt of third-world countries 520–3deflation 492demand curve: for currency 121–2, 129–30; for imports 123;for shares 398depreciation of currency 97, 133–4, 224–5, 250, 291, 339,379, 474–5, 480–3, 503, 542‘‘deregulation wars’’ 439derivatives 27, 68, 440devaluation 112–13, 150, 496, 536–7, 541–2; and exports231–9, 244–8; and imports 240–4, 247; see alsocompetitive devaluationdevelopment bank lending 413dirty floats 106, 499, 501, 524disclosure requirements 400–1discount rates 354–6, 369–72diversification 15, 305, 385; of currency 311–12, 497;indirect 380; of portfolio investment 322–3, 326–7,330–1, 334–5, 341, 380dividend policy 258documentary credits and drafts 448Doha round of trade talks 460dollar standard 493–4, 510, 521, 541; and price adjustment494–6dollarization 471, 474domestic international-sales corporations (DISCs) 367domestic reporting currency 216Double Eagle Fund 298double-entry bookkeeping 98, 102, 108drafts 446–8Durbin–Watson statistic 285Dutch disease 542Eastman-Kodak 8econometric techniques 293–5economic exposure and risk 192, 216economies of scale in financial markets 257, 312–13,451–2economies of scope 452Edge Act corporations 433, 435–6efficiency of foreign exchange markets 280, 283–8, 291–2;weak, semi-strong and strong forms of 284‘‘efficient markets’’ PPP 170‘‘efficient’’ portfolios 322elasticities of trade 133–5, 482, 542‘‘emerging country’’ funds 10Enron 216, 377environmental policies 533–5equity financing 397–402‘‘errors and omissions’’ 106–7escrow accounts 37euro currency 1, 4, 33, 42, 46, 467–8, 527–9, 537–8Eurobonds 402–3, 408–10Eurodollar instruments 15, 105, 403, 423–6; demand for425–6; reasons for use of 424; supply of 424–5Eurodollar multiplier 431Euroequities 398–400, 410Euromoney 299, 385–8, 398European Central Bank 528, 538European currency unit (ECU) 270, 497–8European currency unit (ECU) bonds 408European Monetary Co-operation Fund (EMCF) 497, 499European Monetary Institute 527European Monetary System (EMS) 467, 496–9, 502, 510–11,520; and price adjustment 499European options 77, 79–80; put-call parity for 89–93European terms 42, 64European Union 4, 460–2, 527, 530–1, 537–8Eurosterling bonds 403, 423–4Euroyen deposits 423–4even-dated contracts 60event study methodology 291exchange control 501, 517Exchange Rate Mechanism (ERM) 298, 496, 498, 520exchange-rate risk 189, 311, 327–31, 337, 339, 354, 538exchange rates: arguments for flexibility and for fixity536–42; companies affected by changes in 6–8;destabilization of 390–1; effect on trade balance 133;effects on exporters and importers 244; expectationsabout 502–3; factors affecting 122–30; forecasting of 280,288–300, 491, 495–6, 510; hybrid systems of 499–502;importance of 1–2, 6; monetary theory of 290, 467,469–74, 478–9; operations affected by 230–1; real changesin 216, 220–6; stock and flow theories of 469; variety of 29;volatility of 12–13, 80, 119, 130–3, 258–9, 283, 327–30,479–83, 524, 539; see also ‘‘asset approach’’, crossexchange rates, forward exchange rates, portfolio-balancetheory, sticky-price theoryexchange-traded options 76–9, 82–3exercise price 75expectations, self-fulfilling 130, 496export credit insurance 7, 450–2Export Development Canada 389, 451Export-Import Bank 456export of jobs 391–2exports 99–101; effect of exchange rates on 244; and exposedinputs 245–7; financing of 452–6; and operating exposure231–40; and receivables exposure 247; supply curve for124; understatement of 107exposure in foreign exchange 8, 14–15, 220, 259; definitionof 192–3; as distinct from risk 189, 191, 205–6, 211;examples of 193–8; with multiple exchange rates 202; asa regression slope 198–204; at shareholder level and atcorporate level 256–7; see also operating exposure& 580
SUBJECT INDEXexposure line 200exposure profile 276expropriation of assets 385, 414externalities, see negative externalities, positive externalitiesFAS 8 and FAS 52 rules 217–19, 222–6Federal Reserve 103–4, 291–2, 425, 433–6Fedwire 37fiat money 488fiduciary issue 527filter rules 299Financial Accounting Standards Board 216, 219; see also FAS 8and FAS 52 rulesfinancial engineering 190, 256, 274financial structure 373, 414–16First Eagle Fund 298first-mover advantage 378First World War 515Fisher equation 370–2Fisher-open condition 171fixed assets 206; and financial accounts 224–6; and realchanges in exchange rates 223–4flexibility of production 379Ford Motor Company 6Forecasting: chartist versus fundamentalist methods 297,299, 483; ‘‘rational’’ 287–8; see also exchange rates:forecasting offorecasting methods, relative success of 296–300forecasting models 288–90forecasting services 293–6foreign bonds 402–3foreign branches of international banks 434–5foreign direct investment (FDI) 15, 305–6, 346–8, 375–9;strategic motivation for 378foreign-owned assets 105–6foreign policy 391foreign-sales corporations (FSCs) 367–8‘‘foreign securities’’ 104foreign subsidiaries and affiliates of international banks 435forfaiting 453–5forward contracts 71–3, 538–9; compared with futuresand options 85–6; nondeliverable 60–1; in relationto futures contracts 75; risk premiums and discountson 262–3forward exchange rates: bias in 284–7; definition of 53; asdistinct from expected future spot rates 56forward-forward swaps 59forward hedging: benefits of 264–72; cost of 260–4forward market 27, 53–66; flexibility of 60–1; andspeculation 281; thinness of 64; turnover in 53forward premium and discount 54–5, 80forward quotations 61–5France 5, 325, 516–19, 539free-trade areas 4, 460free-trade zones 461freezing of assets 414frictions, natural and man-made 380futures 27, 68–75; compared with forwards and options 75,85–6; and hedging 265–6; payoff profiles on 73–5, 274;and speculation 281–2gains from trade 19–22game theory 515, 529General Agreement on Tariffs and Trade (GATT) 421,459–60, 462General Electric 314, 338, 347General Motors 326, 338, 393General Motors Acceptance Corporation 409Generally Acceptable Accounting Principles (GAAP) 400Germany 5, 325, 416, 455, 497–8, 521, 524global funds 10globalization 4, 8–13, 340, 378, 397, 423, 535; definitionof 9; measures of 9gold-exchange standard 491–4, 502, 510, 517, 521; and priceadjustment 494–6gold points 488, 491, 511–13gold standard 467, 488–92, 514–16, 529, 541; criticismsof 490–1; and price adjustment 488–91goodwill, trade in 102government export agencies 455–6government lending 413Gramm–Leach–Bliley Act (1999) 402Great Depression (1929–33) 516Greece 107Grenada 369Hanbo Steel 525hedging 7–8, 15, 85, 141, 191, 203–7, 226, 230, 256–77,330–1; benefits of 264–72; via borrowing and lending267–9; corporate policy on 276; via currency ofinvoicing 269–71; expected cost of 264–5; via the futuresmarket 265–6; by management and by shareholders 256–7;via the options market 266–7; pay-off profiles 272–6;according to predictive accuracy of cash flows 271; ofreceivables/payables 259–60; via selection of supplyingcountry 271–2Hewlett Packard 317home-equity bias 334–9; and corporate governance 336Home Shopping Network 398Honda 326, 379Hong Kong 5, 16, 107, 191, 262, 525–6, 530, 541hot money 12, 105, 539IBM 393illegal transactions, 108imperfect competition 236–8581 &
SUBJECT INDEXimport competers 195import duties 366, 378import substitutes 134imports 101–2; demand curve for 123; effect of exchangerates on 244; and operating exposure 240–4income receipts/payments in balance of payments accounts101–2, 129income statements of firms 21, 110–11income taxes 180–2, 364–5increasing returns to scale 21independence in economic policymaking 537India 325indirect exchange 43–4, 47industrial offset 457industrial structure 325–6inflation 123–9, 143, 150, 153, 211, 219–20, 292, 337, 339,473–4, 491, 515–16, 520–3, 541–2; and choice ofdiscount rate 355–6, 369–72initial public offerings 402insurance: of investment 389–90; see also export creditinsuranceintegration of operations 375–6interbank spot market 32–43; turnover in 32–3, 36interest differentials 80–1, 183–4interest parity 59–85, 141, 268; combined withPPP condition 169–71; see also coveredinterest-parity condition, uncovered interest-parityconditioninterest rates 473–4, 480, 483, 510, 523; on offshorecurrency deposits 427; real and nominal 474internal pricing 369<strong>International</strong> Bank for Reconstruction and Development(IBRD), see World Bankinternational banking facilities (IBFs) 428, 436<strong>International</strong> Development Agency (IDA) 413international finance: benefits from study of 1–2; growingimportance of 2–8<strong>International</strong> <strong>Finance</strong> Corporation (IFC) 413international funds 10<strong>International</strong> Harvester 392international investment position 111–13<strong>International</strong> Monetary Fund (IMF) 103, 107, 409, 427, 460,496, 499, 516–23Internet exchange 40in-the-money options 78–81, 275–6intrinsic value of options 78–9investment 104–6, 130; currency of 160–4; insuranceof 389–90; interest disparity on borrowing for183–4; time horizon for 207; see also foreigndirect investmentinvisibles 101Israel 539Italy 5, 497–8, 538J curve 96, 119, 133–5, 245–6Japan 114, 325, 399, 416, 521, 524, 530–4joint ventures 388–9, 435keiretsu 393knowledge, non-transferable 376law of one price 141–4, 148, 208leading and lagging 311, 317‘‘leaning against the wind’’ policy 197–8, 202, 339letters of credit 7, 445–7, 451–3liberalization of trade 4life-cycles of products 377, 381liquidity 182–4, 307, 315, 536–7loan guarantees 456loans, option-linked 82London Interbank Offer Rate 427long positions 68, 194Long-Term Capital Asset Management 440look-back options 82Louvre Accord (1987) 501–2, 524, 529, 531, 542Maastricht Treaty 462, 498, 538maintenance level of a margin account 70Malaysia 525managed floats, see dirty floatsmargin accounts 70–2marginal cost pricing 382marginal propensity: to consume 508; to import 509marginal utility 24–5market imperfections 380market-makers 34marking to market 70–1, 265marking-to-market risk 72–3, 282Marsh & McLennan Company 81Marshall-Lerner condition 133maturity dates 65medium term financial assistance facility of theEMS 498mercantilism 113The Merchant of Venice 453Merck & Co. Inc. 258–9Mexico 292, 347, 381, 458, 462, 496, 522, 525, 527,537, 539Mitsubishi 393MMS <strong>International</strong> 299mobility of factors of production 538–9monetary policy 468, 498, 515–16, 521–9, 538monetary theory 467, 469–74, 478–9money market 159money supply 290–2, 502–4, 510, 542; in relation to demandfor money 470–81, 489–92monopoly 148, 391, 452, 538& 582
SUBJECT INDEXmoral hazard 451Morgan Guarantee Bank 401‘‘most favored nation’’ clause 460multicurrency bonds 408–10multinational banking 423–41; organizational features of431–6; problems of 439–40; reasons for developmentof 436–8multinational corporations (MNCs) 13, 15, 306, 338,346–50, 360, 365, 373–96, 535; and country risk384–90; empirical evidence on growth of 380–1;internally-generated funds 410–11; listed with assets, salesand employment 374–5; problems and benefits for hostcountries 390–3; reasons for growth of 373–80; transferpricing by 381–4Nash equilibrium 515national income: accounting identity 113; and exchange-rateadjustment 508–10Navistar <strong>International</strong> 315–17negative externalities 376net present value (NPV) technique 346–51, 354Netherlands 542Netherlands Antilles 402netting 310–11, 316–17neutralization policy, see sterilization policynews and exchange rates 290–1Nissan Motors 379nontraded goods 152, 479–82, 490–1North American Free Trade Agreement (NAFTA) 4, 460, 462objectives of economic policy 113–14Occidental Petroleum 398offer rates 42official reserve assets 95, 103, 112offshore currency deposits 15, 423–4; different types ofinstrument 427–9; interest rates on 427; multipleexpansion of 429–31oil prices 459, 520, 529one-way arbitrage 46, 172–9, 488open-account sales 450open interest 73operating exposure 189, 192, 208, 230–52, 269–70; forexporters 231–40; for importers 240–4; measurement of249–50; postponement of 244–7optimum-currency-area argument 537–9option-linked bonds and loans 82options 27–8, 75–85, 539; compared with forwards andfutures 85–6; and hedging 266–7; market value of79–81; profiles 274–6; and speculation 282; see alsoexchange-traded options, over-the-counter optionsorder bill of lading 449Organization of Petroleum Exporting Countries (OPEC) 520organization theory 378out-of-the-money options 274, 276outright forward contracts 58–62Overseas Private Investment Corporation (OPIC) 389overshooting 297, 299, 469, 479–83over-the-counter options 81–3parallel loans 411–13‘‘path-dependent’’ options 82payment drafts 448payoff profiles 15, 57–9; for call options 83–4; on futurescontracts 73–5; for hedging techniques 272–6; for putoptions 84–5pegging of currencies 491; see also ‘‘crawling peg’’ systemPeru 458peso crisis (1994–95) 292, 347, 496, 525, 527peso problem 537petrodollars 520Philadelphia Stock Exchange 76–7, 80Philippines, the 525Plaza Agreement (1985) 501, 523–4, 529, 531‘‘points’’ on quoted exchange rates 42–3political risk 179–83, 314–15, 384–5, 414, 450pooling of cash 312–13portfolio-balance theory 467, 475–9portfolio investment 322–42, 378; benefits of 322–31Portugal 531positive externalities 452price-adjustment 487–91; under EMS 499; undergold-exchange and dollar standards 494–6; under goldstandard 488–91price indexes 148–9, 152price-specie automatic adjustment mechanism 489–90,521Private Export Funding Corporation 456profit and loss accounts, see income statementspromissory notes 454–5protection of investors 401protectionism 516, 529, 531purchasing-power-parity (PPP) principle 14, 141,143, 159, 256, 337, 339, 371–2, 379, 475, 479;absolute (or static) form of 144–5, 151;combined with interest parity 169–71; efficient markets(or speculative) form of 147–8, 170; empirical evidenceon 148–51; practical importance of 154–5; reasonsfor departures from 151–2; in relation to exposureand risk 206–11; relative (or dynamic) form of 145–7,151; statistical problems with 152–4put-call parity 89–93put options 77–80; see also payoff profilesQantas Airlines 409–10Quadra Logic 393quantity theory of money 489583 &
SUBJECT INDEXQuantum Fund 298quotas 151–2, 379–80, 383‘‘race to the bottom’’ in environmental standards 535ratchet effect on exchange rates 541–2‘‘rational expectations’’ 515‘‘rational’’ forecasting 287–8real estate 198, 206reference currency 198regionalism in international trade 531regression methodology 153, 198–204, 249–50, 284–5, 290regulation 459–62; avoidance of 379, 425, 437–9Regulation Q and Regulation M 425–6remittance restrictions 350representative offices 434repudiation of debt 522reputation, protection and exploitation of 376–7rescheduling of debt 523research and development 259, 381reserve currencies 519reserve ratios 490resident (bank) representatives 434residual foreign exchange exposure, see operating exposurerestrictions on movement of goods 151–2risk with foreign exchange 5–8; definition of 204–5; asdistinct from exposure 189, 191, 205–6, 211; in relationto interest parity 205–6; in relation to purchasing-powerparity206–11risk premiums on forward contracts 262–3, 286rollover swaps 60round-trip arbitrage 46, 173–5, 178, 488savings 114scenario approach 196secrecy, protection of 376–7, 381Securities Exchange Act (1934) 400Securities Exchange Commission 400seignorage 518–19seizing of assets 414serial correlation 285services, trade in 123share issues: choice of country for 397–8; cost of 401–2;vehicles for 402shareholder protection 401shipping income 107–8short positions 68, 194short term monetary support facility of the EMS 498Siemens 393Singapore 5, 530Smith-Corona 392Smithsonian Agreement (1971) 519‘‘snake’’ currency system 496, 520Somprasong (company) 525sourcing 271–2South Korea 530sovereign loans 522sovereign risk 384Soviet Union 424, 455Spain 531special drawing rights (SDRs) 49, 270, 409, 427, 519speculation 85, 135, 147–8, 190, 260–3, 280–3, 483,495–504, 521, 524–6; via borrowing and lending 282–3;on exchange-rate volatility 283; via the forward market281; via the futures market 281–2; via not hedgingtrade 283; via the options market 282; stabilizing ordestabilizing 540–1spillovers 414–15, 440, 452spot market 32–43; quotation conventions 40–3; expected andrealized rates 56spot options 76spread, on exchange rates 31, 33, 38, 47, 64, 172, 263–4,310, 455spreading of risk 322; see also country risk, political riskstability in foreign exchange markets 137–9standby arrangements 518statistical discrepancy 106–8sterilization policy 490–1, 494–5, 521sticky-price theory 479–82stock markets, correlations between 322–7stock prices 202, 327–30, 339straddles 283strike price 75subsidiary companies 411–15subsidization: of consumption 523; of exports 456, 460supplier credits 456supply curve: for currency 96, 119–21, 129–33; for exports124–5supply-side economics 520support points (of exchange rates) 491, 494, 518‘‘surprises’’ 290–1swap-ins and swap-outs 59swap points 61–4swaps 58–63, 269, 276, 283, 539; definition of 59; as distinctfrom outright forwards 62; uses of 59–60; see alsocentral-bank swaps, credit swapsSweden 451SWIFT (Society for Worldwide <strong>International</strong> FinancialTelecommunications) 33, 36, 54, 105, 432switch trading 457–8Switzerland 365synergy effects of acquisitions 360Taiwan 530talking exchange rates up or down 502target zones for exchange rates 501–4, 524–5tariffs 151, 378–80, 383, 460, 462, 531& 584
SUBJECT INDEXtax arbitrage 182tax havens 369, 438Tax Reform Act (1984) 367taxation 180–2, 256, 265, 350, 364–9, 383,390, 407, 414; for branches and subsidiaries367–9; organizational structures for reductionof 367–9‘‘technical’’ forecasts 299‘‘technical’’ trading 284, 298–9technology transfer 392terms of trade 99–100, 122–3, 526terrorism 391Thailand 525time drafts 446, 452–4time horizons of investors 207tradable inputs 234–6, 243trade, international: drawbacks of 22; and theenvironment 535; financing of 452–6; growth of3–5; liberalization 4; regulation of 459–62; rewardsfrom 5–6; see also gains from trade, risk with foreignexchangetrade balance, effect of exchange rates on 133trade imbalances 102, 113, 532–3, 536, 542trading pits 68transaction costs 172–9, 183, 263–4, 281, 335; andborrowing criterion 309–10; and investment criterion308–9; and political risk 314–15transaction risk and transaction exposure 217–18, 245, 247transfer pricing 373, 381–4; practical considerations 384;strategic considerations 382–4transfers from abroad 129–30transitory shocks 291translated value 101translation risk and translation exposure 217–19, 226,245, 247travel expenditure 108travelers’ checks 31triangular arbitrage 44–9uncovered interest-parity condition 169–71, 205–6unemployment 542unilateral transfers 102–3unit-of-account bonds 408Uruguay round of trade talks 460usance drafts, see time draftsvalue-added tax 306, 364, 366value dates 39, 65vector autoregression 291very short term financing facility of the EMS 498Vietnam War 521Volkswagen 8, 379wage reductions 536weighted average cost of capital 349wire transfers 38withholding taxes 180, 183, 315, 366–7The Wonderful Wizard of Oz 492working capital 307, 313World Bank 413, 522, 533–4World Trade Organization (WTO) 114, 366, 380, 421,459–60WorldCom 216, 377writers of options 79Yankee bonds 403585 &