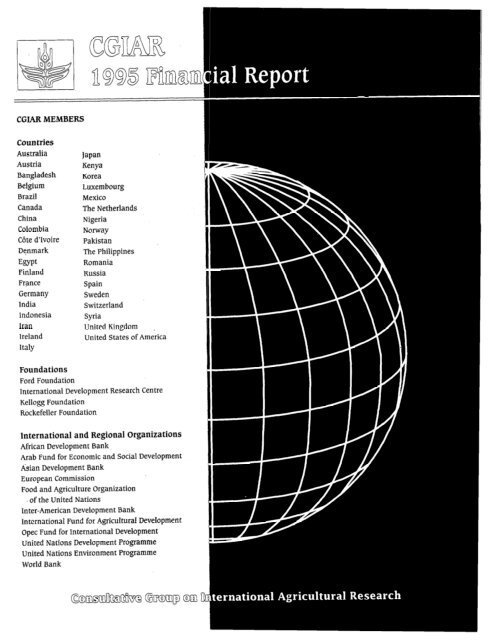
1995 Financial Report - CGIAR Library
1995 Financial Report - CGIAR Library
1995 Financial Report - CGIAR Library
- No tags were found...
Create successful ePaper yourself
Turn your PDF publications into a flip-book with our unique Google optimized e-Paper software.
List of ChartsChart 1:Chart 2:Chart 3:Chart 4:Chart 5:Chart 6:Chart 7:Chart 8:Chart 9:Chart 10:Chart 11:Chart 12:Chart 13:Chart 14:Chart 15:Chart 16:Chart 17:Chart 18:Chart 19:Chart 20:Chart 21:<strong>CGIAR</strong> Funding, 1991-<strong>1995</strong>.. ..........................................................................................4Agenda Contributions, 1994-<strong>1995</strong> (by Member group) .............................................. .5<strong>1995</strong> Top Ten Agenda Contributors ............................................................................. .5<strong>1995</strong> Research Agenda Funding (by Center) ................................................................ 6Changes in Center Funding, 1994-<strong>1995</strong> ....................................................................... .7<strong>1995</strong> <strong>CGIAR</strong> Expenditure by <strong>CGIAR</strong> Undertaking.. ..................................................... .7<strong>1995</strong> <strong>CGIAR</strong> Expenditure by Region ............................................................................ .8<strong>1995</strong> <strong>CGIAR</strong> Expenditure by Object.. ............................................................................ 9<strong>CGIAR</strong> Staff Changes, 1991-<strong>1995</strong> .................................................................................. ,9Composition of Agenda Funding, 1991-<strong>1995</strong> ............................................................. 12Distribution of <strong>1995</strong> World Bank Support (by Center) .............................................. 13<strong>1995</strong> Disbursement of Funds ....................................................................................... 14<strong>1995</strong> Non-Agenda Funding (by Member group) ......................................................... 14Largest Contributors of <strong>1995</strong> Non-Agenda Funding ................................................... 15<strong>1995</strong> Non-Agenda Funding (by Center) ...................................................................... 15<strong>1995</strong> Operating Fund (by Center) ............................................................................... 18<strong>CGIAR</strong> System Current Ratio, 1991-<strong>1995</strong>.. ..................... I.. ........................................... 18Current Ratio, 1994-<strong>1995</strong> (by Center). ......................................................................... 19Working Capital, 1994-<strong>1995</strong> (by Center) ..................................................................... 19<strong>1995</strong> Net Fixed Assets (by Center) ............................................................................. .20<strong>1995</strong> Capital Fund (by Center) ................................................................................... .21List of Annex TablesTable I-l: <strong>CGIAR</strong> Contributions to the Agreed Research Agenda by Member, 1972-<strong>1995</strong> ...... .23Table I-2: <strong>CGIAR</strong> Contributions to the Agreed Research Agenda by Center, 1972-199 j ......... .24Table I-3: ODA and <strong>CGIAR</strong> Contributions by DAC Countries, 1991-<strong>1995</strong> (with illustration). ..25Table II-1 : Ranking of <strong>CGIAR</strong> Contributions to the Agreed Research Agenda, 1991-<strong>1995</strong> ....... .27Table 11-2: <strong>CGIAR</strong> System Grants by Center, 1991-<strong>1995</strong> .............................................................. 28Table 11-3: <strong>1995</strong> <strong>CGIAR</strong> Funding by Center .................................................................................. 29Table 11-4: Components of <strong>Financial</strong> Support to the <strong>1995</strong> Agreed Research. AgendaTable 11-5:Table 11-6:Table 11-7:Table 11-8:Table II-9Table 11-10:Table III-1 :Table 111-2:Table 111-3:Table 111-4:Table 111-j:Table 111-6:Table 111-7:Table III-8Table 111-9:Table IV-l :by Member.. ................................................................................................................. .30<strong>1995</strong> <strong>CGIAR</strong> Funding by Member ............................................................................... 31<strong>1995</strong> Funding Outcome by Center ............................................................................. .32World Bank Funding by Center, 1991-<strong>1995</strong> ................................................................ 33Estimated Disbursement of 199 j Funding to the Agreed Agendaby Member by Month ................................................................................................. .34<strong>1995</strong> Support to the Agreed Research Agenda by Member by Center ..................... 35<strong>1995</strong> Non-Agenda Funding by Member by Center ................................................... .37<strong>CGIAR</strong> Expenditure, 1991-<strong>1995</strong> ................................................................................... 38Capital Investments by <strong>CGIAR</strong> Centers, 1992-<strong>1995</strong> .................................................... 39<strong>1995</strong> <strong>CGIAR</strong> Object Expenditure ................................................................................ .40<strong>1995</strong> <strong>CGIAR</strong> Expenditure, by Activity ......................................................................... 411994 <strong>CGIAR</strong> Expenditure, by Activity ........................................................................ .421993 <strong>CGIAR</strong> Expenditure, by Activity ........................................................................ .43<strong>1995</strong> Regional Allocations ............................................................................................ .44<strong>CGIAR</strong> Staffing, 1991-<strong>1995</strong> .......................................................................................... .45<strong>CGIAR</strong> Centers’ Inflation Rates, 1991-<strong>1995</strong> ................................................................ .46<strong>CGIAR</strong> Centers’ <strong>1995</strong> <strong>Financial</strong> Position ..................................................................... 47
I. <strong>1995</strong> HighlightsATTAININGSTABILITYAt its Mid-Term Meeting in May 1994 (MTM94), the Group launched a program of renewal in responseto a major crisis that confronted the <strong>CGIAR</strong>. The most visible manifestation of the crisis was a significantdecline in funding for the agreed Research Agenda, as well as the diversion of funds from agreed <strong>CGIAR</strong>programs to projects outside of the Agenda, since 1992. The decline was expected to persist in 1994 and <strong>1995</strong>,thereby threatening the continuity, integrity, and effectiveness of research at the <strong>CGIAR</strong> Centers. Behind thefinancial factor, however, there were a number of other uncertainties that reached deep into the vision,programs, governance, and approach of the CGLAR System. It was against this background that the <strong>CGIAR</strong>launched a renewal program to “clarify its vision, refocus its Research Agenda, create greater openness andtransparency, strengthen its partnerships, ensure its efficiency and effectiveness, and tighten its governanceand operations.”The eighteen-month renewal program was underpinned by a short-term financial stabilizationprogram, the cornerstone of which was an exceptional offer by the World Bank to provide up to $20million in 1994 and <strong>1995</strong> to match, at a 50 percent rate, additional contributions from other <strong>CGIAR</strong>Members in support of the agreed Research Agenda (i.e., for every $2 in additional Member contributions,the Bank would provide $1). For planning purposes, this was equally divided between 1994 and<strong>1995</strong> by the <strong>CGIAR</strong> Finance Committee. Almost every aspect of the <strong>CGIAR</strong> has been affected by thesubstance of the renewal process, and the measures, outlined in the Declaration and Action Programadopted at a Ministerial-Level Meeting in Lucerne, Switzerland in February <strong>1995</strong>, have been implemented.The financial targets of the stabilization program were fully met in 1994, enabling the <strong>CGIAR</strong> todraw on $10 million of extraordinary support from the World Bank. The stabilization program wasequally successful in <strong>1995</strong>, resulting in: full funding of the <strong>1995</strong> Research Agenda; sufficient additionalfunding to fully utilize the remaining $10 million of the World Bank’s exceptional support; and enhancementof the stability, predictability, and transparency of the <strong>CGIAR</strong>’s financing arrangements.OVERALL FINANCIAL RESULTSThe <strong>CGIAR</strong> is an informal association, which supports agricultural research and related activitiesof an international public goods nature carried out by the sixteen autonomous <strong>CGIAR</strong> Centers. IndividualMembers support Centers and programs of their choice, and each Center directly receives and spendsfunds. The <strong>CGIAR</strong> financial outcome discussed in this <strong>Report</strong> is consolidated from the financial results ofthe sixteen independent Centers.As shown in Table 1, revenue in <strong>1995</strong> totaled $344 million 2 percent above the 1994 level. Thisincluded $329 million in contributions from Members and $15 million in miscellaneous Center income. Thestabilization of funding enabled <strong>CGIAR</strong> Centers to resume their normal rates of expenditure. Total spendingin <strong>1995</strong> was $338 million, 5 percent higher than in 1994, when expenditures had been restrained due tofinancial uncertainties, until the renewal program was launched at MTM94 in May. Although spending rose ata faster rate than income, <strong>CGIAR</strong> operations produced a small surplus of $6 million, or about 2 percent ofoverall income in <strong>1995</strong>. This surplus increased the operating reserves of the CGL4R by $6 million, to about$51 million, an amount sufficient to cover approximately two months of expenditures. Capital investments in<strong>1995</strong> amounted to $29 million and, at end of <strong>1995</strong>, the capital renewal fund stood at $46 million, representingabout 11 percent of the historical cost of <strong>CGIAR</strong> facilities, equipment, vehicles, and other fixed assets.
AIDENVIRONMENTThe <strong>CGIAR</strong> is financed by contributions from an informal consortium of industrial and developingcountries, private foundations, and international and regional organizations. Industrial countries, specificallythe Members of the Development Assistance Committee (DAC) of the Organization for EconomicCo-operation and Development (OECD), account for more than two-thirds of <strong>CGIAR</strong> financing. Asa <strong>CGIAR</strong> contributions are financed from aid budgets, annual trends in total aid disbursements, or OfficialDevelopment Assistance (ODA), provide one of the more relevant indices for describing the <strong>CGIAR</strong>’sexternal financial environment.In <strong>1995</strong>, ODA amounted to $59 billion, some $0.2 billion less than the 1994 level, and the GrossNational Product (GNP) of DAC countries rose by about 10 percent. Therefore, the aggregate ratio ofODA to GNP in DAC countries declined from 0.30 percent in 1994 to 0.27 percent in <strong>1995</strong>. In itspreliminary report on the financial flows to developing countries in <strong>1995</strong>, the OECD noted that the <strong>1995</strong>ratio was the lowest that had been recorded since the United Nations adopted a target of 0.70 percent in1970. The OECD continues to project a dim outlook for ODA. In this environment, it is noteworthy thatsupport to the <strong>CGIAR</strong> has remained stable. Support by <strong>CGIAR</strong> Members to the <strong>1995</strong> Research Agendarepresented 0.46 percent of ODA, the same level as in 1994, but higher than the average of 0.41 percentachieved in 1991 to 1993. Details on trends in ODA and <strong>CGIAR</strong> contributions from DAC members areprovided in Annex Table 1-3.The reduction in ODA disbursements in <strong>1995</strong> arose from a substantial decrease in ODA byNorth American countries which fully offset increases by other countries. ODA provided by countriesin Asia and Oceania, led by Japan-the largest ODA provider by far-expanded by 9 percent.ODA contributed by European countries grew by 4 percent in <strong>1995</strong>. However, ODA of NorthAmerican countries dropped by 23 percent in <strong>1995</strong>, as the United States reduced its aid by 26percent. European Union (ELI) countries with significant increases in ODA in <strong>1995</strong> were Belgium,Ireland, and the Netherlands, while notable reductions were made by Italy and Portugal. In relationto GNP, Denmark replaced Norway as the most generous ODA contributor, providing almost 1percent of its GNP as ODA. The Scandinavian countries and the Netherlands remained ahead ofother DAC members in terms of the ODA/GNP ratio.<strong>CGIAR</strong>CONTRIBUTIONSThe Research Agenda comprises the bulk of <strong>CGIAR</strong> Center projects and activities. The <strong>CGIAR</strong>Research Agenda is recommended by the Technical Advisory Committee (TAC) of the <strong>CGIAR</strong>, basedon proposals by the <strong>CGIAR</strong> Centers. When endorsed by the Group, it become?? eligible for financing,from individual Members, including the World Bank. Projects included in the Agenda must meetfour criteria. They must: be aimed at producing research or research-related international publicgoods; be of high priority in terms of accomplishing the <strong>CGIAR</strong>’s goals and objectives; have acceptableprobabilities of success; and have no alternative producers or sources of supply with suitablecosts or reliability. Funding for Agenda projects is termed Agenda support. The non-agenda categoryis made up of those Center activities/projects which an individual Center is in a position toundertake because of past experience, location, size, or other factors, but which do not meet all ofthe criteria for inclusion in the Research Agenda. The World Bank does not support non-agendaactivities. As part of the <strong>CGIAR</strong>’s renewal program, most Members stated their intention to channeltheir support to Agenda activities.3
In <strong>1995</strong>, contributions from Members amounted to $329 million, comprising $270 million for theagreed Agenda and $59 million for non-agenda programs. Total contributions increased by 1 percent, or$4 million, over 1994. Contributions for the agreed Agenda expanded at a slower pace, by less than 1percent, from $268 million in 1994, compared with those for non-agenda programs, which increasedby 4 percent, from $57 million. Centers and Members will need to monitor this carefully to ensurethat, in the future, the <strong>CGIAR</strong>’s Research Agenda remains the priority for financial support. Trendsin <strong>CGIAR</strong> funding from 1991 to <strong>1995</strong> are illustrated in Chart 1.Chart 1. <strong>CGIAR</strong> Funding, 1991-<strong>1995</strong>(in $ million)350+-Research Agenda -Total30025020015010050019911992 1993 1994 <strong>1995</strong>ContributionProfileIn <strong>1995</strong>, 41 Members, including two new Members, Egypt and Iran, contributed to the <strong>CGIAR</strong>Research Agenda, as compared with 39 Members in 1994. The average contribution in <strong>1995</strong> was $6.5million. The support provided by the top ten contributors to the <strong>CGIAR</strong> funded about three-quarters ofthe Research Agenda. This profile of contributions in <strong>1995</strong> remained unchanged from 1994.The forty-one contributing <strong>CGIAR</strong> Members can be placed into four distinct groups: industrial countries(191, developing countries (91, foundations (2), and international and regional organizations (11). Foranalytical purposes, industrial countries can be further subdivided along geographical lines, into three subgroups:Europe, North America, and Pacific Rim. This classification is used throughout the <strong>Report</strong>. It shouldbe emphasized, however, that, as contributions to the <strong>CGIAR</strong> are voluntary and each <strong>CGIAR</strong> Member has thefreedom to decide which Centers to support and at what level, the trends emerging from any of the groupingsshould not be interpreted as policy decisions by the group concerned.As shown in Chart 2, contributions to the Agenda in 1994 and <strong>1995</strong> by Member groupings indicatea decline in the share of the North America group, while both the European and developing countriesgroups expanded their shares.Special efforts by individual Members contributed to the success of the stabilization program in<strong>1995</strong>. Some of these Members-Denmark, Norway, and Belgium-had also made a special effort in 1994,4
while others-India, Mexico, and new Members Egypt and Iran-provided funds in <strong>1995</strong>. Through theefforts of the latter group, contributions by developing countries increased by over 61 percent from 1994,increasing their share of the total from 1 percent to 2 percent. Other sources of incremental funds in 199 jwere Finland, Luxembourg, and the Netherlands. As in 1994, the Agenda was also supported in <strong>1995</strong> bythe redirection of funds from non-agenda activities to Agenda programs by the major traditional providersof such support, including Australia, the Netherlands, and the European Commission (EC).Chart 2. Agenda Contributions, 1994-<strong>1995</strong>(by Member group in $ million and percentages)300 1 I250200.NorihAmerica150Ii The EC is included in the European groupChart 3 illustrates the top ten contributors to the <strong>1995</strong> Research Agenda. As shown in AnnexTable II-l, Japan became the largest contributor after the World Bank in 1994. This continued in <strong>1995</strong>.Also notable is that Denmark became, for the first time, one of the top ten contributors in <strong>1995</strong>.Chart 3. <strong>1995</strong> Top Ten Agenda Contributors(in S million)World BankJapanU.S.ECGermanyNetherlandsCanadaSwitzerlandDenmarkUnited Kingdom0 10 20 30 40 50-i5
Chart 5. Changes in Center Funding, 1994-<strong>1995</strong>(in S million)2.01.51.00.50.0-0.5-1.0-1.5-2.0-2.5 LIAGENDA RESOURCES USED BY THE CENTERS IN <strong>1995</strong>Spending on Agenda programs in <strong>1995</strong> expanded by 8 percent over the 1994 level of $265million. The allocation of the <strong>1995</strong> level of $286 million is reviewed below from three perspectives: by<strong>CGIAR</strong> activity; by region; and by object of expenditure.By <strong>CGIAR</strong> ActivityChart 6 illustrates <strong>1995</strong> expenditures by the five principal <strong>CGIAR</strong> activities or undertakings: increasingproductivity; protecting the environment; saving biodiversity; improving policies; and strengtheningnational agricultural research systems (NARS). The overall distribution of resources does notindicate significant shifts in <strong>1995</strong>, but confirms the recent trends shown in Table 1 and elaborated below.Details for the period 1993 to <strong>1995</strong> can be found in Annex Tables 1114, 5, and 6.Chart 6. <strong>1995</strong> <strong>CGIAR</strong> Expenditure(in S million)by <strong>CGIAR</strong> Undertaking140120100806040200Increasing Protecting the Saving Improving StrengtheningProductivity Environment q iodiversity Policies NARS50%45%40%35%30%25%20%15%10%5%0%
l Investment in “protecting the environment” and “saving biodiversity” continued to increase in<strong>1995</strong>, although at a lower rate, after sharply rising in 1993 and 1994.. Investment in “increasing productivity” continued to be the major thrust of <strong>CGIAR</strong> activities. Thedecline noted in earlier years appeared to have reversed with a slight increase in <strong>1995</strong>. Cropscontinued to be the major focus, accounting for 73 percent of the investments, followed bylivestock at 18 percent, forestry at 8 percent, and fish at 2 percent.. Investment in “strengthening NARS” declined. However, in <strong>1995</strong> there appeared to be a shiftwithin this activity area, with training receiving more resources at the expense of information anddocumentation activities.By RegionThe <strong>1995</strong> allocation of <strong>CGIAR</strong> resources by the developing regions of the world is shown inChart 7. This allocation has remained broadly stable, as indicated in Table 1. <strong>CGIAR</strong> expenditureson research targeted to Sub-Saharan Africa (SSA) continued to increase in dollar and percentageterms in <strong>1995</strong>, consistent with the Lucerne Declaration. Although investments for other regions‘stabilized in percentage terms, they continued to increase in dollar terms for all regions except WestAsia and North Africa (WANA). As shown in Annex Table 111-7, almost all Centers had activitiesaimed at Sub-Saharan Africa in <strong>1995</strong>, with four Centers-IITA, ILRI, ICRAF, and ICRISAT-accountingfor over two-thirds of the resources committed. The pattern was similar in Asia. A majority ofthe Centers carried out activities in Asia in <strong>1995</strong>, and four Centers-IRRI, ICRISAT, CIMMYT, andCIP-accounted for the bulk of the investments. On the other hand, over two-thirds of the investmentsmade in WANA continued to be made by ICARDA, while CIAT accounted for about half of theinvestments made in Latin America and the Caribbean (LAC).Chart 7. <strong>1995</strong> <strong>CGIAR</strong> Expenditureby RegionWANAAsla32%By Objectof ExpenditureThe trend in reduced spending on personnel, noted in 1994, continued in <strong>1995</strong>. While actualdollar amounts spent on personnel increased in <strong>1995</strong>, the rate of increase in spending was lower than theoverall spending rate. This was also confirmed by staffing numbers, which continued to decline inabsolute terms for both internationally and nationally recruited staff. As shown in Chart 8, personnel8
costs amounted to 55 percent of total spending in <strong>1995</strong>. This compares with 56 percent in 1994, and anaverage of 58 percent during 1991 to 1993, as indicated in Table 1. These developments are indicative ofthe continuing trend at Centers to control spending on personnel as a measure to increase financialflexibility in an increasingly volatile aid environment.Chart 8. <strong>1995</strong> <strong>CGIAR</strong> Expenditureby ObjectTravelDepreciation7%31%55%Spending data for <strong>1995</strong> also includes one-time costs associated with staff separation for severalCenters, particularly ICRISAT and CIAT. There were no significant changes in expenditures on suppliesand services, travel! and depreciation in <strong>1995</strong>, although there appears to have been a modest increase inspending on travel, possibly caused by the significant expansion of inter-Center initiatives in <strong>1995</strong>.Details by Center are available in Annex Table III-3.STAFFINGPATTERNSThe downward trend in personnel numbers of both internationally and nationally recruited staffcontinued in <strong>1995</strong>, as shown in Chart 9. For internationally recruited staff, the reductions occurred inChart 9. <strong>CGIAR</strong> Staff Changes, 1991-<strong>1995</strong>--Clnlernatlonal staff +TotaI staft5%0%-5%-10%-15%1991 1992 1993 1994 <strong>1995</strong>9
non-agenda activities, and staffing for Agenda programs stabilized at the <strong>CGIAR</strong> level. This phenomenon,however, did not necessarily occur at all Centers, as work programs continued to expand in areas, suchas forestry, where <strong>CGIAR</strong> initiatives are recent. The reduction in nationally recruited staff was mostnotable at ICRISAT, where there was a reduction of over 20 percent.INFLATIONThe costs at <strong>CGIAR</strong> Centers are affected by both inflation and fluctuations of currency values-therelationship between the exchange rates of expenditure currencies and the U.S. dollar, which is the unitof account in the <strong>CGIAR</strong>. An aggregate <strong>CGIAR</strong> cost increase index in dollar terms can be establishedusing data on the proportion of expenditures in various currencies and the annual exchange rates ofcurrencies reported by the International Monetary Fund (IMF). For <strong>1995</strong>, the loss of purchasing powerdue to cost increases was 5 percent. Annex Table III-9 illustrates Center weighted inflation rates from1991 to <strong>1995</strong>.10
II.<strong>1995</strong> <strong>CGIAR</strong> FundingEVOLUTION OF <strong>1995</strong> SUPPORT TO THE AGREED RESEARCH AGENDAA chronologicalsummary of the steps taken to secure <strong>1995</strong> Agenda funding is provided below:. At International Centers Week 1994 (ICW94), the Group approved funding for the <strong>1995</strong> ResearchAgenda at a level of $271 million, as recommended by the Finance Committee, which had determinedthat resources were likely to be available at a level sufficient to finance Agenda requirements.. At the Lucerne Ministerial-Level Meeting in February <strong>1995</strong>, the Finance Committee reviewed theSecretariat’s revised projection confirming the availability of full funding, and approved the allocationof the remaining World Bank contribution, with the exception of a small reserve of $2.5 million.. By April <strong>1995</strong>, when details of the <strong>1995</strong> financing plan were released to the Centers by theSecretariat, it seemed likely that <strong>1995</strong> funding might reach $276 million.. By ICW95, however, it became apparent that slower project implementation rates were likely toresult in Agenda income at a reduced level of about $272 million. At their meeting during ICW95,the Finance Committee noted that the availability of funding for individual Centers continued tobe within f5 percent of the levels indicated in the financing plan, Hence, the Finance Committeedecided to retain a reserve of $2.5 million, which was carried forward into 1996. [See the sectionon World Bank Support below.1. The final outcome of funding at a level of $270 million is broadly in line (99 percent) with theapproved financing plan. Funding available to the Centers was slightly less, at $267 million (98percent of the levels approved in the financing plan), because of the $2.5 million reserve.<strong>1995</strong> was the second and final year of the financial stabilization program launched at MTM94, aselaborated in Part I of this <strong>Report</strong> on “<strong>1995</strong> Highlights.” The <strong>1995</strong> outcome confirms that the remaining$10 million in extraordinary funds provided by the World Bank were matched as required by $20 millionfrom other <strong>CGIAR</strong> Members. A summary is shown in Table 2, and details of the stabilization program in<strong>1995</strong> by Member are illustrated in Annex Table 11-4.Table 2. Matching the World Bank’s $20 Million Contribution to the <strong>CGIAR</strong>, 1994-<strong>1995</strong>(in $ million)1994 <strong>1995</strong> TotalNew funds from MembersNon-agenda funds redirected to the AgendaTotal fundsMatching funds from WI3 l’10.1 10.0 20.110.2 10.0 20.220.3 20.0 40.310.0 10.0 20.0” 50 percent of total funds to be matched, up to $20 million.11
STRUCTUREOF CONTRIBUTIONSAgenda funding comprises unrestriced and restricted contributions. The composition of Agendafunding from 1991 to <strong>1995</strong> is shown in Chart 10 and details by Center are provided in Annex Table 11-3.Noteworthy is that unrestricted funding continued to increase in absolute terms in <strong>1995</strong>, although inpercentage terms the composition did not change much from 1994-remaining at roughly three-quartersunrestricted and one-quarter restricted. The increase in 19% was due to the fact that virtually all of theincremental funds received in <strong>1995</strong>-from Denmark, Finland, the Netherlands, Norway, Egypt, India, andMexico-were unrestricted.Chart 10. Composition of Agenda Funding, 1991-<strong>1995</strong>(in $ million)n Unrestrictedn RestrictedI250WORLD BANK SUPPORTThe World Bank’s <strong>1995</strong> contribution of $50 million was comprised of its “regular” contribution of$40 million and the second half of the special contribution for the stabilization program, at $10 million.The Bank’s total contribution was allocated and disbursed in two tranches, each aimed at a differentobjective as per the recommendations of the Finance Committee adopted at ICW94. The first tranche of$25 million, was disbursed in January <strong>1995</strong> in proportion to the approved budgets of the Centers (about9.5 percent for each Center). The second tranche, disbursed in February <strong>1995</strong>, was aimed at filling thegaps remaining in the approved Center budgets after all other funding had been allocated. The FinanceCommittee decided to hold back $2.5 million from the second tranche to cover any adverse changes inthe funding picture later in the year. Thus, $22.5 million was allocated to fill funding gaps in February. AtICW95, the Finance Committee decided that the safety reserve of $2.5 million should not be distributed,but instead carried forward into I996 to buffer unexpected financial shocks.Bank support amounted to 18 percent of total <strong>CGIAR</strong> Agenda support. All sixteen Centers receivedBank support in <strong>1995</strong>, ranging from 8 to 27 percent of Agenda contributions. Nine Centersreceived 18 to 27 percent, as compared to 1994, when the same nine Centers received 19 to 30 percent.12
The top five recipients of Bank funds, accounting for 60 percent of the total, continued to be ILRI,CIMMYT, ICRISAT, IITA, and CIAT, as has been the case since 1992, although their rank ordering hasvaried over the years. In <strong>1995</strong>, ICRISAT moved up to the second highest level, with CIMMYT, while CIATmoved down to fifth overall. Chart 11 illustrates the distribution of Bank support in <strong>1995</strong>, both in termsof the actual amount provided to each Center and the percentage it represented of the Center’s totalfunding. A longer-term perspective for the period 1991 to <strong>1995</strong> is available in Annex Table 11-7.Chart 11. Distribution of <strong>1995</strong> World Bank Support(by Center).tgg5 World Bank funding in $ million.WorldBank as a % of total agenda funding25%DISBURSEMENTSCHEDULEThe <strong>1995</strong> disbursement schedule was substantially ahead of 1994, marking progress toward thedisbursement targets set as part of the stabilization plan-j0 percent of commitments disbursed in Januaryand the balance by mid-year. Several Members-Austria, the Ford Foundation, the Arab Fund, andthe United Nations Development Programme (UNDP)-accelerated their schedule from the second tothe first half of the year, thus boosting the System’s disbursement profile by 10 percent, to 43percent during the first half of the year. The improvement continued in the second half of the year,with France and Japan disbursing their contributions, hence, by the end of the third quarter over 75percent of the contributions had been disbursed, compared to 54 percent at the same period in 1994.The improved System disbursement trends are illustrated in Chart 12, and details are provided in AnnexTable II-S.<strong>1995</strong> NON-AGENDA CONTRIBUTIONSThe <strong>1995</strong> funding of non-agenda activities amounted to $59 million, 4 percent higher than the1994 level of $ j7 million. The increase in non-agenda funding in 199 j suggests the need for the SystembothCenters and Members-to closely monitor this in the future to ensure that the agreed Agendareceives priority for financial support.13
Chart 12. <strong>1995</strong> Disbursement of Funds(Cumulative percentages)100%90%80%70%60%50%40%30%20%10%0%IICompositionof FundingChart 13 shows the composition of <strong>1995</strong> non-agenda funding by Member group. The distributionwas consistent with the historical trend in the <strong>CGIAR</strong>! in which the industrial countries have largelyaccounted for non-agenda support, in addition to the support they provide to the agreed Agenda.Chart 13. <strong>1995</strong> Non-Agenda Funding(by Member group in percentage terms)DevelopingNon-<strong>CGIAR</strong>lnteandNorth America17%Foundations4%Ii The EC is included in the European group.The five largest contributors in <strong>1995</strong>--the United States, Switzerland, Germany, Japan, and the Netherlands-provided45 percent of non-agenda support. This was the same share as provided by the top fivecontributors in 1994-the United States, Switzerland, UNDP, Germany, and Australia. Chart 14 shows thecontributions made to both Agenda funding and non-agenda f&ding by the largest contributors in 19%.14
Chart 14. Largest Contributors of <strong>1995</strong> Non-Agenda Funding(in $ million)1q Non-*ganda Funding . Plgenda FundingU.S.SwitzerlandGermanyNetherlandsJapanUNDPI0 5 10 15 20 25 30 35CenterPerspectiveAmong the Centers, the five largest recipients of non-agenda funding in <strong>1995</strong> were IRRI, IITA,IPGRI, CIMMYT, and ISNAR, which together received 60 percent of all non-agenda contributions. Thiswas the same percentage received by the top five in 1994-IRRI, IITA, CIAT, IFPRI, and IPGRI. Chart 15shows <strong>1995</strong> non-agenda funding by Center. Annex Table II-10 illustrates the flow of non-agenda contributionsfrom Members to Centers in <strong>1995</strong>.12Chart 15. <strong>1995</strong> Non-Agenda Funding(by Center in $ million)86The increase in <strong>1995</strong> notwithstanding, it is worth noting that the number of Centers with none ornegligible non-agenda funding (i.e., below $0.6 million) increased from zero in 1994 to three in <strong>1995</strong>-ICARDA, ICLARM, and ILRI. &15
III. <strong>1995</strong> <strong>Financial</strong> PositionA complement to the discussion of <strong>CGIAR</strong> contributions and expenditures is an analysis ofthe System’s financial position. The aggregation of Center financial information for 1991 to <strong>1995</strong> isshown in Table 3 as the <strong>CGIAR</strong> System financial position. Annex Table IV-I provides details byCenter. Using standard measures of financial analysis,, the <strong>1995</strong> financial information confirms anumber of positive trends, and indicates that the <strong>CGIAR</strong> as a whole, and the Centers individually,are in good financial condition.NETASSESTSThese balances are prime indicators for not-for-profit organizations, equivalent to equitycapital and reserves in a for-profit organization. A growth trend in these balances is a positiveindicator of financial health, although there is no norm for the optimal size of the balances. Netassets include capital invested in fixed assets, operating funds, capital-related funds, and funds setup for special purposes.The steady increase in the <strong>CGIAR</strong>’s net assets since 1991 has been led by a build up of the capitalrenewal fund following the introduction of depreciation accounting. While the overall level of net assetsincreased in <strong>1995</strong>, it was largely due to increases in fixed assets, reflecting capital renewal as fundbalances stabilized. This is consistent with the resumption of expenditure growth in <strong>1995</strong>, noted earlier,following a period of financial uncertainties during 1993 to 1994, when many Centers suspended theircapital investment plans.OPERATINGFUNDThe operating fund is the accumulated operating surplus/deficit, as is shown on the statement offinancial position. This is equivalent to “retained earnings” in a business enterprise.The operating fund (i.e., retained earnings) maintained an upward trend in <strong>1995</strong>. This was alsoreflected at the Center level, as most Centers were able to match expenditures and revenues closely, withthe result that operating fund levels were maintained. As shown in Chart 16 (see page 181, operatingfund levels at the majority of Centers in <strong>1995</strong> were at or above the average of 58 days coverage of theirspending requirements. ICRISAT’s operating fund, which had been fully exhausted in 1994 to meet staffseparation costs, was not replenished in <strong>1995</strong>; however, ICRISAT intends to do so in 1996.LIQUIDITYLiquidity, as measured by the current ratio and working capital, has stabilized at a levelreflecting sound cash management practices at most Centers.CurrentRatioCurrent ratio is current assets divided by current liabilities, represented as a fraction. This liquiditymeasure is comparable across organizations, regardless of size, because it is a relative figure. Different16
Table 3. <strong>CGIAR</strong> System <strong>Financial</strong> Position, 1991-<strong>1995</strong>(in $ thousand)AssetsCurrentAssetsCash and cash equivalentsAccounts receivable:DonorsEmployeesOthersInventoriesPrepaid expenses1991 1992 1993106,534 134,956 142,30546,476 50,594 34,7762,649 3,074 2,51317,582 12,287 13,5519,785 9,405 9,4254,719 3,629 4,0341994 <strong>1995</strong>174,646 164,75641,3122,26813,17910,0624,43511,79642,9401,95116,22310,1373,96915,477Other current assets 3,7311 7,3131 8,3971Total Current Assets I 191,4761 221,2581 215,0011 257,698( 255,454Fixed AssetsProperty, plant and equipmentLess: accumulated depreciationTotal Fixed Assets (net)Total AssetsLiabilities and Net AssetsCurrent LiabilitiesBank indebtednessAccounts payable:DonorsEmployeesOthersIn-trust accountsAccruals and provisionsTotal Current Liabilities349,402 389,220 407,982 413,397 431,721146,616 174,212 187,165 202,390 214,113I 214,459 215,008 220,817 211,007 217,608I 405,935 436,266 435,818 468,705 473,0612,206 4,319 10,362 1,365 2,36841,683 67,804 40,109 63,176 60,255871 6,190 2,060 2,923 4,43434,372 34,082 29,636 30,882 29,3512,500 3,252 2,438 3,422 1,21840,889 23,491 44,256 41,109 38,339I 122,521 139,138 128,861 142,877 135,965Long-TermLiabilitiesLong-term loan 0 0 1,174 1,098 1,128Other 15,870 12,314 6,502 14,604 14,842Total Long-Term Liabilities I 15,870 12,314 7,676 15,702 15,970Total LiabilitiesI 138,391 151,452 136,537 151,935Net AssetsCapital invested in fixed assets:Center-owned 213,381 213,914 218,108 201,909 211,383In custody 64 66 1,642 10,240 10,468Capital fund 11,811 26,271 37,072 50,392 46,160Operating fund and other funds 42,288 44,564 42,459 47,585 53,115Total Net Assets I 267,544 284,815 299,281 310,126 321,127Total Liabilities/NetAssetsI 405,935 436,267 435,818 468,705 473,06 117
Chart 16. <strong>1995</strong> Operating Fund(by Center in days)types of enterprises may have a different “norm” for what is considered a healthy ratio. Manyenterprises aim to maintain a current ratio of 1.6 to 2.0. The systemwide current ratio in the <strong>CGIAR</strong> continuedto increase in <strong>1995</strong>, indicating an improving relationship between current assets and current liabilities. Thispositive trend is shown in Chart 17.Chart 17. CGL4R System Current Ratio,1991-<strong>1995</strong>I 2.00 )1.801.601.401.201.000.800.600.400.200.001991 1992 1993 1994 <strong>1995</strong>IThe current ratios for the majority of Centers were clustered around the System average of 1.9.Exceptions included lows of 1.1 at ICLARM and WARDA, to a high of 4.1 at CIFOR. Chart 18 shows Centerspecific current ratios for <strong>1995</strong> and 1994.‘18
Chart 18. Current Ratio, 1994-<strong>1995</strong>(by Center)WorkingCapitalWorking capital, defined as current assets minus current liabilities, is a basic liquidity measure, theprimary indicator of the short-term solvency of an organization. Because of the different sizes of theCenters, absolute numbers are not helpful for comparative purposes, but any negative figure suggests afinancial problem at the Center.Chart 19 illustrates another liquidity measure, working capital expressed in terms of cash requirementsby Center in days, for <strong>1995</strong> compared to 1994. The low coverage at CIAT, ICLARM, and WARDA is likely torequire careful management of cash at these CentersChart 19. Working Capital, 1994-<strong>1995</strong>(by Center in days)+<strong>1995</strong> -cl994500450400350300250200150100500'19
FIXED ASSETSThe book value of fixed assets, net of accumulated depreciation and other adjustments, waslargely unchanged in <strong>1995</strong>, indicating a stable pattern of capital acquisition, an expected outcome ofdepreciation accounting and financing policies adopted by the CGlAR in 1991. As shown in Annex Table111-2, capital investments averaged about $2 j million for 1992 to <strong>1995</strong>. Acquisitions surged in <strong>1995</strong> to alevel of $29 million after a low of $20 million in 1994, due to the financial restraints in 1994 referred toearlier. IITA had the largest investment program in <strong>1995</strong> at $6 million, followed by IRRI and CIAT at about$4 million each. Chart 20 illustrates the <strong>1995</strong> year-end levels of fixed assets, net of depreciation, for allCenters.Chart 20. <strong>1995</strong> Net Fixed Assets(by Center in $ million)4035302520151050CapitalFundThe capital fund represents the Center’s accumulated funds available for future fixed asset replacementand acquisition. It is primarily established by setting aside funds each year, equal to the valueof the annual depreciation charge. The mechanism of capital fund accumulation, through the funding ofdepreciation, appeared to be working as planned in <strong>1995</strong>. After a period of rapid accumulation, thecapital fund stabilized at about 11 percent of the gross value of <strong>CGIAR</strong> fixed assets. The <strong>1995</strong> capital fundby Center is shown in Chart 21. WARDA was able to replenish its capital fund in <strong>1995</strong>, thereby eliminatingthe earlier deficit. CUT’s capital fund notably deteriorated, as the Center was forced to resort to deficitfinancing to cope with a mismatch between its projected and actual income. The Secretariat will continueto monitor this development to ensure the adequacy of the fund to support the continuing renewal ofcapital assets.20
Chart 21. <strong>1995</strong> Capital(by Centerin $ million)Fund.-119753121
Iv. Compliance with <strong>Financial</strong> GuidelinesThe <strong>CGIAR</strong> Centers are independent organizations governed by policies established by theirBoards of Trustees. In the interest of transparency and consistency in financial practices and presentationof financial information, the Centers follow common financial guidelines issued by the Secretariat. Theseguidelines aim to bring <strong>CGIAR</strong> financial practices into conformity with those generally accepted. Theywere developed with the input of Center financial personnel, external financial experts, and Secretariatstaff, and are amended as required to reflect changing practices. Guidelines covering accounting policiesand the preparation of externally audited annual financial statements are particularly relevant in thisregard. The most recent revision of these guidelines took effect in 1993 and brought <strong>CGIAR</strong> practices upto date with the current practices for not-for-profit organizations.As part of its annual review of substantive financial performance, the Secretariat has reviewed theexternally audited <strong>1995</strong> Center financial statements, confirmed their compliance with <strong>CGIAR</strong> policy andreporting guidelines, and noted that any departures had not resulted in any material misstatement offinancial information.22
Table I-B. <strong>CGIAR</strong> Contributions to the Agreed Research Agenda by Member, 1972-<strong>1995</strong>(in $ million)AnnexI11 Non-<strong>CGIAR</strong> member.
Table I-2. <strong>CGIAR</strong> Contributions to the Agreed Research Agenda by Center, 1972-<strong>1995</strong>”(in $ miLlion)AnnexICIATCIFORCIMMYTCIPICARDAIClARMICRAFICRlSATIFPRIIIMI52IITAILR?lPGRl=IRRlISNARWARDA11 Figures shown for 1972-1980 are total expenditures (operations/capital) and may be higher or lower than the contributions for that year (due to the accounting convention followed in the seventies).2/ Formedy ILCA and ILRAD.31 Formerly IBPGR and INIBAP.
Table I-3. ODA and <strong>CGIAR</strong> Contributions by DAC Countries, 1991-<strong>1995</strong>AnnexI25
<strong>1995</strong> ODA and CGIAW Cmtributisns by DAC Countries(by ODA/GNP ratios)NB. An illustration of Annex Table I-3..ODAasa%ofGNPn CGfAf? Confributicms as % Total ODA0.00% 0.20% 0.40% 0.60% 0.80% 1 .OO% 1.20%DenmarkSwedenNorwayNetherlandsFranceCanadaLuxembourgBelgiumSwitzerlandAustraliaFinlandAustriaGermanyUKJapanIrelandPortugalSpainNew ZealandItalyUSA0 2 4 6 8 IO 12 14 16I ODA in U.S.$ billion26
AnnexTable II-l. Ranking of <strong>CGIAR</strong> Contributions to the Agreed Research Agenda, 1991-<strong>1995</strong>II#MCIlaoan 23.70 1Canada 15.73 1Zermany 11.04Switzerland 10.16JNDP 6.64Netherlands 6.45DB 6.31blY 6.07Sweden 6.07-inland 5.91Uofwav 4.68%ance 4.10Denmark 3.39Belgium 3.319ustralia 3.17AFDB 1.55Ford Fdn 1.18Austria1 .ooRockefeller 0.90J.S. 48.12Norfd Bank 37.62Japan 26.89Canada 17.55World BankJapanCanadaGermanvIII40.47 World Bank 49.97 II World Bank 50.02laoan 33.9440.00 32.61 1-L3ermany 13.7115.7513.27IEC 13.33 EC 12.09 14.70 II Netherlands 12.82J.K. 11.10 U.K. 9.42Switzerland 10.60 Switzerland 9.18Sweden 8.62 Netherlands 8.34Netherlands 7.64 UNDP 7.27JNDP 6.87 Sweden 6.22Vorway 5.83blY 5.80DB 5.11France 4.91Denmark 4.86Australia 4.38Belgium 3.30 BelgiumFord Fdn 1.75Rockefeller 1.47 AustriaAustria 1.05 AFDB +I IZDB 1.50Finland 1.01 Rockefeller 0.85 11 Rockefeller 1.30 11 India 1.2EIDRC 0.89Arab Fund 0.64 ADB 0.79 Ireland0.tIDRC 0.54 Arab Fund 0.62 Snain0.62 ILIndia 0.50 Soain 0.62Korea 0.50 Korea 0.5c China 0.50 II Ire1China 0.5c India 0.50 III 4DB 0.65 11 ADB 0.97India 0.5cIFAD 0.41Ireland 0.34AFDB 0.2:Philippines 0.2;OPEC Fund 0.11China 0.30Luxemboura 0.25PhilioDines 0.20Nigeria 0.12OPEC Fund 0.12Mexico 0.10Brazil 0.09UNEP 0.03MexicoO.OfNigeria 0.0:IDRCPhilippinesFinlandADBLuxembourgOPEC FundUNEP232.02.:247;2I27
Table 11-2. <strong>CGIAR</strong> System Grants by Center, 1991-<strong>1995</strong>AnnexIICIATCIFORCIMMYTCIPICARDAICLARMICRAFICRISATIFPRIIIMIIITAILRIIPGRIIRRIISNARWARDAI Total Core GrantsOther Net FlowsStabilization FundReserveTotal Support to theAnreed Research Anen&Total Non-AgendaI/ May not add up due to rounl28
Table II-5 <strong>1995</strong> <strong>CGIAR</strong> Funding by Center(in $ million)AnnexIICIATCIFORCIMMYTCIPICARDAICLARMICRAFICRISATIFPRIIIMIIITAILRIIPGRIIRRIISNAR-WARDA12.7 [ 7.312.0 6.74.3 3.37.4 a.822.8 3.2a.5 1.24.5 2.819.5 2.820.3 4.011.2 1.423.4 3.96.1 0.34.5 3.6:I,:::.:;:::::;,:.: :::.;.: ::::::.;:.::..I;.. ::::..,: .. ..To be allocatednot sum up due to rounding.29
Annex PI‘M-&c Ii&4. Connpnewts of Fimndal Support to the <strong>1995</strong> Agreed Research Agenda by Member(in $ million)IndustrializedAustraliacountriesGermanylrelandIt.&JaianLuxembourclFord Fdn. 1.8Rockefeller kdn.1.8 11 1.0 I 1.1 I 0.3 II n .:.SubtotalInternational &Regional OruanizationsADBAl-DBAbkdri”r’““-nr-l’DRCIt-ADtCFundi6.0 iI1.5 I 09 IIII30
” ..,_” . . ...=--...Table II-5 <strong>1995</strong> <strong>CGIAR</strong> Funding by MemberAnnexJIMembersEmoDe2ItalyLuxembourgNetherlandsNorwaySpainSwedenSwitzerlandPwhtntll..___.. . . .._- ..--Canada“Gvfi1 SubtotalCote d’lvoireEgyptIndia00.sst-T0Philippines1 Subtotal _.._. ...~~Total Member Countries 11143.46 36.36 11LeverhulrRockefell,. . _...Foundation TotalIlnt7 & Regional Organk_.-- Arm IIII0.97 II 0.97 IIAFDEi 1.14 II 1.14 10Nor&GMembers31
Table 11-6. <strong>1995</strong> Funding Outcome by Center(in $ million)AnnexII17.7 7.6 6.7 4.4 1 .:. 18.7 15.8 3.2 3.3 1.2 I 7.6 : I16.8 6.0 8.8L I I I24.1 1 14.2 1 2.8 1 5.2 I 22.2 I-.- -_ __-6.84.5 1.6 1 8;4 17.4 3.7 3.6 I271.2 158.2 61.4 47.5 .IReserve 2.5 2.5.:I’I I I I I II/ Includes external review costs for (CIAT-$0.3m, CIP-$0.3m, IITA-$0.3m and ICLARM-$O.lm), and FisheriesReserve for ICIARM ($1 .O m). Also included are systemwide and ecoregional allocations totaling about $5.5m.21 Institutional support in the form of unrestricted contributions.3/ Support restricted to programs or specific projects.32
Table 11-7. World Bank Funding by Center, 1991-<strong>1995</strong>AnnexII11 Allocation of the World Bank contribution to the Stabilization Fund. Also, an advance of $2.5 million from the StabFund was made in 1990 to enable centers to meet their operating levels.2/ An advance of $1.91 million from 1993 World Bank funding was made to centers in 1992. This is includedin center totals for 1992.3/ The <strong>1995</strong> reserve of $2.5 million will be allocated in 1996.33
AnnexTable II-S. Estimated Disbursement of 19% Funding to the Agreed Agenda by Member by Month(in $ million)Unrestricted ContributionsIIRestricted ContributionsMember
Table II-g. <strong>1995</strong> Support to the Agreed Research Agenda by Member by Center(in $ miuion)AnnexIILhrestricYedContributionsMembers CIAT ClFOk CIMMYT Clp ICARDA ICLARM ICRAF’ ICRISAT IiPRl, lliull IITA ILRI iPGRl IRRI ‘%NAR WARDA Unalloc. TotafI I I I I IAustralia II 0.191 0.341 0.671 0.151 0.191 0.221 O.lll 0.521 0.221 0.111 I 0.221 0.361 0.671 0.191 I t 4,’Finland1I I I I I I I JI I 0.171 0.421wwlIndiaIndonesiaIrelandltalv-11 357i i 63i 3 10i t3li 0.55i 0.25i0.~LuxembourgMavirnSwedenSwilzerland-...us,World Bank
RestricfedConfributionsTable H-9. <strong>1995</strong> Support to the Agreed Research Agenda bv . AI ember by Center, continued(in $ million)AnnexHIMembersBelgiumwch India I I I I I 1 I I I I I I I I ‘:::::;.:.::..ty,yyI 0.101 O.lOlo.osl0.1010.101 0.05::.:.:::.:::bi&I I n5nl l-.-.HllI:.:: . . ..:::..,. ..?..,.I I I II II I I “_“”I II I I: ::::.i::.:.vrItah! II I I I 007l oa3lI n .nlt‘.. ‘.!.:i...*NetherlandsI II _.-.I I 1.1.IIIIIIOPEC FundIInnal OflAl n I-Illnn2lIfir\?1...*.I, I I -. - - -. - . ” ” -I I“.“III I Y.YOF.. .. . ..&2Q..Others vI 0391 0751I I I n f-l71n mlII -.-- I “.“b1 . . :::g;fia. .: ...Rockefeller Fdn.0.15 0.04 I n&xlI I 1 “_“” nI I "."I mlIV.V-4,?,%I0.68 0.06I'..' :. :.I:68:... ?Spain“.“I nnal Y,YL nwJl I I I I I I I I I I ’ “’ “’ 0. -..o!iSwedenI nnil n n1 I IAcll nv.l‘.’ 1zwiirland 11 ;.:;IUSA -I, I I_.__ _,-_ _.0.441 0.171 II/ Non-CG Members.
Table 11-10. <strong>1995</strong> Non-Agenda Funding by Member by Center(in $ million)AnnexIIMembers CIAT CIFOR CIMMYT CIP ICARRA ICLAM KRAF JClUSAT IFPR1: IIivII iIT,A0 08 I 0.20 0.23 0.04 I 0.89 I 1.45.-.J3I0.01 0.10 0.07 0.421 0.021I 0 01 I I1.380.183I/ Non-CG Members.
Table III-l. <strong>CGIAR</strong> Expenditure, 1991-<strong>1995</strong>(in $ million)AnnexIIIResearchAgendaNon-AgendaCIAT !! 29.0 1 5.1CIFOR J! ]I CIMMYTICLARMICRAFCIP IFPRI ICARDA ICRISAT: 30.6 27.7 22.0 19.5 9.0 4.1IIMI I! !4.5 0.0 6.7 5.9ISNAR II 8.6 I 2.2WARDA 6.1 1.727.1 5.128.4 5.316.1 5.620.1 0.54.2 1.911.8 1.326.2 6.79.6 3.87.0 2.122.7 13.032.8 0.110.7 1.628.8 12.97.1 3.66.3 3.829.0 4.32.4 0.027.2 5.615.6 5.921.1 0.14.2 3.011.7 2.026.9 4.98.8 3.76.3 2.622.1 12.126.0 0.011.0 2.629.9 14.96.2 4.223.4 1 0.516.8 0.027.5 5.99.7 4.17.8 1.625.1 8.125.7 0.014.5 5.131.7 8.6--q-GAgeada " 248.4,258.7NonrAgeni+ ,, 50.367.2 "~C@LIRT&~ pw .,
Table III-2. Capital Investments by <strong>CGIAR</strong> Centers, 1992-<strong>1995</strong>(in $ million)AnnexIIIf992. ../ +1.70.32.40.01.12.13.6 4.7 3.70.5 0.7 0.41.8 1.6 2.70.8 0.5 1.01.7 0.7 1.40.1 0.1 0.71.1 1.3 1.03.4 1.3 2.70.2 0.2 0.30.4 0.6 0.72.1 2.9 6.01.1 1.5 2.70.2 0.3 0.49.4 2.3 3.90.0 0.1 0.20.5 1.1 1.2Memo Items:Fixed Assets (at cost) ”DepreciationExpenseI’ Net of disposals, as at December 31.39
Table III-3.<strong>1995</strong> <strong>CGIAR</strong> Object Expenditure(in $ million)AnnexIIICIAT a 66%l 56% l 64% i 21%1 32%1 22% I 6%l 12%l 7% II 7% I O%I 6% 1 lCXl%l lOO%I lOO%l40
Table 111-4. <strong>1995</strong> <strong>CGIAR</strong> Expenditure,(in $ million)by Activity’/AnnexIIICIAT 2.0 0.0 0.0CIFORCIMMYTCIPICARDA0.0 2.3 0.00.0 0.0 0.00.0 0.0 0.01.3 0.0 0.0ICLARM0.0 0.0 1.9ICRAF0.4 6.4 0.0ICRISAT0.0 0.0 0.0IFPRI0.0 0.0 0.0IIMI II 0.0 II 0.0 I 0.0 I 0.0 I 0.00.0 0.0 0.017.5 0.0 0.00.0 0.1 0.00.0 0.0 0.00.0 0.0 0.0z0.0 0.0 0.030.2 26.8 0.8877.6 7.7 1.02422.3 26.4 1.18421.1 19.9 0.94523.4 18.7 0.7986.9 7.6 1.10216.8 16.2 0.98527.5 26.0 0.9479.7 9.7 0.9987.8 7.3 0.93325.1 22.2 0.88525.7 24a3 0.944l/ Expenditure for Systemwide Initiatives and Programs is included in the activity/program columns above.2/ Matrix Funding Values: Expenditure is converted to funding by multiplying the <strong>CGIAR</strong> expenditure total in each column by the funding/expenditure ratio (i.e., 0.934)ActivityFUlldinfr: 1 1 36.0 19.7 8.3 1.8 1 1 1 1 1 19.9 15.1 5.6 8.5 1 1261.1Under&kingFun-: n 125.6 49.1SectorFunaYnx:cmps: 91.2 =Livestock: 22.1 =Trees: 9.4 =Fish: 2.8 q73%18%8%2%The values for sectoral aggregates were calculated by adding each Centetsexpenditure on “enhancement and breeding” (column 1) to the relevant cell incolumns 2-5. For CIAT and ICARDA the values in column 1 were dividedproportionate to the existing amounts in production systems (crops and livestock).
‘IMAe IEI-5. 1994 CG Expenditure, by Activity(in $ million)I/ Matrix Funding Values: Expenditure is converted to funding by multiplying the <strong>CGIAR</strong> expenditure total in each column by the funding/expenditure ratio (i.e., 1.013)ActivityJImdinT:UndertakingFunding:162.7 1 42.2 75.9 4.0 7.2 lpi-l ( pq 17.7 19.4 7.0 8.2 ] 1125.9 52.3 (SectorFunding:crops:Livestock:Trees:Fish:98.6 =19.6 =4.8 =2.0 =79%16%4%2%The values for sectoral aggregates were calculated by adding each Center’sexpenditure on “enhancement and breeding” (column 1) to the relevant cell incolumns 2-5. For CIAT and ICARDA the values in column 1 were dividedorocortionate to the existina amounts in croduction svstems (croos and livestock).
Table 111-6. 1993 <strong>CGIAR</strong> Expenditure,(in $ million)by ActivityAnnexIIInn I AA I nn IICLARMlCRAFICRISATIFPRIIIMIIITAILRIIPGRIIRRIISNARWARDAl/ Matrix Funding Values: Expenditure is converted to funding by multiplying the <strong>CGIAR</strong> expenditure total in each column by the funding/expenditure ratio (i.e., 0.924)Undertakingfindinn:1 [ 34.6 78.7 4.5 1.0 pi-j piy p-j 18.0 20.6 6.9 5.6 1 1234.7SectorFbndinn:crops:Livestock:Trees:Fish:82.5 = 73%22.7 = 20%6.0 = 5%1.6 = 1%The values for sectoral aggregates were calculated by adding each Center’sexpenditure on “enhancement and breeding” (column 1) to the relevant cell incolumns 2-5. For CIAT and ICARDA the values in column 1 were dividedproportionate to the existing amounts in production systems (crops and livestock).
Table III-7. <strong>1995</strong> Regional AllocationsGin S million)AnnexIII5%1 I.411 74%1 22.511 I II15% 3.37% 1.598% 22.93% 0.21 % 0.38% 0.83% 0.7&fQ& SSA, Sub-Saharan Africa; LAC, Latin America and Caribbean; WANA, West Asia and North Africa:” IPGRl’s expenditure also include $0.72 m for Europe44
Table III-S. <strong>CGIAR</strong>Staffmg, 1991-<strong>1995</strong>AnnexIIIResearchAgendaResearchAgendaCIATCIFORCIMMYTCIPICARDAICLARMICRAFICRISATA IFPRI“’ IIMIIITAILRIIPGRIIRRIISNARWARDA81 9 1,642 '/-Tpj=TI I I I75 1 12 1 1,241 11 76 1 4 1 1,099I ,c II 'I-J ' I --17 .I --- .- 0 , “JJ59 I 12 I 488 11 51 1 1r-l I”IIL.F.'PI I II I60 1 01 393 11 60 1 01 395102 Ia.2 .I e, .A” 3 I”60 14 1,348 61 14 1,41029 11 49 31 8 4711 6 223 17 0 25876 4 1,06723 3 6365 10 65352 9 60776 0 37918 0 17250 0 27183 9 1,74433 0 8318 3 31578 19 1,44383 0 73433 6 8363 10 1,473861 156. 9,981 : 861; :.; i37: 1 9,775I
Table III-9. <strong>CGIAR</strong> Centers’ Inflation Rates, 1991-<strong>1995</strong>(calculated by Uniform Measurement)AnnexIIICIAT GINi& CIPSystemIEPGR ICARDA ICRISAT IFPRt IITA ILCA’ ILRAD IRRI, iSMAR WARDA CIFOR IC&&.l ICRAF IllWl IPGRl ILRJ Total I’199119921993199411.8% 9.5% 10.3% 3.7% 4.4% -5.3% 3.5% -6.4% 12.8% 2.3% 4.6% 1.4% -1.4% 4.4%6.4% 7.8% 1.1% 3.9% 6.8% 1.1% -4.2% -16.9% -10.4% 6.2% 9.7% 7.4% 6.3% 0.7% -3.4% 3.8% 1.8%3.6% 6.0% -3.8% -6.3% 1.7% -3.5% -3.6% -7.7% -15.2% -6.7% 2.2% -0.8% -2.1% 2.4% -9.6% 1.7% -1.8%16.4% 0.8% 7.4% 2.5% 4.3% -2.8% 3.8% 11.6% 2.3% 16.5% 6.5% 4.0% -18.3% 3.4% 6.3% 12.9% 3.9% 5.9%<strong>1995</strong>8.4% -12.2% 6.5% 5.6% 7.1% 5.3% 0.1% 6.4% 10.4% 19.2% 3.8% 6.3% 8.5% 3.9% 4.8% 7.4% 5.2%9.2% 2.*% 4.2% 0.9% 4.4% -0.8% 0.9% -2.9% -3.3% 4.2% 9.9% 4.4% 0.0% 3.6% 5.9% 1.7% 3.9% 4.8% 7.4% 3.1%55.6% iO.S% 22.7% 3.6% 23.8% -3.8% 4.6% -t3.5% -42.5% 18.1% 32.9% 23.9% -0.1% 7.3%( 25.8% 7.0% 13.9% 4.8% 7.4% 18.4%II System totals through 1991 were calculated only for the 13 pre-expansion Centers.2/ The System inflation for 1994 has been revised following a correction in the adjusted inflation on the Kenya Shilling for ICRAF and ILRI31 Average and cummulative inflation for IBPGR, ILCA and ILRAD were calculated for the period 1991-1994 only.IIExolanatorv Notes:The inflation rates are dollar-based annual rates for each center. They are derived from three elements:1. the currency basket of a center’s expenditures (Source: Centers)2. annual inflation rates (as measured by the consumer price index) on the currencies in the basket (Source: IMF “International <strong>Financial</strong> Statistics”)3. annual changes in exchange rates of each currency in the basket against the US dollar (Source: IMF “International <strong>Financial</strong> Statistics”).Inflation Rates on Selected Currencies and Reaions Movements of Selected Currencies versus the US dollar7.0% 16.7% 0.7% 80.0% 6.3%96.1% -2.1% 8.3% -3.4% -1.8%-10.1% 6.0% 90.2% -6.2% -3.4%II Excludes United States and Canada.Note: Positive percentages are devaluations while negative ones are revaluations
Table IV-l. <strong>CGIAR</strong> Centers’ <strong>1995</strong> <strong>Financial</strong> Position(in $ thousand)AnnexIVLiabilities and Net AssetsCurrent liabilities
Printed on recycled paper.
<strong>CGIAR</strong> CentersCL4T - Centro International de Agricultwa TropicalApartado Aereo 6713Cali, ColombiaPhone: (;7-2) 4450-000Fax: (57-2) 4450-273E-mail: CIAT@cgnet.comCIFOR - Center for International Forestry ResearchJalan Gunung Batu 5Bogor 16001: IndonesiaPhone: 62 (251) 34-3652Fax: 62 (251) 32-6433E-mail: CIFOR@cgnet.comCIMMYT - Centro International de Mejoramiento deMaiz y Trig0Lisboa 27Apartado Postal 6-64106600 Mexico, D.F.: MexicoPhone: (52-5) 726-9091Fax: (52-5) 7%7559/7558E-mail: CIMMYT@cgnet.comCIP - Centro International de la PapaApartado 1558Lima 100, PeruPhone: (51-14) 366920Fax: (51.14)351570E-mail: CIP@cgnet.comICARDA - International Center for AgriculturalResearch in the Dry AreasPO. Box 5466Aleppo. Syrian Arab RepublicPhone: (963-21) 225012/225112Fax: (963-21) 213490E-mail: ICARDA@cgnet.com@internetICLARM - International Center for Living AquaticResources ManagementMC P.O. Box 2631 Makati Central Post Office0718 Makati, Metro Manila, PhilippinesPhone: (63-2) 817-5163&X: (63-2) 816-3183E-mail: ICLARM@cgnet.comICRAF - International Centre for Research inAgroforestryUnited Nations AvenueP.O. Box 30677Nairobi, KenyaPhone: (254-2) j21450Fax: (254-2) 521001E-mail: ICRAF@cgnet.comICRISAT - International Crops Research Institute forthe Semi-Arid TropicsCorporate Office and Headquarters Asia RegionPatancheru 502 324Andhra Pradesh, IndiaPhone: (91-40) 596161fix: (91.40)241239E-mail: ICRISATQcgnet.comIFPI& - International Food Policy Research Institute1200 17th Street N.W.Washington, D.C. 20036-3006 USAPhone: (l-202)862-5600Fax: (l-202)467-4439E-mail: IFPRI@cgnet.comIIMI - International Irrigation Management Institute127 Sunil MawathaPelawatte via ColomboSri LankaPhone: (94-l) 867404/869080/869081Fax: (94.1)866854E-mail: IIMI@cgnet.comIITA - International Institute of Tropical AgricultureOyo RoadP.O. Box 5320Ibadan, NigeriaPhone: (234-2) 241-2626tiX: (234-2) 2412221E-mail: IITAQcgnet.comILRI - International Livestock Research InstitutePlot No. L.R.l89/&‘RNaivasha RoadP.O. Box 30709Kabete via Nairobi, KenyaPhone: (254.2)630743Fax: (254-2) 631499E-mail: ILRI@cgnet.comIPGRI - International Plant Genetic ResourcesInstituteVia delle Sette Chiese 14200145 Rome; ItalyPhone: (39-6) 518921Fax: (39-6) 51892201E-mail: IPGRI@cgnet.comIRRI - International Rice Research InstituteP.O. Box 933Manila, PhilippinesPhone: (63-2) 818-1926Fax: (63-2) 891-1292E-mail: IRRIQcgnercomISNAR - International Service for National AgriculturalResearchLaan van iXieuw Oost Indi?2593 BM The Hague; The NetherlandsPhone: (31-70) 3496100Fax: (31-70) 3819677E-mail: ISNARQcgnet.comWARDA - West Africa Rice Development Association01 B.P. 2551Bouak& 01, CAte d’IvoirePhone: (225) 632396/633242/634514Fax: (225) 634714E-mail: WARDAQcgnet.com


