Ten-year overviewTen-year overviewAmounts in SEK million 2005 2006 2007 2008 2009 2010 2011 2012 2013 1 <strong>2014</strong>Income statement itemsNet sales 123,794 135,802 143,639 164,549 205,407 213,572 181,040 167,313 172,253 165,945EBITDA 43,175 43,938 45,821 45,960 51,777 60,706 54,538 54,271 43,554 41,038Operating profit (EBIT) 28,363 27,821 28,583 29,895 27,938 29,853 23,209 25,958 -6,218 -2,195Underlying operating profit 25,377 27,448 28,497 30,220 31,294 36,838 30,793 27,530 28,135 24,133Financial income 3,810 3,839 2,276 3,412 2,814 2,514 3,843 2,636 1,416 2,590Financial expenses -6,013 -6,135 -6,926 -9,809 -13,018 -10,944 -12,754 -10,476 -10,453 -8,635Profit before tax 26,160 25,525 23,933 23,498 17,734 21,423 14,298 18,118 -15,255 -8,240Profit for the period 20,518 19,858 20,686 17,763 13,448 13,185 10,416 17,047 -13,543 -8,284– of which, attributable to owners ofthe Parent Company 19,235 18,729 19,769 17,095 12,896 12,997 11,083 16,759 -13,668 -8,178– of which, attributable to non-controllinginterests 1,283 1,129 917 668 552 188 -667 288 125 -106Cash flow itemsFunds from operations (FFO) 31,386 35,673 34,049 30,735 36,700 40,108 38,256 34,419 31,888 32,131Cash flow from operating activities 24,423 35,207 32,331 36,194 46,246 41,231 33,468 28,485 37,843 40,146Free cash flow 14,341 23,178 19,650 18,963 27,566 23,846 17,637 12,619 23,579 23,234Balance sheet itemsCash <strong>and</strong> cash equivalents <strong>and</strong> short-terminvestments 14,074 22,168 22,659 40,236 56,940 43,873 28,685 46,495 27,261 45,068Equity 90,909 107,674 124,132 140,886 142,404 133,621 138,931 149,372 130,718 128,462– of which, attributable to owners ofthe Parent Company 80,565 96,589 111,709 129,861 135,620 126,704 131,988 140,764 120,370 115,260– of which, attributable to non-controllinginterests 10,344 11,085 12,423 11,025 6,784 6,917 6,943 8,608 10,348 13,202Interest-bearing liabilities 78,663 71,575 67,189 107,347 213,494 188,277 170,350 160,261 126,488 125,928Net debt 64,343 49,407 43,740 66,000 154,987 144,109 141,089 111,907 98,998 79,473Adjusted net debt — — — — 205,028 173,409 176,031 154,335 162,590 158,291Provisions 65,123 66,094 73,985 89,799 91,100 87,822 91,719 103,832 118,166 138,567Noninterest-bearing liabilities 90,373 77,823 72,930 107,795 155,129 131,712 123,558 114,899 110,112 103,476Capital employed, average — — — — — — 317,799 313,124 302,743 293,992Balance sheet total 325,068 323,166 338,236 445,827 602,127 541,432 524,558 528,364 485,484 496,433Key ratiosIn % unless otherwise stated. (x) means times.Operating margin 22.9 20.5 19.9 18.2 13.6 14.0 12.8 15.5 -3.6 -1.3Operating margin 2 20.5 20.2 19.8 18.4 15.2 17.2 17.0 16.5 16.3 14.5Return on equity 23.2 19.1 17.6 13.6 9.5 10.0 8.6 12.3 -11.4 -6.9Return on capital employed — — — — — — 7.3 8.3 -2.1 -0.7Return on capital employed 2 — — — — — — 9.7 8.8 9.3 8.2EBIT interest cover, (x) 7.6 7.2 6.7 4.5 3.1 4.1 2.6 3.7 -0.7 -0.1EBIT interest cover, (x) 2 6.9 7.1 6.7 4.6 3.4 5.0 3.3 3.9 4.1 5.0FFO interest cover, (x) 8.9 9.7 8.6 5.4 4.8 6.2 4.9 5.7 5.4 7.2FFO interest cover, net, (x) 15.1 15.9 12.2 7.1 5.6 7.5 5.8 6.6 6.2 10.1FFO/gross debt 39.9 49.8 50.7 28.6 17.2 21.3 22.5 21.5 25.2 25.5FFO/net debt 48.8 72.2 77.8 46.6 23.7 27.8 27.1 30.8 32.2 40.4FFO/adjusted net debt — — — — 17.9 23.1 21.7 22.3 19.6 20.3Equity/total assets 28.0 33.3 36.7 31.6 23.7 24.7 26.5 28.3 26.9 25.9Gross debt/equity 86.5 66.5 54.1 76.2 149.9 140.9 122.6 107.3 96.8 98.0Net debt/equity 70.8 45.9 35.2 46.8 108.8 107.8 101.6 74.9 75.7 61.9Gross debt/gross debt plus equity 46.4 39.9 35.1 43.2 60.0 58.5 55.1 51.8 49.2 49.5Net debt/EBITDA, (x) 1.5 1.1 1.0 1.4 3.0 2.4 2.6 2.1 2.3 1.9Adjusted net debt/EBITDA, (x) — — — — 4.0 2.9 3.2 2.8 3.7 3.9Other informationDividend to owners of the Parent Company 5,800 7,500 8,000 6,900 5,240 6,500 4,433 6,774 — — 3Investments 24,497 17,220 18,964 42,296 102,989 41,794 35,750 29,581 27,761 29,032Electricity generation, TWh 169.1 165.4 167.6 162.1 158.9 172.4 166.7 178.9 181.7 172.9Sales of electricity, TWh 200.3 191.1 193.8 189.3 194.6 194.2 209.4 205.5 203.3 199.0Sales of heat, TWh 34.1 35.2 36.2 35.6 37.9 47.1 41.6 29.8 30.3 24.1Sales of gas, TWh — — — 0.3 20.0 63.2 53.8 52.4 55.8 45.5Number of employees, full-time equivalents 32,231 32,308 32,396 32,801 36,593 38,459 37,679 33,059 31,819 30,1811) Certain amounts for 2013 have been recalculated compared with previously published information in Vattenfall's 2013 Annual <strong>and</strong> <strong>sustainability</strong> <strong>report</strong> as a result of new accounting rules(IFRS 11) that took effect in <strong>2014</strong>. See Note 2 to the consolidated accounts, Important changes in the financial statements compared with the preceding year.2) Based on underlying operating profit, i.e., operating profit excl. items affecting comparability.3) Proposed dividend.146 Vattenfall Annual <strong>and</strong> <strong>sustainability</strong> <strong>report</strong> <strong>2014</strong>
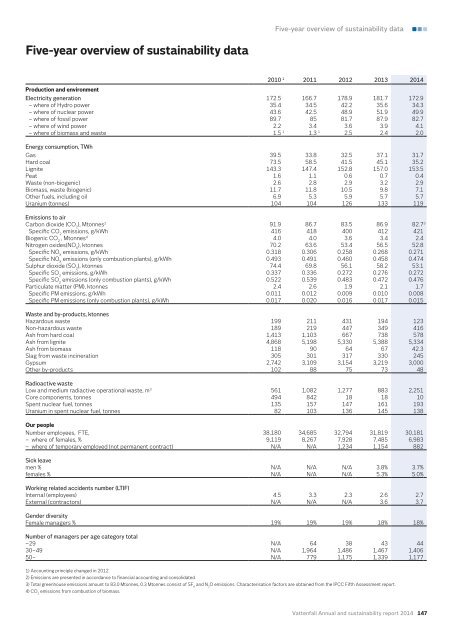
Five-year overview of <strong>sustainability</strong> dataFive-year overview of <strong>sustainability</strong> data2010 1 2011 2012 2013 <strong>2014</strong>Production <strong>and</strong> environmentElectricity generation 172.5 166.7 178.9 181.7 172.9– where of Hydro power 35.4 34.5 42.2 35.6 34.3– where of nuclear power 43.6 42.5 48.9 51.9 49.9– where of fossil power 89.7 85 81.7 87.9 82.7– where of wind power 2.2 3.4 3.6 3.9 4.1– where of biomass <strong>and</strong> waste 1.5 1 1.3 1 2.5 2.4 2.0Energy consumption, TWhGas 39.5 33.8 32.5 37.1 31.7Hard coal 73.5 58.5 41.5 45.1 35.2Lignite 143.3 147.4 152.8 157.0 153.5Peat 1.6 1.1 0.6 0.7 0.4Waste (non-biogenic) 2.6 2.8 2.9 3.2 2.9Biomass, waste (biogenic) 11.7 11.8 10.5 9.8 7.1Other fuels, including oil 6.9 5.3 5.9 5.7 5.7Uranium (tonnes) 104 104 126 133 119Emissions to airCarbon dioxide (CO 2), Mtonnes 2 91.9 86.7 83.5 86.9 82.7 3Specific CO 2emissions, g/kWh 416 418 400 412 421Biogenic CO 2, Mtonnes 4 4.0 4.0 3.6 3.4 2.4Nitrogen oxides(NO X), ktonnes 70.2 63.6 53.4 56.5 52.8Specific NO Xemissions, g/kWh 0.318 0.306 0.258 0.268 0.271Specific NO Xemissions (only combustion plants), g/kWh 0.493 0.491 0.460 0.458 0.474Sulphur dioxide (SO 2), ktonnes 74.4 69.8 56.1 58.2 53.1Specific SO 2emissions, g/kWh 0.337 0.336 0.272 0.276 0.272Specific SO 2emissions (only combustion plants), g/kWh 0.522 0.539 0.483 0.472 0.476Particulate matter (PM), ktonnes 2.4 2.6 1.9 2.1 1.7Specific PM emissions, g/kWh 0.011 0.012 0.009 0.010 0.008Specific PM emissions (only combustion plants), g/kWh 0.017 0.020 0.016 0.017 0.015Waste <strong>and</strong> by-products, ktonnesHazardous waste 199 211 431 194 123Non-hazardous waste 189 219 447 349 416Ash from hard coal 1,413 1,103 667 738 578Ash from lignite 4,868 5,198 5,330 5,388 5,334Ash from biomass 118 90 64 67 42.3Slag from waste incineration 305 301 317 330 245Gypsum 2,742 3,109 3,154 3,219 3,000Other by-products 102 88 75 73 48Radioactive wasteLow <strong>and</strong> medium radiactive operational waste, m 3 561 1,082 1,277 883 2,251Core components, tonnes 494 842 18 18 10Spent nuclear fuel, tonnes 135 157 147 161 193Uranium in spent nuclear fuel, tonnes 82 103 136 145 138Our peopleNumber employees, FTE, 38,180 34,685 32,794 31,819 30,181– where of females, % 9,119 8,267 7,928 7,485 6,983– where of temporary employed (not permanent contract) N/A N/A 1,234 1,154 882Sick leavemen % N/A N/A N/A 3.8% 3.7%females % N/A N/A N/A 5.3% 5.0%Working related accidents number (LTIF)Internal (employees) 4.5 3.3 2.3 2.6 2.7External (contractors) N/A N/A N/A 3.6 3.7Gender diversityFemale managers % 19% 19% 19% 18% 18%Number of managers per age category total–29 N/A 64 38 43 4430–49 N/A 1,964 1,486 1,467 1,40650– N/A 779 1,175 1,339 1,1771) Accounting principle changed in 2012.2) Emissions are presented in accordance to financial accounting <strong>and</strong> consolidated.3) Total greenhouse emissions amount to 83.0 Mtonnes, 0.3 Mtonnes consist of SF 6<strong>and</strong> N 2O emissions. Characterisation factors are obtained from the IPCC Fifth Assessment <strong>report</strong>.4) CO 2emissions from combustion of biomass.Vattenfall Annual <strong>and</strong> <strong>sustainability</strong> <strong>report</strong> <strong>2014</strong> 147