Report 001 rev P2a Sandon Point Flood Study Climate ... - Stockland
Report 001 rev P2a Sandon Point Flood Study Climate ... - Stockland
Report 001 rev P2a Sandon Point Flood Study Climate ... - Stockland

You also want an ePaper? Increase the reach of your titles
YUMPU automatically turns print PDFs into web optimized ePapers that Google loves.
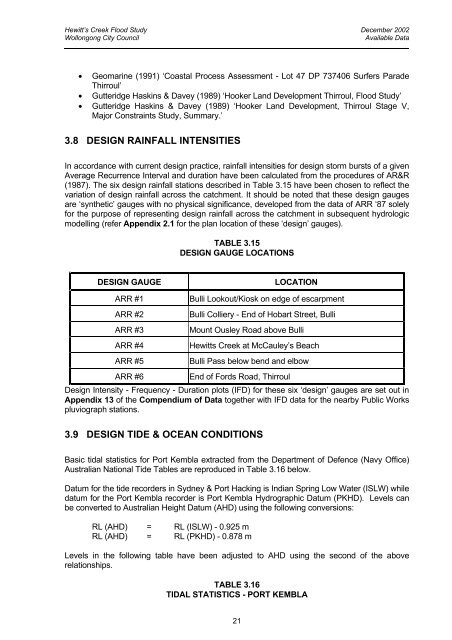
Hewitt’s Creek <strong>Flood</strong> <strong>Study</strong> December 2002Wollongong City CouncilAvailable Data• Geomarine (1991) ‘Coastal Process Assessment - Lot 47 DP 737406 Surfers ParadeThirroul’• Gutteridge Haskins & Davey (1989) ‘Hooker Land Development Thirroul, <strong>Flood</strong> <strong>Study</strong>’• Gutteridge Haskins & Davey (1989) ‘Hooker Land Development, Thirroul Stage V,Major Constraints <strong>Study</strong>, Summary.’3.8 DESIGN RAINFALL INTENSITIESIn accordance with current design practice, rainfall intensities for design storm bursts of a givenAverage Recurrence Interval and duration have been calculated from the procedures of AR&R(1987). The six design rainfall stations described in Table 3.15 have been chosen to reflect thevariation of design rainfall across the catchment. It should be noted that these design gaugesare ‘synthetic’ gauges with no physical significance, developed from the data of ARR ‘87 solelyfor the purpose of representing design rainfall across the catchment in subsequent hydrologicmodelling (refer Appendix 2.1 for the plan location of these ‘design’ gauges).TABLE 3.15DESIGN GAUGE LOCATIONSDESIGN GAUGELOCATIONARR #1Bulli Lookout/Kiosk on edge of escarpmentARR #2Bulli Colliery - End of Hobart Street, BulliARR #3Mount Ousley Road above BulliARR #4Hewitts Creek at McCauley’s BeachARR #5Bulli Pass below bend and elbowARR #6End of Fords Road, ThirroulDesign Intensity - Frequency - Duration plots (IFD) for these six ‘design’ gauges are set out inAppendix 13 of the Compendium of Data together with IFD data for the nearby Public Workspluviograph stations.3.9 DESIGN TIDE & OCEAN CONDITIONSBasic tidal statistics for Port Kembla extracted from the Department of Defence (Navy Office)Australian National Tide Tables are reproduced in Table 3.16 below.Datum for the tide recorders in Sydney & Port Hacking is Indian Spring Low Water (ISLW) whiledatum for the Port Kembla recorder is Port Kembla Hydrographic Datum (PKHD). Levels canbe converted to Australian Height Datum (AHD) using the following conversions:RL (AHD) = RL (ISLW) - 0.925 mRL (AHD) = RL (PKHD) - 0.878 mLevels in the following table have been adjusted to AHD using the second of the aboverelationships.TABLE 3.16TIDAL STATISTICS - PORT KEMBLA21