Use of longitudinal acoustic arrays to detect catchment-scale and ...
Use of longitudinal acoustic arrays to detect catchment-scale and ...
Use of longitudinal acoustic arrays to detect catchment-scale and ...

You also want an ePaper? Increase the reach of your titles
YUMPU automatically turns print PDFs into web optimized ePapers that Google loves.
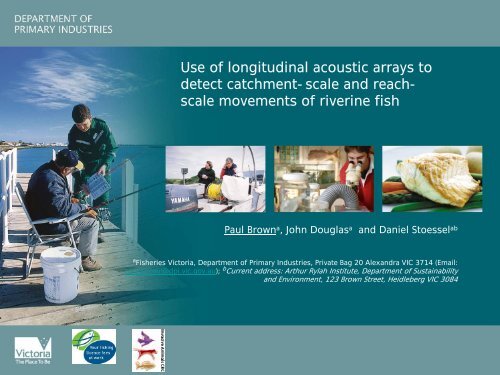
<strong>Use</strong> <strong>of</strong> <strong>longitudinal</strong> <strong>acoustic</strong> <strong>arrays</strong> <strong>to</strong><strong>detect</strong> <strong>catchment</strong>-<strong>scale</strong> <strong>and</strong> reach<strong>scale</strong>movements <strong>of</strong> riverine fishPaul Brown a , John Douglas a<strong>and</strong> Daniel S<strong>to</strong>essel aba Fisheries Vic<strong>to</strong>ria, Department <strong>of</strong> Primary Industries, Private Bag 20 Alex<strong>and</strong>ra VIC 3714 (Email:paul.brown@dpi.vic.gov.au); b Current address: Arthur Rylah Institute, Department <strong>of</strong> Sustainability<strong>and</strong> Environment, 123 Brown Street, Heidleberg VIC 3084
Riverine studies: Outline <strong>of</strong> three studies1. Movement <strong>of</strong> Australian bass in the SnowyRiver2. Movement <strong>of</strong> carp in the Murray-DarlingBasin3. Brown trout residence in response <strong>to</strong>riparian habitat manipulation
Riverine studies: Utility <strong>of</strong> <strong>acoustic</strong> tag studiesCatchment <strong>scale</strong>– linear movement (up- & down-stream,between tributaries)Reach <strong>scale</strong>– linear movement– residence, <strong>detect</strong>ion frequencyHabitat-unit <strong>scale</strong>– residence, <strong>detect</strong>ion frequency, habitat choicebehaviour
Snowy River: Australian bass aimsImprove underst<strong>and</strong>ing about the<strong>scale</strong>, timing, <strong>and</strong> triggermechanisms <strong>of</strong> bass movementsin Vic<strong>to</strong>riaFocus on Snowy River, an “Aussieicon” where flow & habitat,management & rehabilitation arecurrent issues“Australian Bass Movement <strong>and</strong> Migration in the SnowyRiver” Draft in review Fisheries Vic<strong>to</strong>ria Research Series
The ‘s<strong>and</strong>-slug’ – movement through a degradedhabitat reachMean daily distancefrom Ocean (km)908070605040302010Bass #228250002000015000100005000Mean daily flows (ML)Mean daily distancefrom Ocean (km)908070605040302010Bass #223250002000015000100005000Mean daily flows (ML)014-Jan 23-Apr 1-Aug 9-Nov 17-Feb 28-MayDate5-Sep014-Dec014-Jan 23-Apr 1-Aug 9-Nov 17-Feb 28-MayDate5-Sep014-Dec
Bass movement & location: Relationship with Flows &temperatures• Fish Movement is the natural Log <strong>of</strong> absolute movement (km) <strong>of</strong> bass since last known location,<strong>and</strong> Temperature (°C) is mean daily water temperature in the Snowy River at S<strong>and</strong>y Track– a significant proportion <strong>of</strong> the variation in fish movement was explained by temperature (F=8.34,p=0.004), but not by flow (F=0.83, p=0.37)• Fish Location is the natural Log <strong>of</strong> distance (km) from the Ocean (i.e. distance upstream)– Seasonal regression models <strong>of</strong> temperature <strong>and</strong> flow explained a significant proportion <strong>of</strong> thevariation in bass location for spring, summer <strong>and</strong> winter, but not for autumn.– Bass were significantly lower in the <strong>catchment</strong> in winter <strong>and</strong> spring, than in summer <strong>and</strong> autumn(p
Bass location: Flows & temperatures1002500020000Distance from ocean (km) &Flows ML day -1101500010000500010Nov‐03Dec‐03Jan‐04Feb‐04Mar‐04Apr‐04May‐04Jun‐04Jul‐04Aug‐04Sep‐04Oct‐04Nov‐04Dec‐04Jan‐05Feb‐05Mar‐05Apr‐05May‐05Jun‐05Jul‐05Aug‐05Sep‐05Oct‐05Nov‐05Dec‐05Jan‐06Feb‐06DateLog (mean daily distance from Ocean) kmMean daily flow at Jarrahmond (ML)100101Nov‐03Dec‐03Jan‐04Feb‐04Mar‐04Apr‐04May‐04Jun‐04Jul‐04Aug‐04Sep‐04Oct‐04Nov‐04Dec‐04Jan‐05Feb‐05Mar‐05Apr‐05May‐05Log (mean daily distance from Ocean) kmJun‐05Jul‐05Aug‐05Sep‐05Oct‐05Nov‐05Dec‐05Jan‐06Feb‐06Date30Mean daily stream temperature at S<strong>and</strong>y Track (oC)Distance from ocean (km) &Ave. daily temperature (°C)2520151050
Bass movement & location: Flows & temperaturesGeneral Linear Modelling: Location=ƒ( flow & temperature)• In winter increasing temperatures <strong>and</strong> flows: bring bassdownstream– temperature (F=16.8, p
Diel cycle in <strong>detect</strong>ion frequencyDoes this directly indicate‘bass activity pattern’?Theoretically:increased <strong>detect</strong>ion frequency=Slow-fish occasionally in<strong>detect</strong>ion-range <strong>of</strong> VR2AlsoMean <strong>detect</strong>ion frequency (n= 14 VR2s)700600500400300200100increased <strong>detect</strong>ion frequency=Fast-fish <strong>of</strong>ten in <strong>detect</strong>ionrange <strong>of</strong> VR2Total <strong>detect</strong>ion Frequency0600050004000300020007 8 9 10 11 12 13 14 15 16 17 18 19 20 21 22 23 0 1 2 3 4 5 6Hour <strong>of</strong> the dayBrodribb boat rampJacksons CrossingS<strong>and</strong>y PointU/S Wall CrkD/S Wall CrkWood PointU/S Butter fac<strong>to</strong>ryOrbost BridgeFloodgatesLochendU/S Second Isl<strong>and</strong>U/S Lit tle SnowyMarlo JettyBrodribb Cabbage Tree Ck100007 8 9 10 11 12 13 14 15 16 17 18 19 20 21 22 23 0 1 2 3 4 5 6Hour <strong>of</strong> the day
Diel cycle in <strong>detect</strong>ion frequencyDoes this directly indicate‘bass activity pattern’?Probably. Data (not shown 1 )from estuary perch shows asimilar pattern.Real-time tracking <strong>of</strong> some<strong>of</strong> these estuary perchshows nocturnal increase inactivity2520151050DayNightTotal <strong>detect</strong>ion FrequencyMean <strong>detect</strong>ion frequency (n= 14 VR2s)70060050040030020010006000500040003000200010007 8 9 10 11 12 13 14 15 16 17 18 19 20 21 22 23 0 1 2 3 4 5 6Hour <strong>of</strong> the dayBrodribb boat rampJacksons CrossingS<strong>and</strong>y PointU/S Wall CrkD/S Wall CrkWood PointU/S Butter fac<strong>to</strong>ryOrbost BridgeFloodgatesLochendU/S Second Isl<strong>and</strong>U/S Little SnowyMarlo JettyBrodribb Cabbage Tree Ck1Douglas, J. in review, Estuary perch movement <strong>and</strong> habitat use in the SnowyRiver, Fisheries Vic<strong>to</strong>ria Research Report Series07 8 9 10 11 12 13 14 15 16 17 18 19 20 21 22 23 0 1 2 3 4 5 6Hour <strong>of</strong> the day
2. Common carp: Murray-Darling Basin <strong>acoustic</strong> array
Riverine studies: Utility <strong>of</strong> <strong>acoustic</strong> tag studiesCatchment <strong>scale</strong>– linear movement (up- & down-stream,between tributaries)Reach <strong>scale</strong>– linear movement– residence, <strong>detect</strong>ion frequencyHabitat-unit <strong>scale</strong>– residence, <strong>detect</strong>ion frequency, habitat choicebehaviour
Common carp: Murray-Darling Basin <strong>acoustic</strong> arrayStudy Outline:•100 carp tagged @ 7release sites– V13T, V13 & V16– PIT,dart•46 VR2 receivers (in 23pairs)– ½ with temperature loggers•Fisheries Vic<strong>to</strong>ria (SnobsCk) <strong>and</strong> NSW DPI(Narr<strong>and</strong>era)•Invasive AnimalsCooperative Research Centreprojectbar=1000 km
Common carp: Murray-Darling BasinAims– temporal <strong>and</strong> spatial movement patterns: when, where, <strong>and</strong>why carp move around the MDB over time <strong>scale</strong>s relevant <strong>to</strong>their life-his<strong>to</strong>ry– s<strong>to</strong>ck-structure: movement <strong>of</strong> adults among s<strong>to</strong>cks, <strong>and</strong>biological <strong>and</strong> environmental 'triggers' for such movement– vulnerability from movement behaviour ? E.g. aggregation,passage through fishways, etc.
Common carp: Preliminary data1 carp <strong>detect</strong>ed onCampaspe River VR2 May,20071 carp stayed up CampaspeRiver (March-May), 20072 carp moved back in<strong>to</strong>Murray River May, 200725 carp tagged <strong>and</strong>released at Barmah inMurray River Feb, 20074 carp <strong>detect</strong>ed on GoulburnRiver VR2 March & April,20071 carp moved <strong>and</strong> remainedup Goulburn River June,2007
Common carp: Preliminary dataFirst download after 4 months: Original batch <strong>of</strong> 25 carptagged <strong>and</strong> released in the Murray at BarmahMurray River: 24 (3 visited 2 other sub-<strong>catchment</strong>s)Goulburn River: 1Campaspe River: 0
Common carp: Challenges ahead1. Tag & release another 150 carp2. Extend array <strong>to</strong> S.A <strong>and</strong> Qld (another 12 VR2s)3. Regular data-downloads (next one due now)– Massive database expected– VUE• Export <strong>and</strong> query with MSAccess/SAS foranalyses?• integrate <strong>acoustic</strong> <strong>detect</strong>ions with fish-way PITdetec<strong>to</strong>rs (MDBC database in development)4. Secure funding <strong>to</strong> match tag lifeexpectancy• V16 ~9-years
3. Brown trout: Goulburn River• Aim: Moni<strong>to</strong>r the habitat preferences <strong>and</strong>residence pattern <strong>of</strong> brown trout in thestudy area containing a reach withestablished, riparian exotic woodyvegetation, <strong>and</strong> a cleared reach with newnative re-vegetationDaniel S<strong>to</strong>essel <strong>and</strong> John Douglas (2007) Brown trout residence in response <strong>to</strong> riparian habitatmanipulation. Fisheries Vic<strong>to</strong>ria Research Report Series No. 35
Riverine studies: Utility <strong>of</strong> <strong>acoustic</strong> tag studiesCatchment <strong>scale</strong>– linear movement (up- & down-stream,between tributaries)Reach <strong>scale</strong>– linear movement– residence, <strong>detect</strong>ion frequencyHabitat-unit <strong>scale</strong>– residence, <strong>detect</strong>ion frequency, habitat choicebehaviour
Brown trout: Goulburn River study location
Goulburn River: Study site schematicReceiver 3120010008006004002000Stream flowdirectionWillowed section Cleared section260112001000Receiver 48006004002603Receiver 220001200Receiver 5Residence time (hrs)10008006004002000120010008002607Receiver 16004002002608012001000800Residence plot <strong>of</strong> all brown trout thatresided within the study reaches >100hrs60040020001200100080026096004002610200Daniel S<strong>to</strong>essel <strong>and</strong> John Douglas (2007) Brown trout residence in response <strong>to</strong>riparian habitat manipulation. Fisheries Vic<strong>to</strong>ria Research Report Series No. 3501 2 3 4 5Reciever
Brown trout: Goulburn RiverConclusions:1. S<strong>to</strong>cked brown trout did reside in areas where exotic riparian vegetationremoval had occurred.2. Exotic riparian vegetation removal may not impact on trout residencepatterns if sufficient <strong>and</strong> suitable in-stream cover is present.3. At the reach <strong>scale</strong>, tall, shading riparian vegetation may not be as importanta component in trout residence selection as in-stream habitat variables.A further study is in progress <strong>to</strong> repeat this work in a small stream where therelative importance <strong>of</strong> riparian shading vegetation may be greater.Daniel S<strong>to</strong>essel <strong>and</strong> John Douglas (2007) Brown trout residence in response <strong>to</strong> riparian habitatmanipulation. Fisheries Vic<strong>to</strong>ria Research Report Series No. 35