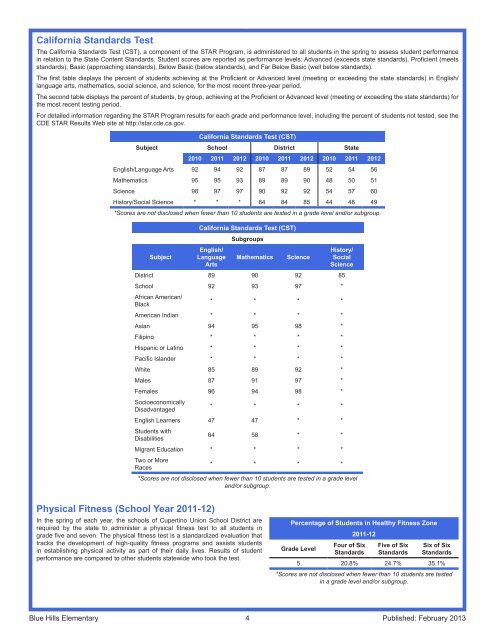
California Standards TestThe California Standards Test (CST), a component of the STAR Program, is administered to all students in the spring to assess student performancein relation to the State Content Standards. Student scores are reported as performance levels: Advanced (exceeds state standards), Proficient (meetsstandards), Basic (approaching standards), Below Basic (below standards), and Far Below Basic (well below standards).The first table displays the percent of students achieving at the Proficient or Advanced level (meeting or exceeding the state standards) in English/language arts, mathematics, social science, and science, for the most recent three-year period.The second table displays the percent of students, by group, achieving at the Proficient or Advanced level (meeting or exceeding the state standards) forthe most recent testing period.For detailed information regarding the STAR Program results for each grade and performance level, including the percent of students not tested, see theCDE STAR Results Web site at http://star.cde.ca.gov.California Standards Test (CST)Subject <strong>School</strong> District State2010 2011 2012 2010 2011 2012 2010 2011 2012English/Language Arts 92 94 92 87 87 89 52 54 56Mathematics 95 95 93 89 89 90 48 50 51Science 98 97 97 90 92 92 54 57 60History/Social Science * * * 84 84 85 44 48 49*Scores are not disclosed when fewer than 10 students are tested in a grade level and/or subgroup.SubjectCalifornia Standards Test (CST)English/LanguageArtsSubgroupsMathematicsScienceHistory/SocialScienceDistrict 89 90 92 85<strong>School</strong> 92 93 97 *African American/Black* * * *American Indian * * * *Asian 94 95 98 *Filipino * * * *Hispanic or Latino * * * *Pacific Islander * * * *White 85 89 92 *Males 87 91 97 *Females 96 94 98 *SocioeconomicallyDisadvantaged* * * *English Learners 47 47 * *Students withDisabilities64 58 * *Migrant Education * * * *Two or MoreRaces* * * **Scores are not disclosed when fewer than 10 students are tested in a grade leveland/or subgroup.Physical Fitness (<strong>School</strong> Year 2011-12)In the spring of each year, the schools of Cupertino Union <strong>School</strong> District arerequired by the state to administer a physical fitness test to all students ingrade five and seven. The physical fitness test is a standardized evaluation thattracks the development of high-quality fitness programs and assists studentsin establishing physical activity as part of their daily lives. Results of studentperformance are compared to other students statewide who took the test.Percentage of Students in Healthy Fitness ZoneGrade Level2011-12Four of SixStandardsFive of SixStandardsSix of SixStandards5 20.8% 24.7% 35.1%*Scores are not disclosed when fewer than 10 students are testedin a grade level and/or subgroup.<strong>Blue</strong> <strong>Hills</strong> <strong>Elementary</strong> 4Published: February 2013
Academic Performance IndexThe Academic Performance Index (API) is a score on a scale of 200 to 1,000 that annuallymeasures the academic performance and progress of individual schools in California. The statehas set 800 as the API score that schools should strive to meet.Statewide Rank: <strong>School</strong>s receiving an API Base score are ranked in ten categories of equalsize (deciles) from 1 (lowest) to 10 (highest), according to type of school (elementary, middle,or high school).Similar <strong>School</strong>s Rank: <strong>School</strong>s also receive a ranking that compares that school to 100 otherschools with similar demographic characteristics. Each set of 100 schools is ranked by APIscore from 1 (lowest) to 10 (highest) to indicate how well the school performed compared tosimilar schools.The first table displays the school’s API ranks and actual API point changes by student group forthe past three years. The second table displays, by student group, the 2010 Growth API at theschool, district, and state level.API <strong>School</strong> Results2009 2010 2011Statewide 10 10 10Similar <strong>School</strong>s 8 8 8Group 09-10 10-11 11-12All Students at the <strong>School</strong>Actual API Change 1 3 -9AsianActual API Change -4 -1 4WhiteActual API Change 4 - -English LearnersActual API Change 11 -13 -372012 Growth API ComparisonNumberofStudents<strong>School</strong> District StateGrowthScoreNumberofStudentsGrowthScoreNumberofStudentsGrowthScoreAll Students at the <strong>School</strong> 327 966 14,003 961 4,664,264 788Asian 259 983 10,080 985 404,670 905White 53 921 2,740 931 1,221,860 853English Learners 80 924 2,810 909 1,530,297 716Students with Disabilities 32 767 1,165 783 530,935 607Adequate Yearly Progress (<strong>School</strong> Year 2011-12)No Child Left Behind (NCLB) is a federal law enacted in January 2002 that reauthorized the <strong>Elementary</strong> and Secondary Education Act (ESEA). Itmandates that all students (including students who are economically disadvantaged, are from racial or ethnic minority groups, have disabilities, or havelimited English proficiency) in all grades meet the state academic achievement standards for Mathematics and English/Language Arts by 2014. <strong>School</strong>smust demonstrate “Adequate Yearly Progress” (AYP) toward achieving that goal. The federal NCLB Act requires that all schools and districts meet thefollowing Adequate Yearly Progress (AYP) requirements:• Participation rate on the state’s standards-based assessmentsin English/Language Arts (ELA) and Mathematics.• Percent proficient on the state’s standards-based assessmentsin ELA and Mathematics.• API as an additional indicator.• Graduation rate (for secondary schools).There are several consequences for schools that do not meet theAYP standards, including additional tutoring and replacing of staff.Students would also be allowed to transfer to schools (within theirdistrict) that have met their AYP, and the former school would berequired to provide the transportation to the new site. Results ofschool and district performance are displayed in the chart.Teacher AssignmentCupertino Union <strong>School</strong> recruits and employs the most qualified credentialed teachers.Adequate Yearly Progress (AYP)<strong>School</strong>DistrictMade AYP Overall Yes NoMet AYP CriteriaEnglish -LanguageArtsMathematicsEnglish -LanguageArtsMathematicsParticipation Rate Yes Yes Yes YesPercent Proficient Yes Yes No NoAPI <strong>School</strong> Results Yes YesGraduation Rate N/A N/ATeacher Credential Status<strong>School</strong>District09-10 10-11 11-12 11-12Fully Credentialed 24 24 26 853Without Full Credentials 0 0 0 0Working Outside Subject 0 0 0 0<strong>Blue</strong> <strong>Hills</strong> <strong>Elementary</strong> 5Published: February 2013