PDF: 1352 KB - Bureau of Infrastructure, Transport and Regional ...
PDF: 1352 KB - Bureau of Infrastructure, Transport and Regional ...
PDF: 1352 KB - Bureau of Infrastructure, Transport and Regional ...
- No tags were found...
Create successful ePaper yourself
Turn your PDF publications into a flip-book with our unique Google optimized e-Paper software.
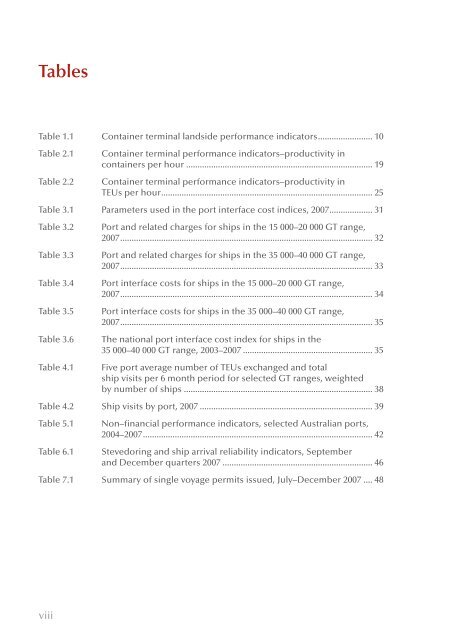
TablesTable 1.1 Container terminal l<strong>and</strong>side performance indicators........................ 10Table 2.1Table 2.2Container terminal performance indicators–productivity incontainers per hour................................................................................... 19Container terminal performance indicators–productivity inTEUs per hour............................................................................................. 25Table 3.1 Parameters used in the port interface cost indices, 2007................... 31Table 3.2Table 3.3Table 3.4Table 3.5Table 3.6Table 4.1Port <strong>and</strong> related charges for ships in the 15 000–20 000 GT range,2007............................................................................................................... 32Port <strong>and</strong> related charges for ships in the 35 000–40 000 GT range,2007............................................................................................................... 33Port interface costs for ships in the 15 000–20 000 GT range,2007............................................................................................................... 34Port interface costs for ships in the 35 000–40 000 GT range,2007............................................................................................................... 35The national port interface cost index for ships in the35 000–40 000 GT range, 2003–2007.......................................................... 35Five port average number <strong>of</strong> TEUs exchanged <strong>and</strong> totalship visits per 6 month period for selected GT ranges, weightedby number <strong>of</strong> ships.................................................................................... 38Table 4.2 Ship visits by port, 2007............................................................................. 39Table 5.1Table 6.1Non–financial performance indicators, selected Australian ports,2004–2007..................................................................................................... 42Stevedoring <strong>and</strong> ship arrival reliability indicators, September<strong>and</strong> December quarters 2007................................................................... 46Table 7.1 Summary <strong>of</strong> single voyage permits issued, July–December 2007..... 48viii


