Untitled - HKU Libraries - The University of Hong Kong
Untitled - HKU Libraries - The University of Hong Kong
Untitled - HKU Libraries - The University of Hong Kong
- No tags were found...

Create successful ePaper yourself
Turn your PDF publications into a flip-book with our unique Google optimized e-Paper software.
THE UNIVERSITY OF HONG KONGLIBRARIES<strong>Hong</strong> <strong>Kong</strong> Collection
HONG KONGSECOND .COMPREHENSIVE TRANSPORT STUDYFina! ReportMay 1989
EPPrinted and Published by the Government Printer, <strong>Hong</strong> Konc
CONTENTSPage1. 111.1 Background 11-./1.2/<strong>The</strong> Second Comprehensive Transport Study 16" 1.3 Contents <strong>of</strong> the Report 18/ 2. 222.1 Introduction 222.2 Inception Phase 222.3 Traffic Surveys " 232.4 Development <strong>of</strong> the Transport Model 232.5 Preparation for Transport Testing 25.2.6 Analysis and Evaluation <strong>of</strong> Transport Projects and Policies •• 27', 2.7 implications <strong>of</strong> Airport Relocation 28.3. 293.1 Introduction 293.2 Growth <strong>of</strong> the Vehicle Fleet • 29i>——-••""/l3> Road Usage and Road Construction 403.4 Tunnel and Vehicular Ferry Traffic 453.5 Public Transport Patronage * 484. 544.1 Introduction 544.2 Land Use 544.3 Economic Growth 604.4 Transport Costs and Fares 62/ 4.5' \International Traffic 66'"4.6 Funding <strong>of</strong> Transport Investments 695. OF THE 745.1 Introduction 745.2 Growth in the Vehicle Fleet 745.3 Growth in Total Transport Demand 755.4 /Transport Demand by Area 765.5 Transport Demand by Mode 795.6 ^Transport Demand by Corridor and Screenline 835.7 Jfaffic Congestion and Traffic Speeds / 87
CONTENTSPage6. OF 966.1 Introduction ' 966.2 Committed Highway Projects 966.3 Candidate Highway Projects 976.4 - Highway Project Evaluation 976.5v ^ftouteS 1036.6 Route 7 1086.7 Hung Horn Bypass and Second Airport Tunnel 1106.8 Centtal-Wanchai Bypass and Island Eastern Corridor Link 1106.9 Route 16 1116.10 ,- <strong>The</strong> Recommended Highway Strategy 11 27. ) EVALUATION OF 1177.1 Introduction 1177.2 <strong>The</strong> Existing Railway Systems 1177.3 Rail Evaluations 1227.4 v/ Candidate Railway Projects 1267.5 MTR Junk Bay Extension 1307.6/ ^Northwest New Territories Urban Link 1 327.7, MTR Island Line Extension to Kennedy Town and Green Island 1367.8 MTR East Kowloon Line 1377.9 Ma On Shan Light Rail Line 1387.10 Diamond Hill Light Rail Line 1407.11 KCR Main Line Extension to Tsim Sha Tsui and Sheung Wan 1417.12 KCR: Sha Tin to Kwai Fong 1427.13 Admiralty to Aberdeen Light Rail Project 1437.14 Further MTR Harbour Crossings 1447.15 <strong>The</strong> Recommended Rail Strategy 1468. PUBLIC TRANSPORT OPERATIOWS 1498.1 Introduction 1498.2 Importance <strong>of</strong> Public Transport 1498.3 Demand Projections for Public Transport 1538.4 Rail Operations 1588.5 Bus Operations 1608.6 Ferry Operations 1628.7 Minibus Operations 1638.8 Non-Scheduled Public Transport Operations 1648.9 Strategies for Future Demand 1658.10 Conclusions on Public Transport Operations 167
CONTENTS9. FOR THE OFPage" 1699.1 Introduction 1699.2 Need for Demand Management Policies 1699.3 A Review <strong>of</strong> Available Options . 1719.4 Vehicle Ownership Controls 1729.5 Vehicle Use Controls 1739.6 Behavioural Incentives 1779.7 Selection and Evaluation <strong>of</strong> Policy Options for the Management <strong>of</strong> 178Transport Demand9.8 Package 1: Car Ownership Taxes 1829.9 Package 2: Fuel Tax 1829.10 Package 3: Goods Vehicle Controls , 1859.11 Package 4: Area Pricing 1879.12 Supplementary Transport Management Policies 1919.13 Recommendations on Transport Management Policies 192CONCLUSIONSONTRANSPORT STRATEGY 19410.1 Introduction 19410.2 Recommended Highway Programme 19410.3 Recommended Railway Programme 1,95.10.4 Conclusions on Public Transport Development 19810.5 Recommended Policies for Management <strong>of</strong> Transport Demand 1 9810.6 Transport Policies with the Recommended Strategy 200• 10.7 "\ Implication <strong>of</strong> a Relocated Airport 2041078"^ Other Issues 207
Page3.1 Licensed Vehicles 1976-1988 303.2 First Registration Tax 313.3 Vehicle Licence Fees 323.4 Licensed Goods Vehicles by Class 363.5 •" Screeniine Traffic by Vehicle Type 413.6 Cross Harbour Tunnel Toi! Increases June 1984 463.7 Daily Public Transport Patronage (1976-1988) 494.1 Territory Population and Domestic Households 554.2 Distribution <strong>of</strong> Population 564.3 Distribution <strong>of</strong> Domestic Households 574.4 Distribution <strong>of</strong> School Places 584.5 Employment Projections 584.6 Distribution <strong>of</strong> Employment 594.7 J Past Economic Growth 614.8 Projected Economic Growth 624.9 / Household Income and Value <strong>of</strong> Time 624.10 Vehicle Operating Costs at 25 krn/h by Year 634.11 Public Transport Fare indices 654.12 Tunnel Tolls by Facility ' 654.13 / Projected Daily Border Crossings by Location 674.14 Projected Passenger Ferry Traffic 684.15 N , Projected Daily Airport Related Traffic 684.16 ' Growth <strong>of</strong> Rail and Port Associated Daily Goods Vehicle Trips 684.17 / Investment in Transport Infrastructure (1971-1989) • 705.1 / Projections <strong>of</strong> the Vehicle Fleet 745.2 Car Ownership and Daily Trip Making 755.3 / Daily Trip Generations and Attractions by Are.a 775.4 "' Projections <strong>of</strong> Daily Trip Making by Mode <strong>of</strong> Travel 825.5 Scheduled Public Transport Movements by Corridor 845.6 Road Movements by Corridor 855.7 Road Volumes and Congestion by Corridor 886.1 Major Committed Highway Projects 966.2 Candidate Highway Projects 1026.3 Summary <strong>of</strong> Highway Project Evaluation 104Highway Construction Programme 1146
TABLESPage7.1 Railway Characteristics (1988) 1207.2 Summary <strong>of</strong> Rail Evaluations 1298.1 Public Transport Operations (1976 and 1988) 1 518.2 Projected Demand for Scheduled Public Transport by Area 1 548.3 Public Transport Movements Across Selected Screenlsnes 1558.4 Projections <strong>of</strong> Scheduled Public Transport (1986-2001) 1 578.5 Composition <strong>of</strong> KCR Traffic 1599.1 1996 Traffic Conditions with No Change in Current Traffic Policies 1819.2 1996 Traffic Conditions with Further Increases in Private Car 183Taxation9.3 1 996 Traffic Conditions with Increases in Petrol Tax 1 849.4/ 1 996 Traffic Conditions with Control on Goods Vehicle Growth 1 869.5 1996 Traffic Conditions with Area Pricing 1909.6 Summary <strong>of</strong> Evaluation <strong>of</strong> Alternative Policy Packages 192
FIGURES_Page1.1 Special Character <strong>of</strong> <strong>Hong</strong> <strong>Kong</strong> Transport 121.2 Major Transport Projects Completed Since 1 979 142.1 Programme <strong>of</strong> CTS-2 Study 222.2 Analytical Process <strong>of</strong> the CTS-2 Mode! 243.1* x " Growth in Licensed Vehicles 293.2 Changes in Annual Licence Fees 333.3 Licensed Private Cars and Motorcycles 333.4 -••" Percent Growth in Cars 343.5 •""' Goods Vehicle and GDP Growth 353.6 X Licensed Goods Vehicles 353.7- ' Licensed Light Vans 373.8 Licensed Taxis 383.9 Licensed Buses 393.10 Use <strong>of</strong> Road Space 403.11 Traffic in Urban <strong>Hong</strong> <strong>Kong</strong> and Kowloon 423.12 Traffic Crossing the Harbour 423.13 Traffic to and from the New Territories 433.14 Traffic in the New Territories 443.15 Highway Construction 443.16 Growth in Tunnel Traffic 4E3.17 Change in Cross Harbour Tunnel Traffic 463.18 Change in HYF Vehicle Ferry Traffic 473.19 Vehicles Using the Cross Harbour Ferries 473.20 Growth in Public Transport Patronage 4£3.21 Growth in Rail and Bus 5C3.22 MTR Passenger Movements at Central Station 513.23 Taxi Usage by Household Income 523.24 Changes in Taxi and Bus Fares 544.1 .-' Population Trends 5£4.2 Projected Changes in Household Size 514.3 Employment Trends 5£4.4 AnnualGDPG ro wt h 6C4.5 Annual GDP Growth per Capita 614.6 1986 Vehicle Operating Costs 6c4.7 / Cross-Border Goods Vehicles (Surveyed) 6t4.8 / Cross Border Goods Vehicles (Projected) 618
FIGURESPage4.9 Investment in Road and Rail (Current Prices) 714.10 Investment in Road and Rail (Constant Prices) 714.11 Cumulative Inflation Since 1961 725.1 ' Projections <strong>of</strong> Cars and Goods Vehicles 745.2 Projected Daily Trip Making by Purpose 765.3 ..•• 1986 Generations and Attractions by Area • 785.4 / 2001 Generations and Attractions by Area 785.5 Person Travel Demand 805.6 ' Goods Vehicle Travel Demand . 815.7 Projections <strong>of</strong> Daily Person Travel 835.8 Demand for Road Space 835.9 Transport Corridors 865.10 Traffic Speeds by Road Type and Congestion Level 875.11 Road Conditions in 1986 Base Year (AM Peak Hour) 905.12 Projection <strong>of</strong> Road Conditions in 2001 Under Committed Scenario 92(AM Peak Hour)5.13 Traffic Speeds by Road Class 945.14 Peak Local Road Speeds by Area 945.15 Peak Trunk Road Speeds by Area 956.1 Major Committed Road Projects 986.2 Candidate Road Projects 100^,6.3" Major Highway Project Requirements 1137.1 Existing Railway System 1187.2 Growth in Daily Rail Passengers 1197.3 New Passenger Rail Lines 1278.1 Passenger Transport by Mode 1508.2 Projected Use <strong>of</strong> Road Space 1508.3 Screenline Locations 1569.1 Management <strong>of</strong> Transport Demand 1719.2 """ Trucking Costs in <strong>Hong</strong> <strong>Kong</strong> Industry 1879.3 ERP Study Scheme B Proposal 18910.1 Projections <strong>of</strong> Daily Person Travel 20110.2 Projection <strong>of</strong> Road Conditions in 2001 with Recommended Strategy 202(AM Peak Hour)10.3 Peak Local Road Speeds by Area 20510.4 Peak Trunk Road Speeds by Area 20510.5 Daily 2-way Line Passenger Volumes 206
Page1.1 Second Comprehensive Transport Study—Working Group 201.2 Second Comprehensive Transport Study—Steering Group 2110.1 X" Projections <strong>of</strong> the Vehicle Fleet 21010.2 Projections <strong>of</strong> the Daily Trip Making by Mode <strong>of</strong> Travel 21010.3 Scheduled Public Transport Movements by Corridor 21110.4 Road Movements by Corridor 21210.5 Road Volumes and Congestion by Corridor 21310
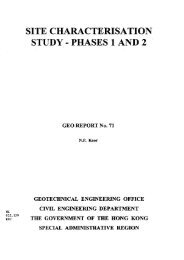
1.1.11.1.1 Transport affects the life <strong>of</strong> every resident <strong>of</strong> <strong>Hong</strong> <strong>Kong</strong>, not only directly in thedaily journeys to work, school or other activities but also indirectly, by its influenceon the economic activity and prosperity <strong>of</strong> the Territory. <strong>The</strong> development andmaintenance <strong>of</strong> an efficient transport system has long been a centra! policy <strong>of</strong>Government.1.1.2 <strong>Hong</strong> <strong>Kong</strong> is expanding rapidly, both geographically, with the development <strong>of</strong> theNew Territories and economically with one <strong>of</strong> the highest GDP growth rates in theworld. To accommodate this expansion, some two to three billion dollars areinvested every year in the construction <strong>of</strong> new highways and railways. Thisinvestment is mostly by Government. <strong>The</strong>re are a large number <strong>of</strong> potential projectsto choose from, but there are practical limits to both financing and constructionindustry capacity. <strong>The</strong>refore, new projects must be planned carefully to obtain themaximum benefits from new transport investments as part <strong>of</strong> the overall investmentstrategy for the Territory.1.1.3 Government also manages transport activities by its policies on such things ascontrolling the provision <strong>of</strong> public transport services to reduce wasteful duplication<strong>of</strong> resources, measures to limit the number and usage <strong>of</strong> inefficient modes, bus lanes,parking provision and vehicle licensing. Without this control, many <strong>of</strong> the benefits <strong>of</strong>new construction would be lost to increased traffic congestion. Transport policiesmust be directed to ensure that priority is given to the most essential" and efficientusers <strong>of</strong> the transport system.1.1.4 While the planning <strong>of</strong> transport investment and policies is a continuing activity <strong>of</strong>Government, it is useful from time to time to stand back and review past progressand future objectives in these matters. This was the task <strong>of</strong> the Second ComprehensiveTransport Study (CTS-2). it is the Government's intention <strong>of</strong> carrying outsimilar reviews as and when necessary after the completion <strong>of</strong> the Study.Special Character <strong>of</strong> <strong>Hong</strong> <strong>Kong</strong> Transport1.1.5 In the past twenty years, <strong>Hong</strong> <strong>Kong</strong> emerged as a major world centre <strong>of</strong> industryand finance, In total Gross Domestic Product (GDP), <strong>Hong</strong> <strong>Kong</strong> now ranks 42nd inthe World out <strong>of</strong> 211 nations (listed in "<strong>The</strong> World in Figures" published by <strong>The</strong>Economist <strong>of</strong> London, 1 987 Edition); just 10 years ago it ranked 60th. A total <strong>of</strong> 102<strong>of</strong> the licensed banks in <strong>Hong</strong> <strong>Kong</strong> are among the top 500 banks in the world in1987 and 76 are ranked among the top 100.1.1.6 Yet all this activity is concentrated into a land area <strong>of</strong> only 1 070 square kilometresand much <strong>of</strong> this consists <strong>of</strong> steep hills and uninhabited islands. <strong>The</strong> built-up area <strong>of</strong><strong>Hong</strong> <strong>Kong</strong> covers oniy 96 square kilometres and contains some <strong>of</strong> the highestdensity residential areas in the world. This combination <strong>of</strong> economic prosperity andtight geographical constraints makes <strong>Hong</strong> <strong>Kong</strong> unique in the world <strong>of</strong> transport;this is illustrated in Figure 1.1.1.1.7 Vehicle Ownership—<strong>The</strong> main graph in Figure 1.1. shows car ownership (cars perthousand persons) compared with relative prosperity (GDP per head) fora selection<strong>of</strong> 21 countries. <strong>Hong</strong> <strong>Kong</strong> by world standards is very prosperous with a GDP perhead greater than many <strong>of</strong> the smaller European countries and far ahead <strong>of</strong> mostother countries in South-East Asia. On the other hand, car ownership is extremelylow, ranking well below countries <strong>of</strong> similar GDP per head (one third <strong>of</strong> the carownership levels in Singapore, for example) and is generally exceeded by all but thepoorest countries shown. This is illustrated further in the smaller graph showing carand commercial vehicle ownership per unit <strong>of</strong> GDP. Only Bangladesh has a smallernumber <strong>of</strong> vehicles and the highest ranked country has twelve times the number <strong>of</strong>vehicles per unit <strong>of</strong> GDP as <strong>Hong</strong> <strong>Kong</strong>.11
TRANSPORTPER UNIT OF GDPCars Per Thousand Parsons600soo -CARPERGDP°USA400 -PUERTO BIOO0 FRAHOB300 -!ennaiHgooY«eoia*iA ^FEHEZUSLA IRELANDg SAUDI ARABIA"**"» s c eitiEoe100MM./tT8IA8OMAH* INDONESIA m,£ tmAa » BTHA!tANP ,OUTH KOREA |6QDP Par10 16Ths W®rid Sank Ati@o t Etflti@nIn Fitttr©§, Th© E@@n@mitt,IrelandOmanIndonssisBangladeshAlgeriaThailand
1.1.8 it is not surprising that <strong>Hong</strong> <strong>Kong</strong> has a relatively low commercial vehicleownership; fleet size is determined by the quantity <strong>of</strong> transport, e.g. tonne-km, to beperformed and this is limited by the compact nature <strong>of</strong> <strong>Hong</strong> <strong>Kong</strong>. Car ownership,on the other hand, is generally less a function <strong>of</strong> transport need and has much to dowith status and expressions <strong>of</strong> wealth. <strong>The</strong> pressures for car ownership are strong in<strong>Hong</strong> <strong>Kong</strong> but ownership levels have been suppressed by high taxes and annuallicence fees.1.1.9 <strong>The</strong> reasons for this are quite clear from the second <strong>of</strong> the smaller graphs. Despite therelatively low vehicle ownership, in relation to economic wealth, <strong>Hong</strong> <strong>Kong</strong> has thehighest density <strong>of</strong> vehicles per kilometre <strong>of</strong> road <strong>of</strong> any <strong>of</strong> the countries shown. Infact, <strong>Hong</strong> <strong>Kong</strong> has more commercial vehicles per kilometre <strong>of</strong> road than most othercountries have total vehicles per kilometre, including private cars. Until recently withthe gradual growth <strong>of</strong> the new towns, both residential and commercial developmentshave been concentrated round the Victoria Harbour. <strong>The</strong>se have permitted thedevelopment <strong>of</strong> an efficient and pr<strong>of</strong>itable public transport system and muchreduced the need for a private mode <strong>of</strong> transport. Equally, a relatively small network<strong>of</strong> roads could only be built in this confined area. This accounts for the low carownership and high density <strong>of</strong> vehicles per kilometre.1.1.10 <strong>The</strong> taxes on private motoring has been critically commented upon, but quite clearly,even with a massive road building programme, <strong>Hong</strong> <strong>Kong</strong> simply cannot permit carusage to rise to the levels enjoyed by other countries <strong>of</strong> similar wealth. It must bebluntly stated at the outset <strong>of</strong> this report that control <strong>of</strong> private cars by one means oranother must continue to be a central part <strong>of</strong> transport policy in <strong>Hong</strong> <strong>Kong</strong>.However, it is also necessary to consider controls on other vehicles, in particulargoods vehicles. <strong>The</strong> goods vehicle fleet has more than doubled in the last 1 0 yearsand the proportion <strong>of</strong> this traffic in the urban area has increased by about 72 percent,compared with 13 and 60 percents for private cars and taxis respectively over thesame period.1.1.11 Public Transport—Without the choice <strong>of</strong> private transport for the majority <strong>of</strong>residents <strong>of</strong> <strong>Hong</strong> <strong>Kong</strong>, it follows that public transport must be provided to thehighest standard possible. At a minimum, this emphasises the need for controls onvehicle growth, since over 50% <strong>of</strong> all public transport services are road-based andtherefore vulnerable to road congestion. It also means that <strong>Hong</strong> <strong>Kong</strong> must look toways <strong>of</strong> expanding the rail system to provide a standard <strong>of</strong> public transport servicescompatible with the growing expectations <strong>of</strong> the population. In this respect theconcentration <strong>of</strong> population, business and industry into restricted land areas andnarrow corridors has advantages by permitting financially self-supporting railoperations. This report examines the case for several new passenger rail lines.Recent Transport Developments in <strong>Hong</strong> <strong>Kong</strong>1.1.12 <strong>The</strong> last ten years have seen a huge expansion <strong>of</strong> the transport system <strong>of</strong> <strong>Hong</strong> <strong>Kong</strong>,as illustrated in Figure 1.2. <strong>The</strong> programme continues and projects currently inconstruction are discussed later in the report.1.1.13 Much <strong>of</strong> the effort has gone into trunk road construction to provide high capacity roadsthrough the existing urban areas and out to the new towns in the New Territories.Within the urban area, road widening schemes and flyovers have vastly improved thecapacity <strong>of</strong> the road system to accommodate the ever-growing volume <strong>of</strong> traffic.1.1.14 Of equal importance to the expansion <strong>of</strong> the Territory road network has been theconstruction <strong>of</strong> the Mass Transit Railway (MTR) and the modernisation <strong>of</strong> theKowioon-Canton Railway (KCR). <strong>The</strong> availability <strong>of</strong> high speed and frequent trainservices has transformed the travel patterns <strong>of</strong> the Territory. <strong>The</strong> first line <strong>of</strong> the MTRopened at the end <strong>of</strong> 1979; rail services now carry a quarter <strong>of</strong> all passenger journeysmade in <strong>Hong</strong> <strong>Kong</strong>. <strong>The</strong> most recent addition to the rail system was the Light RailTransit (LRT) railway opened in 1988 linking the new towns <strong>of</strong> Tuen Mun and YuenLong. <strong>The</strong> franchised buses have also expanded considerably in meeting thegrowing transport demand.13
KCR Double Tracking &\ Electrification 1983"StJNTCR Stage I 1986-Yuen Long Northern Bypass 1984LRT Phase I 1988Au Tau to Yuen Long 1982Tsuen Wan Road 1895 -Tuen Mun Road Dualling 1983Tolo Highway 1986MTR Tsuen Wan Line 1982MTR Kwun Tong Line 1980Airport, Tunnel & Approaches 1982West Kowloon Corridor 1988Island Eastern Corridor 1984Aberdeen Tunnel 1982">£• -aJMTR Island Line 1986IEC Taikoo Shing toShaukeiwan 1985LEGENDMTRLight RailKCRHighwaysFigure 1.2MAJOR TRANSPORT PROJECTS COMPLETED SINCE 1979
Transport Planning Studies1.1.15 While embarking on this massive transport construction programme, it was alsobeing recognised that <strong>Hong</strong> <strong>Kong</strong> could not accommodate unrestricted growth <strong>of</strong>traffic and that priorities had to be established among road users. It was furtherappreciated that transport interactions are complex and need detailed study to beable to determine the outcome <strong>of</strong> policies accurately. From these concerns emergedthe first Comprehensive Transport Study (CIS) in 1973. <strong>The</strong> task <strong>of</strong> CTS was toestablish the analytical tools to evaluate transport proposals and to use these tools todevise a balanced programme <strong>of</strong> transport projects and transport policies. <strong>The</strong> CTSprogramme based on this work was published in 1976.1.1.16 Following the first CTS, a great number <strong>of</strong> studies were undertaken which wereconcerned with detailed transport planning issues, or which had strong transportplanning elements. It is estimated that some ten to twenty studies were completedeach year in the period 1976-1988.1.1.17 <strong>The</strong> main categories <strong>of</strong> study can be identified as follows, with examples:(1) Transport Department studies and surveys undertaken on a regular basis, e.g.the Annual Traffic Census.(2) Planning studies <strong>of</strong> specific routes and corridors, e.g. the Feasibility Study<strong>of</strong> Alternative Transport Development in the Sha Tsn-Tsuen Wan Corridor(1981).(3) A series <strong>of</strong> sub-regional studies associated with the development <strong>of</strong> theTerritorial Development Strategy, e.g. the Harbour Reclamation and UrbanGrowth Study (1983).(4) Studies <strong>of</strong> the transport requirements <strong>of</strong> New Towns, e.g. the Junk BayTransport Review (1984).(5) District studies to develop local transport plans within the context <strong>of</strong> the overalltransport strategy, e.g. the Western District Traffic Study (1987).(6) Public transport studies, e.g. the series <strong>of</strong> Development <strong>of</strong> an Integrated PublicTransport System (DIPTRANS) studies to forecast public transport requirementsin conjunction with the development <strong>of</strong> the Mass Transit Railway(1979-1983).(7) Policy studies, e.g. studies in connection with the taxi policy reviews (1983 and1987).1.1.18 <strong>The</strong> common element running through most <strong>of</strong> these studies was the use made <strong>of</strong>the computerised transport forecasting model, originally developed in the first CTSand since maintained and periodically updated by Government and consultants. Inmany cases, the model was modified to meet the particular needs <strong>of</strong> a study; many <strong>of</strong>these changes have now been incorporated in the main version <strong>of</strong> the model. It isrecognised that there will be a need for the model to continue to be modified as andwhen necessary after the completion <strong>of</strong> CTS-2.1.1.19 Many <strong>of</strong> the major assumptions adopted in the various transport planning studiesare continually updated in the course and after the completion <strong>of</strong> the studies. <strong>The</strong>seinclude the projections <strong>of</strong> population, employment and economic growth. Duringthe study period <strong>of</strong> CTS-2, there have been several updates <strong>of</strong> these projections.Even at the beginning <strong>of</strong> the Study, it was not conceived that the airport at Kai Takwould be relocated before 2001. It is now considered that a new airport is highlylikely by then. All <strong>of</strong> these changes in study assumptions reinforce the need <strong>of</strong>regular updating <strong>of</strong> the CTS-2 results.15
1.2 <strong>The</strong> Second Comprehensive Transport StudyBrief for the Study1.2.1 <strong>The</strong> overall objective <strong>of</strong> the Second Comprehensive Transport Study (CTS-2) wasstated in the Brief for the Study as follows:"to determine what has to be done to achieve and maintain an acceptable level <strong>of</strong>mobility for passengers and freight by road, rail and ferry up to 2001"1.2.2 More specific objectives were set out later in the Brief and elsewhere which can besummarised as follows:(1) <strong>The</strong> principal objective <strong>of</strong> the Study is to review transport plans and policies forthe period up to 2001, going on to prepare detailed road infrastructure andpublic transport development programmes.(2) <strong>The</strong> main emphasis <strong>of</strong> this Study will be towards the year 1996, but forecasts <strong>of</strong>transport demand are also required for two additional key years <strong>of</strong> 1991 and2001.(3) It is particularly emphasised that the Study must recognise the limitations onfinancial resources which are unlikely to be adequate to pay for the transportnetwork necessary to meet the unrestrained transport demand. <strong>The</strong> determination<strong>of</strong> the effects <strong>of</strong> varying resource levels and the measures necessitated bysuch variations is an important part <strong>of</strong> the Study.(4) <strong>The</strong> Study is required to provide Government with an analytical tool capable <strong>of</strong>assisting in the formulation <strong>of</strong> transport policy and able fo reflect the effects <strong>of</strong>changes in policy on the highways and transport infrastructure <strong>of</strong> the Territory.Organisation <strong>of</strong> the Study1.2.3 As stated earlier, CTS-2 is intended to mark the start <strong>of</strong> a continuous transportplanning process with a regular programme for adapting the transport strategy tochanging circumstances. To this end, Government has set up a ComprehensiveTransport Study Division within the Planning and Research Branch <strong>of</strong> TransportDepartment with the following staffing:1 Chief Engineer2 Transport Engineers2 Principal Technical Officers2 Senior Technical Officers8 Technical Officers1.2.4 This represented the Government core team for CTS-2, with occasional assistanceprovided from other divisions within Transport Department.1.2.5 For the duration <strong>of</strong> CTS-2, the team were assisted by consultants Wilbur SmithAssociates who seconded staff to work within the CTS Division. <strong>The</strong> consultantteam were as follows:1 Senior Engineer (Deputy Project Director)1 Transport Planner \> full time1 Systems Analyst1 Transport Economist part time1.2.6 In order to ensure that the CTS transport planning process can continue effectivelyto account for changes in developments after the departure <strong>of</strong> the consultants, theComprehensive Transport Study Division as mentioned in paragraph 1.2.3 aboveshould be strengthened by the addition <strong>of</strong> experienced pr<strong>of</strong>essional and technicalsupporting staff.16
Study Direction1.2.7 <strong>The</strong> consultants were directed in their work by the Commissioner for Transport'srepresentative who was nominated as the Assistant Commissioner for Planning andResearch. Normally, these duties were delegated to the Chief Engineer <strong>of</strong> CTSDivision.1.2.8 A Working Group was formed to provide detailed guidance to the Study team, t<strong>of</strong>acilitate the exchange <strong>of</strong> information, and to monitor progress on the Study. Thisgroup, including representatives from ail concerned Departments <strong>of</strong> Government,normally met each month.1.2.9 A Steering Group was also formed to provide guidance to the Study on all policymatters and to consider the Study findings and recommendations. Like the WorkingGroup, the Steering Group normally met each month.1.2.10 <strong>The</strong> composition <strong>of</strong> the Working and Steering Groups is given in Annex 1.1.Relationship to Other Studies1.2.11 Such is the pace <strong>of</strong>"development <strong>of</strong> <strong>Hong</strong> <strong>Kong</strong> that several other studies are nowunderway which will have significant implications for transport strategy. Thisunderlines the continuous nature <strong>of</strong> transport planning in <strong>Hong</strong> <strong>Kong</strong> and emphasisesthe need for regular review and updating <strong>of</strong> transport plans. <strong>The</strong> aims and status <strong>of</strong>the major studies are discussed below.1.2.12 Port and Airport Development Strategy (PADS)—A series <strong>of</strong> studies wereundertaken in the late 1970s/early 1980s on the possible relocation <strong>of</strong> the airportfrom its current site at Kai Tak. <strong>The</strong>se culminated in the preparation <strong>of</strong> a masterdevelopment plan for a new airport at Chek Lap Kok on the northern side <strong>of</strong> Lantau.However, the project was shelved early in 1983 for financial and economic reasons.1.2.13 <strong>The</strong> Territorial Development Strategy (TDS) study which helps determine futureurban development maintained the concept <strong>of</strong> a relocated airport, but the earliesttiming was considered to be some time after 2001. Accordingly, the CTS-2 Studyassumed that no change <strong>of</strong> airport would be made within the planning periodcovered by the Study.1.2.14 Thinking has developed further since the start <strong>of</strong> CTS-2, and several studies <strong>of</strong>airport capacity and relocation are now underway. <strong>The</strong> central study is the Port andAirport Development Strategy (PADS) which is evaluating alternative sites for anew airport in the general area <strong>of</strong> the Western Harbour and Lantau, together with theneeds for new port facilities. Based on the findings <strong>of</strong> the PADS and various airportstudies, Government is expecting to make decisions by the end <strong>of</strong> 1989 on therelocation <strong>of</strong> the airport. <strong>The</strong>se would have major long term implications for thelocation and timing <strong>of</strong> new transport links in the Territory. In order to gain someindication <strong>of</strong> the impact <strong>of</strong> a new airport on the CTS-2 transport strategy, somesensitivity tests were undertaken and these are reported later in Chapter 10. While itwould be wrong to pre-judge the findings <strong>of</strong> PADS, it does seem that an airportrelocated strategy could have many features in common with the overall strategyrecommended by CTS-2, since both require transport links on the west side <strong>of</strong> theexisting urban area.1.2.15 Reclamation Studies—Three large land reclamations are planned in the main urbanarea; Central and Wan Chai, Green Island and West Kowloon. Together with othersmaller reclamations, these projects could accommodate some 400 000 persons, aswell as a large expansion <strong>of</strong> commercial and <strong>of</strong>fice buildings.1.2.16 It is necessary to establish the feasibility and costs <strong>of</strong> these reclamations. Manyaspects have to be investigated; for example, all would affect the movement <strong>of</strong>water through the harbour and this might have serious environmental or port andshipping implications which must be weighed carefully. To investigate the technicalissues and development potentials for each reclamation more thoroughly, detailedfeasibility studies are now underway. <strong>The</strong> Central and Wan Chai Study is expectedto report in early 1989, with the other two studies reporting later in the year.17
1.2.17 <strong>The</strong> way in which these reclamations are developed, and their timing, is <strong>of</strong>considerable importance to the Territory transport strategy. <strong>The</strong>y will afford opportunitiesfor developing high class transport links close to the main business districts.However, they will aiso impose their own demands on the transport system, andthese could be considerable. Thus the outcome <strong>of</strong> the reclamation studies will be amajor input to the continuing work <strong>of</strong> CTS.1.2.18 Metroplan— Metroplan is a study to prepare a comprehensive master plan for theupgrading and "redevelopment <strong>of</strong> the main urban area encompassing <strong>Hong</strong> <strong>Kong</strong>Island, Kowloon and Tsuen Wan. Many districts were built to very high densities as aresult <strong>of</strong> the rapid public housing development programmes <strong>of</strong> the 1950s and 1960s:parts <strong>of</strong> these districts are now in a decaying condition and lack essential communityamenities. Housing Authority is planning a comprehensive redevelopment programmewhich aims to redevelop all old housing blocks by 2001.1.2.19 Transport considerations will be a very important element <strong>of</strong> Metroplan, andTransport Department will be closely involved in the project.Continuing Nature <strong>of</strong> the CTS Study1.2.20 Fixed master plans are <strong>of</strong> dubious value in a rapidly developing and changingsociety; too many factors can change to undermine the assumptions in the plan. Totake just one example, in parallel with CTS-2, the Government has been exploringdevelopment options for a replacement airport. Ciearly, a decision to move theairport would have major implications for the re-development <strong>of</strong> Kowloon and onthe transport strategy for this area.1.2.21 Because <strong>of</strong> the uncertainty associated with future developments, it was plannedfrom the outset that CTS-2 should be the start <strong>of</strong> a continuing process. This decisionhad institutional implications (see later in Section 1.4) but also affected the thrust <strong>of</strong>the analyses <strong>of</strong> CTS-2. <strong>The</strong>refore, while the Study has prepared an investment planto cover the entire planning period <strong>of</strong> the Study (1986-2001), the emphasis was onidentifying projects for implementation within the next few years. Subject toapproval, these will be the projects which will go forward into the public worksprogramme. Another important element <strong>of</strong> the Study is the analysis <strong>of</strong> transportpolicy issues which will be,a useful tool to manage transport demands to acceptablelevels.1.2.22 It is intended that a special division <strong>of</strong> Government will carry on the CTS process,• using the techniques and procedures set up during CTS-2. Thus later projects in theCTS-2 programme, as well as transport policies, will be re-assessed at regularintervals in the light <strong>of</strong> actual developments and changes in Territory forecasts.Always the emphasis will be on identifying the projects for immediate planning andconstruction within the framework <strong>of</strong> longer term plans. In this way, the transportstrategy will be continually updated to meet the changing needs <strong>of</strong> <strong>Hong</strong> <strong>Kong</strong>.1.3 Contents <strong>of</strong> the Report1.3.1 <strong>The</strong> report is written in ten chapters, as follows:Chapter 11ntroduction—giving the background to the Study work.Chapter 2 Study Approach—describing briefly the main data sources and Studymethodology.Chapter 3 Transport Trends and Issues—presenting an overview <strong>of</strong> developments intransport in <strong>Hong</strong> <strong>Kong</strong> over recent years, and commenting on the issues raised.Chapter 4 Planning Characteristics and Projections—describing the main assumptions<strong>of</strong> the Study concerning future development <strong>of</strong> the Territory, set in the context<strong>of</strong> the recent past.18
Chapter 5 Forecasts <strong>of</strong> the Transport Scene—detailing projections <strong>of</strong> traffic up to theyear 2001 assuming compietion <strong>of</strong> only those highway and railway projects alreadyin construction or otherwise committed, and the continuation <strong>of</strong> current transportpolicies; this chapter provides the transport background against which CTS-2recommendations on new projects and policies were developed.Chapter 8 Evaluation <strong>of</strong> Highway Projects—describing the evaluation <strong>of</strong> newhighways and selection <strong>of</strong> a highway investment programme.Chapter 7 Evaluation <strong>of</strong> New Passenger Rail Lines—describing the evaluation <strong>of</strong>new passenger rail lines and selection <strong>of</strong> a railway development programme.Chapter 8 Public Transport Operations—discussing the future operations <strong>of</strong> publictransport services and the issues these raise.Chapter 9 Policies for the Management <strong>of</strong> Transport Demand—dealing with transportpolicy issues, particularly those concerned with managing transport demand.Chapter 10 Conclusions and Recommendations on Transport Strategy—presentingthe conclusions and recommendations <strong>of</strong> CTS-2 on the future development <strong>of</strong>transport in <strong>Hong</strong> <strong>Kong</strong>.1.3.2 In addition, there are a number <strong>of</strong> technical appendices prepared during the Studywhich describe in detail the assumptions made and the study results obtained ineach series <strong>of</strong> computer tests.19
ANNEX1.1Terms <strong>of</strong> Reference(1) To provide guidance to the Study team on all aspects <strong>of</strong> their work and any related mattersreferred to the Group.(2) To review the Study team's monthly progress reports and to monitor progress on theStudy.(3) To direct the Study team to prepare technical memoranda and papers for the Studywhenever necessary.(4) To identify and assist in resolving problems encountered.(5) To ensure liaison between the Study team and Government Departments/Offices/Divisionsinvolved.(6) To advise the Steering Group on the Study team's progress on the Study.(7) To seek guidance from the Steering Group on all policy matters.MembershipChairman — Assistant Commissioner for Transport/Planning & ResearchSecretary — Study team memberMembers — Chief Engineer/Comprehensive Transport StudyDeputy Project DirectorChief Engineer/Traffic and Transport SurveyPrincipal Transport Officer/Public Transport PlanningRepresentatives <strong>of</strong>: Transport BranchPolice Traffic HeadquartersEconomic Services BranchTown Planning OfficeLands and Works BranchTerritory Development DepartmentRailway DivisionHighways DepartmentEnvironmental Protection DepartmentTraffic Engineering Division/<strong>Hong</strong> <strong>Kong</strong>Traffic Engineering Division/KowloonTraffic Engineering Division/NT.Housing DepartmentCensus and Statistics DepartmentIn Attendance—Other Study team members as requiredRepresentatives from other Government Departments on an ad hoc basis20
ANNEX 1.2Terms <strong>of</strong> Reference(1) To provide guidance to the Study team in the choice <strong>of</strong> planning data and on all policymatter.(2) To resolve any problems that may not be dealt with appropriately by the Working Group.(3) To recommend action as a result <strong>of</strong> findings during and at the conclusion <strong>of</strong> the Study.(4) To consider the Study's recommendations prior to the finalisation <strong>of</strong> the Reports.MembersChairman — Secretary for TransportSecretary — Study team memberMembers — Principal Assistant Financial SecretarySecretary for Lands and Works or representativeDirector <strong>of</strong> Civil Engineering ServicesCommissioner for TransportDirector <strong>of</strong> HighwaysPrincipal Assistant Secretary for Economic ServicesAssistant Director <strong>of</strong> Territory DevelopmentGovernment Town PlannerDeputy Director <strong>of</strong> Police/TrafficPrincipal Assistant Secretary for District AdministrationAssistant Director <strong>of</strong> HousingAssistant Commissioner for Transport/Planning and ResearchChief Engineer/Comprehensive Transport StudyDeputy Project DirectorIn Attendance—Members <strong>of</strong> Study team as necessaryRepresentatives from other Government Departments as may be invited toattend when particular matters affecting their interests are being discussed21
2.2.1 introduction2.1.1 This chapter summarises the work programme <strong>of</strong> the Study, briefly describing thesources <strong>of</strong> data and the approach to the technical work. More detailed technicalinformation, in the form <strong>of</strong> survey results and documentation <strong>of</strong> specific techniques,was prepared in the course <strong>of</strong> the Study.2.1.2 <strong>The</strong> bar chart in Figure 2.1 outlines the programme <strong>of</strong> the Study. Work commencedin late November 1986, and was divided into seven main groups <strong>of</strong> tasks:1.2.3.Inception phaseTraffic surveysDevelopment <strong>of</strong> the transport model4. Preparation for transport testingA«jil««,i-*!n. « i« j-J s*\tf*%lii*>4-is i M'> /~vfi"&""*rTif*r5. Analysis and evaluation <strong>of</strong> transport projects and policies6. Implications llll|kyilVSULIVJ > IIV« <strong>of</strong> V^« airport "U I B Js^ %-c » ». uwavv* relocationReporting and presentationFIGURE 2.1:PROGRAMME OF CTS-2 STUDYWORK TASK1986N D1987J F M A M J J A S 0 N D1988J F M A M J J A S 0N D1989J FMInception PhaseTraffic SurveysDevelopment <strong>of</strong> theTransport ModelPreparation forTransport TestingAnalysis and Evaluation<strong>of</strong> Transport Projectsand PoliciesImplications <strong>of</strong>Airport RelocationReporting andPresentationjiI^m!12.1.32.22.2.1Each group <strong>of</strong> tasks up to reporting and presentation is summarised in the remainder<strong>of</strong> this chapter.Inception PhaseThis was a preparatory phase <strong>of</strong> the Study defining the issues to be analysed and theanalytical techniques to be used. An Inception Report was prepared setting out theobjectives, techniques and schedule for the study.22
2.3 Traffic2.3.1 It was planned that the Study would rely on existing sources <strong>of</strong> data as far aspossible. <strong>The</strong> main data base on person travel characteristics was derived from the1981 Transport Characteristics Survey (TCS). <strong>The</strong> detailed surveys carried out forthe 1984 Trucking Industry Study provided comparable information on goodsvehicle transport. Both these surveys were updated using current statistics on trafficand public transport operations. In addition, data from the sample householdsurveys conducted by MTRC in 1 985 and 1 986 were made available to the Study.2.3.2 In order to supplement these data, four special surveys were carried out for CTS-2 asfollows:1. Taxi Driver Log Survey2. Van Survey3. Area Speed-Flow Survey4. Parking Accumulation Survey2.3.3 Taxi Survey—<strong>The</strong> purpose <strong>of</strong> this survey was to provide detailed informationconcerning taxi travel patterns. This was necessary because the 1981 TCS wasdeficient in this respect, accounting for only about one third <strong>of</strong> known taxi trips andrequiring unreliably large adjustment factors.2.3.4 A total <strong>of</strong> 429 taxis were surveyed, about 2.4% <strong>of</strong> the total taxi fleet, with driversmaintaining a log <strong>of</strong> all journeys made for a two-week period. Information collectedfor each trip included origin, destination, number <strong>of</strong> passengers and the start time foreach trip.2.3.5 Van Survey—Light vans have proliferated over the past few years, the fleet growingfrom about 4000 vehicles in 1976 to nearly 50000 in 1988. Observation surveyswere undertaken to investigate the uses made <strong>of</strong> such light vans.2.3.6 Passenger vans were surveyed at eight sites, classifying use as school Governmentcommercial or passenger, based on easily observable characteristics. A total ol11 450 observations were made. In addition, goods vehicle registered vans (distinguisedby a black patch on the side <strong>of</strong> the cab) were surveyed at four sites classifyinguse as either commercial or passenger. A total <strong>of</strong> 2 160 observations were made.2.3.7 Speed-Flow Survey—-Travel times along seven routes in key urban area locationswere surveyed to investigate the relationship between traffic speed and congestionlevels. Total route length was some 65 kilometres. Most routes were surveyed eighltimes, four each in congested and uncongested conditions. Both travel and stoppedtimes were recorded and related to street characteristics and traffic volumes.2.3.8 Parking Survey—Public parking space occupancy at peak parking time (12:00 noonto 3:00 pm) was investigated in 14 areas covering about 10% <strong>of</strong> the commercial ancbusiness centres in the urban area. <strong>The</strong> occupancy survey was preceded by a parkingspace inventory.2.4 Development <strong>of</strong> the Transport Model2.4.1 A computerised transport forecasting model lay at the heart <strong>of</strong> the CTS-2 analyticaprocess. <strong>The</strong> function <strong>of</strong> the model is summarised in Figure 2.2. Based on descriptions<strong>of</strong> the transport system and projections <strong>of</strong> Territory development—populationemployment economic growth, international traffic—the model estimates dail^transport demand by each type <strong>of</strong> mode. Considering the estimated demand foiroad-based transport services, the model is able to estimate traffic congestion levelsand traffic speeds. Thus the model can be used to project traffic conditions in futureyears under different assumptions <strong>of</strong> future development. Most importantly, nev\transport projects or changes in transport policy can be analysed by incorporatingthem in the description- <strong>of</strong> the transport system, re-running the model, and thercomparing projected traffic flows with and without these projects or policies.23
2.2: OF THEPROJECTS AND POLICIESFOR EVALUATIONDESCRIPTION OFTHE TRANSPORT SYSTEMHighways, railways, ferry piersPublic transport servicesOperating costs and faresPROJECTIONS OFTERRITORY DEVELOPMENTPopulationEmploymentHouseholdSchool placesPROJECTIONS OFECONOMIC GROWTHGDP growthPersonal incomesLabour costsValue <strong>of</strong> timeCTS-2MODELPROJECTIONS OFINTERNATIONAL TRAFFICRoad (cross-border)SeaAirPROJECTEDDAILY TRANSPORTDEMAND24
<strong>The</strong> model was originally developed in 1973 as part <strong>of</strong> the first CIS. ft was used toinvestigate all aspects <strong>of</strong> transport ranging from assessments <strong>of</strong> different landdevelopment policies to analyses <strong>of</strong> detailed traffic management problems. Some <strong>of</strong>these original functions have since been taken over by other transport models,themselves developed from the original CIS model, so that a 3-ieve! hierarchy <strong>of</strong>models and studies has evolved:Level Purpose Model ApplicationLevel 1 Strategic land use LUTO 1 Strategic land usedevelopmentdevelopment planning takinginto account transport projectand policy requirementsLevel 2 Strategic transport CTS-2 Identify strategic transportproject programmingproject and policyand policy formulationrequirements <strong>of</strong> land usedevelopment recommendedin Level 1 studiesLevel 3 Regional transport Various District trafficplanning andanalysistraffic management1 Land Use Transport OptimisationThus the CTS-2 transport model now occupies the second level <strong>of</strong> the hierarchywith the function <strong>of</strong> modelling transport demand over the entire Territory transportsystem in sufficient detail to evaluate transport projects and policies.<strong>The</strong> relative level <strong>of</strong> detail <strong>of</strong> each model can be judged by the number <strong>of</strong>sub-divisions or zones into which the Territory is divided to represent locations <strong>of</strong>population and employment. <strong>The</strong> final CTS-2 model operates with 232 zones for thebase year <strong>of</strong> 1986 (expanded to 238 zones to allow for new major development sitesup to 2001), reduced from the 383 zones defined for the original CTS. For the moredetailed Level 3 studies, each CTS zone in the area <strong>of</strong> interest would normally besub-divided into three or four sub-zones. In contrast, the Level 1 LUTO model usesonly 49 zones for the entire Territory; for example, <strong>Hong</strong> <strong>Kong</strong> Island is representedby just 7 zones in the LUTO model compared with 55 in the CTS-2 model.An important initial task <strong>of</strong> CTS-2 was to overhaul the CTS model and adapt it betterto its new role. This process included:(1) Adjustments to reflect the most recent data on travel patterns.(2) Incorporation <strong>of</strong> improvements in modelling techniques as developed in <strong>Hong</strong><strong>Kong</strong> and elsewhere.(3) Reorganisation and simplification <strong>of</strong> the model structure to reduce computerrunning times(4) Expansion <strong>of</strong> the model to include economic evaluation procedures.Preparation for Transport Testing<strong>The</strong> projections <strong>of</strong> future transport demand depended on the assumptions <strong>of</strong> futuredevelopment <strong>of</strong> the Territory and its transport system, it was necessary to collate allthis information and prepare it in a form suitable for input to the model. In all caseswhere choices had to be made, the Study team prepared technical papers fordiscussion with the Study Working and Steering Groups, setting out the options andmaking recommendations, <strong>The</strong> main tasks are listed below.25
Transport Networks2.5.2 Descriptions <strong>of</strong> the transport system were prepared, including physical characteristics<strong>of</strong> transport links (e.g. road lengths, road width, etc.) and the characteristics <strong>of</strong>public transport services operating on them (e.g. routes followed, service frequencies,vehicle carrying capacity, etc.). Based on the results <strong>of</strong> the speed-flow surveyreported above, relationships were derived linking traffic speeds to congestionlevels; thus the model could estimate travel speeds in the transport network based onphysical capacity <strong>of</strong> transport links and the estimated volume <strong>of</strong> travel demand.Planning Data2.5.3 Estimates <strong>of</strong> the future growth, distribution and characteristics <strong>of</strong> population,employment, household and school places were made based on projections by theWorking Group on Population Distributions (WGPD) and work <strong>of</strong> the StrategicPlanning Unit (SPU) <strong>of</strong> Lands and Works Branch, and also on data providedby Census and Statistics Department, Territory Development Department, TownPlanning Office, Education Department and other relevant organisations.Economic Growth2.5.4 For the purpose <strong>of</strong> this study, it was assumed that Gross Domestic Product (GDP)would grow by 5%-6% per year over the period 1988-2001. Together with thepopulation and employment projections, estimates <strong>of</strong> the growth in GDP per headand per employee were derived as a basis for estimating the respective growth inincomes and labour costs over the study period.Transport Operating Costs and Fares2.5.5 Operating costs were estimated for all classes <strong>of</strong> road vehicle based on the currentcharacteristics <strong>of</strong> the vehicle fleet in the Territory. Operating costs for publictransport operations were developed from data supplied by the public transportoperators and by Public Transport Planning Division <strong>of</strong> Transport Department.Projections <strong>of</strong> costs were based on the likely changes in future costs, particularlylabour costs discussed above. Indices <strong>of</strong> likely fare changes were projected based onchanges in operating costs and other factors.InternationalTraffic2.5.6 Projections <strong>of</strong> international traffic were required at all points <strong>of</strong> entry to the <strong>Hong</strong><strong>Kong</strong> transport system. <strong>The</strong>se comprised the airport, international ferry piers and theborder for passenger traffic, and the airport container port, public cargo workingareas and border for goods vehicle traffic. Projections were based on estimates ollikely traffic growth, but with a range <strong>of</strong> values adopted for the goods vehiclecross-border flows for which estimates were less certain.Investment Budgets2.5.7 Analyses were made <strong>of</strong> past investments in transport related to the growth <strong>of</strong> theeconomy as a guide to the likely future funding <strong>of</strong> transport projects. Final estimates<strong>of</strong> available funding were based on guidelines provided by Government.Projects and Policies2.5.8 <strong>The</strong> Study compiled a list <strong>of</strong> all known transport construction projects. A divisionwas made into those in construction or otherwise firmly committed which could beassumed to be completed whatever the recommendations <strong>of</strong> CTS-2, and those inthe planning or concept phase which were required to be evaluated by the Study.<strong>The</strong> initial source <strong>of</strong> projects was the Territorial Development Strategy (IDS) series<strong>of</strong> work, but many other projects were suggested by other Government Departments,Projects agreed for evaluation by CTS-2 were costed with the help <strong>of</strong> HighwaysDepartment and the two rail corporations MTRC and KCRC,26
2.5.9 A literature review was made <strong>of</strong> potential transport policies for the management <strong>of</strong>transport demand. A set <strong>of</strong> policies considered to have potential for application in<strong>Hong</strong> <strong>Kong</strong> were agreed for testing by CTS-2.2.8 Analysis Evaluation <strong>of</strong> Transport Projects,and Policies2.6.1 <strong>The</strong> testing <strong>of</strong> transport projects and policies followed a clearly defined programme,with evaluations <strong>of</strong> results at each stage. <strong>The</strong> sequence <strong>of</strong> testing and the approachto evaluation are discussed below.Testing Programme2.6.2 A sequence <strong>of</strong> seven rounds <strong>of</strong> testing were conducted in developing the transportstrategy as described below.2.6.3 Committed Network Tests—Transport projections were made assuming completion<strong>of</strong> only those projects currently under construction or otherwise firmly committed,and with no change in current transport policies. Projections were made for thethree years 1991, 1 996 and 2001. <strong>The</strong>se tests indicated the scale <strong>of</strong> likely problemsconfronting transport planners to the end <strong>of</strong> the century and provided the backgroundagainst which new projects and policies could be justified.2.6.4 Maximal Network Tests—Transport projections were made assuming construction<strong>of</strong> a large number <strong>of</strong> transport projects, but assuming that current transport policieswere maintained. Five different transport network-configurations were investigated,all with the same highway plans but with different combinations <strong>of</strong> rail projects.Tests were made for the year 1996 only. <strong>The</strong>se tests indicated the scope for resolvingfuture transport problems by the construction <strong>of</strong> new infrastructure only.2.6.5 Policy Tests—-Eight different policies for managing the growth <strong>of</strong> transport demandwere investigated, assuming no further construction <strong>of</strong> transport projects beyondthose already under construction or otherwise firmly committed. As with the MaximalNetwork tests, the policy tests were undertaken for the year 1 996 only. <strong>The</strong>se testsindicated the scope for resolving future transport problems by new policy initiativesonly.2.6.6 Initial Strategy—Based on the results <strong>of</strong> the first three rounds <strong>of</strong> testing, an InitialStrategy was devised combining new transport projects and policies. Projectsselected for the strategy were compatible with estimates <strong>of</strong> the transport investmentbudget up to 2001. <strong>The</strong> strategy was tested and evaluated for the two years 1996and 2001, but with ail new projects included for both years. While the assumptionthat all new projects could be completed by 1996 was unrealistic, the results <strong>of</strong> thetests provided useful information <strong>of</strong> project priorities.2.6.7 Revised Strategy—Following the evaluation <strong>of</strong> the Initial Strategy, a RevisedStrategy was prepared selecting a realistic programme <strong>of</strong> transport projects forcompletion by 1996 and 2001. Testing was carried out for both these two years.2.6.8 Sensitivity Tests—A series <strong>of</strong> sensitivity tests were undertaken on the RevisedStrategy to assess the implications <strong>of</strong>;— Higher economic growth— Variations in population distribution.— Variations in cross-border goods vehicle flows.2.6.9 Final Strategy—A final set <strong>of</strong> tests were made for 1996 and 2001 incorporatingminor adjustments to the Revised Strategy based on the results <strong>of</strong> the sensitivitytests.Evaluation2.6.10 <strong>The</strong> transport projects and policies examined in each round <strong>of</strong> testing wereevaluated from several different viewpoints as discussed below:27
2.6.11 Operational Evaluation—<strong>The</strong> simplest approach was to measure the physical impact<strong>of</strong> the project or policy on the transport system in terms <strong>of</strong> the volumes <strong>of</strong> traffic,congestion levels and traffic speeds. This gave a graphic picture <strong>of</strong> effectiveness, butonly a limited idea <strong>of</strong> value.2.6.12 Financial Evaluation—This described the impact <strong>of</strong> the project or policy on thefinancial costs and revenues <strong>of</strong> the affected organisations and interest groups; thisinformation was important but did not generally permit a conclusion on whether theproject was in the best interests <strong>of</strong> the community.2.6.13 Environmental Evaluation— Environmental Protection Department (EPD) cooperatedwith the Study by providing a general environmental assessment <strong>of</strong> eachhighway project. This assessment was used to modify the estimated costs <strong>of</strong>construction to include works to ameliorate noise impacts. It was noted that moredetailed assessments would be required at the detailed design stage when moredetailed planning features <strong>of</strong> the projects are known.2.6.14 Distributional Evaluation—This was an analysis <strong>of</strong> the distribution <strong>of</strong> costs andbenefits between the different groups in the community, in particular betweendifferent classes <strong>of</strong> travellers (private and public transport) and between Governmentand transport users.2.6.15 Economic Evaluation—<strong>The</strong> object was to place comparable values on all costs andbenefits resulting from projects and policies and thus show which ones were olgreatest value to the community as a whole. <strong>The</strong> economic evaluation was morebroadly based than the financial evaluation, considering such things as travel timesavings, changes in congestion costs, and the benefits to travellers from having animproved choice <strong>of</strong> travel modes.Project Selection and Programming2.6.16 Projects were selected for inclusion in the recommended investment programmebased on the estimates <strong>of</strong> funds available for investment and the priorities indicatecby the evaluation. Evaluation priorities were modified by the need to define logicalsequences <strong>of</strong> construction, and to accommodate projects required for reasons nolevaluated in CTS-2 e.g. access to new developments, and projects to re-align ancreconstruct some New Territories roads to modern traffic standards.2.7 Implications <strong>of</strong> Airport Relocation2.7.1 As discussed in Chapter 1 <strong>of</strong> this report, several studies <strong>of</strong> airport capacity ancrelocation are currently underway. Based on these studies, Government is expectecto make decisions on whether a replacement airport should be built, and if so, thelocation and timing <strong>of</strong> the new replacement airport as well as <strong>Hong</strong> <strong>Kong</strong>'s futurerequirements for port facilities by the end <strong>of</strong> 1 989.2.7.2 Quite clearly, relocation <strong>of</strong> the airport, if implemented, and further development o'the port would have major implications for the transport strategy. In particular, cpositive decision on the early relocation <strong>of</strong> the airport, which could occur within 1Cto 12 years <strong>of</strong> a decision to go ahead, would influence plans for the construction otransport infrastructure throughout the 1990s in order to satisfy the new travedemand pattern.2.7.3 Without any firm decision to move the airport (retaining the airport at Kas Tal
3.3.1 Introduction3.1.1 This chapter reviews trends in the development <strong>of</strong> transport, concentrating on thetwelve years since the end <strong>of</strong> the first Comprehensive Transport Study in 1 976.3.2 Growth <strong>of</strong> the Vehicle3.2.1 <strong>The</strong> growth <strong>of</strong> the licensed vehicle fleet is shown in Figure 3.1 from its origins afterthe Second World War. <strong>The</strong> growth by vehicle type since 1976 is set out in Table3.1.3.2.2 <strong>The</strong> strong growth in the vehicle fleet since the Second World War was interruptedon two occasions by increases in vehicle taxation, particularly on private cars andmotorcycles. <strong>The</strong> changes in taxation from 1974 are shown in Tables 3.2 (FirstRegistration Tax—FRT) and 3.3 (Annual Licence Fees—ALF). <strong>The</strong> changes inannual licence fees are plotted in Figure 3.2.3.2.3 After the 1974 taxation increases, the fleet declined for two years reaching a lowpoint in 1976 at the end <strong>of</strong> the first CTS. <strong>The</strong> fleet then grew rapidly, despite somefurther increases in taxes, until checked by the severe vehicle taxation increasesimposed in 1 982. This time/ it took four years before growth resumed in 1 986, andthis was as a result <strong>of</strong> a continuing decline in the car fleet being <strong>of</strong>f-set by the stronggrowth in goods vehicles. <strong>The</strong> vehicle fleet did not reach the previous high level setin 1981 until 1988.3.2.4 Despite the decline in the fleet following the 1982 tax measures, the vehicle fleetgrew by 75% in the twelve years since the first CTS, from 172000 to 300000vehicles.3.2.5 Each vehicle type is discussed in more detail below.3.1: IN VEHICLES36029
3.1GO OLicensed Vehicle Fleets (a]Private CarsMotorcyclesSub-TotalTaxis (c)Public BusesSingle DeckDouble DeckSub-TotalPrivate BusesSingle DeckDouble DeckSub-TotalTotal BusesPublic Light Buses (c/)MinibusPLBSub-TotalPrivate Light BusesGoods Vehicles (e)LightOtherSub-TotalGovernment VehiclesGrand TotalPublic Bus by OperatorC.M.B.K.M.B.Other PublicTotal1976(b) 1977 1978 1979 1980 1981 1982 1983 1984 1985 1986 1987103 5551654710659716103121 6711658614032217509160 23018523181 20420809192 9492080917019117758152362160661451041466614048413577140203132831 20 1 0260341 6201 7523372241 132543626—43311 18521 65210930325823875171 7356461 5691 1571 22 70067911 6631 8613524226 122383762—43351 0282521213456386683912181 1966941 6451 18513825771791 7451 9533698224 122363934__43339442852314484430074254201 9087171 7151 26615783181901 99221604152200 1121143631564172432888831 18915159463484357226 3058031 8341 5151787539272202023884408202 112134621295404243379443404916160502094464252 6008791 8701 659202 01 310490222327754998183 151985196348400243507963614616679528254757280 42786622551 87721375811 942229730705367177 522295596475387343488023965016755564055146297 9971 006234520161 87 94913437230431405444171 542255669701363343341 3984377416013597875468278 0421 004237320671 68 42815115218532565441149 351845625836349243281 7074562014776603965779261 3789952366208015977016069216632855451116 3214855991 001333443351 8625078114041648225939258 396936238621291 54 06116353225234465698101 810958071 0543291434521065827415279735535979262 2049062582221015348616579236938146183108 1912763101 190315243452257688761728886164600127514294028932350Annual Change (%)1988 1976-82 1982-88 1976-881 51 492136041 65 096166762617370463211121813064511 2543093434723617947019704991746293300 3988762771267410.93.910.112.16.09.88.1-5.026.0-1.77.544.9 (O-2.4(O3372 3524 3698 4152 4408 4998 5367 5444 5441 5451 5698 6183 6321 2.8 5.40.1-6.310.67.49.64.89.67.76.99.7-4.0-6.8-4.25.72.23.22.8-7.3-16.2-9.02.417.6-3.70.019.712.32.79.93.40.1-2.3 2.84.83.2-1.62.78.84.16.45.4-6.2 2.7-5.44.925.8(0)-3.2(0)0.05.911.45.09.74.14.82.64.97.2Notes:(a) As at end June.(b) 1976 Values calculated from registered vehicles.(c) Includes hire cars.(d) Minibus figures not reported separately until 1 979.(e) Goods vehicles not reported by type until 1985;Figures derived from valid licensing system tabulations.(f) 1979-1982.(g) 1979-1988.Source: Traffic and Transport Digest, TTSD. r Transport Department.
3.2 TAX(Percent <strong>of</strong> GIF Value)Date <strong>of</strong> IntroductionMar 1 Dec 4 Feb 28 Mar 1 May 5Vehicle Class 1974 1975 1978 1979 19821. Private CarGIF value:under $20,000 15 30 30 35 70$20,000—$30,000 15 30 35 40 80over $30,000 15 30 40 45 902. Taxi 153. Goods Vehicle 154. Public/Private Omnibus (a) 155. Public/Private Light Bus 156. MotorCycIe 15 30 35 70Note:Source:(a) Excludes Franchisee! BusLicensing Division, Transport Department31
Table 3.3 VEHICLE(Dollars per year)Vehicle ClassFeb28 Feb28 May 5 Feb 231974 1979 1982 1983Date <strong>of</strong> IntroductionAug251984 1985•eb271985Feb 261986Feb 251987Mar 219881. Private Car(a) under 1000 cc(b} 1001 cc-1500ce(c) 1501 cc - 2500 cc(<strong>of</strong>) 2501 cc-3500cc(e) 3501 cc - 4500 cc(/) over 4500 cc3505007501 0001 2501 5004006009001 2001 5001 8001 8001 80027003600450054002300230034004500560067002500250037505000620074002600260039005200650077002750275041005450680081002915291543455775721085852. Taxi(a) Urban(/?) New Territories(c) Lantau3205009009001 6001 60040020002000500210021005252200220055023302330583GO fO3. Goods Vehicle(a) under 20 cwt.weight unladen(b) 20,1 cwt. -45 cwt.(c) 45.1 cwt. -75 cwt.(d) over 75 cwt.3006009001 2004008001 2001 6004008001 2001 6007001 40021002800Permitted grossvehicle weight:up to 1.9 metrictonnes1.9- 5.5 metrictonnesmore than 5.5 metrictonnes7001 40028007501 50030008001 55031508501 65033009001 75035004. Public Bus(a) Driver(b) Per Seat10301535163717395. Private Bus(a) Driver(b) Per Seat10251530163217346. Public Light Bus500055005700600063607. Private Light Bus480900 900 1 6001 7501 8001 90020158. Motor Cycle175200 600 750800830870920Note:Source:Starting on May 5, 1982, Licence fees for private cars using diesel fuel were $1,000 higher than petrol cars <strong>of</strong> similar engine size. This premium was increased to $1,050 on February25th, 1987 and to $1,115 on March 2nd, 1988.Licensing Division, Transport Department.
FIGURE 3.2:CHANGES IN ANNUAL LICENCE FEESRelative To 1966 - 1.0148- Motorcycle" mmm Private Car- Private Light Bua- Qoode VehiclePLB- Taxi- Franchisee! Bus^— Inflation Index70 71 72 73 74 75 76 77 78 79 80 81 82 83 84 85 86 87 88 89Private Cars3.2.6 <strong>The</strong> growth in the car and motorcycle fleet over the period 1976-1988 is shown inFigure 3.3. As noted earlier, the vehicle taxation measures over this period concentratedon private cars and motorcycles. First Registration Tax was increased in both1978 and 1979 and then doubled in 1 982. Annual licence fees increased by over sixtimes over the period, including a tripling in 1982; after adjustment for inflation, thisrepresents a real increase <strong>of</strong> about three times over the period.FIGURE 3.3:LICENSED PRIVATE CARS AND MOTORCYCLES200 -Thousands (Mid-Year)150-10076 77 78 79 80 81 82 83 84 86 86 87 88M/C Car van Car
3.2.7 <strong>The</strong> car and motorcycle fleet declined over a period <strong>of</strong> five years following the 1982tax measures. <strong>The</strong> prolonged decline was attributable to several factors: the severity<strong>of</strong> the 1982 measures, subsequent annual adjustments to licence fees to <strong>of</strong>f-setinflation and the introduction <strong>of</strong> the private car inspection scheme in 1986 whicheffectively increased the cost <strong>of</strong> owning and operating a car. At their peaks in 1981,cars and motorcycles represented 72% <strong>of</strong> the total vehicle fleet; by 1988 this sharehad dropped to 55%.3.2.8 In early 1987, the car fleet started growing again, as shown in Figure 3.4; by the end<strong>of</strong> 1988, it was increasing at a rate <strong>of</strong> about 10% per year. <strong>The</strong> future growth <strong>of</strong> theprivate car fleet is a key issue in the management <strong>of</strong> transport demand.3.4: IN186160166160146140136 J. .S I .1 I i ,1, i I 1-8. .|. I i. .j. » i. .1. a i ,s, i.i i. J.L s j.j..4 .g, j i i.. \ ,i jJan Apr Jul Ocf Jan Apr Jul Oct Jan Apr Ju( Oct Jan Apr Jut OcfI 1986 I 1986 I 1987 I 19883.2.93.2.103.2.113.2.12<strong>The</strong> changes in the motorcycle fleet followed those in the private car fleet but theshare taken by motorcycles declined over the period from 14% <strong>of</strong> the combined fleetin 1976 to 8% in 1988.Car registered light vans grew from almost nothing in 1976 to 10% <strong>of</strong> the car andmotorcycle fleet by 1982; this share dropped to 6% by 1988. Light vans arediscussed in more detail below.An increasing proportion <strong>of</strong> the car-registered vehicle fleet was company-owned, asopposed to ownership by a private individual. In 1976, just 3% <strong>of</strong> all cars werecompany-owned; this proportion had risen to 20% by 1986.Goods VehiclesFor many years, the goods vehicle fleet grew at about the same rate as the economyas measured by the real growth in Gross Domestic Product (GDP); the relationshipsince 1961 is shown in Figure 3.5. With the very rapid growth <strong>of</strong> the economy, thegoods vehicle fleet increased three times between 1976 and 1988 to constitute onethird <strong>of</strong> the total vehicle fleet In fact by the end <strong>of</strong> 1988 the goods vehicle fleetappeared to be growing faster than the economy, but it is too early to say whetherthis accelerated growth is a long term trend.34
FIGURE 3.5:GOODS VEHICLE AND GDP GROWTHRelative to 19613 -1961 1964 1967 1970 1973 1976 1979 1982 1985 1988GDP In Constant Prlcea3.2.13 <strong>The</strong> changes in the goods vehicle fleet by vehicle class are set out in Table 3.4 andillustrated in Figure 3.6. Much <strong>of</strong> the growth in goods vehicles was in light vans, asdiscussed in paragraphs 3.2.18 to 3.2.26.FIGURE 3.6:LICENSED GOODS VEHICLES120Thousands (Mid-Year)100-Light Van*Other Light GoodsMedium/Heavy Goods2076 77 78 79 80 81 82 83 84 86 86 87 88
3.2.14 <strong>The</strong> non-van goods vehicle fleet doubled between 1976 and 1988 with growthfairly evenly divided between light goods (up to 5.5 tonnes gross vehicle weight)and medium/heavy goods vehicles. Growth <strong>of</strong> the light goods fleet paused in 1984,and the medium/heavy fleet declined slightly between 1982 and 1985. This couldhave been the result <strong>of</strong> the 75% increase in annual licence fees in 1983. Growthpicked up after 1985, reaching 12% per year by 1988.3.2.15 <strong>The</strong> trailer fleet also expanded rapidly over the period, increasing from | 245 in 1976to 6960 by 1988. A large proportion <strong>of</strong> trailers are associated with containercarrying vehicles and the increase in trailers is indicative <strong>of</strong> the strong growth incontainer traffic.3.2.16 <strong>The</strong> heavy goods vehicle fleet (vehicles over 24 tonnes gross vehicle weight)remains very small, but grew rapidly in 1988. By the end <strong>of</strong> the year, it had reached434 vehicles, well over double the prevailing fleet size up to 1987.3.4 BY(Mid-year)Light Medium Heavy 1Vans Other Total1976 3538 18114 10930 325821977 5005 20207 13456 386681978 6524 21999 14484 430071979 8178 23011 15159 463481980 9681 24368 16160 502091981 10914 25232 16679 528251982 12541 27109 16755 564051983 15294 28480 16013 597871984 17440 28180 14588 188 603961985 19891 30890 13859 182 648221986 24921 33353 15091 188 735531987 32669 36207 17106 182 861641988 39073 40397 19432 272 99174Definition: Light = 5.5 tonnes Gross Vehicle Weight (GVW) and underMedium = over 5.5 tonnes and up to 24.0 tonnes GVWHeavy = above 24.0 tonnes GVWVan = Up to 3.0 tonnes GVW with a van body.1 1976 to 1984, combined with medium goods vehicles3.2.17 Policies for managing the growth in traffic have previously concentrated on privatevehicles. It is now clear that attention must also be paid to the growth <strong>of</strong> the goodsvehicle fleet, with particular attention to goods light vans.Light Vans3.2.18 <strong>The</strong> number <strong>of</strong> light vans (defined as a vehicle registered with a van body and with agross vehicle weight <strong>of</strong> 3 tonnes or less) increased rapidly over the twelve yearssince the first CTS from 4000 vehicles in 1976 to 49 000 vehicles in 1988. <strong>The</strong>growth is illustrated in Figure 3.7.3.2.19 <strong>The</strong> reason for this growth is easy to see. <strong>The</strong> modern van is really a new class <strong>of</strong>vehicle having considerable advantages over conventional goods vehicles in easymanoeuverability and also security; a van can be locked and left unattended. For thisreason, a significant degree <strong>of</strong> substitution <strong>of</strong> goods light vans for other goodsvehicles can be observed. <strong>The</strong> growth in light vans can also be linked to the growthin service industries such as home deliveries (groceries, florists, etc.) and air freightcouriers. <strong>The</strong>se industries are associated with the increasing affluence <strong>of</strong> thecommunity and the growth <strong>of</strong> <strong>Hong</strong> <strong>Kong</strong> as a business centre, and light vans areideally suited to their requirements.36
3.2.20 Light vans can be registered either as a private car or as a goods vehicle. To qualify asa goods vehicle on registration, the van must comply with the following:(1) <strong>The</strong>re may be no side windows in the goods compartment.(2) <strong>The</strong> goods compartment must include at least 50% <strong>of</strong> the capacity <strong>of</strong> the van.(3) <strong>The</strong>re must be a partition between the driver and goods compartments.3.2.21 However registered, surveys by CTS-2 indicated that during the working day, mostlight vans were being used for goods transport or by service industries; about85%-90% <strong>of</strong> goods-registered light vans but also an estimated 70% <strong>of</strong> car-registeredlight vans. Private car registration for goods light vans is advantageous, in somecircumstances, particularly to obtain access to areas banned to goods vehicles in thepeak hour. In fact, many goods light vans are still registered as private cars despitethe much higher taxes.3.2.22 <strong>The</strong> changes in vehicle taxation in 1982 made it very much cheaper to register lightvans as goods vehicles. Registrations as a goods vehicle now (early 1989) incursmuch lower First Registration Tax (1 5% versus 70% for a small car) and much lowerannual licence fees (currently $970 versus $3,1 50 for a small car). <strong>The</strong>se changes areundoubtedly the reason for the switch in registration <strong>of</strong> light vans from private carsto goods vehicles illustrated in Figure 3.7. This should not necessarily be interpretedin too sinister a light. What possibly happened is that many light van operatorsperceived the advantages <strong>of</strong> private car registration as marginal but worthwhilebefore 1982, but not as worthwhile after the private car tax increase. It is alsopossible that some users <strong>of</strong> car-registered light vans for passenger carrying purposesswitched to less expensive private light bus registration, which would explain thesudden growth in private light buses after 1982.FIGURE 3.7:LICENSED LIGHT VANSThousands (Mid-Year)Registered As GoodsRegistered As Car76 77 78 79 80 81 82 83 84 85 86 87Light Van Defined Ae VehicleWith Van Body Of Qroes VehicleWeight Up To 3 Tonnes.
3.2.23 Use <strong>of</strong> Light Vans as Private Vehicles—<strong>The</strong>re is evidence, however, that there issome use <strong>of</strong> goods light vans for private car purposes, using goods vehicleregistration to escape the high private car taxation. Much <strong>of</strong> the evidence isanecdotal in nature, such as tinted windows installed in goods light vans, unusuallyluxurious finishings and extras and full side-windows installed after registration.While the specifications for goods-registered vans reported above deter use <strong>of</strong> lightvans as private cars, it is noted that alterations made to vehicles subsequent toregistration are not illegal, although owners can be made to restore the vehicle toregistration standards if changes are detected on subsequent vehicle inspection.3.2.24 Supporting the view that some light vans are purchased for personal use, recentstatistics show a stronger growth in goods vehicles than growth in the economywould suggest, although as noted in paragraph 3.2.12 the recent rapid growth in theeconomy makes it difficult to detect trends. It can also be noted that some <strong>of</strong> thestatistics go against this view; it is the larger vans which are growing faster andcompany registration <strong>of</strong> vans is growing faster than registration by private individuals.3.2.25 <strong>The</strong> CTS-2 survey <strong>of</strong> goods van use <strong>of</strong>fers perhaps the best evidence, which is that10-20% <strong>of</strong> the goods van fleet is being used for non-goods purposes; say 5 000 to10000 vehicles. Much <strong>of</strong> this might be for quite satisfactory reasons; use as acompany run-about mainly for passengers, but with just occasional use for packagesor equipment. <strong>The</strong> level <strong>of</strong> real abuse, registration <strong>of</strong> a personal light van as a goodsvehicle to avoid higher taxes, may be much lower. A possible range could be 4 000to 8 000 vehicles in the current goods-registered light van fleet, but this is very mucha matter <strong>of</strong> judgement.3.2.26 In addition to this, it is likely that a significant number <strong>of</strong> light goods vans have dualuse; primarily for goods transport during the working day, but also for personaltransport to and from work and during evenings and weekends. Again, the evidenceis anecdotal in nature, but convincing. Given that mobility is highly prized, such adevelopment should not be surprising.Taxis3.2.27 <strong>The</strong> taxi fleet, included with other vehicles in Figure 3.1 but illustrated separately inFigure 3.8, grew rapidly in the late 70s and early 80s. <strong>The</strong> taxi fleet more than tripledFIGURE 3.8:LICENSED TAXISThousands (Mid-Year)76 77 78 79 80 81 82 83 843886 87 88
in the ten years following the first CIS, mainly through increased demand but partlyto replace the remaining hire car fleet which was phased out by 1978. Quotas fortaxis have been introduced which are currently no more than 200 new urban and100 New Territories taxi licences per year.3.2.28Buses and Minibuses (Public and Private Light Buses)<strong>The</strong> standard bus fleet almost doubled in size between 1976 and 1988, as shown inFigure 3.9. <strong>The</strong> distribution <strong>of</strong> buses by type at the end <strong>of</strong> 1988 was as follows:Kowloon Motor BusChina Motor BusNew Lantau BusOther Public BusPrivate BusSingleDeck93322751120DoubleDeck2633876131651229983699FIGURE 3.9:LICENSED BUSESThousands (Mid-Year)76 77 78 79 80 81 82 83 84 85 86 87 883.2.29 Thus the great majority <strong>of</strong> double-deck buses are operated by the franchised buscompanies.3.2.30 <strong>The</strong> public light bus fleet remained fixed throughout the period at about 4350vehicles, although by 1988 nearly 30% <strong>of</strong> the fleet were converted from red to greenminibuses. <strong>The</strong> private light bus fleet declined up to 1982, but then tripled in sizebetween 1982 and 1988, probably partly as a result <strong>of</strong> the changes in vehicletaxation in 1982 which reduced the number <strong>of</strong> car-registered light vans.
3.3 Road Usage and Road Construction3.3.1 <strong>The</strong> total volume <strong>of</strong> travel more than doubled between 1976 and 1988 which isshown in Figure 3.10 together with the changes in road usage by the differentvehicle types. <strong>The</strong> increasing dominance <strong>of</strong> goods vehicles is clearly illustrated, andthe reduction in the proportion <strong>of</strong> road space taken by road-based public transportservices. Of the latter, bus services more than doubled in the period, but public lightbus (PLB) use remained constant. <strong>The</strong>se fixed route public transport services weresupplemented by the growth in special purpose buses (SPB) comprising mainlyschool buses, but also including factory, residential and tour buses.FIGURE 3.10:USE OF ROAD SPACETaxi 1602,16%Goods Vehicle 361734%\yiBus 16917%PLB 112211% f/W PLB 1100*\t?
Screenline3.5 BY(vehicles per day)Vehicle Type 197.6 1981 7986Annual Growth Hates (%)1988 1976-81 1981-88 1976-88Overall UrbanCarTaxiPassenger VanPublic Light BusGoods VehicleBusTotal342 84629861014814892811 1 2 1 9458916465 454376 75461 00871 4641 43 45653493386 321477 70861 8916533919262963221400 394457 5424677766 255263467671286.34.832.7-4.45.0-1.9-2.12.8-3.7-1.19.13.31.33.610.1-2.57.41.1916660 1 171 630 1 247110 1 301 563 5.0 1.5 3.0KowloonExternalRural (R-R)Cross-HarbourCarTaxiPassenger VanPublic Light BusGoods VehicleBusTotalCarTaxiPassenger VanPublic Light BusGoods VehicleBusTotalCarTaxiPassenger VanPublic Light BusGoods VehicleBusTotal5526290033463221604058180331 07 27321 08615551279387933512388105591364652283015537118275183911130775472816901185111762562293714.218.635.04.714.39.00.814.61.2-5.712.19.26.116.214.1-1.513.09.1138500 263570 317090 402410 13.7 6.2 9.314861400800533199961 933327541 5708064492421 1232926301384025589053014476680503817767844523412471 033838017.131.558.7-1.616.18.62.223.3-7.9-2.518.916.28.226.615.5-2.117.813.033320 71360 98170 133021 16.5 9.3 12.23566066221 2761 21511 8464131646581460411 4241 41321 2004475579212014188827513227651295998418506599682742006680212.617.155.03.112.31.6-1.13.4-8.8-7.410.36.24.48.913.8-3.211.14.260750 117775 125100 134121 14.2 1.9 6.8Notes: (1) Data derived from Annual Traffic Census <strong>of</strong> Transport Department(2) Overall urban is a composite <strong>of</strong> 5 screenlines: <strong>Hong</strong> <strong>Kong</strong> Internal, C-C, F-F, G-G, and I-l(3) Cross-harbour screenline includes vehicular ferries3.3.3 <strong>The</strong> high proportion <strong>of</strong> private cars and taxis in the urban traffic stream is shown inFigure 3.11. Taxi traffic increased up to 1986, but declined slightly over the next twoyears. <strong>The</strong> volume <strong>of</strong> car traffic declined following the 1982 private car taxationmeasures, but started to increase again after 1986. Passenger van traffic increased inthe early part <strong>of</strong> the period reflecting the decline in car-registered vans following the1982 increases in private car taxation. Public light bus traffic declined, probablyreflecting the conversion to green minibus operations which operate <strong>of</strong>f the maintransport corridors. Goods vehicle traffic grew substantially in the period, showing a37% growth over the last two years alone.41
FIGURE 3.11:TRAFFIC IN URBAN HONG KONG AND KOWLOONVehicle TypePrivate CarTaxiPaseenger VanPublic Light BusGoode VehicleBus0 100 200 300 400 600Vehicles Per Day (Thousands)Includes TT8D Screenllnes HK Internal,C-C. F-F, Q-S And l-l3.3.4 <strong>The</strong> changes in cross-harbour traffic are shown in Figure 3.12. Growth in private cartraffic was more rapid in the first part <strong>of</strong> the period than in the urban area in general,and the decline after 1981 was not so severe. Taxi traffic is less prominentcross-harbour than in the rest <strong>of</strong> the urban area, reflecting the predominant use <strong>of</strong>taxis for short journeys. Passenger van traffic grew strongly in the first part <strong>of</strong> theperiod, but declined thereafter. Cross-harbour goods vehicle traffic increased by afactor <strong>of</strong> 3.5.FIGURE 3.12:TRAFFIC CROSSING THE HARBOURVehicle TypePrivate CarTaxiPassenger VanPublic Light BusGoods VehicleBusIncludes Traffic On <strong>The</strong>Cross-Harbour Vehicular F«rrl««10 20 30 40 60 80Vehicles Per Day (Thousands)4270
3.3.5 <strong>The</strong> changes in traffic to and from the New Territories are shown in Figure 3.13, andwithin the New Territories in Figure 3.14. With the population growth <strong>of</strong> the NewTerritories during the period, traffic growth was strong for most vehicle classes. Inparticular, goods vehicle traffic increased seven times in the New Territories over theperiod. <strong>The</strong> decline in car traffic following the 1982 tax measures was less markedthan in the urban area and by 1988 had surpassed the previous high level <strong>of</strong> 1981.Strong growth was seen in franchisee! bus movements, again associated with thebuild up in population.FIGURE 3.13:TRAFFIC TO AND FROM THE NEW TERRITORIESVehicle TypePrivate CarTaxiPassenger VanPublic Light BusGoods VehicleBusIncludes TT8D ScreenllneKowloon External50 100 160Vehicles Per Day (Thousands)20043
FIGURE 3.14:TRAFFIC IN THE NEW TERRITORIESVehicle TypePrivate CarTaxiPassenger VanPublic Light BusGoods VehicleBusIncludes TT8D8ora«nlln« R-R20 40 60Vehicles Per Day (Thousands)Highway Construction3.3.6 In the period between 1976 and 1988 in which total travel more than doubled, thehighway network increased only by about 40% in terms <strong>of</strong> lane-kilometres, asshown in Figure 3.15. Most <strong>of</strong> the construction took place in the New Territorieswhere lane-kilometres increased by 80% in the period; this is contrasted withincreases <strong>of</strong> 16% and 19% in Kowloon and <strong>Hong</strong> <strong>Kong</strong> Island respectively.1900Lane-KilometresFIGURE 3.15: HIGHWAY CONSTRUCTION1700150013001100900<strong>Hong</strong> <strong>Kong</strong> Island70060076 77 78 79 80 81 82 83 84 86 86 87 8844
3.3.7 Thus traffic growth exceeded the growth in road space by a considerable marginWith the exception <strong>of</strong> the Cross-Harbour and Lion Rock tunnels and some specificareas, the road system was able to accommodate this growth for several reasonsnew roads are generally <strong>of</strong> higher traffic capacity than existing, traffic grew faster irthe New Territories where there was existing spare traffic capacity, and growth wasgreatest in goods vehicle traffic which is associated more with <strong>of</strong>f-peak travel wherthere is also spare capacity. However, the situation is deteriorating quickly withcongestion spreading over the road network due to the rapid growth in trafficdemand.3.4 Tunnel and Vehicular Ferry Traffic3.4.1 <strong>The</strong>re are four major tunnels in the Territory, each <strong>of</strong> four traffic lanes. <strong>The</strong> growth irtraffic <strong>of</strong> each tunnel is shown in Figure 3.16.3.16: IN12010080804020J_I_[—LJ-I , I -S- T 1- i -,[_!—I—L_[_-LJLJ74 7§ 78 77 78 79 80 81 82 83 84 85 88 87 883.4.2 By the mid-1980s, the two older tunnels, Cross-Harbour and Lion Rock, wereheavily utilised with peak hour traffic demand considerably above planned trafficcapacity. As a result, queues <strong>of</strong> traffic were backing up into the surrounding roacsystem and were a major cause <strong>of</strong> traffic congestion in the Territory. Increasing dashtraffic volumes were a result <strong>of</strong> increases in <strong>of</strong>f-peak traffic augmented by peak-houtraffic spreading to adjacent hours.3.4.3 In order to curb the growth in tunnel traffic, a passage tax was imposed on theCross-Harbour tunnel in June 1984. Toll levels before and after the passage tax anshown in Table 3.6. <strong>The</strong> changes in traffic flows in the tunnel and on the vehiculaferries before and after the introduction <strong>of</strong> the tax are illustrated in Figures 3.11 anc3.18. Traffic demand in the tunnel was reduced by about 10% but growth resumecreaching the 1984 levels again by 1987. Most <strong>of</strong> this renewed growth was in goodivehicle traffic; the number <strong>of</strong> private cars and taxis were still below the pre-passag«tax levels at the end <strong>of</strong> 1988.45
Table 3.6 CROSS HARBOUR TUNNEL TOLL INCREASES JUNE 1984Vehicle TypeMay 1984Toll ($)Passage Tax($)June 1984Toll ($)Motor CyclePrivate car, taxiPrivate and public light busPrivate and public single deck busDouble deck busGoods vehicle not exceeding 5.31 tonnesGoods vehicle 5.31-12.73 tonnesGoods vehicle over 12.73 tonnesExtra axles25810151015205252nilni!555nil4101010151520255FIGURE 3.17:CHANGE IN CROSS-HARBOUR TUNNEL TRAFFICVehicles Per Day (Thousands)140120100806079 80 81 82 83 84 86 86 87 8846
FIGURE 3.18:CHANGE IN HYF VEHICLE FERRY TRAFFICVehicles Per Day (Thousand®)181814TOTALCAR/HO12108842079 80 81 82 83 84 86 86 87 883.4.4 <strong>The</strong> graph in Figure 3.1 9 shows the changes in vehicular ferry traffic since the early60s. Traffic volumes are currently increasing rapidly, but are expected to besubstantially reduced on the opening <strong>of</strong> the Eastern Harbour Crossing in 1989.Ferries are currently carrying some 12% <strong>of</strong> total cross-harbour vehicular traffic.3.4.5 <strong>The</strong> opening <strong>of</strong> new tunnel facilities will provide relief to existing tunnels, but theissue <strong>of</strong> tunnel capacities and toll levels is likely to remain a critical issue.FIGURE 3.19:VEHICLE USING THE CROSS HARBOUR FERRIESThousands Per Day2520Opening Of Th«Croas-Harbour TnnnaJ151062 64 66 68 70 72 74 76 78 80 82 84 86 8847
3.5 Public Transport Patronage3.5.1 Public transport patronage increased by 65% in the period 1976 to 1988, comparedwith a 25% increase in population. <strong>The</strong> higher rate <strong>of</strong> growth in travel can beattributed to the increase in personal incomes and the dispersal <strong>of</strong> the populationfrom the urban centre. <strong>The</strong> growth in traffic by mode is reported in Table 3.7 andillustrated in Figure 3.20.FIGURE 3.20:GROWTH IN PUBLIC TRANSPORT PATRONAGEMillions Per Day76 77 78 79 80 81 82 83 84 85 86 87 88I FerryTaxiBus3.5.2 Bus travel increased by over 50% between 1976 and 1984, although remained fairlystatic at just under 4 million journeys per day after 1984. <strong>The</strong> expansion <strong>of</strong> the railsystem curtailed the growth in bus patronage, initially by providing an efficientcompeting service and latterly because most population growth was taking place incorridors well served by rail. Congestion in the Cross-harbour and Lion Rock tunnelsalso contributed to the stagnation in bus growth over the last four years, togetherwith the exclusion <strong>of</strong> internal bus services from the North-west New Territories lightrail Transit Service Area (TSA) from September 1988. <strong>The</strong> latter has further restrictedbus growth. However, franchised buses still carried 38% <strong>of</strong> all public transportpassengers in 1988.Rail3.5.3 Rail travel showed the most substantial growth over the 1 2 year period, due to theopening <strong>of</strong> the Mass Transit Railway (MTR), the double-tracking and electrification<strong>of</strong> the Kowloon-Canton Railway (KCR) and the recent opening <strong>of</strong> the Light RailTransit (LRT) system in the North-west New Territories. Together with <strong>Hong</strong> <strong>Kong</strong>Tramways, rail services were carrying 27% <strong>of</strong> all public transport journeys in 1988.48
3.7(Thousands)Public Transport Operator19761977197819791980198119821983198419851986Annual Change (%)19871988 (d) 1976-82 1982-88 1976-88Mass Transit Railway Corp, (a)———127.6459.0610.7961.91,128.61,124.81,268.21,460.51 ,624.41,630.396.1 (e) 9.232.8(0Kowloon-Canton Railway Corp.34.237.843.450.353.046.960.9131.8219.1282.9317.4373.6403.310.137.122.8<strong>Hong</strong> <strong>Kong</strong> Tramways Ltd.Total Fixed Rail Services351.1385.4368.4406.2379.9423.3413.5591.4436.1948.1439.61,097.2392.81,415.5359.21,619.6335.61,679.5331.01,882.2334.92,112.8367.62,365.6356.32,389.91.924.2(1.6)9.10.116.4Kowloon Motor Bus Co, Ltd.1,962.82,221.72,357.52,559.82,497.72,556.22,576.42,689.92,929.62,956.33,036.42,981.83,042.74.62.83.7China Motor Bus Co. Ltd.631.7656.5697.8751.6754.9787.6854.5953.7993.5942.5872.3872.3883.65.20.62.8New Lantao Bus Co.Total Franchised Bus Services4.62,599.15.52,883.76.03,061.36.83,318.27.73,260.28.63,352.49.23,440.28.63,652.28.73,931.88.73,907.68.33,917.08.93,863.08.73,935.012.24.8(1.0)2.35.43.5Green Minibus Services10.014.918.149.3103.1139.1191.6285.2379.0466.9519.2582.6613.163.621.440.9Public Light Bus (Other than GreenMinibus Services)1,585.01,60011,479.91,527.71,391.91,319.91,268.41,136.8979.01,013.1993.8963.8962.3(3.6)(4.5)(4.1)Total Minibus Services<strong>The</strong> Star Ferry Co. Ltd.<strong>Hong</strong> <strong>Kong</strong> & Yaumatei Ferry1,595.0138.9370.71,615.0139.6365.61,498.0148.5359.41,577.0154.9390.21,495.0127.5361.61,459.0113.3346.71,460.0104.4314.41,422.0102,5274.31,358.0114.0248.01,480.0118.6229.41,513.0111.8209.51,546.4109.3205.41,575.4110.0202.8(1.5)(4.6)(2.7)1.30.9(7.0)(01)(1.9)(4.9)Minor Ferry ServicesTotal Ferry ServicesOther (o)Total PassengersTaxis (c)18.5528.25.05,112.6638.019.3524.610.95,440.3698.020.9528.89.65,520.9833.022.0567.110.16,063.9717.020.7509.99.16,222.3822.016.0476.08.96,393.5905.016.8435.79.36,760.71,018.019.0395.812.67,102.11,099.018.6380.516.37,366.21,104.017.1365.122.57,657.31,155.016.6337.925.77,906.41,198.015.8330.528.58,134.11,210.715.5328.329.48,258.01,211.7(1.6)(3.2)10.94.88.1(1.4)(4.6)21.23.42.9(1.5)(3.9)15.94.15.5Notes: (a) Opened for service October 1, 1979.(b} Includes Peak Tramway, Residential Coach Services (Starting in 1983), and Ocean Park Cable Car (Starting in 1977).(c) Includes hire cars.(d) Through the end <strong>of</strong> June.(e) 1979—1982(f) 1979—1988Figures Represent Daily Averages, Including Weekends.Source: Traffic and Transport Digest, Traffic and Transport Survey Division, Transport Department, and Transport Department Annual Report.
3.5.4 <strong>The</strong> growth in rail transport occurs in the Spring <strong>of</strong> each year, as shown in Figure3.21, when passengers seek the air-conditioned comfort associated with rail. Little<strong>of</strong> the new traffic is lost at the end <strong>of</strong> the hot season. (<strong>The</strong> particularly strong growthshown at the end <strong>of</strong> 1988 is associated with the opening <strong>of</strong> the Northwest LRTsystem.)3.21: INPer Oaf4*03.53,02.S2.0Jan Jan Jan1986 1988Jan1987 19883.5.53,5.63.5.73.5.8<strong>The</strong> growth <strong>of</strong> rail travel was so rapid that the limits <strong>of</strong> capacity were being reachedin 1988 in some locations; in particular, the Sha Tin to Kowloon section <strong>of</strong> the KCR,the Nathan Road Corridor on the MTR and the MTR/KCR interchange station atKowloon Tong,<strong>The</strong> main problem for the railways is the very high demand in the morning andevening peak periods. <strong>The</strong> distribution <strong>of</strong> passengers by hour <strong>of</strong> day entering andexiting the MTR Central station is shown in Figure 3.22. Some 22% <strong>of</strong> all passengerscoming to Central arrive in the hour between 8:00 and 9:00 in the morning, whilevolumes for most <strong>of</strong> the day barely reach one quarter <strong>of</strong> this level. It is estimated thatbetween 20% and 26% <strong>of</strong> one-way demand occurs in the morning peak hour on allthe main rail corridors, including the KCR line south <strong>of</strong> Sha Tin.<strong>The</strong> capacity <strong>of</strong> the rail system and policies for managing demand in the peak hourare important issues for transport planning.MinibusesMinibus services are restricted by the policy <strong>of</strong> maintaining the fleet <strong>of</strong> public lightbuses constant at 4350. Minibus patronage declined slightly after 1976, butregained their 1976 level <strong>of</strong> demand by 1988. <strong>The</strong> main change in the period hasbeen the conversion <strong>of</strong> the red minibus services operating in the main transportcorridors to green minibuses to serve defined feeder routes. By 1988, the greenminibus services were carrying nearly 40% <strong>of</strong> the total minibus demand.50
FIGURE 3.22:MTR PASSENGER MOVEMENTS AT CENTRAL STATIONProportion Of Dally One-Way Traffic25%20%ExitingEntering15%10%5%0%6 7 8 9 10 11 12 13 14 15 16 17 18 19 20 21 22 23 24Hour BeginningPassenger Ferries3.5.9 Cross-harbour ferry services declined between 1976 and 1988 with the opening <strong>of</strong>the MTR cross-harbour link and with increasing competition from cross-harbourbuses. However, traffic to and from the outlying islands increased by nearly 60%over the period.Taxis3.5.10 Table 3.7 indicates that demand for taxis (and hire cars in the earlier years) doubledin the period 1976 to 1988, while Table 3.1 previously showed that the taxi and hirecar fleet increased by 2.8 times. Not too much weight should be placed on theapparent discrepancy, since taxi passenger statistics are very approximate. Growthhas undoubtedly been strong in the period and there is no indication <strong>of</strong> diminishingproductivity as measured by the proportion <strong>of</strong> passenger-carrying to empty kilometrestravelled.3.5.11 Growth in demand for taxis was probably the result <strong>of</strong> a number <strong>of</strong> factors. Inparticular, taxi usage is strongly influenced by income levels, as illustrated in Figure3.23, hence increasing affluence with the growth <strong>of</strong> the economy played a role. Alsoimportant was the decline in taxi fares relative to bus fares, illustrated in Figure 3.24,which by 1988 resulted in it being cheaper, for some journeys in the urban area, for agroup to share a taxi than take a bus. Finally, the decline <strong>of</strong> the private car fleetfollowing the 1982 tax measures probably also influenced the demand for taxis.3.5.12 <strong>The</strong> taxi trade was able to survive the decline in real fares for several reasons. Inparticular, the structure <strong>of</strong> the industry changed. In 1981 (when the first detailedsurvey <strong>of</strong> taxi trade costs was undertaken), two thirds <strong>of</strong> all taxis were operatedusing hired drivers; this type <strong>of</strong> operation now represents only 1 % <strong>of</strong> taxi operations.In 1988, most taxis were owner-operated (14%), rented out by the shift toindependent drivers (53%), or operated by the owner for one shift and rented out toan independent driver for the other (29%). Thus the overhead costs <strong>of</strong> hiring driverswere eliminated and both owners and renters had personal incentives to improve
taxi productivity. <strong>The</strong> average paid kilometres per taxi increased by 9% over theperiod. At 1988, the average net income per shift for an urban taxi driver wasestimated at $5,700.FIGURES 3.23:TAXI USAGE BY HOUSEHOLD INCOME0.70.60.50.40.30.20.1Trips Per Day Per Person5Derived From <strong>The</strong> 1981 TravelCharacteristic* Survey (TC8)10 15 20 25 30Average Household Income ($1981 Thousands)FIGURE 3.24:CHANGES IN TAXI AND BUS FARESIndex Relative To 1976 • 1.01.50.576 77 78 79 80 81 82 83 84 85 86 87 88Change* In Bue Fares BaaedOn KMB Urban Service*(Conatant Prlcea)52
3.5.1 3 Income per taxi net <strong>of</strong> operating costs (fuel, repairs, etc.) and driver costs (allowingowner-drivers an average driver wage) were low at about $4,400 per month in 1 988;considerably less than the cost to an owner <strong>of</strong> purchasing a taxi. This was estimatedin August 1988 at around $700,000 for a second-hand taxi with licence; typically anew owner would buy the taxi on a mortgage, with a down payment <strong>of</strong> $1 00,000 to$150,000 and payments over a 9-10 year period <strong>of</strong> $9,000 per month. With quotasimposed on the number <strong>of</strong> new taxi licences issued each year, the value <strong>of</strong> a taxilicence rose considerably from about $200,000 in the early 1980s to around$700,000 in 1988. With such high appreciation in the licence value, owners couldmore easily accept the low pr<strong>of</strong>its on the operation <strong>of</strong> the taxi itself. Also, it is wellunderstood by owners and drivers alike that large increases in taxi fares to bettercompensate increased costs would have a sharp impact on demand for taxi servicesand could in fact be counter-productive.53
4.4.1 introduction4.1.1 Demand for movement is dependent upon where people live, where they work, howmuch they can spend on travel and how much travel costs. In addition, the situation<strong>of</strong> <strong>Hong</strong> <strong>Kong</strong> results in international traffic as the dominant flow on certain parts <strong>of</strong>the transport network. In a study <strong>of</strong> this nature, it is necessary to represent theseitems numerically and make a forecast <strong>of</strong> their values. This chapter discusses theprojections <strong>of</strong> these planning data under four broad headings:— Land Use— Economic Growth— Transport Costs— International TrafficProjections were made for the three forecast years for the Study: 1991, 1996 and2001.4.1.2 <strong>The</strong> planning <strong>of</strong> infrastructure to meet transport needs must take account <strong>of</strong>available funds. <strong>The</strong> discussion <strong>of</strong> the likely budget for transport investment takes upthe last part <strong>of</strong> the chapter.4.1.3 <strong>The</strong> projections presented in this chapter are only estimates <strong>of</strong> what might occur ifcurrent trends and policies continue. <strong>The</strong>se assumptions or projections wereadopted specifically for the purpose <strong>of</strong> the present Study, as they are basic inputs tothe model process. However, as will be seen later in this report, the majorrecommendations <strong>of</strong> the Study are not affected by minor variations in theseprojections. <strong>The</strong> impact on transport projects or policies <strong>of</strong> major variations isdiscussed in the relevant chapters. <strong>The</strong> Study has also been planned as the start <strong>of</strong> acontinuing transport planning process which is intended to re-assess transportprojects and policies at regular intervals in the light <strong>of</strong> actual developments andrevised projections.4.2 Land Use4.2.1 To be useful in forecasting traffic flows, land use needs to be quantified on a smalland localised basis. CTS-2 used a system <strong>of</strong> 242 traffic zones for its analyses. Fourrepresented cross-border traffic by road and rail at Lok Ma Chau, Man Kam To, ShaTau Kok, and Lo Wu. <strong>The</strong> remaining 238 internal zones covered the territory <strong>of</strong> <strong>Hong</strong><strong>Kong</strong>, the structure reflecting administrative boundaries and areas <strong>of</strong> new reclamation.Most importantly, the zones delineated each area in terms <strong>of</strong> accessibility totransport facilities, with separate zones for each <strong>of</strong> the main public transportcatchment areas such as ferry piers and MTR/KCR stations. <strong>Hong</strong> <strong>Kong</strong> Island wasdivided into 59 zones, 78 were used for Kowloon, and the remaining 101 coveredthe New Territories including Tsuen Wan and the outlying islands.4.2.2 <strong>The</strong> distribution <strong>of</strong> population and employment are key parameters for forecastingtraffic demand; estimates <strong>of</strong> existing and projected population and employmentwere made for each <strong>of</strong> the 238 internal traffic zones. Domestic households andschool places were also estimated for each zone; these two stems are strongly relatedto population and in general follow a similar trend in distribution.Population and Households4.2.3 Territory control totals <strong>of</strong> population used for CTS-2 are shown in Table 4.1, andreflect a declining rate <strong>of</strong> population growth.54
Table 4.1(1981 to 2001)Growth over Domestic Growth over DomesticPopulation past 5 years Households past 5 years HHYear (000) Number p.a. (000) Number p.a. Size1981 5125 ' — 1 253 — 3.941986 5487 72000 1460 41000 3.661991 5811 65000 1691 46000 3.361996 6110 60000 1906 43000 3.132001 6340 46000 2103 39000 2.95Note: Land population (mid-year); excluding marine population4.2.4 Population in the existing housing stock in the urban area is expected to decline dueto decreasing household size and improved accommodation standards in the olderpublic housing estates. <strong>The</strong> decline in household size is also shown in Table 4.1; itfalls from 3.94 in 1981 to 2.95 in 2001. As a result the increase in the number <strong>of</strong>households remains fairly constant at about 40000 a year, despite the decliningpopulation growth rate.Distribution <strong>of</strong> Population4.2.5 Over recent years there has been considerable effort spent on the examination <strong>of</strong>future land use and determination <strong>of</strong> priorities for development. In particular, theTerritorial Development Strategy (TDS) has examined the impact and priority <strong>of</strong>alternative development sites including the various harbour reclamations.4.2.6 It is projected that about 80% <strong>of</strong> the year 2001 population would be in housing areaswhich are either existing or are firmly programmed for development. However, thelocations for the remaining 20%, about 1.3 million persons, are less clearly defined.This is because decsssons still have to be taken on which areas to develop and some<strong>of</strong> these decisions depend on technical feasibility studies which in 1988 were stillon-going. For 1 996, the position is firmer and about 90% <strong>of</strong> the population can belocated with considerable certainty.4.2.7 <strong>The</strong> approach adopted by CTS-2 was to define a central land use strategy for themain series <strong>of</strong> transport tests. <strong>The</strong> next step was to investigate likely deviations fromthe central strategy in a series <strong>of</strong> sensitivity tests. <strong>The</strong> central land use and maintransport tests assumed that the airport would be retained at Kai Tak; its possiblerelocation was analysed in further sensitivity testing. <strong>The</strong> population distributionsfor 1991,1996 and 2001 are shown in Table 4.2 by area. Also shown for comparisonare the population distributions for 1 981 and 1986 to indicate recent trends. Trendsby region are shown in Figure 4.1.4.2.8 <strong>The</strong> total land population <strong>of</strong> the Territory is projected to grow by about 850 000 inthe 15 years from 1986 to reach 6.3 million by 2001. Most <strong>of</strong> the population growthis expected to occur in the new towns <strong>of</strong> the New Territories due mainly to themovement <strong>of</strong> population from the existing urban areas. <strong>The</strong> population <strong>of</strong> the NewTerritories is expected to grow by nearly one million in the 15-year period and, by2001, would contain 45% <strong>of</strong> the total Territory population.4.2.9 Population in the existing urban area is expected to decrease with a general declinein household size and the redevelopment <strong>of</strong> older housing estates to lower densities.This will be balanced by some new population growth, in particular that associatedwith new reclamations on both sides <strong>of</strong> the harbour. Overall, <strong>Hong</strong> <strong>Kong</strong> Islandis expected to gain 270000 population from 1986 to 2001, while Kowloon isexpected to lose 350 000.55
Table 4.2DISTRIBUTION OF POPULATION(thousands)AreaCentral and WesternWan ChaiEasternSouthern7557286251462230Population1986 199125921348724926320355627419962622005633372007351224542356Total <strong>Hong</strong> <strong>Kong</strong> IslandYau Ma TeiMong KokSham Shui PoKowloon CityKwun TongWong Tai Sin1 2291972444754586015721 2081692014314066664901 2961481863874096193821 3621471563313745774011 473209164337366533406Total KowloonTsuen WanTuen MunYuen LongTin Shui WaiTai PoFanling/Sheung ShuiSha TinMa On ShanJunk BayRural25476271046435911313307236366926977123963560113132131709376120417413142569842921 986658485129822491844341741372302015645468140116247183440196200217Total New Territories1 3491 916238427622852Total Territory (Land)51255487581161106340FIGURE 4.1:POPULATION TRENDSMillionsHK IslandKowloonNew Territories106110911071100610812001SB 1086
Distribution <strong>of</strong> Domestic Households4.2.10 <strong>The</strong> number <strong>of</strong> domestic households by the broad areas <strong>of</strong> <strong>Hong</strong> <strong>Kong</strong> Island,Kowloon, New Towns and Rural Areas for the years 1991, 1996 and 2001 areshown in Table 4.3 together with the household size. <strong>The</strong> household size is expectedto decrease for all areas but slightly faster than average for households on <strong>Hong</strong><strong>Kong</strong> Island. Changes in household size are illustrated in Figure 4.2.AreaTable 4.3<strong>Hong</strong> <strong>Kong</strong> IslandKowloonNew TownsRuralTotalDISTRIBUTION OF DOMESTIC HOUSEHOLDS(1986 to 2001)Number <strong>of</strong> Households (000) and Household size1986 1991 1996 2001No. Size No. Size No. Size No. Size329647401833.553.553.883.53393598614863.203.493.363.24447615773712.953.143.233.04512658862712.792.983.022.861460 3.66 1691 3.36 1906 3.13 2103 2.95FIGURE 4.2:PROJECTED CHANGES IN HOUSEHOLD SIZEPersons Per Household<strong>Hong</strong> <strong>Kong</strong> Island Kowloon New Towns Rural•11986 •11991 •11996 •J2001Distribution <strong>of</strong> School Places4.2.11 <strong>The</strong> territory-wide school enrolment was projected using a forecast <strong>of</strong> the territorialage structure with the assumption that the proportion <strong>of</strong> population <strong>of</strong> a given ageattending school remained at the 1986 level. <strong>The</strong> location <strong>of</strong> school places took intoaccount information from relevant organisations and was adjusted as appropriate toreflect local changes in population. Table 4.4 shows the projected distribution <strong>of</strong>school places by broad area. It is noted that the proportion <strong>of</strong> school places in theNew Towns is projected to increase from 32% to 39% over the period 1986 to 2001.
AreaTable 4.4<strong>Hong</strong> <strong>Kong</strong> islandKowioonNew TownsRuralTOTALDISTRIBUTION OF SCHOOL PLACES(1986 to 2001)1986No.280520401511 252Number <strong>of</strong> School Places (000)1991 1996% No. % No. %2242324100279513508561 3562138374100280512560651 41720363951002001No.283517563671 430%2036395100Employment4.2.12 <strong>The</strong> location <strong>of</strong> employment has a strong influence on travel patterns, both personaland goods vehicle travel. <strong>The</strong> CTS-2 analysis used five types <strong>of</strong> employment:El — Manufacturing and EngineeringE2— Public Utilities and TransportE3 — Retail and WholesaleE4— Import Export Banks and FinanceE5— Agriculture, Services, Construction, Government and Education.Projections <strong>of</strong> the number <strong>of</strong> jobs in each type <strong>of</strong> employment are shown in Table4.5 for each year.4.5(1986 to 2001)Employment TypeE1E2 -E3E4E5TOTAL1986No9472252283928822674%35891533100Number <strong>of</strong> Jobs (000)1991 1996No. % No.9472462374549362820349816331009092672485081 0452977%319817351002007No.8572852545571 1463099%28981837100Distribution <strong>of</strong> Employment4.2.13 In allocating employment by area, different methods were used for eachemployment type. <strong>The</strong> location <strong>of</strong> manufacturing and engineering employment (E1)was projected assuming that it will be in balance with the number <strong>of</strong> manufacturingworkers within each defined area. <strong>The</strong> E2 employment is located according to thenumber <strong>of</strong> transport interchanges and population. <strong>The</strong> E3 and E5 employmentsaccount for nearly half the total number <strong>of</strong> jobs; and these were projected assumingthat the 1986 ratios <strong>of</strong> jobs to population for each group remain unchanged. <strong>The</strong>allocation <strong>of</strong> the growth <strong>of</strong> E4 jobs took account <strong>of</strong> the location <strong>of</strong> increased growthin <strong>of</strong>fice space in major <strong>of</strong>fice centres, but 15 percent <strong>of</strong> the growth was allocatedamong the new towns. <strong>The</strong> distribution <strong>of</strong> total employment by area is shown inTable 4.6 for the three design years, together with the 1981 and 1986 figures toindicate the recent trends. Trends by region are shown in Figure 4.3.58
Table 4.6 DISTRIBUTION OF EMPLOYMENT(thousands)AreaCentral and WesternWan ChaiEasternSouthern1981305175151Employment1986 1991 1996 200126215312610232617219093355185196105400213189118Total <strong>Hong</strong> <strong>Kong</strong> Island705643781841920Yau Ma TeiMong KokSham Shui PoKowloon CityKwun TongWong Tai Sin198140209205265154195123216190309140193105164171288972039814817128697236102152175258Total KowloonTsuen WanTuen MunYuen LongTin Shui WaiTai PoFanling/Sheung ShuiShaTinMa On ShanJunk BayRural1 171 1 173 1 019 1 003 1 018299370243601155334160032615760281502021534304190671910268229354530118810270234406072Total New Territories586858 1 020 1 133 1 161Total Territory (Land)2462 2674 2820 2977 3099MillionsFIGURE 4.3:EMPLOYMENT TRENDSHK IslandKowloonNew TerritoriesSi 1973 M1981 ^1986 1199111996 Bi 2001
4.2.14 An additional 425 000 jobs in the Territory are projected between 1986 and 2001.Over the same period, the main urban area <strong>of</strong> Kowioon is projected to lose some155000 jobs as population and factories move out. <strong>The</strong> rest <strong>of</strong> the Territory isprojected to gain some 580 000 new jobs in the 15 years from 1986 to 2001; theseare expected to split about evenly between the new towns in the New Territories and<strong>Hong</strong> <strong>Kong</strong> Island. <strong>The</strong> new employment locations in the urban areas are mostly onthe north shore <strong>of</strong> <strong>Hong</strong> <strong>Kong</strong> Island, including 198 000 in Wan Chai, Central andWestern and 41 000 new jobs in Yau Ma Tei in Kowioon.4.3 Economic Growth4.3.1 <strong>The</strong> rate <strong>of</strong> economic growth has important implications for transport planning,directly influencing the growth in demand for both goods and passenger transport.<strong>The</strong> impact <strong>of</strong> economic growth on passenger transport is complex but it can belinked to growth in persona! incomes. Higher personal incomes generally result inincreased travel demands. However they also increase labour costs and consequentlyvehicle operating costs and public transport fare levels, thus tending to dampen thegrowth in demand by making travel more expensive. Higher incomes also increasethe demand for car ownership, and awareness <strong>of</strong> the cost <strong>of</strong> time wasted throughunreliable public transport or traffic congestion. <strong>The</strong> rate <strong>of</strong> economic growth alsoaffects the funds likely to be available for investment in transport facilities.4.3.2 Economic growth is measured by the change in Gross Domestic Product (GDP).This tends to be a cyclical phenomenon, as shown by the graphs in Figures 4.4 and4.5, which indicate the growth <strong>of</strong> GDP and GDP per capita, since the early 1960s.Growth is shown in real terms, eliminating the changes due to inflation, and athree-year moving average was used to smooth out annual fiuctations and show theoverall trend. Annual growth over the period averaged 8.8% per year, and per capitagrowth averaged 6.4% per year.FIGURE 4.4:ANNUALGrowth Per14%12%10%/\^3-year8%6%1962-19884%2%0%62 64 66 68 70 72 74 76 78 80 82 84 86 88Real Growth In Constant Prices60
FIGURE 4.5:ANNUAL GDP GROWTH PER CAPITAPercent growth per year10%moving awra@«8%6%4%2%0%\ \ l \ l l l82 84 88 68 70 72 74 76 78 80 82 84 88 88in4.3.3For the purpose <strong>of</strong> CTS-2, growth in GDP per employed worker is a measure ochanges in labour costs, whilst growth in GDP/household is a measure <strong>of</strong> change;in income levels. Table 4.7 shows the annual growth rates <strong>of</strong> GDP, GDP/headGDP/household and GDP/employed worker for the period 1976 to 1986, and theannual growth rates for these variables. Over the period 1981-86, the growth oGDP in real terms slowed down, attributable at least in part to the slow down in th
4.3(1986-2001)Growth Over 1988Period GDP/head GDP/household GDP/employedTotal Growth1986-1991 1-36 1.24 1.361991-1996 1.70 1-44 1.691996-2001 2.11 1.68 2.09Annual Growth Rate (% per year)1986-1991 6.4 4.4 6.41991-1996 4.6 3.1 4.61996-2001 4.4 3.1 4.4Household Income and Values <strong>of</strong> Time4.3.6 Projections <strong>of</strong> average household income and the values <strong>of</strong> time are shown in Table4.9. Car ownership and trip making are dependent on the level <strong>of</strong> household income,which is assumed to grow at the same rate as the growth in GDP per domestichousehold.Table 4.9(1986—2001)VALUE OFValues <strong>of</strong> Time (1986 dollars per-hour)AverageHousehold Behavioural EvaluativeMonthly Income(1988 dollars) car-owning n on-car owning1986 7,130 17.4 7.0 10.71991 8,820 21.5 8.7 13.71996 10,270 25.0 10.1 16.52001 11,990 29.2 11.8 20.14.3.7 <strong>The</strong> choice between modes is influenced by the behavioural value <strong>of</strong> time; this wasassumed to increase in line with incomes, with separate values used for car-owningand non-car-owning households. <strong>The</strong> value <strong>of</strong> time used for project evaluationpurposes drops the distinction between car owners, who tend to use cars, andnon-car owners, the majority <strong>of</strong> whom use public transport. This is because currentpractice is to give the same value to all travellers in the same circumstancesregardless <strong>of</strong> income.4.4 Transport Costs and FaresRoad Vehicle Operating Costs4.4.1 Three types <strong>of</strong> operating costs were required for road vehicles; perceived costsreflecting the costs on which travellers base their travel decisions, and financial andeconomic costs used in the evaluations to calculate benefits arising from additionaltransport infrastructure or policies. <strong>The</strong> costs are developed for the following classes<strong>of</strong> vehicles:— Private cars— Taxis— Goods vehicles— Special purpose bus (SPB)62
4.4.2 Cost components were analysed in three classes; material, labour, and fuel. Materialand fuel costs were assumed to remain constant in 1986 prices. Thus increases invehicle costs were assumed to be caused solely by real increases in the labour costcomponent <strong>of</strong> drivers and maintenance.4.4.3 Operating costs depend on vehicle speed; in very high congestion and low speeds,operating costs per kilometre may be four times greater than costs <strong>of</strong> a typical urbanspeed <strong>of</strong> say 25km/h. <strong>The</strong>refore costs were calculated at 14 speeds ranging from5km/h to 70km/h. Financial operating costs for 1 986 are shown in Figure 4.6.FIGURE 4.6:1986 VEHICLE OPERATING COSTSDollars Per KilometrePrivate CarTaxiGoods VehicleSpecial Purpose Bus5 10 15 20 26 30 35 40 45 50 56 80 65 704.4.4 <strong>The</strong> costs by type, vehicle class and year are shown in Table 4.10 for the averagebase year speed <strong>of</strong> 25km/h. <strong>The</strong> economic costs exclude tax elements which areTable 4.10 VEHICLE OPERATING COSTS AT 25 KM/H BY YEAREconomic1986199119962001Financial1986199119962001Perceived1986199119962001Operating Costs (7986 dollars per km)Car Taxi GV SPB1.952.012.072.143.273.273.333.400.650.650.650.651.722.142.533.001.942.372.763.232.142.613.033.554.735.856.888.125.236.567.388.635.236.367.388.632.503.083.433.433.213.674.094.593.544.044.505.0563
included in the financial costs. Perceived costs for private cars included only thecosts <strong>of</strong> fuel oil and tyres. For taxis it was determined by the fare which wasassumed to be related to the financial cost plus 10% for an element <strong>of</strong> pr<strong>of</strong>it to thetaxi operator. Perceived and financial costs are identical for goods vehicles and werebased on the costs for iightgoods vehicles which comprise the majority <strong>of</strong> the goodsvehicle fleet.Costs <strong>of</strong> Car Ownership and Use4.4.5 Costs <strong>of</strong> car ownership and use were required for estimating the probability <strong>of</strong>households owning a car. <strong>The</strong> costs refer to a typical small car (1000-1500 cc)appropriate for households on the fringe <strong>of</strong> car ownership. <strong>The</strong> costs in 1986 pricescomprised an annual ownership cost <strong>of</strong> $20,100 and an annual usage charge <strong>of</strong>$8,610. <strong>The</strong>y were made up as follows:Ownership costs:Average purchase cost, including FRT $75,000Annual costs Capital 11,600Insurance 1,900Licence 2,600Home Parking 4,000Total 20,100Usage Costs Fuel 5,820Oil 80Tyres 260Repairs 1,720Parking 730Public Transport Operating CostsTotal 8,6104.4.6 Unit costs for ferry, tram and road-based operators were established by analysis <strong>of</strong>the expenditure <strong>of</strong> the public transport operators. As with road vehicle costs, fueland material costs were assumed to remain constant in real terms, but labour costswere assumed to increase in line with the increase in GDP per worker. A consequence<strong>of</strong> these assumptions is that costs were projected to increase most rapidly on themore labour-intensive modes.4.4.7 Rail operating costs were related to service frequency for each <strong>of</strong> the existing andprojected lines, taking account <strong>of</strong> the complex nature <strong>of</strong> the rail operations, thenumber <strong>of</strong> stations, quantity <strong>of</strong> roiling stock and staff requirements. <strong>The</strong>se estimateswere provided by the two rail corporations; MTRC and KCRC.4.4.8 For confidentiality reasons, the details <strong>of</strong> public transport operating costs are notpresented here.Public Transport Fares4.4.9 <strong>The</strong> projection <strong>of</strong> public transport fares was influenced by the expected increase inunit costs <strong>of</strong> operation <strong>of</strong> each mode. However, the likely change in patronage andtherefore revenue <strong>of</strong> each mode had also been considered. Over the last decade,public transport boardings have been increasing at roughly 4% per year. <strong>The</strong> extrarevenue this generated acted as a form <strong>of</strong> increased productivity and reduced theneed for more frequent or larger fare rises which would otherwise have beenrequired to meet increased costs.64
10 It was necessary to make a projection <strong>of</strong> fare levels in order to forecast patronage foreach public transport operator. <strong>The</strong> initial assumption as to fare levels for eachoperator is shown in Table 4.11 as an index on 1986 fares. <strong>The</strong> construction <strong>of</strong> theindex reflected expected changes in operating costs and patronage, and tookaccount <strong>of</strong> the recent fare trends. One index was used for franchised buses, coveringall CMB and KMB services. Taxi fares were also projected to rise in proportion to thereal increase in taxi operating costs. Because <strong>of</strong> the high proportion <strong>of</strong> labour costs(about two-thirds <strong>of</strong> all taxi operating costs), taxi fares were projected to increasefaster in real terms than those <strong>of</strong> other public transport.4.11Mode1986Year1991 1996 2001Franchised BusPublic Light BusTaxiHK TramwaysStar FerryHYFRail (MTR, KCR, LRT)1.01.01.01.01.01.01.01.171.201.221.051.051.051.051.331.371.421.051.051.101.101.521.571.661.051.051.151.15To/I Charges11 Tolls for the road tunnels included in the CTS-2 transport network are shown inTable 4.12. <strong>The</strong>se charges are expressed in 1986 prices. Facilities serving asalternative routes for the same trip were generally assumed to charge the same tolls,apart for the cross harbour movement where the Eastern Harbour Crossing wasassumed to have a lower charge in order to generate a better balance <strong>of</strong> trafficbetween the cross harbour facilities. <strong>The</strong> tolls at the Route 5 and Junk Bay tunnelswere assumed to be the same as for the Lion Rock and Aberdeen tunnels, as thetunnels are <strong>of</strong> similar length, while the Route 3 tunnel toll is greater due to its greaterlength.Table 4.12TUNNEL TOLLS BY FACILITY(1986 dollars)TunnelCross HarbourLion RockAberdeenEastern HarbourRoute 5Junk BayTate's CairnRoute 3Route 3 (Western Harbour)Length (km)2.02.02.04.02.02.03.04.03.0Private Car Toll10.03.03.06.03.03.03.06.010.0Note: <strong>The</strong> tolls are those assumed in CTS-2 for testing purposes and do notnecessarily reflect tolls likely to be charged for the new facilities; tolls forgoods vehicles are assumed to remain at the same ratio to those <strong>of</strong> private carsas at present for similar facilities.65
4.5 International Traffic4.5.1 Projections <strong>of</strong> international traffic were required at all points where it enters theTerritory. <strong>The</strong>se were:— the Border with China (Road and Rail)— Internationa! Ferries— the Airport— the PortEach are discussed below.Cross Border Traffic4.5.2 <strong>The</strong>re is considerable uncertainty involved in projecting China border crossingsbecause many <strong>of</strong> the factors which affect transport demand on the China side arevery difficult to predict; also trend information is too recent and limited to be used.<strong>The</strong>refore low, median and high projections were derived. <strong>The</strong> median value wasused in preparing the main travel forecasts, and sensitivity tests examined the impact<strong>of</strong> the high and low values on project evaluations.4.5.3 Goods vehicle traffic is the dominant part <strong>of</strong> the cross border vehicle traffic. Roadtonnage increased seven-fold between 1981 and 1986 and annual crossings bygoods vehicles increased by 37% per year and doubled between 1985 and 1987.Growth in cross-border goods vehicle traffic is shown in Figure 4.7.4.7:12Par Day1081 82 83 84 86 86 87 884.5.4 One <strong>of</strong> the most recent studies available to CTS-2 concerning trade with China wasthe Hung Horn Bay Development Study. This projected freight traffic for the CTS-2design period. Estimates <strong>of</strong> goods vehicles crossing the border were derived on theassumption that their share <strong>of</strong> tonnage would be the same as today's, with thebalance carried by rail and sea. This gave the low projection <strong>of</strong> goods vehicle traffic.4.5.5 A high projection <strong>of</strong> goods vehicle crossings was forecast assuming that the highgrowth would continue. This projection assumed that the number <strong>of</strong> crossingswould double between 1987 and 1991, and continue to double every five yearsthereafter. A median projection was then developed, simply as the average <strong>of</strong> thehigh and low projections. Projections are illustrated in Figure 4,8.66
FIGURE 4.8: CROSS-BORDER GOODS VEHICLES(PROJECTED)Vehicles Per Day (Thousands)8070605040High Projection302010Low Projection1981 1986 1991 1996 2001.5.6 <strong>The</strong> number <strong>of</strong> border crossings by bus and car are currently small. <strong>The</strong> Hung HornBay Development Study made projections <strong>of</strong> passenger trips by all modes, includingcar and bus. <strong>The</strong>se were used in conjunction with the results <strong>of</strong> the Traffic andTransport Survey Division analyses to project the number <strong>of</strong> cars and buses for eachyear. High and low projections were prepared at 50% above and 50% below themedian projection..5.7 <strong>The</strong>re are three road border crossing points: Lok Ma Chau, Man Karri To, and ShaTau Kok. A distribution <strong>of</strong> traffic between these three locations was made taking intoaccount their assumed capacities, the projected origins and destinations <strong>of</strong> trips, androad access. <strong>The</strong> numbers <strong>of</strong> vehicles by type and location for the median projectionis shown in Table 4.13.Table 4.13 PROJECTED DAILY BORDER CROSSINGS BY LOCATION(median projection, 2-way traffic)199119962001Lok Ma ChauGoods VehiclesOther VehiclesTotal7200200740018300400187003350060034100Man Kam ToGoods VehiclesOther VehiclesTotal57006006300650070072001200090012900Sha Tau KokGoods VehiclesOther VehiclesTotal1 5001001 6001 3001001 4002400200260067
Cross Border Rail Passenger Traffic4.5.8 <strong>The</strong> projected number <strong>of</strong> passengers using the Kowloon-Canton Railway to crossthe border was based on the Hung Horn Bay Development Study report. <strong>The</strong>average weekday passenger rail crossings (2-way) were projected as follow:1986 - 520001 991 84 0001996 1080002001 132000International Ferry Passenger Traffic4.5.9 <strong>The</strong> CTS-2 analysis included an estimate <strong>of</strong> the passengers travelling to and fromChina and Macau using the two main ferry terminals, the recently opened ChinaFerry Terminal in Tsim Sha Tsui and the Macau Ferry Terminal in Sheung Wan.Average weekday passenger ferry movements were projected in Table 4.14.4.14Macau Traffic China TrafficSheung Wan Tsim Sha Tsui Sheung Wan Tsim Sha Tsui1986 22 300 5 6001991 21400 7100 2100 65001996 27 300 9100 < 2 600 7 8002001 34800 11 600 3000 9000AirportTraffic4.5.10 <strong>The</strong> standard modelling techniques used by CTS-2 adequately represent all the tripmaking <strong>of</strong> people who work at the airport but an additional estimate has beenincluded to represent all the travel associated with air passengers and the goodsvehicles associated with the various airport activities. <strong>The</strong> traffic figures were takenfrom the Kai Tak Consultancy Study and are shown in Table 4.15.Port and Rail Goods Vehicle Trips4.5.11 A separate estimate was included in the CTS-2 analysis for the international goodsvehicle traffic associated with the rail and port facilities. <strong>The</strong> estimates <strong>of</strong> goodsvehicles associated with rail freight were taken from the Hung Horn Bay DevelopmenlStudy; the majority <strong>of</strong> this traffic is located at Hung Horn at the main KCR terminus<strong>The</strong> daily traffic volume is shown in Table 4.1 6,Table 4.15 PORJECTED DAILY AIRPORT(2-way)TRAFFICVehicle Type 1986 1991 1996 2001'Car 15600 18000 25100 3210CTaxi 28000 33800 45300 57 30COther Bus 4500 5500 7300 9 20CGoods Vehicle 6200 8100 12200 1740CTable 4.16 GROWTH OF RAIL AND PORT ASSOCIATED DAILYGOODS VEHICLE TRIPS (2-way)GeneratorRail1986 1991 1996 200)1 900 2900 4000 5 20CContainer: Kw-ai Chung 9500 13200 25500 37 OOCOther areas 1 600 1 600 1 600 1 60(Public Cargo Working Areas 9100 14 900 21 800 31 40C68
4.5.12 <strong>The</strong> Port Development Strategy Study (PDSS) projected demand for annualcontainer traffic and traffic at public cargo working areas; these figures, as updatedin 1987, were used by CTS-2, and are also shown in Table 4.16. <strong>The</strong> container trafficis predominantly at Kwai Chung. <strong>The</strong>re are nine public cargo working areas locatedround the harbour on <strong>Hong</strong> <strong>Kong</strong> Island and Kowloon, and each attracts a largenumber <strong>of</strong> goods vehicle trips.4.6 Funding <strong>of</strong> Transport investments4.6.1 <strong>The</strong> planning <strong>of</strong> a transport infrastructure programme requires estimates to be made<strong>of</strong> available investment funds. This section reviews past expenditure and establisheslimits for future expenditure.Past Financing <strong>of</strong> Transport Investments4.6.2 Past investment in transport in <strong>Hong</strong> <strong>Kong</strong> has been financed in three differentways:(1) By public expenditure controlled through the Capital Works Reserve Fund(CWRF); most highways as well as the KCR modernisation programme havebeen funded in this way.(2) By private investors; this covers most transport equipment purchases such asrolling stock, as well as three major tunnel infrastructure projects; the existingCross-Harbour tunnel in 1970-72, the Eastern Harbour Crossing started in1986 and the recently started Tate's Cairn tunnel.(3) By borrowing on world capital markets; this has been the primary means <strong>of</strong>financing the Mass Transit Railway (MTR).4.6.3 To establish the financial position <strong>of</strong> the Mass Transit Railway Corporation (MTRC)and to enable it to borrow on world markets, Government has contributed equity toMTRC. Strictly speaking, these contributions do not represent capital spending,since Government in theory can realise these funds in the future. In practice,however, the long term nature <strong>of</strong> the Government equity position is such that thesefunds must be regarded as being just as fully committed as investments in highways.Review <strong>of</strong> Past Expenditure4.6.4 Past investments in transport infrastructure are summarised in Table 4.17 for theperiod 1 971 to 1 988, with an estimate <strong>of</strong> expenditure for 1 989.4.6.5 Public expenditure is that made through the Capital Works Reserve Fund (CWRF).Highways expenditure is controlled by either Highways Department or TerritoryDevelopment Department. After a pause in the early 1980s, the programme built upagain and is expected to reach an all-time high in 1 989. Public railway expenditurecovers the Kowloon-Canton Railway (KCR) modernisation programme, whichstarted in the late 1970s and reached a peak in the early 1980s, and more recentlythe construction <strong>of</strong> the track bed for the Northwest LRT project. Other publicexpenditure includes ferry piers, bus termini, footbridges, car parks and alsotransport studies (a very small proportion).4.6.6 Private highway expenditure has included completion <strong>of</strong> the existing Cross Harbourtunnel in the early 1970s and the Eastern Harbour Crossing and Tate's Cairn tunnelin the late 1980s; both <strong>of</strong> which are still under construction. Private railwayexpenditure was dominated by the massive investments in the Mass Transit Railway(MTR) (including a share <strong>of</strong> the Eastern Harbour Crossing), but also includesinvestments in the Northwest LRT system. It can be noted that the outstanding debton the construction costs <strong>of</strong> the MTR was about $17 billion at the end <strong>of</strong> 1988,compared with total costs <strong>of</strong> $21 billion.69
Table 4.17IN(1971-1989)HighwayPrices Current for the Year Indicated ($ Billion)PublicPrivateRailwayOtherHighwayRailwayExpenditure Based on 1988 Prices ($ Billion)GovtPublicPrivateRailEquity Highway Railway Other Highway RailwayGovtRailEquity19711972197319741975197619771978197919801981198219831984198519861987198819890.070.140.150.270.260.210.300.420.600.720.951.511.501.270.950.921.382.182.740.000.020.030.060.030.020.030.070.160.450.800.740.340.210.120.270.160.150.160.020.020.030.040.020.030.040.080.100.080.180.300.310.140.150.220.200.120.070.100.100.000.000.000.000.000.000.000.000.000.000.000.000.000.410.821.131.020.000.000.000.000.220.871.102.212.751.371.442.933.073.021.360.831.200.880.730.000.000.000.000.100.700.330.010.000.033.530.380.010.121.740.050.051.000.050.360.660.630.940.920.680.921.131.241.291.542.362.401.941.451.251.592.182.490.020.090.120.190.110.060.090.190.320.821.291.150.550.330.190.360.180.150.140.080.110.140.140.080.090.110.200.210.150.290.470.500.210.230.300.230.120.070.500.470.000.000.000.000.000.000.000.000.000.000.000.000.000.560.941.130.930.000.000.000.000.772.903.405.905.672.462.324.604.934.602.071.131.380.880.660.000.000.000.000.362.331.030.020.010.065.690.590.020.182.650.070.061.000.0571-8916.73 3.81 2.18 3.58 23.98 8.11 26.18 6.36 3.77 4.52 43.68 14.11Sources'. Government consolidated accountsCapital Works Reserve FundAnnual reports <strong>of</strong> KCRC and MTRC
4.6.7 Government contributions to MTRC equity are also shown in the table to completethe investment picture. Just over $8 billion had been contributed by the end <strong>of</strong> 1988,valued at $14 billion in 1988 prices. This has covered over one third <strong>of</strong> the total cost<strong>of</strong> constructing the MTR system.4.6.8 Expenditure on highways and railways is shown in Figures 4.9 and 4.10 in bothprices current for the various years and 1988 prices respectively. To demonstrate theFIGURE 4.9:INVESTMENT IN ROAD AND RAIL CURRENT PRICESDollars (Billions) Current For Years ShownPRIV INV (Road)QOV INV (Road)PRIV INV (Rail)QOV Rail EquityQOV INV (Rail)71 72 73 74 75 76 77 78 79 80 81 82 83 84 85 86 87 88 89Rail Equity Payments Subtracted FromPrivate Rail And Adjusted Slightly ToFit Actual Investment ProgrammeFIGURE 4.10:INVESTMENT IN ROAD AND RAIL CONSTANT PRICESDollars (Billions) In 1988 Price71 72 73 74 75 76 77 78 79 80 81 82 83 84 85 86 87 88 89QOV INV (Rail)QOV INV (Road)QOV Rail EquityPRIV INV (Road)EE3 PRIV INV (Rail)Rail Equity Payments Subtracted FromPrivate Rail And Adjusted Slightly ToFit Actual Investment Programme
contribution <strong>of</strong> Government equity to the MTRC, equity payments are shown in thegraph with private rail investments reduced by the same amount. Some large equitycontributions were spread into adjacent years to ensure that public and private railinvestments and equity contributions add up to the actual yearly constructioninvestments.4.6.9 <strong>The</strong> graphs show clearly the bulge in expenditure in the early 1980s due to manymajor highway projects, road infrastructure construction in the new towns, themodernisation programme <strong>of</strong> the Kowioon-Canton Railway (KCR) and construction<strong>of</strong> the Mass Transit Railway (MTR).Current Committments4.6.10 <strong>The</strong> total value <strong>of</strong> all projects, both public and private, currently under constructionor otherwise firmly committed is estimated at $23 billion (current prices), <strong>of</strong> whichan estimated $11-$12 billion (1 988 prices) remained to be spent from the beginning<strong>of</strong> 1989.Impact <strong>of</strong> Inflation4.6.11 <strong>The</strong> graph in Figure 4.11 shows the cumulative inflation since 1961 for both thegeneral economy (based on the GDP deflator) and for the highway constructionsector (based on the cost changes monitored by Highways Department). Sincethe late 1970s, highway industry inflation has run ahead <strong>of</strong> general inflation, witha particularly strong growth since 1986. In the two years 1986-1988, highwayconstruction prices rose 32% compared with an 18% increase in prices generally.4.11: CUMULATIVE 19616.06.0 -J —-^—To 1972 • 104.03.02.01.00.0 J L J L J L. J L J L J L J L J L61 64 67 70 73 76 82 86 884.6.12 Recent price rises for railway construction are estimated to be even higher, althoughwith little current construction the estimates are not so firm. Estimates supplied byMTRC indicate the following price rises between 1986 and 1988:Electrical and Mechanical +73%Rolling Stock +23%Civil Engineering +44%72
4.6.13 Based on cost breakdowns supplied by the MTRC, the average price increase for railprojects was 40% to 50% in this two-year period.4.6.14 While the recent surge in construction costs relative to general inflation is worrying,it is by no means certain that this trend would continue over the Study forecastperiod. However, if the relatively higher rate <strong>of</strong> inflation in the construction industry. continues unabated, it could have serious implications for the completion <strong>of</strong> theprogramme <strong>of</strong> transport projects recommended by this Study.Future Investment Funds4.6.15 While total public expenditure is likely to continue to rise in line with the growth inthe economy, the share <strong>of</strong> public expenditure for transport infrastructure must haveregard to competing claims from other sectors <strong>of</strong> public expenditure, such asenvironmental protection, education and medical services. This has made it difficultto forecast with any certainty what the transport share <strong>of</strong> public expenditure wouldbe within the duration <strong>of</strong> the planning period covered by this Study. Recognisingthis uncertainty and working on the basis <strong>of</strong> certain assumptions, Governmentexpenditure guidelines have put the share <strong>of</strong> public sector capital expenditure onnon-rail transport projects at $2.5 billion (in 1988 prices) per annum over theduration <strong>of</strong> the planning period. Of this, $2 billion was assumed to be available forfunding major highway projects. With the objective <strong>of</strong> avoiding overheating <strong>of</strong> theconstruction industry, it is Government's view that expenditure by the private sectoron highways should, in future, substitute for public funds, rather than supplementthem. In other words, privatisation <strong>of</strong> future highway projects should not expand thetotal investment programme for transport.4.6.16 <strong>The</strong> construction <strong>of</strong> the MTR and much <strong>of</strong> the LRT system was financed by theprivate sector on the basis <strong>of</strong> borrowings on world capital markets, backed by equityinjections from Government in the case <strong>of</strong> the MTR. This is likely to continue to bethe means <strong>of</strong> financing rail projects, with the long term prospect that passengerrevenue surpluses can be used to finance new rail projects after the current debtshave been paid.73
5. FORECASTS OF THE TRANSPORT SCENE5.15.1.15.25.2.1introductionThis chapter presents projections <strong>of</strong> the future demand for transport assuming thecentral estimates <strong>of</strong> population, employment and economic growth described inChapter 4, completion <strong>of</strong> only those transport projects in construction or firmlycommitted (see Chapters 6 and 7), and the continuation <strong>of</strong> current transportpolicies. Comparisons are made with the base year for transport modelling <strong>of</strong> 1 986.<strong>The</strong> projections indicate the scale <strong>of</strong> transport problems facing the Territory in futureyears, taking into account these assumptions, and provide the basis for justifying thenew projects and policies discussed in subsequent chapters <strong>of</strong> this report.Growth in the Vehicle FleetProjections <strong>of</strong> the vehicle fleet to 2001 are shown in Table 5.1 and illustrated for cars(including motorcycies) and goods vehicles in Figure 5.1 against a background <strong>of</strong>historical development. Figure 5.1 also shows the likely impact <strong>of</strong> higher economicgrowth rates on the size <strong>of</strong> the vehicle fleet.Vehicle Type 1Table 5.1Car and MotorcycleGoods VehicleTaxiSpecial Purpose BusMinibusFranchised BusPROJECTIONS OF THE VEHICLE FLEET(thousands)1986 214484169441991200117171144Total Vehicles261 353 476 6101 For CTS-2 modelling purposes, some licensed cars reclassified as either goods vehicle or special purpose bus.2 Observed, subject to note 1 .19962801541913462007363202211347FIGURE 5.1:PROJECTIONS OF CARS AND GOODS VEHICLESThousands600Private CarCar (High Growth)Goods VehicleGoods (High Growth)1971 1976 1981 1986 1991 1996 2001Committed Projects, No Change In PolicyCar includes Motorcycles74
5.2.2 <strong>The</strong> private car and motorcycle fleet is projected to increase to 2.5 times from 1986to 2001. This assumes that vehicle taxation is not changed sn real terms from thecurrent rates, although adjustments to keep pace with inflation are assumed. At1986, the car and motorcycle fleet was considerably lower than the peak reached in1981 just before the 1 982 tax measures. <strong>The</strong> projected number <strong>of</strong> cars is expected toexceed the 1981 maximum by 1991, but will not exceed the previous 1981cars-per-household level <strong>of</strong> 0.1 5 until 1996. By 2001, 0.1 7 cars and motorcycles perhousehold are projected compared with 0.10 in 1986.5.2.3 <strong>The</strong> growth rate is very sensitive to the assumptions on economic growth; with aGDP growth <strong>of</strong> 9% per year instead <strong>of</strong> the assumed 5%-6%, the 2001 fleet could behigher by 200 000. This emphasises the potential strength <strong>of</strong> car ownership growthas affluence increases.5.2.4 <strong>The</strong> goods vehicle fleet is expected to continue to grow at the same rate as thegrowth <strong>of</strong> the economy. This indicates that the goods vehicle fleet could be more thandouble between 1986 and 2001, or more than treble with high economic growth.5.2.5 <strong>The</strong> growth in the taxi fleet is restricted by the current quotas <strong>of</strong> not more than 300new taxis per year which are assumed to continue. Similarly, the minibus fleet is heldconstant as has been the policy for many years now. Both the franchised bus fleetand special purpose bus (SPB) fleet (school buses, works buses, etc.) are projectedto grow with the growth in demand for services.5.3 Growth in Total Transport Demand5.3.1 <strong>The</strong> projected growth in trip making is summarised in Table 5.2, relating person tripmaking to car ownership and purpose. Total person trips by purpose are shown inFigure 5.2.Table 5.2Number <strong>of</strong> HouseholdsNon-car-owningWith one carWith two or more cars(thousands)1986 1991 1996 20011 333115121 505175111 648242161 76831620Total householdsDaily trips by car-owning householdsWork 390School 144Other home-based 576Employers'business 172Non-home-based 2671 460 1 691 1 906 21045121867562483576542311 0633405237692711 393434634Sub-total 1 5492059 281' 3501Daily trips by non-car-owning householdsWork 2 560School 1 083Other home-based 2 275Employers' business 457Other non-home-based 73928301 077254859392728801 04027046941 032289599329886941 125Sub-total7114797583508695Total Territory Person TripsTerritory Goods Vehicle Trips86634551003462811 161819121961 06075
FIGURE 5.2:PROJECTED DAILY TRIP MAKING BY PURPOSEHome Based WorkHome Based SchoolOther Home BasedEmployer's BusinessOther Non-Home BasedAll HouseholdsCommitted Projects, No Change In Policy2 3Millions Of Journeys5.3.2 <strong>The</strong> proportion <strong>of</strong> car-owning households is projected to rise from just 9% in 1986 to16% <strong>of</strong> all households by 2001. Residents <strong>of</strong> car owning households represent themore affluent segment <strong>of</strong> the population and make more trips per day than non-carowners. Hence the proportion <strong>of</strong> trips from car-owning households representedabout 18% <strong>of</strong> the Territory total in 1986, and is projected to rise to 29% by 2001.5.3.3 About 70% <strong>of</strong> all trips from car-owning households were either to or from the homein 1986; this proportion is projected to remain almost constant to 2001. Amonghome-based trips, work and school purposes will continue to be important but mostgrowth is projected in other home-based trips such as those for shopping or socialpurposes. Most non-home-based trips are for personal purposes but business travelis projected to be increasingly important.5.3.4 Households without cars showed a much higher proportion <strong>of</strong> home-based trips in1986 at 82%, but this proportion is expected to decline to 71% by 2001.5.3.5 <strong>The</strong> growth in goods vehicle trips also shown in Table 5.2 is in line with the growthin the goods vehicle fleet.5.4 Transport Demand by Area5.4.1 <strong>The</strong> changes in trip making by area are shown in Table 5.3 and illustrated for persontravel in Figures 5.3 and 5.4.5.4.2 <strong>The</strong> two ends <strong>of</strong> each trip are referred to as the trip generation and the trip attraction.For goods vehicle and personal non-home-based trips, this is the same thing asorigin and destination, or start and finish. For the analysis <strong>of</strong> home-based trips,however, the home end is always counted as the generation and the other end as theattraction. Hence a comparison <strong>of</strong> generations and attractions indicates whether anarea is predominantly an employment centre, a residential area, or mixed.
5.3 BY(thousands)AreaCentral and WesternWan ChaiEasternSouthern<strong>Hong</strong> <strong>Kong</strong> IslandYau Ma TeiMong KokSham Shui PoKowloon CityKwun longWong Tai SinKowloonTsuen WanTuen MunYuen LongTin Shui WaiTai PoFanling/Sheung ShuiSha TinMa On ShanJunk BayRural NTNew TerritoriesTotal Territory (Internal)Cross-Border198654746871138121074653656977491 049699402492533310931561175061153672532866328199167252588144225205193736708271 05558040241 07553217772421787009412036534901003447Generations199675256993759428525903466098291 08663440941 039717201113359263774244204301421511 16162200197365195264832247763806578711 02866743791 06873922316838027683329331230145931219676Person Trips198682668443427322171 02349567679089140142768073051363144109419414229217086632819911 08079256332427591 1325026418509193404384890418215 7243173503 569828828911003447Attractions19961 19386462440830891 2394906278901 043358464790552724578312239579133148259342511 1616220011 3901 00264748235211 4985316819609463774993935531256113331259625158211263368212196761986191522 126830234736593022572136114321 13281624556Goods VehicleGenerations I Attractions 11991 1996Note: Every trip is said to have a generation and an attraction. This is the same as trip origin and trip destination, except for person trips starting or finishing at home which account for the greatmajority <strong>of</strong> person trips. For these home-based trips, the home end is always counted as the generation, and the other end (school, work place, shop, etc.) as the attraction A comparison<strong>of</strong> the generations and attractions indicates the nature <strong>of</strong> an area, whether predominantly an employment centre, a residential area, or mixed.1 For goods vehicles, generations and attractions are identical by area.28203920107352550437531259922611127844613342626289372548 2813844295852893831011445 14104212601821353718191520015434583818462377466109 473951415618185316762535434811 06027
FIGURE 5.3: 1986 GENERATIONS AND ATTRACTIONS BY AREACentral and WesternWan ChaiEasternSouthernYau Ma TelMong KokSham Shui PoKowloon CityKwun TongWong Tai SinTsuen WanTuen MunYuen LongTin Shui WaiTaiPoFanling/Sheung ShuiSha TinMa On ShanJunk BayRural NT0 200 400 600 800 10001200140016001800Thousands Per DayCommitted Projects, No Change In PolicyFIGURE 5.4: 2001 GENERATIONS AND ATTRACTIONS BY AREACentral and WesternWan ChaiEasternSouthernYau Ma TeiMong KokSham Shui PoKowloon CityKwun TongWong Tai SinTsuen WanTuen MunYuen LongTin Shui WaiTaiPoFanling/Sheung ShuiSha TinMa On ShanJunk BayRural NT0 200 400 600 800 10001200140016001800Thousands Per DayCommitted Projects, No Change In Policy5.4.3 <strong>The</strong> north shore <strong>of</strong> <strong>Hong</strong> <strong>Kong</strong> Island represented by Central and Western and WanChai, and the tip <strong>of</strong> the Kowloon peninsula represented by Yau Ma Tei, arepredominantly employment centres with attractions heavily outnumbering generations.<strong>The</strong>se three areas account for nearly one third <strong>of</strong> the total attractions in theTerritory by 2001, a rather higher proportion than in 1986. <strong>The</strong> rest <strong>of</strong> Kowloon ismixed, with only one predominantly residential area in Wong Tai Sin. <strong>The</strong> New
Territories and both Southern and Eastern on <strong>Hong</strong> <strong>Kong</strong> Island are predominantlyresidential, with a large surplus <strong>of</strong> generations over attractions. This imbalance isprojected to increase for the New Territories, indicating an increasing dormitorycharacter for the new towns, and less employment self-sufficiency.5.4.4 Overall growth rates for the period 1986 to 2001 in generations and attractions byregion are as follows:Person TripsGoodsGenerations Attractions Vehicle<strong>Hong</strong> <strong>Kong</strong> Island 53% 59% 170%YauMaTei 67% 46% 107%Other Kowloon 1% 7% 71%New Territories 81% 70% 197%Total Territory 41 % 41 % 133%5.4.5 <strong>The</strong>se changes are reflected in Figure 5.5, which shows the projected changes inperson travel patterns between 1986 and 2001, and Figure 5.6 which shows thechanges for goods vehicles. <strong>The</strong> strongest growth occurs for trips to, from, or withinthe New Territories. Personal trip is projected to decline within Kowioon consistentwith the projected drop in population. Within the urban area, the strongest growth isprojected for cross-harbour travel; this can be attributed to strong growth inemployment projected for the north shore <strong>of</strong> <strong>Hong</strong> <strong>Kong</strong> Island combined withpopulation growth in the New Territories, and it can also be linked to the opening <strong>of</strong>the Eastern Harbour road and rail crossings in 1 989.5.5 Transport Demand by Mode5.5.1 Table 5.4 summarises the projections <strong>of</strong> trip making by mode <strong>of</strong> travel. <strong>The</strong> trends bymain mode are illustrated in Figure 5.7.5.5.2 Public transport trip making is projected to increase by 37% between 1986 and2001. <strong>The</strong> increase is attributable partly to the 16% increase in population and partlyto the increase in personal incomes associated with the growing economy.5.5.3 <strong>The</strong> strongest jgrowth is projected for rail travel. MTR travel is expected to beboosted"" with the opening <strong>of</strong> the Eastern Harbour Crossing in 1989. However, thedecline in population and employment densities in the main part <strong>of</strong> Kowloon willslow growth on the MTR to some extent. Growth on the KCR main line is expectedto be strong with the continuing growth <strong>of</strong> the North-east New Territories. Similarly,the LRT system is projected to grow rapidly with the large population increasesplanned in the Npitivw-es^WewTerritories, and with the planned expansion <strong>of</strong> theLRT system in the Region. In total, rail (including tram) is expected to increase theshare <strong>of</strong> total public transport from 23% in 1986 to 33% in 2001.5.5.4 Franchised buses were the main public transport carrier in 1986 and, despite thegrowth <strong>of</strong> rail, are still expected to be the most heavily used mode by 2001. <strong>The</strong> totalshare <strong>of</strong> public transport taken by franchssed buses is projected to decline from 42%in 1986 to 38% by 2001.5.5.5 <strong>The</strong> Star Ferry's patronage is expected to grow throughout the period. <strong>Hong</strong>kong &Yaumati Ferry trips are expected to decline following the opening <strong>of</strong> the EasternHarbour Crossing in 1989 but growth is expected to resume thereafter. <strong>The</strong> totalshare <strong>of</strong> public transport taken by ferry services is projected to return to the 1986value <strong>of</strong> 3% by 2001.5.5.6 Patronage <strong>of</strong> the two non-scheduled road modes <strong>of</strong> taxi and special purpose bus(school buses, residential coaches, etc..) is projected to grow more slowly than forother public transport, due to quotas on taxis and low rate <strong>of</strong> growth in school travel.Hence their share <strong>of</strong> total public transport is projected to decline from 16% in 1986to 13% by 2001.79
FIGURE 5.5: PERSON TRAVEL DEMAND(COMMITTED PROJECTS, NO CHANGE IN POLICY)in QQ Z-J ujHI CDO "1co j2EC oUJ UJ°-3£LJI- UJh-O8 *" §c 52O ^S I
oLEGEND(122) in 1986393 in 2001(Thousands <strong>of</strong> Vehicle Trips Per Day)Kowloon-New Territories BoundaryFigure 5.6GOODS VEHICLE TRAVEL DEMAND(COMMITTED PROJECTS, NO CHANGE IN POLICY)
Table 5.4PROJECTIONS OF DAILY TRIP MAKINGBY MODE OF TRAVEL(thousands)Mode1986*1 1991 1996 2001Mass Transit RailwayKowloon-Cantort RailwayNorth-west LRJ2<strong>Hong</strong> <strong>Kong</strong> Tramways1 530358032420985722343452242715582374247781758E436Total Rail2212 3249 3913 431EKowloon Motor Bus 3China Motor Bus 3Cross Harbour 4303461233632356714473461726470366379650CTotal Bus398243534657495SMinibus 51 5161 6501 6701 70CHK Yaumati FerryStar Ferry185116159139191162222174Total Ferry301298353396Total scheduled public transportTaxiSpecial Purpose Bus80111 03351795501 076536105931 11955411 3701 162573Total non-scheduled PT1 5501 6121 6731 735Total Public Transport956111 1621226613105Private Car Person Trips1 0861 51820722582Note: Public transport trip-making is in terms <strong>of</strong> boardings; one trip may involve several boardings (but notcounting changes between trains on the MTR and between buses and/or LRV's on the LRT system).1Public transport boardings from Transport Department for October/November during school term (but see note6 below)2 Including bus feeder services3 Excluding cross-harbour shown separately4 Operated by KMB and CMB5 Red PLBs and Green minibuses6 Observed taxi flows derived from the CTS-2 taxi survey adjusted to traffic counts. <strong>The</strong>y imply a taxi passengeroccupancy about 15 percent lower than Transport Department estimate5.5.75.5.8Taken as a group, road-based modes <strong>of</strong> public transport dominate, as shown inFigure 5.7. Even with the growth <strong>of</strong> rail services, road-based public transport isexpected to carry 64% <strong>of</strong> all public transport services by 2001, compared with 74%in 1986.With the increase in the private car fleet, private car trip making more than doublesand accounts for 16% <strong>of</strong> total travel demand by 2001.5.5.9 ] Projected growth in road usage is shown in Figure 5.8 by vehicle type, measured interms <strong>of</strong> daily pcu (equivalent passenger car unit) kilometre. This shows the stronggrowth projected for private car and goods vehicle travel with no changes indemand management policies. On this basis, the share <strong>of</strong> road space taken by publictransport services (bus, minibus, special purpose bus and taxi) would shrink from38% to 22% between 1986 and 2001. *82
FIGURE 5.7:PROJECTIONS OF DAILY PERSON TRAVELMillions10Road Based PT (Bus,Minibus. Taxi, 8PB)Fsrry1986 1991Committed Projects, No Change In Policy1996 2001FIGURE 5.8:DEMAND FOR ROAD SPACETaxi 382619%1986Goods Vehicle 876642% Taxi 621912%8PB 12483%Bus 22616%PLB 11112%Car 11927%Goods Vehicle 2239761%20012001 Assumes Committed ProjectsAnd No Changes In Transport PoliciesMeasured In thoussnds Of PCU-KM Per DayPCU • Passenger Car Unit5.6 Transport Demand by Corridor and Screenline5.6.1 <strong>The</strong> growth in passenger movements by scheduled public transport and the growthin total road vehicle movements for selected corridors <strong>of</strong> movement are shown inTable 5.5 and 5.6 respectively. <strong>The</strong> corridor locations, comprising the main controllocations for the Annual Traffic Census, are shown in Figure 5.9.
Table 5.5 SCHEDULED PUBLIC BY(thousands passengers per day)00Corridor<strong>Hong</strong> <strong>Kong</strong> IslandF-F Centra!G-G Causeway Bayl-l Shaii KeiWanHK External:Pok Fu LamHappy ValleyChai WanTotal HK ExternalCross-HarbourKowloonA-A KCR LineC-C: Nathan Rd CorridorWaterloo Rd Cor.To Kwa WanTotal C-CK-K East KowloonKowloon External:Kwai ChungLion RockJunk BayTotal Kowloon Ext.New TerritoriesR-R:Sham TsengSha TinTotal R-RS-S Northwest NTT-T NorthernTuen Mun-Yuen Long490 260318 24659 1050 000 750 00 5641640 94 00 1642194164504 868 0649 264110 109 0 0 409759 782 0309 699 0369 484 0249 336 0 0 43 00 198132 72132 2700 25269 98 0 1106175191620 21 02902431300 906 00 7622910 00 28892341 372 471 874853 519 454585 416 39743 0 197913 775 228219 205 100409 0 4241 5411 0089803997526880 1980 2040 4020 252 00 16711002802800179122323 9141440913210366856216128 0892340 1 3451 0030 3054240 1 7320 1 0860 9730 81319700003233706934093112252982521340 966 00 8142940 140 00 25032140250527 883811 207246 106 0 4371 057 750442 719530 453515 472 0 2700368368024721634410500 0000000449 044216182 0769 321610 258168 1290 17100 258321 4101 0183524371 8071 162983987270344472816442408298589 911916 221282 110 0 4491 198 780460 705575 475594 492 0 362042342302872030 1 090 00 8682970 17100 25826 261311012324991681150 1 5000 1 13700 3924490 1 9780 1 1640 050 00 1 0863620000131524655499455318Note: Excludes non-scheduled public transport modes <strong>of</strong> taxi and Special Purpose Bus.Rail includes MTR, KCR, LRT, and TramBus includes Bus and Minibus
Table 5.6BY(thousand vehicles per day)00enCorridor<strong>Hong</strong> <strong>Kong</strong> IslandF-F Centra!G-G Causeway BayI-i Shau Kei WanHK External:Pok Fu LamHappy ValleyChai WanTotal HK ExternalCross-HarbourKowloonA-A KCR LineC-C:Nathan Rd CorridorWaterloo Rd Cor.To Kwa WanTotal C-CK-K East KowloonKowloon External:Kwai ChungLion RockJunk BayTotal Kowloon Ext.New TerritoriesR-R:Sham TsengSha TinTotal R-RS-S Northwest NTT-T NorthernTuen Mun-Yuen Long1986ivate Public Goods65501013203366318243 66 5116078443748516132920141223 52 95 3820 30 64 2917 23 52 22Total Private94 24 183 8975 25 150 6718 10 38 1922 4 39 17223 111 537 26447312581638141991325814797185100 37 180 6589 46 201 6583 28 162 5127286111735432371819037 77 158 64243 53 114 6011 18 176414112514143 357729073 5913114128 27551991Public Goods103 822124 284564024398798125884372897417153229262273 140 5148 103 5229 73 37Total Private29 221 12226 175 9618 58 256 47 3516 70 402 10 524531201271905488013725945 208 8331 175 8830 162 651069354526723613672 173 8551 139 9027 53 271505752109365102 941962023641771996Public Goods114 3992 3923 2235 10324 24271 3642 68244 17689 5776 4180 42245 14095 13639 11434 8812 4085 24216 7218 8134 15328 10832 9926 47 ",Total \\2752277080961118724767922920518762136723821279529124140264187183110Private154120303653796183317119118803171661041114125648 5210067\ 62•' 452001Public Goods Total31 144 24231 131 22424 63 132126 52 33297 50 26724 28 8239 12 87375 29 1194 1681482554580213222311785103 81 30384 55 25784 52 2162719518818177644241 122 26737 103 25114 60 1159219 193828593108201633160179339(1) Public includes Taxi, Special Bus, Minibus and, where appropriate, tram and LRT.
• FANLING/SHEUNG SHUIRMA ON SHAN<strong>Hong</strong> <strong>Kong</strong>External<strong>Hong</strong> <strong>Kong</strong>aFigure 5.9TRANSPORT CORRIDORS
5.6.2 <strong>The</strong> growth in passenger movements by scheduled public transport by corridorreflects the patterns in trip making discussed above. <strong>The</strong> strongest growth occurs inthe New Territories, and in particular the northern New Territories, <strong>The</strong> opening <strong>of</strong>the Eastern Harbour Crossing shifts passengers away from ferries to rail andcross-harbour bus, so that ferry passengers decline from 26% to 17% <strong>of</strong> the totalcross-harbour movements. <strong>The</strong> impact <strong>of</strong> the Tate's Cairn tunnel, due to open in1991, is shown by the growth <strong>of</strong> the Lion Rock corridor <strong>of</strong> the Kowloon Externalscreenline and by the low growth in the Kowloon KK screenline. <strong>The</strong> opening <strong>of</strong> thetwo tunnels, and the Kwun Tong Bypass connecting the two, opens up a new routefrom eastern <strong>Hong</strong> <strong>Kong</strong> and Kowloon to the New Territories. Rail travel increasinglydominates the corridors served by rail lines to the extent <strong>of</strong> demand exceedingcapacity in some cases; this is discussed further in Chapter 7.5.6.3 Road corridor movements shown in Table 5.6 show similar patterns with stronggrowth in the New Territories and slower growth in the main urban area. <strong>The</strong>increasing importance <strong>of</strong> goods vehicles is shown, especially in the New Territorieswhere they are expected to dominate road flows.5.7 Traffic Congestion and Traffic Speeds5.7.1 <strong>The</strong> relationship between traffic congestion, as defined by the ratio <strong>of</strong> traffic volumeto traffic capacity (V/C), and traffic speeds is shown in Figure 5.1 0 by class <strong>of</strong> road.Traffic speeds decline from free-flow speeds (sometimes controlled by speed limits)at quite low traffic volumes. Up to the point when traffic reaches the practicalcapacity <strong>of</strong> the road (V/C <strong>of</strong> 1.0), traffic is still flowing smoothly. A V/C^bpye 1.0indicates the onset <strong>of</strong> congestion; above,1.2 indicates more serious congestion, withtraffic speeds progressively deteriorating with further increase in traffic. With V/Csabove 1,4, traffic is moving very slowly with frequent halts. With the high peak hourV/Cs, traffic starts to spread into adjacent <strong>of</strong>f-peak hours.5.10: TRAFFIC BY TYPE LEVEL0.8 0.8 1.0 1.2 145.7.2<strong>The</strong> congestion caused by a vehicle depends on its size. In order to assess trafficvolumes relative to traffic capacity, it was necessary to convert vehicle volumes intoequivalent passenger car unit (pcu) volumes. This was done using the followingconversion factors:87
Cars and taxis 1.00Minibus/Special Purpose Bus 1.50Goods vehicles 1.75Buses 3.005.7.3 Converting ali road traffic into passenger car units (PCU), the projected growth intotal daily traffic volumes by corridor is shown in Table 5.7, together with the V/Cratio during the morning peak hour. Most corridors are projected to reach or exceeda V/C ratio <strong>of</strong> 1.0 by 2001, compared with only two corridors in 1986; Crossharbourand Lion Rock. <strong>The</strong> 1991 projections show that both corridors are improvedby the opening <strong>of</strong> the Eastern Harbour Crossing to Tate's Cairn route. Other majorprojects, such as the West Kowloon Corridor and the island Eastern Corridor, aresimilarly expected to improve traffic conditions by 1991. After 1991, congestionstarts to build and under these conditions <strong>of</strong> no further construction projects beyondthose already committed, and no changes in traffic demand management policies,few corridors remain uncongested by 2001. Several corridors, especially Crossharbourand in the New Territories, show severe congestion.Table 5.7BY1986 1991 1996 200124-hour AM Peak 24-hour AM Peak 24-hour AM Peak 24-hour AM PeakCorridor pcus V/C 1 pcus 1//C 1 pcus V/C 1 pcus V/C 1(thous) (thous) (thous) (thous)<strong>Hong</strong> <strong>Kong</strong> IslandF-F Central 219 0.7 261 0.7 324 0.8 392 0.9G-G Causeway Bay 182 0.9 209 1.0 271 1.3 320 1.4l-l Shau Kei Wan 52 0.9 78 0.5 95 0.6 110 0.7HK External:Pok Fu Lam 50 0.6 57 0.6 99 0.9 108 1.0Happy Valley 68 0.5 92 0.6 123 0.9 152 1.0Chai Wan 8 0.4 13 0.6 14 0.7 20 10Total HK External 126 0.5 162 0.6 236 0.9 280 1.0Cross-Harbour 169 1.2 241 1.0 310 1.2 384 1.5KowloonA-A KCR Line 731 0.8 677 0.7 855 0 8 986 0 9C-C:Nathan Rd Corridor 223 0.8 256 0.5 284 0.7 379 0.7Waterloo Rd Corridor 245 0.7 206 0.6 245 0 8 307 1 0To Kwa Wan 202 0.8 202 0.8 236 1.0 274 1.1Total C-C 670 0.8 664 0.6 765 0.8 960 0.9K-K East Kowloon 322 0.6 365 4.4 498 0.8 606 1.0Kowloon External:Kwai Chung 235 0.7 244 0.5 321 0.6 377 0.7Lion Rock 167 1.3 199 0.9 295 1.3 347 1.5Junk Bay 28 0.3 80 (5.4 118 0.5 169 0.7Total Kowloon Ext. 430 0.8 523 0.6 734 0.7 893 0.9New TerritoriesR-R:Sham TsengSha Tin11390Q.50.51561390.80.81902081.11.2242267J.4T.5Total R ' R 203 0.5 295 0.8 398 1.1 509 1.5S-S Northwest NT 145 0.6 211 0.7 286 08 369 1.1T-T Nothern 94 0.5 149 0.5 "269"""" l!o "333 T3Tuen Mun-Yuen Long 75 0.8 99 1.0 451 0.8 ,185 'Y/ C w n^cates rati °u n <strong>of</strong> *?*£!? volume to Poetical capacity. A V/C <strong>of</strong> 1.0 indicates the onset <strong>of</strong> congested traffic conditions.<strong>The</strong> V/C mayjeach much higher values representing the-demand in excess <strong>of</strong> capacity but with increasingly severe effectson average traffic speeds..."....» y ........88
5.7.4 <strong>The</strong> changes in congestion in the road system are shown in Figure 5.11 (1986conditions) and 5.12 (2001 conditions).5.7.5 Figure 5.13 shows average road speeds by class <strong>of</strong> road for 1986 and 2001, andFigures 5.14 and 5.15 show peak speeds for local and trunk roads. Speeds declinedrastically from 1986 to 2001. On average, peak hour speeds drop by about one halfand <strong>of</strong>f-peak speeds by one third. By 2001, 38% <strong>of</strong> roads in the peak hour and 29%<strong>of</strong> roads in the <strong>of</strong>f-peak hour would have V/C ratios greater than 1.0, compared with1986 values <strong>of</strong> 10% and 7% respectively.5.7.6 Such severe increases in congestion would have serious consequences for theTerritory, with virtually ail goods movements and two thirds <strong>of</strong> public transportmovements dependent on road-based services. Transport projects and policies toavoid this situation are set out in the next chapters.89
LEGEND V/C Ratio Range• 1.1 - 1.2• > 1.2Figure 5.11ROAD CONDITIONS IN 1986 BASE YEAR (AM Peak Hour)HONG KONG ISLAND AND KOWLOONSheet 1 <strong>of</strong> 2
LEGEND V/C Ratio Range• 1.1 - 1.2• > 1.2Figure 5.11ROAD CONDITIONS IN 1986 BASE YEAR (AM Peak Hour)NEW TERRITORIESSheet 2 <strong>of</strong> 2
•Vf'rLEGEND V/C Ratio Range> 1.1 - 1.2• > 1.2Figure 5.12PROJECTION OF ROAD CONDITIONS IN 2001 UNDER COMMITTED SCENARIO (AM Peak Hour)HONG KONG ISLAND AND KOWLOONSheet 1 <strong>of</strong> 2
COCO/LEGENDV/C Ratio Range1.1 - 1.2> 1.2Figure 5.12PROJECTION OF ROAD CONDITIONS IN 2001 UNDER COMMITTED SCENARIO (AM Peak Hour)( NEW TERRITORIESSheet 2 <strong>of</strong> 2
FIGURE 5.13:TRAFFIC SPEEDS BY ROAD CLASSAM PEAK HOURRural LocalRural TrunkUrban LocalUrban DistrictUrban PrimaryUrban TrunkOFF-PEAK HOURRural LocalRural TrunkUrban LocalUrban DistrictUrban PrimaryUrban Trunk10 20 30 40Average Traffic Speed (km/h)1986 2001Committed Projects, No Change In PolicyFIGURE 5.14:PEAK LOCAL ROAD SPEEDS BY AREACentral and WesternWan ChaiEasternSouthernYau Ma TelMong KokSham Shu I PoKowloon CityWong Tai SinKwun TongTeuen WanSha TinOther NTIncludes Rural Local, Urban LocalAnd Urban Dletrlct Roads.10 20 30 40Average Traffic Speed (km/h)Committed Projects, No Change In Policy34
FIGURE 5.15:PEAK TRUNK ROAD SPEEDS BY AREACentral and WesternWan ChaiEasternSouthernYau Ma TelMong KokSham Shui PoKowloon CityWong Tal SinKwun TongTsuen WanSha TinOther NTIncludes Rursl Trunk, Urbsn TrunkAnd Urbsn Primary Rosds.10 20 30 40Average Traffic Speed (km/h)Committed Projects, No Chsngs In Policy96
6. OF6.1 Introduction6.1.1 This chapter reports on the evaluation <strong>of</strong> highway projects and the development <strong>of</strong> ahighway investment programme. <strong>The</strong> evaluations, combining traffic and economicfactors, were made in the context <strong>of</strong> the demographic changes, economic growthand major new developments reported in previous chapters. <strong>The</strong>y also took intoaccount presently known and committed changes in the transport network.6.1.2 It was assumed in the analyses that the airport would remain at its present site at KaiTak until 2001. During the course <strong>of</strong> the Study, the possibility emerged for theairport to be relocated towards the end or by the turn <strong>of</strong> the century. <strong>The</strong> impact <strong>of</strong>airport relocation on the highway investment programme is included here whereappropriate, and reported in more detail in Chapter 10.6.2 Committed Highway Projects6.2.1 At the present time, many highway projects are under construction, or have beencommitted to start in the near future. Estimates <strong>of</strong> transport conditions with theseprojects completed served as the reference against which the need for furtherhighway projects was evaluated6.2.2 Committed highway projects were identified chiefly from the Public Works Programme,updated to the end <strong>of</strong> 1988. <strong>The</strong> major committed projects considered byCTS-2 are listed in Table 6.1 and illustrated in Figure 6.1.6.2.3 Several trunk highways are currently under construction which are expected to havea significant impact on the Territory's travel patterns. <strong>The</strong> most important one is anew trunk road linking the east end <strong>of</strong> <strong>Hong</strong> <strong>Kong</strong> Island with the New Territories atSha Tin via the Eastern Harbour Crossing, the Kwun Tong Bypass and the Tate'sCairn tunnel. <strong>The</strong> Eastern Harbour Crossing is due to open in 1989, and the otherparts <strong>of</strong> the route two years later in 1991. This route will bring traffic relief to the twomain existing traffic bottlenecks in the Territory; the Cross-Harbour tunnel and theLion Rock tunnel.Table 6.1COMMITTED HIGHWAY PROJECTSProject DescriptionReferenceNo. inFig. 6.1(A) <strong>Hong</strong> <strong>Kong</strong> IslandRt 1—Route Through Aberdeen—Stage 3 1Rt 7—Upgrading and Dualling <strong>of</strong> Connaught Rd, Stage 1 & 2 2Rt 8—I EC, Stage 3, Shau Kei Wan to Chai Wan 3Rt 8—Reconstruction <strong>of</strong> Causeway Bay Flyover 4(B) KowloonRt 1 — Princess Margaret Road Flyover Improvement 5Rt 1—ELE. Link Between East and West Kowloon Tong 6Rt 2—Gascoigne Rd and Chatham Rd Improvement 7Rt 2—WKC, Cheung Sha Wan & Tung Chau St/Tong Mi Rd Ramp 8Rt 2—WKC, Yau Ma Tei Section 9Rt 4— Lung Cheung Rd/Hammer Hill Rd Intersection 10Rt 4—Reconstruction <strong>of</strong> Kwun Tong Road 11Rt 4—Reconstruction <strong>of</strong> Lung Cheung Rd (Shatin Pass Road and 12Clear Water Bay Road)Rt 6—Kwun Tong By-pass, Phase 1 13Rt 6—Kwun Tong By-pass, Phase 2 14Rt 6—Kwun Tong By-pass, Phase 3 15Rt 6—Tate's Cairn Tunnel and Prince Edward Rd Interchange 16Rt 6—Tate's Cairn Tunnel and Approaches 1796
(C) New TerritoriesRt 1 — NTCR, North Tai Po To Lam Kam Rd 18Rt 1—Vehicular Border Link at Lok Ma Chau, Stage ! & SI 19Rt 1—NTCR Improvement—Lam Kam Rd to Wo Hop Shek (Part) 20Rt 2—Widening <strong>of</strong> Kwai Chung Rd (From Lai Chi Kok to Tsuen Wan Road) 21Rt 2—NTCR Improvement Au Tau to Fan Kam Rd; Phase ! to IV and V! 22Rt 2—Au Tau Bypass 23Rt 2—NWNT, YL—TM Eastern Corridor and YL West Link 24Rt 2—NWNT Development—Yuen Long Southern By-pass 25Rt 5—Sha Tin to Tsuen Wan 26(D) Items Under Private FinanceRt 6—Eastern Harbour Crossing, Tunnel and Associated Works 27Rt 6—Tate's Cairn Tunnel 286.2.4 Other important trunk roads include the Connaught Road upgrading in Central andWestern, including new flyovers and an underpass, completion <strong>of</strong> the West KowloonCorridor project from Jordan Road to Lai Chi Kok, completion <strong>of</strong> the Island EasternCorridor project all the way to Chai Wan, completion <strong>of</strong> the New Territories CircularRoad and opening <strong>of</strong> the Route 5 tunnel linking Sha Tin and Tsuen Wan.6.2.5 Completion <strong>of</strong> the committed highway projects is expected to provide congestionrelief in the early 1 990s but traffic conditions would deteriorate seriously by the end<strong>of</strong> the 1990s without further highway projects. This was discussed in Chapter 5.6.2.6 <strong>The</strong> total value <strong>of</strong> current commitments to highway construction is estimated at$23 billion, <strong>of</strong> which some $10-11 billion remained to be spent from the beginning<strong>of</strong> 1989.6.3 Candidate Highway Projects6.3.1 Candidate highway projects evaluated by CTS-2 came from three major sources:(1) Projects in the Public Works Programme, most <strong>of</strong> which were developed byHighways or Territory Development Departments, including further stages <strong>of</strong>committed improvements.(2) Suggestions and recommendations from previous and current transport andplanning studies such as the Harbour Reclamation and Urban Growth (SHRUG)Study, Territorial Development Strategy (TDS) Study, etc.(3)^ Projects to address traffic needs or problems identified in the CTS-2 testingprogramme.6.3.2 <strong>The</strong> candidate highway projects considered by CTS-2 are shown in Table 6.2 andillustrated in Figure 6.2. Many <strong>of</strong> these were conceptual projects without detailedtraffic or engineering feasibility studies. <strong>The</strong> approach taken in each case was for theCTS-2 to develop a preliminary design and agree on details with HighwaysDepartment after review.6.4 Highway Project Evaluation6.4.1 As discussed in Chapter 4, the limits to investment in transport infrastructure are setby the transport budget likely to be available. Hence highway projects identified forpossible implementation required to be evaluated and assigned relative priorities forinvestment. Three aspects were considered, as discussed below.Traffic Operations6.4.2 Projects were first examined from the point <strong>of</strong> view <strong>of</strong> traffic operations, assessingthe volumes <strong>of</strong> traffic carried by the project and the traffic congestion relief given toother parts <strong>of</strong> the transport system. <strong>The</strong> traffic performance was measured by thepeak period volume to capacity (V/C) ratio, as discussed in Section 5,7 <strong>of</strong> Chapter 5.97
LEGENDMajor Committed Road ProjectKowloon-New Territories BoundaryFigure 6.1MAJOR COMMITTED ROAD PROJECTSHONG KONG ISLAND AND KOWLOONSheet 1 <strong>of</strong> 2
CDLEGENDMajor Committed Road ProjectKowloon-New Territories BoundaryFigure 6.1MAJOR COMMITTED ROAD PROJECTSNEW TERRITORIESSheet 2 <strong>of</strong> 2
LEGENDCandidate Road ProjectKowloon-New Territories BoundaryFigure 6.2CANDIDTAE ROAD PROJECTSHONG KONG ISLAND AND KOWLOONSheet 1 <strong>of</strong> 2
LEGENDCandidate Road ProjectKowloon-New Territories BoundaryFigure 6.2CANDIDATE ROAD PROJECTSNEW TERRITORIESSheet 2 <strong>of</strong> 2
A V/C ratio <strong>of</strong> 1.0 or less indicates a satisfactory level <strong>of</strong> traffic, while a V/C ratioabove 1.0 indicates the onset <strong>of</strong> congested conditons. A more general measure <strong>of</strong>traffic operations was given by the average speed <strong>of</strong> travel on different classes <strong>of</strong>road in the districts through which the project passed. An overall objective <strong>of</strong> therecommended transport strategy was to achieve average speeds <strong>of</strong> at least thoseprevailing in the Study base year, by means <strong>of</strong> highway projects and trafficmanagement measures (discussed in Chapter 9).Project Name8.2Link No.inFigure 6.2(A) HONG KONG ISLANDRoute 7—Sai Ying Pun to Aberdeen ' 1Route 7—Centra! and Wan Chas Bypass 2iEC Link—Causeway Bay to Wan Chai 3Route 81—Aberdeen Tunnel to Stanley 4Route 81—Stanley to Chai Wan 5Additional Tube to CHT and Approach (Argyle Street to Gloucester Road) 6Western Harbour Crossing (part <strong>of</strong> Route 3) 7Gloucester Road Westbound Flyover over Tunnel Exit 8Second Ap Lei Chau Bridge 9(B) KOWLOONEast KowSoon Corridor Improvement (Hung Horn to Kowloon Bay) (or alternatively 10upgraded Hung Horn Bypass plus Second Airport Tunnel)Hung Horn By-pass (Salisbury Road to fVSa Tau Kok Road) 11Gascoigne Road Improvement (Ferry Street to Princess Margaret Road) (or alternatively 12convert the existing Gascoigne Road flyover to one way eastbound and add a two laneflyover along Jordan Road for westbound traffic)Waterloo Road Extension (Ferry Street to West Kowloon Expressway) 13West Kowloon Expressway (Western Harbour Crossing to Ching Cheung Road) (part <strong>of</strong> 14Route 3)Lung Cheung Road Improvement (Ching Cheung Road to New Clearwater Bay Road) 15Elevated Road along Boundary Street (Kai Tak to Las Chi Kok Road) 16Boundary Street Extension to West Kowloon Expressway 17Tonkin Street Extension to West Kowloon Expressway 18Waterloo Road Improvements (from Argyle Street to Lung Cheung Road) 19Additional Lion Rock Tunnel and Associated Works 20(C) NEW TERRITORIESAu Tau-Lam Kam New Road 21Tuen Mun Bypass 22T6 (Sha Tin) Improvement (Tolo Highway to T5) 23T7/P8 corridor (MOS) Improvement (T5 to MOS Town Centre) 24Route 16—Sha Tin to Lai Chi Kok 25Route 5—Section Between Shek Wai Kok and Chai Wan Kok 26Route 42—Hiram's Highway Improvements, Remaining Stages (Clear Water Bay Roadto Sai Kung)27Part <strong>of</strong> Route 3 between NWNT and Kwai Chung 28Improvements to Kwai Chung Road South (Phase II and SIS) (part <strong>of</strong> Route 3) 29New Road from Man Kam To to the New Territories Circular Road, west <strong>of</strong> Sheung Shui 30Widening <strong>of</strong> NTCR (from Au Tau to Fan Kam Road) 31Further Widening <strong>of</strong> Tai Po Road (from Lung Cheung Road to Sha Tin) 32Economic Evaluation6.4.3 <strong>The</strong> economic evaluation compared the costs <strong>of</strong> each project in economic termswith the anticipated benefits <strong>of</strong> the project to the community. <strong>The</strong> results wereexpressed in the ratio <strong>of</strong> annual economic benefits <strong>of</strong> the project at the year <strong>of</strong>operation to the total economic costs, termed the Single Year Rate <strong>of</strong> Return102
(SYRR). <strong>The</strong> economic costs <strong>of</strong> a highway project comprised construction cost andeconomic land cost. <strong>The</strong> latter reflected the opportunity cost to the society <strong>of</strong>diverting the land required for the project away from its best alternative use. <strong>The</strong>economic benefits <strong>of</strong> having a highway project in piace generally consisted <strong>of</strong>passenger time and vehicle operating cost savings due to reduced travel distanceand increased traffic speed.Environmental Considerations6.4.4 It is not possible to treat the environmental aspects <strong>of</strong> new highways, for instancetraffic noise, air pollution, visual intrusion, fully in a strategic study such as CTS-2.Analysis <strong>of</strong> these impacts requires detailed studies taking into account localconditions and design details which are not yet known. Nevertheless, candidatehighway projects were classified according to the degree <strong>of</strong> environmental sensitivityand additional construction costs were included for works to ameliorate traffic noiseimpacts. It is recognised that more should be done to investigate environmentalimpacts, but this is the task <strong>of</strong> the detailed feasibility studies required for eachrecommended project (see paragraph 6.10.15).Computer Testing6.4.5 <strong>The</strong> evaluation <strong>of</strong> highway projects was carried out in a sequence <strong>of</strong> computer tests,refining the highway strategy at each stage. <strong>The</strong> sequence <strong>of</strong> tests is described inChapter 2.Evaluation Results6.4.6 Table 6.3 summarises the construction cost and economic evaluation result for each<strong>of</strong> the highway projects recommended for inclusion in the transport investmentprogramme. Traffic operation analysis results in terms <strong>of</strong> daily flows and V/C ratiosin the morning peak hour are also shown in the table.6.4.7 For the purpose <strong>of</strong> CTS-2, projects having an economic Single Year Rate <strong>of</strong> Returngreater than 4% are considered worthwhile projects for investment. <strong>The</strong> economicanalysis was carried out for the year 1996 for evaluation purposes. Rather thanreporting specific values, returns are classified in Table 6.3 as follows:SYRRLow below 4%Medium 4%-8%High above 8%6.5 RouteSOnly the evaluation <strong>of</strong> major highway projects is presented in this chapter./6.5.1 Route 3 refers to the north-south trunk route starting from the western end <strong>of</strong> <strong>Hong</strong><strong>Kong</strong> Island and routed through West Kowioon, Kwai Chung and Tsing Yi up toYuen Long. It consists <strong>of</strong> several major sections including Western HarbourCrossing, West Kowioon Expressway, Kwai Chung and Tsing Yi section and the YauKom Tau to Yuen Long section.Route 3 (Western Harbour Crossing)6/5.2 <strong>The</strong> Western Harbour Crossing (WHC) is a proposed 6-lane tunnel connecting the'/ West Kowioon Reclamation with the western end <strong>of</strong> <strong>Hong</strong> <strong>Kong</strong> Island. It isexpected to carry 26% <strong>of</strong> all cross-harbour traffic in 1996 at a V/C ratio <strong>of</strong> 0.6,increasing to 39% in 2001 at a V/C ratio <strong>of</strong> 1.0. Most <strong>of</strong> the growth in cross-harbourtraffic between 1996 and 2001 is expected to occur on the WHC.103
Table 6.3 SUMMARY OF HIGHWAY PORJECT EVALUATIONConstr 1ProjectCost($M)Major ProjectsIsland Eastern Corridor Link293Route 7 (Kennedy Town-Aberdeen)475Route 7 (Sai Ying Pun-K. Town) 41 005Central-Wan Chai Bypass1460Route (Western Harbour Crossing)3505Route 3 (West Kowloon Expressway) (South) 5228Route 3 (West Kowloon Expressway) (North) 6 1 .019Hung Horn Bypass372Second Airport Tunnel400Route 3 (Yau Kom Tau-Yuen Long)2 856Route 3 (Kwai Chung-Yau Kom Tau)3,278Route 16695Sub-total 16586Medium ProjectsSecond Ap Lei Chau Bridge263Boundary Street (East) Flyovers133Boundary Street (West) Flyovers242Waterloo Road Flyover133Jordan/Gascoigne Road Flyovers184Lung Cheung Road 7262Chatham Road Flyover102Man Kam To-NTCR Connector116Texaco Road Flyover144Fan Kam Road Widening145Kwai Chung Circumferential Road131Route 5 (Shek Wai Kok-Chai Wan Kok)228Road T4—Sha Tin177Castle Peak Road Widening218Sub-total 2478Minor ProjectsGloucester Road Flyover21Smithfield Extension84Lung Cheung Road Flyover60Nam Cheong Street Widening12Tai Po Road Flyover54Ching Cheung Road Widening67Hiram's Highway44Kam Tin Road Widening95Lam Kam Road Widening86NT Circular Road Widening33Kam Tin Bypass (Phase 2)28Hang Hau Road ImprovementRoute Twisk 8 58 7Sub-totalTotal64919713SYRR 2Recommended Strategy1996 200124 hr pcu PkV/C 3 24 hr pcu(000) (000)M 38M L 43M HHH 779186M 83HHHL 4321H 36L 81H L H51M6MMLLHHHHMHLLLMML81 16312918505848 17260.60.60.60.90.50.80.40.80.70.80.60.11.00.70.90.50.60.70.80.40.21.2Pk V/C 386 0.970 0.7124 1.0112 0.8143 1.01601.1141 0.9102 0.691 1.092 0.8104 0.848 0.747 0.523 0.918 0.447 0.997 0.9142 1.058 0.428 0.446 0.611 0.214 0.734 0.671 0.834 0.681 1.022 1.250 1.034 0.511 0.694 0.623 0.651 0.758 0.774 0.612 0.226 1.016 0.8Notes:12345678In 1988 prices; land costs excluded.Economic Single Year Rate <strong>of</strong> Return (SYRR) at year <strong>of</strong> operation which was taken as 1996 for all projects forevaluation purposes only. Return classified as follows:L = Low 8%<strong>The</strong> higher V/C ratio <strong>of</strong> the two directional flows in the morning peak.Includes Belcher's Bay link.South <strong>of</strong> Tonkin Street. Costs assume at-grade facility.North <strong>of</strong> Tonkin Street Includes South Kwai Chung Road Improvements, Phases II and III. Also includes proposedMei Foo Bypass (in 1996 only).Includes 3 improvement projects from Butterfly Valley Interchange to Waterloo Road Interchange.This project is included in the construction programme but not evaluated economically.104
6.5.3 <strong>The</strong> redistribution <strong>of</strong> traffic caused by the WHC would affect traffic conditions onthe north shore <strong>of</strong> <strong>Hong</strong> <strong>Kong</strong> island and parts <strong>of</strong> Kowioon. Volumes on main streetsin Central, Wan Chai and Causeway Bay would decrease as traffic previouslyapproaching the Cross Harbour tunnel (CHT) diverts to the WHC. Kowioon trafficvolumes would decrease in the central corridor linking the existing Cross-Harbourtunnel to Lion Rock tunnel, and would increase on the West Kowioon Corridor andon Waterloo Road.6.5.4 <strong>The</strong> economic evaluation showed the highest return <strong>of</strong> all major projects indicatingthat it is a very worthwhile project.6.5.5 <strong>The</strong> Western Harbour Crossing is dependent on a landfall provided by the southernsection <strong>of</strong> the planned West Kowioon Reclamation. <strong>The</strong> programme (in late 1988)for the West Kowioon Reclamation indicated that this portion <strong>of</strong> the reclamationcould likely be completed by 1 993 and hence facilitate the construction <strong>of</strong> the WHCin early 1990s. It has been suggested that the interchange required on <strong>Hong</strong> <strong>Kong</strong>island for this 6-iane facility may be too large to be accommodated on the WesternReclamation in Sai Ying Pun. If so, the alternatives might be to either construct theWHC as a 4-iane facility or relocate the interchange westward to the proposedGreen Island Reclamation. Both alternatives have disadvantages. A 4-lane facilitywould provide less cross-harbour road capacity leading to a shortfall in trafficcapacity by the late 1990s. On the other hand, a relocated tunnel would beconsiderably longer and less likely to divert traffic from the other two crossings. <strong>The</strong>relocation would also make the WHC dependent on the timing <strong>of</strong> the Green IslandReclamation, which is unlikely to be in place before 1996.6.5.6 If a site for the replacement airport is selected in the Western Harbour, with portexpansion on Lantau, the resulting airport and port traffic would require a 10-lanefacility by 2001, effectively two new crossings in the Western Harbour.?7 Conclusions—Tests have shown a critical need for additional cross-harbour roadcapacity by the mid-1990s. Completion <strong>of</strong> a 6-Iane Western Harbour Crossing bythe mid-1990s would result in satisfactory operations on all three tunnels up to2001. However, a decision to relocate the airport to the Western Harbour wouldrequire a serious re-evaluation <strong>of</strong> the requirements for the crossing. This project hasthe highest priority for investment.Route 3 (West Kowioon Expressway)6.5.8 <strong>The</strong> West Kowioon Expressway (WKE) is a proposed dual 3-Iane trunk road throughthe West Kowioon Reclamation. It would form a section <strong>of</strong> Route 3 between theWestern Harbour Crossing and Kwai Chung.6.5.9 Daily traffic volume on the WKE in 2001 is projected at 141 000 pcus per day on theLai Chi Kok section, rising to 160 000 on the Yau Ma Tei section at V/C ratios <strong>of</strong> 0.9and 1.1 respectively. This compares with 143000 pcus per day projected for theWestern Harbour Crossing. <strong>The</strong> WKE is expected to operate at capacity southboundsouth <strong>of</strong> Tonkin Street. Approximately 60% <strong>of</strong> this volume is taken from local streetsin Las Chi Kok and Yau Ma Tei while the balance is diverted from central Kowioon.6.5.10 <strong>The</strong> Single Year Rate <strong>of</strong> Return (SYRR) for the WKE is the second highest <strong>of</strong> themajor projects under evaluation. It is a very worthwhile project.6.5.11 This project is dependent on the West Kowioon Reclamation. Current thinking isthat the earliest reasonable completion date for the reclamation is 1997, except forone section in Sham Shui Po which could only be completed after relocation <strong>of</strong> thetemporary wholesale market at a later date. Timing <strong>of</strong> the reclamation project issubject to considerable uncertainty, as it depends on the reprovisioning <strong>of</strong> a largenumber <strong>of</strong> facilities in a sequence <strong>of</strong> interrelated steps. In view <strong>of</strong> this constraint theWKE project was not assumed to be in place before mid-1990s.105
6.5.1 2 <strong>The</strong> traffic implications <strong>of</strong> opening the WHC prior to the West Kowloon Expresswayare likely to be less problematic than could be expected, as long as the extension<strong>of</strong> Route 3 to Yuen Long, and the extension <strong>of</strong> Route 7 to Aberdeen, are a!sopostponed to the late 1990s. Without these extensions, the diversionary effect <strong>of</strong> theWestern Harbour Crossing would be largely limited to cross-harbour movementsand traffic from the WHC would tend to disperse into Kowloon. In this situation,very few, and scattered, Sinks in West and Northwest Kowioon are projected to havecapacity problems in 1996, and these are expected to operate better than in 1986.6.5.13 With the possible new replacement airport relocated to North Lantau and portdevelopment on Lantau Island, the airport and port traffic coming into the urban areawould require an increase in capacity for the WKE from a dual 3-lane to a dual4-!ane facility by 2001.6.5f14 Conclusions—<strong>The</strong> West Kowloon Expressway will clearly be necessary by 2001 to/ provide capacity for the growth in traffic in Kowloon and to allow the WesternHarbour Crossing to attain its ful! potential to relieve the other harbour crossings.From the latter perspective, the West Kowloon Expressway is desirable as soon aspossible. Detailed planning for the West Kowloon Reclamation should consider thepossibility <strong>of</strong> accelerating the project or structuring the phases to permit completion<strong>of</strong> the WKE by mid to late 1990s. An alternative could be to construct theExpressway as an elevated facility, but this would be considerably more expensiveand may interfere with marine access to the existing waterfront facilities and causeproblems for subsequent reclamation work.6.5.15 It appears that traffic conditions in West and Northwest Kowloon would be tolerablein the mid 1990s without the WKE even if the Western Harbour Crossing were open,provided:(1) Additional capacity is provided to relieve the bottleneck at the Lai Chi KokBridge (refer to the following section on South Kwai Chung Road Phases II&HI).(2) <strong>The</strong> West Kowloon Expressway opens prior to, or simultaneously with, thenorthern extension <strong>of</strong> Route 3 and the southern extension <strong>of</strong> Route 7 on <strong>Hong</strong><strong>Kong</strong> Island.Route 3 (South Kwai Chung Road Improvements, Phases [I and III)6.5.16 <strong>The</strong> extensive project to improve South Kwai Chung Road has three phases. Phase I,a committed project will widen South Kwai Chung Road from Ching Cheung Roadto Tsuen Wan Road and provide a direct connection between Ching Cheung Roadand Container Port Road. Phases II and 111 are designed to provide connectionsbetween the West Kowloon Expressway, the Tsing Yi section <strong>of</strong> Route 3 and SouthKwai Chung Road.6.5.17 In order to bypass the expected traffic congestion at the Lai Chi Kok Bridgebottleneck, it is proposed to extend this project south to a temporary connectionwith the northern end <strong>of</strong> the West Kowloon Corridor. This will serve until the WestKowloon Expressway can be completed.6.5.18 Such a bypass would certainly serve its purpose effectively. Projected daily volumesare 58000 and 90000 pcus at V/C ratios <strong>of</strong> 0.5 and 0.7 in 1996 and 2001respectively. With the bypass, the corridor would function satisfactorily, with theexception <strong>of</strong> the northernmost section <strong>of</strong> the West Kowloon Corridor which wouldbe operating slightly above practical capacity. Opportunities exist to improve thissituation by making improvements identified in the Northwest Kowloon TrafficStudy recently completed for Transport Department.6.5.19 <strong>The</strong> Single Year Rate <strong>of</strong> Return is HIGH, only slightly less than that <strong>of</strong> the WestKowloon Expressway indicating that it is also a very worthwhile project.106
6.5.20 <strong>The</strong> South Kwai Chung Road Improvement project was designed as a part <strong>of</strong> acontinuous through expressway. This section <strong>of</strong> the project is planned to be built onreclaimed land at the northern end <strong>of</strong> the West Kowioon Reclamation. <strong>The</strong> currentprogramme for the reclamation indicates that Stage 1 in the area <strong>of</strong> the containerport is planned for completion by late 1993. <strong>The</strong> Cheung Sha Wan sections aretentatively scheduled for completion in about 1995 and later. <strong>The</strong> possibility <strong>of</strong>accelerating these depends on the relocation <strong>of</strong> the facilities in Cheung Sha Wan. Inaddition, the temporary connections would have to be investigated in detail.Construction may require disruption or detours <strong>of</strong> traffic on the West KowioonCorridor.6.5.21 Conclusions—<strong>The</strong> idea! situation from a traffic point <strong>of</strong> view would be for the WestKowioon Expressway to be fully in place with the Western Harbour Crossing, butthis is dependent on the completion <strong>of</strong> the West Kowioon Reclamation which isunlikely to be ready by the mid 1990s. Traffic operations in West Kowioon appear tobe manageable without the West Kowioon Expressway, but the Kwai Chung areawill be most critical due to the lack <strong>of</strong> alternatives to the Las Chi Lok Bridge. HenceSouth Kwai Chung Road Improvements Phases II and 111, together with theproposed bypass to Lai Chi Kok Bridge, is recommended to be completed by mid1990s to provide traffic relief to this area until the West Kowioon Expressway isavailable.Route 3 (North <strong>of</strong> Kwai Chung)6.5.22 This part <strong>of</strong> the Route 3 was analysed in two sections: Yuen Long Jo Yau Kqm Tau,with an interchange at Tuen Mun Road;, and Yau Kom Tau to Kwai Chung with ."ahinterchange on Tsing Yi Island. <strong>The</strong>se are referred to here as the northern andsouthern sections respectively. <strong>The</strong> northern end <strong>of</strong> this part <strong>of</strong> Route 3 wouldprovide connections to the Yuen Long Southern Bypass and New TerritoriesCircular Road, while the southern end would connect to South Kwai Chung Roadand the West Kowioon Expressway. <strong>The</strong> two sections are proposed as a dual 3-laneexpressway, and would carry through traffic between the New Territories and urbanarea, removing it from the Tsuen Wan and Kwai Chung road system.6.5.23 <strong>The</strong> northern section is projected to carry 92 000 pcus per day in 2001 at a V/C rajtio-^<strong>of</strong> 0.8, resulting in satisfactory operating conditions on roads in the Kwai Chungcorridor providing access to the North-west New Territories.6.5.24 Thte southerasection through Tsing Yi is projected toxajry, 1.Q4 000,,pcus per day in ••2001 at a.V/C ratsg,.,QlQ,$. This would result in substantial reductions in traffic flowson Tuen Mun Road and Castle Peak Road approaching Tsuen Wan. <strong>The</strong>sereductions will improve the morning peak hour operations from severely congestedto generally satisfactory.6.5.25 <strong>The</strong> economic benefits <strong>of</strong> the two sections <strong>of</strong> Route 3 as a combined project aresubstantial split approximately evenly between the two. Both <strong>of</strong> them are worthwhileprojects. <strong>The</strong> SYRR for the southern section is lower due mainly to its highereconomic costs.6.5.26 Traffic volumes on this part <strong>of</strong> Route 3 would change relatively little if either theWestern Harbour Crossing or the West Kowioon Expressway, or both, were notbuilt. This is because it provides a high speed connection between the NewTerritories and Kowioon which would be attractive, even if the harbour crossingswere congested. However, the consequence <strong>of</strong> opening these sections without theWest Kowioon Expressway in place would be to increase the traffic volume on theWest Kowioon Corridor by approximately 60-70%, resulting in congested conditionsin the morning peak. Congestion would also be expected to occur on Kwai ChungRoad and the Lai Chi Kok bridge under these circumstances.107
6.5.27 it is estimated that traffic volume on the northern section would decrease by 22%if the southern section were not opened simultaneously. <strong>The</strong> most serious consequences<strong>of</strong> this situation would be felt on Tuen Mun Road and Castle Peak Roadbetween Yau Kom Tau and Tsuen Wan. In addition, numerous roads in Tsuen Wanand Kwai Chung would be operating at capacity as vehicles were forced to travelthrough these areas to the urban area.6.5.28 Traffic volumes on this route, and in the North-west New Territories in general,would be increased in the event <strong>of</strong> stronger population growth in this region, orhigher volumes <strong>of</strong> traffic crossing the border with China. However, the additionalvolumes could be accommodated satisfactorily.6.5.29 <strong>The</strong> alignment and design <strong>of</strong> the Tsing Yi section is dependent upon the ultimatedevelopment <strong>of</strong> port and replacement airport facilities. With the possible newrepiacement airport relocated to North Lantau and port development on LantauIsland, the airport and port traffic coming into the urban area would require anincrease in capacity for the southern section <strong>of</strong> this part <strong>of</strong> Route 3 from a dual3-iane to a dual 4-Iane facility by 2001.6.5.30 Con elusions—This part <strong>of</strong> Route 3 is necessary to provide satisfactory service onlinks between the Western New Territories and urban area. Budget limitations and itsrelationship to other projects indicate a late 1990s timing for this project. Underthese conditions, temporary congestion may occur on several links in or approachingTsuen Wan and Kwai Chung, particularly Tuen Mun and Castle Peak Roads. Shortterm improvements should be investigated for these local problems.6.5.31$> Conclusions for Route 3 as a Whole—Considered with the previous conclusionsconcerning the WHC and WKE, it is recommended that the major projects designatedas parts <strong>of</strong> Route 3 be programmed in the south to north sequence: Western HarbourCrossing and South Kwai Chung Road, West Kowloon Expressway, section to YauKom Tau and section to Yuen Long.6.6 Route?6.6.1 A This is a proposed expressway at the western end <strong>of</strong> <strong>Hong</strong> <strong>Kong</strong> Island. It wasanalysed in two sections: between Sai Ying Pun and Kennedy Town, and fromKennedy Town to Aberdeen. *Route 7 (Sal Ying Pun to Kennedy Town)6.6.2 This is a proposed dual 3~lane expressway elevated above Connaught Road andcontinuing to Kennedy Town. It would connect to the Rumsey Street flyover, nowunder construction, and to the proposed Western Harbour Crossing.6.6.3 Traffic volumes in 1996 on this section <strong>of</strong> Route 7, if constructed without thesection to Aberdeen, would range from 21 000 pcus per day on the Kennedy Townsection to 43000 on the Sai Ying Pun section; well below traffic capacity. <strong>The</strong>Kennedy Town section would reduce Belcher's Street, Kennedy Town Praya andPokfulam Road from severely congested conditions to near capacity operations.Traffic on this section <strong>of</strong> Route 7 would come primarily from ground level ConnaughtRoad West and secondarily from Des Voeux Road West and Queen's Road West.Connaught Road West would then carry 25% less traffic and operate within capacity.<strong>The</strong> light volume on the Kennedy Town section <strong>of</strong> Route 7 is a result <strong>of</strong> poorconnections with Pok Fu Lam Road, which are constrained by difficult topography.6.6.4 Projected traffic volumes for 2001, now including the extension to Aberdeen, varyfrom 87 000 pcus per day on the Kennedy Town section to 124 000 on the Sai YingPun section. <strong>The</strong> latter would be operating at practical capacity. It is estimated thatabout 12% <strong>of</strong> this traffic is attributable to the Green Island Reclamation, 27% todiversion <strong>of</strong> trips originating in the Southern District out <strong>of</strong> the Aberdeen tunnel,and the balance <strong>of</strong> relief <strong>of</strong> local streets.108
6.6.5 <strong>The</strong> Single Year Rate <strong>of</strong> Return on this route is LOW because it is expensive and theeconomic benefits are largely confined to a small area and are therefore relativelysmall.6.6.6 "T Conclusions—Although the economic benefits are low, this section <strong>of</strong> Route 7 isrequires by the mid 1990s for local traffic reasons and to provide adequateconnections for the Western Harbour Crossing.Route 7 (Kennedy Town to Aberdeen)6.6.7 This section <strong>of</strong> Route 7 is proposed as a dual 3-lane expressway at ground level onthe Green Island Reclamation and on structure to the south. This highway wouldserve several purposes: traffic relief to Pokfulam and Victoria Roads, service to theGreen island Reclamation and potential connections to any proposed port andreplacement airport facilities in the Western Harbour.6.6.8 <strong>The</strong> section <strong>of</strong> Route 7 in Pokfulam is projected to carry 70 000 pcus per day in2001. Parallel Victoria and Pokfuiam Roads would be relieved <strong>of</strong> about 30 000 pcusper day, but Pokfulam Road would still be congested northbound in the morningpeak.6.6.9 <strong>The</strong> completed Route 7 expressway from Aberdeen to the Western HarbourCrossing would divert approximately 34 000 pcus per day away from the Aberdeentunnel which would then carry 84 000 pcus per day and operate without congestion.This diversion would also improve conditions on the main trunk roads on thesouthern shore <strong>of</strong> the Island between the Aberdeen tunnel and Wah Fu.6.6.10 Completion <strong>of</strong> the southern section <strong>of</strong> Route 7 is estimated to place an additional56000 pcus per day on the northern section, largely due to diversion from theAberdeen tunnel. This southern section <strong>of</strong> Route 7 would provide connections toany new trunk roads to the Green Island Reclamation and any proposed airportfacilities in the Western Harbour, and should be planned in conjunction with thesedevelopments.6.6.11 <strong>The</strong> economic benefits <strong>of</strong> this section <strong>of</strong> Route 7 are higher than those <strong>of</strong> thenorthern section and it is considered economically a worthwhile project.6.6.12 <strong>The</strong> analyses indicated that the amount <strong>of</strong> traffic diverted onto Route 7 from parallelstreets and hence the traffic relief provided by it, is sensitive to conditions <strong>of</strong> access.<strong>The</strong>se points should be taken into account in the detailed traffic and engineeringstudies for this route.6.6.13 If the replacement airport is relocated to the Western Harbour and with the portdevelopment on Lantau, the additional airport and port traffic would have seriousconsequences for Route 7, requiring an increase in capacity from dual 3-lane to dual5-lane.6.6.14 ^5 Conclusions—This project particularly illustrates the necessity for joint planning <strong>of</strong>land use developments and transport facilities. <strong>The</strong> appropriate capacity andconfiguration for this section <strong>of</strong> Route 7 will only be clear when decisions are madeconcerning the Green Island Reclamation and the future strategy on port and airportdevelopments. Even without these facilities, the substantial congestion indicated onPokfulam and Victoria Roads is related to planned population increases in the area.Also, this project is expected to contribute significantly to the usage <strong>of</strong> the WesternHarbour Crossing and the highways in West Kowloon. In order not to overloadthe West Kowloon Corridor in advance <strong>of</strong> the completion <strong>of</strong> the West KowloonExpressway, this project is programmed for a start in the late 1990s. <strong>The</strong> question <strong>of</strong>access to this project should be reviewed at the design stage." 109
6.7 and Airport Tunnel6.7.1 <strong>The</strong> Hung Horn Bypass is a dual 3-Iane expressway proposed to continue thepresently committed bypass northeastward from Bailey Street to Sung Wong ToiRoad, where it would connect to the proposed Second Airport tunnel. <strong>The</strong> tunnel isproposed as a dual 2-lane facility underneath the airport runway with connectionsto Kai Fuk and Kai Cheung Roads at the east portal <strong>of</strong> the existing Airport tunnel.<strong>The</strong> Hung Horn Bypass would serve as an alternative to the existing East KowloonWay. <strong>The</strong> objective <strong>of</strong> these two projects is to relieve the existing major east-westroutes (East Kowloon Way, existing Airport tunnel, Prince Edward Road East andLung Cheung Road), which are all expected to operate at or slightly above capacityin 1996 if no further highways are constructed in the area.6.7.2 Traffic volume on the Hung Horn Bypass is projected at 79 000 to 92 000 pcus perday in 1996 at V/C ratio <strong>of</strong> 0.7 to 1.0. Daily traffic on the East Kowloon Way isexpected to decline by 23% and congestion on this road would be eliminated.6.7.3 <strong>The</strong> Second Airport tunnel is expected to carry almost 83 000 pcus per day in 1996and operate at 80% <strong>of</strong> its capacity. <strong>The</strong> existing Airport tunnel would be relieved <strong>of</strong>approximately 40% <strong>of</strong> its volume and would then operate within capacity. Inaddition, this facility will attract east-west traffic from parallel northerly streets,particularly Prince Edward Road East past the airport.6.7.4 By 2001, the Second Airport tunnel and East Kowloon Way are expected to operateat practical capacity, while spare capacity would be available on the existing Airporttunnel and Prince Edward Road East.6.7.5 <strong>The</strong> Hung Horn Bypass and Second Airport tunnel were treated separately for thepurposes <strong>of</strong> economic analysis but are in practice interdependent. Economicevaluation indicated that 80% <strong>of</strong> the benefits <strong>of</strong> the combined project were due tothe Second Airport tunnel, but since the economic cost <strong>of</strong> the tunnel (includingeconomic land cost) is much greater, both projects achieve a MEDIUM Single YearRate <strong>of</strong> Return. Both projects are economically worthwhile.6.7.6 <strong>The</strong> engineering feasibility <strong>of</strong> the Second Airport tunnel has not been determined.Preliminary consultations with the Civil Aviation Department have not ruled out theidea, but indicated that it requires careful investigation. If the airport were relocatedit would not be necessary to construct a tunnel, but the need for additional capacitythrough the Kai Tak area would still be required.6.7.7 Conclusions—This combined project is desirable by the mid 1990s to provideadditional east-west capacity. <strong>The</strong> general issue <strong>of</strong> east-west traffic movements inKowloon should be studied in detail. <strong>The</strong>re is no high capacity expressway plannedfor these movements at present, and the combined Hung Horn Bypass and SecondAirport tunnel would be a worthwhile option. It would also allow the parallel localroads to serve the purpose <strong>of</strong> local access and function within capacity.6.8 Central-Wanchai Bypass and Island Eastern Corridor Link6.8.1 <strong>The</strong> Central and Wanchai Bypass is a proposed 6-lane facility on the Central andWanchai Reclamation. It would proceed from the committed Rumsey Street flyoverin Central through the proposed Tamar tunnel to Wan Chas. From this point theproposed Island Eastern Corridor (IEC) Link proceeds as a dual expressway nearVictoria Park. Partial access with the local street network would be provided atHarbour Road, Fleming Road and Tonnochy Road. A direct access ramp would alsobe provided to allow southbound tunnel traffic to proceed westbound on theBypass. Taken together these projects would link the I EC and Route 7 to provide acontinuous expressway along the north shore <strong>of</strong> <strong>Hong</strong> <strong>Kong</strong> Island.110
6.8.2 <strong>The</strong> Bypass is projected to carry 11 2 000 pcus per day in 2001 at a V/C ratio <strong>of</strong> 0.8while the !EC Link is projected to carry 86 000 pcus per day and operate at 90% <strong>of</strong>capacity westbound. With relatively little development assumed by this Study for2001 on the new Central and Wan Chai reclamation, parallel roads in Central, WanChai and Causeway Bay are expected to be relieved <strong>of</strong> substantial traffic. This resultsfrom both relief by the Bypass and diversions out <strong>of</strong> this area caused by the WesternHarbour Crossing. All streets east <strong>of</strong> Cotton Tree Drive are expected to operatewithin capacity during the morning peak period except for a few scattered linkswhich will be operating at capacity.6.8.3 <strong>The</strong> WHC would divert tunnel-related traffic away from the area, resulting ingenerally satisfactory operations through the existing Cross Harbour tunnel. However,it would make no improvement in east-west capacity and congestion would occuron several links, particularly between the I EC end and the existing Cross Harbourtunnel. <strong>The</strong> fact that most streets with capacity problems in 1996 without thecombined project are east <strong>of</strong> the tunnel suggests that the need for the iEC Link ismore critical than the Bypass. It is estimated that if the I EC Link alone were in placein 1996, it would carry about 38 000 pcus per day and relieve both Victoria Park andGloucester Roads.6.8.4 Economic evaluation indicated that both the Bypass and the IEC Link haveMEDIUM rates <strong>of</strong> return.6.8.5 <strong>The</strong> project would be built largely on the Central and Wan Chai Reclamation, andwould depend on the timing <strong>of</strong> this development. <strong>The</strong> current programme for thereclamation indicates staged development proceeding generally from east to west. Aconstruction programme consistent with the anticipated development is as follows:Island Eastern Corridor LinkCentral and Wan Chai Bypassearly to mid 1990smid to late 1990s6.8.6 Conclusions—<strong>The</strong> Centra! and Wan Chai Bypass and I EC Link will be required by2001 for east-west movements through the north shore <strong>of</strong> <strong>Hong</strong> <strong>Kong</strong> Island.Completion <strong>of</strong> the Western Harbour Crossing by the mid 1990s would allow theBypass to be deferred until the late 1990s. Completion <strong>of</strong> the IEC Link in the mid1990s would result in satisfactory traffic operations in the area, while deferral to thelate 1990s would result in congestion on sections <strong>of</strong> Gloucester and Victoria ParkRoads.6.9 Route 166.9.1 Route 16 is a proposed dual 2-tane expressway connecting Sha Tin with urbanKowloon. This facility would run roughly parallel to Tai Po Road. Route 16 isexpected to carry 48 000 pcus per day in 2001 and operate at about 60% <strong>of</strong> capacityin the morning peak. Route 5 would be relieved <strong>of</strong> about 25% <strong>of</strong> its volume and becongestion free. However, Tate's Cairn and Lion Rock tunnels would operateslightly above practical capacity. This is assuming equal tolls for all,tunnels linkingthe North-east New Territories to urban Kowloon corridor; modification <strong>of</strong> the tollstructure could improve the distribution <strong>of</strong> traffic among the tunnels.6.9.2 <strong>The</strong> HIGH Single Year Rate <strong>of</strong> Return on this project indicated that it is aneconomically worthwhile investment.6.9.3 <strong>The</strong> need for this project depends critically on the build-up in traffic movingbetween Kowloon and the North-east New Territories, and this will be affected bythe impact <strong>of</strong> traffic management policies (see Chapter 9). <strong>The</strong>refore, traffic growthshould be monitored to determine the appropriate timing <strong>of</strong> this project.6.9.4 Analyses indicated that the amount <strong>of</strong> relief provided by Route 16 to other tunnels inthe corridor depends on the connection <strong>of</strong> the project to the urban area in Kowloon.A detailed investigation would be required to address this issue.111
6.9.5 Conclusions— This is likely to be a worthwhile project for investment for the late1 990s, to provide relief to the Lion Rock and Tate's Cairn tunnels which could reachcapacity by the end <strong>of</strong> the century. More than most other projects, the need forRoute 1 6 depends critically on actual traffic growth.6.10 <strong>The</strong> RecommeodecS Highway6.1 0.1 <strong>The</strong> CTS-2 Study recommends a $20 billion (in 1 988 prices) construction programmefor highway projects for construction in the 1 990s. <strong>The</strong> programme is summarised inTable 6.4 and the locations <strong>of</strong> the major road projects are shown in Figure 6.3. It isnoted that preliminary design <strong>of</strong> some <strong>of</strong> the projects is in hand and the latest costestimates may be different from those shown in Table 6.4 due to various reasons,including site conditions, foundations and complexity <strong>of</strong> design.6.10.2 <strong>The</strong> recommended highway strategy includes the construction <strong>of</strong> three trunkhighways:(1 ) Route 3 from the Western District <strong>of</strong> <strong>Hong</strong> <strong>Kong</strong> Island to Yuen Long, via theWestern Harbour Crossing and northwards on new reclamation along the westside <strong>of</strong> the Kowloon peninsula, through Tsing Yi Island and then through theTai Lam Country Park, mostly in tunnel.(2) Route 7 on <strong>Hong</strong> <strong>Kong</strong> Island, extending from the current end <strong>of</strong> the IslandEastern Corridor in Causeway Bay through the planned Central and Wan ChaiReclamation to Western and round the coast to Aberdeen.(3) A new route which extends the Hung Horn Bypass from Tsim Sha Tsui, alongthe east side <strong>of</strong> the Kowioon peninsula, across the Hung Horn Bay Reclamationand under the airport in a Second Airport tunnel to an interchange with theKwun Tong Bypass now under construction.Recommended Highway Priorities6.10.3 , ......<strong>The</strong> Jilghest priority., js for Route 3. .(Western .......Harbour ......... Crossing), it is currentlyplanned as a 6-lane immersed tube tunnel connecting Western District on <strong>Hong</strong><strong>Kong</strong> Island with the west side <strong>of</strong> the Kowloon peninsula. It would requirecompletion <strong>of</strong> the southern arm <strong>of</strong> the West Kowioon Reclamation to provide aKowloon landfall.6.10.4 A section <strong>of</strong> Route 7 on <strong>Hong</strong> <strong>Kong</strong> Island from Sai Ying Pun to Kennedy Town isscheduled early to provide adequate connections for the Western Harbour Crossing.6.1 0.5 <strong>The</strong>Wesi^ be built on the planned West Kowloon Reclamation,is <strong>of</strong> high priority. However, current indications are that the reclamation cannotbe completed until' the late 1990s. Until then, the 4-lane elevated West KowloonCorridor highway, which is expected to be completed in the early 1990s, wouldserve as the main trunk road in West Kowloon.6.10.6 Early priority is given for the improvements to South Kwai Chung Road. Phases IIand ill <strong>of</strong> this scheme form part <strong>of</strong> Route 3, linking the West Kowloon Expressway tothe section <strong>of</strong> Route 3 on Tsing Yi Island. As a temporary measure in advance <strong>of</strong>completion <strong>of</strong> the West Kowloon Expressway, it is recommended that this project beextended south around the bottleneck <strong>of</strong> Lai Chi Kok bridge to connect with theWest Kowloon Corridor highway.6.10.7 Despite a high economic priority, the extensions <strong>of</strong> ..... Route 3 ..... fromjhe .....South KwaiChung Road Improvements northwards to Tsing Yi and then on ...... to Yuen Long arescheduled later in the highway programme, This is partly for funding reasons, andalso to avoid overloading the" ....... routes through West Kowloon before the WestKowloon Expressway can be completed in the late 1 990s.112
ROUTE 3Yau Kom Tau — Yuen LongROUTE 3Kwai Chung — Yau Kom TauROUTE 3Kwai Chung Road ImprovementROUTE 16" Sha Tin - Lai Chi KokROUTE 3West Kowloon ExpresswayROUTE 3Western Harbour CrossingROUTE 7Sai Ying Pun — Kennedy TownSecond Airport TunnelHung Horn BypassROUTE 7Kennedy Town — AberdeenIEC LINKCentral — Wan ChaiFigure 6.3MAJOR HIGHWAY PROJECT REQUIREMENTS
6.4(1988 Prices)ProjectLocFinancial Costs byConstruct/on Period (HK$ Million)Financial Early Mid. toCost 6 1990'S Late1990'S TotalMajor ProjectsIsland Eastern Corridor LinkRoute 7 (Kennedy Town-Aberdeen)Route 7 (Sai Ying Pun-K. Town) 1Central-Wan Chai BypassRoute 3 (Western Harbour Crossing)Route 3 (West Kowloon Expressway (South) ) 2Route 3 (West Kowloon Expressway (North) ) 3Hung Horn BypassSecond Airport TunnelRouteS (Yau Kom Tau-Yuen Long)Route 3 (Kwai Chung-Yau Kom Tau)Route 16HKHKHKHKKOWKOWKOWKOWKOWNTNTNT2931 4751 0051 46035052281 01937240028563278695293 01 0050350501 019372400 00001 47501 460 0228 000285632786952931 4751 0051 46035052281 01937240028563278695Medium ProjectsSecond Ap Lei Chau BridgeBoundary Street (East) FlyoversBoundary Street (West) FlyoversWaterloo Road FlyoverJordan/Gascoigne FlyoversLung Cheung Road 4Chatham Road FlyoverMan Kam To-NTCR ConnectorTexaco Road FlyoverFan Kam Road WideningKwai Chung Circumferential RoadRoute 5 (Shek Wai Kok-Chai Wan Kok)Road T4~Sha TinCastle Peak Road WideningMinor ProjectsGloucester Road FlyoverSmithfield St. ExtensionLung Cheung Road FlyoverNam Cheong Street WideningTai Po Road FlyoverChing Cheung Road WideningHiram's HighwayKam Tin Road WideningLam Kam Road WideningNT Circular Road WideningKam Tin Bypass (Phase 2)Hang Hau Road ImprovementRoute Twisk 5Notes:12345Sub-totalSub-totalSub-totalTotalHKKOWKOWKOWKOWKOWKOWNTNTNTNTNTNTNTHKHKKOWKOWKOWKOWNTNTNTNTNTNTNT1658626313324213318426210211614414513122817721824782184601254674495863328 587649197136594263133 0133184000144145^0 0 01 002218460 12004495863328 0747080669992024200262102116001312281772181 47600054670000058017911 6471658626313324213318426210211614414513122817721824782184601254674495863328 58764919713Includes Biecher's Bay Link.South <strong>of</strong> Tonkin Street. Costs Assume at-grade facility.North <strong>of</strong> Tonkin Street. Includes South Kwai Chung Road, Phases II and III. In 1996 only, also includes proposedMei Foo Bypass.Includes three improvement projects from Butterfly Valley Interchange to Waterloo Road Interchange.This project is included in the construction programme but was not evaluated economically.Government cost to construct project; construction costs in 1988 dollars: land costs excluded.114
6.10.8 <strong>The</strong> two recommended projects in the East Kowloon Corridor, the Hung HornBypass extension and the Second Airport tunnel, are recommended for constructionin the early 1990s. <strong>The</strong> recommendation on the Second Airport tunnel is subject toresolving the engineering problems <strong>of</strong> tunnelling through the difficult groundconditions <strong>of</strong> the Kai Tak reclamation while maintaining runway operations, Atunnel would not, <strong>of</strong> course, be needed if the airport is to be relocated but additionalroad capacity would still be required.6.10.9 <strong>The</strong> Central and Wan Chai Bypass project is scheduled for the late 1990s on thebasis <strong>of</strong> traffic operation and availability <strong>of</strong> funding. It is likely that the opening <strong>of</strong> theWestern Harbour Crossing could give adequate traffic relief to Central and Wan Chasuntil the late 1990s. This indicates that the Central and Wanchai Reclamation has alower priority than the West Kowloon Reclamation from the point <strong>of</strong> view <strong>of</strong> theprovision <strong>of</strong> new highways.6.10.10 <strong>The</strong> extension <strong>of</strong> Route 7 from Kennedy Town to Aberdeen is an expensive project.Also it is expected to contribute significantly to the usage <strong>of</strong> the Western HarbourCrossing and the highways in West Kowloon. <strong>The</strong>refore, in order to avoid overloadingthe West Kowloon Corridor in advance <strong>of</strong> the completion <strong>of</strong> the West KowloonExpressway, this project is programmed for a start in the late 1990s. Current thinkingnow appears to indicate a lower population growth for South-west <strong>Hong</strong> <strong>Kong</strong>Island and this would reinforce the proposed timing, although a possible decision torelocate the airport in the southern part <strong>of</strong> the Western Harbour could influence thisdecision the other way.6.10.11 <strong>The</strong> recommended highway investment programme also includes the Route 16project, a major highway linking West Kowloon with the North-east New Territories.On current forecasts <strong>of</strong> traffic, the completion <strong>of</strong> Route 16 would be desirable by2001 to give relief to the Lion Rock and Tate's Cairn tunnels which are expected tobe near capacity by then. However, the timing <strong>of</strong> Route 16 depends very much onthe growth <strong>of</strong> traffic demand and the extent to which the growth <strong>of</strong> goods vehicletraffic can be controlled. <strong>The</strong> project has been tentatively programmed for completionby the late 1990s. Apart from timing, the southern end <strong>of</strong> this route and the way itshould connect into urban Kowloon requires detailed investigation.6.10.1 2 <strong>The</strong> highway programme specifies many other road improvements in the urban areain the form <strong>of</strong> flyovers and road widenings. Rural road projects in the New Territoriesare included only partially on traffic grounds; in most cases, the existing roadsrequire re-alignment and roadbed reconstruction in order to meet modern designstandards. <strong>The</strong> programming <strong>of</strong> all these projects is recommended according to theschedule given in Table 6.4.Highway Funding6.10.13 <strong>The</strong> highway investment programme for the early 1990s fits with Governmentexpenditure guidelines. <strong>The</strong> programme also allows an additional 25% on top <strong>of</strong> thefunds indicated in Table 4 for other projects such as access roads, footbridges andtransport termini. <strong>The</strong> investment programme for the late 1990s is a little moretentative; much depends on the growth <strong>of</strong> the economy, the changing pattern <strong>of</strong>land use to meet new policies and requirements, other competing demands onpublic expenditure and pressures on the construction industry.6.10.14 <strong>The</strong>re are clearly some possibilities for private participation in new highway projects,similar to the present projects <strong>of</strong> the Eastern Harbour Crossing and the Tate's Cairntunnel. However, it is assumed that this will not expand the total funds for highwayconstruction but merely be a substitute for public funding.Further Studies6.10.15 Most <strong>of</strong> the candidate highway projects evaluated by CTS-2 were developed fromconceptual schemes identified in previous studies. For CTS-2, they were defined in115
sufficient detail to permit computer testing and evaluation. Detailed feasibilitystudies would be required for ail selected projects prior to design and construction.6.10.16 Although currently committed highway projects are expected to absorb availablefunding until at least 1992, detailed planning and design <strong>of</strong> new projects shouldcommence immediately.116
7. OF7.1 introduction7.1.1 Over the last ten years, travel in the Territory has been transformed by the opening<strong>of</strong> the Mass Transit Railway, (MTR), the modernisation <strong>of</strong> the Kowloon-CantonRailway (KCR) and, most recently, by the opening <strong>of</strong> the Light Rail Transit (LRT)system linking Tuen Mun and Yuen Long. Between them, these rail systems nowcarry over 25% <strong>of</strong> all public transport passengers who formerly were almost totallydependent on bus or ferry. <strong>The</strong> patronage <strong>of</strong> the rail system continues to grow andsome sections are now under heavy pressure during the critical peak hour periods.This chapter examines the case for new rail lines to alleviate this congestion and t<strong>of</strong>urther extend passenger rail services.7.1.2 Although purely local freight movements are too short to benefit from rail services,railways do have a role in carrying international freight to and from China. Analysis<strong>of</strong> international rail freight services is highly specialised and was not included as part<strong>of</strong> the CTS-2 Study. However, proposals for new freight rail lines were examined fortheir potential to permit passenger services.7.2 <strong>The</strong> Existing Railway System7.2.1 Figure 7.1 shows the various lines which make up the existing railway system. <strong>The</strong>five rail systems operating in the Territory are, in order <strong>of</strong> age:<strong>The</strong> Peak Tramway (1 888)<strong>Hong</strong>kong Tramways (1904)<strong>The</strong> Kowioon-Canton Railway (1910)<strong>The</strong> Mass Transit Railway (1979)<strong>The</strong> North-west Railway (1988)7.2.2 System characteristics are briefly summarised in Table 7.1. Past traffic growth, asdiscussed in Chapter 5, and CTS-2 traffic projections are illustrated in Figure 7.2.This projections assume no new rail projects in addition to the currently committedEastern Harbour Crossing and the Regional LRT system in NWNT and exclude thelow volumes carried by the Peak Tram. Projected growth in rail patronage is strong,which continues the recent trends in the growth <strong>of</strong> rail passenger transport. This canbe attributed to several factors but the most important are:(1) a projected strong growth in personal incomes averaging over 5% per year inreal terms over the projection period results in higher travel demand and makesrail services affordable for an increasing proportion <strong>of</strong> the population(2) the rate <strong>of</strong> increase <strong>of</strong> bus fares is likely to be faster than rail fares, due toincreased labour costs having greater impact on the more labour intensive busoperations(3) the reliability and comfort <strong>of</strong> the rail mode and its relatively shorter journey timethan buses7.2.3 Only the MTR, KCR and LRT are considered in this chapter.Kowloon-Canton Railway (KCR)7.2.4 <strong>The</strong> Kowloon-Canton Railway (KCR) was constructed in 1910 as a single track lineserving freight and passengers. Until 1975, the Kowloon terminus was located nextto the Star Ferry but it was moved in that year to the current terminus at Hung Horn.By the late 1970s, daily patronage within the Territory was running at about 40 000passengers per day.117
LEGENDMTR £_EHC LRT(under vL} construction )KCRHK TramwaysPeak TramFigure 7.1EXISTING RAILWAY SYSTEM
3000FIGURE 7.2: GROWTH IN DAILY RAIL PASSENGERSThousandsPast Trends And CTS-2 Projections(assuming no new2500-2000-MTR15001000500KCRLRTI I I I I I I I I 1 1 I78 80 82 84 86 88 90 92 94 96 98 2000Trips For MTR And KCRBoardings For Tram And LRT119
7.1Peak Tram<strong>Hong</strong> <strong>Kong</strong>TramwaysKowloon-CantonRailway (KCR)Mass TransitRailway (MTR)Light RailTransit (LRT)System length (km)1.416.334.038.623.4Track gauge15241067143514321435ElectrificationElectrically poweredcable railway500VOverhead25KvACOverhead1 500V DCOverhead750V DCOverheadRolling stock:Number/configurationPassenger capacity 1Routes operatedAdult fareAverage daily Passengers carried3 single-deck cars72 per carCentral to <strong>The</strong> Peak$5.00-6.0070001 63 double-deck trams1 39 per car6 routes betweenShau Kei Wan andKennedy Town$0.60360 000703-carEMUs290 per car 2Hung Horn to Lo Wu$2.00-$1 7.50422 000622 cars in 8-car trains375 per car 2Tsuen Wan to CentralKwun Tong to Yau Ma TeiChai Wan to Sheung Wan$2.50-$6.001 721 00070 cars230 per car 22 within Tuen Mun3 between Tuen Munand Yuen Long$1 .50-$2.401 59 000 31 Crush capacity-2 Based on current seating capacity and allowing standees at a density <strong>of</strong> about 7 per square metre3 LRT started operation in September 1988 and carried 159 000 passengers daily in December 1988
7.2.5 in order to better serve the developing new towns <strong>of</strong> the. North East NewTerritories—-Sha Tin, Tai Po, Sheung Shui and Fanling, a decision was made in 1 978tc5nrfocrBIeTrack and electrify the Sine. <strong>The</strong> Kowloon-Canton"'Raiiway Corporation(KCRC) was formed in 1983 to take over the operation <strong>of</strong> the line from Government.<strong>The</strong> first electric trains ran in 1982 and daily patronage has since increased ten-foldfrom pre-electrification levels to about 400 000 passengers per day in 1 988.7.2.6 Patronage is expected to continue to increase as the population growth <strong>of</strong> the NewTerritories continues, doubling the 1986 volumes by the end <strong>of</strong> the century. Withadditional rolling stock and improved signalling, these line volumes are manageable,although platform access at some stations would need improvement. Several railprojects were considered by CTS-2 to extend KCR passenger services; these arediscussed later in this chapter.Mass Transit Railway (MTR)7.2.7 Construction <strong>of</strong> the MTR started in 1975 based on plans initially proposed in the late1960s. <strong>The</strong> first line between Kwun Tong in Kowioon and Central on <strong>Hong</strong> <strong>Kong</strong>Island was opened in stages between October 1979 and February 1980. Two furtherlines have since been opened: the Tsuen Wan Line in 1982 and the <strong>Hong</strong> <strong>Kong</strong>Island Line in 1985 (extended in 1986). <strong>The</strong> Kwun Tong line is currently beingextended across the harbour to Quarry Bay as part <strong>of</strong> the Eastern Harbour Crossingand is due to open in 1 989.7.2.8 <strong>The</strong> MTR currently carries some 1.8 million passengers per day and growthcontinues to be strong. Demand is particularly high in the morning and evening peakhours when the Nathan Road Corridor section <strong>of</strong> the Tsuen Wan Line reaches itscapacity, it is expected that the opening <strong>of</strong> the Eastern Harbour Crossing willalleviate the overloading problem for a while but traffic in that corridor is expected toreturn to the current levels in the early 1990s. CTS-2 examined several projects toextend the MTR and to provide additional capacity in the urban areas; these arediscussed later in this chapter.7.2.9 If no new lines are built to relieve congestion, management measures to regulatedemand during the peak periods may have to be considered. Also, fare adjustmentscould be made to encourage maximum use <strong>of</strong> the Eastern Harbour Crossing. <strong>The</strong>sesubjects are discussed in greater detail in Chapter 8.Light Rail Transit (LR T)7.2.10 <strong>The</strong> North-west Railway, known more familiarly as the LRT (Light Rail Transit), isthe most recent addition to the rail services, opening in September 1988. it isoperated by KCRC within a defined Transit Service Area (TSA) linking the two newtowns <strong>of</strong> Tuen Mun and Yuen Long and providing services within those towns.Communities within the TSA located away from the tracks are served by feederbuses to the LRT, also operated by KCRC and by minibus and taxi services.7.2.11 <strong>The</strong> 23 kilometre system has been built entirely at-grade, mostly in separate roadsidereservations but with some street running in housing estates. Stops are relativelyclosely spaced (at about every 580 metres) and journey speeds averaged 20 km/hon opening.7.2.12 <strong>The</strong> LRT patronage has increased steadily since opening, but it is too early tocomment on the overall performance. Extensions are planned within the TransitService Area, in particular linking in the New Town <strong>of</strong> Tin Shui Wai and the newhousing estates to the south-east <strong>of</strong> Tuen Mun. <strong>The</strong> complete LRT system isexpected to carry over 500 QQCtpassengers per day by 2001, compared with about160 000 at the end <strong>of</strong> f98a , ' ~ "7.2.13 CTS-2 did not examine any further additions to the LRT within the existing TransitService Area but did examine possibilities for linking the LRT to the main urban areaas well as the potential for LRT services in other parts <strong>of</strong> the Territory. <strong>The</strong>se arediscussed later in this Chapter.121
MTR/KCR Interchange7.2.14 A key transport interchange is that between the KCR and MTR at Kowloon long. In1986, it was estimated that 77000 persons per day changed between MTR andKCR lines at this station; this volume grew to 130000 by 1988. <strong>The</strong> rapid recentgrowth can be attributed to a number <strong>of</strong> factors, including continuing development<strong>of</strong> the Northeast New Territories, and recent increases in train frequency and in thenumber <strong>of</strong> carriages assigned to trains. However, it is also probably linked to achange in travel mode brought about by road congestion on the Lion Rock andCross-harbour tunnels. <strong>The</strong> opening <strong>of</strong> the Eastern Harbour Crossing in 1989 andthe Tate's Cairn tunnel in 1991 should therefore bring some relief to the situation.7.2.15 It is not certain how further growth in interchanging passengers beyond the levelreferred to above could be accommodated; expensive re-construction would berequired and engineering feasibility for this has not yet been established. New urbanrail lines providing alternative locations for an KCR/MTR interchange would providean answer; some rail projects which would relieve the Kowloon Tong interchangeproblem are evaluated later in this chapter.7.3 Rail Evaluations7.3.1 CTS-2 examined a large number <strong>of</strong> new rail projects, both extending the rail systemto major communities not yet reached by rail, and supplementing the rail servicesalready serving the main urban area. In deciding whether or not to recommend aninvestment in an expensive project such as a railway line, it was necessary to weighall the factors involved in an objective manner. <strong>The</strong> key factors are summarised inthis section.Projected Patronage7.3.2 Clearly the likely patronage <strong>of</strong> a new rail line is crucial to the evaluation. Patronagedepends on many things, including:(1) the size and density <strong>of</strong> population and employment centres served by the newline(2) fare levels and whether passengers are able to pay the fares(3) relative travel times and fares by alternative means <strong>of</strong> transport(4) the general propensity to travel by rail which is linked to the comfort, reliabilityand convenience <strong>of</strong> rail relative to other modes7.3.3 Ail these factors are accounted for in the computerised CTS transport model (seeChapter 2) used to prepare the passenger projections.Light or Heavy Rail7.3.4 Rail systems are <strong>of</strong>ten classified as either light' or 'heavy'. A heavy rail system impliesstandard gauge tracks in a segregated right-<strong>of</strong>-way, limited stops at fully providedstations, high speed running, control by sophisticated signalling, and long trainswith high passenger carrying capacity. Both the MTR and KCR are heavy railsystems.7.3.5 Almost any rail system built to lower standards than heavy rail is classified as a lightrailway, <strong>The</strong> technical attributes are hard to define as the mode occupies a broadspectrum between the street tramway (such as the <strong>Hong</strong>kong Tramways) and fullheavy rail. Typically, though, light rail systems imply short trains (<strong>of</strong>ten singlevehicles), rail tracks laid in or by the side <strong>of</strong> roads, frequent halts at stops littledifferent from bus stops, speeds similar to that <strong>of</strong> other traffic and driver controlbased on traffic conditions and ordinary traffic signals.7.3.6 Heavy rail systems are expensive, especially in urban areas, since tracks must besegregated <strong>of</strong>ten requiring overhead or underground construction and both curves122
and gradients must be gentle to permit reasonable operating speeds. <strong>The</strong>y arenormally only justified when traffic volumes reach over 20 000 passenger per hourone-way but can handle volumes <strong>of</strong> up to 80-90 000 per hour.7.3.7 Light rail systems are cheaper, being mostly at-grade and able to tolerate tightercurvatures and steeper grades. Capacity is normally limited to between 20 000 and30 000 passengers per hour (depending on the character <strong>of</strong> the system) but can beoperated economically at lower volumes.7.3.8 <strong>The</strong> distinctions between light and heavy rail blur when considering inter-urbanrailways. For example, on the Northwest New Territories urban link discussed inSection 7.6 later in this chapter, the light rail and heavy rail alternatives previouslyproposed for this line (in studies by MTRC and KCRC) both required relatively fasttrains on segregated tracks with full signalling systems. <strong>The</strong> light rail alternativeshould be somewhat cheaper to build by permitting sharper curves and steepergradients but the principal difference lies in the trains used and passenger carryingcapacity <strong>of</strong>fered.7.3.9 This report considers inter-urban light rail to be limited to 4-car trains using similarvehicles to those used in the recently opened North West Railway, and heavy rail tobe similar in characteristics to the current MTR 8-car trains. Detailed feasibilitystudies could pr<strong>of</strong>itably investigate intermediate designs.7.3.10 Apart from variations in the light and heavy rail options, a wide variety <strong>of</strong> alternativeguided transit systems are available, such as monorails and magnetic levitationsystems. Some have been advocated in <strong>Hong</strong> <strong>Kong</strong> in the last decade, but nonehave been implemented. Such systems are unlikely to have sufficient capacity toserve the main urban corridors, but could find a role for some specialised applicationsat the district level. <strong>The</strong>se should be investigated, where appropriate, in regional anddistrict studies.Rai/^Capsnity.7.3.11 <strong>The</strong> capacity <strong>of</strong> a rail line to carry passengers depends on four critical factors:(1) Passenger carrying capacit/<strong>of</strong> a rail car(2) Maximum train lengtjv'(3) Minimum operating headway"(4) Proportion <strong>of</strong> passenger demand-occurring in the peak7.3.12 <strong>The</strong>se factors vary according to the type <strong>of</strong> rail system under consideration anddepend entirely on the assumptions made on passenger comfort. <strong>The</strong> Studyassumptions are specified below for the main systems <strong>of</strong> MTR, KCR main line, andLRT:DesignNormalOne-way Two-way One-way Two-way(per hr) (per day) (per hr) (per day)MTR (urban area)—low 60 000 570 000 75 000 700 000MTR (urban area)—high 60 000 670 000 75 000 830 000MTR (urban link to NWNT) 60 000 545 000 75 000 680 000KCR (current) 1 50 000 455 000 58 000 530 000KCR (future) 1 76 000 690 000 86 000 780 000LRT (region system) 1 19200 215000 22800 250000LRT (urban link to NWNT) 1 1.9 200 175J300- 22 800 21QJMXX1 <strong>The</strong>se capacities could be further increased by reducing seating provision7.3.13 Low and high capacities are indicated for MTR since much depends on passengermovement characteristics, <strong>The</strong> low values indicate strong directional bias by time <strong>of</strong>123
day, particularly in the peak hour. This bias prevails over much <strong>of</strong> the system andis currently even lower on sections <strong>of</strong> the Island Line. <strong>The</strong> high values apply onsections such as the northern end <strong>of</strong> the Tsuen Wan Line where flows are betterbalanced by direction.7,3.14 Design capacities allow for comfortable passenger conditions (standees at 4-5 persquare metre) even in the peak hour and should be used for planning new lines.Normal capacities assume crush loadings (standees at 7 per square metre) for shortperiods in the peak hour and can be used to assess a reasonable maximum loadingfor an existing line. Passenger loadings can certainly go well beyond thesecapacities but passenger comfort and piatform safety deteriorate, and it becomesmore difficult to maintain operating frequencies due to the additional time taken toload and unload trains.Costs <strong>of</strong> Project Implementation7.3.1 5 <strong>The</strong>re are three principal costs involved in implementing a new rail line:(1) construction costs, including ail civil, mechanical and electrical engineeringcomponents together with land costs(2) costs <strong>of</strong> rolling stock(3) annual operating costs, including costs <strong>of</strong> operating and administrative staff aswell as costs <strong>of</strong> maintenance <strong>of</strong> infrastructure and equipment7.3.16 Estimates <strong>of</strong> these costs were provided by the rail corporations for each <strong>of</strong> theprojects evaluated.Passenger Revenues7.3.17 Passengers pay fares to use the rail system and these accrue as revenues to the railoperators, <strong>of</strong>f-setting the costs <strong>of</strong> rail operations. In some cases, the introduction <strong>of</strong>a new rail line will cause changes in other rail operator revenues; in all cases, a newrail line will adversely affect the revenues <strong>of</strong> non-rail public transport operators.Passenger Travel Times7.3.18 Rail services generally result in faster travel times, especially in the central urban areaon segregated tracks. <strong>The</strong> time savings <strong>of</strong> passengers is an important benefit <strong>of</strong> arailway line and can be quantified by applying standard values <strong>of</strong> time which arerelated to income levels. <strong>The</strong> value <strong>of</strong> time is projected to rise in the future withincreasing real incomes.Cost Savings for Other Transport7.3.19 <strong>The</strong> introduction <strong>of</strong> a new rail line takes passengers away from other public transportservices and the operating costs <strong>of</strong> these services will reduce. For example, less buskilometres will be run on the roads because <strong>of</strong> the reduced demand and also the fleetsize can be reduced to run the remaining services. <strong>The</strong>se operating cost savings are avery important element <strong>of</strong> the total rail project benefits.7.3.20 With passengers removed from major road-based public transport services and theconsequent reduction in buses on the road, traffic conditions are made easier for theremaining buses and other road users—cars, taxis and goods vehicles. With easiertraffic conditions, operating costs <strong>of</strong> land-based transport services are reduced andtravel times improve. Generally speaking, however, these road user cost savings arefairly small compared with the savings in public transport operating costs and traveltime.Financial Evaluation7.3.21 <strong>The</strong> simplest but harshest test <strong>of</strong> a .new passenger railway is whether or not it isfinancially viable; that is to say, whether the passenger fare revenues alone are124
sufficient to pay for the costs <strong>of</strong> constructing, equipping and operating the line.Generally speaking, a potential new operator will compare the expected annualoperating surplus (fare revenues, less operating costs, less an allowance fordepreciation) with the capital investment to identify the financial return on thatinvestment. As a fully viable commercial project, the new line should generate afinancial internal rate <strong>of</strong> return <strong>of</strong> about 10% to 12% over an investment period <strong>of</strong>10-15 years. However, expected commercial returns contain an element to coverinflation which was specifically excluded from CTS-2 projections <strong>of</strong> costs andrevenues. Stripping out the inflation-coverage element, a reasonable financial returnfor an operator is probably in the range 4% to 8% in real terms.7.3.22 If a new rail line cannot be fully financially viable, some support will be required if itis to be built. This can come in a variety <strong>of</strong> ways. A desirable minimum financialcriterion, however, is that the operating surplus is at least positive; that is to say thatrevenues from passengers cover at least the costs <strong>of</strong> rail passenger operations androlling stock depreciation.Economic Evaluation7.3.23 While a project may not be financially viable as a commercial venture for a privateoperator, jt might have considerable advantages from the point <strong>of</strong> view <strong>of</strong> thecommunity as a whole. That is to say, taking into account the total economicresources consumed by all modes <strong>of</strong> travel and the overall savings in passengertravel'time, it may be more cost-effective for the community to construct a railwayrather than continue to rely on other modes <strong>of</strong> public transport services. In thiscase, and in the absence <strong>of</strong> full financial viability, it may then be worthwhile forGovernment to support the construction <strong>of</strong> new rail lines.7.3.24 <strong>The</strong> economic evaluation seeks to address this issue. <strong>The</strong> calculation is similar to thatfor financial viability but replacing fare revenues by estimated cost and time savingsover other modes <strong>of</strong> transport (identified in paragraphs 7.3.17 to 7.3.20 above) tojustify the project. For the purpose <strong>of</strong> CTS-2, an economic internal rate <strong>of</strong> return <strong>of</strong>4% in real terms over an operating period <strong>of</strong> 20 years is taken as the minimum foreconomic viability.Environmental Considerations7.3.25 Generally speaking, railways have considerable environmental advantages overroad-based public transport. In particular, by using electric power, railways reducethe air pollution associated with buses and taxis. However, elevated rail lines can bevisually intrusive and, <strong>of</strong> more concern, can be a significant source <strong>of</strong> noise.Limitations <strong>of</strong> Other Modes7.3.26 If public transport has to be dependent on road-based services, essentially buses,minibuses and taxis, there is a limit to the total passenger volumes that can becarried. This limit is set not so much by the road space required for moving vehiclesbut more by the requirements to set down and pick up passengers. A mass transitrailway can carry and deliver far higher volumes than road-based bus services. <strong>The</strong>limits to road-based public transport capacity are difficult to determine but can becrucial in determining the need for railways, especially in very dense urban centres.Implications for Other Public Transport Operators7.3.27 <strong>The</strong> <strong>Hong</strong> <strong>Kong</strong> public transport system is made up <strong>of</strong> a number <strong>of</strong> independent andprivately owned transport operators combined with two rail corporations (MTRCand KCRC) which are operating along commercial principles. While competitionbetween the operators is an important feature <strong>of</strong> <strong>Hong</strong> <strong>Kong</strong> public transport, thereis also Government coordination <strong>of</strong> their operations to obtain the best blend <strong>of</strong>services. This means that the impact <strong>of</strong> new rail lines on established routes andoperators must also be taken into account in the evaluation.125
Impacts on Urban Development7.3.28 <strong>The</strong> introduction <strong>of</strong> a new railway can lead to city centre development which couldnot otherwise occur through lack <strong>of</strong> transport capacity. For'"example, it "is clMbtfOlwhether the expansion <strong>of</strong> Central District over the past few years could have beensupported without the presence <strong>of</strong> the Mass Transit Railway and serious questionsmust be raised about the extent <strong>of</strong> future development on planned reclamationswithout new rail access.7.3.29 New and improved rail lines can undoubtedly spur the development <strong>of</strong> ...newcommunities in the New Territories by making them more attractive places to,live.'-However, by Integrating the new towns "into the main urban transport system, thechances <strong>of</strong> developing the new towns as self-contained communities away from theexisting urban centres will be weakened.7.3.30 Development impacts are clearly important and it is desirable that the decision toconstruct a rail project be integrated with the planning and development<strong>of</strong> , r citycentres and new communities.Uncertainty <strong>of</strong> Future Development7.3.31 <strong>The</strong> Study used a set <strong>of</strong> population and employment projections by region formaking traffic forecasts. <strong>The</strong>se were made considering plans for new developmentareas, both in the New Territories and in the urban area. Development plans havechanged substantially in the past even during the course <strong>of</strong> this Study, and it mustbe expected that they will change again in the future as investigations <strong>of</strong> developmentpotentials continue. <strong>The</strong>refore, it is important to assess the impact <strong>of</strong> assumptions onnew developments on the outcome <strong>of</strong> the project evaluations and thus identify thedegree <strong>of</strong> certainty attached to the evaluation results.Protection from Congestion7.3.32 Without in the least detracting from the efforts to control the growth <strong>of</strong> trafficcongestion, it must be recognised that this is going to be an increasingly difficulttask over the coming years if the prosperity <strong>of</strong> the Territory and resulting transportexpectations <strong>of</strong> the population continue to rise. New rail lines in the urban area <strong>of</strong>ferthe prospect <strong>of</strong> acceptable travel conditions even when traffic jams block the roads;to this extent, expensive rail lines and unpopular traffic restraint measures can beconsidered as parallel approaches to the urban traffic problem.Implementation Capability7.3.33 <strong>The</strong> implementation <strong>of</strong> a complex rail project is a sophisticated exercise and thesuccess <strong>of</strong> rail projects in some communities has been undermined by basic inabilityto carry through the project to a sound overall plan and time scale. However, <strong>Hong</strong><strong>Kong</strong> has demonstrated the ability to implement major railway projects to the extent<strong>of</strong> being counted as a world leader in this field. This is therefore not an issue in<strong>Hong</strong> <strong>Kong</strong>.7.4 Candidate Railway Projects7.4.1 <strong>The</strong> new rail projects evaluated by CTS-2 are shown in Figure 7.3. <strong>The</strong>y wereconceived with a variety <strong>of</strong> different objectives. Some would provide links to theremaining major existing or planned population centres not yet connected to the railsystem. <strong>The</strong>se include the lines to Junk Bay, Tuen Mun, Yuen Long/Tin Shui Wai,IVIa On Shan and Aberdeen. Other lines would provide additional rail capacity forcertain critical rail corridors. <strong>The</strong>se include the urban area cross-harbour links, theKCR main line extension to Tssm Sha Tsui and Sheung Wan, and the Diamond Hillto Sha Tin light rail line.126
NWNT URBAN LINKYuen Long — FanlingNWNT URBAN LINKYuen Long — Tai Wo(can possibly be Heavy Rail)NWNT URBAN LINKTsuen Wan — Yuen Long(can possibly be Light Rail)NWNT URBAN LINKTsuen Wan — Tuen Mun(can possibly be Light Rail)Mong Kok — Tsim Sha Tsui— Sheung VVaniYau Ma Tei — Sheung WanSha Tin — Lai KingSha Tin — Ma On ShanEAST KOWLOON LINEDiamond Hill — Sha Tin(can possibly be Light Rail)EAST KOWLOON 1INERumsey — DiamondJunk Bay ExtensionGreen Island ExtensionEAST KOWLOON LINEAberdeen — Rumsey(can possibly be Light Rail)Aberdeen — Admiralty*"'"ILEGENDHeavy RailLight RailFigure 7.3NEW PASSENGER RAIL LINES
7.4.2 <strong>The</strong> East Kowloon Line would serve both the functions identified in the previousparagraph by linking Aberdeen to the urban area rail system and by relieving boththe Beacon Hill and Cross-harbour rail corridors. It would also open up the easternside <strong>of</strong> the Kowloon Peninsula to rail access, thus completing the original scheme<strong>of</strong> the Mass Transit Railway.7.4.3 In addition to these passenger rail lines, the Study also considered the possibility <strong>of</strong>running passenger services along a proposed raii freight line from Sha Tin to KwaiChung.7.4.4 Some projects would preclude others; for example, three projects are in competitionto use the rail reserve from Hung Horn to Tsim Sha Tsui—the East Kowloon Line, theYau Ma Tei to Sheung Wan cross-harbour link the once planned, and the KCRextension to Tsirrs Sha Tsui. Other rail lines, while not physically exclusive, are clearlyrival projects; for example, it is unlikely to be worthwhile to build both a light and aheavy rail line to Aberdeen.7.4.5 Other projects have alternative configurations. In particular, the North West NewTerritories Urban Link projects could be run as either a rail shuttle to and from theexisting railhead, or as an extension to existing rail lines.7.4.6 <strong>The</strong>re are many potential rail projects within the urban area not identified in Figure 7.3which could be tied to the plans for urban renewal projects or new harbour reclamationscurrently under consideration. <strong>The</strong>se could be entirely separate projects fromthose identified in Figure 7.3, or modifications <strong>of</strong> them. <strong>The</strong> CTS-2 Study did notinvestigate these alternatives mainly because they depend upon the outcome <strong>of</strong>technical feasibility studies <strong>of</strong> reclamations now underway. At best, these are projectsfor the late 1990s at the very end <strong>of</strong> the current CTS-2 planning period. <strong>The</strong>y will beexamined more closely in the updating <strong>of</strong> the CTS-2 (see Chapter 10). Commentsare made on the urban rail extension problem later in this chapter.Evaluation <strong>of</strong> Candidate Rail Projects7.4.7 Table 7.2 summarises the construction costs (in 1988 prices), basic operatingcharacteristics and economic evaluation results for each <strong>of</strong> the candidate railprojects. Construction costs include the costs <strong>of</strong> land associated with each project.Operating characteristics and costs apply to projected operations in the year 2001.7.4.8 <strong>The</strong> financial evaluation indicates the operators' financial return on initial constructioninvestment in the years 1996 and 2001. Financial return is defined as the annualoperating surplus (revenues from passenger fares less operating costs less depreciationon fixed assets) expressed as a percentage <strong>of</strong> initial construction costs.7.4.9 <strong>The</strong> economic evaluation indicates the community return or total annual communitybenefits on total investment in the years 1996 and 2001. This is the savings in costs <strong>of</strong>other modes and savings in passenger travelling time expressed as a percentage <strong>of</strong>the total initial investment; the construction costs plus cost <strong>of</strong> rolling stock. Sincetime savings normally constitute a large proportion <strong>of</strong> the total benefits, results arepresented for two cases; (i) assuming full time savings, and (ii) assuming only onethird <strong>of</strong> the estimated time savings to reflect a lower valuation <strong>of</strong> time and to avoid theevaluation being heavily biased by this type <strong>of</strong> benefit.7.4.10 Rather than reporting specific percentages, returns are classified as follows:Negative Less than 0%Low0%to4%Medium 4% to 8%High Over 8%7.4.11 On the basis <strong>of</strong> the economic and financial criteria discussed in paragraphs 7.3.21 to7.3,24, a LOW classification indicates returns below those required for viability, aMEDIUM classification indicates the project is possibly viable, while a HIGH returnindicates a good possibility <strong>of</strong> full viability. It must be clearly understood that theseare indicators only, and that detailed financial and economic analyses would berequired to establish the economies and financing <strong>of</strong> selected projects.128
7.2 OFro CDProjectHeavy Rail ProjectsMTR Junk Bay Extension:Lam Tin to Junk BayJunk Bay to <strong>University</strong>NW New Territories Urban Link 5 :Tsuen Wan to Yuen LongTsuen Wan to Tuen MunMTR Island Line Extension:Sheung Wan to Kennedy TownGreen Island LoopMTR East Kowloon Line:Aberdeen to Sheung WanSheung Wan to Diamond HillDiamond Hill to Sha TinAberdeen to Sha TinMTR Harbour Crossings:Yau Ma Tei to Sheung WanYau Ma Tei to FortressKCR System Extensions:Sha Tin to Kwai FongMong Kok to Star FerryMong Kok to Sheung WanLight Rail ProjectsNW New Territories Urban Link:Tsuen Wan to Yuen LongDiamond Hill to Tai WaiMa On Shan to Tai WaiAdmiralty to AberdeenKey to economic returns:Pop 1CentHigh*CentHighCentHigh— = Not investigateNEG = Negative returnLOW(L) = 0% - 4%MED(M) = 4% - 8%HIGH(H) - over 8%LineLength(kms)5.92.71 2.616.62.46.47.79.26.523.44.83.97.52.44.412.516.75.510.86.4FinCost($ mils) 222991 2362924462932503692544211 575254819565487935913401 8715222222437801 30923143200DailyPass.(ths)27433420273355400460212291253424402361250353105168220159210155246902001 Operations Economic EvaluationPeak NumberHead Trains 3-way(mins)1 Population assumed—centra! projection unless otherwise stated2 Total financial cost in 1988 prices3 Expressed in terms <strong>of</strong> the number <strong>of</strong> 8-car trains for MTR, 3-car EMUs for KCR, single cars for light rail.4 With Junk Bay Phase Ml5 Could be operated by KCR or MTR—evaluation assumed MTR operation.4344332.5222.52.52.54333 32.52222.56828121919341014832468 9660964813630Fin operCost perpass-km(cents)18.116.4161.37.36.26.45.652.319.020.315.79.714.912.511.411.724.018.78.97.110.18.836.1FinancialWith fullWith 113rdEvaluationtime savings time savings1996 2001 1996 2001 1996 2001(single year returns, see footnotes for ranges)M MH HHHM LMMMHHHHHLLHHHHHHHMMHHHHHLLHMMMLMLMLLMMH HHHMLM LLMLMMHLLLLNEGMMNEG LH LLMMMLLLLNEGMHMLLLLNEGLHLLMMHLL
7.4.1 2 Both the financial return and the community return as defined above are single yearvalues for operation in the two years 1996 and 2001. Comparison <strong>of</strong> the values forthe two years indicates the impact on viability <strong>of</strong> postponing construction from theearly 1990s to the late 1990s. For selected projects, a lifetime evaluation over anoperating period <strong>of</strong> 20 years was also undertaken; these are reported individually.7.4.1 3 Each individual candidate rail project is now reported on in Sections 7.5 to 7.14.7.5 MTR Junk Bay Extension7.5.1 An extension <strong>of</strong> the MTR system has featured in the planning <strong>of</strong> Junk Bay NewTown from the beginning. <strong>The</strong> current proposal is for a branch from the Kwun TongLine, starting from the Lam Tin Station now under construction as part <strong>of</strong> the EasternHarbour Crossing works, through a station at Yau Tong to four stations in the newtown <strong>of</strong> Junk Bay. Some trains in the peak hour would be run all the way from JunkBay to Yau Ma Tei, the rest would operate as a shuttle between Junk Bay and LamTin.7.5.2 <strong>The</strong> planned <strong>University</strong> <strong>of</strong> Science and Technology is also planned at Sai Kung andso the possibility <strong>of</strong> extending the MTR line to the <strong>University</strong> was also examined.Catchment Area7.5.3 <strong>The</strong> catchment area for the planned extension is well defined, comprising the newtown <strong>of</strong> Junk Bay, the community <strong>of</strong> Yau Tong and the <strong>University</strong> <strong>of</strong> Science andTechnology.7.5.4 Yau Tong is a relatively small centre with a 1986 population approaching 50000.This is expected to decline to nearer 40 000 by 2001 with declining household size.<strong>The</strong> Third <strong>University</strong> would have a daytime population <strong>of</strong> perhaps 10 000 studentsand staff; about half this number would be resident. <strong>The</strong>refore, it is the population<strong>of</strong> Junk Bay New Town itself which would supply most <strong>of</strong> the patronage <strong>of</strong> the railextension.7.5.5 Development <strong>of</strong> the new town commenced in 1986 and by 1988 had reached32 000 population. <strong>The</strong> central projection for CTS-2 indicates 137 000 populationby 1996, and 200 000 by 2001. Recently, though, the Government has undertakenengineering feasiblity studies into the development <strong>of</strong> Junk Bay Phase III, whichwould boost the growth rate considerably. A high population growth with Phase 111is now indicated as follows:Patronage Projections1996 164 0001997 1980001998 203 0002001 270 0002002 300 0002010 4000007.5.6 Patronage <strong>of</strong> the Junk Bay extension would depend principally on population levelsin Junk Bay but also on income levels which are generally rising. Projected volumesto and from Junk Bay associated with the population growth rate given above are asfollows (in thousands <strong>of</strong> passengers per day, measuring traffic between Yau Tongand Junk Bay):Central HighPop Pop1996 144 1612001 213 273130
7.5.7 Patronage on the line approaching the junction with the existing Kwun long Linewould be boosted by about 60 000 per day with the additional passengers from theYau long area. <strong>The</strong> 7 000 students and 3 000 staff <strong>of</strong> the Third <strong>University</strong> could beexpected to generate a maximum additional 20000 daily trips to and from the<strong>University</strong>.7.5.8 <strong>The</strong>se volumes would be wei! within the capacity <strong>of</strong> the MTR system.Alternative Transport7.5.9 Without the MTR extension to Junk Bay, public transport would be dependentmainly on buses, although high speed ferry transport to the main urban area could beconsidered to supplement these services. <strong>The</strong> passenger volumes generated by thefull development <strong>of</strong> Junk Bay would require very careful management without a railline.7.5.10 While many buses could be express services to other parts <strong>of</strong> the urban area, forinstance, across to West Kowioon and through the Eastern Harbour Crossing to<strong>Hong</strong> <strong>Kong</strong> Island, there would be a high demand for short distance feeder servicesto rail stations in East Kowioon. For these services, it would be essential for most busloading and unloading operations to take place at <strong>of</strong>f-street termini located in towncentres, at railway stations and in housing estates. It would also be difficult to findsuitable interchanges in the Kwun Tong area. Even with careful planning, however,management <strong>of</strong> the bus and passenger volumes involved would be difficult andcould prove to be a constraint on the growth <strong>of</strong> Junk Bay New Town.Financial/Economic Evaluation7.5.11 <strong>The</strong> financial evaluation indicates that passenger fare revenues would cover railoperating costs and rolling stock depreciation, even with a population <strong>of</strong> less than150000 in Junk Bay. Return on investment would be very low at this populationlevel but would rapidly improve with the growth in population in the new town.7.5.12 <strong>The</strong> economic analysis indicates strong economic benefits from travel time savingsand savings in operating costs <strong>of</strong> road-based public transport services and privateroad vehicles. By 2001, the economic return is rated as HIGH with full time benefitsand MEDIUM with only one third <strong>of</strong> time benefits.7.5.13 Internal rates <strong>of</strong> return (IRR) were estimated assuming that construction started in1992 for opening in 1996, with the following results:CentralHighEconomic IRR Population PopulationFull time savings High High1/3rd time savings Medium HighFinancial IRR Low Medium7.5.14 <strong>The</strong>se results assume a continuing growth in economic and financial returns <strong>of</strong> 4%per year after 2001, which assumes the continuing build up <strong>of</strong> Junk Bay new townto the levels indicated in paragraph 7.5.5. <strong>The</strong> results generally confirm the results<strong>of</strong> the single year analyses.7.5.15 With the patronage projected, the extension <strong>of</strong> the Junk Bay Line to the <strong>University</strong><strong>of</strong> Science and Technology could not possibly be justified in either financial oreconomic terms. It would be much more efficient to operate feeder services betweenthe <strong>University</strong> and the MTR station in Junk Bay town.Conclusions7.5.16 <strong>The</strong> MTR extension to Junk Bay would clearly be an attractive project expected tocarry over half the public transport demand to and from Junk Bay. However, thefurther extension from Junk Bay to the Third <strong>University</strong> would not be worthwhile.131
7.5.17 Patronage and economic results depend critically on the population assumed inJunk Bay. At the relatively modest level <strong>of</strong> development assumed by the Study for1996, about one third <strong>of</strong> the ful! development <strong>of</strong> Junk Bay, the project would beworthwhile from the community point <strong>of</strong> view. This would provide substantialsavings in travel time and alternative transport operating costs. Passenger revenuescould probably cover operating costs at that population level and financial returnswould build up rapidly with increasing population.7.5.18 <strong>The</strong>re is a clear case for planning the extension <strong>of</strong> the MTR to Junk Bay inconjunction with the development <strong>of</strong> the new town. This would undoubtedlyincrease the attractiveness <strong>of</strong> the new town and ensure that population build up israpid, thus contributing to the success <strong>of</strong> both the town as a whole and the MTRextension project in particular. <strong>The</strong> earlier the MTR extension is established as adefinite project, the easier it will be to plan other transport services to complement,rather than compete with, the MTR line.Worthwest New Territories Urban Link7.6.1 <strong>The</strong> Northwest New Territories (NWNT), with the existing towns <strong>of</strong> Tuen Mun andYuen Long and the developing town <strong>of</strong> Tin Shus Wai, is the largest populated region<strong>of</strong> the Territory not yet linked to the main urban area by rail. <strong>The</strong> region is now servedinternally by the recently opened LRT but all external public transport services areprovided by ferry, bus, minibus and taxi. CTS-2 examined the case for constructingan urban rail link between the existing urban rail network and the new LRT system.Alternative Routes7.6.2 Four alternative routes have been proposed for the NWNT Urban Link, as shownpreviously in Figure 7.3. Two are connections from the main KCR line, one fromFanling and the other from Tai Po, both connecting to the LRT terminus at YuenLong East. <strong>The</strong> other two connect from the MTR terminus at Tsuen Wan, onethrough the Tai Lam Country Park also to Yuen Long East as before and the otheralong the coast to Tuen Mun.7.6.3 <strong>The</strong> KCR main line connection from Fanling to Yuen Long was rejected byconsultants at an early stage <strong>of</strong> the the 1 987 LRT Extensions Studies (Urban Links)conducted for KCR, on the grounds <strong>of</strong> insufficient patronage. Little has changed inTerritory development projections since then and so this link was not re-examined inCTS-2.7.6.4 <strong>The</strong> other KCR main line connection from Tai Po was examined in CTS-2, but trafficprojections indicated substantially lower patronage than the two alternatives fromTsuen Wan. It was concluded that the Tai Po to Yuen Long route did not reallyfunction as an urban link. While this option would have attractions financially forthe KCRC (essentially by linking up the two KCRC-operated rail systems), it wasconcluded in this Study that it should be dropped from further consideration since itwould serve such a limited segment <strong>of</strong> the NW New Territories transport market.7.6.5 <strong>The</strong>refore, the main analysis <strong>of</strong> CTS-2 concentrated on the two alternative routesfrom Tsuen Wan, one to Tuen Mun and the other to Yuen Long.Catchment Area7.6.6 <strong>The</strong> population <strong>of</strong> the NW New Territories is concentrated in the two candidatetermini for the rail urban link: Tuen Mun and Yuen Long/Tin Shui Wai.7.6.7 Tuen Mun was already a well developed towodnJLiS^^population. <strong>The</strong> Study population projections show an increase to about 470 000population by 2001. This includes the development <strong>of</strong> Tuen Mun EastT'thTsprojected growth would put the population <strong>of</strong> the Tuen Mun area approaching thecurrently planned population capacity <strong>of</strong> 540 000.132
7.6.8 <strong>The</strong> other centre, comprising the two towns <strong>of</strong> Yuen Long and Tin Shui Wai, wasmuch less developed in 1986 with less than one third <strong>of</strong> the population <strong>of</strong> TuenMun. Future population depends on the pace <strong>of</strong> development <strong>of</strong> Tin Shui Wai whereconstruction started only recently. <strong>The</strong> central projections used by the Study assumeless than half the full development <strong>of</strong> Tin Shui Wai by 2001, giving a total populationfor the two towns <strong>of</strong> 26£LGQO, However, the full population potential <strong>of</strong> 425 000might be reached by 2001 if Government decided to concentrate resources ondevelopment there.Rail Passenger Projections7.6.9 <strong>The</strong> patronage <strong>of</strong> the urban rail link would be affected by a number <strong>of</strong> factors, themost important being:(1) the fares charged relative to fares by road transport(2) whether or not the Route 3 highway to Yuen Long is open with competing busservices(3) population growth in the NW New Territories7.6.10 A range <strong>of</strong> forecasts covering combinations <strong>of</strong> these factors is shown below,together with the selected central population forecast for each alternative route, allexpressed in thousands <strong>of</strong> passengers per day:1996 2001Yuen Long Line—Range 90—260 110—355Central 150—240 160—270Tuen Mun Line —Range 160—360 190—460Central 190—350 210—4007.6.11 <strong>The</strong> central forecast assumes the population projections as set out in the previoussection and that the new Route 3 highway linking Yuen Long to the urban areawould be completed, after 1996 but before 2001, as specified in the highwayinvestment programme recommended in Chapter 6. Route 3 bus services aretherefore assumed to be competing with rail after 1996, although the extent <strong>of</strong>competition would be regulated by the current inter-modal policy. <strong>The</strong>refore therange associated with the central forecasts has to do with the assumptions on fares.7.6.12 <strong>The</strong> high estimates <strong>of</strong> the central forecasts assume that the urban link would beoperated as an extension <strong>of</strong> the MTR Tsuen Wan Line with the fares on the urban linkintegrated with the fare structure <strong>of</strong> the MTR system. This would give rail a clearadvantage over road public transport for long distance trips, to the extent that the railterminus in the NWNT would attract trips from all parts <strong>of</strong> the NWNT and not justfrom the immediate area around the railhead. In the case <strong>of</strong> a Yuen Long rail line, forexample, travellers to the urban area from Tuen Mun would access the rail line atYuen Long.7.6.13 With higher rail fares, and certainly if the urban link fares were not integrated withthe main urban rail fare structure, the two population centres <strong>of</strong> the NWNT would bemore independent. In the above example, residents <strong>of</strong> Tuen Mun would be morelikely to travel to the urban area via a bus trip to Tsuen Wan rather than an LRT trip toYuen Long. This could lead to patronage at the lower end <strong>of</strong> the central forecaslgiven above.7.6.14 <strong>The</strong> urban rail link would also have a significant impact on rail volumes in the mainurban area, particularly the Nathan Road Corridor, boosting traffic by as much as tenpercent. <strong>The</strong> implications <strong>of</strong> this additional traffic in this currently overloadedcorridor are discussed further in the section 7.15 <strong>of</strong> this Chapter.133
Rail Operations7.6.15 Two proposals have been made for operating the NWNT urban rail link. One wouldbe as an extension <strong>of</strong> the MTR Tsuen Wan Line with standard 8-car trains operatingfrom Central on <strong>Hong</strong> <strong>Kong</strong> Island via Tsuen Wan to a terminus at either Yuen Longor Tuen Mun. <strong>The</strong> alternative operation proposed is for a separate light rail shuttlebetween the Tsuen Wan MTR station and the Yuen Long or Tuen Mun terminus,using 4-car trains made up <strong>of</strong> similar cars to those used on the LRT System.7.6.16 From the point <strong>of</strong> view <strong>of</strong> the user, there would be little to choose between the twoalternatives. <strong>The</strong> light rail shuttle would operate more frequently but would require atransfer between trains at Tsuen Wan. <strong>The</strong> less frequent MTR alternative would<strong>of</strong>fer through services all the way from the North West NT to Central District on<strong>Hong</strong> <strong>Kong</strong> Island. However, there would be significant differences in costs andcapacities, as discussed earlier.7.6.17 Choice <strong>of</strong> operation depends on the expected level <strong>of</strong> patronage. At the higherpatronage levels, associated with the lower fares integrated with the main urban arearail fare structure, volumes would be beyond the capacity <strong>of</strong> a light rail operation soheavy rail would be required, similar to MTR or the existing KCR main line services.With lower patronage associated with higher fares, light rail would have adequatecapacity.7.6.18 <strong>The</strong> choice, then, comes down to a mass transit carrier with relatively low faresthoroughly integrating the NW New Territories into the transport system <strong>of</strong> <strong>Hong</strong><strong>Kong</strong>, or a more restricted system <strong>of</strong>fering a comfortable service to a smaller andmore affluent section <strong>of</strong> the external travel market <strong>of</strong> the TSA.Alternatives to Rail7.6.19 If the NWNT urban rail link is not built, the NW New Territories would continue todepend primarily on road based public transport services; buses, minibuses andtaxis, as well as the private car.7.6.20 <strong>The</strong> projected volumes <strong>of</strong> passengers to and from the North West New Territoriescould be handled adequately by road-based public transport services in the absence<strong>of</strong> rail. As at present, most passengers would be carried.in high capacity expressbuses travelling between transport interchanges in the NWNT and the urban area,principally the MTR station in Tsuen Wan. Main road capacity is certainly adequateto carry the number <strong>of</strong> buses required; however, there would be problems inproviding bus terminals for the projected services.7.6.21 <strong>The</strong>refore, the case for rail is that it could provide more attractive and efficientservices than bus. <strong>The</strong> latter requires loading and unloading facilities enroute andalso suitable terminals for which it would be difficult to provide.F.inanciall Economic Evaluation7.6.22 <strong>The</strong> financial evaluation shows that passenger fare revenues from the NWNTUrban Rail Link (for both alternative routes) would cover operating costs and thedepreciation <strong>of</strong> rolling stock, either as a heavy rail operation or as a light rail shuttle.<strong>The</strong> financial return on the investment in the line is classed at least as MEDIUM forall combinations <strong>of</strong> route, and as HIGH for the Yuen Long heavy rail alternative by2001 assuming full development at Tin Shui Wai.7.6.23 <strong>The</strong> economic evaluation showed good returns; HIGH for both the heavy rail andthe light rail alternatives with full time savings included, but down to MEDIUM withsome combinations with only one third <strong>of</strong> time savings. <strong>The</strong>se results stronglyindicate the value <strong>of</strong> the project to the community.7.6.24 In comparison with the Yuen Long route, the Tuen Mun alternative gave highereconomic benefits approximately in proportion to the higher construction costs,therefore generating similar economic returns.134
7.6.25 <strong>The</strong> heavy rail alternatives showed a better economic performance than Sight rail.7.6.26 A lifetime economic and financial evaluation were undertaken for the heavy railalternatives for both the Tuen Mun and Yuen Long rail links, computing thefollowing internal rates <strong>of</strong> return (IRR):Yuen Long LineTuen Mun LineCent High Cent HighEconomic IRR Popul. Popui. Popul. Popul.Full time benefits High High High High1/3rd time benefits High High High HighFinancial IRR Medium Medium Low Medium7.6.27 <strong>The</strong>se analyses assume construction starting in 1992 with the line open in 1996.Growth rates in financial and economic returns after 2001 were assumed at a veryconservative 2% per year. <strong>The</strong> results generally confirm the results <strong>of</strong> the single yeareconomic and financial analyses.Other Considerations7.6.28 Consideration is at a very preliminary stage for a new freight rail line from the borderwith the PRC to the new port sites in the Western Harbour. Such a freight line coulduse a similar alignment to the Tsuen Wan-Yuen Long link. It has not been decidedyet whether or where a freight line should be built but opportunities for combiningthe passenger and freight line should be explored.Conclusions7.6.29 A rail link to the NW New Territories appears to be an attractive project and couldattract substantial patronage. It would provide more efficient services than bus butits economic viability will be affected by direct bus competition.7.6.30 <strong>The</strong> rail line should start from Tsuen Wan with a terminus at either Yuen Long orTuen Mun. On current knowledge, Yuen Long appears to be the most suitableterminus for the following reasons:(1) It is likely to be cheaper, being both shorter and passing through easier terrain orin tunnel(2) Yuen Long can serve more naturally as a railhead for the entire North West NewTerritories; after Route 3 is built the Tuen Mun alternative would involve asubstantial detour for residents <strong>of</strong> the Yuen Long/Tin Shui Was area(3) <strong>The</strong> rail line to Yuen Long can be built before Route 3 is open, allowing the railline to establish itself ahead <strong>of</strong> competing bus services(4) <strong>The</strong> route to Yuen Long can be linked to the development <strong>of</strong> the new town <strong>of</strong>Tin Shui Wai, to the benefit <strong>of</strong> the development <strong>of</strong> both the rail line and thenew town7.6.31 With a fare structure fully integrated with the urban area rail fares, passenger demandon opening in the mid-1990s would be likely to exceed the capacity <strong>of</strong> a light railline. However, for the Yuen Long to Tsuen Wan alternative, passenger demandcould probably be kept within the limits <strong>of</strong> light rail by using a non-integrated farestructure. This would require rail passengers to pay at least two separate fares totravel to the urban area, one for the urban link and the other for the onward journeyby MTR.7.6.32 <strong>The</strong> analysis by CTS-2 assumed that a heavy rail link would be an extension <strong>of</strong> theMTR system. This need not necessarily be the case. For example, if the Tsuen Wan toYuen Long route is finally selected and plans are coordinated with the proposed newfreight line, then it might be more sensible for the freight line operator to operate the135
passenger services. Also, while light rail as defined in this report is clearly inadequate,full MTR services might give excess capacity. As noted earlier, detailed engineeringstudies could usefully explore train operations intermediate between full heavy railand light rail.7.7 MTR Line Extension to Kennedy Town and Green7.7.1 <strong>The</strong> original plans for the MTR Island Line included an extension westwards toKennedy Town from the current terminus <strong>of</strong> Sheung Wan. <strong>The</strong>re is now thepossibility <strong>of</strong> extending the line further to the developments planned for the GreenIsland Reclamation. <strong>The</strong> CTS-2 Study looked at both possibilities.Catchment Area7.7.2 <strong>The</strong> catchment area for the Island Line Extension includes the districts <strong>of</strong> Sai YingPun and Kennedy Town. Population <strong>of</strong> these two districts was 150 000 in 1986 andlittle change is expected to 2001. Employment places in the area are expected todecline from 85 000 in 1986 to 66 000 in 2001. <strong>The</strong>se population and employmentlevels alone would not be sufficient to justify the extension. Of critical importanceare the population levels assumed for the planned reclamation <strong>of</strong> Green Island andfor South-West <strong>Hong</strong> <strong>Kong</strong> Island.7.7.3 <strong>The</strong> population for a full development <strong>of</strong> a reclaimed Green Island was estimated at330000, but this scale <strong>of</strong> development could not take place for many years. <strong>The</strong>central population forecast <strong>of</strong> the Study assumed development starting in the late1990s to reach 85 000 population by 2001 but more recent thinking is that GreenIsland will not be developed until after 2001.7.7.4 <strong>The</strong> central forecasts <strong>of</strong> the Study assume that population <strong>of</strong> South-west <strong>Hong</strong><strong>Kong</strong> Island, Pok Fu Lam to Aberdeen, would grow by about 50% from 217 000 in1986 to 326 000 in 2001. Current thinking has de-emphasised development in thispart <strong>of</strong> <strong>Hong</strong> <strong>Kong</strong> Island; currently, a population <strong>of</strong> 241 000 is expected by 2001which is only an 11 % growth on 1986.Patronage Projections7.7.5 Traffic on the Island Line Extension with the central population estimates wasprojected as follows (in thousands <strong>of</strong> passengers per day):1996 2001West <strong>of</strong> Sheung Wan 210 290West <strong>of</strong> Kennedy Town 100 1907.7.6 <strong>The</strong> additional 80-90 000 passengers per day in 2001 are mainly attributable to theGreen Island developments. Not all the traffic west <strong>of</strong> Sheung Wan would beadditional MTR traffic; much would have been travelling to and from MTR by feederservice (bus, tram or PLB) without the extension project. <strong>The</strong>se volumes are wellwithin the capacity <strong>of</strong> the MTR.Financial/Economic Evaluation7.7.7 <strong>The</strong> financial evaluation indicated that operating costs and depreciation <strong>of</strong> rollingstock could be covered from revenues for the Kennedy Town extension in 1996, andfor the Green Island extension in 2001. However, the surplus remaining fromrevenues would give LOW returns on the investment.7.7.8 <strong>The</strong> economic evaluation showed HIGH returns on investment with full time savingscounted but these reduced substantially for the case with one third <strong>of</strong> time savings.7.7.9 Both evaluations assumed the central population projection. If, as seems likely,population growth in Green Island and South-west <strong>Hong</strong> <strong>Kong</strong> Island is slower thanassumed, then the economic and financial returns would be reduced.136
Conclusions7.7.10 On the evidence presented here, the extension <strong>of</strong> the Island Line to either KennedyTown or Green Island would be a marginal project heavily dependent for justificationon the estimates <strong>of</strong> passenger travel time savings. Financial results would be poor.7.7.11 Much depends on the developments on Green Island. Without extensive developmentthere, extension <strong>of</strong> the Island Line west <strong>of</strong> Sheung Wan appears to be <strong>of</strong> a !owpriority. <strong>The</strong> extension wiii also depend on the decision on the relocation <strong>of</strong> theairport.7.8 IV1TR Kowloon Line7.8.1 <strong>The</strong> original concept <strong>of</strong> the Mass Transit Railway included four lines, <strong>of</strong> whichthree—the Kwun Tong Line, the Tsuen Wan Line and the Island Line; have all beenlargely completed. <strong>The</strong> fourth line was the East Kowloon Line from Diamond Hill inKowloon to Sheung Wan on <strong>Hong</strong> <strong>Kong</strong> Island via Kai Tak, To Kwa Wan and TsimSha Tsui. CTS-2 re-examined the potential for this line on the above alignment butwith additional extensions, one to the south terminating at Wong Chuk Hang to theeast <strong>of</strong> Aberdeen and the other to the north terminating at Sha Tin in the NewTerritories. An alignment has been reserved through Eastern Kowloon.Projected Patronage7.8.2 Projected volumes on this line for 1996 are as follows (in thousands <strong>of</strong> passengersper day):1996 2001West <strong>of</strong> Aberdeen 50 55Aberdeen to Sheung Wan 230 250Cross-harbour 380 420Star Ferry to Hung Horn 370 410Hung Horn to Diamond Hill 360 400Diamond Hill to Tsz Wan Shan 370 400Tsz Wan Shan to Sha Tin 300 3307.8.3 <strong>The</strong>se are high volumes by most urban mass transit standards; for example, they aresignificantly higher than volumes on the Island Line in 1986.7.8.4 In the central section <strong>of</strong> the line through the East Kowloon peninsula, traffic on theline is taken in mainly from the MTR Nathan Road corridor and from buses; there isalso some diversion from the KCR main line. <strong>The</strong> northern section <strong>of</strong> the linebetween Diamond Hill and Sha Tin attracts traffic equally from the KCR main lineand from bus routes. <strong>The</strong> least trafficked section <strong>of</strong> the line in the south attractstraffic from the alternative bus routes.7.8.5 Traffic volumes in the central section <strong>of</strong> the line would be cut by about 40% withoutthe Sha Tin extension, and by about 20% without the Aberdeen extension. Projectedvolumes are well within the capacity <strong>of</strong> an MTR line.7.8.6 At the development densities currently prevailing in the East Kowloon peninsula,bus services could cope with the expected demands in the corridor in the absence <strong>of</strong>the East Kowloon Line.Financial/Economic Evaluation7.8.7 <strong>The</strong> financial evaluation shows that the East Kowloon Line could cover operatingcosts and equipment depreciation by 1996, but the operating surplus would besmall giving a LOW return on the investment.137
.S.Bi ne economic evaluation or tne central section, TaKing into accouni TUII savings incommunity resources, shows a LOW return on investment by 1996 and MEDIUM by2001, indicating economic feasibility by that date. Passenger time savings constitutejust over half the economic benefits, hence the more conservative evaluation takingjust one third <strong>of</strong> estimated passenger time savings reduces the economic returnsto LOW, except for the Aberdeen to Centra! section for 2001 which remains atMEDIUM.7.8.9 In economic terms, the Sha Tin extension is competing against the KCR main line ina well-provided corridor; the Aberdeen extension in contrast provides a more directroute from Aberdeen to Central than can be provided by road, and transforms theconnections between Aberdeen and all other points <strong>of</strong> the Territory, thus accountingfor the rather better economic performance.Conclusions7.8.10 <strong>The</strong> East Kowloon Line from Sha Tin to Aberdeen would attract substantial volumes<strong>of</strong> traffic, in this respect performing better in 1996 than the Island Line in 1986.7.8.11 <strong>The</strong> economic evaluation indicates feasibility, even by 1996, but would not supporta high priority by that year. <strong>The</strong> financial evaluation shows that the line would requiresubstantial financial support. It must be concluded that the East Kowloon Line is soexpensive, at about $20 billion with rolling stock, that the economic case for the lineis marginal. If the line is to be recommended, more compelling arguments in itsfavour must be established. <strong>The</strong>se would depend on the scale and direction <strong>of</strong>urban development in the years to come. Two points can be established concerningthis aspect7.8.12 First, the reclamation studies <strong>of</strong> Central and Wan Chai indicate the need for railaccess if that reclamation is to be built to the densities currently prevailing in theexisting Central and Wan Chai Districts. It is possible that a re-aligned East KowloonLine might serve this purpose.7.8.13 Secondly, there is the possibility <strong>of</strong> relaxing building height restrictions in this areaif the airport were to be moved from Kai Tak. At higher densities, patronageprojections and therefore the economic benefits <strong>of</strong> the East Kowloon Line, wouldhave to be revised upwards.7.8.14 <strong>The</strong> importance <strong>of</strong> the East Kowloon Line evaluation is that it demonstrates the value<strong>of</strong> a major new urban rail link for the late 1990s. Detailed planning must reconsiderthe alignment to take account <strong>of</strong> major new urban developments now in planning.7.9 Ma On Shan Light Rail Line7.9.1 A rail line has been proposed in various development studies for the new town <strong>of</strong> MaOn Shan, located to the North East <strong>of</strong> Sha Tin. <strong>The</strong> current proposal is for a light railline from Ma On Shan to Tai Wai, just south <strong>of</strong> Sha Tin, where the line wouldterminate in an interchange with the KCR main line. <strong>The</strong> line would pass through theeastern side <strong>of</strong> Sha Tin; an alignment for a light rail line has been reserved. While aheavy rail alternative was at one time considered, it is now understood that the railreserve currently allocated would not be adequate.7.9.2 <strong>The</strong> Ma On Shan LRT is envisaged as a regional system like that recently opened inthe NW New Territories, with frequent stops (one every 500 metres) and relativelyslow average journey speeds. However, unlike the NW New Territories LRT, thesystem would be mostly grade separated with only three ground level road crossingsin Ma On Shan. Moreover, the proposal considered in CTS-2 is for a single linerather than a network <strong>of</strong> routes as in.the NW New Territories.138
Catchment Area7.9.3 <strong>The</strong> line would primarily provide access to the new town <strong>of</strong> Ma On Shan, although itwould also serve some major housing areas on the east side <strong>of</strong> Sha Tin.7.9.4 Ma On Shan, where development started in 1987, has a potential population <strong>of</strong> atleast 500 000 but current plans limit the population to 174 000 in 1 996 and 196 000population by 2001. Currently, there are no plans to advance beyond thesepopulation levels, at least in part because <strong>of</strong> problems <strong>of</strong> overloading transportfacilities from Sha Tin/Ma On Shan to the main urban area.Patronage Projections7.9.5 Patronage projected for this line is as follows (in thousands <strong>of</strong> passengers per day):1998 2001Ma On Shan-Sha Tin 138 165Sha Tin-Tai Wai 200 2467.9.6 <strong>The</strong>se estimates assume that the Diamond Hill LRT (see next section) is alsoconstructed and that through trains would be run from Diamond Hill to Ma OnShan; without the extension to Diamond Hill, volumes on the Ma On Shan sectioncould be expected to drop by about 4%.7.9.7 It can also be noted that these rail patronages were estimated assuming that LRTfares were not integrated into the KCR main line fare structure. Integration <strong>of</strong> fareswould undoubtedly boost patronage further but this would lead to problems <strong>of</strong>capacity, as discussed below.7.9.8 <strong>The</strong> direct connection <strong>of</strong> Ma On Shan by rail to the KCR main line at Tai Wai wouldincrease KCR main line patronage in 1996 by about 40 000 trips per day.Service and Capacity7.9.9 <strong>The</strong> Ma On Shan LRT could be operated in a similar way to the recently opened NWNew Territories LRT with one minute headways and trains driven on sight. For thissingle line and the volumes projected, 2-car trains would be required. If the system isto be operated with the Diamond Hill LRT, it would probably be better to use 4-cartrains at 2 minute headways, to match the likely minimum headway requirement <strong>of</strong>the Diamond Hill Line with its higher operating speeds.7.9.10 <strong>The</strong> volumes projected are near the limits <strong>of</strong> capacity <strong>of</strong> an LRT system. This is not asubstantial problem, however, since no further development is planned for Ma OnShan beyond the currently projected population.7.9.11 In the absence <strong>of</strong> a light rail system, and for the projected population <strong>of</strong> 196 000 inMa On Shan by 2001, bus transport could handle the passenger transport to andfrom the town.Financial/Economic Evaluation7.9.12 <strong>The</strong> financial evaluation indicated only a small surplus on operations after coveringoperating costs and equipment depreciation, giving a LOW rating on investment.7.9.13 Travel time savings, usually a key element <strong>of</strong> economic benefit <strong>of</strong> rail projects, arenot so dominant for this project because the road to Ma On Shan at the projectedpopulation levels is expected to be fairly free-flowing. Also, the frequent stops leadto a low average journey speed for the light rail <strong>of</strong> only 25 km/h. Hence the economiccase for the Ma On Shan LRT is not good, with economic returns rated as LOW in allcases.7.9.14 Patronage could be boosted by restricting bus competition, or by operating at higherspeeds. However, a higher capacity rail system would be required in both cases; thiswould cost more and it is perhaps doubtful whether viability would be improved.139
Conclusions7.9.15 At the projected populations for Ma On Shan for 1996 and 2001, patronageestimates for a light rail system linking Ma On Shan to Tai Wai are sufficient to justifyserious consideration <strong>of</strong> this project. However, volumes would be approaching thecapacity <strong>of</strong> a light rail system as currently envisaged. Also, bus services can handlethe passenger transport without much problem.7.9.16 <strong>The</strong> economic evaluation indicates poor returns on this project, both in financial andeconomic terms, which indicates a low priority. This is mainiy because <strong>of</strong> therelatively low average journey speed <strong>of</strong> the line as noted above resulting in lowoperating benefits over buses. Strong competition from buses operating in parallelto the light rail line adversely affects the financial viability <strong>of</strong> this project.7.9.17 <strong>The</strong> Ma On Shan LRT system would be enhanced if extended to Diamond Hill. Thisproject is looked at in the next section.7.10 Diamond Hill Light Rail Line7.10.1 This project comprises a light rail line connecting the KCR station <strong>of</strong> Tai Wai (theterminus <strong>of</strong> the possible Ma On Shan LRT) with the MTR station at Diamond Hill.<strong>The</strong> project would have the characteristics <strong>of</strong> an urban link, with just oneintermediate station at Tsz Wan Shan, and an average journey speed <strong>of</strong> 55 km/h.With the Ma On Shan LRT system completed, through trains could be run from MaOn Shan to Diamond Hill.Patronage Projections7.10.2 Passenger volumes on this line depend on whether or not the Ma On Shan LRTline is in operation. Thus the following volumes are projected (in thousands <strong>of</strong>passengers'per day);1996 2001With Ma On Shan Line 135 172Without Ma On Shan Line 87 111Service and Capacity7.10.3 As noted in the previous section, 4-car trains running at 2 minute headways wereassumed to match the proposed Ma On Shan LRT service. <strong>The</strong> 2001 projectedpatronage in this situation would be at the design capacity <strong>of</strong> an inter-urban LRT,although still short <strong>of</strong> an acceptable normal capacity.7.10.4 <strong>The</strong> patronage estimates reported here assume that the LRT would operate as astand-alone system with no fare integration with other rail modes. If fare integrationwere in operation, or if Ma On Shan population were to grow much beyond thecurrently projected 2001 population, the capacity <strong>of</strong> the Diamond Hill LRT couldbe exceeded. Capacity would also be exceeded if the East Kowloon Line wereconstructed south <strong>of</strong> Diamond Hill since this project would channel passenger flowsinto the Diamond Hill-Sha Tin corridor.Financial/Economic Evaluation7.10.5 As an extension <strong>of</strong> the Ma On Shan LRT system, the Diamond Hill LRT shows goodfinancial returns by 2001. However, a drop in revenue on the KCR main line wouldmodify these results overall for a KCRC-run light rail operation. <strong>The</strong> economicevaluation also shows good results for this line, with a HIGH rating at 2001 whetherwith full time savings or counting just one third <strong>of</strong> time savings, and dropping toMEDIUM only in the case <strong>of</strong> taking one third <strong>of</strong> time savings in 1996.140
7.10.6 <strong>The</strong> Diamond Hill LRT project was not evaluated without the Ma On Shan LRT, butestimates <strong>of</strong> the impact on economic results <strong>of</strong> omitting that line can be made. Asindicated above, projected passenger volumes on the Diamond Hill LRT would dropby about one third in the absence <strong>of</strong> the Ma On Shan LRT. Assuming revenues andeconomic benefits drop proportionately, the economic returns on the project wouldstill be rated HIGH with full time savings, dropping to MEDIUM with only one third<strong>of</strong> time savings counted.7.10.7 Taking Diamond Hill and Ma On Shan results together (which probably exaggeratesbenefits) the financial returns are rated as LOW for 1996 but MEDIUM for 2001.Economic returns for the joint project are rated as MEDIUM counting all timebenefits, but LOW with one third <strong>of</strong> time savings.Conclusions7.10.8 On the assumptions tested, the Diamond Hill LRT as an extension <strong>of</strong> the Ma OnShan LRT would represent a good rail-based transport investment. However, likeother light rail lines examined, the projected passenger volumes by 1996 alreadyreach design capacity and could well exceed capacity under other assumptions,in particular with stronger population growth in the corridor, with differentassumptions on fare structures and with an East Kowloon line built south <strong>of</strong>Diamond Hill. <strong>The</strong> extension <strong>of</strong> the MTR East Kowloon Line to Sha Tin would <strong>of</strong>fermuch greater capacity and would be the more natural project for this corridor. Hencea decision on the Diamond Hill LRT depends on a final decision on the East KowloonLine.7.11 KCR Main Line Extensions to Tsim Tsui and Sheung Wan7.11.1 <strong>The</strong> KCR main line currently terminates at Hung Horn which, while quite satisfactoryfor international passengers, is not very convenient for most <strong>of</strong> the urban railcommuters using the line. As a consequence, most passengers destined for the mainurban area <strong>of</strong> Kowloon or <strong>Hong</strong> <strong>Kong</strong> Island change at Kowloon Tong to the MTRsystem.7.11.2 CTS-2 looked at a proposal to improve the accessibility <strong>of</strong> the KCR main line byconstructing a-branch line from the KCR main line, starting at Mong Kok, runningalong the pre-1975 alignment <strong>of</strong> the KCR parallel with Chatham Road, andterminating near the Kowloon terminus <strong>of</strong> the Star Ferry. This branch line would beunderground for most <strong>of</strong> its length. An intermediate station would be provided toserve Tsim Sha Tsui East, and underground walkways would be provided to connectto the MTR station at Tsim Sha Tsui. With this branch line, the main line suburbanservices were assumed to terminate at Star Ferry on Kowloon side while theinternational traffic and freight traffic would continue to use Hung Horn Station.A further extension <strong>of</strong> this line across the Harbour to <strong>Hong</strong> <strong>Kong</strong> Island at SheungWan was also examined.Patronage Projections7.11.3 Passenger volumes were projected as follows (in thousands <strong>of</strong> passengers per day):Extension toMariner OnlyExtension toSheung Wan1996 2001 1996 2001Mong Kok to Hung Horn 162 177 101 111Mong Kok to TST East 165 195 311 366TST East to Star Ferry 100 123 240 295Cross-Harbour 193 237141
7.11.4 With an extension to Star Ferry only, the total traffic coming to the southern tip <strong>of</strong>Kowloon by KCR would increase by about one third, or 90 000 passengers per dayin 1996, dividing fairly evenly between the two termini <strong>of</strong> the line but slightlyfavouring Star Ferry by 2001. This split in traffic indicates that perhaps some <strong>of</strong> thesuburban trains under this arrangement should continue to terminate at Hung Horn.7.11.5 Total traffic volumes would increase sharply with an extension across the harbour,but the number <strong>of</strong> passengers terminating at Hung Horn would decrease. It is clearthat a KCR extension across the harbour could give quite significant relief to theexisting MTR cross-harbour link.Financial I'Economic Evaluation7.11.6 <strong>The</strong> financial evaluation indicates that passenger revenues could cover operatingcosts and depreciation for an extension to the Star Ferry terminus in Kowloon, butreturn on investment would be rated LOW. This is essentially because little more canbe charged to KCR passengers for the short additional travel to Star Ferry over theexisting fare for the trip to Hung Horn.7.11.7 Financial results for the extension across the harbour to Sheung Wan are also ratedLOW, and come at the expense <strong>of</strong> MTR and ferry revenues. Effectively, a majorsegment <strong>of</strong> passenger revenues for the cross-harbour movement would transferto KCRC from MTRC. MTRC would experience little cost saving, despite losingrevenues, since maximum service is already being provided and would not be cutback for the remaining traffic.7.11.8 An economic evaluation was carried out for the Star Ferry extension only. A HIGHreturn was indicated with full time savings included. With time savings reduced, thereturn was insufficient to justify the project by 2001. However, the economicevaluation does not fully recognise limitations on capacity on the IVITR Nathan RoadCorridor and this factor has to be included in reaching final conclusions on the KCRextensions.Conclusions7.11.9 <strong>The</strong> KCR extensions could attract considerable additional traffic to the KCR line.This would have the effects <strong>of</strong> relieving pressure on the main KCR/MTR interchangeat Kowloon Tong, taking traffic from the heavily loaded MTR Nathan RoadCorridor, and providing direct rail access to Tsim Sha Tsui East.7.11.10 <strong>The</strong> alignments <strong>of</strong> the possible KCR extensions pass through the lowest densitycorridor <strong>of</strong> Kowloon and with few stations. Considering the route from KowloonTong to Tsim Sha Tsui including a KCR extension to Star Ferry Station, the KCRwould have just two intermediate stations, one at Mong Kok and the other at TsimSha Tsui East compared with five for the MTR. <strong>The</strong>refore, investment <strong>of</strong> funds in anextension <strong>of</strong> the KCR, while improving the performance <strong>of</strong> KCR, would be to someextent handicapped by the inadequacies <strong>of</strong> the KCR alignment. In other words, theremay be more effective ways <strong>of</strong> investing money in urban rail development.7.11.11 <strong>The</strong> KCR extension to Star Ferry would take up the East Kowloon Line reserve andwould therefore prevent that line being constructed on its currently plannedalignment. <strong>The</strong>refore a decision on the KCR Star Ferry extension must be part <strong>of</strong> amore wide-ranging plan for urban rail services in general. This is discussed further inSection 7.15 <strong>of</strong> this Chapter.7.12 KCR Line: Sha Tin to Kwai Fong7.12.1 A freight line has been proposed to connect the existing KCR main line at Sha Tinto the container port at Kwai Chung. CTS-2 looked at the possibility <strong>of</strong> runningpassenger services on this line passing under the MTR station at Kwai Fong and onto the Rambler Channel area.142
7.1 2.2 Passenger volumes were projected as follows:1996 95 000 passengers per day2001 1090007.12.3 <strong>The</strong>se volumes are not high and could be met by trains consisting <strong>of</strong> single 3-carEMU units operating on a 3 minute peak headway and 6 minute <strong>of</strong>f-peak headway.<strong>The</strong>re are no foreseeable problems <strong>of</strong> capacity on this line.7.12.4 In the absence <strong>of</strong> the rail line, public transport movements would be by busoperating along Route 5 which is due to be completed in 1989, <strong>The</strong>re would be noproblems in accommodating the likely bus volumes for the passenger forecastsprojected here.7.12.5 Projected revenues would cover operating costs and depreciation <strong>of</strong> rolling stockcomfortably. Since construction costs are very low if the freight line is already inplace (passenger facilities are merely additions to a line constructed to serve freight),the operating surplus would give a HIGH return on investment the best <strong>of</strong> any railproject evaluated. <strong>The</strong> economic evaluation also confirms the high value <strong>of</strong> theproject.Conclusions7.12.6 If a freight line were to be built on the suggested alignment linking Sha Tin withKwai Fong, it would clearly make sense to provide for passenger services. However,benefits from passenger operations would not be sufficient to justify the entireconstruction cost <strong>of</strong> the line.7.13 Admiralty to Aberdeen Light Project7.13.1 A light rail transit (LRT) line has been proposed for <strong>Hong</strong> <strong>Kong</strong> Island to linkAdmiralty MTR station in Central District to the south side <strong>of</strong> the Island at Aberdeen.<strong>The</strong> characteristics <strong>of</strong> the scheme discussed below were preliminary estimatesdeveloped during a pre-feasibility study. Further studies are currently underway.Catchment Area7.13.2 <strong>The</strong> Aberdeen LRT would directly serve the communities <strong>of</strong> Aberdeen and the twolarge housing estates <strong>of</strong> Wah Fu and Chi Fu to the west <strong>of</strong> Aberdeen. Via feederservices, it could also serve Ap Lei Chau, to the south <strong>of</strong> Aberdeen, and theBaguio/Pokfulam area.7.13.3 <strong>The</strong> population <strong>of</strong> this area was around 217000 in 1986. <strong>The</strong> central populationestimate <strong>of</strong> the Study assumed new development in the area increasing thepopulation to 326 000 population by 2001.Patronage Projections7.13.4 Maximum line loadings <strong>of</strong> 75 000 passengers per day by 1996 and 90 000 by 2001were projected based on the initial plans for the route. This represents only about20%-25% <strong>of</strong> the total demand for public transport to and from the catchment area.7.13.5 Demand is comparatively low principally because bus competition is very strong,with direct routes through the Aberdeen tunnel penetrating to most parts <strong>of</strong> theNorth shore <strong>of</strong> <strong>Hong</strong> <strong>Kong</strong> Island and also across the harbour. <strong>The</strong> rail fare is higherthan for bus even for direct connection to Admiralty. To go beyond Admiraltyrequires an additional fare on a new mode. For example, the fares to North Point orDiamond Hill by combined LRT and MTR would be nearly double the comparablebus fares.7.13.6 It can be noted that the line picks up half <strong>of</strong> the projected patronage from thehousing developments to the west <strong>of</strong> Aberdeen. <strong>The</strong>refore projected passengervolumes would be affected by the changes in population projections for thesouthwest <strong>of</strong> <strong>Hong</strong> <strong>Kong</strong> Island discussed above.143
7.13.7 It is estimated that the LRT as proposed in the pre-feasibility study could not carryvery much higher volumes than those discussed above, and that the full capacity forsuch a line could satisfy only about 30% <strong>of</strong> total PT demand from catchment area.7.13.8 It is noted that the Aberdeen LRT would have a severe impact on China Motor Bus(CMB) operations attributable to CMB losing traffic on their more pr<strong>of</strong>itable higherspeed routes, in particular those operating through the Aberdeen tunnel. If theAberdeen LRT is not built passengers would continue to be carried by bus. At thevolumes projected, this would not pose problems.Financial/Economic Evaluation7.13.9 Passenger revenues could be expected to cover operating costs and depreciation <strong>of</strong>equipment but would give a LOW return on the construction investment in both1996 and 2001.7.13.10 <strong>The</strong> estimated economic benefits <strong>of</strong> the project were also rated LOW. Travel timesavings, which are usually a major component <strong>of</strong> rail project economic benefits, arelow in this case, basically because there is strong competition from buses which<strong>of</strong>fer faster travel times to many <strong>of</strong> the immediate destinations on <strong>Hong</strong> <strong>Kong</strong>Island.Conclusions7.13.11 On the basis <strong>of</strong> the Study evaluations, this project could not receive priority as apublic sector project. <strong>The</strong> main problems <strong>of</strong> the project, as identified in the prefeasibilitystudy, centre on the questions <strong>of</strong> passenger capacity and integration withthe rest <strong>of</strong> the rail system. If run as a stand-alone system with a separate nonintegratedfare structure, projected loadings and capacity would be in balance.However, it would serve only a relatively small part <strong>of</strong> the total market and wouldhave a serious effect on CMB, the main public transport carrier currently servingthat area. A better integrated service could attract many more passengers, buthigher capacity requirements would also increase capital costs and overall viabilitymight not be improved. <strong>The</strong> impact on CMB <strong>of</strong> a high volume rail system would, <strong>of</strong>course, be even more serious than the current proposal. <strong>The</strong> current technical andeconomic feasibility studies might be able to resolve these questions.7.13.12 Construction <strong>of</strong> an Aberdeen LRT would also have a serious negative impact on theviability <strong>of</strong> an MTR extension to Aberdeen. While the prospects <strong>of</strong> this latter projectdo not look promising for early implementation in the case <strong>of</strong> the airport retained atits present site <strong>of</strong> Kai Tak, removal <strong>of</strong> the airport to a site <strong>of</strong>f <strong>Hong</strong> <strong>Kong</strong> Islandmight well require such a line. In this case, it would be essential for the airport line toattract as much patronage as possible from the south side <strong>of</strong> <strong>Hong</strong> <strong>Kong</strong> Island toimprove overall viability.7.14 Further MTR Harbour Crossings7.14.1 <strong>The</strong> existing harbour crossing <strong>of</strong> the MTR is currently near the limits <strong>of</strong> capacity.While the situation should be relieved considerably by the opening <strong>of</strong> the EasternHarbour Crossing MTR line in late-1989, traffic growth is expected to bring trafficvolumes on this line back to current levels by the early 1990s. <strong>The</strong>refore, there is anurgent need for an additional rail crossing <strong>of</strong> the harbour.7.14.2 <strong>The</strong> Study looked at four possibilities for additional harbour crossings, as follows:1. KCR Line: Mong Kok and Tsim Sha Tsui to Sheung Wan2. MTR East Kowloon Line: Star Ferry to Sheung Wan3. MTR Kwun Tong Line: Yau Ma Tei to Sheung Wan4. MTR Kwun Tong Line: Yau Ma Tei to Fortress7.14.3 <strong>The</strong> first two crossings were discussed in previous sections <strong>of</strong> this Chapter; thissection concentrates on the second pair <strong>of</strong> crossings which are alternative forms <strong>of</strong>extending the MTR Kwun Tong Line across the harbour from its current terminus atYau Ma Tei.144
7.14.4 <strong>The</strong> Yau Ma Tei to Sheung Wan crossing would extend the MTR Kwun long Linesouth to a station on Chatham Road serving Tsim Sha Tsui East and then on acrossthe harbour to interchange with the MTR Island Line at Sheung Wan.7.14.5 <strong>The</strong> Yau Ma Tei to Fortress Line would extend the MTR Kwun Tong line south-eastto an interchange with the KCR at Hung Hom and then across the harbour tointerchange with the MTR Island Line at Fortress.Patronage Projections7.14.6 Projected volumes for the two alternative crossings are compared with the existingand Eastern Harbour crossings below (in thousands <strong>of</strong> passengers per day):1996 2001Sheung Wan CrossingYau Ma Tes to TST East 280 320TST East to Sheung Wan 210 240Existing Crossing 690 790Eastern Harbour Crossing 1 240 280Fortress CrossingYau Ma Tei to Hung Hom 310 350Hung Hom to Fortress 300 350Existing Crossing 650 730Eastern Harbour Crossing 1 250 2601 Planned to open in late-19897.14.7 <strong>The</strong> Yau Ma Tes to Fortress crossing is clearly the more effective <strong>of</strong> the two inrelieving the existing rail harbour crossing, probably because it provides a betterconnection to the fast developing Wan Chas and Causeway Bay areas. On the otherhand, the Sheung Wan crossing might carry more passengers than indicated here,attracted by a relatively congestion-free crossing reaching the edge <strong>of</strong> CentralDistrict.7.14.8 <strong>The</strong> Fortress Crossing is clearly more useful in relieving the overloaded KowloonTong interchange between the MTR and the KCR. With the Fortress Crossing,passengers using the KCR for travel between the New Territories and <strong>Hong</strong> <strong>Kong</strong>Island would be able to interchange with the MTR at Hung Hom.Financial/Economic Evaluation7.14.9 On the basis <strong>of</strong> earlier tests, the Fortress crossing was selected for more detailedanalysis and was carried forward to the stage <strong>of</strong> economic evaluation. <strong>The</strong> SheungWan alternative was subject to a financial evaluation only.7.14.10 Neither crossing performs well on the financial evaluation. In the case <strong>of</strong> the SheungWan crossing, few additional revenues are generated for MTR since revenues gainedby the new crossing represent revenues lost from the existing crossing. Thusadditional revenues do not cover operating costs and depreciation and give aNegative return on investment. <strong>The</strong> Fortress crossing generates rather greaterrevenues but still rate only as LOW.7.14.11 <strong>The</strong> economic evaluation for the Fortress crossing indicates MEDIUM to HIGHreturns on investment. However, time savings are an important component <strong>of</strong> this; ifone third <strong>of</strong> timing savings is made, the returns reduce to LOW for both 1996 and2001.7.14.12 As with the KCR extensions discussed earlier, the economic and financial evaluationsdo not properly account for overloading in the MTR Nathan Road Corridor. Inpractice, the usefulness <strong>of</strong> the crossings to MTR would be in the relief <strong>of</strong> congestionenabling MTR to carry all the projected traffic demand. In other words, without theadditional crossings, MTR would not be able to realise the entire projected demandand associated revenues.145
Conclusions7.14.13 Both harbour crossings could provide useful relief to the MTR Nathan RoadCorridor. Of the two, the Fortress Crossing appears to be more useful also providinga way <strong>of</strong> relieving the busy Kowloon long interchange between the MTR and theKCR.7.14.14 Clearly, these two crossings cannot be considered in isolation from the other urbanrail lines considered. Conclusions are developed in the final section <strong>of</strong> this Chapter.7.15 <strong>The</strong> Recommended7.1 5.1 <strong>The</strong> evaluation <strong>of</strong> new passenger rail lines reported in this chapter revealed a number<strong>of</strong> rail projects which could usefully extend the Territory's rail network. Two mainclasses <strong>of</strong> projects were identified:(1) extensions to major communities not yet reached by rail.(2) additions to the urban rail network to relieve congestion on existing lines.Rail Links to New Communities7.15.2 Projects were examined to provide rail links to four different communities: JunkBay, the North-West New Territories, Ma On Shan and Aberdeen. It was concludedthat rail lines to Aberdeen and Ma On Shan would be marginal projects at thecurrently expected levels <strong>of</strong> population. <strong>The</strong>refore, the higher priorities are for thelines to Junk Bay and to the North-West New Territories.7.15.3 Detailed consideration <strong>of</strong> a rail link to Junk Bay is already underway. It is clear thatany such line should be an extension <strong>of</strong> the MTR system and linked in to theoperations <strong>of</strong> the MTR Kwun Tong Line.7.15.4 <strong>The</strong> planning <strong>of</strong> the link to the North-West New Territories is a more complex matter.Choice <strong>of</strong> route (from Tsuen Wan to either Yuen Long or Tuen Mun), type <strong>of</strong> trainoperation and operator have all to be decided. CTS-2 analyses indicate that theroute from Tsuen Wan to Yuen Long has advantages but much would depend onthe detailed engineering feasibility studies <strong>of</strong> the alternatives. Regarding trainoperations, the evaluations indicate that light rail probably would not be adequatefor future demands but whether operations should be full heavy rail like the MTR orKCR, or some intermediate configuration, remains to be settled.7.15.5 CTS-2 assumed that the North-west New Territories Urban Link would be operatedas an extension <strong>of</strong> the MTR with through trains operating from Central on <strong>Hong</strong><strong>Kong</strong> Island to the NWNT terminus. Alternatively, the route could operate as ashuttle to and from Tsuen Wan, with convenient interchange with MTR at thatstation. It is important, however, that the fares on the urban link are fully integratedwith the MTR fare structure to encourage maximum use <strong>of</strong> this expensive facility.Bus competition should be restricted in line with current policy on inter-modalcoordination. If fare competition is allowed, it would seriously jeopardise theviability <strong>of</strong> this project.7.15.6 For both the Junk Bay extension and the North-west New Territories Urban Link,the timing <strong>of</strong> the new rail project should depend on growth in population. However,it can also be observed that the presence or otherwise <strong>of</strong> a rail link is likely to have astrong effect on the population growth that could be achieved. It is also likely tohave a critical effect on the build up <strong>of</strong> both Junk Bay New Town, in the case <strong>of</strong> theJunk Bay extension, and Tin Shui Wai New Town, in the case <strong>of</strong> the North-westNew Territories urban rail link. It seems clear, therefore, that the new rail lines andthe development <strong>of</strong> the new towns proceed hand-in-hand, each reinforcing theprospects and utility <strong>of</strong> the other.146
Rail Lines in the Existing Urban Area7.15.7 <strong>The</strong> evaluations indicate that there are many projects which could provide relief tothe'existing rail network in the main urban area. Certainly, if growth in rail patronagefollows the projections <strong>of</strong> this Study, then at least an additional harbour crossingwould be required in the early 1990s; this requirement would be reinforced by theopening <strong>of</strong> the two rail extension projects in the mid-1990s discussed above.7.1 5.8 <strong>The</strong> evaluation <strong>of</strong> the East Kowioon Line indicate that there is a potential for a majornew railway line in the central urban area by the late 1990s f although not necessarilyon the currently defined alignment <strong>of</strong> the East Kowloon Line. A new central urbanrail line would be a major investment and the expectations from the project shouldnot be too narrowly defined, in particular, such a project would be likely to have astrong influence on urban development. With the major review <strong>of</strong> urban areadevelopment currently underway in a series <strong>of</strong> studies; Central and Wan ChaiReclamation, Green Island Reclamation, West Kowloon Reclamation, the Port andAirport Development Strategy (PADS) Study and METRO PLAN, there would appearto be an opportunity to harness the planning <strong>of</strong> a new urban rail line to help achieveurban development goals.7.15.9 Since urban development plans are in such a state <strong>of</strong> flux at the present time, there islittle point in CTS-2 making firm recommendations before land use proposals areclarified. It is certainly clear that transport planning and land use planning should gohand-in-hand. <strong>The</strong>refore the CTS-2 rail project evaluations in the central urban areashould be regarded as indicative only, with final alignments <strong>of</strong> any new projectspending the current series <strong>of</strong> reclamation and urban development studies.7.15.10 <strong>The</strong> urgent need for a new rail cross-harbour link has been identified. CTS-2 hasprovisionally identified the MTR Yau Ma Tes to Fortress link as the new rail harbourcrossing, but final selection <strong>of</strong> route must be set in the context <strong>of</strong> long term raildevelopment plans. For example, if Yau Ma Tei to Fortress were to be built, it wouldcreate an underground barrier across the southern tip <strong>of</strong> the Kowloon peninsulawhich would present a serious obstacle to other possible rail lines, such as an EastKowloon Line or extensions to the KCR main line. <strong>The</strong>refore, the decision to buildthis project cannot be taken in isolation.7.15.11 <strong>The</strong> functions <strong>of</strong> this cross-harbour link would be as follows:(1) to relieve the MTR Nathan Road corridor <strong>of</strong> excess demand which will build upeven without other new rail lines(2) to accommodate additional rail passenger demands imposed in the urban areaby the two New Territories rail extensions recommended by the Study(3) to provide an interchange between the KCR main line and the MTR system atHung Horn to relieve the presently overloaded interchange .at Kowloon TongFinancial Support7.15.12 None <strong>of</strong> the rail projects identified would be fully financially viable in the sense <strong>of</strong>revenues from passengers paying for the entire cost <strong>of</strong> initial investment andsubsequent rail operations- However, all projects should cover operating costs andequipment depreciation from revenues, leaving an operating surplus.7.15.13 Financing <strong>of</strong> the cross-harbour rail link could be linked to the construction <strong>of</strong> theWestern Harbour Crossing road tunnel recommended in the CTS-2 highwaystrategy. It would not be satisfactory for the rail and road crossings to share the sametunnel for both technical reasons (tunnel size and tunnel gradients) and locatsonalreasons (the Western Harbour Crossing would not be a good location for the nextrail harbour crossing). However, if the tunnels were built at the same time, significantcost savings might be possible in the operation <strong>of</strong> the necessary tunnel constructionfacilities. This may <strong>of</strong>fer a means to tie together the financing <strong>of</strong> the two projects.147
7.15.14 Financial support for the new rail lines would be required and could come ina variety <strong>of</strong> forms. Internal financing by the existing rail corporations based onrevenues from other rail lines is also a possibility. <strong>The</strong> financial position <strong>of</strong> the twocorporations should be taken into account in deciding the scale <strong>of</strong> support that isrequired <strong>of</strong> the Government.Next Steps7.15.15 <strong>The</strong> CTS-2 Study recommends three railway projects for construction in the early1990s:(1) MTR Junk Bay Extension(2) North-West New Territories Urban Link(3) An additional cross-harbour rail link7.15.16 Subject to a firm Government decision to proceed with these projects and toagreement on any financing arrangement required, detailed engineering and planningstudies are now required to define the details <strong>of</strong> these projects and to prepareconstruction plans. This should be relatively straightforward in the case <strong>of</strong> the JunkBay extension where some initial planning has already been undertaken.7.15.17 <strong>The</strong> North-West New Territories Urban Link will require more work, since severalmajor choices have to be made as discussed above, However, the choices are welldefined and the final selection <strong>of</strong> route and operation should not present technicaldifficulties.7.15.18 <strong>The</strong> study <strong>of</strong> an additional rail harbour crossing is more complex. It is essential thatsuch a crossing fit with long term urban rail developments and these will be stronglyinfluenced by plans for the development <strong>of</strong> the urban area. <strong>The</strong>se plans are underclose examination at the present time in a series <strong>of</strong> studies <strong>of</strong> new reclamations,airport re-location, and urban renewal. It is essential that the needs for raildevelopment, and the opportunities afforded by rail development, are fully takeninto account in the recommendations <strong>of</strong> these studies. Decisions on urban area railstrategy, and the location <strong>of</strong> the next cross-harbour rail link, should be made at anearly date to permit detailed location and construction studies to proceed as soon aspossible.148
88.1 introduction8.1.1 This chapter examines the future role <strong>of</strong> public transport operations in the light <strong>of</strong> theinfrastructure programmes and policies recommended by the Study and presented inother chapters.8.1.2 It should be stressed at the outset that CTS-2 is a strategic study and has not carriedout any detailed planning <strong>of</strong> individual public transport routes. This type <strong>of</strong> work isthe province <strong>of</strong> the short term local public transport studies which are carried outroutinely in Transport Department. However, the CTS model is, and will continue tobe, available for use in such studies.8.1.3 <strong>The</strong> evaluation <strong>of</strong> public transport options must inevitably concentrate on the shortto medium term. For this reason, most <strong>of</strong> the discussion in this chapter focusses onthe Study projections for 1 996, rather than 2001 as in other chapters.8.2 Importance <strong>of</strong> Public Transport8.2.1 <strong>The</strong> overwhelming majority <strong>of</strong> travellers in <strong>Hong</strong> <strong>Kong</strong> use public transport. This isillustrated in Figure 8.1 which shows passenger-kilometres <strong>of</strong> travel by each mode<strong>of</strong> transport observed in 1986 and projected for 1996. Public transport servicescarried 87% <strong>of</strong> all travel in 1986; this is projected to drop to 85% in 1996, andcompares with the 89% by public transport estimated by the first CTS for 1974. Even"with the slight switch to private car, public transport continues to dominate.8.2.2 Road-based public transport uses a very small proportion <strong>of</strong> total road space. This isillustrated in Figure 8.2 which shows the share <strong>of</strong> road space occupied by eachmode <strong>of</strong> transport, observed in 1986 and projected to 1996, and allowing for thedifferent sizes <strong>of</strong> vehicle employed by each mode by converting vehicle-kilometresto pcu-kilometres (see Section 5.7 <strong>of</strong> Chapter 5 for definitions). <strong>The</strong> public transportmodes occupied 38% <strong>of</strong> all road space in 1986. This is projected to drop to 26% in1996 as some public transport travel switches to the new rail lines recommended byCTS-2, and goods vehicle usage expands.8.2.3 An index <strong>of</strong> the relative efficiency <strong>of</strong> each mode in the use <strong>of</strong> road space to carrytravellers can be established by dividing passenger-kilometres by pcu-kilometres.While being a similar measure to average vehicle occupancy, the index also takesinto account the dead kilometrage performed by taxis and public transport vehicleswhen they have no passengers. Based on the data presented in Figures 8.1 and 8.2,the following efficiency indices were derived for 1996:Taxi 1.2Private car 1.9SPB 4.1Minibus 5.5Bus 13.48.2.4 Taxis have the lowest efficiency index, significantly lower than cars, due mainly toempty taxis circulating and searching for passengers. Other public modes are muchmore efficient than cars with indices reflecting higher vehicle carrying capacity. Inhigh demand corridors served by the highest capacity buses, the index for busoperations could be much higher than that shown.8.2.5 Public transport services by road, rail and ferry are provided by a wide variety <strong>of</strong>operators, the most important <strong>of</strong> which are listed in Table 8.1. <strong>The</strong> table shows therelative importance <strong>of</strong> each operation in terms <strong>of</strong> average daily boardings in 1988and makes a comparison with similar figures for 1976 which marked the end <strong>of</strong> thefirst Comprehensive Transport Study (CTS). Overall, average daily boardings increasedby 65% since the first CTS, totalling nearly 10 million boardings per dayin 1988.149
FIGURE 8.1: PASSENGER TRANSPORT BY MODE(Share <strong>of</strong> Territory-wide passenger-kms)Bus 36%Ferry 2%Ferry 2%Rail 26%Bus 27%Rail 41%PLB 9%^^^^^ Car 13%8PB 7% Taxi 7%1986PLB 6%8PB 6%Tax,19961996 Assumes Full CT8-2 RecommendedProgramme Of Projects And PoliciesFIGURE 8.2: PROJECTED USE OF ROAD SPACE(Share <strong>of</strong> Territory-wide pcu-kms)Qoods Vehicle 42%Qoods Vehicle 61%Taxi 19%Taxi 12%8PB6%Bus 8%PLB 6%1986Car 20%8PB 4%Bus 6%PLB 3%1996Car 24%1996 Assumes Full CT8-2 RecommendedProgramme Of Projects And PoliciesShare Off PCU-KM Per DayPCU • Passenger Car Unit150
Table 8.1 PUBLIC TRANSPORT OPERATIONS (1976 and 1988)(mid-year)Boardings Per Day (thousands)1976Number%NumberXGrowth76-88RailMass Transit RailwayKowloon-Canton Railway<strong>Hong</strong>kong Tramways0343510161 63040335617441 085%1%3857238925521%Ferry<strong>Hong</strong>kong and Yaumati Ferry'Star' FerryMinor Ferry3711391962020311016210-45%-21%-16%52983293-38%BusKowloon Motor BusChina Motor BusNew Lantao Bus1 9636325331103043884-9319055%40%80%26004439364051%Other Road Services 1Red MinibusGreen minibusNon-franchised bus1 585035027069626135131065-40%47%Taxi50081 050111 1 0%24354131383229%Total Public Transport5949100979210065%Estimates <strong>of</strong> patronage very approximate151
Railways8.2.6 Rail services began to expand considerably from 1979 onwards as the Mass TransitRailway (MTR) run by the Mass Transit Railway Corporation (MTRC) was opened.Three lines are now open:Yau Ma Tei to Kwun Tong (1979)Central to Tsuen Wan (1980/82)Sheung Wan to Chai Wan (1985/86)8.2.7 Rail traffic was further augmented by the completion in 1983 <strong>of</strong> the electrificationand double-tracking <strong>of</strong> the Kowloon-Canton Railway (KCR) main line from HungHorn to Lo Wu and the opening in 1988 <strong>of</strong> the Light Rail Transit (LRT) systemlinking Tuen Mun and Yuen Long in the Northwest New Territories. <strong>The</strong> <strong>Hong</strong>kongTramway operating along the north shore <strong>of</strong> <strong>Hong</strong> <strong>Kong</strong> Island carries about thesame passengers in 1988 as in 1976. Railways account for over 25% <strong>of</strong> the totaldaily public transport boardings by the end <strong>of</strong> 1988.Buses8.2.8 Bus operations are dominated by CMB and KMB services. CMB holds a franchisefor specific bus routes on <strong>Hong</strong> <strong>Kong</strong> Island while KMB holds the franchise forspecific routes in Kowloon and most <strong>of</strong> the New Territories; both companies sharecross-harbour bus routes. Since the opening <strong>of</strong> the Northwest Light Rail Transit(LRT) system, the Kowloon-Canton Railway Corporation (KCRC) has operated busservices in the North-west New Territories within a defined Transit Service Area,feeding and supplementing the LRT network in that area. <strong>The</strong> New Lantao BusCompany holds franchises for specific bus routes on Lantau Island. Buses accountfor 38% <strong>of</strong> the daily public transport boardings by the end <strong>of</strong> 1988.Ferries8.2.9 Franchised ferry services are provided by two companies; the Star Ferry Companyoperating three services between <strong>Hong</strong> <strong>Kong</strong> island and the southern tip <strong>of</strong>Kowloon (both the Star Ferry pier and Hung Horn), and the <strong>Hong</strong>kong and YaumatiFerry Company operating a mixture <strong>of</strong> cross-harbour ferries and ferry services to theoutlying islands. <strong>The</strong> franchised ferries are supplemented by some smaller licensedferry operations. Ferries in 1988 accounted for 3% <strong>of</strong> the daily public transportboardings.Public Light Buses8.2.10 Public minibus services are divided into two classes, visually distinguished by thecolour stripe on the side <strong>of</strong> the vehicle. <strong>The</strong> red minibuses operate non-scheduledbut regular services along the main public transport corridors. <strong>The</strong>y are operated byindividuals who are usually grouped into associations which generally cover specificareas or routes. Green minibuses are licensed by Government to operate by route;they have mostly been set up as feeder services operating <strong>of</strong>f the main transportcorridors. In 1988 minibuses accounted for some 16% <strong>of</strong> the daily public transportboardings.Taxis8.2.11 Three classes <strong>of</strong> taxi services operate in the Territory; at the end <strong>of</strong> 1988, the number<strong>of</strong> vehicles licensed in each class were as follows:Urban 14334New Territories 2 431Lantau 4016805Taxi's in 1988 accounted for some 11% <strong>of</strong> the daily public transport boardings.152
Other Road-Based Public Transport8.2.12 "Special purpose bus" (SPB) is a class <strong>of</strong> vehicle defined for transport planningpurposes to account for non-franchised public and private buses. SPBs cover a widerange <strong>of</strong> specialised services, including school buses, residential buses for estates,works buses for factories, tour buses and some buses for the disabled. In total theseaccounted in 1 988 for some 5% <strong>of</strong> the daily public transport boardings.8.2.1 3 All <strong>of</strong> the operators listed in Table 8.1 are private, with the notable exceptions <strong>of</strong> thetwo rail corporations: the MTRC and KCRC. Government monitors all privatelyoperated public transport operations and, except for red minibuses, special purposebuses and smaller ferries, makes frequent suggestions to improve and rationaliseservices. <strong>The</strong>se suggestions have force since changes in fares and service schedulesproposed by the operators have to be agreed with Government. Government directlysets the fare tariffs for taxis, adjusting and sealing the taximeters which register thefare. <strong>The</strong> rail corporations are charged with running their operations on a prudentcommercial basis. <strong>The</strong>y have the power to set their own fares, notifying Government<strong>of</strong> their intentions in advance.8.3 Demand Projections for Public Transport8.3.1 <strong>The</strong> projections <strong>of</strong> public transport patronage depend critically on the assumptionsabout population and employment. <strong>The</strong>se assumptions were set out in detail inChapter 4. <strong>The</strong> overall picture is one <strong>of</strong> decreasing population and employment inurban Kowloon, balanced by growth on <strong>Hong</strong> <strong>Kong</strong> Island and in the NewTerritories. Population growth is expected to be particularly strong in the NewTowns with a projected ....... increase <strong>of</strong> one million between 1986 andment growth is expected to be strong on <strong>Hong</strong> <strong>Kong</strong> island, with a projected 43%grpwtfi .......In ..... pverair'eWploYrrient including 200 000, additional jobs projected, for theCentral ........ and Wan Chai. <strong>The</strong> new towns are projected to attract jobs but not insufficient numbers to be self-contained in terms <strong>of</strong> employment opportunities forthe population.8.3.2 <strong>The</strong> major impact on travel demand <strong>of</strong> these assumptions is likely to be as follows:(1) <strong>The</strong> increasing jmp^Qitance, <strong>of</strong> the north shore <strong>of</strong> <strong>Hong</strong> .........K.oiigJMaadjs likely tolead to a large increase in cross harbour 'travel.(2) <strong>The</strong> new towns are likely to generate substantial out-bound commuting, much<strong>of</strong> which would be long distance, as the projected increase in jobs to match thenew town population growth will be located on <strong>Hong</strong> <strong>Kong</strong> Island.(3) <strong>The</strong> projected loss <strong>of</strong> population and jobs in urban Kowloon and Tsuen Wanbetween 1 986 and 2001 would substantially reduce the number <strong>of</strong> trips startingand ending within the area <strong>of</strong> urban Kowloon. <strong>The</strong>refore, an increasingproportion <strong>of</strong> the travel on the streets <strong>of</strong> Kowloon would be longer distancecommuting trips from the new towns, rather than short distance local trips.(4) <strong>The</strong> land use assumptions are likely to emphasise, rather than reduce, thepeaking problems <strong>of</strong> the rail modes, by emphasising the proportion <strong>of</strong> longdistance commuting.8.3.3 <strong>The</strong> demand for travel by scheduled public transport (excluding taxis and SPBs) isshown by area in Table 8.2 comparing 1986 with 1996. <strong>The</strong> growth is in line withthe assumed land use changes. ([here is an overall growth <strong>of</strong> 27% in total publictransport travel, but this combines a 12% decrease in urban Kowloon and TsuenWan, with increases <strong>of</strong> 25% for internal movements on <strong>Hong</strong> <strong>Kong</strong> Island jyjjyiQLcrjoss-harhojjir travel, 75% for movements to and from the New Territories and 98%for movements within the New Territories. Increases in the New Territories areassociated with the growtK<strong>of</strong> the new towns in the North-east and North-west NewTerritories and at Junk Bay. }153
Table 8.2PROJECTED DEMAND FOR SCHEDULED PUBLICTRANSPORT BY AREA(excluding Taxi and SPB)AreaTrips Per Day 11986 1996(thousands)Growth86-96<strong>Hong</strong> <strong>Kong</strong> IslandInternal (North shore)Internal (other)6772318063271.?%42%"Total Internal <strong>Hong</strong> <strong>Kong</strong>9081 13325%Cross HarbourHK—Urban KowloonHK—North-east NTHK—North-west NT1 086103411 52223510340%1 28%151%Total Cross-Harbour1 2301 86051%Kowloon and Jsuen Wan (Urban)Internal26222318-12%Urban—New Territories 2Urban—North-east NT (exclude Junk Bay)Urban—Junk BayUrban—North-west NT5011521677916933155%1 027%53%Total Urban—New Territories7321 27975%New Territories 3Internal North-eastInternal North-westInternal other197160216429494213118%209gTotal New Territories5731 13698%Grand Total6065772627%Note'. 1996 estimates assume recommended CTS-2 highways and railways1 Trips, not boardings2 Urban includes Kowloon and Tsuen Wan3 New Territories exclude Tsuen Wan154
8.3.4 <strong>The</strong> impact <strong>of</strong> this growth in demand for travel is shown in Table 8.3 for 1996 interms <strong>of</strong> the passengers travelling along certain key corridors. <strong>The</strong> locations selectedare based on the standard screenlines used in Annual Traffic Census carried out byTransport Department and illustrated in Figure 8.3.8.3(passengers per day)Location1986 1996^Volume % Rail % Ferry Volume % Rail(thous)(thous)% FerryGrowth86-96<strong>Hong</strong> <strong>Kong</strong> Island (F-F)Cross-harbourUrban Kowioon (C-C)7501 2101 54165%49%49%22%8991 919207771%63%65%15%20%59%35%Kowloon to New Territories:Kwas Chung CorridorSha Tin Corridor 2Junk Bay Corridor8535864343%42%1 0891 06627763%47%52%28%82%544%North-west NT (S-S)25257142%127%North-east'NT (T-T)21955%39261%79%Note: For screenline locations, see Figure 8.21 Assumes CTS-2 recommended highway and railway programme2 Corridor includes, Tai Po Road, Lion Rock Tunnel and Tate's Cairn Tunnel8.3.5 <strong>The</strong> lowest growth is projected for the urban area on <strong>Hong</strong> <strong>Kong</strong> Island with only20% growth; this low growth is primarily a result <strong>of</strong> the opening <strong>of</strong> the EasternHarbour Crossing which should divert some travel from the existing Cross Harbourtunnel and reduce the growth in flows across the screenline F-F. Cross harbourtravel is forecast to increase by 59%, mainly as a result <strong>of</strong> the land use changesdiscussed above but also influenced by the third rail harbour crossing assumedbetween Yau Ma Tes and Fortress. MTR is expected to carry 63% <strong>of</strong> all cross harbourtraffic in 1996, while ferry declines from 22% to 1 5%.8.3.6 <strong>The</strong> Sha Tin corridor comprises, Tai Po Road, and the Lion Rock and Tate's Cairntunnels; this group <strong>of</strong> roads intercepts all traffic between the North-east NewTerritories and the urban area. <strong>The</strong> forecast increase <strong>of</strong> 82% in traffic is in line withthe population changes assumed. <strong>The</strong> proportion using rail (KCR) is relatively low at47%, due to strong competition from tunnel buses which <strong>of</strong>fer more direct serviceto many locations; most KCR passengers would need to change to the MTR tocomplete their journey.8.3.7 <strong>The</strong> largest growth in traffic is attributed to the planned expansion <strong>of</strong> the new towns.<strong>The</strong> number <strong>of</strong> people travelling each day between Junk Bay and urban Kowloon isforecast at 277 000, <strong>of</strong> which 52% would use the MTR. <strong>The</strong> projected growth acrossthe North-west New Territories screenline is caused by the developments at TuenMun, Yuen Long and Tin Shui Was; population there is expected to double between1986 and 1996. <strong>The</strong> very strong growth in traffic to and from the North-west NewTerritories is linked to the influence <strong>of</strong> the recommended rail urban link betweenTsuen Wan and Yuen Long. <strong>The</strong> growth in the North-east New Territories wouldarise from the development at Sheung Shui and a forecast increase in internationalcross-border rail traffic.155
FANLING/SHEUNG SHUIYUENLONGMA ON SHAN'TUEN MUNTSUENWANKWAI* CHUNGSNATINJUNKBAYCrossHarbourc3Figure 8.3SCREENUNE LOCATIONS
8.3.8 Table 8.4 shows the projected growth in patronage by scheduled public transportfrom 1986 to 2001. An overall growth <strong>of</strong> 31 % is projected between 1986 and 1996,with the largest gains for the rail services. A further growth <strong>of</strong> 7% is projected for thefive year period to 2001.8.4OF(excluding Taxi and SPB)Mode1986Number(thous)Boardings Per Day 11996 2y 0 Number %(thous)2001 2Number(thous)Growth86-96 96-01Mass Transit RailwayKowloon-Canton Railway:—Main line heavy rail—Light rail transit 3<strong>Hong</strong>kong Tramways1 530358 0324221219 26214 7020 6934 37827 4 39424 2 8887 7957 7393 455414877267644371%96%17%99%10%13% 7%11%Ferry<strong>Hong</strong>kong and Yaumati Ferry:Cross-harbour servicesOutlying island servicesStar Ferry14243116301125 5215733415252172376-16%29%35%8%12%23%10%12%BusKowloon Motor Bus 4China Motor Bus 4Cross-harbour bus 53034612336398238 84503148721439430830 74413247806470452329744018%31%3%12% 7%5%Minibus ServicesRed MinibusGreen minibus9136031 51611 8198218091 63079180915 1 60014-17% 24%-1%0%4%2%Total Public Transport801110010666100 11 37610031%7%1 Trips per day for MTR and KCR2 Assuming completion <strong>of</strong> CTS-2 recommended highways and railways3 Including bus feeder services operated by KCRC4 Excluding cross-harbour buses5 Operated by CMB and KMBPeak-Hour Demands8.3.9 (J-ike all major cities, <strong>Hong</strong> <strong>Kong</strong> faces the difficulty <strong>of</strong> providing sufficient publictransport capacity to carry peak period demand. )Prior to the opening <strong>of</strong> the MTR andmodernisation <strong>of</strong> the KCR, the peak problem was primarily encountered on buses,ferries and other public transport services. Surveys showed that passengers frequentlymissed the first bus, and sometimes the second and third as well; at ferrypiers, passengers were formed into platoons, again to wait for sometimes two orthree ferries before they could board(Jhe problem is now focused on the rail system.<strong>The</strong>re is always concern for safety <strong>of</strong> passengers under conditions <strong>of</strong> overcrowding,but there is additional concern for railways such as the MTR and the KCR because <strong>of</strong>the proximity <strong>of</strong> passengers to the track on crowded platform edges.,8.3.10 <strong>The</strong> expansion <strong>of</strong> the rail system emphasised the peak, since the regularity <strong>of</strong>services independent <strong>of</strong> road congestion rrjade it easier for passengers to predictarrival time with more confidence. Hence atjthe most congested section <strong>of</strong> the MTRsystem between Yau Ma Tei and Jordan, 22% <strong>of</strong> the daily southbound passengervolume occurs in the one-hour period from 8:15 am to 9:1 5 am. <strong>The</strong> peaking is more157
severe on the MTR island Line where 26% <strong>of</strong> the daily westbound passenger volumein the Wan Chai and Causeway Bay section occurs in this same one hour period. <strong>The</strong>KCR experiences the same problem with 22% <strong>of</strong> the daily southbound volumemoving in the morning peak hour. In.comparison, peak one-way flows on busesgenerally do not exceed 15% <strong>of</strong> the daily volume. This sharp peaking on the railsystemjs wasteful <strong>of</strong> equipment with many trains required for only a short period <strong>of</strong>the day/8.3.11 /Providing extra rail capacity is one potential solution to the rail peak houroverloading problem, but it is an expensive one. A better approach to the problem isto try and spread the peak demand over a longer period. This can be done byadjusting fares to make <strong>of</strong>f-peak hour reductions. It can be noted that provision <strong>of</strong>rolling stock which is only required for a short peak period is expensive, and is anexpense which is ultimately borne by the passengers in higher fares. <strong>The</strong> MTRCintroduced <strong>of</strong>f-peak fare reductions in 1988; the results were mixed but they didappear to control the growth <strong>of</strong> peak demands. This Study recommends further/neasures <strong>of</strong> this type to positively encourage passengers to avoid the peak periods.8.3.12 { Measures to promote the staggering <strong>of</strong> working hours would also be <strong>of</strong> help. <strong>The</strong>se"are discussed in Chapter 9.Another more fundamental approach would be to actively encourage decentralisation<strong>of</strong>_the Central Business District functions to new town areas rather Than toconcentrate such "activities in Central, Wan Chai and Tsim Sha. Tsui. An alternativeto induce the development <strong>of</strong> commercial centres around selected transport snter-- changes throughout the urban area should be considered and promoted.)8.4 Rail OperationsMass Transit Railway (MTR)8.4.1 <strong>The</strong> projections <strong>of</strong> rail traffic presented in Table 8.4 assume completion <strong>of</strong> theEastern Harbour Crossing MTR extension, due to open in 1989, and three railprojects recommended by CTS-2 for construction in the early 1990s:MTR extension to Junk BayNorth-west NT urban rail link: Tsuen Wan to Yuen Long/Tuen MunRail cross-harbour link: Yau Ma Tei to FortressDetails <strong>of</strong> the evaluation <strong>of</strong> new passenger rail lines and why these three projectswere selected can be found in Chapter 7.8.4.2 • <strong>The</strong>re is little doubt that the rail line to Junk Bay would be an extension to the MTR.For the other two links, decisions have yet been taken on operator; they will dependon the more detailed operational and engineering studies to be completed afterCTS-2. However, for the purposes <strong>of</strong> projecting traffic volumes, these links were allassumed to be operated by the MTRC.8.4.3 Projected traffic growth on MTR is high with a 71% growth over the ten years from1986 to 1996 to reach 2.62 million passengers per day. In the absence <strong>of</strong> the threenew extensions, projected 1996 volumes are reduced to 2.26 million passengersdaily, a growth <strong>of</strong> 48% from 1986. However, without additional capacity providedby the new cross-harbour link, limited capacity in the Nathan Road corridor wouldprobably restrict growth.8.4.4 <strong>The</strong> patronage forecast for MTR without new rail lines is slightly lower than the mostrecent trends indicated for MTR growth; this can be attributed to several reasons:(1) Over the last few years, the MTR has benefited from the strong growth in theeconomy; future economic growth is assumed to remain strong but would bemore moderate than in the last few years.(2) <strong>The</strong> land use assumptions indicate a decline in land use activity <strong>of</strong> more than15% between 1986 and 1996 in urban Kowloon; this would have a directimpact on traffic volumes.158
(3) <strong>The</strong> completion <strong>of</strong> several highway projects now under construction; in particular,the Eastern Harbour Crossing, Tate's Cairn tunnel and Route 5 betweenSha Tin and Tsuen Wan, should enable some journeys to be made more directlyby bus; this competition will reduce MTR growth.8.4.5 • Capacity constraints at two locations will influence the future traffic growth on the'*MTR: the Nathan Road Corridor and the Kowloon Tong interchange with the KCEL<strong>The</strong> Kowloon Tong interchange was discussed in Chapter 7. <strong>The</strong> Nathan RoadCorridor problem is discussed further in the next paragraphs.8.4.6 Nathan Road Corridor—This section <strong>of</strong> the MTR from Mongkok to Tsim Sha Tsui isalready running at full capacity in the morning peak hour. It is expected that theopening <strong>of</strong> the Eastern Harbour Crossing MTR extension in 1989 will relieve thiscorridor, but with further growth is likely to reach capacity again by the early 1990s.Construction <strong>of</strong> a new cross-harbour rail link, such as the Yau Ma Tes to Fortress linkdiscussed in Chapter 7, would provide additional relief but this might not becompleted before mid 1990s. <strong>The</strong> short term solution to managing demand,therefore, lies with the fare policy adopted. Two possibilities are available:(1) Discounts to encourage more passengers to travel before or after the peak, asdiscussed earlier in this Chapter.(2) Fare incentives to encourage use <strong>of</strong> the Eastern Harbour Crossing to reachCentral and Wan Chai from Kowloon. Passenger interchange at Quarry BayStation between the Island Line and the new Eastern Harbour Crossing line willbe via a passageway connecting the platforms. By installing ticket barriers inthis passageway, it should be possible to introduce a fare discount for users <strong>of</strong>the Eastern Harbour Crossing.8.4.7 Much depends on the changes in travel patterns that actually take place after theopening <strong>of</strong> the Eastern Harbour Crossing. It is also possible that the improvement <strong>of</strong>bus accessibility to,the urban area following the opening <strong>of</strong> Tate's Cairn tunnel willalso help to relieve the rail passenger loads in the Nathan Road Corridor.Kowloon-Canton Railway (KCR)8.4.8 Traffic on the KCR is projected to double between 1986 and 1996. <strong>The</strong> increase intraffic is attributed to population developments planned for the KCR corridor andgrowth <strong>of</strong> international traffic. <strong>The</strong> composition <strong>of</strong> the KCR traffic is shown in Table8.5 below, classified by type <strong>of</strong> movement.Table 8.5OF KCR TRAFFIC(passenger volumes in thousands)Movement 1986 1996 GrowthInternational traffic 52 108 108%Internal New Territories " 39 163 318%Internal Kowloon Urban 15 22 47%Urban Kowloon to NT 252 409 62%Total 358 702 96%8.4.9 <strong>The</strong> main movement that served by KCR is between the North-east New Territoriesand the urban area. This is forecast to remain the largest class <strong>of</strong> traffic, although theopening <strong>of</strong> the Tate's Cairn and Route 5 highway tunnels will provide opportunitiesfor particular bus services which should moderate rail growth. Cross border passengersform a significant part <strong>of</strong> the KCR traffic stream, doubling in volumebetween 1986 and 1996. <strong>The</strong> fastest growing traffic group is internal traffic withinthe New Territories, where KCR provides a direct and fast link between Sha Tin, TaiPo, Fanling and Sheung Shut.159
8.4.10 <strong>The</strong> KCR main Sine is expected to have sufficient capacity to carry these projectedtraffic volumes. Existing capacity can be upgraded by running longer trains (12-carsinstead <strong>of</strong> 9-cars) and by modifying the seating arrangements in the carriages.Greater capacity could be provided by upgrading the signalling system to permitmore frequent trains, at least in the peak periods. However, higher passengervolumes will also require improvements in passenger facilities at stations.8.4.11 KCR is also affected by the limits to capacity <strong>of</strong> the Kowloon Tong interchange withthe MTR, discussed in Chapter 7. Some relief can be expected with the development<strong>of</strong> bus routes through the new Tate's Cairn and Route 5 tunnels and longer termrelief would be achieved by the construction <strong>of</strong> the Yau Ma Tei to Fortress railcrossing, by providing another interchange between MTR and KCR at Hung Horn.<strong>The</strong> Northwest Railway8.4.12 <strong>The</strong> Northwest Railway, known more familiarly as the LRT (for light rail transit),operates within a defined Transit Service Area (TSA) covering Tuen Mun, YuenLong, Tin Shui Wai and the Castle Peak Road corridors. Both light rail and busservices within the TSA are operated under the KCRC Ordinance; buses generallyprovide feeder services to light rail routes to maximise utilisation <strong>of</strong> the light railway.8.4.13 Public transport services to and from the TSA are provided primarily by KMB busesbut also PLBs and H YF ferries. This Study is recommending the construction <strong>of</strong> a railline to link the TSA with the main urban area, with a route from the present MTRterminus at Tsuen Wan to either Yuen Long or Tuen Mun; the chosen route wouldcomprise the so-called urban rail link.8.4.14 <strong>The</strong> population <strong>of</strong> the TSA is projected to double in the 10 years from 1986 to 1996.By that date, the TSA is projected to include 11 % <strong>of</strong> all the population and 9% <strong>of</strong> allthe jobs in the Territory. Population growth beyond 2001 could continue to bestrong if the later stages <strong>of</strong> Tin Shui Wai are committed.8.4.15 <strong>The</strong> LRT opened in September 1988 and was carrying about 160000 passengersper day by the end <strong>of</strong> the year. Future growth in patronage will clearly depend verymuch on the growth in population and employment within the TSA and on theability <strong>of</strong> the LRT to meet the demands placed on it. <strong>The</strong> construction <strong>of</strong> the urbanrail link would place greater demands on the LRT, by increasing the proportion <strong>of</strong>external travel and by using the LRT as a feeder to the urban rail link terminus in theTSA. With the full population and employment growth currently projected and withthe completion <strong>of</strong> the LRT Regional System and the construction <strong>of</strong> the urban raillink, daily patronage <strong>of</strong> the LRT could reach 700 000 by 2001.<strong>Hong</strong>kong Tramways8.4.16 <strong>Hong</strong>kong Tramways Ltd (H KT) provides a street tram service along the north shore<strong>of</strong> <strong>Hong</strong> <strong>Kong</strong> Island between Kennedy Town and Shau Kei Wan. It caters mainly forshort distance trips and has successfully survived the introduction <strong>of</strong> the MTR islandLine and competition from buses.8.4.17 Tramways patronage fell <strong>of</strong>f sharply in the early 1980s, mainly in response to tw<strong>of</strong>are increases and stronger bus competition. It began to recover even before theopening <strong>of</strong> the MTR Island Line, and has continued to rise steadily over the last fouryears to reach 360000 boardings daily in 1988. Continued moderate growth isforecast, subject to slight variations caused by land use developments and competingtransport services. HKT has engaged consultants to study improvements andpossible extensions to the tramways, but these have not been examined by CTS-2.8.5 Bus Operations<strong>The</strong> Kowloon Motor Bus Company (KMB)8.5.1 KMB is the largest public transport carrier in <strong>Hong</strong> <strong>Kong</strong>. Over the last ten years,KM B has had to absorb the impact <strong>of</strong> the opening <strong>of</strong> the MTR and the changing land160
use distribution in Kowloon and the New Territories. Additionally, KMB is nowprohibited from serving internal movements in the LRT's North-west New TerritoriesTransit Service Area (ISA). Boardings on the urban area routes have declined in thelast four years, but growth has occurred in the New Territories, especially on themajor commuter routes which suffer from high peak hour factors.8.5.2 <strong>The</strong>se trends are expected to continue over the next ten years based on projectedland use changes. Also, three rail lines are recommended by CTS-2 which wouldtake away yet more patronage from KMB.8.5.3 <strong>The</strong>refore, although total scheduled public transport boardings are expected to growby 31% between 1986 and 1996, KMB boardings overall are expected to grow by4% assuming all three rail extensions are built. Without the three rail lines, thegrowth in KMB patronage could reach 17%. Projections <strong>of</strong> KMB traffic, excludingcross-harbour buses which are discussed separately, are as follows (in thousands <strong>of</strong>passengers per day):1986 1996 GrowthUrban 1 840 1 649 -10%Other 1 194 1 499 26%Total 3034 3148 4%8.5.4 In this table, "urban" includes all the routes operating within Tsuen Wan andKowloon. By 1996 these routes are projected to lose 10% <strong>of</strong> their patronage. <strong>The</strong>growth area for KMB is expected to be routes to and within the New Territories. Inparticular, KMB routes to the North-east New Territories are expected to benefitsubstantially from the opening <strong>of</strong> the Route 5 and Tate's Cairn tunnels. <strong>The</strong> growthin vehicle fleet and kilometrage requirements is expected to be faster than thegrowth in patronage reflecting the increase in longer distance travel.8.5.5 <strong>The</strong> CTS-2 analyses assumed that fares for all modes <strong>of</strong> public transport would beincreased in real terms to cover the expected increases in wage rates associated withstrong economic growth; this is discussed in Chapter 4. As with all other road-basedpublic transport operations, bus fare increases would have to be higher if trafficcongestion increases significantly from current levels.China Motor Bus Company (CMB)8.5.6 CMB lost traffic on the opening <strong>of</strong> the MTR Island Line in 1985. Traffic in 1988 wasapproximately 900 000 passengers per day, compared with nearly 1 million per dayin 1984. Prospects for future growth are good, though, and CMB does not face thesame problems <strong>of</strong> falling population and increased rail competition as KMB.Estimates <strong>of</strong> growth, excluding cross-harbour services, are as follows (in thousands<strong>of</strong> passengers per day):1986 1996 GrowthIsland North 411 453 10%Island South 201 268 33%Total 612 721 18%8.5.7 With the growth <strong>of</strong> population and employment on <strong>Hong</strong> <strong>Kong</strong> Island, CMBservices, on the north shore <strong>of</strong> the Island and to and from the south <strong>of</strong> the Island, allshow reasonable growth. Total boardings are projected to grow by 18% in the tenyears from 1986 to 1996. *8.5.8 Patronage is currently either increasing or holding steady on the majority <strong>of</strong> routes.However, CMB will need to spend more on fleet replacement in the near future toaccommodate increased patronage and to renew its ageing fleet; this will affect itscompetitiveness.161
Cross Harbour Bus Operations8.5.9 <strong>The</strong> cross-harbour bus services are operated both by CMB and KMB. Most routesare operated by both companies, although KMB has three routes <strong>of</strong> its own and thushas rather more than half the patronage. <strong>The</strong>se routes also carry significant noncross-harbour passengers; in 1985 it was estimated that some 35% <strong>of</strong> routepatronage was <strong>of</strong> this type. <strong>The</strong> patronage figures reported by CTS-2, however, referonly to those passengers who cross the harbour. Projections are summarised belowby tunnel (in thousands <strong>of</strong> passengers per day).1986 1996 GrowthCross Harbour Tunnel 336 340 1%Eastern Harbour Crossing — 49 —Western Harbour Crossing — 50 —Total 336 439 31%8.5.10 As a result <strong>of</strong> the additional tunnels and the growth in cross harbour traffic, the crossharbour bus traffic is projected to grow by 31% despite the two additionalcross-harbour rail links included in the network.8.6 Ferry Operations8.6.1 Ferry traffic has been much affected by the provision <strong>of</strong> the cross-harbour road andrail tunnels. Opening <strong>of</strong> new tunnels, including the Eastern Harbour Crossing now inconstruction and further new tunnels recommended by CTS-2, will further affectferry operations.<strong>The</strong> Star Ferry Company8.6.2 Star Ferry operates three routes; Central to Tssm Sha Tsui, Central to Hung Horn, andTsim Sha Tsui to Wan Chai. <strong>The</strong>se are ail in the central harbour area, linking majortraffic generators. <strong>The</strong> projected traffic growth for each route is shown below (inthousands <strong>of</strong> passengers per day):1986 1996 GrowthCentral to Tsim Sha Tsui 101 118 17%Central to Hung Horn 15 18 20%Wanchai to Tsim Sha Tsui — 21 —Total 116 157 35%8.6.3 Patronage on the Central to Tsim Sha Tsui route reached a little over 160 000 in thelate 1970s prior to the opening <strong>of</strong> the MTR. After the initial losses, patronage hasbeen slowly recovering, reaching 91 000 by 1986. <strong>The</strong> route serves two <strong>of</strong> the majorand expanding commercial areas and also attracts some tourist traffic. <strong>The</strong> congestionon the MTR reinforces the attraction <strong>of</strong> ferry, leading to a projected patronage <strong>of</strong>around 120 000 per day in the mid 1990s.8.6.4 <strong>The</strong> Central to Hung Horn route is expected to lose some patronage when the ferrypier is moved further away from the KCR station during the reclamation <strong>of</strong> HungHorn Bay. On completion <strong>of</strong> the reclamation, the new developments could accommodateup to 50 000 people and 10 000 jobs within easy walking access <strong>of</strong> the ferrypier, and with a service taking them directly to job opportunities in Central. <strong>The</strong>reforethe route is expected to remain attractive.8.6.5 <strong>The</strong> Tsim Sha Tsui to Wan Chai route started operating in April 1988, and by the end<strong>of</strong> the year had a regular daily patronage <strong>of</strong> more than 10 000. <strong>The</strong>re are more <strong>of</strong>ficesand hotels yet to open on Wan Chai reclamation; therefore the projected patronage<strong>of</strong> 21 000 in 1996 should be reached easily.162
8.6.6 Ail routes operated by the Star Ferry Company wouid be vulnerable to disruptionscaused by the Central and Wan Chai Reclamation which is currently at the planningstage. Careful planning <strong>of</strong> the necessary relocations <strong>of</strong> ferry piers will be necessary toretain adequate access during the period <strong>of</strong> the reclamation.<strong>The</strong> <strong>Hong</strong>kong and Yaumati Ferry Company (HYF)8.6.7 HYF has been particularly affected by the opening <strong>of</strong> the existing road and railcross-harbour tunnels; the additional cross-harbour tunnels under construction andin planning are expected to reduce patronage further. By 1996, the Star Ferry isprojected to carry more passengers than HYF will carry on its cross-harbour routes.8.6.8 Projected traffic on the HYF cross-harbour routes has been analysed by four groupsin thousands <strong>of</strong> passengers per day, as follows:Routes 1988 1996 GrowthWestern Harbour 47 53 13%Central Harbour 38 18 -53%Eastern Harbour 52 42 -19%Tuen Mun Route 5 12 140%Total cross-harbour 142 125 -12%Outlying Islands 43 52 21%Total 185 177 -4%8.6.9 <strong>The</strong> Western Harbour services link Central to the western side <strong>of</strong> the Kowloonpeninsula. <strong>The</strong>y will face competition from buses using the planned WesternHarbour Crossing, although this would not be as severe as that presented by theEastern Harbour Crossing to the Eastern Harbour ferries. <strong>The</strong>re is a projectedincrease in employment jobs in Central but declining population in Kowloon. As aresult the routes show only a small increase in patronage to 1 996.8.6.10 <strong>The</strong> patronage on the Central to Tuen Mun route is projected to double between1986 and 1996; this is linked to the increases in population projected for the NewTerritories. This would require the acquisition <strong>of</strong> additional high speed ferries.8.6.11 <strong>The</strong> Eastern Harbour ferries are expected to lose about 19% <strong>of</strong> the 1986 traffic by1996, due to the opening <strong>of</strong> the Eastern Harbour Crossing. <strong>The</strong> Central Harbourferries show a similar pattern to the Eastern Harbour group. <strong>The</strong> Wan Chai to HungHorn route is expected to lose traffic to the Tsim Sha Tsui to Wan Chai routeoperated by Star Ferry which is cheaper and more frequent.8.6.12 Traffic associated with the outlying islands is expected to grow as a result <strong>of</strong>development on the islands, the general increase in trip-making with growingprosperity, and increases in recreational travel.8.7 Minibus Operations8.7.1 <strong>The</strong> total number <strong>of</strong> public light buses (PLBs) which operate public minibusservices has been held constant since 1976. Restrictions on the growth <strong>of</strong> theseservices arose from concerns over the efficiency <strong>of</strong> minibus operations in the maintransport corridors and their adverse impact on franchised bus operations.8.7.2 A policy was developed to encourage groups <strong>of</strong> operators to serve routes <strong>of</strong>f themain transport corridors, by granting licences for specific routes. Consequently, twoclasses <strong>of</strong> minibus are now in operation: traditional PLBs distinguished by a redstripe along the side <strong>of</strong> the vehicle, and the other minibus services distinguished by agreen stripe and rool <strong>The</strong> two services are normally referred to as PLBs and GMBs(for Green Minibuses).163
8.7.3 In the New Territories, the red PLBs serving trunk routes would lose traffic upon theconstruction <strong>of</strong> new rail lines. GMBs in this area are operating generally shorterroutes and would be less affected by new rail lines; they are expected to gain trafficfrom population growth.8.7.4 Both types <strong>of</strong> minibus are expected to lose traffic in urban Kowloon but, because theGMBs <strong>of</strong>ten have little competition, their patronage is likely to suffer less. Both redPLBs and GMBs are projected to gain patronage on <strong>Hong</strong> <strong>Kong</strong> Island due toincreases in jobs and population; GMBs show the biggest gains in patronage.8.7.5 Overall GMBs are expected to carry half the minibus patronage by 1996, comparedwith about 40% in 1986.8.8 Won-Scheduled Public TransportTaxis8.8.1 Taxis are used as an alternative to private cars as a personalised form <strong>of</strong> publictransport. <strong>The</strong>y are the predominate mode <strong>of</strong> public transport operating through thenight; 18% <strong>of</strong> taxi travel occurs between the hours <strong>of</strong> 10 pm and 6 am, and a further16% in the hours between 7 pm and 10 pm. Taxis currently form about 25% <strong>of</strong> thetraffic stream overall, but in the central part <strong>of</strong> the urban area the proportionincreases to between 35% and 40%. In some locations, such as Wyndham St inCentral and Waterloo Rd in Kowloon, taxis form as much as 50% to 60% <strong>of</strong> the trafficstream.8.8.2 <strong>The</strong> rapid rise in the numbers and usage <strong>of</strong> taxis in the early 1980s (9% per year to1986) can be at least partly attributable to the decline in taxi fares when measured inconstant prices. In order to contain the growth <strong>of</strong> taxi travel, it is recommended (seeChapter 9) that the present quotas <strong>of</strong> not more than 200 new urban licences and100 New Territories licences be continued; in this case, the number <strong>of</strong> taxis inoperation may increase from 16 400 in 1986 to 20 900 by 2001. Taxi fare adjustmentsare also recommended as essential to keep demand for taxis in line with the number<strong>of</strong> taxis permitted by the quotas.8.8.3 <strong>The</strong>re is pressure from the operators to raise fares due to rising costs <strong>of</strong> taxi servicesand the highly labour intensive nature <strong>of</strong> this trade points to further cost increases inthe future. Thus fares can be allowed to rise naturally to cover costs, or further fareincreases can be induced by imposing cost increases on the taxi trade using fiscalmeasures (see Chapter 9). A sensible policy would be to allow regular real increasesin fares, rather than a dramatic increase in one step.8.8.4 Projected trip patterns for taxis reflects the assumed changes in land use. <strong>The</strong>number <strong>of</strong> taxi trips on the north shore <strong>of</strong> <strong>Hong</strong> <strong>Kong</strong> Island is forecast to increase by10% from 1986 to 1996, while decreasing by 15% in urban Kowloon, following theexpected decline <strong>of</strong> employment there. A growth <strong>of</strong> more than 50% is forecast for theNew Territories associated with the projected large increase in population.8.8.5 New Territories Taxis—<strong>The</strong> system <strong>of</strong> New Territories taxi licences, with the vehiclescharging lower fares, was set up in 1976 to replace "Pak Pass" which were operatingin rural communities not served by scheduled public transport. It ensured that therewas a supply <strong>of</strong> taxis to serve travel demands in what was a lower income area whichwas not as well served as the urban area by the franchised public transport services.<strong>The</strong> New Territories is one <strong>of</strong> the most rapidly changing areas in <strong>Hong</strong> <strong>Kong</strong>; by1996 the number <strong>of</strong> people and jobs in the area served by the restricted taxis is likelyto have increased fourfold compared with when the system was set up. <strong>The</strong> area istaking on the characteristics <strong>of</strong> the rest <strong>of</strong> the Territory, both in terms <strong>of</strong> incomelevels, the demand for travel and the provision <strong>of</strong> franchised services.8.8.6 <strong>The</strong> urban taxis also operate in the New Territories and currently carry about half thetaxi demand there; by 1996 the share <strong>of</strong> travel taken by the rural taxis could declineto about 35%. As many <strong>of</strong> the initial reasons for the separate class would havedisappeared, it would seem appropriate at that stage to review the need for164
continuing with the separate licensing <strong>of</strong> New Territories taxis. Such a review wouldhave to confirm that adequate franchised services and unrestricted taxis wereavailable and consider alternative arrangements for the remaining New Territoriestaxi licences.Special Purpose Bus (SPB)8.8.7 <strong>The</strong>re are a large number <strong>of</strong> miscellaneous public transport services which aregrouped under the heading <strong>of</strong> "Special Purpose Bus" (SPB). <strong>The</strong>y include workbuses, schoo! buses, residential coach services and tour buses.8.8.8 SPB travel does not contribute significantly to congestion levels on the primarynetwork. On average SPBs formed 6% <strong>of</strong> the traffic stream in 1986; this is projectedto drop to 4% in 1996. This is about one third <strong>of</strong> the road space used by taxis to carrya similar number <strong>of</strong> passengers or about 5% <strong>of</strong> total public transport demand for bothSPBs and taxis in 1996.8.8.9 Two major operational problems are the parking <strong>of</strong> SPB vehicles when they are notin use and the picking-up and setting-down <strong>of</strong> passengers. This applies in particularto school buses; there are rarely sufficient <strong>of</strong>f-street loading bays to accommodatethe waiting vehicles and it is common for vehicles to wait on-street or park onpavements. <strong>The</strong>re is also a problem in finding terminal space in central areas forresidential coaches to wait for their passengers. Both problems need to be tackledon a case-by-case basis, although generally these problems do not affect theprimary road network.8.9 Strategies for Future Demand8.9.1 As stated previously the detailed planning <strong>of</strong> individual public transport routes is notthe concern <strong>of</strong> a strategic study like CTS-2. However, the programme <strong>of</strong> transportinfrastructure provision and transport management measures recommended byCTS-2 would assist road and rail based public transport operations in the followingways:(1) Construction <strong>of</strong> additional rail lines: this provides a direct improvement inaccessibility and quality <strong>of</strong> travel to the population and employment served bythe lines.(2) Construction <strong>of</strong> additional highways: this assists bus operations by providingrelief to congestion and, in some cases, a shorter travel distance.(3) Transport demand management measures: these assist by reducing the number<strong>of</strong> non-essential vehicles on the roads, thereby providing easier operatingconditions for road-based public transport.Inter-modal Coordination8.9.2 <strong>The</strong> main aim <strong>of</strong> Government policy on inter-modal coordination has been toencourage the development <strong>of</strong> a geographically comprehensive and economicallyefficient public transport system. This has generally been interpreted to promote theuse <strong>of</strong> the <strong>of</strong>f-road modes <strong>of</strong> rail and ferry by:(1) promoting the development <strong>of</strong> feeder services to rail and ferry(2) discouraging bus routes which parallel rail corridors to avoid wasteful duplication<strong>of</strong> resources8.9.3 <strong>The</strong>se objectives are implemented flexibly and also have been tempered by the needto maintain a choice <strong>of</strong> public transport services for a range <strong>of</strong> prices.8.9.4 Bus-Rail Coordination—<strong>The</strong> policy <strong>of</strong> promoting rail services over buses wasoriginally conceived to protect the large investment made in the rail system andensure that railways achieved their objective <strong>of</strong> relieving road congestion. <strong>The</strong> railsystem has succeeded in attracting passengers to the extent that the Nathan Road165
ail corridor is now operating at full capacity in the peak hour, This is in goodmeasure due to rising affluence <strong>of</strong> the population and willingness to pay premiumfares for quality transport.8.9.5 <strong>The</strong> gap between rail costs and bus costs is likely to narrow in the future since thecosts <strong>of</strong> bus operations are likely to increase faster for various reasons:(1) Buses are more labour intensive than rail; labour costs are likely to grow rapidlywith the continued growth <strong>of</strong> the economy.(2) Public expectations <strong>of</strong> comfort are rising and demands will be placed on buscompanies to provide air conditioning and improved seating on buses.(3) <strong>The</strong> trend to less dense urban developments, and the increase in longer distancecommuting with sharper peaking characteristics, will require more buses tocarry the same loads.8.9.6 It can therefore be concluded that there is less need for protecting rail operationsfrom competition than there was in the past. In some corridors, it may be necessaryto apply the policy flexibly in order to promote provision <strong>of</strong> more bus capacity. Thismust be considered on a case-by-case basis; development <strong>of</strong> new rail lines will stillrequire protection from bus competition in order to establish the rail servicessecurely.8.9.7 Ferries—<strong>The</strong> modal coordination policy has assisted in maintaining a viable ferryservice for the public by:(1) providing feeder services and bus termini close to ferry piers(2) encouraging consolidation <strong>of</strong> certain routes(3) modifying or curtailing the worst loss-making services, when alternative modeswere available(4) giving advice on the development <strong>of</strong> new routes, and supporting their introduction8.9.8 Continuation <strong>of</strong> this policy will be required, in particular as new reclamations aredeveloped to ensure that adequate accessibility to ferry services is maintainedthroughout the period <strong>of</strong> reclamation.8.9.9 Coordination <strong>of</strong> Bus Services—<strong>The</strong> avoidance <strong>of</strong> bus-on-bus competition is afurther aspect <strong>of</strong> coordination. In a dense urban area, it is inevitable that there will bebus routes running in parallel over sections <strong>of</strong> routes. Service to the public could beimproved by providing feeder routes from housing estates to central termini wherepassengers would interchange for longer distance routes. This aspect is undercontinuous study by Transport Department; there are currently plans for an "AreaPublic Transport Network Efficiency" Study in 1989/1990 to examine the issuefurther.8.9.10 It is recommended therefore that the inter-modal coordination policy shouldcontinue to be flexibly applied to ensure that the various public transport modescomplement each other as far as possible.Fare Integration8.9.11 With several major rail, bus and ferry operators, and many minor operators, each withspecific geographical catchment areas, many passengers have to use two or moreoperators' services to complete a journey, paying separate fares on each service. Thissituation will be further emphasised as the second generation New Towns developand their inhabitants commute into the urban area.8.9.12 With intermediate interchanges, total fares paid by passengers are generally higherthan if just one operator could be used. For example, the journey by MTR fromTsuen Wan to Central is <strong>of</strong> a similar length to the rail journey from Sha Tin to Centralwhich requires use <strong>of</strong> both MTR and KCR. In 1988, the MTR Tsuen Wan passengerwould pay $5.50 while the Sha Tin passenger would pay $7.90, over 40% more.166
8.9.13 Hence integration <strong>of</strong> fares, with one fare paid based on distance irrespective <strong>of</strong>intermediate transfers, is an attractive objective. In a transport system with completelyintegrated fares, journeys would be charged according to modes used and journeydistance. This would promote a system <strong>of</strong> feeder/trunk services which is operationallyefficient.8.9.14 Since heavy rail systems rely entirely on automatic ticket barriers, an integrated farescheme would require extensions to this system. <strong>The</strong> mechanics <strong>of</strong> such a system arealready proven operationally. <strong>The</strong> MTR and KCR ticket barrier machines recognise acommon Stored Value ticket; therefore a passenger interchanging between the tworailway lines at Kowloon Tong can use a single ticket even though a separate MTRfare and KCR fare are currently charged. Furthermore, both KMB and residents'service operator, Citybus, have experimentally equipped buses with machines whichcan read MTRC Common Stored Value tickets. <strong>The</strong>se experiments have apparentlyproved to be successful.8.9.15 With the limits to rail capacity being approached in the urban centres, the scope forpromoting bus and minibus feeders to rail stations is limited until more rail lines areconstructed. <strong>The</strong> desirability <strong>of</strong> fare integration between the MTR and the KCR (asopposed to merely having the capability to read each others tickets) is alsoweakened as long as the single interchange between the two lines at Kowloon Tongremains overloaded at peak times. However, future rail developments, both in theurban centre and with extensions into the New Territories, will require fare integrationto achieve the full benefits <strong>of</strong> these lines, especially in the case <strong>of</strong> rail extensions notoperated by MTRC.8.9.16 <strong>The</strong>re is probably more scope at the current time to promote integration.<strong>of</strong> bus fares,with two main benefits:(1) Introduction <strong>of</strong> ticket machines on buses would enable buses to chargedistance based fares, instead <strong>of</strong> the basically flat fare system now employed.This could assist in rationalising the urban bus network.(2) Fare integration could help the development <strong>of</strong> bus feeder services to trunk busroutes linking the New Towns to the urban centre.8.10 Conclusions on Public Transport Operations8.10.1 As stated previously the major impact on travel demand <strong>of</strong> the assumptions aboutpopulation and employment is likely to be as follows:(1),<strong>The</strong> increasing importance <strong>of</strong> the north shore <strong>of</strong> <strong>Hong</strong> <strong>Kong</strong> Island will lead to ax large increase in cross harbour travel.(2) <strong>The</strong> new towns will not be self-contained in terms <strong>of</strong> the employment opportu-/ nities for the population; there will be substantial out-bound commuting andmuch <strong>of</strong> it will need to be long distance, as the increasejn jobs to match thenew town population growth is on <strong>Hong</strong> <strong>Kong</strong> Island, x(3) <strong>The</strong> loss <strong>of</strong> population and jobs in urban Kowloon and Tsuen Wan between1986 and 2001 will substantially reduce the number <strong>of</strong> trips starting and endingwithin the area <strong>of</strong> urban Kowloon. <strong>The</strong>refore, an increasing proportion <strong>of</strong> thetravel on the streets <strong>of</strong> Kowloon will be longer distance commuting trips fromthe new towns, rather than short distance local trips.(4) <strong>The</strong> land use assumptions are likely to emphasise, rather than reduce, thepeaking problems <strong>of</strong> the rail modes, by emphasising the proportion <strong>of</strong> longdistance commuting.8.10.2 <strong>The</strong> peak hour capacity problems currently experienced on the main rail corridors arelikely to be relieved by the opening <strong>of</strong> the Eastern Harbour Crossing MTR extensionand by the development <strong>of</strong> new bus routes through the new road tunnels. However,the strong growth in rail demand is likely to see the peak-hour capacity problemsre-emerge in the early 1990s. Until new rail projects can be constructed in the167
urban area, the short term means <strong>of</strong> controlling these problems will be throughfare adjustments. <strong>The</strong> Study recommends fare adjustments to achieve the following:(1) encourage travel in <strong>of</strong>f-peak periods(2) discourage travel in peak periods(3) encourage passengers to use the new Eastern Harbour rail crossing instead <strong>of</strong>the existing crossing8.10.3 Public transport carried 87% <strong>of</strong> all person trips in 1986. This proportion is expectedto decrease slightly to 81 % in 2001 but the number <strong>of</strong> daily boardings will increasefrom 9.6 million to 13.1 million. It is clear that <strong>Hong</strong> <strong>Kong</strong> has to continue to rely onpublic transport to carry the bulk <strong>of</strong> person trips and the highly concentrateddevelopment pattern and limited road space do not permit extensive use <strong>of</strong> private orpersonalised form <strong>of</strong> transport.Rdfe <strong>of</strong> Public Transport Modes8.10.4x x Franchised buses are the single largest carrier <strong>of</strong> passengers with a daily passengerboardings <strong>of</strong> 4.0 million in 1986, which is expected to increase to 4.5 million in2001. Buses are an efficient road user, flexible in operation and able to provideservices at relatively low fares. <strong>The</strong>y should therefore continue to be given priorityover other road users in the use <strong>of</strong> road space. Over the last ten years, KMB hasabsorbed the impact <strong>of</strong> the opening <strong>of</strong> the MTR and modernisation <strong>of</strong> the KCR, thechanging land use distribution in Kowloon and the New Territories, and, mostrecently, their operational restrictions in the North-west New Territories LRT TransitService Area. KMB now faces the prospect <strong>of</strong> competition from the opening <strong>of</strong>further new rail lines as recommended by CTS-2. However, there is still expected tobe growth for KMB in routes to and within the New Territories. In particular, routesto the North-east New Territories are expected to benefit substantially from theopening <strong>of</strong> the Route 5 and Tate's Cairn tunnels. <strong>The</strong> other major franchised busoperator, CMB, are likely to be little affected by the recommended new rail lines.8.10.5 <strong>The</strong> rail operations <strong>of</strong> the MTR and the KCR provide high speed and high capacity<strong>of</strong>f-road transport services which avoid, and also help to reduce, the problems <strong>of</strong>road congestion. <strong>The</strong> other main rail operations <strong>of</strong> LRT and the <strong>Hong</strong>kong Tramwaysprovide partially segregated rail services and are expected to attract growingdemand. With the expansion <strong>of</strong> the rail network, rail is expected to continue to be thefastest growing mode <strong>of</strong> public transport, projected to increase from 2.2 million dailyjourneys in 1986 to 4.9 million by 2001.8.10.6 Ferries provide essential services to the outlying islands, and <strong>of</strong>fer a useful andpopular alternative to other forms <strong>of</strong> public transport cross-harbour services.Infrastructure requirements <strong>of</strong> ferries are low, in contrast to road and rail, althoughthe cost <strong>of</strong> new ferries and piers can be high. Due to relatively low travel speeds,ferries are vulnerable to competition from cross-harbour bus and rail services, 'andare also subject to disruption during reclamation works. However, with the expectedcontinuing development <strong>of</strong> the harbour area, the demand for ferry services isexpected to increase from 0.3 million per'day in 1986 to 0.4 million per day by 2001.With the planned opening <strong>of</strong> the Eastern Harbour Crossing in 1989, and plans fornew road and rail links across the harbour for the mid-1990s, there is likely to be aneed to rationalise the route structure <strong>of</strong> the passenger ferries.8.10.7 Minibus services are expected to continue to provide a useful supplement to themass carriers. Although it is recommended that the fleet continue to be fixed at aconstant level, overall patronage is expected to increase slightly over the forecastperiod with the change from 14-seat to 16-seat vehicles.8.10.8 Taxis are a personalised form <strong>of</strong> public transport <strong>of</strong>fering a speedy, comfortable anddirect service. <strong>The</strong>y are, however, extravagant users <strong>of</strong> road space, tend to congregatein the congested areas where demand is highest, and make considerable demandson limited road space even when empty and cruising for passengers. It is recommendedthat taxi fares continue to be increased at regular intervals to ensure that thedemand for taxi services is kept in balance with the limited supply <strong>of</strong> taxis.168
9. FOR OF9.19.1.1 Earlier chapters identified the rapidly rising demand for ail kinds <strong>of</strong> transportservices—bus, rail, taxi, private car and goods transport. <strong>The</strong> underlying reason forthis is the dynamic growth <strong>of</strong> the <strong>Hong</strong> <strong>Kong</strong> economy, one <strong>of</strong> the fastest growingeconomies <strong>of</strong> the world. <strong>The</strong> growth <strong>of</strong> the economy generates the demand forgoods transport and this translates directly into increased goods vehicle activity,increasing affluence also results in a rise in personal trip-making; daily trips perperson have increased from an average <strong>of</strong> 1.3 per day in 1981 to 1.6 in 1988 and areexpected to increase to 1.9 trips per day by the end <strong>of</strong> the century.9.1.2 To accommodate growing demand for transport services, an extensive constructionprogramme has been identified for new highways (Chapter 6) and new railways(Chapter 7). Spending on this construction programme could approach $3 billionper year through the 1990s. <strong>The</strong> investment programme also recognises the realities<strong>of</strong> preparing for new construction, limits to the capacity <strong>of</strong> the construction industryto take on new transport infrastructure projects and in particular for the time requiredto prepare land reclamations needed for some <strong>of</strong> the major highway projectsrecommended. <strong>The</strong> recommended transport investment programme, therefore, representsthe practical limits that can be undertaken.9.1.3 While the recommended transport infrastructure development programme woulddramatically improve transport facilities during the 1990s, it is unlikely to be able toabsorb unrestrained growth in transport demand. This is simply illustrated by the factthat the fleet <strong>of</strong> cars and goods vehicles is currently growing at about 10% per year. Ifthis trend continued, there would be a more than threefold increase in the number <strong>of</strong>these vehicles on the road by the end <strong>of</strong> the century, from 280 000 in end 1988 to880 000 by 2001. However, the committed highway programme together with thehighways recommended by this Study would increase available road space by onlyabout 34% in the same period, from 3 650 to 4 900 lane-km, despite the huge scale<strong>of</strong> the investment involved. Clearly, without suitable demand management measures,the growth in traffic demand could swamp both the existing and planned newinfrastructure.9.1.4 This chapter looks at possible options open to Government for managing the growthin transport demand and identifies some practical policies to follow. <strong>The</strong> subject <strong>of</strong>this chapter is the control <strong>of</strong> road traffic congestion; the need to manage demand forrail passenger services was discussed in Chapter 8.9.2 Need for Demand Management Policies9.2.1 Every vehicle that joins the traffic stream to some extent interferes with the progress<strong>of</strong> other vehicles already on the road. In light traffic, this interference is negligible; inheavy traffic, it is severe. Hence as more vehicles join the traffic stream, the speed <strong>of</strong>traffic falls until it reaches crawling speed with frequent and intermittent stops—theclassic traffic jam.9.2.2 In the context <strong>of</strong> urban operations, lower traffic speeds mean higher costs for eachjourney made, for the following reasons:(1) Motor engines are less efficient at slower speeds, and consume more fuel. Forexample, dropping from 20 km/h to 15knn/h will cause an average car toconsume about 25% more fuel for every kilometre travelled. Stop-go conditionsare even less efficient, with the engine idling during stops and with constantspeeding up and slowing down.169
(2) More vehicles are required to do the same job. For example, slower traffic meansthat a wholesale delivery van can service less shops in a day; therefore, to deliverthe same number <strong>of</strong> goods would require the distributor to invest in a largervehicle fleet.(3) Time costs money, whether this is directly in the wages <strong>of</strong> goods vehicle, busand taxi drivers, or in the lost time <strong>of</strong> passengers; school children, housewivesor business executives; caught in traffic jams. Also, congested traffic conditionsmean that even more time has to be allowed for journeys to allow for the greateruncertainty <strong>of</strong> travel, further wasting valuable time.9.2.3 Given that congestion increases transport costs, the question still remains as to whyGovernment should interfere with free choice <strong>of</strong> transport and attempt to managethe growth <strong>of</strong> transport demand. Can it not be said that traffic finds its own level,with a workable equilibrium being reached between congestion levels and additionaltransport demands? <strong>The</strong> answer is that a working equilibrium will be reached butthat would be extremely inefficient.9.2.4 <strong>The</strong> decision to make a journey in congested traffic conditions is usually made in thefull knowledge <strong>of</strong> slow traffic speeds and the likelihood <strong>of</strong> encountering trafficqueues. Despite this, the journey is made because the costs to the traveller in terms<strong>of</strong> fuel expenses and the time involved, while higher than costs in uncongestedconditions, are still acceptable. While the decision to make the journey undercongested conditions cannot be disputed from the point <strong>of</strong> the traveller, a problemarises because each additional journey on the road system not only incurs costs <strong>of</strong> itsown but also imposes additional costs on other road users by slowing down theirtravel speeds. In congested traffic conditions, the costs imposed on others faroutweigh the costs incurred by the new traveller. This results in deterioratingefficiency; in particular, essential users who have to use the road system are impededby more marginal users who could travel by some other means.9.2.5 Road public transport services are particularly badly affected by traffic congestion.For example, consider the impact <strong>of</strong> congestion on buses, which can be clearlyidentified as essential road users. Slower running speeds require more vehicles tomaintain a service frequency; if these vehicles are not provided service deterioratesbut, if they are provided, they must be paid for and this translates into higher fares.Either way, a drop in patronage can be expected which triggers further increases infares since costs must now be shared among fewer passengers. This in turn leads t<strong>of</strong>urther drops in patronage.9.2.6 To illustrate the impact <strong>of</strong> congestion on road public transport, estimates arepresented below <strong>of</strong> <strong>Hong</strong> <strong>Kong</strong> bus operations under two conditions <strong>of</strong> trafficcongestion in 2001:LowHighCongestion 1 Congestion 2Daily operating kilometres 602 000 602 000Daily operating hours 42 000 55 700Average speed (km/h) 14.3 10.8Number <strong>of</strong> buses required 4120 61601 With recommended highway programme and policies2 With only committed highways and no change in policies9.2.7 Hence with a reduction in average operating speeds <strong>of</strong> 3.5 km/h, operating hoursincrease by one third and the number <strong>of</strong> buses required to operate the samefrequency services increases by one half. This would imply a fare rise <strong>of</strong> perhaps 30%to cover increased costs and demonstrates quite clearly the devastating impact <strong>of</strong>170
traffic congestion on bus operations. Since bus and minibus transport together carryabout half <strong>of</strong> all public transport passengers, the need to prevent traffic congestionfrom getting out <strong>of</strong> control is apparent.9.2.8 Other adverse impacts <strong>of</strong> traffic congestion can be noted, including loss <strong>of</strong> efficiencyin the goods transport system which depends on trucks, including the impact onindustry generally, and the difficulties posed to other essential road users such asemergency and police services.9.2.9 If traffic levels are to be kept below congestion levels, priorities must be set for roadusers. Since there is no way for motorists to establish priorities among themselves,the only way to avoid inefficiencies in the usage <strong>of</strong> the transport system is forGovernment to intervene and impose a regime based on economic and otherconsiderations.9.2.10 Clearly the objective <strong>of</strong> any demand management policies to control traffic would beto make more efficient use <strong>of</strong> the scarce road space, which can be assessed primarilyon the basis <strong>of</strong> the economic benefits <strong>of</strong> the various options to the community.However, the evaluation <strong>of</strong> options needs to take into account other aspectsincluding effectiveness, ease <strong>of</strong> administration, flexibility and acceptability.9.3 A Review <strong>of</strong> Available Options9.3.1 Available policy options for managing transport demand are listed in Figure 9.1 andgrouped into three main classes. One set <strong>of</strong> options attempts to deal with theproblem at source and discourage or limit the ownership <strong>of</strong> vehicles. <strong>The</strong>se options9.1: OFI1I 11I1USE 1I1)AREA.PRICINQFUEL-TAX";-TOLLS ./8TAQQEREDmnK.ANDVEH9CLEL SHARINGL STANDARDS ANDCLASSIFICATION-CONTROLSACCESSCONTROLSBUS.PLANNED• DELAYSOPERATING• PERMITS171
are classified under Vehicle Ownership Controls. <strong>The</strong> main alternative is to permitwider vehicle ownership but then control the use made <strong>of</strong> vehicles; these options areclassified under Vehicle Use Controls. <strong>The</strong> third option, which can be viewed as asupplement to vehicle ownership and use controls, is to introduce incentives toencourage more efficient use <strong>of</strong> vehicles and the transport system in general. <strong>The</strong>seoptions are classified under Behavioural Incentives.9.3.2 Each option is described and commented on. <strong>The</strong> most practical options are thencarried through in subsequent sections for detailed discussion <strong>of</strong> possible implementation.9.4 Vehicle Ownership Controls9.4.1 Vehicle ownership controls seek to limit the size <strong>of</strong> the vehicle fleet by either fiscal orregulatory means, in this way restricting the number <strong>of</strong> vehicles available to use theroad system. Vehicle ownership controls can be effective as they tackle the problemat source; they have been used successfully to control traffic growth in both <strong>Hong</strong><strong>Kong</strong> and Singapore. <strong>The</strong> key disadvantage <strong>of</strong> ownership controls is that they arenon-selective; they limit all travel whether in congested or uncongested areas.Vehicle Taxation9.4.2 Two taxes are currently imposed on vehicle ownership: First Registration Tax (FRT)paid on purchase based on the value <strong>of</strong> the vehicle, and a licence fee paid annuallybased on engine size. Rates <strong>of</strong> FRT and licence fees were reported in Chapter 3. FRTfor private cars is now set at between 70% and 90% <strong>of</strong> the import (GIF) value,compared with 15% for all other vehicles. Private car annual licence fees aresignificantly higher than for most other vehicles. <strong>The</strong>re is scope for further increasesin taxation on private cars and other vehicles which are explored later in this chapter.Sty^Vfehicle Quotas9.4.3 Vehicle quotas can be used to manage the growth <strong>of</strong> the vehicle fleet to a fixednumber <strong>of</strong> vehicles per year. <strong>The</strong>y are currently used in <strong>Hong</strong> <strong>Kong</strong> to restrict the taxiand public light bus (PLB) fleets. <strong>The</strong> quota for taxis was recently reduced to notmore than 300 new taxi licences per year, following a period <strong>of</strong> rapid growth. It isimportant that taxi fares should continue to be adjusted to ensure that the demandfor taxi services is in balance with the limited supply <strong>of</strong> taxis imposed by quotas. <strong>The</strong>maximum number <strong>of</strong> licensed PLBs (red PLBs and green minibuses) has beenfrozen at 4350 since 1976.9.4.4 <strong>The</strong>re are serious problems <strong>of</strong> extending the quota principle to other vehicle types.<strong>The</strong> allocation <strong>of</strong> the vehicle quota to customers would have to be based on price asany other approach would require an assessment <strong>of</strong> individual needs which wouldpose insuperable problems <strong>of</strong> selection and control. With a fixed quota and highdemand, prices would undoubtedly rise substantially. To ensure that the increase inprice did not simply go into the motor dealer's pocket, Government would need toestablish a system similar to the taxi licence bidding procedures today. Specification<strong>of</strong> the details <strong>of</strong> a licence bidding system would be very complicated. This optionis also considered not appropriate for goods vehicle as the limitations <strong>of</strong> a quotasystem might be a restriction on the legitimate needs <strong>of</strong> industry for vehicles andthus might affect the economy.9.4.5 In the end, vehicle quotas would have the same impact as higher ownership taxes.Quotas have the merit <strong>of</strong> fixing the vehicle fleet growth rate but pose considerableproblems <strong>of</strong> administration for most vehicle types.Garaging Requirements9.4.6 A widespread practice in Japan is to restrict vehicle ownership to those who have<strong>of</strong>f-street parking places. Pro<strong>of</strong> <strong>of</strong> parking place must be deposited when a vehicle islicensed, consisting <strong>of</strong> maps and letters <strong>of</strong> authority.172
9.4.7 <strong>The</strong> main asm <strong>of</strong> establishing garaging requirements is to ensure that residentialstreets are not cluttered with parked vehicles. <strong>The</strong> effective restriction on totalvehicles which results is a by-product. While on-street residential parking has been aproblem in <strong>Hong</strong> <strong>Kong</strong> in the past more cars are now parked <strong>of</strong>f-street. <strong>The</strong> policealso anticipate serious problems <strong>of</strong> enforcement with this option. For these reasons,this policy would merit re-examination only if on~street residential parking onceagain becomes a serious problem.Vehicle Standards and Classification9.4.8 High vehicle standards enforced by annual inspections are primarily safety measurespractised in many countries. However, higher vehicle standards effectively influencevehicle ownership by raising the cost <strong>of</strong> motoring. It is considered that theintroduction <strong>of</strong> private car inspections in 1986 was responsible for extending for afurther year the downward trend in licensed vehicles initially caused by the cartaxation increases <strong>of</strong> 1982. Annual inspections are now required for cars over 6years old; extending the scheme to newer cars, while appropriate for safety reasons,is unlikely to have the ownership reduction impact <strong>of</strong> the initial scheme since newercars can be expected to pass inspections with less costly repair work.9.4.9 Specification <strong>of</strong> vehicle design requirements is necessary if different classes <strong>of</strong>vehicle are taxed at different rates or otherwise treated differently. This is the casecurrently with goods vehicles which are taxed at much lower rates than private cars.As a result, vehicles such as some light vans are being registered as goods vehiclesto obtain low tax rates, but subsequently used as private cars. To prevent this abuse,vehicle standards for goods vehicles need to be more tightly defined if the taxdifferential with private cars is to be maintained.9.5 Vehicle Use Controls9.5.1 <strong>The</strong> problem with controls on vehicle ownership, discussed in the previous section,is that they are non-selective as they affect traffic on roads in the New Territories justas much as traffic in Central in the middle <strong>of</strong> the peak. Vehicle use controls <strong>of</strong>fer theopportunity to be more discriminating in the management <strong>of</strong> traffic growth.Area Pricing9.5.2 Area pricing aims to charge motorists for the use <strong>of</strong> roads in selected districts, withthe highest charges for the most congested districts. Frequent users <strong>of</strong> busy roadswould incur high charges but the more casual motorist, by careful selection <strong>of</strong> timesand routes, could avoid road charges altogether. <strong>The</strong> practical effect should be lesstraffic on the busy roads as motorists avoid the congested and hence expensivedistricts.9.5.3 <strong>The</strong> main difficulty with area pricing is in devising a practical method for collectingcharges from the motorist. This leads to at least three different schemes:Admission ChargesSupplementary LicensesElectronic Road Pricing9.5.4 Admission Charges—A cordon is set up around the area to be charged with tollgates installed at all entry points. Toll charges can be varied by time <strong>of</strong> day to makepeak hour entry more expensive, and charges can be abandoned altogether at<strong>of</strong>f-peak times, on Sundays and on public holidays. <strong>The</strong> disadvantages <strong>of</strong> such ascheme are clear; land is needed for the toll barriers, and the practical problems <strong>of</strong>locating barriers would probably dictate the limits and coverage <strong>of</strong> the scheme ratherthan pure traffic control considerations. A further disadvantage is that the operation<strong>of</strong> the toll barriers requires traffic to stop; resulting delays are dependent on thenumber <strong>of</strong> toll booths and hence size <strong>of</strong> the toll plaza. With high traffic flows, largetoll plazas would be required, perhaps the size <strong>of</strong> the existing cross-harbour tunneltoll plaza for an average urban four-lane highway; with the cost <strong>of</strong> land in <strong>Hong</strong><strong>Kong</strong>, it is difficult to see such a scheme as being practical.173
9.5.5 Supplementary Licences—<strong>The</strong>se schemes require cars to display a specially purchasedadditional licence to be able to enter, or use roads in, a designated area. <strong>The</strong>Singapore area licensing scheme introduced in 1975 is such a scheme, requiring aspecial licence to enter the central area during the morning peak hour between 7:30am and 10:15 am. Gantries have been set up at all entry points to the designatedcentral area, with flashing lights to indicate times when the special licence isrequired to pass the barrier. Traffic <strong>of</strong>ficers monitor the traffic stream; <strong>of</strong>fenders arephotographed and tape recordings are made noting time <strong>of</strong> <strong>of</strong>fence. <strong>The</strong>se photographsand recordings are admissible evidence in courts.9.5.6 <strong>The</strong> Singapore scheme regulates entry during the morning peak but does nothing tocontrol movements within the single designated control area. Other more elaborateschemes require vehicles to display licences while actually in the designated area.Schemes have been proposed, but not implemented, using different colouredlicences for areas with different congestion levels, thus allowing more subtlety <strong>of</strong>charging for different levels <strong>of</strong> congestion. For example, a high priced red licencemay be required for the most congested areas but cheaper blue and yellow licencescould permit use <strong>of</strong> roads in other less critical areas. Of course, many areas wouldnot require supplementary licences at all. <strong>The</strong> red, blue and yellow zones would beclearly designated by maps and roadside signs. Enforcement <strong>of</strong> supplementarylicence schemes would be the main problem, although not insuperable. A proposedscheme for Central London, not implemented subsequently, estimated that 400wardens would be required to achieve 90% compliance at a cost equal to 6% <strong>of</strong>gross revenues.9.5.7 <strong>The</strong> 1985 <strong>Hong</strong> <strong>Kong</strong> Electronic Road Pricing (ERP) Scheme Pilot Study examinedthe practicality <strong>of</strong> the simpler Singapore approach for <strong>Hong</strong> <strong>Kong</strong>, identifying fourimportant criteria for such a scheme to succeed. <strong>The</strong>se were:(1) enforcement should take place at check points on moving traffic(2) there must be few vehicles garaged within the zone overnight(3) there must be a means <strong>of</strong> dealing with any through traffic(4) charging can be one period only—typically am peak (as in Singapore) or allworking day9.5.8 <strong>The</strong> ERP Study identified two areas where such a scheme might be useful: Tsim ShaTsui and Central. It concluded that such a scheme could be satisfactory for Tsim ShaTsui but would not be practical for Central. Problems would arise in defining theboundaries <strong>of</strong> the area, particularly between Central and the Mid-levels, and indealing with through traffic.9.5.9 Electronic Road Pricing—This is the most sophisticated <strong>of</strong> the area pricing schemesand was examined in great detail in the 1985 ERP Study cited above. <strong>The</strong> schemerequires a network <strong>of</strong> vehicle detectors buried in the road surface and linked to acentral computer. All vehicles in the Territory would be equipped with electronicidentity tags which would register on passing the vehicle detectors. A charge wouldbe made for each passing vehicle based on a well publicised price scale, with vehicleowners being billed for their accumulated charges each month in the same way asfor telephone or electricity charges.9.5.10 Careful siting <strong>of</strong> detectors and varying charges by time <strong>of</strong> day, allows traffic plannersto target the heaviest charges on the busiest roads, while leaving uncongested roadscharge-free. This flexibility means that electronic road pricing <strong>of</strong>fers potentially themost effective way <strong>of</strong> countering traffic congestion yet devised. <strong>The</strong> 1985 <strong>Hong</strong><strong>Kong</strong> ERP Pilot Study developed the necessary equipment and made extensive fieldtrials. <strong>The</strong> scheme was considered a technical success within the limits set by thestudy, but was rejected by the public because it was perceived both as an invasion <strong>of</strong>privacy and as a way <strong>of</strong> increasing taxes on private cars.174
9.5.11 Conclusions on Area Pricing— Jbe main problem with area pricing is that itrepresents a major change in traffic control policy with considerable uncertainty asto the outcome. In particular, electronic road pricing (ERP) has been rejected beforefor reasons described above. Nevertheless, the CTS-2 analyses confirm area pricingas technically the most effective means <strong>of</strong> controlling traffic growth in specific areas.Fuel Tax9.5.12 Duties are already levied on fuel; increasing these duties would be anadministratively simple traffic control measure acting directly on the use <strong>of</strong> vehicles.9.5.13 <strong>The</strong> disadvantage <strong>of</strong> fuel tax is that it acts across the board, hitting <strong>of</strong>f-peakmotoring in uncongested areas as well as motoring on the busiest roads. Users <strong>of</strong>congested roads would pay more per kilometre, since fuel consumption goes up asspeeds decline, but <strong>of</strong>f-peak motorists would still pay a large proportion <strong>of</strong> the taxpaid by peak-hour motorists. However, as a supplement to the already high vehicleownership taxes, fuel tax could have a role.Tunnel Tolls9.5.14 Tolls are charged on three out <strong>of</strong> the four existing road tunnels in <strong>Hong</strong> <strong>Kong</strong>, theonly exception being the airport tunnel where space does not permit construction <strong>of</strong>a toil plaza. Tolls are planned for all major new road tunnels being planned or nowunder construction.9.5^1 5 Tolls affect the traffic volumes using the tunnels and therefore can be used to controlw traffic demand. This was demonstrated by the imposition <strong>of</strong> a passage tax on theCross- Harbour tunnel in 1 984 which had the effect <strong>of</strong> reducing car and taxi traffic byabout 1 5% and light goods vehicles traffic by about 1 3%; medium and heavy goodswere almost unaffected. Traffic growth since then has replaced those trafficreductions but three years <strong>of</strong> improved operations were gained. It is recommendedthat tolls continue to be used as a means .<strong>of</strong> -managing...... traffic ......9.5,1 6 It would be possible to extend the toll principle to control traffic levels on other roads,in particular the main trunk roads <strong>of</strong> the Territory. <strong>The</strong>re are some disadvantages:(1 ) Toll plazas are required to collect the tolls. <strong>The</strong> toll system can take two forms:open or closed. <strong>The</strong> open system establishes toll plazas at intervals along thelength <strong>of</strong> the road, with the disadvantage that traffic can by-pass the tolledsections by returning to the street system. Closed systems, on the other hand,require toll barriers at all entrances and exits to the toll road to ensure that allusers pay for the full length <strong>of</strong> the journey on the road; they have thedisadvantage <strong>of</strong> greater expense to build and operate.(2) Traffic is deterred from using the toll roads, thus reducing the congestion reliefgiven to the existing street system. To control the street congestion, other trafficmanagement policies are required.Parking Controls9.5.1 7 <strong>The</strong> areas <strong>of</strong> highest traffic congestion tend to be the major business and shoppingdistricts. <strong>The</strong>refore, controls on parking can be used to limit the number <strong>of</strong> tripswhich can be made to these districts by private car. Parking controls are widely usedinternationally as a traffic demand management measure.9.5.18 A weakness <strong>of</strong> parking controls as a traffic management measure is that throughtraffic, which does not need to park in the targeted district is also unaffected. Thishas been summarised as the inherent problem <strong>of</strong> parking policy <strong>of</strong> attempting tocontrol moving vehicles by charging stationary ones. Also, local authorities aresometimes forced to relax their parking policy to attract important developers to theirarea. However, with the system <strong>of</strong> major through routes being developed and withcontrol <strong>of</strong> parking standards throughout the Territory in the hands <strong>of</strong> a singleGovernment both these factors present less problems in <strong>Hong</strong> <strong>Kong</strong> than elsewhere.175
9.5.19 Controls are required on both public parking places (on and <strong>of</strong>f-street), which aredirectly under Government control, and on private parking places, which arenormally done through setting parking provision standards.9.5.20 Public On-street Parking—On the basis that streets are intended for moving traffic,on-street parking should be restricted to short duration visits, sufficient to set downor pick up passengers, or make quick deliveries. This is the current policy in <strong>Hong</strong><strong>Kong</strong>, with charges and timings for parking meters set to discourage long termparking. Meter fees remained unchanged between 1974 and 1981 but have sincebeen doubled on two occasions in the busiest districts, aiming for a 15% availabilityrate.9.5.21 Public Off-Street Parking—It is comparatively straightforward to make use <strong>of</strong> theparking fees as a traffic control measure when potential demand exceeds supply. Animportant element <strong>of</strong> parking charges, used as a traffic control policy, should be theuse <strong>of</strong> different charging rates depending on duration and time <strong>of</strong> arrival to obtaina balance between long term commuting parkers and short term parking for otherpurposes such as shopping.9.5.22 <strong>The</strong> operation <strong>of</strong> Government car parks was privatised in 1984. <strong>The</strong> operatingcompany has the freedom to set parking tariffs according to commercial principlesbut Government can intervene if it is felt that tariff changes would cause significantchanges in utilisation. <strong>The</strong> target aimed for is a 15% availability rate.9.5.23 New parking provision can be accepted in places where there is a demand andwhere the road system is considered <strong>of</strong> adequate capacity. On this basis, Governmentis now actively looking for further sites for car park development and encouragingthe construction <strong>of</strong> public parking facilities in new private developments. It isstrongly recommended that full account is taken <strong>of</strong> wider traffic considerationsbefore completing plans for new car parks.9.5.24 Private Off-Street Parking—Private non-residential parking is not charged directly;staff are simply allocated the use <strong>of</strong> parking spaces at the employers' discretion. <strong>The</strong>privileged users <strong>of</strong> these spaces therefore park free and are unaffected by publicparking policy. At the present time, there are about three times as many privateparking spaces as public. Control <strong>of</strong> the number <strong>of</strong> parking places is normallyeffected through specifying building standards but these are extremely difficult toenforce.Access Controls9.5.25 Many European and American cities have positively discriminated against cars in thecentral areas <strong>of</strong> cities by closing streets, creating pedestrian precincts and creatingtortuous 'mazes' or 'traffic cells' to deter use by traffic. <strong>The</strong> main aim has been toremove through traffic to peripheral routes and to make the use <strong>of</strong> a car for citycentre trips less attractive. <strong>The</strong>se schemes have particular value in older cities wherethe charm and scale <strong>of</strong> the sometimes ancient street pattern has been swamped byexcessive use <strong>of</strong> cars for which they were not designed.9.5.26 As a pure traffic control (as opposed to a re-routeing) measure, restricted accessschemes require other measures so that congestion on the remaining streets iscontrolled. <strong>The</strong>re are probably several areas where such schemes could be appropriatein <strong>Hong</strong> <strong>Kong</strong>; these must be developed at a district level to balance the localneeds for access and the desire for improved amenity for workers and residents.Bus Lanes9.5.27 <strong>The</strong> introduction <strong>of</strong> reserved bus lanes has a double impact on the transport system;the amount <strong>of</strong> road space available to other road vehicles is reduced and theefficiency <strong>of</strong> public transport services is enhanced. Reserved bus lanes are widelyused in Europe, and transit lanes are common in the North America and Australia formajor facilities such as bridges and tunnels. Several bus lanes have already beenintroduced in <strong>Hong</strong> <strong>Kong</strong> and they should be provided wherever opportunities arise.176
9.5.28 As a traffic control measure, bus lanes are <strong>of</strong> limited value. <strong>The</strong>y must beaccompanied by other controls or the reduction in road space for cars will simplylead to-increased traffic congestion.Planned Delays9.5.29 On the basis that excess traffic brings about traffic delays through congestion ina random and uncontrolled way, some schemes have been devised to imposeregulated delays on traffic with the hoped-for advantage that drivers could planjourneys with more certainty. One such scheme was tried in Nottingham in the UKknown as the Zone and Collar Scheme. Traffic leaving some large housing estatesand traffic approaching the city centre were held up at traffic lights with a verylow proportion <strong>of</strong> green time. Car parks were provided at the traffic light locations onthe main roads with free bus services to the city centre. At all traffic light barriers,buses could by-pass the lights. <strong>The</strong> scheme did not succeed, partly because themain roads could not accommodate the traffic queues and partly because manymotorists refused to obey the traffic signals at the exit to the housing estates. <strong>The</strong>hoped-for switch to public transport did not take place and overall economicbenefits were negative. <strong>The</strong>re seems little advantage in pursuing such schemes in<strong>Hong</strong> <strong>Kong</strong>.Operating Permits9.5.30 Car operating permits issued on the basis <strong>of</strong> need have been suggested for use inLondon but not implemented. In reality, it is very hard to define need adequately,doctors on call and the handicapped are two categories that may be accepted but,for the most part, it is impossible to define watertight criteria which could beadministered easily.9.5.31 A simpler permit system is practised in Lagos and Athens which allocates days <strong>of</strong> usebased on the car number plate; odd numbers and even numbers are permitted on theroad on alternate days. It was also applied in Seoul during the period <strong>of</strong> the 1988Olympic Games to ensure easier traffic conditions for visitors. It is a simple system toset up but is arbitrary in operation and wide open to fraud. As a short term measure,such as the Seoul application, the scheme has merit but this is not considered asuitable long term policy for <strong>Hong</strong> <strong>Kong</strong>.9.6 Behavioural Incentives9.6.1 Incentives to change travel behaviour are complementary measures to accompanvtraffic control policies.Staggered Working Hours9.6.2 <strong>The</strong> main transport problems occur in the morning and evening peak hourscoinciding with the operating hours <strong>of</strong> most businesses and (in the morning)schools. Widespread implementation <strong>of</strong> staggered working hours, including flexitime,could improve the peak hour commuting problem and reduce the need for trafficcontrol measures. Such policies are not popular with employers and positive effortsare needed to gain wider acceptance.9.6.3 While voluntary schemes for staggered working hours are to be encouragedconsideration may be given to imposing employer shift charges. <strong>The</strong>se are a tax oremployers based on the number <strong>of</strong> employees starting and finishing work in thepeak travel periods, with the objective <strong>of</strong> giving an incentive to employers tcintroduce modified working hours. However, strong opposition could be expectecfrom employers, and such a plan is very unlikely to be accepted.177
Park and Hide9.6.4 This policy promotes the construction <strong>of</strong> car parks at railway stations in order toinduce commuters to restrict the use <strong>of</strong> cars to the uncongested parts <strong>of</strong> theTerritory, completing the journey to the urban centres by train. This policy wasrecommended by the 1981 Working Group on Parking Policy but has had limitedimpact. Most commuting journeys in <strong>Hong</strong> <strong>Kong</strong> are too short to make suchdual-mode journeys attractive. However, it is recommended that this option bereviewed in the light <strong>of</strong> changing circumstances.Vehicle Sharing9.6.5 Cars receive a low transport efficiency rating because <strong>of</strong> low occupancy; a vehiclewhich takes up the road space equivalent to one third <strong>of</strong> a bus is <strong>of</strong>ten carrying onlyone person compared with at least 30, and up to 160 on a bus. Filling cars withpassengers still leaves them at the bottom <strong>of</strong> the carrying efficiency list but doesimprove the situation. For this reason, the Singapore Area Licence scheme permitscars with four or more passengers to enter the controlled area without a speciallicence. Similarly, it is common practice in the USA and Australia to allow highoccupancy vehicles (HOVs) to use designated bus lanes on freeways.9.6.7 A common practice in South America, also followed in Washington DC, is topromote sharing <strong>of</strong> taxis by allowing drivers to pick up additional passengers alongthe route. While this leads to higher occupancy <strong>of</strong> taxis, which could be regarded asmore efficient for the road space used, taxis as a result tend to keep to the maincorridors which are already served by other higher capacity public transport modes.<strong>The</strong> main impact <strong>of</strong> this practice is probably in cost sharing, permitting lower taxifares for each individual user. Shared taxis are probably not useful for <strong>Hong</strong> <strong>Kong</strong> asPLBs already perform the shared-transport role relatively more efficiently, and taxifare increases rather than reductions are likely to be the issue. Hence a policy <strong>of</strong> taxisharing is not recommended.9.7 Selection and Evaluation <strong>of</strong> Policy Options for the Management <strong>of</strong>Transport Demand<strong>The</strong> main-focus <strong>of</strong> policies for managing, the growth <strong>of</strong> transpprtdemand must be inprivate cars and goods vehicles,, which between them comprise, .nearly 90% <strong>of</strong> the^existing vehicle "fleet "Pressures for increased car ownership and usage are intense,but limitations on road space simply do not permit the private car to assume theprominent role that it does in other less densely developed countries <strong>of</strong> similaraffluence. Similarly, limitations on road space also mean that the recent rapid growthin the goods vehicle fleet cannot be allowed to continue unchecked. Policies arealso required to ensure that other vehicle classes find an appropriate level relative tothe availability <strong>of</strong> road space, with the highest priority being given to buses.9.7.2 <strong>The</strong> previous sections discuss a range <strong>of</strong> policy options available for managing thegrowth <strong>of</strong> transport demand. Options identified as worth considering further are asfollows:1. Taxi controls2. Minibus quotas3. Parking controls4. Tunnel tolls5. Car and goods vehicle ownership taxes6. Fuel tax7. Area pricing9.7.3 <strong>The</strong>se policies are evaluated in more detail in the remainder <strong>of</strong> this chapter.178
9.7.4 <strong>The</strong>re are clearly many combinations <strong>of</strong> policy options which could be effective incontrolling the growth in transport demand. To present a comprehensible range <strong>of</strong>options, they have been grouped together into alternative policy packages asfollows:(1) Package 1—Car Ownership Taxes(2) Package 2—Fuel Tax(3) Package 3—Goods Vehicle Controls(4) Package 4—Area Pricing(5) A set <strong>of</strong> supplementary policies covering vehicle quotas, parking controls andtunnel tolls to be combined with all other packagesApproach to the Evaluation <strong>of</strong> Policy Packages9.7.5 A detailed traffic and economic assessment <strong>of</strong> each alternative policy package wasmade using the full computer transport model. <strong>The</strong> results are summarised forpresentation in this report displaying three main aspects:(1) Impact on traffic volumes(2) Impact on traffic speed(3) Economic benefits associated with the policyOther considerations such as effectiveness, ease <strong>of</strong> administration, flexibility andselectivity are also accounted for in the evaluation.9.7.6 Traffic Volumes—<strong>The</strong> objective <strong>of</strong> traffic management policies is to influencethe demand for transport to make the best use <strong>of</strong> the road system and prevent itfrom becoming congested. <strong>The</strong> impacts will vary by location and by time <strong>of</strong>day, depending on the characteristics <strong>of</strong> the particular policy. Hence traffic volumesare displayed in this chapter as average hourly flows by three main traffic areas,<strong>Hong</strong> <strong>Kong</strong> Island, Kowloon and the New Territories, and by two time periods,the morning peak and the daytime <strong>of</strong>f-peak. All volumes refer to an average weekdayin 1996 expressed in terms <strong>of</strong> kilometres by equivalent passenger car units(PCU).9.7.7 Traffic Speeds—<strong>The</strong> clearest measure <strong>of</strong> traffic congestion is the average speed <strong>of</strong>traffic. This is determined by traffic volumes and road system capacity. Averagetraffic speeds are displayed for each <strong>of</strong> the three areas and for each time period aslisted above.9.7.8 Economic Benefits—Economic benefits measure the value <strong>of</strong> the policy package tothe community with four main components:(1) Operating cost savings, which represent the reductions in the cost <strong>of</strong> vehicleoperations <strong>of</strong> private and non-fixed route public transport vehicles (cars, taxis,goods vehicles and special purpose buses) brought about by easier trafficoperating conditions.(2) Passenger time savings, which represent the time savings to passengers inthe above vehicles including drivers <strong>of</strong> passenger cars through higher trafficspeeds.(3) Public transport savings, which represent the savings in fixed route publictransport operating costs including the passenger time savings through highertraffic speeds.(4) Generated traffic benefits, which are normally negative and represent theeconomic losses experienced by traffic which is eliminated as a result <strong>of</strong> thetraffic control policy. Overall, these losses are <strong>of</strong>f-set by savings to other trafficspecified in (1)-(3) above.179
Alternative Scenarios for the Evaluation9.7.9 <strong>The</strong> need for controls on traffic growth will depend on the future development <strong>of</strong> theTerritory, it was therefore important to examine each policy package under somealternative scenarios <strong>of</strong> development. <strong>The</strong> two most critical factors were consideredto be:(1) <strong>The</strong> rate <strong>of</strong> growth <strong>of</strong> the economy <strong>of</strong> <strong>Hong</strong> <strong>Kong</strong>(2) <strong>The</strong> rate <strong>of</strong> construction <strong>of</strong> new highway infrastructure9.7.10 Economic Growth—<strong>The</strong> Study made assumptions about the growth <strong>of</strong> the economyas discussed in Chapter 4. It was noted there that due to the expected slowing downin the growth rate <strong>of</strong> the labour force, the assumed long term rate <strong>of</strong> growth in GDP<strong>of</strong> about 5% to 6% per year in real terms is low compared to the extraordinary rates <strong>of</strong>growth actually achieved in <strong>Hong</strong> <strong>Kong</strong> since the 1960s. Average annual growthhas been about 8.5% for the last 25 years with a 10% annual growth over the lastthree years. While it is prudent to take a conservative view <strong>of</strong> economic growth inlong term planning, it would not be appropriate to ignore the traffic growthconsequences <strong>of</strong> achieving higher economic growth given the past record <strong>of</strong> <strong>Hong</strong><strong>Kong</strong>. Hence the traffic and economic consequences <strong>of</strong> the policy packages arespelt out for both the Central forecast <strong>of</strong> economic growth and for a High forecast <strong>of</strong>growth <strong>of</strong> 9% real GDP growth per year.9.7.11 Highway Construct/on—<strong>The</strong> Study recommends a programme <strong>of</strong> highwayconstruction which would greatly reduce traffic congestion in all parts <strong>of</strong> theTerritory. However, completion <strong>of</strong> this programme according to the planned schedulecannot be assured for several reasons:(1) <strong>The</strong>re may be a time when other sectors <strong>of</strong> the economy are making increasingdemands on Government funding, for example health, environmentand education.(2) Some <strong>of</strong> the major projects require completion <strong>of</strong> massive land reclamations <strong>of</strong>fWest Kowloon and <strong>of</strong>f Central and Wan Chas on <strong>Hong</strong> <strong>Kong</strong> Island. <strong>The</strong>technical feasibility and the timing <strong>of</strong> these reclamations are not yet certain.(3) A decision to remove the airport from Kai Tak to another site could absorb much<strong>of</strong> the available resources <strong>of</strong> the construction industry as well as much <strong>of</strong> theavailable funding, to the extent that the CTS-2 recommended highway projects,which are not essential to the airport re-located situation, might have to bepostponed.9.7.12 <strong>The</strong>refore the situation was examined for each policy package for two constructionscenarios, one with the full highway investment programme recommended byCTS-2 for completion in the mid-1990s, and the other assuming that only half <strong>of</strong> theprogramme is completed. Clearly, it is not known which projects might be delayedand where the impacts on traffic congestion would be felt. <strong>The</strong>refore a simplisticapproach was adopted by taking a situation half way between the full highwaystrategy and that with only the completion <strong>of</strong> the currently committed highwayprogramme,<strong>The</strong> Reference Case: No Change in Current Policies9.7.13 <strong>The</strong> situation with no changes in current policies is examined first to provide areference basis for considering new policies. This is summarised in Table 9.1,comparing 1996 conditions with those prevailing in 1986 which is the base year forthe Study.9.7.14 Without any changes in policy, the vehicle fleet <strong>of</strong> private cars and goods vehicles isexpected to approximately double in the ten years to 1996. This represents a growthrate <strong>of</strong> between 6% and 7% per year. With high economic growth, the vehicle growthrate could increase to about 10% to 11% per year which corresponds to the early180
1989 rate <strong>of</strong> growth following three years <strong>of</strong> high economic growth. Growth <strong>of</strong> thetaxi fleet is assumed to be constrained by the quotas to no more than 300 per year(but see Section 9.12 on Supplementary Policies),CURRENT TRAFFICNONumber <strong>of</strong> vehs (thous)CarsTaxisGoodsPCU-kilometres (thous/hr)AM Peak HKKowloonNew TerTotalOff-Peak HKKowloonNew TerTotalAM PeakOff-Peak198614416842344435861 2631774335441 154Average traffic speeds (km/h)HK22.0Kowloon22.2New Ter33.4Total26.2HK29.6Kowloon 21.9New Ter37.5Total28.7Central Economic GrowthCommitted 1J2CTS Full CTSHyws only Highways Highways280181544186551 24523183136031 0231 94013.821.026.221.326.324.835.229.7280181544186551 24523183136031 0231 94015.723.729.424.027.727.036.531.4280181544186551 24523183136031 0231 94017.626.432.626.829.129.237.833.1High Economic GrowthCommitted 1J2CTS Full CTSHyws only Highways Highways418182165688721 60030414087621 28524557.012.315.912.020.717.327.022.0418182165688721 60030414087621 28524557.913.917.813.621.818.828.023.3418182165688721 60030414087621 28524558.915.519.715.122.920.328.924.6Note: Central economic growth about 5.6% per yearHigh economic growth specified at 9% per year9.7.15 <strong>The</strong> growth in vehicles has a strong impact on traffic volumes which are projectedto grow from 1986 to 1996 by 84% and 68% in the peak and <strong>of</strong>f-peak hoursrespectively under the Central economic growth assumption, but by 141% and113% with High economic growth.9.7.16 Projected traffic speeds vary according to traffic growth and the amount <strong>of</strong> highwayconstruction. With no further construction beyond current commitments and underthe Central economic growth assumption, traffic speeds would decline, relative to1986. A significant exception to this is Kowloon in the <strong>of</strong>f-peak hour, which testifiesto the large improvements in traffic congestion likely to be brought about by themajor traffic projects opening in the next few years; in particular, the EasternHarbour Crossing, Kwun long Bypass, Tate's Cairn Tunnel and West KowloonCorridor.9.7.17 With the completion <strong>of</strong> the full CTS-2 highway construction programme, averagetraffic speeds in the Territory would exceed 1986 levels marginally in the peak hour.However, speed changes from 1986 are uneven. In particular, peak hour speeds on<strong>Hong</strong> <strong>Kong</strong> Island would still be significantly worse than in 1986; about 18 km/h in1996 compared with 22 km/h in 1986. Under alternative scenarios, conditionswould be very much worse than in 1986. In particular, economic growth is a criticalaspect; under conditions <strong>of</strong> High economic growth, traffic speeds would be severelyreduced and unacceptably low in the urban areas in the peak hour, even with the fullCTS-2 highway programme.181
9.7.18 Thus although the Centra! economic growth projection combined with construction<strong>of</strong> the full highway programme recommended by CTS-2 appears to show acceptabletraffic conditions in 1996, the current high growth rate <strong>of</strong> the economy and thedifficulty <strong>of</strong> achieving the completion dates <strong>of</strong> highway projects show that there areno grounds for complacency.9.8 Package 1: Car Ownership Taxes9.8.1 <strong>The</strong> first policy package examined was an extension <strong>of</strong> the existing controls on carownership through increased vehicle taxation. <strong>The</strong> results are shown in Table 9.2.9.8.2 An increase in taxation on private cars and motor cycles in terms <strong>of</strong> annual licencefees and First Registration Tax <strong>of</strong> 50% was investigated, making an averageannualised increase <strong>of</strong> about $5,000 per vehicle. This would reduce the projectedunrestrained car and motorcycle fleet in 1996 from 280000 to 233000. Thiscompares with a fleet size at the end <strong>of</strong> June 1988 <strong>of</strong> 165 000, and shows an annualaverage growth rate <strong>of</strong> about 5% per year.9.8.3 Under conditions <strong>of</strong> Central economic growth and construction <strong>of</strong> the fullrecommended CTS-2 highway programme, this policy package results in veryeffective congestion relief. Traffic conditions would be as good if not better than in1986 based on a comparison <strong>of</strong> traffic speeds.9.8.4 While significant savings are brought about in operating costs for all transportoperations, this policy suffers by the massive disbenefits to would-be private carowners who can no longer afford this luxury. Under this policy, the private motoristpays a heavy price for the benefits brought to the rest <strong>of</strong> the community.9.8.5 While the policy is effective in traffic operations terms under Central economicgrowth and the full highway programme, the situation is not so good underconditions <strong>of</strong> higher economic growth or less highway construction. <strong>The</strong> 50%increase in taxes discussed above would have a much reduced impact on the size <strong>of</strong>the vehicle fleet and traffic conditions would be much worse than in 1986particularly in the peak hour. Even increasing the taxation on private cars and motorcycles by 120%, to reduce the vehicle fleet to the same size estimated under Centraleconomic growth for a 50% increase in taxation, would not improve traffic conditionsto 1986 levels. This is principally because <strong>of</strong> the estimated high growth in goodsvehicle traffic under conditions <strong>of</strong> High economic growth.9.8.6 Private car and motor cycle ownership restraint has the merit <strong>of</strong> being a familiar andtested policy in <strong>Hong</strong> <strong>Kong</strong>. It is simple to administer, effective in reducing vehicleownership and hence in tackling general congestion. However, it is non-selective asit is not directed at times and places where congestion is particularly a problem.Under conditions <strong>of</strong> High economic growth, other measures would be required inaddition; in particular controls on goods vehicle growth.9.9 Package 2: Fuel Tax9.9.1 <strong>The</strong> second package <strong>of</strong> options still concentrated on the control <strong>of</strong> car traffic,examining the impact <strong>of</strong> a doubling <strong>of</strong> petrol tax from $2.30 per litre to $4.60. Onlythe impact on car travel was examined although it is recognised that some light vanshave petrol engines. <strong>The</strong> results are reported in Table 9.3.9.9.2 <strong>The</strong> results in terms <strong>of</strong> traffic operations are quite similar to the effects <strong>of</strong> increasingcar ownership taxes although the impact <strong>of</strong> doubling petrol tax was less effectivethan a 50% increase in car ownership tax. It is emphasised though that the impacts<strong>of</strong> petrol tax are a little uncertain; it would be a new approach to traffic control andthe impacts <strong>of</strong> such an increase in tax would require careful monitoring.9.9.3 Economic benefits from savings in vehicle operating costs, travel time and publictransport operations were obtained at about one third <strong>of</strong> the level obtained from carownership taxes tested in Package 1. However, a petrol tax does not suffer from themassive economic disbenefits associated with car ownership taxes.182
Table 9.2 IN CARNumber <strong>of</strong> vehs (thous)CarsTaxisGoodsPCU-kilometres (thousfhr)AM Peak HKKowloonNew TerTotalOff-Peak HKKowloonNew TerTotalAverage traffic speeds (kmIn)AM Peak HKKowloonNew TerTotalOff-Peak HKKowloonNew TerTotalEconomic Benefits ($ mi/s/year)Operating cost savingsPassenger time savingsGenerated traffic benefitsPublic Transport savingsTotal economic benefits198614416842344435861 2631774335441 15422.022.233.426.229.621.937.528.7Committee/Hyws onlyCentra/ Economic GrowthCar Taxes Up112 CTSHighways23318-1543836101 18821812885719931 85316.824.028.824.428.426.936.531.6427277(822)353233181543836101 18821812885719931 85319.127.132.327.529.929.437.833.4379245(822)313Full CTSHighways233181543836101 18821812885719931 85321.430.235.830.631.431.839.135.2340220(822)281CommittedHyws onlyHigh Economic Growth—1Car Taxes Up 50%7/2 CTSHighways346182165107981 50828163677121 24023198.914.617.914.322.819.228.223.81 512979(1 302)1 250346182165107981 50828163677121 240231910.116.420.016.224.020.929.225.21 340868(1 302)1 107Full CTSHighways346182165107981 50828163677121 240231911.318.322.218.025.222.630.226.61 203779(1 302)994CommittedHyws onlyHigh Economic Growth—2Car Taxes Up 120%112 CTSHighways233182164467221 41225803286571 193217911.917.620.417.525.221.729.526.032502105(4 703)2686233182164467221 41225803286571 193217913.619.822.919.726.623.630.527.528821 866(4 703)2382Full CTSHighways233182164467221 41225803286571 193217915.222.125.421.927.925.631.628.925891 677(4 703)2140235 116 20 2439 2014 1 675 3338 2427 1 702Note: Central economic growth about 5.6% per yearHigh economic growth specified at 9% per year
9.3 INNumber <strong>of</strong> vehs (thous)CarsTaxisGoods1986144 1684Central Economic GrowthPetrol Tax DoubledCommitted 1/2 CTS Full CTSHyws only Highways Highways280 18154280 1815428018154High Economic Growth—1Petrol Tax DoubledCommitted 1/2 CTS Full CTSHyws only Highways Highways418 18216418 18216418 18216High Economic Growth—2Petrol Tax QuadrupledCommitted 1/2 CTS Full CTSHyws only Highways Highways418 18216418 18216418 18216PCU-kHometres (thous/hr)AM Peak HKKowloonNew TerTotalOff-Peak HKKowloonNew TerTotalAverage traffic speeds (km/h)OQ AM Peak HK•£*KowloonNew TerTotalOff-Peak HKKowloonNew TerTotalEconomic Benefits ($ mils/year)Operating cost savingsPassenger time savingsGenerated traffic benefitsPublic Transport savingsTotal economic benefits2344435861 2631774335441 15422.022.233.426.229.621.937.528.73976301 21322402985851 0051 88815.522.727.723.027.526.036.030.8162101(145)1372553976301 21322402985851 0051 88817.625.631.026.029.028.337.332.614389(145)1222103976301 21322402985851 0051 88819.728.534.428.930.530.638.534.412980(145)1091735338291 54829103827331 25823728.013.617.013.322.018.327.723.1566352(224)4811 1775338291 54829103827331 25823729.115.319.015.023.220.028.724.5502312(224)4271 0175338291 54829103827331 258237210.217.121.116.724.321.629.725.8451280(224)3838905208161 52428613737221 24523418.514.017.513.822.518.728.023.51,058658(492)89921235208161 52428613737221 24523419.715.719.615.623.620.429.024.9937583(492)7971 8255208161 52428613737221 245234110.817.521.717.424.822.130.026.2842524(492)7151 589Note: Central economic growth about 5.6% per yearHigh economic growth specified at 9% per year
9.9.4 As with car ownership taxes, the High economic growth scenario shows seriouscongestion even with much higher petroi taxation rates on private cars andmotorcycles. This again emphasises the need for goods vehicle controls under theseconditions.9.9.5 Petrol tax is a usage tax with the advantage that individuals can decide when, whereand how much to use their cars depending on personal circumstances; there is nooutright exclusion from car ownership. It is also simple to administer. However, likecar ownership taxes, it affects all travel whether made in congested areas oruncongested. It does have slightly more impact in congested areas in that slowertraffic speeds increase the rate <strong>of</strong> petrol consumption and hence the rate <strong>of</strong> tax paidbut this effect is marginal. It does not allow the flexibility to discourage particulargroups by charging higher rates.9.9.6 An increased petrol tax could cause a switch to diesel engined cars. To combat this,adjustments could be required to the current special tax rates on private diese!vehicles. Alternatively, an increase in diesel fuel taxation for other reasons such ascontrol <strong>of</strong> taxis and goods vehicles could also be considered. <strong>The</strong> latter measureswould help improve environmental conditions by reducing pollution caused bydiesel vehicles.9.10 Package 3: Goods Vehicle Controls9.10.1 <strong>The</strong> goods vehicle fleet has tripled in the last 12 years from about 33000 vehiclesto 99 000. While strong measures were being taken against private cars and taxisin the form <strong>of</strong> ownership taxes and quotas respectively, changes in taxation ongoods vehicles have done little more than keep pace with inflation, in other words,the entire thrust <strong>of</strong> traffic management policies has been directed at private carsand taxis.9.10.2 It is clear from the analyses <strong>of</strong> the Study that the growth in goods vehicle traffic willbe a great concern to the long term traffic conditions. It is noted from the above thatcar ownership taxation and petroi tax would be adequate only under conditions <strong>of</strong>Central economic growth and with the full CTS-2 recommended highway construction.Even under the Central economic growth assumptions, evidence fromother longer term studies indicate that controls on private cars alone will beinsufficient to manage traffic congestion beyond the year 2001. <strong>The</strong>refore, the Studyhas examined the possibilities and consequences <strong>of</strong> controlling the growth <strong>of</strong> thegoods vehicle fleet In particular, the Study examined the impact on traffic operations<strong>of</strong> reducing the estimated 1996 demand for goods vehicles by 15%; the results arereported in Table 9.4.9:10.3 <strong>The</strong> results <strong>of</strong> this policy option are similar to those <strong>of</strong> car ownership taxes in generaltraffic operations but with some significant differences. In particular, the impacts <strong>of</strong>goods vehicle controls are felt more in the New Territories and less on <strong>Hong</strong> <strong>Kong</strong>Island. Economic benefits from savings in vehicle operation costs, travel time andpublic transport operations are about 80% <strong>of</strong> those obtained from car ownershiptaxes in Package 1. This option also suffers from the same massive disbenefits tovehicle owners who are no longer able to afford to buy goods vehicles.9.10.4 At High economic growth, goods vehicle controls would not be sufficient on theirown and would need to be combined with other measures.9.10.5 Achieving Goods Vehicle Controls— It is assumed that the 15% reduction in goodsvehicle activity could be achieved by means <strong>of</strong> increases in vehicle taxation. Thiswould increase the costs <strong>of</strong> goods vehicle operations and this in turn wouldencourage operators and users <strong>of</strong> goods vehicles to seek improvements in operationalefficiency. However, a very real difficulty arises in assessing the size <strong>of</strong> taxationincrease to achieve a specified reduction. <strong>The</strong> 1984 Trucking Industry Study pointedout that taxation is only a comparatively small proportion <strong>of</strong> total operating costs <strong>of</strong>goods vehicles, and the cost <strong>of</strong> local transport which is linked to the cost <strong>of</strong> goods185
Table 9.4ON(Increases in goods vehicle taxation and diesel fuel duties)Number <strong>of</strong> vehs (thous)CarsTaxisGoodsPCU-kilometres (thous/hr)AM Peak HK KowloonNew TerTotalOff-PeakHKKowloonNew TerTotalAverage traffic speeds (kmjh)AM Peak HK KowloonNew TerTotalOff-Peak HKKowloonNew TerTotalEconomic Benefits ($ mils/year)Operating cost savingsPassenger time savingsGenerated traffic benefitsPublic Transport savingsTotal economic benefits1986144 16842344435861 2631774335441 15422.022.233.426.229.621.937.528.7Central Economic GrowthTaxation Up 200%Committed 1/2 CTS Full CTSHyws only Highways Highways280 181313946081 15921612965719661 83315.724.230.324.427.727.037.731.9337217(471)271280 181313946081 15921612965719661 83317.927.334.027.529.229.439.033.7299193(471)240280 181313946081 15921612965719661 83320.030.437.730.730.631.840.435.6268173(471)216High Economic Growth—/Taxation Up 200%Committed 1/2 CTS Full CTSHyws only Highways Highways418 181845297951 46527903797121 20222938.214.718.914.222.119.229.224.01 170754(455)941418 181845297951 46527903797121 20222939.316.521.216.023.320.930.325.51 037668(455)833418 181845297951 46527903797121 202229310.418.423.517.924.522.631.326.9930599(455)748High Economic Growth—2Taxation Up 300%Committed 1/2 CTS Full CTSHyws only Highways Highways418 181515107491 34826083676781 12421698.816.422.415.922.820.631.625.721461 382(1 094)1 724418 181515107491 34826083676781 124216910.118.525.118.024.022.532.727.21 9001 224(1 094)1 527418 181515107491 34826083676781 124216911.320.627.820.025.224.333.828.71 7051 098(1 094)1 370354 260 186 2410 2083 1 823 4158 3556 3078Note: Central economic growth about 5.6% per yearHiah finonomin nrnwth snftnififid at 9% nf*r \rna
vehicle operations is only a very small proportion <strong>of</strong> the total production costs <strong>of</strong>industry. <strong>The</strong> relevant figures are illustrated in Figure 9.2. <strong>The</strong> Trucking IndustryStudy therefore concluded that even quite large changes in taxation would beunlikely to have a very big impact on the volume <strong>of</strong> goods vehicle traffic. It was alsoconcluded that, for the same reasons, that increases in goods vehicle taxation wasunlikely to have a significant impact on industry production costs.FIGURE 9.2: TRUCKING COSTS IN HONG KONG INDUSTRYTaxes$0.4 billion10%$432b.mon ___ ^bffllon ' $a?b5on^1% 90%TOTALINDUSTRYTRUCKINGINDUSTRY1981 Dollars9.10.6 However, not all goods vehicles are used for the sole purpose <strong>of</strong> transporting goods.It has been noted that following the increases in private car taxation in the early1980s, there was a switch from registering light vans as private cars to registeringthem as goods vehicles. Vans currently make up about half the goods vehicle fleetand it is suspected that a significant proportion are used solely for private purposesor at least only incidentally as goods carriers. Increases in goods vehicle taxationshould have a large impact on these vehicles and should control their future growth.A further reason for higher taxes on medium and heavy goods vehicles is to obtain abigger contribution to the costs <strong>of</strong> road repair and provision. It is estimated that 80%<strong>of</strong> road maintenance costs and 15% <strong>of</strong> road construction costs can be attributable toheavy vehicles.9.11 Package 4: Area Pricing9.11.1 <strong>The</strong> disadvantage <strong>of</strong> all the traffic demand management options so far examined isthat they are non-selective, affecting the use <strong>of</strong> relatively uncongested roads as wellas the busiest roads. Area pricing <strong>of</strong>fers a way <strong>of</strong> being far more selective in trafficcontrols permitting wider vehicle ownership and making better use <strong>of</strong> the Territory'sroad system.9.11.2 This policy option was evaluated by testing one <strong>of</strong> the road pricing schemesexamined in the 1985 Electronic Road Pricing (ERP) Study. This envisaged cordonsset up around and within the main urban area with charges levied on all vehiclescrossing the cordon. <strong>The</strong> scheme calls for automatic identification and charging <strong>of</strong>vehicles by means <strong>of</strong> electronic detection. Monthly road charge bills would be sentto motorists in much the same way as utility bills. Charges could vary by time <strong>of</strong> day,ranging from peak charges at the busiest times to no charges at all during the nightand on Sundays.187
9.11.3 <strong>The</strong> specific scheme chosen was the 1 985 ERP Study Scheme B proposal. <strong>The</strong> mapin Figure 9.3 shows the locations <strong>of</strong> the pricing cordons where road user chargeswould be imposed. Generally, they control private cars entering and leaving the mainurban areas <strong>of</strong> <strong>Hong</strong> <strong>Kong</strong> island North and the Kowloon Peninsula with subsidiarycordons further controlling movements within these areas. Only private cars wouldbe charged. Prices were set at the levels described for Scheme B as shown on themap. One variation on the ERP Study scheme was to extend the scheme to operateon Saturdays as well as weekdays. This was because Saturday traffic volumes aresimilar to those on a weekday and restraint would clearly be beneficial. <strong>The</strong> resultsare set out in Table 9.5.9.11.4 At the charge levels tested, the overall traffic performance <strong>of</strong> area pricing was similarto those <strong>of</strong> 50% increase in car ownership taxation; while the latter policy gave morerelief in the inter-peak period, area pricing gave more relief in the peak period whereit is more necessary. Economic benefits from improved operating costs <strong>of</strong> transport,savings in travel time and savings in public transport operations were also similar tothose <strong>of</strong> car ownership taxation, but area pricing has the advantage <strong>of</strong> comparativelySow disbenefits associated with restrained traffic. <strong>The</strong>re is none <strong>of</strong> the massive dropin car ownership although there are some disbenefits from suppressed traffic.Moreover, with area pricing, it is possible to return a large proportion <strong>of</strong> the revenuescollected from the scheme which was estimated at about $400 million per year,averaging $120 per month per vehicle, to the motorists in the form <strong>of</strong> reduced annuallicence fees.9.11.5 Area pricing is very effective, reducing usage directly and only at the times andplaces which require restraint. It is also flexible as coverage and level <strong>of</strong> chargescould be adjusted to suit changes in circumstances. However, the actual impact isuncertain as the option has not been tested before or tried elsewhere.9.11.6 Unlike any <strong>of</strong> the other policy options examined, area pricing would require asubstantial initial investment to install vehicle detection equipment at the pricingcordons, set up a central billing and monitoring organisation and to fit all vehicleswith electronic identification tags. Costs would be incurred thereafter to operate andmaintain the scheme. Annuaiised costs were estimated in 1 985 at about $50 millionper year, consisting <strong>of</strong> $30 million capital costs and $20 million recurrent costs.<strong>The</strong>se are well covered by the expected economic benefits over no restraint policy,Thus the costs <strong>of</strong> installing and running an area pricing scheme should not oneconomic grounds be considered a deterrent.9.11.7 <strong>The</strong>re are also other problems with area pricing which need to be resolved. <strong>The</strong>secan be summarised as follows:(1) Some control <strong>of</strong> taxis, which the ERP Study considered would be exempt fromthe scheme, would be required to prevent a switch from cars to taxis as a result<strong>of</strong> area pricing. Unless this is prevented, many <strong>of</strong> the traffic advantages <strong>of</strong> areapricing would be lost.(2) Similarly controls on light goods vans would need to be tightened to ensurethat private vans registered as goods vehicles were-not used to avoid the areapricing charges. Again, goods vehicles were exempted from the area pricingschemes in the ERP study.(3)' Area pricing may shift congestion to areas outside the pricing areas and thisneeds to be examined in detail.(4) Political acceptability is clearly vital, this being where the 1985 recommendationsfoundered. Two particular objections were made at the time. <strong>The</strong> first wasto the 'big brother' connotations <strong>of</strong> automatic vehicle detection. <strong>The</strong> secondwas to the cost; it simply was not accepted that costs would be less than thealternative <strong>of</strong> car ownership taxation restraint or that the introduction <strong>of</strong> ERPwould lead on to lower annual licence fees.188
NO CHARGE$6NO CHARGE$3MO CHARGEFigure 9.3ERP STUDY SCHEME B PROPOSAL189
Table 9.5(Similar to Scheme B investigated by the 1985 ERP Study)Number <strong>of</strong> vehs (thous)CarsTaxisGoodsPCU -kilometres (thous/hr)AM Peak HK KowloonNew TerTotalOff- Peak HKKowloonNew TerTotalAverage traffic speeds (kmlh)AM Peak HK KowloonNew TerTotalOff -Peak HKKowloonNew TerTotalEconomic Benefits {$ mils /year)Operating cost savingsPassenger time savingsGenerated traffic benefitsPublic Transport savingsTotal economic benefits1986144 16842344435861 2631774335441 15422.022.233.426.229.621.937.528.7CommittedHyws onlyCentral Economic Growth@2/3* ERP Study Charges1/2 CTSHighways280 181543686011 20721762915781 0061 87518.324.727.924.828.126.535.931.2432286(317)388280 181543686011 20721762915781 0061 87520.827.931.328.029.628.837.233.0383254(317)344Full CTSHighways280 181543686011 20721762915781 0061 87523.331.334.731.131.131.238.534.7344228(317)310CommittedHyws onlyHigh Economic Growth—7@2/3* ERP Study Charges7/2 CTSHighways418 182164897841 53928113717221 25923539.715.017.214.722.618.721.123.41 484983(490)1 3335418 182164897841 53928113717221 259235311.117.019.316.523.820.428.724.81 316872(490)1 183Full CTSHighways418 182164897841 53928113717221 259235312.418.921.318.425.022.129.626.11 182783(490)1 063High Economic Growth—2@7.5* ERP Study ChargesCommitted 1/2 CTS Full CTSHyws only Highways Highways418 182163926791 47025413346791 234224715.919.718.818.524.820.628.325.032892179(2 093)2957418 182163926791 47025413346791 234224718.122.221.120.826.122.529.326.429201 935(2 093)2626418 182163926791 47025413346791 234224720.324.823.423.227.524.330.427.826261 740(2 093)2361790 665 565 3312 2881 2538 6332 5387 4633Note\ Central economic growth about 5.6% per yearHigh economic growth specified at 9% per year
9.11.8 It is concluded that area pricing has the greatest potential for controlling trafficgrowth successfully and to the greatest benefit <strong>of</strong> the community. Some problemsrequire resolving, but would be well worth re-investigating.9.12 Supplementary Transport Policies9.12.1 Based on the detailed assessments <strong>of</strong> policy options undertaken by the Study,selected options were defined as a set <strong>of</strong> supplementary policies common to ai! otherpackages. <strong>The</strong>se concerned treatment <strong>of</strong> taxis, minibuses, parking controls andtunnel tolls.9.1 2.2 Taxi Quotas—<strong>The</strong>re was a very rapid growth in the number <strong>of</strong> urban taxis in the firstpart <strong>of</strong> the 1 980s with the fleet increasing from about 9 000 in 1980 to 16 000 in1985. As a result <strong>of</strong> this rapid growth, quotas were imposed in 1984 on the number<strong>of</strong> new taxi licences granted each year. Currently these are at the rate <strong>of</strong> 200 urbanlicences and 100 New Territories taxi licences, but they will be reviewed asnecessary.9.1 2.3 As discussed in Chapter 3 the recent growth in demand for taxis was undoubtedlyinfluenced by the growing affluence <strong>of</strong> people and by the decline in average urbantaxi fares measured in real terms relative to other public transport modes in the sameperiod. As a result <strong>of</strong> these relative fare changes, it is now <strong>of</strong> similar cost for somejourneys for a small group to travel by taxi as by bus but consuming on average atleast five times as much road space.9.12.4 A rational road space allocation policy requires that the differential between taxifares and bus fares be restored. To make an abrupt change in taxi fares would be verydisruptive and so a policy <strong>of</strong> gradual increases in taxi fares should be pursued. Overthe period <strong>of</strong> adjustment, it is sensible to maintain the current quotas on new taxilicences. Fare increases can then be judged to maintain a balance between thedemand for taxis and the limited supply imposed by quotas. <strong>The</strong> status <strong>of</strong> thisbalance can continue to be judged by monitoring surveys <strong>of</strong> taxi usage.9.12.5 If necessary, taxi fare rises can be induced by imposing taxation on taxis; this wouldavoid taxi owners and drivers pr<strong>of</strong>iting unduly from the fare increases <strong>of</strong> taxis. <strong>The</strong>most suitable tax to adjust might be the tax on diesel duty since this would fit withrecommendations on other fuel taxes presented later and would also be likely toreduce unnecessary empty taxi trips.9.12.6 Minibus Quotas—<strong>The</strong> number <strong>of</strong> public minibuses has been kept constant for 13years at 4 350 but the carrying capacity has recently been increased from 14 to 16seats. Controls are judged to be necessary because <strong>of</strong> the preference <strong>of</strong> red PLBdrivers to operate on the main public transport corridors which can be moreefficiently operated by franchised buses. Much effort has gone into converting thered public light buses into green minibuses operating feeder services to areas <strong>of</strong> lowtraffic volume or difficult topography which are unsuited to larger vehicles. It isrecommended that this policy be continued and current limits on the number <strong>of</strong>public minibuses be maintained.9.12.7 Parking Controls— Control <strong>of</strong> traffic levels by parking policy is difficult to achieve,partly because traffic volumes are not always related to the need to park in an area assome traffic is just passing through and also because much parking is private andtherefore uncharged. <strong>The</strong> most that can be hoped for is to restrict the supply <strong>of</strong> allparking places by planning controls and control the price <strong>of</strong> public parking places.Parking prices in public car parks are currently adjusted at regular intervals to obtainapproximately a 1 5% availability rate. If parking places are not under-supplied, thereis no point in charging either more or less than this rate.9.12.8 <strong>The</strong> main issue concerns the supply <strong>of</strong> new parking places. It is essential that this iscontrolled to the capacity <strong>of</strong> the road system so that use <strong>of</strong> private cars in congestedareas is not encouraged unduly. Estimates by CTS-2 indicate that an increase inparking places is required and could be tolerated by the expanded road system.However, it is strongly recommended that this is done only on the basis <strong>of</strong> area-wide191
traffic assessments. If the increase in supply <strong>of</strong> parking places is restricted to matchthe capacity <strong>of</strong> the road system to cope, then parking charges can be matched to thedemand to ensure proper utilisation on the lines <strong>of</strong> present policy.9.12.9 Tunnel Tolls—<strong>The</strong> level <strong>of</strong> tunnel tolls controls the traffic demand for the tunnelfacilities. <strong>The</strong> impact <strong>of</strong> toils can be judged by the changes in tunnel traffic whichoccurred following the imposition <strong>of</strong> a passage tax on the Cross-Harbour tunnel in1984 (discussed in Chapter 3). Car and taxi traffic in 1988 was still lower than in1984, perhaps also attributable to the decline in the private car fleet although thesurge in goods vehicle traffic took total traffic volumes in the tunnel in 1988 beyondthe 1984 levels.9.12.10 <strong>The</strong> most important result <strong>of</strong> controlling tunnel traffic is the elimination <strong>of</strong> queues <strong>of</strong>traffic waiting for an over-capacity tunnel blocking the adjacent road network. It isclear that the costs <strong>of</strong> congestion on the urban road network due to traffic storage forthe Cross- Harbour and Lion Rock tunnels is currently one <strong>of</strong> the most serious trafficproblems in <strong>Hong</strong> <strong>Kong</strong>.9.12.11 With the opening <strong>of</strong> new road tunnels in the next few years, there will possibly bea need to adjust tunnel, tolls to control the traffic distribution between parallelfacilities; for example, between the existing Cross-Harbour tunnel and the newEastern Harbour Crossing due to open in 1989, and between the Lion Rock tunneland the Tate's Cairn tunnel due to open in 1991.9.12.1 2 Thus tunnel tolls can be used as a tactical measure both to control tunnel usage toacceptable levels and to ensure an efficient balance <strong>of</strong> use between parallel routes.In this context, there is scope for differential tolls by vehicle type and by time <strong>of</strong> daygiven adequate sophistication <strong>of</strong> toll collection equipment.9.13 Recommendations on Transport Management Policies9.13.1 Results <strong>of</strong> the evaluation <strong>of</strong> the policy packages are summarised in Table 9.6.Table 9.6 Of OFECONOMICBENEFITSEFFECTIVENESSEASE OFADMINISTRA-TIONFLEXIBILITYSELECTIVITYCar OwnershipTaxationHigh, but with massivedisbenefits due tosuppression <strong>of</strong> carownershipVery effective; impactknown and testedFuel TaxBenefits <strong>of</strong> doubling taxare about 1 /3 <strong>of</strong> those <strong>of</strong>50% increase inownership taxation;disbenefits with ownersmuch lessSlightly less effectivethan ownership taxation;impact a littie uncertainas not tested beforePolicy PackageGoods VehicleControlsBenefits <strong>of</strong> 15%reduction in g.v. fleet areabout 80% <strong>of</strong> those <strong>of</strong>50% increase in carownership taxation (17%reduction in car fleet)Not known, but likely tobe very effective, withimpact felt more stronglyin New Territories andless on HK IslandSimple to administer Simple to administer Simple to administerLevel <strong>of</strong> taxation couldbe adjusted easilyNon-selective, affectingall motoristsLevels <strong>of</strong> taxation couldbe adjusted easilyNon-selective, affectingall journeysLevel <strong>of</strong> taxation couldbe adjusted easilyCharges could be variedfor different types <strong>of</strong>vehicleArea PricingBenefits at 2/3 <strong>of</strong> ERPScheme B charges aresimilar to those <strong>of</strong> 50%increase in car ownershiptaxation; comparativelylow disbenefits withsuppressed trafficNot known, but likely tobe very effective. Optionrejected before by thepublic and not testedelsewhereRequires substantial initialinvestment and a centralbilling and monitoringorganisationCoverage and level <strong>of</strong>charges could be adjustedto suit changes incircumstancesHighly selective, reducingusage directly at times andplaces which requirerestraint192
9.13.2 Based on the analyses <strong>of</strong> the Study, the following transport management policies arerecommended for controlling growth in traffic demand:For immediate consideration(1) Maintain taxi quotas at the current level <strong>of</strong> not more than 300 new taxi licencesper year. Taxi fares should be adjusted to maintain a balance between demandfor taxi services and the supply <strong>of</strong> new taxis.(2) Maintain the current limit <strong>of</strong> 4 350 public (red and green) light buses.(3) Increase the ownership taxes on private motoring to curb the current highgrowth in private car traffic.(4) Introduce regular adjustments to tunnel tolls to ensure that traffic demand fortunnels does not exceed traffic capacity.(5) Continue to adjust the parking fees for public car parks to maintain an average1 5% availability rate and assess the provision <strong>of</strong> new public car parks based onthe capacity <strong>of</strong> the road system to absorb additional traffic.(6) Modify the ownership tax structure for goods vehicles to raise taxes generallyand to increase taxes on light goods vehicles in particular. This is to ensure anefficient use <strong>of</strong> the road system by reducing marginal users, and to ensure thatheavy and medium goods vehicles make a proper contribution to road provisionand repair.For further consideration(7) Increase fuel tax on private cars and motorcycles and monitor the effects over atrial period. <strong>The</strong> increase would have to be severe to have significant impact.(8) Increase the duties on diesel fuel as an additional measure to curb the growth <strong>of</strong>goods vehicle traffic and as a means <strong>of</strong> inducing cost increases and thereforefare increases on taxi operations.(9) Re-investigate the potential for area pricing considering both techniques similarto those adopted in Singapore and the results <strong>of</strong> the 1985 ERP study. <strong>The</strong>possibility <strong>of</strong> widening the coverage <strong>of</strong> such an area scheme, if adopted, toinclude all or most types <strong>of</strong> vehicles should also be considered.193
10 ON10.1 Introduction10.1.1 This concluding chapter summarises the recommended transport strategy, includingproposals for the the construction <strong>of</strong> new highways and railways and proposals fortransport management policies. <strong>The</strong> chapter also discusses the steps necessary forimplementation <strong>of</strong> the recommended strategy and other issues concerned withlong-term transport planning. <strong>The</strong> recommendations and conclusions, unlessotherwise stated, relate to the airport retained at its present site.10.2 Recommended Highway Programme10.2.1 <strong>The</strong> Study evaluated a large number <strong>of</strong> highway projects and established prioritiesfor highway construction in the 1990s. in preparing this new programme <strong>of</strong> highwayprojects, the Study took into account the programme <strong>of</strong> highway projects alreadyunder construction or in the final stage <strong>of</strong> design.10.2.2 <strong>The</strong> total value <strong>of</strong> all public and private highway related investments currently underconstruction or firmly committed is estimated at nearly $23 biliion (in 1988 prices),<strong>of</strong> which $10-11 billion remained to be spent from the beginning <strong>of</strong> 1989. Underpresent budgetary considerations, funds for new projects recommended by thisStudy, and discussed below, are not expected to become available until 1992 at theearliest.10.2.3 It is also noted that the construction industry is experiencing severe cost inflation atthe present time; highway costs rose by over 30% and railway costs by 40% to 50%from mid-1986 to mid-1988. It is possible therefore that funding limits and capacityconstraints could extend the construction period for committed projects, thuspostponing the start on projects recommended by the Study until 1993.Recommended Highway Projects10.2.4 <strong>The</strong> CTS-2 Study recommends a $20 biliion (in 1988 prices) construction programmefor new highway projects for construction in the 1990s. <strong>The</strong> programme issummarised in Table 6.4 and the locations <strong>of</strong> the major projects are shown inFigure 6.3 <strong>of</strong> Chapter 6.10.2.5 <strong>The</strong> recommended highway strategy includes the construction <strong>of</strong> three new trunkhighways:(1) Route 3 from <strong>Hong</strong> <strong>Kong</strong> Island to Yuen Long, via the Western HarbourCrossing and northwards on new reclamation along the west side <strong>of</strong> theKowloon peninsula, through Tsing Yi Island and then through the Tai LamCountry Park, mostly in tunnel.(2) Route 7 on <strong>Hong</strong> <strong>Kong</strong> Island, extending from the current end <strong>of</strong> the IslandEastern Corridor in Causeway Bay through the planned Central and WanchaiReclamation to Western and round the coast to Aberdeen.(3) A new route which extends the Hung Horn Bypass from Tsim Sha Tsui, alongthe east side <strong>of</strong> the Kowloon peninsula, across the Hung Horn Bay reclamationand under the airport in a second airport tunnel to an interchange with theKwun Tong Bypass now under construction.10.2.6 <strong>The</strong> major trunk road projects would be built in stages; the following priorities arerecommended:(1) <strong>The</strong> highest priority is for Route 3 (Western Harbour Crossing). It is currentlyplanned as a 6-Iane immersed tube tunnel connecting Western District on <strong>Hong</strong><strong>Kong</strong> Island with the west side <strong>of</strong> the Kowloon peninsula. It would require194
completion <strong>of</strong> the southern arm <strong>of</strong> the West Kowloon Reclamation to provideKowioon landfall.(2) A section <strong>of</strong> Route 7 on <strong>Hong</strong> <strong>Kong</strong> Island from Sai Ying Pun to Kennedy Towiis scheduled early to provide adequate connections for the Western HarbouCrossing.(3) Despite its high priority, Route 3 (West Kowioon Expressway) has to bdeferred to mid to late 1990s as the West Kowioon Reclamation, upon whicfthe expressway is to be built, cannot be completed until the late 1990s.(4) Early priority is given for the improvements to South Kwai Chung Road Phase;1 1 and ! 1 1 which also form part <strong>of</strong> Route 3, linking the West Kowioon Expresswayto the section <strong>of</strong> Route 3 on Tsing Yi Island. As a temporary measure in advance<strong>of</strong> completion <strong>of</strong> the West Kowioon Expressway, this project should beextended south around the bottleneck <strong>of</strong> Lai Chi Kok bridge to connect with th
10.2.9 <strong>The</strong>re are clearly some possibilities for private participation in new highway projects,similar to the present projects <strong>of</strong> the Eastern Harbour Crossing and the Tate's Cairntunnel. However, it is assumed that this will not expand the total funds for highwayconstruction but merely be a substitute for public funding.10.2.10 Although currently committed highway projects are expected to absorb availablefunding until at least 1992, detailed planning and design <strong>of</strong> new projects shouldcommence immediately.10.3 Recommended Railway Programme10.3.1 In the 13 years since the MTR started construction, some $28 billion have beeninvested in rail projects with the construction <strong>of</strong> the Mass Transit Railway ($22billion), the modernisation <strong>of</strong> the Kowloon-Canton Railway ($3 billion), and theconstruction <strong>of</strong> the Light Rail Transit system in North-west New Territories ($2.5billion). Following this massive investment in railways, only a few rail projectscurrently remain under construction. <strong>The</strong> main project is a new MTR rail link acrossthe harbour using the Eastern Harbour Crossing which is due to open in 1989. Inaddition to this MTR project, the LRT system in North-west New Territories will beextended by three new lines providing direct rail access for further population areasin the region, including the new town <strong>of</strong> Tin Shui Was. <strong>The</strong>se extensions areexpected to be progressively completed in the next few years.10.3.2 Given the success and popularity <strong>of</strong> the rail system, the Study examined thepotential for new projects to further extend the rail system. A rail investmentprogramme <strong>of</strong> $9 billion is recommended for the early 1990s, with a possible further$20 billion in the late 1990s. Two main classes <strong>of</strong> rail project were considered:(1) Extensions to major communities not yet reached by rail.(2) Additions to the existing rail network to extend the coverage <strong>of</strong> the rail system,and to relieve congestion on existing lines.Extensions to New Communities10.3.3 New rail lines are recommended to two communities in the New Territories: theseare the new town <strong>of</strong> Junk Bay and the region <strong>of</strong> the North-west New Territories.Both communities are planned to be major population growth centres and it isstrongly recommended that the detailed planning <strong>of</strong> the new rail lines go hand-snhandwith the development <strong>of</strong> these communities. Both links are recommended forconstruction in the early 1990s, assuming current plans for population growth.10.3.4 <strong>The</strong> build-up in population in Junk Bay has only just started but it could reach270000 by 2001, depending on the decision to proceed with Phase III <strong>of</strong> the newtown. Planning for the town includes provision for an extension <strong>of</strong> the MTR from theexisting Kwun Tong line and this is considered justified by the CTS-2 Study. <strong>The</strong>estimated cost <strong>of</strong> the project is about $2.5 billion, including construction and rollingstock.10.3.5 <strong>The</strong> detailed planning <strong>of</strong> a rail link to the North-west New Territories is a morecomplex matter than for Junk Bay. It is clear that the link should start from theexisting MTR station in Tsuen Wan but choice <strong>of</strong> terminus in the TSA (either YuenLong or Tuen Mun), type <strong>of</strong> train operation and operator have all to be decided.CTS-2 analyses indicate that the route from Tsuen Wan to Yuen Long hasadvantages but much would depend on the detailed engineering feasibility studies<strong>of</strong> the alternatives. Projected patronage indicates that a light railway probably wouldnot be adequate for future demands but whether it should be operated to the fullheavy rail standards <strong>of</strong> the MTR or the KCR, or to some intermediate configuration,remains to be investigated. It is important that the fares on the urban link are fullyintegrated with the urban area rail fare structure, thus giving the advantage <strong>of</strong>relatively cheap fares for long distance travellers to encourage maximum use <strong>of</strong> thisexpensive facility. <strong>The</strong> estimated cost <strong>of</strong> a heavy rail line between Tsuen Wan andYuen Long is about $3 billion including rolling stock.196
New Urban Rail Links10.3.6 <strong>The</strong> original plans for the Mass Transit Railway included four lines, <strong>of</strong> which threehave been built so far. <strong>The</strong> Study examined the case for the fourth line known as theEast Kowloon Line running from Diamond Hill in Kowloon to Sheung Wan on <strong>Hong</strong><strong>Kong</strong> Island and with extensions to Sha Tin in the north and to Aberdeen in thesouth, it was concluded that the line could attract substantial patronage, with morepassengers projected in 2001 than the MTR Island Line carries today. However, theline would be extremely expensive, perhaps $20 billion for construction and rollingstock in 1988 prices. While passenger revenues from such a line should be able tocover the full costs <strong>of</strong> operation and depreciation, the operating surplus would give avery low financial return on the initial investment. On the other hand, the projectwould generate substantial benefits in terms <strong>of</strong> savings in economic resources suchas reduced travel time and better quality <strong>of</strong> travel for passengers, reduction inoperating costs for other transport operators and reduction in traffic congestion bygetting travellers <strong>of</strong>f the roads. <strong>The</strong>se savings would be sufficient to make this aworthwhile project for the community as a whole.10.3.7 While the MTR East Kowloon Line on its original alignment would be a worthwhileproject, there are important new opportunities to re-plan this line to take advantage<strong>of</strong>, and enhance, new developments currently under study in the urban area. <strong>The</strong>seinclude the development <strong>of</strong> the planned new harbour reclamations and redevelopment<strong>of</strong> the existing urban area under study in the METROPLAN project.Relocation <strong>of</strong> the airport from its current site <strong>of</strong> Kai Tak if proceeded with would alsoopen up further opportunities. It is therefore strongly recommended that wherejustified, the opportunities for, and planning <strong>of</strong>, a new urban rail line should be fullyintegrated with the future plans for expanding and re-developing the existing urbanarea.New Harbour Rail Crossing10.3.8 <strong>The</strong> pace <strong>of</strong> re-development and the time scale for completing new reclamationsimplies that a new urban rail line could not be contemplated for construction untilthe late 1990s, However, the Study concludes that there is an urgent need for a newrail harbour crossing for completion by the mid 1 990s to cope with expected normaltraffic growth and the additional demands arising from the recommended railextensions to Junk Bay and the North-west New Territories.10.3.9 It is clear that the new crossing must be planned in the context <strong>of</strong> planned harbourdevelopments and the potential for a new urban rail line in the 1990s as discussedabove. CTS-2 has provisionally designated the MTR harbour crossing from Yau MaTei to Fortress as the next rail harbour crossing, including an intermediate KCR/MTRinterchange station at Hung Horn which would relieve the currently overloadedinterchange at Kowloon Tong; it is estimated that this would cost about $3.5 billionfor construction and rolling stock. However, detailed planning and engineeringstudies may suggest a different alignment including the possibility <strong>of</strong> an alignmentbased on the KCR system rather than the MTR.Joint Development <strong>of</strong> the Recommended Road and Rail Harbour Crossings10.3.10 It will be noted that the Study is recommending two new harbour crossings: theWestern Harbour Road Crossing discussed earlier, and a rail link as discussed above.<strong>The</strong> Study examined the question <strong>of</strong> whether the two crossings could be combinedinto one, as with the Eastern Harbour Crossing now under construction whichcontains both a 4-lane highway and an MTR line. It was concluded that it would notbe satisfactory for the new rail and road crossings to share the same tunnel because<strong>of</strong> tunnel size and tunnel gradients. Also, the Western Harbour Road Crossing wouldnot be an idea! location for the next rail harbour crossing, being too removed fromthe main rail travel demands. However, if the tunnels were built at the same time,significant cost savings might be possible in the operation <strong>of</strong> the necessary tunnelconstruction facilities.197
Railway Funding10.3.11 An expenditure programme for railway investments was not established in the sameway as for highway projects, since recommended new projects are few in numberand could be decided on a case by case basis. Also, it is expected that investment inthese projects will be made by either IVITRC or KCRC, either from internal funds orby borrowing. Government support, if any, would be decided only after detailedstudy <strong>of</strong> the rail proposals and the overall financial position <strong>of</strong> the two corporations.10.4 Conclusions on Public Transport10,4.1 A strong growth in demand for public transport services is projected, with particulargrowth in rail travel in the New Territories. Serious consideration will need to begiven to rationalising the ferry services as they are vulnerable to competition by crossharbour bus and rail services, although passenger demand for ferries in the centralharbour area and for outlying districts services is expected to remain strong. KMBbus operation is likely to be affected by the projected reduction in population inKowloon and the extension <strong>of</strong> rai! services in the New Territories recommended bythis Study. However there will be growth in patronage for the longer distance KMBroutes to and within the .New Territories, in particular, on routes to the North-eastNew Territories with the opening <strong>of</strong> Route 5 and Tate's Cairn tunnels. <strong>The</strong> growth inKMB patronage is expected to be much greater without the new rail extensions.10.4.2 <strong>The</strong> peak hour capacity problems currently experienced on the main rail corridors arelikely to be relieved by the opening <strong>of</strong> the Eastern Harbour Crossing MTR extension,and by the development <strong>of</strong> new bus routes through the new road tunnels. However,the strong growth in rail demand is iikely to see the peak hour capacity problemsre-emerge in the early 1990s. Until new rail projects can be constructed in the urbanarea, measures to spread the peak hour demand over a longer period should beinvestigated to achieve the following:(1) Encourage travel in <strong>of</strong>f-peak periods.(2) Discourage travel in peak periods.(3) Encourage passengers to use the new Eastern Harbour rail crossing instead <strong>of</strong>the existing crossing.10.4.3 It is recommended that the current inter-modal coordination policy should continueto be flexibly applied to ensure that the various public transport modes complementeach other.10.5 Recommended Policies for Management <strong>of</strong> Transport Demand10.5.1 While the construction programme for roads and railways summarised in theprevious sections would substantially improve transport facilities during the 1990s,it is unlikely to be able to absorb the unrestrained growth in transport demand,increased construction is not the answer; the recommended highway programme isat the practical limits set by available funding, capacity <strong>of</strong> the transport constructionindustry and availability <strong>of</strong> land. It is clear therefore that the growth <strong>of</strong> transportdemand must be managed to ensure that new traffic does not swamp the existingand planned transport infrastructure.10.5.2 Road traffic congestion is very expensive for all types <strong>of</strong> road transport throughincreased operating costs and time wasted in traffic jams. It is critical for goodstransport which depends on road haulage and for scheduled bus and minibusservices. Despite the continuing growth in rai! transport, scheduled buses andminibuses are expected to carry over half <strong>of</strong> all public transport journeys to the end<strong>of</strong> the century. <strong>The</strong> efficiency <strong>of</strong> transport operations in <strong>Hong</strong> <strong>Kong</strong> dependstherefore on keeping control over traffic congestion. Traffic congestion also raisespollution levels by increasing fuel consumption rates.198
10.5.3 <strong>The</strong> Study examined several policy options for transport demand management andmade recommendations on the following:(1) Taxi controls(2) Minibus quotas(3) Tunnel tolls(4) Parking controls(5) Private car controls(6) Goods vehicle controls(7) Area pricingTaxi Controls10.5.4 in order to control the future growth in taxi travel the Study endorses recent policydecisions to maintain current quotas on new taxi licenses at not more than 300 peryear, which will need to be reviewed as necessary, and to restore an appropriatedifferential between taxi and other public transport fares. Fare levels should continueto be adjusted to ensure that the demand for taxi services is in balance with thelimited supply <strong>of</strong> taxis imposed by quotas.Minibus Quotas10.5.5 <strong>The</strong> number <strong>of</strong> public minibuses has been kept constant since 1976 at 4350.Controls are judged to be necessary because <strong>of</strong> the preference <strong>of</strong> drivers to operateon the main public transport corridors which can be more efficiently served by largercapacity franchised buses. Much effort has gone into converting the red public lightbuses into green minibuses operating feeder services to areas <strong>of</strong> low traffic volumeor difficult topography which are unsuited to larger vehicles, it is recommended thatthis policy be continued and current limits on the number <strong>of</strong> public minibuses bemaintained.Tunnel Tolls10.5.6 Government does not have complete flexibility in setting tunnel tolls due to legalarrangements with present and future tunnel operators but in so far as tolls can becontrolled, the objectives should be as follows:(1) To limit demand for the tunnel to the capacity <strong>of</strong> the facility in order to preventqueueing traffic from congesting the surrounding road system and interferingwith other traffic.(2) To balance traffic flows among the available alternative routes.Parking Controls10.5.7 It is recommended that the main elements <strong>of</strong> the current policy should continue:(1) To control the number <strong>of</strong> parking places in private car parks by planningspecifications.(2) To control demand for parking at public car parking places to maintain a 15%availability rate.10.5.8 <strong>The</strong> construction <strong>of</strong> new public car parks should be determined by demand and alsoby the capacity <strong>of</strong> the road system to absorb the additional traffic. For the latter thecriteria should be wider than just local traffic conditions and should consider totalvolumes <strong>of</strong> traffic entering the business district in which the planned car park islocated.199
Private Car Controls10.5.9 It is recommended that the growth in the private car fleet is controlled to not morethan 5% per year by means <strong>of</strong> real increases in both ownership taxes and fuel duties.<strong>The</strong> effects <strong>of</strong> increases should be monitored in terms <strong>of</strong> fleet size and usage andadjustments made to tax rates and duties accordingly.Goods Vehicle Controls10.5.10 It is recommended that taxation <strong>of</strong> goods vehicles be increased, focussing on thetaxation <strong>of</strong> light goods vehicles in particular. <strong>The</strong> principal aim <strong>of</strong> taxes on lightgoods vehicles is to control the growth <strong>of</strong> the vehicle fleet. Taxes on medium andheavy goods vehicles are recommended to contribute to the costs <strong>of</strong> road repairs androad provision attributable to heavy vehicles. It is also recommended that duties ondiesel fuel be increased as an additional measure to curb the growth <strong>of</strong> goodsvehicle traffic.Area Pricing10.5.11 <strong>The</strong> disadvantage <strong>of</strong> most <strong>of</strong> the transport demand management measures is thatthey are blunt instruments affecting all motorists irrespective <strong>of</strong> whether their tripsare causing congestion. <strong>The</strong> alternative is area pricing which permits wider vehicleownership but aims to charge for the use <strong>of</strong> vehicles with the highest charges in themost congested areas and busiest times <strong>of</strong> day. It is recommended to re-investigatethe potential for area pricing considering both techniques similar to those adopted inSingapore and the results <strong>of</strong> the 1985 ERP Study. <strong>The</strong> possibility <strong>of</strong> widening thecoverage <strong>of</strong> such an area scheme, if adopted, to include all or most types <strong>of</strong> vehicles,should also be considered.10.6 Transport Projections with the Recommended Strategy10.6.1 Transport projections to the year 2001 were presented in Chapter 5 assuming nochanges in transport policy and construction <strong>of</strong> no further highways and railwaysbeyond those already under construction or otherwise firmly committed. Thissection summarises the impact on transport <strong>of</strong> the projects and policies recommendedby this Study. Detailed tables <strong>of</strong> transport demand with the recommendedtransport strategy are included in Annexes 10.1-10.5.Trip Making and Choice <strong>of</strong> Mode10.6.2 <strong>The</strong> projections <strong>of</strong> daily person travel by main mode are illustrated in Figure 10.1.Public transport trip-making is projected to increase by 37% between 1986 and2001. <strong>The</strong> increase is attributable partly to the increase in population and partly tothe increase in personal incomes associated with the growing economy. <strong>The</strong>strongest growth is projected for rail travel with three new rail lines recommended by1996. Ferry trips are expected to decline to 1991 following the opening <strong>of</strong> theEastern Harbour Crossing in 1989, but growth is expected to resume thereafter. Withgrowth in the private car fleet limited to 5% per year, private car trip making isexpected to more than double by 2001.Congest/on Levels and Road Speeds10.6.3 Figure 10.2 shows the projected usage <strong>of</strong> the 2001 highway network assumingimplementation <strong>of</strong> the recommended strategy. <strong>The</strong> map indicates road links wherethe projected traffic volumes are likely to exceed practical road capacity. A volumeto capacity ratio (V/C) above 1.0 indicates the onset <strong>of</strong> congestion; above 1.2indicates more serious congestion with traffic speeds deteriorating sharply withfurther increases in traffic.200
FIGURE 10.1:PROJECTIONS OF DAILY PERSOM TRAVELMillions1086CommittedStrategyRoad Based PT (Bus,Minibus, Taxi, SPB)Farry1986 1991 1996 2001201
c:,LEGEND V/C Ratio Range1.1 - 1.2> 1.2Figure 10.2PROJECTION OF ROAD CONDITIONS IN 2001 WITH RECOMMENDED STRATEGY (AM Peak Hour)HONG KONG ISLAND AND KOWLOONSheet 1 <strong>of</strong> 2
o aooLEGEND V/C Ratio Range1.1 - 1.2• > 1.2Figure 10.2PROJECTION OF ROAD CONDITIONS IN 2001 WITH RECOMMENDED STRATEGY (AM Peak Hour)NEW TERRITORIESSheet 2 <strong>of</strong> 2
10.6.4 Several roads are projected to exceed a V/C ratio <strong>of</strong> 1,0 by 2001, despite the newhighways and traffic growth management policies <strong>of</strong> the recommended transportstrategy. Some highways are projected to exceed a V/C <strong>of</strong> 1.2; in particular, ToloHighway and Tas Po Road (which would additionally be affected if cross-bordertraffic increases faster than expected), the Peak and Mid-levels region <strong>of</strong> <strong>Hong</strong> <strong>Kong</strong>Island, and sections <strong>of</strong> Pokfulann Road. Given the uncertainties attached to theprojected developments, no specific action in the areas is recommended at thepresent time, but traffic growth should be monitored by region as a basis for futureaction.10.6.5 It should also be noted that over half <strong>of</strong> the existing roads are now reaching the end<strong>of</strong> their design life and will require rehabilitation or re-construction in the next 10-15years. Also, continuing economic growth and development will lead to increasingdemand for utility services, and this <strong>of</strong>ten means additional pipes and cables to belaid under the road bed. <strong>The</strong>se essential works, together with works associated withnew highway construction, will inevitably lead to some additional localised andshort term congestion problems.10.6.6 Figures 10.3 and 10.4 show peak speeds for local and trunk roads by area which alsocompared with the 2001- committed scenario. In each case, speeds will deterioratefrom 1986 levels in the 2001 committed situation, but are restored to around the1986 levels by the recommended strategy.Projected Rail Traffic10.6.7 Figure 10.5 shows the projected passenger demand for the Territory urban railsystem, including the three rail projects recommended for construction in the early1990s: the Junk Bay extension, the Northwest New Territories urban link (assumedhere to terminate in Yuen Long) and the Yau Ma Tei to Fortress cross-harbour link.Even with the recommended rail projects, the Nathan Road Corridor <strong>of</strong> the MTR isexpected to be heavily patronised, and fare incentives are recommended to spreadthe peak hour demand and to encourage maximum use <strong>of</strong> the Eastern HarbourCrossing. It is expected that the KCR will have adequate capacity to carry theprojected loads, initially by increasing train length up to the maximum <strong>of</strong> 12 cars pertrain, and later by upgrading the signalling system to permit closer train headways inthe peak hour. Improvements will also be necessary at KCR stations to improvepassenger handling facilities.10.7 Implications <strong>of</strong> a Relocated Airport10.7.1 Based on the findings <strong>of</strong> the various airport studies underway, including the Portand Airport Development Strategy (PADS), Government is expected to makedecisions by the end <strong>of</strong> 1989 on whether or not to build a replacement airport.Sensitivity tests were undertaken in CTS-2 for the year 2001 in order to assess theimpact <strong>of</strong> a new airport on the recommended transport strategy.10.7.2 CTS-2 looked at just two alternatives for the year 2001, one assuming that theairport would be relocated to Chek Lap Kok on the north side <strong>of</strong> Lantau Island and asecond with the airport relocated to reclaimed land in the Western Harbour. In eachcase, new port facilities on Lantau Island were included. It was assumed that anexpressway would connect the new airport and port facilities to the existingtransport system. For the Lantau site, the connection was from North Lantau to aninterchange with Route 3 on Tsing Yi Island; for the Harbour site, the connectionwas to Route 7 on <strong>Hong</strong> <strong>Kong</strong> Island in the vicinity <strong>of</strong> Telegraph Bay.10.7.3 No rail connections to the airport were assumed for 2001; the timing <strong>of</strong> such a linkwould depend on the build-up <strong>of</strong> new population and employment at the newairport site.204
FIGURE 10.3:PEAK LOCAL ROAD SPEEDS BY AREACentral and WesternWan ChaiEasternSouthernYau Ma TelMong KokSham Shui PoKowloon CityWong Tai SinKwun TongTsuen WanSha TinOther NT19862001 COM2001 STR0 6 10 15 20 25 30 35Average Traffic Speed (km/h)Includes Rural Local,Urban Local And Urban Dlatrict RoadaCOM - Committed, STR • StrategyFIGURE 10.4:PEAK TRUNK ROAD SPEEDS BY AREACentral and WesternWan ChalEasternSouthernYau Ma TelMong KokSham Shut PoKowloon CityWong Tai SinKwun TongTsuen WanSha TinOther NT19862001 COM2001 STR0 10 20 30 40 50Average Traffic Speed (km/h)Includes Rural Trunk,Urban Trunk And Urban Primary RoadaCOM • Committed, STR - Strategy205
o1991 Committed1996 Recommended Strategy2001 Recommended StrategyFigure 10.5DAILY 2-WAY LINE PASSENGER VOLUMES (Thousands)
10.7.4 <strong>The</strong> new airport and port development between them would generate a substantialvolume <strong>of</strong> new traffic entering the transport system from the west estimated atabout 200 000 equivalent passenger car units (PCU) per day. About three-quarters<strong>of</strong> this traffic would be associated with the new airport and the rest with theextended port. <strong>The</strong>se volumes would require a dual 4-Iane highway to the new siteby 2001, but expected further growth would require greater capacity soon after.Separation <strong>of</strong> the access to the airport from that to the new port facilities wouldmake the traffic volumes more easily manageable.10.7.5 <strong>The</strong> large volumes <strong>of</strong> traffic associated with the new airport and port would have astrong impact on the road system. With the Lantau site connecting to Route 3 onTsing Yi Island, volumes in West Kowloon would increase by 20% to 30%,overloading the existing and planned highways. With this traffic, Route 3 wouldrequire expansion from dual 3-!ane to dual 4-lane between the northern end <strong>of</strong> theWestern Harbour Crossing and Yau Korn Tau (north <strong>of</strong> Tsing Yi Island). Crossharbourtraffic volumes would not change significantly, but there would be someincreased congestion in Centra! on <strong>Hong</strong> <strong>Kong</strong> Island.10.7.6 With the Harbour site for the new airport and port connecting to <strong>Hong</strong> <strong>Kong</strong> Islandaround Telegraph Bay, the impacts would be felt particularly on Route 7 and theproposed third harbour crossing at Western. Traffic projections indicate that thesetwo facilities would have to be upgraded from 6 lanes to 10 lanes to take theprojected traffic, effectively requiring a fourth harbour crossing. For both airportrelocation scenarios, there would be serious traffic problems in Kowloon on the localdistributor road network but substantial traffic will be removed from East Kowloonbringing much relief to congestion in this area.Conclusions10.7.7 <strong>The</strong> relocation <strong>of</strong> the airport would have substantial implications for the transportstrategy, requiring upgrading <strong>of</strong> the planned highways in West Kowloon and, if theHarbour site is selected, on the west side <strong>of</strong> <strong>Hong</strong> <strong>Kong</strong> Island. For the satisfactoryoperation <strong>of</strong> the new airport, the key links <strong>of</strong> the recommended CTS-2 highwaystrategy would have to be in place by the year <strong>of</strong> opening, upgraded to accomodatethe greater traffic volumes associated with the relocated airport. <strong>The</strong> analysessuggest that the Lantau airport site could be accommodated more easily by 2001,since this would require a single Western Harbour Crossing and delay in theconstruction <strong>of</strong> Route 7 could be more easily tolerated. A detailed study will berequired to examine the overall impact and transport implications <strong>of</strong> an airportrelocation scenario, in particular for the period beyond 2001. <strong>The</strong> transportinvestment programme recommended by CTS-2 for the early 1990s is not expectedto be affected by this scenario, the planning for which can be put in hand.10.8 Other IssuesImplementation <strong>of</strong> the Transport Strategy10.8.1 <strong>The</strong> Study has made a number <strong>of</strong> recommendations on transport projects andmanagement policies. Detailed studies are now required <strong>of</strong> the individualrecommendations to prepare for implementation. <strong>The</strong> main studies are as follows:(1) Route planning and design studies for the recommended highway projects.Some studies are already underway or are planned for early commencementincluding those for parts <strong>of</strong> Route 3 including the Western Harbour Crossing.(2) Route planning and design studies for the recommended rail projects. Threeprojects have been recommended: the MTR Junk Bay extension, the NorthwestNew Territories urban rail link, and a new cross-harbour rail link. <strong>The</strong> routeand operation <strong>of</strong> the Junk Bay Line have already been well studied, this nowneeds to be brought to final design. <strong>The</strong>re are more issues to be considered forthe North-west New Territories urban rail link, including route, type <strong>of</strong> train207
operation and operator. Much depends on detailed engineering investigationsyet to be carried out, and on the final plans for the population development <strong>of</strong>the North-west New Territories. Similarly, the cross-harbour rail link requiresdetailed studies <strong>of</strong> engineering possibilities, giving due consideration to theneed for further expansion <strong>of</strong> the urban rail network at a later date, and tothe needs and opportunities <strong>of</strong> the new reclamations and other urbanredevelopments in Kowloon.(3) Reinvestigation <strong>of</strong> area pricing techniques for possible implementation in <strong>Hong</strong><strong>Kong</strong>. Further work should examine extensions <strong>of</strong> the scheme to cover all ormost types <strong>of</strong> vehicle.Vehicle Pollution10.8.2 Serious concerns have been raised about air pollution from vehicles, in particularover the very high proportion <strong>of</strong> diesei engined vehicles in the Territory and theprojected growth in such traffic. This Study endorses the need for a detailed study <strong>of</strong>air pollution from vehicles.Vehicle Surveillance10.8.3 With the growing number <strong>of</strong> high capacity and high speed trunk roads in thestrategic road network, traffic volumes will become more concentrated and theproblems and disruptions associated with traffic accidents more serious. <strong>The</strong> Studytherefore endorses the need for a vehicle surveillance system capable <strong>of</strong> detectingtraffic incidents early, enabling the emergency authorities to take appropriate action.Transport Surveys10.8.4 <strong>The</strong> planning <strong>of</strong> transport depends on detailed knowledge <strong>of</strong> travel patterns andcharacteristics, and these can only be obtained from periodic surveys. <strong>The</strong> last majorsurvey <strong>of</strong> travel characteristics was undertaken in 1981. Much has happened in thedevelopment <strong>of</strong> the Territory since then, in particular the rapid expansion <strong>of</strong> the NewTerritories and major developments <strong>of</strong> the Territory rail system. Pians for a newhousehold survey <strong>of</strong> travel characteristics are endorsed.Regional and District Studies10.8.5 <strong>The</strong> Second Comprehensive Transport Study was a strategic study, concerned withbroad issues <strong>of</strong> policy and the development <strong>of</strong> an overall transport infrastructurestrategy. <strong>The</strong> integration <strong>of</strong> strategic plans with local communities requires thecontinuation <strong>of</strong> individual regional and district studies, in order to plan local streetimprovements, traffic management schemes (including area traffic control), parkingfacilities, transport interchanges and pedestrian facilities.Updating the Transport Strategy10.8.6 <strong>The</strong>re is considerable uncertainty attached to any long term forecast <strong>of</strong> developmentin a rapidly growing economy such as <strong>Hong</strong> <strong>Kong</strong>. <strong>The</strong> planning process inevitablystarts with sketch plans based on available information, and proceeds to detailedengineering and other investigations which can lead to substantial modifications <strong>of</strong>the original concept. For this reason, transport plans for more than 5-10 years aheadmust be heavily qualified by the uncertainties attached to the developments theyare to serve.10.8.7 Recognising this, Government is planning to set up a special division withinTransport Department with the objectives <strong>of</strong> monitoring the implementation <strong>of</strong> thetransport strategy, and updating the strategy at regular intervals to take account <strong>of</strong>new development plans.208
10.8.8 <strong>The</strong> immediate concern <strong>of</strong> the division will be the studies now in progress for newreclamations in the Harbour area (Central and Wan Chai, West Kowloon and GreenIsland), the study <strong>of</strong> airport relocation and port development by PADS and theMETRO PLAN urban redevelopment study. AH these studies are expected to becompleted progressively and will have substantial implications for the transportprojects included in the transport strategy.10.8.9 <strong>The</strong> division will also need to take account <strong>of</strong> reactions to the consultative GreenPaper on Transport Policy to be issued shortly; these will help shape the futuredirection <strong>of</strong> policies for managing the transport system.Integration <strong>of</strong> Land Use and Transport Planning10.8.10 As indicated in Chapter 4, a centra! land use strategy was adopted by this Study forthe main series <strong>of</strong> transport tests and evaluation <strong>of</strong> transport projects andmanagement policies, it was noted that the major recommendations <strong>of</strong> the Study arenot affected by minor variations in the land use assumptions. Nevertheless, it wasalso pointed out in Chapter 8 that the current land use assumptions are expected tolead to a large increase in cross-harbour travel, substantial out-bound commutingfrom the New Territories and a worsening <strong>of</strong> the peak problems <strong>of</strong> the rail modes. It isrecognised that opportunities should be identified for adjusting land use proposalsto optimise the utilisation and viability <strong>of</strong> the transport system. This callsfor a carefulintegration <strong>of</strong> land use and transport planning.209
ANNEX 10.1PROJECTIONS OF THE VEHICLE FLEET(thousands)Vehicle Type 1Car and MotorcycleGoods VehicleTaxiSpecial Purpose BusMinibusFranchised BusTotal Vehicles1986 214484169442611991200117171144353Committed199628015419134647620073632022113476101991183117171144336Strategy199623315419134542820072982022113455431 For CTS-2 modelling purposes, some licensed cars reclassifsed as either goods vehicle or special purpose bus.2 Observed, subject to note 1 .ANNEX 10.2OF DAILY TRIP-MAKING BY(thousands)OFModeMass Transit RailwayKowloon-Canton RailwayNorth-west LRT 2<strong>Hong</strong> <strong>Kong</strong> TramTotal RailKowloon Motor Bus 3China Motor Bus 3Cross-Harbour Bus 4Total BusMinibus 5HK Yaumati FerryStar FerryTotal FerryTaxi 6Special Purpose BusTotal non-scheduled PTTotal Public TransportPrivate Car Person Trips1986^1 530358 03242212303461233639821 5161851163011 0335171 55095611 08619912098572234345323567144743531 6501591391 0765361 61211 1621 518Committed19962242715582374346172647046571 6701911621 1195541 67312266207220012477817585436199120985722343454315 324936637965004959323567144743531 700 1 650222174159139396 2981 1625731 7351310525821 0765361 61211 1621 416Strategy199626217026933784394314872143943081 6301771573341 1195541 673123391 840200128887957394554877324780647045231 6002041723761 1625731 735131112258Note: Public transport trip-making is in terms <strong>of</strong> boardings; one trip may involve several boardings (but not counting changesbetween trains on the MTR).1 Public transport boardings from Transport Department for October/November during school term2 Including bus feeder services3 Excluding cross-harbour shown separately4 Operated by KMB and CMB5 Red PLBs and Green minibuses6 Observed taxi flows derived from CTS-2 taxi survey adjusted to traffic counts. Implied passenger occupancy about 15 percentlower than Transport Department estimates210
10.3(thousand passengers per day)BYCorridor<strong>Hong</strong> <strong>Kong</strong> IslandF-F CentralG-G Causeway BayI-I Shau Kei WanHK External:Pok Fu LamHappy ValleyChai WanTotal HK ExternalCross-HarbourKowloonA-A KCR LineC-C:Nathan Rd Cor.Waterloo Rd Cor.To Kwa WanTotal C-CK-K East KowloonKowlopn External;Kwai ChungLion RockJunk BayTotal Kowloon ExtNew TerritoriesR-R West, Sham TsengR-R East, ShaTinTotal R-RS-S Northwest NTT-T NorthernTuen Mun-Yuen LongRail Bus490 260318 24659 1050 94000 16421279579 316504 868649 264110 1090 409759 782309 699369 484249 3360 43618 8630 198132 72132 2700 25269 980 1101986Ferry Total0 0000 0 075056416494164212798951 3729132194091 5411 008853585 431 481198204402252167110Rail63761117600 01 2056071 050309 01 3594306835041441 331239367606239238269Bus262234129159241514514247572061173967196584064741341 0142279732433215419960 0000291000000000040FerryTotal899845305159241514511,9191 3641 25642639620781 0881 0899782782345466464930571392309Rail730680183001 3516791 164348 01 5124437415792131 533273416689273273283Bus200?Ferry277 0239126 0199244 038481 0455 333777222129398749 06344134941641 07122794 0321 0341 015723 0Total1 00791930919924438481213914561 38647739822611 0771 1541 07337726045005101 010614430306Note: Excludes non-scheduled public transport modes <strong>of</strong> taxi and Special Purpose Bus.Rail includes MTR, KCR, LRT, TramBus includes Bus and Minibus
ANNEX 10.4BY(thousand vehicles per day)roCorridor<strong>Hong</strong> <strong>Kong</strong> IslandF-F CentralG-G Causeway BayI-1 Shau Kei WanHK External:Pok Fu LamHappy ValleyChai WanTotal HK ExternalCross-HarbourKowloonA-A KCR LineC-C:Nathan Rd Cor.Waterloo Rd Cor.To Kwa WanTotal C-CK-K East KowloonKowloon External:Kwai ChungLion RockJunk BayTotal Kowloon ExtNew TerritoriesR-R West, Sham TsengR-R East, ShaTinTotal R-RS-S Northwest NTT-T NorthernTuen Mun-Yuen LongPrivate6550 101320 33663182436651160784437 48516132920 1412Public1986 Goods94 2475 2518 1022 422 113 147 1631 38258 141100 3789 4683 28272 11186 7337 7724 533 1164 14114 4311 3525 7723 5220 3017 23Total95 44 2764 36 2752 28 22Private Public183 88 94150 53 5438 21 1939 37 3153 31 2837 599 73 6213258112322542232180 77 77201 72 67162 68 82543 217 226237 118158 73 36114 78 3218 24 10290 175 7873 31 1659 35 16131 66 321996 Goods2926 221220 33570166633649148139104 894023373801531106946Total211133 6280 79 11170235623217175199591343213199 7448612013125118113296PrivatePublic126 11298 7824 2057 43295 26491 73168 48266 249122 9689 7583 89294 260132 8397 4096 3535 12228 8747 1939 1686 3560 3043 2728 202001Goods5149 2728 1834981195105406821317314610158305111 922031679442Total289225 71128 73 1221329771032320424076738828323210562017714732425716490(1) Public includes Taxi, Special Bus, Minibus and, where appropriate, tram and LRT.
ANNEX 10.5(in passenger car units)BYCorridor<strong>Hong</strong> <strong>Kong</strong> IslandF-F Centra!G-G Causeway BayI-S Shau Kei WanHK External:Pok Fu LamHappy ValleyChai WanTotal HK ExternalCross-HarbourKow/oonA-A KCR LineC-C:Nathan Rd COR.Waterloo Rd COR.To Kwa WanTotal C-CK-K East KowloonKowloon External:Kwai ChungLion RockJunk BayTotal Kowloon Ext.New TerritoriesR-R West, Sham TsengR-R East, Sha TinTotal R-RS-S Northwest NTT-T NorthernTuen Mun-Yuen Long198624 Hour AM PeakVolume V/C 1(thous)2190.7182 0.9520.9500.668 0.580.41260.51691.27310.82230,82450.72020.86700.83220.62350.71671.3280.34300.81130.5900.52030.51450.6940.575 0.8199624 Hour AM PeakVolume V/C 1(thous)250166 8699105 152192997872782092537404753082841107021851983832791941340.60.90.50.70.80.80.80.80.70.60.60.60.60.70.51.10.40.60.81.11.00.60.60.7200724 Hour AM PeakVolume V/C 1(thous)3462769916197162743708964162433079665454093271558912722234953992461250.60.80.60.60.60.80.60.90.80.60.70.70.70.70.60.90.60.70.81.20.90.60.70.61 V/C indicates ratio <strong>of</strong> traffic volume to practical capacity. A V/C <strong>of</strong> 1.0 indicates the onset <strong>of</strong> congested traffic conditions.<strong>The</strong> V/C may reach much higher values representing the demand in excess <strong>of</strong> capacity but with increasingly severe effectson average traffic speeds.213
TOC
xooamosEHK 385.095125 H77 s<strong>Hong</strong> <strong>Kong</strong> second comprehensivetransport study : finalreport.<strong>Hong</strong> <strong>Kong</strong> : Govt. Printer,1989.Date Due Date Due Date Due