2007 Wetland Inventory for the Eyre Peninsula
2007 Wetland Inventory for the Eyre Peninsula
2007 Wetland Inventory for the Eyre Peninsula
- No tags were found...

You also want an ePaper? Increase the reach of your titles
YUMPU automatically turns print PDFs into web optimized ePapers that Google loves.
Executive SummaryThe <strong>Wetland</strong> <strong>Inventory</strong> of <strong>Eyre</strong> <strong>Peninsula</strong> documents a representative sample of inland wetlands byrecording <strong>the</strong>ir physical, chemical and biological attributes. Twenty-seven wetlands were surveyed, <strong>the</strong>majority of <strong>the</strong>se comprised saline lake systems and brackish water bodies, with only one freshwaterwetland being recorded during <strong>the</strong> survey.The aquatic invertebrate fauna was notably scarce in many of <strong>the</strong> wetlands surveyed. This may beattributed to <strong>the</strong> high conductivity readings in <strong>the</strong> majority of wetlands, only four wetlands displayed goodinvertebrate diversity. The correlation between increasing salinity levels and decreasing biological activitywas clear, and this decline is of concern <strong>for</strong> <strong>the</strong> health of many wetlands.Several wetlands surveyed are considered to be nationally important as <strong>the</strong>y meet <strong>the</strong> ANZECC criteria ofbeing a good example of a wetland type occurring within a biogeographic region in Australia. Thesewetlands include <strong>the</strong> saline lake systems within Lincoln National Park and Lake Newland ConservationPark. Seven wetlands are recommended <strong>for</strong> monitoring, and include four wetlands in <strong>the</strong> District Council ofElliston and three wetlands managed by National Parks and Wildlife.3
31.0 RECOMMENDED WETLANDS TO MONITOR.................................................................................................. 5431.1 RECOMMENDED PRIORITY WETLANDS ................................................................................................................. 5531.2 SECOND PRIORITY WETLANDS ............................................................................................................................ 5532.0 RECORDING MONITORING PARAMETERS ................................................................................................... 55BIBLIOGRAPHY............................................................................................................................................................. 57APPENDIX 1 WETLAND INVENTORY DESCRIPTIONS ....................................................................................... 60FiguresFIGURE 1. ON SITE WETLAND LAND USES .............................................................................................................. 14FIGURE 2. TENURE AND MANAGEMENT ................................................................................................................... 15FIGURE 3. WETLANDS WITHIN ENVIRONMENTAL REGIONS.................................................................................. 16FIGURE 4. WETLANDS WITHIN KEY BIODIVERSITY AREAS.................................................................................... 18FIGURE 5. WETLAND AREA. ........................................................................................................................................ 18FIGURE 6. WETLAND LANDFORM ELEMENTS. ......................................................................................................... 19FIGURE 7. GEOLOGICAL STRUCTURE UNDERLYING WETLANDS......................................................................... 20FIGURE 8. WETLAND DISTURBANCE ......................................................................................................................... 24FIGURE 9. AQUATIC VEGETATION CLASSES............................................................................................................ 25FIGURE 10. INVERTEBRATE DIVERSITY BY WETLAND SITE. ................................................................................. 30FIGURE 11. TEMPORARY WETLAND CYCLES........................................................................................................... 32FIGURE 12. PH VALUES ............................................................................................................................................... 33FIGURE 13. WETLAND PH VALUES FOR SURVEYED SITES ON EYRE PENINSULA............................................. 34FIGURE 14. SALINITY GUIDELINES............................................................................................................................. 36FIGURE 15. FISH ACTIVITY AGAINST TURBIDITY VALUES AND TIME.................................................................... 39FIGURE 16. AQUATIC FAUNA RAPID ASSESSMENT ................................................................................................ 41FIGURE 17. ANZECC CRITERIA................................................................................................................................... 45FIGURE 18. WETLAND TYPE........................................................................................................................................ 47TABLESTABLE 1. INVERTEBRATE ABUNDANCE .................................................................................................................... 29TABLE 2. TURBIDITY GUIDELINES.............................................................................................................................. 40TABLE 3. RIPARIAN VEGETATION RAPID ASSESSMENT......................................................................................... 42TABLE 4. WETLANDS WITH HIGH RAPID ASSESSMENT SCORES. ........................................................................ 43TABLE 5. WETLAND WITH MODERATE RAPID ASSESSMENT VALUES. ................................................................ 43TABLE 6. WETLANDS WITH LOW RAPID ASSESSMENT VALUES. .......................................................................... 44TABLE 7. WETLANDS WITH ANZECC CRITERIA........................................................................................................ 45TABLE 8. WETLAND TYPES. ........................................................................................................................................ 48TABLE 9. RECOMMENDED PRIORITY WETLANDS FOR MONITORING. ................................................................. 55TABLE 10. SECOND PRIORITY WETLANDS TO MONITOR....................................................................................... 556
PLATESPLATE 1. MELALEUCA HALMATURORUM TALL SHRUBLAND OVER HALOSARCIA SP........................................ 22PLATE 2. MELALEUCA HALMATURORUM .................................................................................................................. 23PLATE 3. INTRODUCED GRASSES ............................................................................................................................. 23PLATE 4. GAHNIA SP. ................................................................................................................................................... 23PLATE 5. FLINDERS HIGHWAY.................................................................................................................................... 24PLATE 6. DIACYPRIS CF. SPINOSAPLATE 7. DAPHNIOPSIS PUSILLA ............................................................................................................................... 29PLATE 8. OLD PLOUGH SWAMPPLATE 9. BIG SWAMP ........................................................................................................................................... 31PLATE 11. MIDDLE LAKEPLATE 12. LAKE TUNKETTA ....................................................................................................................................... 31PLATE 12. HAMP LAKEPLATE 13. TADDIE POOL.............................................................................................................................................. 37PLATE 14. MEADOW POOLPLATE 15. SAMPHIRE FLAT ......................................................................................................................................... 37MapsMap 1. Natural Heritage Trust Boundary <strong>for</strong> <strong>Eyre</strong> <strong>Peninsula</strong>Map 2. <strong>Wetland</strong> survey localitiesMap 3. Key Biodiversity AreasMap 4. Geology underlying wetlands on <strong>Eyre</strong> <strong>Peninsula</strong>7
SECTION ONEWETLAND INVENTORY1.0 INTRODUCTION<strong>Eyre</strong> <strong>Peninsula</strong> contains unique and significant inland wetlands, <strong>the</strong> majority of which are saline lakesystems with characteristic tea-trees <strong>for</strong>ming circular bands around <strong>the</strong>m. In spite of <strong>the</strong> high salinities,<strong>the</strong>se lake systems contain excellent biodiversity values within <strong>the</strong> aquatic zone and adjacent terrestrialvegetation. This wetland inventory documents a representative sample of inland wetlands and records <strong>the</strong>physical, chemical and biological attributes of each waterbody. From this in<strong>for</strong>mation, aquatic environmentsthat contain high biodiversity are highlighted and threats affecting <strong>the</strong>m documented. The inventoryprovides a snap shot of <strong>the</strong> condition and conservation value of wetlands on <strong>Eyre</strong> <strong>Peninsula</strong>. Thosewetlands that meet one or more of <strong>the</strong> Australian and New Zealand Environment and Conservation Council(ANZECC) criteria <strong>for</strong> an important wetland will be nominated <strong>for</strong> inclusion into <strong>the</strong> National Directory ofImportant <strong>Wetland</strong>s in Australia.The wetland database and inventory project is an initiative of <strong>the</strong> South Australian Department <strong>for</strong>Environment and Heritage, Conservation Strategies Section with support from Environment Australia,National <strong>Wetland</strong>s Program.2.0 REPORT STRUCTUREThis report is divided into three sections, namely <strong>the</strong> wetland inventory, wetland assessment and wetlandmonitoring.Section 1 - <strong>Wetland</strong> <strong>Inventory</strong>. Outlines <strong>the</strong> project aims, wetland risk assessment methodology andinventory methodology.Section 2 - <strong>Wetland</strong> Assessment. Provides an analysis of <strong>the</strong> wetland inventory, which includes <strong>the</strong>identification of wetland values and threats.Section 3 – <strong>Wetland</strong> Monitoring. Discusses frameworks <strong>for</strong> monitoring and recommends indicator species<strong>for</strong> monitoring and wetlands to monitor.3.0 PROJECT SCOPEThe project scope consist of seven actions, <strong>the</strong>se are to:• Undertake wetland baseline surveys <strong>for</strong> <strong>the</strong> inland waters of <strong>Eyre</strong> <strong>Peninsula</strong>.• Identify wetlands from surveys of conservation significance, according to ANZECC classification.• Identify gaps in <strong>the</strong> data and prioritise <strong>the</strong> need <strong>for</strong> fur<strong>the</strong>r surveys.• Develop a South Australian wetland management database, <strong>for</strong>mat fields to be compatible with <strong>the</strong> Directory ofImportant <strong>Wetland</strong>s in Australia, and to allow <strong>for</strong> inclusion of data in <strong>the</strong> Directory and <strong>the</strong> <strong>Wetland</strong>s <strong>Inventory</strong> ofAustralia.• Provide digital coverage of spatial boundaries of identified wetlands in ARC/INFO compatible <strong>for</strong>mat at appropriatescale, in consultation with Planning SA.• Develop monitoring protocols <strong>for</strong> assessment of changes in ecological character of wetlands, and <strong>for</strong> recordingresults from this and future wetland related projects, based on <strong>the</strong> following key references.• Produce a manual on monitoring protocols and a report on <strong>the</strong> biological values of wetlands on <strong>Eyre</strong> <strong>Peninsula</strong>.8
4.0 OVERVIEW OF WETLAND INVENTORY TRENDSThe most comprehensive listing of wetlands in South Australia in terms of numbers and coverage is byLloyd and Balla (1986). This study identified about 1500 wetlands and complexes state-wide.The Lloyd and Balla listing was a desktop study that collated and recorded in<strong>for</strong>mation within a standard<strong>for</strong>mat. This included:• wetland type • aquatic and fringing vegetation• name • wetland condition• location • water regime• size • landuse• catchment • impacts• aquatic fauna • tenure.This report does provide a good starting point in understanding <strong>the</strong> extent and some attributes of SouthAustralian wetlands. The study does however fall short in providing up to date in<strong>for</strong>mation on invertebratecomposition, water chemistry and basic land<strong>for</strong>m in<strong>for</strong>mation. The wetlands listed in Lloyd and Balla <strong>for</strong>med<strong>the</strong> basis <strong>for</strong> site selection in undertaking baseline surveys <strong>for</strong> this current study.Since Lloyd and Balla’s 1986 report, several studies have mirrored this kind of in<strong>for</strong>mation and presentationof wetland in<strong>for</strong>mation, but has not been collected within a standard <strong>for</strong>mat. However, good in<strong>for</strong>mation hasbeen generated <strong>for</strong> certain areas including <strong>the</strong> Murray River corridor. Thompson’s (1986) study of RiverMurray <strong>Wetland</strong>s and Jensen et al (1996) <strong>Wetland</strong> Atlas report of <strong>the</strong> South Australian Murray Valley<strong>Wetland</strong>s made inroads into spatially capturing wetland locations through <strong>the</strong> use if GIS. The introduction oflinking wetlands with GIS enabled <strong>the</strong> creation of a wetlands GIS database <strong>for</strong> <strong>the</strong> Murray Valley <strong>Wetland</strong>s.In 1997 a GIS database was also created <strong>for</strong> <strong>the</strong> South East wetlands. This database recorded wetlandtype, name, complex, watercourses and assigned a condition score and conservation value, Carru<strong>the</strong>rs andHille (1997). The benefits of collecting data and linking it to GIS became evident not only <strong>for</strong> environmentalplanning and in<strong>for</strong>mation retrieval but also <strong>for</strong> reporting to Environment Australia on <strong>the</strong> extent of wetlandresources.In 1993 <strong>the</strong> Australian Nature and Conservation Agency published <strong>the</strong> first edition of ‘A Directory ofImportant <strong>Wetland</strong>s in Australia’. A second edition was complied in 1996, which included in<strong>for</strong>mation on 68wetlands in South Australia. In<strong>for</strong>mation was collected and put into a <strong>for</strong>mat which provided, <strong>for</strong> <strong>the</strong> firsttime, a detailed assessment of selected wetlands in South Australia.It became apparent, that several regions within South Australia were lacking baseline wetland in<strong>for</strong>mation.De Jong and Morelli (1996) suggested that <strong>the</strong>re is a need <strong>for</strong> systematic inventories, biological surveysand research programs in many areas of <strong>the</strong> State. <strong>Wetland</strong> in<strong>for</strong>mation in regions such as <strong>the</strong> GreatVictoria Desert, Flinders and Olary Ranges, <strong>Eyre</strong> <strong>Peninsula</strong>, Yorke <strong>Peninsula</strong>, Kangaroo Island andNullarbor is inadequate.This project combines some of <strong>the</strong>se key developments and recommendations, namely developing a GISdatabase and providing baseline in<strong>for</strong>mation <strong>for</strong> nominated regions.9
5.0 WETLAND RISK ASSESSMENTThe wetland risk assessment is a conceptual framework to assist in predicting and assessing change in <strong>the</strong>ecological character of wetlands. The framework has been adopted by Ramsar (resolution V11.10) and isnow promoted as an integral component of <strong>the</strong> management planning processes <strong>for</strong> wetlands. Therelevance of undertaking wetland inventories becomes apparent within this framework. A wetland inventoryultimately collects in<strong>for</strong>mation <strong>for</strong> <strong>the</strong> wetland assessment framework. This in<strong>for</strong>mation is also critical inorder to develop monitoring programs.5.1 Ecological CharacterA central component of <strong>the</strong> wetland risk assessment is <strong>the</strong> ability to record <strong>the</strong> ecological character of awetland. The first process comprises of <strong>the</strong> collection of in<strong>for</strong>mation, <strong>the</strong> wetland inventory.Ecological character is <strong>the</strong> sum of <strong>the</strong> biological, physical, and chemical components of <strong>the</strong> wetlandecosystem and <strong>the</strong>ir interactions that maintain <strong>the</strong> wetland and its products, functions, and attributes.Change in ecological character is <strong>the</strong> impairment or imbalance in any biological, physical, or chemicalcomponents of <strong>the</strong> wetland ecosystem, or in <strong>the</strong>ir interactions.Van Dam et al (1999) outline five main causes of adverse change, namely:1. changes to <strong>the</strong> water regime2. water pollution3. physical modification4. exploitation of biological products5. introduction of exotic species.6.0 WETLAND INVENTORY METHODOLOGYThis section describes <strong>the</strong> approach and in<strong>for</strong>mation collected <strong>for</strong> <strong>the</strong> wetland inventory. A wetlandinventory can be defined as <strong>the</strong> collection of core in<strong>for</strong>mation <strong>for</strong> wetland management, including <strong>the</strong>provision of an in<strong>for</strong>mation base <strong>for</strong> specific assessment and monitoring activities (Finlayson and Eliot,2001). Costa et al (1996) also suggests that inventories have <strong>the</strong> attributes of set objectives over a giventime-period with <strong>the</strong> aim of publishing and disseminating <strong>the</strong> in<strong>for</strong>mation and making it available within adatabase.6.1 Study area boundariesThe project boundary is defined by <strong>the</strong> Natural Heritage Trust administration boundaries <strong>for</strong> <strong>Eyre</strong> <strong>Peninsula</strong>.Refer to Map 1.6.2 Site selectionThe aim of <strong>the</strong> wetland selection process is to sample a broad range of wetlands within each region andwhere access was relatively simple. Factors such as time constraints and project budget was also a limitingfactor in <strong>the</strong> number of wetlands selected.<strong>Wetland</strong> sites identified by previous studies (eg Lloyd and Balla, 1986) and sites located in state and localgovernment reserves were given priority <strong>for</strong> selection. These sites usually have in<strong>for</strong>mation regarding <strong>the</strong>wetland and <strong>the</strong> surrounding natural resources.10
6.3 GIS DatabaseThis project builds on initiatives undertaken by Planning SA and <strong>the</strong> Department <strong>for</strong> Environment andHeritage. GIS databases are developed <strong>for</strong> <strong>the</strong> Murray River region Carru<strong>the</strong>rs and Nicolson (1992) andpublished in <strong>the</strong> <strong>for</strong>m of an Atlas, Jensen et al (1996). A GIS database exists <strong>for</strong> <strong>the</strong> South East region of<strong>the</strong> state and published in <strong>the</strong> <strong>for</strong>m of a technical report (Carru<strong>the</strong>rs and Hille 1997). One of <strong>the</strong> projectscopes <strong>for</strong> this project is to provide a digital coverage of spatial boundaries of identified wetlands. This willprovide a GIS database <strong>for</strong> <strong>Eyre</strong> <strong>Peninsula</strong>, Mount Lofty Ranges, Nor<strong>the</strong>rn Agricultural Districts andKangaroo Island. Gaps in coverage will occur simply due to project constraints, and it is suggested that<strong>the</strong>se gaps be filled at a later stage.A State-wide numbering system was developed <strong>for</strong> identifying wetlands which follows <strong>the</strong> systemestablished <strong>for</strong> <strong>the</strong> Murray wetlands. The Murray region wetlands have been assigned <strong>the</strong> numbers S0001to S0999. The South East region wetlands have been assigned <strong>the</strong> numbers S1000 to S1999, Nor<strong>the</strong>rnAgricultural Districts S4000 to S4999, Kangaroo Island S5000 to S5999 and <strong>the</strong> Mount Lofty Ranges S2000S2999. <strong>Eyre</strong> <strong>Peninsula</strong> is assigned numbers S3000 to S3999.The system used to produce <strong>the</strong> wetlands data is <strong>the</strong> ESRI (Environmental Systems Research Institute)geographic in<strong>for</strong>mation system (GIS) ARC/INFO. The GIS layer was created initially from <strong>the</strong> existing landcover layer that contained areas designated as swamps, vegetated swamps, lakes and vegetated lakes.This land cover layer was mapped from 1:40 000 colour aerial photography (Carru<strong>the</strong>rs and Hille 1997).6.4 <strong>Wetland</strong> inventory surveyIn developing <strong>the</strong> wetland survey it was critical that in<strong>for</strong>mation relevant to <strong>the</strong> wetland risk assessmentframework was incorporated. This ultimately involves <strong>the</strong> collection of physical, biological and chemicalparameters. Several survey methodologies were studied and incorporated; <strong>the</strong>se included:Butcher R.J.(1999) Assessing biodiversity in temporary and permanent wetlands. Pp 50-53 in The O<strong>the</strong>r 99%. TheConservation and Biodiversity of Invertebrates, ed by Ponder W and Lunney D, (1999). Transactions of <strong>the</strong> RoyalZoological Society of New South Wales Finlayson C.M. and Spiers A.G. (1999) Techniques <strong>for</strong> enhanced wetland inventory and monitoring. SupervisingScientist, Canberra Fairwea<strong>the</strong>r P.G. & Napier (1998) Environmental indicators <strong>for</strong> national state of <strong>the</strong> environment reporting - inlandwaters. Environment Australia Maher W & Liston P (1997) Water quality <strong>for</strong> maintenance of aquatic ecosystems: Appropriate indicators andanalysis. Australia: State of <strong>the</strong> Environment Technical Paper Series. (Inland waters). Environment Australia Morelli J & de Jong M (1996) A Directory of Important <strong>Wetland</strong>s in South Australia. South Australian Departmentof Environment and Natural Resources, Adelaide Storey A.W., Lane J.A.K and Davies P.M. (1997) Monitoring <strong>the</strong> ecological character of Australia's wetlands ofinternational importance (RAMSAR Convention). Western Australian Department of Conservation and LandManagement and Biodiversity Group of Environment Australia.11
6.5 <strong>Wetland</strong> survey templateFor each wetland surveyed physical, biological and chemical in<strong>for</strong>mation was collected. A brief outline isgiven below. The complete wetland survey descriptions are given in Appendix 1.Physical parameters• <strong>Wetland</strong> Reference Number• Ramsar Site• Land Use• Land Element• <strong>Wetland</strong> Name• Description of Site• Tenure• GeologyBiological parameters• Vegetation Associations• Biological Threats• Noteworthy Flora andFauna• Aquatic VegetationClassesChemical parameters• Dissolved Oxygen• Conductivity• Turbidity• pH• Temperature12
SECTION TWOWETLAND ASSESSMENT FOR EYRE PENINSULA7.0 INTRODUCTION<strong>Wetland</strong> assessment involves <strong>the</strong> identification of <strong>the</strong> status of and threats to wetlands as a basis <strong>for</strong> <strong>the</strong>collection of more specific in<strong>for</strong>mation through monitoring activities. In essence, Section Two of this reportanalyses <strong>the</strong> survey results by looking at each relevant survey parameter individually. This comprises abackground discussion, analysis and discussion of results.8.0 EYRE PENINSULA8.1 <strong>Wetland</strong> overview<strong>Eyre</strong> <strong>Peninsula</strong> contains excellent examples of inland saline lake systems found within South Australia.These wetland systems are confined mainly to <strong>the</strong> south-west of <strong>the</strong> <strong>Peninsula</strong>. There are also severalareas with good quality coastal wetland systems consisting of mangroves and samphire flats; <strong>the</strong>se arelocated within <strong>the</strong> numerous bays and tidial inlets around <strong>the</strong> <strong>Peninsula</strong>. The eastern portion of <strong>Eyre</strong><strong>Peninsula</strong> contains many degraded saline lake systems and <strong>the</strong> occasional freshwater wetland. Theseremaining freshwater wetlands are quickly becoming saline due to <strong>the</strong> effects of dryland salinity. Threats todeteriorating water quality in wetlands include vegetation clearance contributing to increased salinisation,livestock grazing, introduced plants and animals, altered water regimes and introduction of industriesdependant upon irrigation are affecting wetland areas on <strong>Eyre</strong> <strong>Peninsula</strong>.There are several inland wetland areas on <strong>Eyre</strong> <strong>Peninsula</strong> that are listed in <strong>the</strong> Directory of importantwetland <strong>for</strong> South Australia. These include Big Swamp, Little Swamp, Slea<strong>for</strong>d Mere, Lake Newland andLake Hamilton.A total of 27 wetlands were surveyed. Some are conserved within <strong>the</strong> South Australian reserve system,including Lake Newland in Lake Newland Conservation Park and Slea<strong>for</strong>d Mere and Pillie Lake withinLincoln National Park. O<strong>the</strong>r wetland areas protected in <strong>the</strong> reserve system but not covered by <strong>the</strong> surveyinclude Coffin Bay Conservation Park and Calpatanna Waterhole Conservation Park.Refer to Map 2 <strong>for</strong> wetland survey localities.13
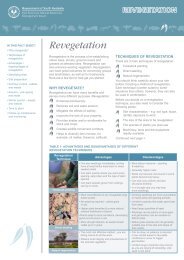
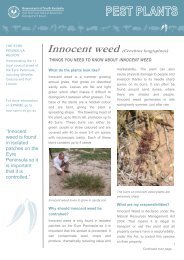
9.0 WETLAND LAND USE9.1 BackgroundOn site and surrounding land uses can have major impacts on wetlands. The most common land uses on<strong>Eyre</strong> <strong>Peninsula</strong> include cropping and grazing. Land used <strong>for</strong> cropping can lead to bank erosion, depletedsoil structure and loss of nutrients. Dryland salinity is significantly increased in areas where deep-rootedvegetation has been replaced by annual crops. Grazing by domestic stock affects wetlands by removingvegetation, breaking up of <strong>the</strong> soil surface, distributing weed species and increasing organic nutrientsthrough faecal deposits. Land set-aside <strong>for</strong> conservation purposes ei<strong>the</strong>r through <strong>the</strong> reserve system or onfarmconservation have <strong>the</strong> least impact but currently comprise <strong>the</strong> minority of wetland land uses.9.2 Analysis<strong>Wetland</strong> land uses on site25Occurrences of wetlands20151050Cropping/GrazingLocal governmentreserveConservation/National ParkSeries1 21 4 3 4 1Land usesUnknownReservoirFigure 1. On site wetland land usesTwenty-one occurrences of cropping and grazing were recorded as <strong>the</strong> main land uses within or adjacent towetlands surveyed on <strong>Eyre</strong> <strong>Peninsula</strong>. Land uses <strong>for</strong> four wetlands were classified as unknown. These areareas that have been rested from primary industry or are roadsides or lands with no clear land useallocation. <strong>Wetland</strong>s located within NPWSA reserves were sufficiently protected from deleterioussurrounding land uses.14
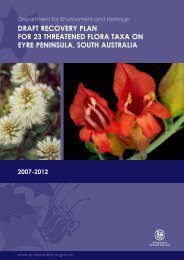
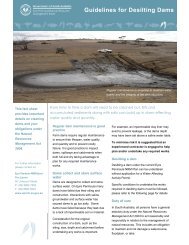
10.0 TENURE AND MANAGEMENT AUTHORITY10.1 BackgroundThe type of management authority and tenure surrounding a wetland often dictates <strong>the</strong> type and level ofprotection and management <strong>for</strong> <strong>the</strong> wetland. An understanding of this parameter also allows considerationof different legislation and approaches concerning on-site management and planning <strong>for</strong> wetland areas.Tenure and management25Occurrence of wetlands20151050PrivateLocalgovernmentStategovernmentNo dataType 20 4 5 4TypeFigure 2. Tenure and management10.2 AnalysisPrivate tenure and management was <strong>the</strong> most common occurrence with 20 sites recorded. This suggeststhat <strong>the</strong> management of wetlands surveyed on <strong>Eyre</strong> <strong>Peninsula</strong> lies with private landholders. This factor hasimplications <strong>for</strong> <strong>the</strong> management of wetlands <strong>for</strong> biodiversity, and highlights <strong>the</strong> importance of off reserveconservation programs.11.0 ENVIRONMENTAL REGIONS11.1 BackgroundLaut et al (1977) described and mapped South Australia hierarchically into Environmental Provinces,Environmental Regions and Environmental Associations. The three tiers are based on geological<strong>for</strong>mations and vegetation type. <strong>Eyre</strong> <strong>Peninsula</strong> is part of <strong>the</strong> <strong>Eyre</strong> and Yorke <strong>Peninsula</strong> Province. Thisprovince is divided into six Environmental Regions, which are based on vegetation criteria. The wetlandsurvey is contained within three of <strong>the</strong>se regions.The Sou<strong>the</strong>rn Highlands and Plains Environmental Region encompasses <strong>the</strong> sou<strong>the</strong>rn section of <strong>the</strong>uplands of <strong>the</strong> Koppio Hills and along <strong>the</strong> east coast of <strong>Eyre</strong> <strong>Peninsula</strong>, and <strong>the</strong> undulating to low hillyplains to <strong>the</strong> west. The western boundary represents a change from duplex soils on <strong>the</strong> hilly or undulatingcountry to sands and calcarenite plains, <strong>the</strong> north is defined by inland dune land<strong>for</strong>ms (Laut et al 1977).The West Coast Environmental Region is comprised predominantly of undulating to hilly plains oncalcarenite with local rises and <strong>the</strong> occasional steep-sided hills on quartzite on <strong>the</strong> west side of <strong>Eyre</strong><strong>Peninsula</strong>. Dunes are restricted to <strong>the</strong> coastal fringe where <strong>the</strong>y occur in association with lagoons and lakes(Laut et al 1977).15
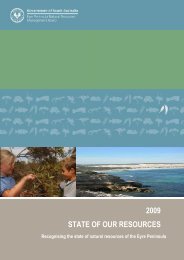
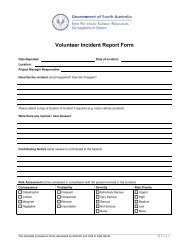
The Central Mallee Plains and Dunes and Environmental Region extends across <strong>Eyre</strong> <strong>Peninsula</strong> fromits western extremity to Spencer Gulf. It is distinguished climatically by being more arid than regions to <strong>the</strong>south, and this is reflected in <strong>the</strong> vegetation. The nor<strong>the</strong>rn margin is <strong>for</strong>med by <strong>the</strong> dunefields of <strong>the</strong> GreatVictoria Desert and <strong>the</strong> eastern margin by <strong>the</strong> Gawler Ranges. The region is essentially an undulating plainwith an extensive cover of dunes and sand sheets (Laut et al 1977).11.2 AnalysisEnvironmental RegionsOccurrence of wetlands181614121086420West coastSou<strong>the</strong>rn highlandsand plainsCentral mallee plainsand dunesRegion 17 14 2Figure 3. <strong>Wetland</strong>s within environmental regionsThe West Coast and <strong>the</strong> Sou<strong>the</strong>rn highlands and plains regions contained most of <strong>the</strong> wetlands surveyed.This suggests that more wetlands occur in <strong>the</strong>se regions, which correspond to <strong>the</strong> geological characteristicsof limestone or highland wetland <strong>for</strong>mations.12.0 KEY BIODIVERSITY AREAS12.1 BackgroundKey Biodiversity Areas are used to define areas of high biodiversity on <strong>Eyre</strong> <strong>Peninsula</strong>. The ability ofoverlying wetlands surveyed within Key Biodiversity Areas assists in highlighting wetlands located inenvironmental significant areas. Two key biodiversity areas are identified in <strong>the</strong> Biodiversity Plan <strong>for</strong> <strong>Eyre</strong><strong>Peninsula</strong> (Mat<strong>the</strong>ws, 2001). These are large remnant areas and threatened habitat areas which have beendeveloped by combining <strong>the</strong> biological assets of <strong>Eyre</strong> <strong>Peninsula</strong>. Refer to Map 3 <strong>for</strong> Key Biodiversity Areas.12.1.1 Large remnant areasThese areas have been identified on <strong>the</strong> basis that <strong>the</strong>y contain large blocks of vegetation, good linkages,species diversity and populations of species with high conservation significance. Two large remnant areashave been identified on <strong>Eyre</strong> <strong>Peninsula</strong>, <strong>the</strong> ‘Central North-West linkage’ and <strong>the</strong> ‘Jussieu <strong>Peninsula</strong> toCoffin Bay <strong>Peninsula</strong>’.Central North-West Linkage is almost a continuous vegetated band stretching from central <strong>Eyre</strong><strong>Peninsula</strong> to approximately <strong>the</strong> Poochera district. Large areas are dedicated to <strong>the</strong> South Australian reservesystem and private Heritage Agreement areas. A network of Heritage Agreements and reserves has <strong>for</strong>medan almost continuous linkage of habitat up to 200 kilometres long (Mat<strong>the</strong>ws 2001).Jussieu <strong>Peninsula</strong> to Coffin Bay <strong>Peninsula</strong> is located south of Flinders Highway between Port Lincolnand Coffin Bay. The area includes two large National Parks (Lincoln and Coffin Bay) along with Kellidie16
Bay, Slea<strong>for</strong>d Mere and Kathai Conservation Parks and a number of Heritage Agreements (Mat<strong>the</strong>ws2001).12.1.2 Threatened Habitat AreasThreatened Habitat Areas have been identified on <strong>the</strong> basis that <strong>the</strong>y are:• selectively cleared and modified resulting in low remnancy of plant communities• poorly conserved within reserve systems• fragmented and contain regionally threatened plant communities• contain large numbers of species of high conservation significance.Five Threatened Habitat Areas have been identified on <strong>Eyre</strong> <strong>Peninsula</strong>. These are Koppio Hills, Cleve Hills,South-west, Sheoak Grassy Woodlands and <strong>the</strong> Far West Threatened Habitat Areas (Mat<strong>the</strong>ws 2001).Koppio Hills Threatened Habitat Area contains small scattered remnants of highly significant vegetationcommunities such as <strong>the</strong> regionally threatened community of E. camaldulensis woodland (river red gum).The Koppio Hills cover an area of approximately 96,000 hectares with a total area of native vegetation of18,000 hectares (Mat<strong>the</strong>ws 2001).Cleve Hills Threatened Habitat Area has been identified as a Threatened Habitat Area due to a number ofthreatened and endemic species. The boundary of this area has been made on <strong>the</strong> sou<strong>the</strong>rn and easternboundary at approximately 200m above sea level (Mat<strong>the</strong>ws 2001).South-West Threatened Habitat Area has been identified due to a number of significant biologicalfeatures of this area. This area includes <strong>the</strong> plains to <strong>the</strong> south-east of Lake Hamilton, and includes <strong>the</strong>large areas of salt lakes including Lakes Malata and Greenly. The South-West Threatened Habitat Areacomprises 172,000 hectares with a total of 25,000 hectares of native vegetation.Sheoak Grassy Woodlands Threatened Habitat Area contains scattered sheoak populations,Allocasuarina verticillata and temperate native grasslands and grassy woodlands. Sheoak GrassyWoodlands comprises an area of 123,000 hectares with 27,000 hectares of native vegetation.Far West Threatened Habitat Area has been identified due to a number of significant biological features ofthis area. This area contains several vegetation communities that have been identified as being rare orthreatened. Unlike <strong>the</strong> o<strong>the</strong>r Threatened Habitat Areas <strong>the</strong> Far West extends down to <strong>the</strong> coast andincorporates high biodiversity coastal areas. Areas such as Tourville Bay contains mangroves and saltmarshes <strong>for</strong> wading birds and o<strong>the</strong>r wetland species (Mat<strong>the</strong>ws 2001).12.2 AnalysisKey Biodiversity Area1412Occurrence of wetlands1086420Threatened Habitat -Koppio HillsThreatened Habitat -Sheoak W oodlandThreatened Habitat -SouthwestLarge Remnant Area -Central-NorthwestLinkageLarge Remnant Area -Jussieu <strong>Peninsula</strong> toCoffin Bay <strong>Peninsula</strong>Not applicableKey Biodiversity Area 2 13 9 1 4 417
Figure 4. <strong>Wetland</strong>s within Key Biodiversity Areas.The grouping of Threatened Habitat Areas has <strong>the</strong> highest wetland occurrence, especially within <strong>the</strong>subgroup of Sheoak Grassy Woodlands (13 sites). This is understandable due to <strong>the</strong> characteristic calcretesheets <strong>for</strong>mations which have <strong>for</strong>med wetland areas in wea<strong>the</strong>red or cracked calcrete sheets. The South-West Threatened Habitat Area contains wetlands such as Lake Hamilton and Lakes Malata and Greenly.Again, geological <strong>for</strong>mations (dune and calcrete) have dictated much of <strong>the</strong> distribution of wetlands in thisarea. Several wetland sites are located within <strong>the</strong> Large Remnant Area of <strong>the</strong> Central-Northwest Linkage,<strong>the</strong>se wetlands are mostly located within Lincoln National Park and Coffin Bay National Park.13.0 WETLAND AREA13.1 BackgroundThe area of wetlands was calculated by using ArcView GIS based on ISB/GAR Landcover – 1991Photography, River/Lakes Layer 2000, Evaporation Basins 2000.13.2 Analysis<strong>Wetland</strong> Area (Hectares)1210864200-50 51-100 101-200 201-300 over 300 HaOccurrence 11 6 6 2 6Figure 5. <strong>Wetland</strong> Area.The total wetland area <strong>for</strong> <strong>Eyre</strong> <strong>Peninsula</strong> is approximately 64,000 hectares with a mean of 21 hectares anda maximum of 3,170 hectares. With only 13,000 hectares having baseline data, <strong>the</strong> opportunity exists <strong>for</strong><strong>the</strong> o<strong>the</strong>r 51,000 hectares to be mapped and baseline data attributed to <strong>the</strong>se wetlands.<strong>Wetland</strong>s over 300 hectares in size include Slea<strong>for</strong>d Mere (707 ha), lake Hamilton (1,900 ha) and LakeGreenly (2,629 ha).18
14.0 LANDFORM ELEMENT14.1 BackgroundLand<strong>for</strong>m element definitions have been adapted from Heard and Channon (1997) “Guide to a nativevegetation survey using <strong>the</strong> biological survey of South Australia methodology, Section 3”. GeographicAnalysis and Research Unit, Department of Housing and Urban Development.14.2 AnalysisW etland land <strong>for</strong>m elements20151050Salt Lake Swamp No data Lake LagoonRockoutcropOpendepressionOccurrences 17 7 1 3 3 1 1Figure 6. <strong>Wetland</strong> land<strong>for</strong>m elements.Salt lakes were <strong>the</strong> most common wetland sampled. Salt lakes are defined as lakes that contain aconcentration of mineral salts (predominantly sodium chloride in solution as well as magnesium andcalcium sulphate). Swamps were <strong>the</strong> next most common wetland land<strong>for</strong>m with seven occurrences (eg OldPlough Swamp and Elliston Cemetery Swamp). Swamps are generally level or closed depressions with aseasonal or permanent water table at or above <strong>the</strong> surface; sometimes biological (peat) accumulationoccurs.19
15.0 GEOLOGY15.1 Background<strong>Eyre</strong> <strong>Peninsula</strong> is underlain by a basement of crystalline rocks, mainly granite and gneiss. The triangularshape of <strong>the</strong> peninsula is due to <strong>the</strong> intersection of two major fault zones. The Lincoln fault runs along <strong>the</strong>east coast, south-west from <strong>the</strong> vicinity of Port Augusta and ano<strong>the</strong>r fault runs from <strong>the</strong> sou<strong>the</strong>rn tip of <strong>the</strong>peninsula north-west to Elliston. The nor<strong>the</strong>rn section of <strong>the</strong> peninsula is separated from <strong>the</strong> GawlerRanges by <strong>the</strong> Corrobinnie depression. This depression also extends southwest from Minnipa and ischaracterised by a series of ephemeral salt lakes (Mat<strong>the</strong>ws 2001). The Corrobinnie depression containsold limestone <strong>for</strong>mations, which <strong>for</strong>ms series of sub-surface water areas. The Bridgewater Formationcontaining <strong>the</strong>se limestone <strong>for</strong>mations is a dominant geological band along <strong>the</strong> west coast. A number ofbasins are located within this area, namely <strong>the</strong> Lincoln, Uley South, Uley Wanilla and Polda Basins. Referto Map 4 <strong>for</strong> <strong>the</strong> geology underlying <strong>the</strong> surveyed wetlands.15.2 AnalysisGeological structure underlying surveyed wetlands161412Occurrence1086420HoloceneBridgewater<strong>for</strong>mationHutchisongroupOccurrence 9 14 4 3 1 1Figure 7. Geological structure underlying wetlands.PleistocenesedimentsQuaternaryaeoliansedimentsNo dataThe majority of wetlands are located within <strong>the</strong> Bridgewater Formation (eg salt lakes near Elliston and LakeHamilton). The Bridgewater Formation consists of partly cemented calcareous sand usually calcreted at <strong>the</strong>surface. This <strong>for</strong>mation extends from south of Port Lincoln along <strong>the</strong> west coast to beyond Streaky Bay.Calcrete is <strong>for</strong>med by dissolution and replacement of shell fragments which gradually develops a nodular orsheet of hardened material (Parker et al, 1985). Several of <strong>the</strong> wetlands surveyed are underlaid byHolocene sediments (eg Round Lake and Sheringa Lagoon) <strong>the</strong>se sediments <strong>for</strong>m <strong>the</strong> base of <strong>the</strong>longitudinal sand dunes of <strong>the</strong> Corrobinnie Depression. The Holocene sediments are described in Map 4 asundifferentiated alluvial/fluvial sediments. The soil characteristics tended to reflect <strong>the</strong> underlying geological<strong>for</strong>mations, hence <strong>the</strong> majority of soils ranged from calcareous sands to silty loams and clays.20
16.0 HYDROLOGY16.1 BackgroundThe wetland survey recorded average annual rainfall <strong>for</strong> wetland areas and made observations on <strong>the</strong> mainsources of water <strong>for</strong> <strong>the</strong> wetlands. The mean average annual rainfall varies from 550 mm to 500 mm on <strong>the</strong>south of <strong>the</strong> <strong>Peninsula</strong> to 400 mm in <strong>the</strong> north-western section near Elliston and 350 mm near Cleve in <strong>the</strong>north-east. Nearly all of <strong>the</strong> rainfall is during winter with Port Lincoln receiving an average rainfall of 260 mmand Elliston of 200 mm (Schwerdtfeger, 1985). Evaporation is high in summer throughout <strong>the</strong> region andmean monthly evaporation exceeds median monthly rainfall throughout <strong>the</strong> year except in sou<strong>the</strong>rn areas inwinter.Surface water is <strong>the</strong> most common source of water <strong>for</strong> wetlands on <strong>Eyre</strong> <strong>Peninsula</strong>. The surroundingcatchment plays a critical role in supplying and filtering water <strong>for</strong> <strong>the</strong> lower lying drainage depressions that<strong>for</strong>m <strong>the</strong> wetlands. Extensive vegetation clearance in many areas has resulted in increases in drylandsalinity which has increased water salinity levels. This has affected aquatic fauna composition, aquatic floraand surrounding terrestrial flora. Groundwater occurs in three geological environments which are Precambrian,Tertiary and Quaternary ages. The most important of <strong>the</strong>se is <strong>the</strong> Bridgewater Formation; refer toMap 4. This <strong>for</strong>mation houses <strong>the</strong> three sou<strong>the</strong>rn basins, Lincoln, Uley South and Uley Wanilla. Recharge<strong>for</strong> <strong>the</strong>se basins is mainly from rainfall (Mat<strong>the</strong>ws, 2001).16.2 AnalysisAll of <strong>the</strong> wetlands surveyed had annual rainfall ranges between 400 and 500 mm. Limited in<strong>for</strong>mation isavailable on <strong>the</strong> groundwater connections to <strong>the</strong> wetlands surveyed. The Polda Basin near Elliston mayhave some impact on surrounding wetlands and <strong>the</strong> Lincoln Basin probably influences Big Swamp andSlea<strong>for</strong>d Mere. The majority of <strong>the</strong> in<strong>for</strong>mation available regarding water resources on <strong>Eyre</strong> <strong>Peninsula</strong> isfocused on water supplies <strong>for</strong> human consumption and use by stock; <strong>the</strong>re is a need <strong>for</strong> investigationsregarding water requirements <strong>for</strong> biodiversity.17.0 PLANT ASSOCIATION SUMMARY17.1 Background and AnalysisA large proportion of <strong>the</strong> wetlands surveyed within <strong>the</strong> three regions are considered to be saline (>3000EC).Aquatic flora was noticeably scarce in most water bodies, especially in hyper-saline water bodies (>100000EC). Those species that tend to dominate saline areas are mainly terrestrial-aquatic species. Genera of<strong>the</strong> family Chenopodiaceae are common including Halosarcia and Sarcocornia (glassworts or samphires).Several species of submerged aquatic genera (Ruppia and Lepilaena) also occur within saline waterbodies. These genera tend to <strong>for</strong>m <strong>the</strong> understorey and ground cover within <strong>the</strong> structural vegetation<strong>for</strong>mation surrounding wetlands.The most common canopy vegetation type is Melaleuca halmaturorum ssp. halmaturorum. Melaleucahalmaturorum ssp. halmaturorum tall shrubland is considered rare on <strong>Eyre</strong> <strong>Peninsula</strong>. The wetland surveyrecorded 13 sites with Melaleuca halmaturorum as <strong>the</strong> dominant vegetation association and four sitesrecorded Melaleuca halmaturorum over Gahnia filum (which is recognised as a threatened plant communityon <strong>Eyre</strong> <strong>Peninsula</strong>). Several sites recorded Eucalyptus species (E. camaldulensis at three sites and onesite with E. diversifolia). The remaining sites recorded introduced grasses ei<strong>the</strong>r with or without Melaleucahalmaturorum <strong>for</strong>ming <strong>the</strong> canopy.The ecological role of Melaleuca halmaturorum as a fringing saline wetland species is very important.Melaleuca halmaturmorum often <strong>for</strong>ms an effective buffer <strong>for</strong> water bodies from increased sediment loadsand nutrient concentrations. Greenway (1997) discusses some fur<strong>the</strong>r direct benefits from Melaleucahalmaturorum. These include:21
Hydrological benefits• Improved water quality by filtering suspended particles and by removing, recycling, or immobilisingcontaminants and nutrients, <strong>the</strong>reby preventing deterioration of downstream aquatic ecosystems• Provide a protective buffer zone between shorelines, estuaries and river systems protecting <strong>the</strong>sewaterways from siltation, nutrient runoff and erosion• Provide flood mitigation by storing and detaining precipitation and runoff thus reducing flow rates andpeak floods• Provide groundwater recharge and a water source <strong>for</strong> people and wildlife.Ecological benefits• Melaleuca trees are highly productive at recycling nutrients and function as long-term biomass sinks• During major flood events, particulate matter is washed into <strong>the</strong> rivers and estuaries to provide a foodsource <strong>for</strong> heterotrophic mirco-oranisms and detritivores• Provide both temporary and permanent habitats <strong>for</strong> a variety of flora and fauna, including roosting andbreeding areas <strong>for</strong> wildlife, some Melaleuca swamps support large ibis and egret colonies• Provide refuges <strong>for</strong> wildlife during periods of drought• Melaleuca trees flower prolifically and provide a source of nectar <strong>for</strong> resident and migratory birds, bats,possums, bees and o<strong>the</strong>r insects. Their nectar is a particularly valuable food source <strong>for</strong> migratory honeyeaters and parrots during <strong>the</strong> autumn/winter months.ThreatsThere are several key threatening processes which affect <strong>the</strong> majority of remnant Melaleuca halmaturorumwoodlands. Drainage or water extraction, which influences soil chemistry, is common and can cause acidsulphate soils.Increased nutrients moving into <strong>the</strong> water due to catchment clearance may result in vegetation dieback andchange in water chemistry. Melaleuca halmaturorum requires fresh water flushing on a seasonal basis tostimulate regeneration of seedlings and maintenance of existing specimens.Plate 1. Melaleuca halmaturorum tall shrubland over Halosarcia sp.Low open shrubland. Hamp Lake near Elliston.22
Melaleuca halmaturorum infull flower providing excellentnectar source <strong>for</strong> insects.Plate 2. Melaleuca halmaturorumNorth of Wanilla, <strong>Eyre</strong><strong>Peninsula</strong>.Typical example of a wetlandwith introduced grasses as <strong>the</strong>dominant vegetation.Meadow Pool, central westregion, <strong>Eyre</strong> <strong>Peninsula</strong>.Plate 3. Introduced grassesExample of a wetland withGahnia sp. as <strong>the</strong> dominantvegetation association.Orana Swamp, central westregion, <strong>Eyre</strong> <strong>Peninsula</strong>.Plate 4. Gahnia sp.23
18.0 DEGRADATION AND DISTURBANCE18.1 BackgroundDisturbances or threats are defined as any direct or indirect human activities at <strong>the</strong> site or in <strong>the</strong> site or in<strong>the</strong> catchment area that may have a detrimental effect on <strong>the</strong> ecological character of <strong>the</strong> wetland. The effectmay be a low level disturbance such as low stocking rates or major threats from water diversion schemes.18.2 Analysis<strong>Wetland</strong> disturbance66 118Access tracksFence linesRubbishAltered flows18329Cleared landGrazing damageDrainsBorrowpits/quarryFigure 8. <strong>Wetland</strong> disturbanceMany wetlands were found to have a number of disturbances at <strong>the</strong> one site, <strong>the</strong> two most frequentdisturbances recorded were access tracks and cleared land. The majority of wetlands are located on privateproperty where cleared land <strong>for</strong> cropping and access tracks are a necessity. Many of <strong>the</strong> tracks are locatedadjacent to wetlands and clearance <strong>for</strong> cropping occurs to <strong>the</strong> wetland edges. Drains, grazing and fencelines are also common disturbances. Rubbish dumping occurred within two wetlands, both on privateproperty. Altered flows commonly involved extracting water <strong>for</strong> irrigation or <strong>the</strong> construction of levy banks<strong>for</strong> vehicle access and drainage.Plate 5. Flinders HighwayFlinders Highwaydissecting <strong>the</strong> centraland nor<strong>the</strong>rn lagoonsof Big Swamp.24
19.0 AQUATIC VEGETATION CLASSES19.1 BackgroundParameters <strong>for</strong> seven classes of aquatic vegetation were included in <strong>the</strong> survey. These records can indicate<strong>the</strong> types of producers within <strong>the</strong> wetland system. The diversity of classes recorded may indicate a level ofaquatic biodiversity present, or lack of plants recorded indicates limited primary production within <strong>the</strong>wetland system.The vegetation classes consisted of:• Algal • Floating vascular• Aquatic Moss • Submergents• Rooted Vascular • Surface vegetation• Floating leaved •Algal and aquatic moss commonly comprise Charophyta (stoneworts) and Chlorophyta (green algae)which <strong>for</strong>ms macroscopic mats ei<strong>the</strong>r attached to plants or in open water. Algal <strong>for</strong>ms <strong>the</strong> basis <strong>for</strong>photosyn<strong>the</strong>tic basis <strong>for</strong> <strong>the</strong> open water food sources in many inland waters (Boulton and Brock, 1999).For green algae images see: http://www.nmnh.si.edu/botany/projects/algae/Imag-Chl.htm.Floating vascular/leaved plants have part or all of <strong>the</strong> leaves at <strong>the</strong> waters surface. Examples includeAzolla species floating ferns that host bacteria that fix nitrogen (Romanowski,1998), Lemna, Spirodela andWolffia (duckweeds) and members of <strong>the</strong> family Utricularia (bladderworts). Members from <strong>the</strong> familyPotamogetonacea (pondweeds) are also common floating plants and can be found in a variety of habitats.All <strong>the</strong>se plants are able to provide habitat <strong>for</strong> invertebrates, provide shelter <strong>for</strong> fishes and produce oxygen.Rooted vascular plants are those rooted in <strong>the</strong> sediments with ei<strong>the</strong>r a major proportion of material abovewater (reeds, rushes and sedges) or totally under water (vallisneria spp.). Many of <strong>the</strong>se plants play a keyrole in nutrient cycling and provide habitat <strong>for</strong> birds, insects and aquatic invertebrates. Typical generainclude Baumea, Bolboschoenus, Carex, Cyperus, Gahnia, Schoenus, Juncus, Triglochin andMyriophyllum. Myriophyllum is a distinctive wetland genus that provides food, shelter and spawning ornesting sites <strong>for</strong> a variety of animals, from invertebrates to fish, frogs and birds, (Romanowski,1998).19.2 AnalysisVegetation classes3020100Floating Aquatic Rooted No data Floating AlgaeOccurrence 2 4 24 7 1 1Figure 9. Aquatic vegetation classes recordeded.The aquatic class of rooted vascular is <strong>the</strong> most common <strong>for</strong>m of vegetation class within <strong>the</strong> wetlandssurveyed. Genera such as Myriophyllum, Halosarcia and Sarcocornia were frequently recorded within thosewetlands that are not hyper-saline. The genus Gahnia was also recorded at some sites with fresh to salinewaters. Vegetation composition and abundance is strongly linked with salinity levels, many saline wetlands25
surveyed had very little aquatic vegetation abundance or diversity. The majority of vegetation was in <strong>the</strong><strong>for</strong>m of terrestrial-aquatic species such as samphires.20.0 AQUATIC INVERTEBRATE ANALYSIS20.1 BackgroundMacro and micro invertebrates are an essential component of <strong>the</strong> wetland food web. They are responsible<strong>for</strong> a significant proportion of <strong>the</strong> secondary production occurring in wetlands, and <strong>for</strong>m two interconnectedwetland food chains, a grazing food chain and a detrital food chain, Davis and Rolls (1987). Invertebratescomprise much of <strong>the</strong> diet of waterfowl populations <strong>the</strong> diversity and abundance of waterfowl can be adirect consequence of <strong>the</strong> invertebrate food supply.20.1.1 Ecological benefitsYen and Butcher (1997) provide some examples of direct ecological benefits that invertebrates contribute.Tangible direct benefits:1. Plant pollination2. Effects on soil; soil <strong>for</strong>mation and fertility.3. Decomposition; fragmentation and recycling of dead plant and animal material.4. Position in <strong>the</strong> food web; invertebrates are <strong>the</strong> principle food <strong>for</strong> many vertebrates. They <strong>for</strong>m a basicelement in food chains and networks which underlie <strong>the</strong> general balance of nature5. Preditation and parasitism; involved in <strong>the</strong> natural regulation of populations of o<strong>the</strong>r species throughpredation and parasitism; and thus <strong>for</strong>m <strong>the</strong> basis of biological control.Indirect ecological benefits:• Ecosystem stability: <strong>the</strong> loss of species from highly interrelated systems is likely to cause a cascade offur<strong>the</strong>r losses.• Evolutionary time: diversity within ecosystems maintains greater diversity.20.1.2 Trophic dynamicsStanding water communities are dynamic systems which reflect change in many variables. The trophicstate of a wetland depends on nutrient inputs from <strong>the</strong> catchment and within <strong>the</strong> wetland (Boulton andBrock 1999). If samples from all trophic groups are collected, this could suggest that <strong>the</strong> aquatic ecosystemis a reasonable state of equilibrium. The top of <strong>the</strong> food chain is occupied by vertebrate predators, includingfish, water rats and water birds. Terrestrial predators can be considered to be on <strong>the</strong> top of <strong>the</strong> aquatic foodchain, and provide a pathway <strong>for</strong> export of nutrients and o<strong>the</strong>r material from <strong>the</strong> wetland ecosystem(Boulton and Brock 1999).Primary producersPrimary producers <strong>for</strong>m two groups those that are suspended or floating and those attached to substrate oro<strong>the</strong>r plants. Attached macrophytes includes frindging reeds and submerged plants and periphyton (<strong>the</strong>biota attached to submerged surfaces). Suspended or floating <strong>for</strong>ms generally consist of <strong>the</strong> phytoplanktonand algae groups. Phytoplankton <strong>for</strong>m <strong>the</strong> basic photosyn<strong>the</strong>tic basis <strong>for</strong> <strong>the</strong> open water food web in moststanding watersConsumersThere are two main types of consumers based on diet: grazers that consume plants and predators thatconsume o<strong>the</strong>r animals.26
GrazersGrazers consist of aquatic snails (Gastropoda) and some mayfly nymphs (Ephemeroptera), caddisfly larvae(Trichoptera) and beetles (Coleoptera). These groups are usually found near <strong>the</strong> edges of <strong>the</strong> water body.Within <strong>the</strong> open water, some of <strong>the</strong> important grazers are zooplankton, including rotifers, water fleas(Cladocera) and copepods (Calanoida and Cyclopoida).Vertebrate GrazersVertebrate grazers generally consist of groups such as tadpoles, fish and waterbirds. Vertebrate grazerscan influence <strong>the</strong> food web considerably when attracted to water bodies in times of flood or in types ofdrought.PredatorsPredators include dragonfly larvae (Odonata) which tend to ambush prey and invertebrates that hunt inopen water such as diving beetles (Dytiscidae, Coleoptera) (Boulton and Brock 1999). Areas such as <strong>the</strong>littoral zone tend to have high biodiversity of grazers which in turn attracts many invertebrate predators.20.2 Salt Lake SystemsFreshwater organisms in Australia generally tolerate salinities up to about 3 gL (3000 EC), and beyond this<strong>the</strong>re are changes in community composition, with decreased richness and increased abundance (Williams,1998; Skinner et al 2001). The biological process in salt lakes can resemble those of fresh water bodiesdespite <strong>the</strong> differences in physical, chemical and biological attributes (Boulton and Brock 1999). The bedsof many salt lakes are covered with benthic microbial mats dominated by photosyn<strong>the</strong>tic producers, andlake crusts contain propagules of decomposers, producers and consumers. Boulton and Brock (1999)comment that little is known about <strong>the</strong> microbial loop in salt lakes.A high diversity of invertebrates can occur within salt lakes, examples include rotifers, anostracan,cladocerans, calanoid copepods and ostracods. Fishes are usually absent from saline lake systems and <strong>the</strong>top consumers are mostly water birds.In general, invertebrate species richness in salt lakes declines with increasing salinity, but at intermediatesalinities where many species tolerances are broad, o<strong>the</strong>r factors such as biological interactions, pH willaffect community composition (Skinner et al, 2001; Williams 2000). Studies by Skinner et al (2001)indicates that salinization shifts invertebrate community structure and algae tends to also become dominantat <strong>the</strong> higher salinity levels. This could lead to insufficient food <strong>for</strong> animals higher in <strong>the</strong> trophic level,including fish and waterfowl.27
20.3 Temporary <strong>Wetland</strong>sMany of South Australia’s inland wetlands are temporary and display slightly different invertebrate faunacomposition from o<strong>the</strong>r wetland systems (saline lakes or permanent waters) Williams (2000) makes fourgeneral conclusions from his study of temporary wetlands.1. Faunal diversity is high and often higher than in many permanent wetlands.2. A wide range of fauna groups occurs, <strong>the</strong> particular assemblage depending largely upon time fromfilling. Many species are restricted to temporary wetlands, <strong>for</strong> example all notostracan, conchostracanand anostracan species are restricted to temporary wetlands.3. Local differences in hydrology, filling frequency, basin shape and o<strong>the</strong>r factors often result in differencesbetween wetlands in <strong>the</strong> same area and same time.4. Considerable continental and regional endemism prevails. Most macofaunal species are endemic toAustralia.The filling or flooding of temporary water bodies realises a pulse of nutrients that, toge<strong>the</strong>r with light andwater, provide <strong>the</strong> resources <strong>for</strong> germination and growth of both micro and macro photosyn<strong>the</strong>sizers.Habitat <strong>for</strong> consumers and decomposers soon follows. The invertebrate sediment egg bank withdesiccation-resistant stages seems to be <strong>the</strong> initial source of colonists. The groups that tend to be first intemporary waters include rotifers, ostacods, copepods and cladocerans.When <strong>the</strong> water body starts to dry a ‘predator soup’ results, and terrestrial predators (eg birds) come to <strong>the</strong>water to feed during <strong>the</strong> drying process. This process <strong>for</strong>ms a critical trophic link between aquatic andterrestrial systems (Boulton and Brock, 1999).20.4 AnalysisThirty-three sites were surveyed with 18 sites returning invertebrate sample results. The remaining 15 sitesdid not have invertebrates present; <strong>the</strong>se are hyper saline wetlands that do not support micro invertebrates,or had water levels that were to low too retrieve samples. Overall species composition, richness and trophicstructure is quite deficient in wetlands surveyed on <strong>Eyre</strong> <strong>Peninsula</strong>.20.4.1 Invertebrate abundanceTable 1 illustrates <strong>the</strong> invertebrate abundance sampled within <strong>the</strong> 18 survey sites. Twenty-three specieswere recorded in total. The average abundance of species within each wetland is approximately fourspecies. Abundance levels varied from one species to 14 species, with three species showing substantiallyhigher frequency of occurrence than <strong>the</strong> o<strong>the</strong>r 15 species. Two of <strong>the</strong>se species are from <strong>the</strong> familyOstracoda (Candonocypris sp. and Diacypris cf. spinosa) and <strong>the</strong> o<strong>the</strong>r Daphniopsis pusilla is from <strong>the</strong>family Cladocera. Both families are widely distributed and common, occurring within inland waters fresh andsaline. Ostracods vary in <strong>for</strong>m, some being swimmers, clingers, climbers or burrowers. Cladocerans usuallylive on <strong>the</strong> substrate where <strong>the</strong>y feed on fine particulate matter, o<strong>the</strong>rs are mainly free-swimming andconstitute an important part of <strong>the</strong> plankton of <strong>the</strong> open water (Williams 1980). Cladocerans are also animportant food <strong>for</strong> zooplanktivorous fish. Their nutritional value is high, <strong>the</strong>y are in particular rich in essentialhighly unsaturated fatty acids and natural anti-oxidants.28
Table 1. Invertebrate abundanceInvertebrate identificationNumber of recordsAcanthocyclops sp. 2Alona sp. 2A<strong>the</strong>rinosoma sp. 1Austrachiltonia australis 4Bennologia australis 2Boeckella triatriculata 5Calamoecia cilitellata 4Calamoecia salina 5Candanocypris sp. 14Chydorus cf.sphaericus 1Coxiella striata 1Cypricercus sp. 5Daphnia cf. carinata 4Daphniopsis pusilla 8Diacypris cf. spinosa 10Liyodromus sp. 6Macrothrix spp. 6Mesochra cf. baylyi 2Mesocyclops spp. 1Metacyclops cf. mortoni 6Mytilocypris 4Parartemia cf. zietziania 3Simocephalus cf. elizabethae 1Plate 6. Diacypris cf. spinosa. Plate 7. Daphniopsis pusillaDiacypris cf. spinosa. (family Ostracoda) 40XTen records were recorded.Daphniopsis pusilla (family Cladocera)40X. Eight records recorded.29
20.4.2 Invertebrate diversityFigure 10 illustrates invertebrate diversity by wetland site. Two wetlands stand out as having high diversity;<strong>the</strong>se are S3033 (Old Plough Swamp) and S3006 (Big Swamp). Both sites have different land<strong>for</strong>mcharacteristics, vegetation and water regimes, but with <strong>the</strong> same occurrence of invertebrate diversity.<strong>Wetland</strong> sites S3023 (Lake Tungketta) and S3022 (Middle Lake) are very similar, both being typical saltlake systems with invertebrate species common to both sites. Genera common to both sites includesMytilocypris, Austrachiltonia, Calamoecia, Diacypris and llyodromus.Invertebrate DiversityS3037S3035S3034S3033S3031S3027S3026S3023S3022S3020S3019S3018S3017S3016S3014S3006S3003S30010 1 2 3 4 5 6 7 8 9Figure 10. Invertebrate diversity by wetland site.30
Plate 8. Old Plough Swamp. Plate 9. Big SwampOld Plough Swamp. Temporary water regimelocated within agricultural land.Big Swamp. Permanent water regime locatedwithin a largely agricultural catchment.Established aquatic and fringing vegetationexists.Invertebrate family structure is quite similar between Old Plough Swamp and Big Swamp wetlands bothcomprising of copepods, cladocerans and ostracods. The differences at each site are on a species levelwith each comprising six different species and two common species. One conclusion is that <strong>the</strong> generafound in Old Plough Swamp are adapted to temporary waters (Daphnia, Diacypris, Metacyclops andCalamoecia) while those found in Big Swamp are adapted more to a permanent water regime (Alona,Coxiella, Cypricercus and Simocephalus).Plate 11. Middle Lake Plate 12. Lake TunkettaMiddle Lake and Lake Tungketta are good examples of salt lake systems, both sites recorded sevendifferent taxa.31
21.0 WATER CHEMISTRYChemical processes in permanent and temporary waters are extremely complex. The chemistry of <strong>the</strong>water directly influences <strong>the</strong> biological process (such as photosyn<strong>the</strong>sis) <strong>the</strong> physical features of <strong>the</strong>wetland also has a strong influence on both <strong>the</strong> chemical and biological processes. These three factors(chemical, physical and biological) are constantly in a state of movement and change. Changes in <strong>the</strong>separameters are most apparent in temporary wetlands where a wetting and drying cycle occurs. The majorityof wetlands on <strong>Eyre</strong> <strong>Peninsula</strong> have seasonal water regimes, filling during winter and remaining drythroughout spring, winter and autumn.DRY FILLING FILLED DRYING DRYDepthWaterTempDissolvedOxygenConductivitypHNutrientsFigure 11. Temporary wetland cyclesTIMEPioneer species Core species Core species Core speciesPeak flow speciesTolerant lentic species32
Brock and Boulton (1999) state that changes in water quality during drying and filling depend on factorsincluding:1. sediment properties (composition, nutrients and organic content)2. type of drawdown (gravity or evaporative)3. severity of drying (rate of drying, temperature, wea<strong>the</strong>ring)4. conditions of refilling (origin of water, degree of sediment disruption).Figure 11 describes <strong>the</strong> changes in chemical variables over time during <strong>the</strong> phases of filling and drying intemporary wetlands. Seasonal changes in invertebrate composition is also noted.21.1 pH21.1.1 BackgroundThe pH value of water indicates how acidic or alkaline it is on a scale 1-14. Acids have a low pH of about 2<strong>for</strong> a strong acid like sulphuric acid and about 4 <strong>for</strong> a weak one like lactic acid. Alkalis have a high pH ofabout 12 <strong>for</strong> sodium hydroxide. Pure distilled water has a pH of 7 which is neutral. From pH 7 to 0, a liquidbecomes increasing acidic and from pH 7 to 14, a liquid becomes increasingly alkaline.Generally in South Australia, <strong>the</strong> pH of natural water ranges between 6.0 and 8.5 with most water bodies in<strong>the</strong> range 7.0-8.0. The higher pH of natural water bodies is caused by high bicarbonate levels in <strong>the</strong> waterand can raise <strong>the</strong> pH during <strong>the</strong> day and lower pH at night. Chemicals entering <strong>the</strong> water can also affect <strong>the</strong>pH.PH is an important environmental indicator. At extremely high or low pH values, <strong>the</strong> water becomesunsuitable <strong>for</strong> most organisms.14 HIGH (Alkaline)10 MEDIUM9 MILD8 PRISTINE6 MILD5 MEDIUM4HIGH (Acidic)1Figure 12. pH values33
21.1.2 AnalysispH ValuesValue109876543210S3000S3001Figure 13. <strong>Wetland</strong> pH values <strong>for</strong> surveyed sites on <strong>Eyre</strong> <strong>Peninsula</strong>.The average pH of <strong>the</strong> wetlands surveyed ranged between pH 7 and 8, which falls into a neutral pH value.This suggests that aquatic species diversity within <strong>the</strong> wetlands surveyed are not severely affected by pHlevels. <strong>Wetland</strong> site S3038 (Samphire Flat) recorded <strong>the</strong> highest acidic reading with a pH of 6; opposing thiswas wetland site S3016 which recorded <strong>the</strong> highest alkaline reading of 9. These two sites had very differentconductivity readings. Site S3038 was hyper-saline (185 Ms) and site S3016 was slightly saline (14 Ms).Turbidity readings were also quite different with site S3038 having extremely high turbidity (15 NTU’s) andsite S3016 had a turbidity reading of zero. These results suggest that pH is closely linked to conductivityand turbidity levels. pH readings are regarded as a useful secondary chemical indicator of water qualityra<strong>the</strong>r than a primary one.21.2 ConductivityS3003S3006S3016S3012S3014S3014S3017S3032S3033S3034S3035S3019<strong>Wetland</strong> SiteS3020S3022S3023S3024S3025S3026S3027S3029S3030S3031S3036S3037S3038The majority of wetlands studied within <strong>the</strong> three regions are affected by salt ei<strong>the</strong>r through naturalprocesses or by secondary salinisation processes. In closed drainage basins (typical throughout Yorke<strong>Peninsula</strong>, <strong>Eyre</strong> <strong>Peninsula</strong> and Kangaroo Island) salt is retained and accumulated over long periods. Thisnatural accumulation of salt in closed basins results in <strong>the</strong> development of salt lakes, and this process isprimary or natural salinisation. Natural salinisation has caused almost 45% of global surface waters tobecome more saline (Williams 2001).Secondary salinisation primarily results from human activities. Disturbances have increased <strong>the</strong> number ofsalt lakes and <strong>the</strong> levels of salt in freshwater wetlands. The main causes of secondary salinisation include:• Clearance of native deep-rooted vegetation from catchments and its replacement by pasture and o<strong>the</strong>ragricultural crops.• Drainage of saline waste water from irrigated regions.• Rising saline ground waters and saline intrusions.• Diversion of inflows from salt and freshwater lakes <strong>for</strong> irrigation.• Construction of impoundments on rivers.• Construction of salt harvesting basins• Brine discharges from mining activities (Williams 2001).34
Effects on biodiversitySecondary salinisation causes various serious biological effects, <strong>the</strong>se include;• Changes to <strong>the</strong> natural character of water-bodies• Loss of biodiversity• Less salt-tolerant species are replaced by more tolerant species.These effects can cause permanent degradation and ecosystem collapse. Williams (2001) comments that<strong>the</strong> loss of biodiversity is probably greater than generally realised since recent work in semi-arid and aridregions indicates <strong>the</strong>y have much greater biodiversity than was thought. Salinisation also leads tosignificant decreases in water quality <strong>for</strong> irrigation and water supply (leading to high economic costs), <strong>the</strong>loss of amenity and aes<strong>the</strong>tic values, extensive habitat loss and reduced conservation values (Williams2001).Survey results indicate that up to 18,000 hectares of inland water bodies are affected by increases fromprimary and secondary salinity and pose risks to wetland biodiversity. Approximately ano<strong>the</strong>r 120,000hectares of water bodies exist on Kangaroo Island, <strong>Eyre</strong> <strong>Peninsula</strong> and Yorke <strong>Peninsula</strong> (based on wetlandmapping, Planning SA, 2000). Extrapolating preliminary results from <strong>the</strong> 18,000 hectares surveyed, it islikely that salinity poses a risk to biodiversity in <strong>the</strong> remaining 120,000 hectares of wetlands within <strong>the</strong>seregions.21.2.1 AnalysisConductivity within <strong>the</strong> wetlands surveyed tended to fall within <strong>the</strong> highly saline range, often being equal toor higher than conductivity levels in sea water. High salt levels occur in some water bodies such as salinelake systems but o<strong>the</strong>r wetland systems are obviously being affected by increasing dryland salinity.<strong>Wetland</strong> number S3038 (Samphire Flat), west of Kyanatta, is an example of a water body suffering fromincreased dryland salinity with a reading of 185 mS/cm. <strong>Wetland</strong> S3025 (Hamp Lake), near Elliston, is agood example of a wetland with salinity levels reaching <strong>the</strong> same salinity as sea water (approximately 64.0mS/cm); healthy stands of Melaleuca halmaturorum are also present. Some of <strong>the</strong> freshest waterbodiessampled are located within seasonally flooded pasture and small rocky outcrops. They include wetland sitesS3037 (Meadow Pool) and S3036 (Taddie Pool), both located on <strong>the</strong> western section of <strong>Eyre</strong> <strong>Peninsula</strong>.Limited data is available <strong>for</strong> assessing <strong>the</strong> risk of adverse effects of salinity in different ecosystem types,particularly wetlands. The Draft Australian and New Zealand Guidelines <strong>for</strong> Fresh and Marine Water Quality(1999) tables wetlands with ‘no data’ related <strong>for</strong> assessing adverse effects of salinity. A criteria of 8.0mS/cm (8000 EC) above which irrigation water may be detrimental to a wide range of vegetable, fruit,ornamental and pasture crops. This level has also been adopted by <strong>the</strong> Murray-Darling Basin Commissionas an interim objective to be met at Morgan in South Australia to ensure that reasonable water quality isavailable to all users.35
Figure 14 is based from <strong>the</strong> salt measurement conversions guide from <strong>the</strong>Land Management Society Inc.Salinity in milli-siemens per cm Water definition Surveyed wetlands0 – 0.9 Fresh0 = distilled water1.0 – 2.7 MarginalMaximum <strong>for</strong> hotwater systems, damwater starts to goclear, maximum <strong>for</strong>people.3.0 – 9.1 BrackishMaximum <strong>for</strong> milkingcows and poultry,crop losses start.Meadow Pool.Big Swamp, Taddie Pool.Little Swamp, Todd Reservoir.9.5 – 15.0 Salt9.5 = Yabbie growthstarts to slow,maximum <strong>for</strong> horses.14.5 = Yabbie growthceases15.5 – 22.5 SaltThis range includes<strong>the</strong> maximum <strong>for</strong> beefcattle, sheep andmany trees.23.0 – 64.0 SaltSea water at 64.064.0 – 649.0 SaltLimit <strong>for</strong> salt bush at100.0 and saturatedNaCl salt lakes at649.0Figure 14. Salinity guidelines.Pillie Lake, Orana Swamp, Pillana Swamp, OldPlough Swamp.Sheringa Lagoon.Slea<strong>for</strong>d Mere, Malata Complex, Round Lake,Middle Lake, Lake Tungketta, Elliston CemeterySwamp, Elliston Myrtle Swamp, Three LakesOne, Three Lakes Three, Three Lakes Four,Greenly Complex.Elliston hamp lake, Lake Newland, Lake greenly,Big lake malata, Samphire flat.The majority of wetlands fall within <strong>the</strong> 23.0 to 100.0 mS/cm range, with <strong>the</strong>remaining wetlands scattered across <strong>the</strong> marginal, brackish and salt ranges.More research is required to understand <strong>the</strong> effects of salinity upon flora andfauna, in particular invertebrate fauna. Little is known regarding <strong>the</strong> range oftolerance levels that invertebrate’s display, and research into <strong>the</strong>se aspectswould enable <strong>the</strong> development of biological indicators.36
Plate 12. Hamp LakeHamp Lake (S3025) 69.1 ms/cmPlate 13. Taddie PoolTaddie Pool (S3036) 2.25 ms/cmPlate 14. Meadow PoolPlate 15. Samphire FlatMeadow Pool (S3037) .515 ms/cmSamphire Flat (S3038). 185 ms/cm Insert:crystalised salt.37
21.3 TurbidityTurbidity is a measure of water clarity and can be affected by <strong>the</strong> amount of suspended particles of clay,silt, plankton, industrial wastes and sewage in water. Turbidity is caused by small particles suspended inwater which are too small to settle out, but big enough to scatter light. At higher levels of turbidity, waterloses its ability to support a diversity of aquatic organisms, and it becomes warmer as suspended particlesabsorb heat from <strong>the</strong> sun. Turbidity leads to less light penetrating <strong>the</strong> water, <strong>the</strong>reby decreasingphotosyn<strong>the</strong>sis, which in turn reduces dissolved oxygen concentrations. Suspended particles may also clogaquatic invertebrate and fish gills, reduce growth rates, and prevent egg and larval development. Particlesin suspension can carry heavy metals, pesticides, nutrients and bacteria. Different components ofecosystems are adapted to different levels of light. The plant community structure and biomass in anecosystem are determined by <strong>the</strong> light regime, in conjunction with nutrients and temperature. Changes inwater clarity may produce changes in <strong>the</strong> dominant phytoplankton groups. A common result from increasedclarity tends to reduce <strong>the</strong> primary productivity of systems. Changes to <strong>the</strong> primary producers will also effect<strong>the</strong> o<strong>the</strong>r trophic components of <strong>the</strong> ecosystem (Liston and Maher, 1997).Turbidity can have a significant effect on <strong>the</strong> microbiological quality of drinking-water, its presence caninterfere with <strong>the</strong> detection of bacteria in drinking-water. Turbid water has been shown to stimulate bacterialgrowth since nutrients are adsorbed on to particulate surfaces, <strong>the</strong>reby enabling <strong>the</strong> attached bacteria togrow more rapidly than those in free suspension. The major problem associated with turbidity is its effect ondisinfection, high levels have been shown to protect microorganisms from <strong>the</strong> action of disinfectants and toincrease <strong>the</strong> chlorine and oxygen demand,(http://www.who.int/water_sanitation_health/GDWQ/Chemicals/turbidity.htm).Turbidity in water is measured in units called NTU's, or Nephelometric Turbidity Units. It is calculated bymeasuring <strong>the</strong> dispersion of a light beam passed through a sample of water.Fine particles, silt, and suspended matter will cause a light beam passing through <strong>the</strong> water to be scattered.It has been found that <strong>the</strong> amount of scattering is proportionate to <strong>the</strong> amount of turbidity present.There<strong>for</strong>e, this process gives a good indication of <strong>the</strong> relative turbidity of a water sample.The measurement of NTU does not give <strong>the</strong> sizes of <strong>the</strong> particles, nor does it indicate <strong>the</strong> amount ofparticles present. It is a qualitative, ra<strong>the</strong>r than quantitative way of measuring turbidity.21.3.1 AnalysisTo understand <strong>the</strong> results fully, in<strong>for</strong>mation about <strong>the</strong> natural levels of turbidity within all <strong>the</strong> survey regionsat various times of <strong>the</strong> year is required. This is important because normal levels of turbidity can vary greatlyin wetlands from clear flowing zones to murky areas. Natural variations are also related to flow events suchas floods, winter rains, road run-off which can increase levels dramatically.The Australian Water Quality Guidelines <strong>for</strong> Fresh and Marine Waters do not set a guideline <strong>for</strong> turbidity toprotect aquatic ecosystems, but recommend that increases in suspended solids should be less than 10% of<strong>the</strong> seasonal mean NTU. Bek and Robinson (1991) also suggest that turbidity below 50 NTU is suitable <strong>for</strong>protecting aquatic animals and plants.The New South Wales EPA has developed <strong>the</strong> following general guidelines <strong>for</strong> turbidity:- good (< 5 NTU)- fair (5-50 NTU)- poor (> 50 NTU)Refer to: http://www.epa.nsw.gov.au/soe/97/ch3/11.htmThe National Advisory Committee to Water on <strong>the</strong> Web has developed regional trends of fresh water fishactivity with turbidity values and time. See figure 15.(See: http://wow.nrri.umn.edu/wow/under/parameters/turbidity.html)These trends correspond well with those guidelines developed by <strong>the</strong> NSW EPA mentioned above.38
100,00010,0001,000100FishAbandonCoverReduced growthratesIncreased respirationReduced feeding ratesDelayed hatchingLong termreduction infeedingsuccessDeath10Fish showsigns ofstressNTUsHours Days Weeks MonthsTimeFigure 15. Fish activity against turbidity values and time39
Survey ResultsTurbidity values were generally below 30 NTUs with <strong>the</strong> exception of two sites, S3034 (lake Greenly) with areading of 1000 NTUs and S3035 (Big Lake Malata) with 721 NTUs. Both of <strong>the</strong>se sites displayed fine siltyclay particles that obviously clouded <strong>the</strong> water column. The water depth was less than 15 cm and <strong>the</strong> landsurrounding <strong>the</strong> waterbody was generally cleared. It is assumed that <strong>the</strong> combination of <strong>the</strong>se factors,particularly <strong>the</strong> soil characteristics, contributed to <strong>the</strong>se high NTU readings.Many sites that contained moderate to high salinity levels tended to record a very low turbidity reading,generally zero. To put <strong>the</strong> survey readings in perspective <strong>the</strong> guidelines used by <strong>the</strong> NSW EPA have beenadopted. Interpreting <strong>the</strong>se results should be done with caution, as o<strong>the</strong>r water chemistry factors play a partin <strong>the</strong> overall health of a wetland.Table 2. Turbidity guidelines.Guideline NTUs Number of <strong>Wetland</strong>sGood 50 2(lake Greenly and Big LakeMalata)21.4 Water TemperatureMany of <strong>the</strong> physical, biological and chemical characteristics of a wetland are directly affected bytemperature. Temperature affects <strong>the</strong> solubility of oxygen in water with warmer water holding less oxygenthan cooler water. These factors affect <strong>the</strong> rate of photosyn<strong>the</strong>sis by algae and larger water plants, withwarm water temperatures being susceptible to eutrophication and <strong>the</strong>re<strong>for</strong>e algal blooms. The sensitivity o<strong>for</strong>ganisms to toxic waste, parasites and diseases is also related to water temperature. Organisms canbecome stressed as temperatures rises and become less resilient to o<strong>the</strong>r stresses, this results in mostaquatic organisms having a narrow temperature range in which <strong>the</strong>y can function effectively.Most aquatic organisms are cold-blooded which means <strong>the</strong>y are unable to internally regulate <strong>the</strong>ir corebody temperature. There<strong>for</strong>e, temperature exerts a major influence on <strong>the</strong> biological activity and growth ofaquatic organisms. To a point, <strong>the</strong> higher <strong>the</strong> water temperature, <strong>the</strong> greater <strong>the</strong> biological activity. Fish,insects, zooplankton and o<strong>the</strong>r aquatic species all have preferred temperature ranges. As temperatures gettoo far above or below this preferred range, <strong>the</strong> number of individuals of <strong>the</strong> species decreases until finally<strong>the</strong>re are few, or none.The most obvious reason <strong>for</strong> temperature change in lakes is <strong>the</strong> change in seasonal air temperature waterlevel. Daily variation also may occur, especially in <strong>the</strong> surface layers, which are warm during <strong>the</strong> day andcool at night. In deeper lakes (typically greater than 5 m <strong>for</strong> small lakes and 10 m <strong>for</strong> larger ones) duringsummer, <strong>the</strong> water separates into layers of distinctly different density caused by differences in temperature,this process is called <strong>the</strong>rmal stratification.When <strong>the</strong> surface water cools again in <strong>the</strong> fall to about <strong>the</strong> same temperature as <strong>the</strong> lower water, <strong>the</strong>stratification is lost and <strong>the</strong> wind can turbulently mix <strong>the</strong> two water masses toge<strong>the</strong>r because <strong>the</strong>ir densitiesare so similar. A similar process also may occur during <strong>the</strong> spring as colder surface waters warm to <strong>the</strong>temperature of bottom waters and <strong>the</strong> lake mixes. The lake mixing associated with a turnover oftencorresponds with changes in many o<strong>the</strong>r chemical parameters and this can affect biological communities(The National Advisory Committee to Water on <strong>the</strong> Web 2001).40
For aquatic systems <strong>the</strong> maximum recommended increase in <strong>the</strong> natural temperature range of any inland ormarine water is 2 0 C (Waterwatch Manual 1994). Because <strong>the</strong> surveys have recorded <strong>the</strong> first readings <strong>for</strong>many wetlands, this natural temperature range is largely unknown. As a general guide, temperaturesbetween zero and 20 degrees are acceptable limits <strong>for</strong> Mediterranean climates, while temperatures over 20degrees can start impacting on aquatic fauna and fauna (Waterwatch Manual 1994).24.4.1 AnalysisThe average water temperature was 19 degrees, with temperature variations between 11degrees (EllistonHamp Lake) and 26 degrees being recorded. The influencing factor in wetland temperatures on <strong>Eyre</strong><strong>Peninsula</strong> is that <strong>the</strong> majority of water bodies are very shallow, usually no more than 60 cm in depth. Thetime of sampling will also effect temperature ranges, readings taken early in <strong>the</strong> morning will be muchdifferent from temperatures in <strong>the</strong> afternoon. Temperature readings are required over several time periodsand during different seasons to attain a true indication of temperature regimes.22.0 RAPID ASSESSMENTThe rapid assessment component of <strong>the</strong> survey provides a quick snap shot of <strong>the</strong> condition within differentriparian habitats. Generally <strong>the</strong> score is a subjective one given by <strong>the</strong> observer, it is an estimate ofpercentage of intact native vegetation and <strong>the</strong> diversity and abundance of aquatic flora and fauna.22.1 Aquatic FaunaThis is a subjective score according to <strong>the</strong> abundance and diversity of invertebrates, fish and birds locatedwithin or on <strong>the</strong> water body. Low (1) refers to no fish or birds with little or no invertebrate presence, Moderate (3) refers to some bird presence and good vertebrate abundance, fish usually are not present, High (5) indicates good bird and invertebrate diversity and abundance with <strong>the</strong> presence of fish.Aquatic Fauna Score30%15%55%1 = Low3 = Moderate5 = HighFour sites received a low score (Pillie Lake, OldPlough Swamp, Lake Greenly and Samphire Flat).Fifteen sites scored a moderate score and eightsites scored a high score (eg Orana Swamp).Figure 16. Aquatic Fauna Rapid Assessment41
22.2 Aquatic floraThis records <strong>the</strong> abundance and diversity of aquatic vegetation. Low (1) indicates no or very little aquaticvegetation, moderate (3) indicates some aquatic vegetation cover ei<strong>the</strong>r in <strong>the</strong> <strong>for</strong>m of floating or rootedvegetation, high (5) indicates good diversity of aquatic vegetation with a range of rooted vegetation such asreeds and rushes and floating vegetation such as water ribbons.Eleven sites received a low score, 16 sites a moderate score and no sites received high scores.23.0 RIPARIAN VEGETATION RAPID ASSESSMENTRiparian native vegetation is assessed in three zones. These are <strong>the</strong> toe of bank (low water – high water),bank (high water mark – buffer) and buffer (top of <strong>the</strong> bank to <strong>the</strong> buffer which can extend between 10metres and 100 metres). The vegetation association <strong>for</strong> each zone consists of <strong>the</strong> dominant or co-dominantover storey species and understorey species. The vegetation association <strong>for</strong> each zone is scoredconsidering <strong>the</strong> level of disturbance and vegetation cover within each zone.The vegetation association scoring system consists of: Degraded or no vegetation (1) with less than 30% vegetation cover, with high level of disturbance, Natural (3) between 30 – 75% vegetation cover, with little disturbance Intact (5) over 75% vegetation cover with little or no disturbance.Table 3. Riparian vegetation Rapid Assessment.Degraded Natural IntactToe of bank 10 10 7Bank 11 8 8Buffer 13 11 524.0 WETLAND CONDITION SCOREThe wetland score reflects <strong>the</strong> previous rapid assessment scores <strong>for</strong> aquatic fauna, aquatic vegetation andriparian vegetation values. The combination of <strong>the</strong>se values and <strong>the</strong> interpretation of o<strong>the</strong>rs parametersrecorded during <strong>the</strong> survey (such as land degradation and water chemistry) <strong>for</strong>m <strong>the</strong> basis of <strong>the</strong> wetlandcondition score.The wetland score consists of: Degraded (1) those sites that have a high level of disturbance and received low rapid assessmentscores. Natural (3) those sites that have little disturbance, received moderate to high rapid assessmentscores and that are sites usually protected within <strong>the</strong> reserve system or by privateconservation. Pristine (5) those sites with no obvious sign of disturbance, scored very highly in <strong>the</strong> rapid assessmentand are <strong>for</strong>mally conserved within <strong>the</strong> State reserve system.<strong>Wetland</strong> condition scores are very subjective. Although 17 sites received a natural score, significantdisturbances are present at most sites. Nine sites scored as degraded and no sites received apristine score.42
25.0 RAPID ASSESSMENT TOTAL SCOREThe total score provides an indication of <strong>the</strong> environmental value of wetlands surveyed. These values arean interpretation of <strong>the</strong> biological, chemical and physical parameters.This score consist of a tally from all <strong>the</strong> rapid assessment scores and <strong>the</strong> values are scored as follows: 0 – 6 low wetland values 7 – 18 moderate wetland values 19 – 30 high wetland valuesThese scores provided a quick means of identifying wetlands with low to high environmental attributesbased on <strong>the</strong> survey parameters. Those wetlands that fall into <strong>the</strong> moderate to high wetland scores shouldbe more closely examined in terms of land ownership, placement within <strong>the</strong> landscape and <strong>the</strong> likelysuccess of monitoring and protective measures. Three sites received a low score, 16 sites a moderatescore and eight received high wetland value scores.25.1 <strong>Wetland</strong>s with high valuesTable 4. <strong>Wetland</strong>s with high rapid assessment scores.<strong>Wetland</strong> sitenumber<strong>Wetland</strong> nameManagement AuthorityS3000 Slea<strong>for</strong>d Mere National Parks and WildlifeS3014 Orana Swamp DC CumminsS3032 Greenly Complex PrivateS3025 Elliston Hamp Lake DC EllistonS3026 Elliston Myrtle Swamp DC EllistonS3027 Three Lakes One PrivateS3029 Three Lakes Four PrivateS3031 Lake Newland National Parks and Wildlife25.2 Moderate wetland valuesTable 5. <strong>Wetland</strong> with moderate rapid assessment values.<strong>Wetland</strong> sitenumber<strong>Wetland</strong> nameManagement AuthorityS3001 Pillie Lake National Parks and WildlifeS3003 Little swamp Multiple private land holders and <strong>the</strong>Department of Correctional ServicesS3006 Big Swamp PrivateS3012 Tod Reservoir SA WaterS3016 Pillana Swamp PrivateS3017 'Malata Complex' PrivateS3018 Lake Hamilton PrivateS3019 Round Lake PrivateS3020 Sheringa Lagoon DC EllistonS3022 Middle Lake PrivateS3023 Lake Tungketta PrivateS3024 Elliston Cemetery Swamp DC EllistonS3030 Three Lakes Four PrivateS3035 Big Lake Malata PrivateS3036 Taddie Pool DC EllistonS3037 Meadow Pool Private43
25.3 Low wetland valuesTable 6. <strong>Wetland</strong>s with low rapid assessment values.<strong>Wetland</strong> sitenumber<strong>Wetland</strong> nameManagement AuthorityS3033 Old Plough Swamp PrivateS3034 Lake Greenly PrivateS3038 Samphire Flat Private26.0 ANZECC WETLAND CRITERIAThese criteria are used <strong>for</strong> determining nationally important wetlands in Australia, and <strong>for</strong>m <strong>the</strong> bases <strong>for</strong><strong>the</strong> inclusion in <strong>the</strong> Directory <strong>for</strong> Important <strong>Wetland</strong>s. These criteria were agreed to by <strong>the</strong> ANZECC<strong>Wetland</strong>s Network in 1994.A wetland may be considered nationally important if it meets at least one of <strong>the</strong> following criteria:1. It is a good example of a wetland type occurring within a biogeographic region in Australia.2. It is a wetland which plays an important ecological or hydrological role in <strong>the</strong> natural functioning of amajor wetland system/complex.3. It is a wetland which is important as <strong>the</strong> habitat <strong>for</strong> animal taxa at a vulnerable stage in <strong>the</strong>ir lifecycles, or provides a refuge when adverse conditions such as drought prevail.4. The wetland supports 1% or more of <strong>the</strong> national populations of any native plant or animal taxa.5. The wetland supports native plant or animal taxa or communities which are considered endangered orvulnerable at <strong>the</strong> national level.6. The wetland is of outstanding historical or cultural significance.Many of <strong>the</strong> sites in <strong>the</strong> Directory meet more than one of <strong>the</strong> criteria. Application of <strong>the</strong> criteria to individualwetland sites involves a degree of subjectivity. Aspects of a site’s significance can be interpreted differentlyby different surveyors, and in<strong>for</strong>mation gaps often exist which make it difficult to judge whe<strong>the</strong>r or not a sitemeets a particular criterion. This is especially true in <strong>the</strong> case of this wetland survey of <strong>Eyre</strong> <strong>Peninsula</strong>,more studies of nominated wetlands are required to apply <strong>the</strong> ANZECC criteria with greater certainty.The Interim Biogeographic Regionalisation <strong>for</strong> Australia (IBRA) is used as <strong>the</strong> framework <strong>for</strong> applyingCriterion 1, which identifies wetlands that are unique or representative within a biogeographic region inAustralia. This framework has limitations due to its broad coverage of some areas, <strong>for</strong> example Yorke<strong>Peninsula</strong> and <strong>Eyre</strong> <strong>Peninsula</strong> are not defined as different regions. The use of IBRA subregions <strong>for</strong> SouthAustralia provides much greater definition in identifying wetlands that are unique or representative <strong>for</strong> eachsub region.44
26.1 AnalysisOf <strong>the</strong> 27 wetlands surveyed,13 sites recorded an ANZECC wetland criteria. Two of <strong>the</strong>se sites receivedmultiple values. Criteria one, two and three all recorded a wetland with <strong>the</strong>se values, while criteria four, fiveand six were not recorded.ANZECC <strong>Wetland</strong> Criteria1513105120Criteria 1 Criteria 2 Criteria 3Figure 17. ANZECC Criteria.Table 7. <strong>Wetland</strong>s with ANZECC Criteria<strong>Wetland</strong> Number <strong>Wetland</strong> Name ANZECC CriteriaS3000 Slea<strong>for</strong>d Mere 1,3S3001 Pillie Lake 1S3006 Big Swamp 1,2,3S3014 Orana Swamp 1S3016 Pillana Swamp 1S3020 Sheringa Lagoon 1S3024 Elliston Cemetery Swamp 1S3025 Elliston Hamp Lake 1S3026 Elliston Myrtle Swamp 1S3027 Three Lakes One 1S3029 Three Lakes Three 1S3030 Three Lakes Four 1S3031 Lake Newland 145
27.0 WETLAND TYPESThe definition of a wetland used in <strong>the</strong> survey is one adopted by <strong>the</strong> Ramsar Convention under Article 1.1.“<strong>Wetland</strong>s are areas of marsh, fen, peatland or water, whe<strong>the</strong>r natural or artificial, permanent of temporary,with water that is static or flowing, fresh, brackish or salt, including areas of marine water <strong>the</strong> depth of whichat low tide does not exceed six meters.”Within this definition, <strong>the</strong> wetland classification system used in <strong>the</strong> Directory of Important <strong>Wetland</strong>sidentifies 40 different wetland types in three categories: A-Marine and Coastal Zone wetlands, B-Inlandwetlands, and C-Human-made wetlands. This wetland survey does not include Category A – Marine andCoastal Zone wetlands .The system is based on that used by <strong>the</strong> Ramsar Convention in describing <strong>Wetland</strong>s of InternationalImportance, but was modified slightly to suit <strong>the</strong> Australian situation.A – Marine and Coastal Zone wetlands1. Marine waters - permanent shallow waters less than six metres deep at lowtide, includes sea bays straits2. Subtidal aquatic beds, includes kelp beds, sea-grasses, tropical marinemeadows3. Coral reefs4. Rocky marine shores, includes rocky offshore islands, sea cliffs5. Sand, shingle or pebble beaches, includes sand bars, spits, sandy islets6. Estuarine waters, permanent waters of estuaries and estuarine systems ofdeltas7. Intertidal mud, sand or salt flats8. Intertidal marshes, includes salt marshes, salt meadows, saltings, raised saltmarshes, tidal brackish and freshwater marshes9. Intertidal <strong>for</strong>ested wetlands, includes mangrove swamps, nipa swamps, tidalfreshwater swamps <strong>for</strong>ests10. Brackish to saline lagoons and marshes with one or more relatively narrowconnections with <strong>the</strong> sea11. Freshwater lagoons and marshes in <strong>the</strong> coastal zone12. Non-tidal freshwater <strong>for</strong>ested wetlandsB – Inland wetlands1. Permanent rivers and streams includes waterfalls2. Seasonal and irregular rivers and streams3. Inland deltas(permanent)4. Riverine floodplains, includes river flats, flooded river basins, seasonallyflooded grassland, savanna and palm savanna5. Permanent freshwater lakes (8 ha) includes large oxbow lakes6. Seasonal/intermittent freshwater lakes (>8 ha) floodplain lakes7. Permanent saline /brackish lakes8. Seasonal/intermittent saline lakes9. Permanent freshwater ponds (
13. Shrub swamps, shrub dominated freshwater marsh, shrub carr, alder thicketon inorganic soil14. Freshwater swamp <strong>for</strong>est, seasonally flooded <strong>for</strong>est, wooded swamps, oninorganic soils15. Peatlands, <strong>for</strong>est, shrubs or open bogs16. Alpine and tundra wetlands: includes alpine meadows, tundra pools,temporary waters from snow melt17. Freshwater springs, oasis and rock pools18. Geo<strong>the</strong>rmal wetlands19. Inland, subterranean karst wetlandsC- Human-made wetlands1. Water storage areas; reservoirs, barrages, hydro-electric dams,impoundment’s (generally over 8 ha).2. Ponds; includes farm ponds, stock ponds, small tanks; (generally below 8 ha).3. Aquaculture ponds; fish ponds shrimp ponds4. Salt exploitation, salt pans, salines5. Excavations; gravel pits; borrow pits, mining pools.6. Wastewater treatment areas; sewage farms, settling ponds, oxidation basins.7. Irrigated land; includes irrigation channels and rice fields, canals, ditches8. Seasonally flooded arable land, farm land9. Canals27.1 Analysis<strong>Wetland</strong> Type1816141210864201851 13 1 12B5 B6 B7 B8 B10 B12 C1 C8Figure 18. <strong>Wetland</strong> Type.Seasonal/intermittent saline lakes (B8) were <strong>the</strong> most frequently recorded surveyed wetland type on <strong>Eyre</strong><strong>Peninsula</strong> (18 sites), with permanent saline /brackish lakes being <strong>the</strong> next most common wetland typerecorded (5 sites). One site (Little Swamp) is recorded as being a permanent freshwater lake (B5) and onesite (Big Swamp) as an intermittent freshwater lake (B6). Two sites recorded wetland types asseasonal/intermittent freshwater ponds (B10), three sites as seasonal saline marshes (B12), one site as awater storage area (C1) and one site as seasonally flooded arable land and farm land. Refer to Table 8.47
Table 8. <strong>Wetland</strong> types.<strong>Wetland</strong> ReferenceNumber<strong>Wetland</strong> Name<strong>Wetland</strong> TypeS3000 Slea<strong>for</strong>d Mere B7S3001 Pillie Lake B8S3003 Little Swamp B5S3006 Big Swamp B6S3012 Todd Reservior C1S3014 Orana Swamp B12S3016 Pillana Swamp B8S3017 'Malata Complex' B8S3018 Lake Hamilton B8S3019 Round Lake B8S3020 Sheringa Lagoon B7S3022 Middle Lake B8S3023 Lake Tungketta B8S3024 Elliston Cemetery Swamp B12S3025 Elliston Hamp Lake B12S3026 Elliston Myrtle Swamp B8S3027 Three Lakes One B8S3029 Three Lakes Three B8S3030 Three Lakes Four B8S3031 Lake Newland B7S3032 Greenly Complex B8S3033 Old Plough Swamp C8S3034 Lake Greenly B8S3035 Big Lake Malata B8S3036 Taddie Pool B10S3037 Meadow Pool B10S3038 Samphire Flat B8S3039 Driver Salt Lake B8S3040 Duck Ponds B8S3041 Lake Wangary B7S3042 Lake Baird B8S3043 Duck Lake B748
SECTION THREEWETLAND MONITORING28.0 INTRODUCTIONThere are three important steps in developing monitoring protocols that can be applied effectively within <strong>the</strong>South Australian wetland management context.These consist of:1. Identification of wetland values (collating and collecting existing in<strong>for</strong>mation and undertaking baselinesurveys)2. Identification of wetland threats (from <strong>the</strong> analysis of wetland values)3. Development of monitoring indicators that highlight early changes in ecologicalCharacter.“Monitoring essentially means <strong>the</strong> keeping of a continual record of certain parameters, advising whe<strong>the</strong>r<strong>the</strong>y are being maintained within prescribed limits and warning if undesirable changes occur” (Hart 1980).Finlayson and Eliot (2001) expand on this definition by emphasising that <strong>the</strong> in<strong>for</strong>mation derived frommonitoring provides a plat<strong>for</strong>m on which management actions are both based and judged.Finlayson and Mitchell (1999) identified <strong>the</strong> following five major reasons <strong>for</strong> monitoring wetlands:• To characterise variations in responses of wetlands to natural variability in <strong>the</strong> environment;• To collect baseline data on wetlands as part of inventory processes;• To record ecological changes that may be occurring as a result of specific natural or anthropogenicevents;• To measure progress toward set objectives of a management program; and• To audit <strong>the</strong> per<strong>for</strong>mance of management agencies and land users.28.1 Ecological changeThe third dot point mentions ecological change, <strong>the</strong> Ramsar Convention <strong>for</strong> Internationally Important<strong>Wetland</strong>s states that in order to record ecological change, <strong>the</strong> ecological character needs to be defined.Once defined it is possible to monitor <strong>for</strong> changes in ecological character.Ecological character is <strong>the</strong> combined biological, physical, and chemical components of <strong>the</strong> wetlandecosystem, and <strong>the</strong>ir interactions, which maintain <strong>the</strong> wetland and its products, functions and attributes.The change in ecological character is <strong>the</strong> impairment or imbalance in any biological, physical, or chemicalcomponents of <strong>the</strong> wetland ecosystem, or in <strong>the</strong>ir interactions, which maintain <strong>the</strong> wetland and its products,functions and attributes. (www.ramsar.org/key_guide-list-e.html)The Ramsar Convention provides detailed guidelines <strong>for</strong> monitoring <strong>the</strong> ecological character of wetlands.These include guidelines <strong>for</strong> initiating and conducting a risk assessment framework. The Ramsar riskassessment framework consists of six steps and <strong>the</strong>se are:Step 1 - Identification of <strong>the</strong> problem. This is <strong>the</strong> process of identifying <strong>the</strong> nature of <strong>the</strong> problem anddeveloping a plan <strong>for</strong> <strong>the</strong> remainder of <strong>the</strong> risk assessment based on this in<strong>for</strong>mation. It defines <strong>the</strong>objectives and scope of, and provides <strong>the</strong> foundation <strong>for</strong>, <strong>the</strong> risk assessment. In <strong>the</strong> case of a chemicalimpact, it would include obtaining and integrating in<strong>for</strong>mation on <strong>the</strong> characteristics (<strong>for</strong> example, properties,known toxicity) and source of <strong>the</strong> chemical, what is likely to be affected, and how is it likely to be affected,and importantly, what is to be protected.49
Step 2 - Identification of <strong>the</strong> adverse effects. This step evaluates <strong>the</strong> likely extent of adverse change orimpact on <strong>the</strong> wetland. Such data should preferably be derived from field studies, as field data are moreappropriate <strong>for</strong> assessments of multiple impacts, such as occur on many wetlands. Depending on <strong>the</strong>extent of adverse change and available resources, such studies can range from quantitative fieldexperiments to qualitative observational studies. For chemical impacts, on-site ecotoxicological bioassaysconstitute appropriate approaches, whereas <strong>for</strong> changes caused by weeds or feral animals, on-siteobservation and mapping may be all that is required.Step 3 - Identification of <strong>the</strong> extent of <strong>the</strong> problem. This step estimates <strong>the</strong> likely extent of <strong>the</strong> problem on<strong>the</strong> wetland of concern by using in<strong>for</strong>mation ga<strong>the</strong>red about its behaviour and extent of occurrenceelsewhere. In <strong>the</strong> case of a chemical impact, this includes in<strong>for</strong>mation on processes such as transport,dilution, partitioning, persistence, degradation, and trans<strong>for</strong>mation, in addition to general chemicalproperties and data on rates of chemical input into <strong>the</strong> environment. In <strong>the</strong> case of an invasive weed, itmight include detailed in<strong>for</strong>mation on its entry into an ecosystem, rate of spread and habitat preferences.While field surveys most likely represent <strong>the</strong> ideal approach, use of historical records, simulation modeling,and field and/or laboratory experimental studies all represent alternative or complementary methods ofcharacterising <strong>the</strong> extent of <strong>the</strong> problem.Step 4 - Identification of <strong>the</strong> risk. This involves integration of <strong>the</strong> results from <strong>the</strong> assessment of <strong>the</strong> likelyeffects with those from <strong>the</strong> assessment of <strong>the</strong> likely extent of <strong>the</strong> problem, in order to estimate <strong>the</strong> likelylevel of adverse ecological change on <strong>the</strong> wetland. A range of techniques exist <strong>for</strong> estimating risks, oftendepending on <strong>the</strong> type and quality of <strong>the</strong> likely effects and <strong>the</strong>ir extent. A potentially useful technique <strong>for</strong>characterising risks in wetlands is via a GIS-based framework, whereby <strong>the</strong> results of <strong>the</strong> variousassessments are overlaid onto a map of <strong>the</strong> region of interest in order to link effects to impact. In addition toestimating risks, such an approach would also serve to focus future assessments and/or monitoring onidentified problem areas.Step 5 - Risk management and reduction. This is <strong>the</strong> final decision-making process and uses <strong>the</strong>in<strong>for</strong>mation obtained from <strong>the</strong> assessment processes described above, and it attempts to minimize <strong>the</strong> riskswithout compromising o<strong>the</strong>r societal, community or environmental values. In <strong>the</strong> context of <strong>the</strong> RamsarConvention, risk management must also consider <strong>the</strong> concept of wise use and <strong>the</strong> potential effects ofmanagement decisions on this. The result of <strong>the</strong> risk assessment is not <strong>the</strong> only factor that riskmanagement considers; it also takes into account political, social, economic, and engineering/ technicalfactors, and <strong>the</strong> respective benefits and limitations of each risk-reducing action. It is a multidisciplinary taskrequiring communication between site managers and experts in relevant disciplines.Step 6 - Monitoring. Monitoring is <strong>the</strong> last step in <strong>the</strong> risk assessment process and should be undertaken toverify <strong>the</strong> effectiveness of <strong>the</strong> risk management decisions. It should incorporate components that functionas a reliable early warning system, detecting <strong>the</strong> failure or poor per<strong>for</strong>mance of risk management decisionsprior to serious environmental harm occurring. The risk assessment will be of little value if effectivemonitoring is not undertaken. The choice of endpoints to measure in <strong>the</strong> monitoring process is critical.Fur<strong>the</strong>r, a GIS-based approach will most likely be a useful technique <strong>for</strong> wetland risk assessment, as itincorporates a spatial dimension that is useful <strong>for</strong> monitoring adverse impacts on wetlands.50
29.0 MONITORING PROTOCOLS AND INDICATORSThe underlying concept of early warning indicators is that effects can be detected be<strong>for</strong>e actualenvironmental impacts. While such a ‘early warning’ may not necessarily provide firm evidence of largerscale environmental degradation, it provides an opportunity to determine whe<strong>the</strong>r intervention or fur<strong>the</strong>rinvestigation is warranted.Early warning indicators can be defined as:"The measurable biological, physical or chemical responses to a particular stress, preceding <strong>the</strong>occurrence of potentially significant adverse effects on <strong>the</strong> system of interest".(http://ramsar.org/key_guide_risk_e.htm)Typically, indicators are ecological communities or assemblages of organisms, habitat or keystone-species.Indicators are usually closely linked to ecosystem-level effects. In selecting an indicator it is important that<strong>the</strong> ecological character of a wetland which includes <strong>the</strong> biological, chemical and physical components of<strong>the</strong> ecosystem. There<strong>for</strong>e, it may be useful to select early warning indicators according to which of <strong>the</strong>above three components are considered more susceptible to change (Finlayson and Spiers, 1999).The concepts of early warning and ecological relevance can conflict. The types of biological responses thatcan be measured, and <strong>the</strong>ir relationship to ecological relevance and early warning capability. As anexample, biomarker responses can offer exceptional early warning of potential adverse effects. However,<strong>the</strong>re exists very little evidence that observed responses result, or culminate in adverse effects at anindividual level, let alone <strong>the</strong> population, community or ecosystem level (Finlayson and Spiers 1999). If <strong>the</strong>primary assessment objective is that of early detection, <strong>the</strong>n it is likely that it will be at <strong>the</strong> expense ofecological relevance (Finlayson and Spiers 1999).To have potential as an early warning indicator, a particular response should be:1. anticipatory: it should occur at levels of organisation, ei<strong>the</strong>r biological or physical, that provide anindication of degradation, or some <strong>for</strong>m of adverse effect, be<strong>for</strong>e serious environmental harm hasoccurred;2. sensitive: in detecting potential significant impacts prior to <strong>the</strong>m occurring, an early warningindicator should be sensitive to low levels, or early stages of <strong>the</strong> problem;3. diagnostic: it should be sufficiently specific to a problem to increase confidence in identifying <strong>the</strong>cause of an effect;4. broadly applicable: it should predict potential impacts from a broad range of problems;5. correlated to actual environmental effects/ecological relevance: an understanding thatcontinued exposure to <strong>the</strong> problem, and hence continued manifestation of <strong>the</strong> response, wouldusually or often lead to significant environmental (ecosystem-level) adverse effects;6. timely and cost-effective: it should provide in<strong>for</strong>mation quickly enough to initiate effectivemanagement action prior to significant environmental impacts occurring, and be inexpensive tomeasure while providing <strong>the</strong> maximum amount of in<strong>for</strong>mation per unit ef<strong>for</strong>t;7. regionally or nationally relevant: it should be relevant to <strong>the</strong> ecosystem being assessed;8. socially relevant: it should be of obvious value to, and observable by stakeholders, or predictiveof a measure that is socially relevant;9. easy to measure: it should be able to be measured using a standard procedure with knownreliability and low measurement error;51
10. constant in space and time: it should be capable of detecting small change and of clearlydistinguishing that a response is caused by some anthropogenic source, not by natural factors aspart of <strong>the</strong> natural background (that is, high signal to noise ratio);11. nondestructive: measurement of <strong>the</strong> indicator should be nondestructive to <strong>the</strong> ecosystem beingassessed.Attributes of indicators developed by van Dam et al (in press) in Finlayson and Spiers (1999).The importance of <strong>the</strong> above attributes cannot be over-emphasized, since any assessment of actual orpotential change in ecological character will only be as effective as <strong>the</strong> indicators chosen to assess it.However, an early warning indicator possessing all <strong>the</strong> ideal attributes cannot exist, as in many cases someof <strong>the</strong>m will conflict, or will simply not be achievable (Finlayson and Spiers 1999).29.1 Early warning indicatorsFinlayson and Spiers (1999) outline a number of early warning indicators, <strong>the</strong>se are placed into three broadcategories:1. rapid response toxicity tests;2. field early warning tests; and3. rapid assessments.Each of <strong>the</strong> techniques may meet different objectives in water quality assessment programs. Although <strong>the</strong>majority of early warning indicators are of a biological nature, physico-chemical indicators do exist and often<strong>for</strong>m <strong>the</strong> initial phase of assessing water quality (Finlayson and Spiers, 1999).29.1.1 Toxicity testsThese represent rapid and sensitive responses to one or more chemicals. They provide an indication that<strong>the</strong>re may be a risk of adverse effects occurring at higher levels of biological organization (<strong>for</strong> example,communities and ecosystems). Laboratory toxicity tests are of particular use <strong>for</strong> a chemical or chemicals yetto be released into <strong>the</strong> aquatic environment (<strong>for</strong> example, a new pesticide or a pre-release waste water).They provide a basis upon which to make decisions about safe concentrations or dilution/release rates,<strong>the</strong>reby eliminating, or at least minimizing, adverse impacts on <strong>the</strong> aquatic environment. However, <strong>the</strong>re aremajor differences in <strong>the</strong> ecological relevance of responses that can be measured (Finlayson and Spiers1999).29.1.2 Field early warning indicatorsThese comprise of a range of techniques that are grouped toge<strong>the</strong>r because <strong>the</strong>y are used to measureresponses or patterns in <strong>the</strong> field and thus provide a more realistic indication of effects in <strong>the</strong> environment.In contrast to rapid response toxicity tests, early warning field tests predict and/or assess <strong>the</strong> effects ofexisting chemicals. Some of <strong>the</strong> techniques can also be applied to biological and physical problems(Finlayson and Spiers, 1999).29.1.3 Rapid AssessmentsRapid assessment is essentially <strong>the</strong> method used <strong>for</strong> this wetland inventory, and has <strong>the</strong> appeal of enablingecologically-relevant in<strong>for</strong>mation to be ga<strong>the</strong>red over wide geographical areas in a standardised fashionand at relatively low costs. The trade-off is that rapid assessment methods are usually relatively ‘coarse’and hence are not designed to detect subtle impacts.52
Attributes of rapid assessment include:1. measured response is widely regarded as adequately reflecting <strong>the</strong> ecological condition or integrity of asite, catchment or region (that is, ecosystem surrogate);2. approaches to sampling and data analysis are highly standardised;3. response is measured rapidly, cheaply and with rapid turnaround of results;4. results are readily understood by non-specialists; and5. response has some diagnostic value (Finlayson and Spiers 1999).The most powerful impact assessment programs will generally be those that include two types of indicator,namely those associated with early warning of change and those (regarded as) closely associated wi<strong>the</strong>cosystem-level effects. The ‘ecosystem-level’-type indicator might include ecologically importantpopulations (<strong>for</strong> example, keystone species) or habitat, or communities of organisms that serve as suitableecosystem ‘surrogates’. Indicators used in rapid assessment would also normally serve this role. With bothtypes of indicators measured in a monitoring program, in<strong>for</strong>mation provided by ‘ecosystem-level’ indicatorsmay <strong>the</strong>n be used to assess <strong>the</strong> ecological importance of any change observed in an early detectionindicator.30.0 RECOMMENDED INDICATORS FOR MONITORING SURVEYED WETLANDSMonitoring water chemistry is recommended as an early warning indicator andmonitoring invertebrate composition as an ecosystem level indicator.Be<strong>for</strong>e <strong>the</strong>se indicators can be used effectively in a monitoring program, more research and surveys arerequired. The wetland surveys undertaken on <strong>Eyre</strong> <strong>Peninsula</strong>, Kangaroo Island and Yorke <strong>Peninsula</strong>recorded in<strong>for</strong>mation rapidly at one location and at one time of <strong>the</strong> year. Significantly more work is requiredto establish creditable baseline data that records wetland values over time. An understanding of <strong>the</strong> naturallevels of water chemistry and invertebrate composition <strong>for</strong> each region also needs to be established be<strong>for</strong>eeffective monitoring can occur. For <strong>the</strong> interpretation of water chemistry parameters and ecosystem basedparameters, refer to Section Two – <strong>Wetland</strong> Assessment under <strong>the</strong> relevant background discussions.30.1 Early warning indicators – Water chemistryThe collection of water chemistry parameters is suggested as <strong>the</strong> means <strong>for</strong> monitoring <strong>for</strong> early change inwetlands. Parameters essential to collect include conductivity, dissolved oxygen, temperature, turbidity andpH. Conductivity will probably play an important indicator providing <strong>the</strong> first early warning change withinwetlands.30.2 Ecosystem based indicatorInvertebrates are recommended as <strong>the</strong> ecosystem based indicators <strong>for</strong> monitoring. The important featuresof invertebrates which make <strong>the</strong>m useful as indicators include:1. Invertebrates are ecologically and functionally important2. Invertebrates are diverse, providing a good range from which to choose suitable taxa3. Many species are habitat specific4. Many species are abundant and are relatively simple to collect (Yen and Butcher, 1997)Indicator taxa should be selected on a regional basis and that are sensitive species to environmentalchange, whose presence indicates <strong>the</strong> probability of disturbance.Indicator species should also be selected that have been identified as keystone species. These speciesplay critical ecological roles, and <strong>the</strong>ir loss from a particular system will result (directly or indirectly) in <strong>the</strong>disappearance of o<strong>the</strong>r species (Soule and Kohm 1989); (Lawton 1991).53
Research is required towards developing <strong>the</strong>se indicators. Yen and Butcher (1997) suggest research in <strong>the</strong>following areas: The link between invertebrate biodiversity and ecosystem functioning The value of using guilds or functional groups to monitor ecosystem processes Identifying keystone taxa The existence of redundant species.The interaction between invertebrate composition and water chemistry also requires much research.Without an understanding of <strong>the</strong> dynamics between <strong>the</strong>se two parameters, interpretation of ecologicalchange will be hindered.An example of how <strong>the</strong> invertebrate monitoring program can be applied to detect change in ecologicalcharacter is to study <strong>the</strong> trophic dynamics or functional groups. The presence of both invertebrate grazersand predators indicates functional invertebrate dynamics. The loss of ei<strong>the</strong>r group quickly indicates changein <strong>the</strong> ecological character of <strong>the</strong> wetland.The development of keystone indicator species requires fur<strong>the</strong>r research especially within saline lakesystems. However, as a starting point <strong>the</strong>re are several families that can be used in starting to develop<strong>the</strong>se indicators. Representative grazers and predators are important to include as indicators due to <strong>the</strong>irimportance in <strong>the</strong> trophic chain.Keystone species to monitor include:Grazers: zooplankton, including cladocera, copepods, Calanoida and Cyclopoida.Predators: dragonfly larvae (Odonata) and families Dytiscidae, Coleoptera.30.3 O<strong>the</strong>r considerationsMonitoring also is required <strong>for</strong> many o<strong>the</strong>r parameters. Programs need to include whole of catchmentparameters that cause change in <strong>the</strong> ecological character of wetlands. Monitoring of threats to wetlandsuch as land clearance, drainage, land ownership changes and land use changes all need to bedocumented and included in <strong>the</strong> monitoring program. Ideally an action plan to alleviate and manage threatsshould be developed <strong>for</strong> nominated wetlands in conjunction with a monitoring program.31.0 RECOMMENDED WETLANDS TO MONITORThose wetlands that received a high to moderate wetland score (refer to Section Two – <strong>Wetland</strong>Assessment) are used as <strong>the</strong> first criteria <strong>for</strong> inclusion. The second criteria is <strong>the</strong> management authority.Those wetlands that are under public ownership are targeted as preferential sites to monitor unlesssignificant wetland values are identified on private lands. The reasoning behind this is that wetlands within<strong>the</strong> community land classification or under State government ownership may be easier to access andmanage a monitoring program. At this early stage of developing a monitoring program <strong>the</strong>se sites will assistin refining techniques and develop monitoring protocols.Once monitoring techniques have been developed and tested, <strong>the</strong> opportunity to expand monitoring too<strong>the</strong>r wetlands with high value on private property is feasible. O<strong>the</strong>r protection measures can be developed<strong>for</strong> wetlands on private property be<strong>for</strong>e monitoring occurs. Actions such as buffering wetlands withrevegetation, fencing, removing rubbish and <strong>the</strong> development of wise use of wetland programs <strong>for</strong>landowners are currently required to manage wetland threats. The recording of baseline data be<strong>for</strong>e suchactions is necessary to assist in <strong>the</strong> development of an on-going monitoring program in <strong>the</strong> future.54
31.1 Recommended priority wetlandsTable 9. Recommended priority wetlands <strong>for</strong> monitoring.<strong>Wetland</strong> sitenumber<strong>Wetland</strong> nameManagement AuthorityS3000 Slea<strong>for</strong>d Mere National Parks and WildlifeS3031 Lake Newland National Parks and WildlifeS3001 Pillie Lake National Parks and WildlifeS3025 Elliston Hamp Lake DC EllistonS3026 Elliston Myrtle Swamp DC EllistonS3020 Sheringa Lagoon DC EllistonS3024 Elliston Cemetery Swamp DC Elliston31.2 Second priority wetlandsTable 10. Second priority wetlands to monitor.<strong>Wetland</strong> sitenumber<strong>Wetland</strong> nameManagement AuthorityS3027 Three Lakes One PrivateS3006 Big Swamp Private32.0 RECORDING MONITORING PARAMETERSThe wetland inventory template (refer to Section One) should be used <strong>for</strong> <strong>the</strong> collection of baseline data.Once collected, analysis of <strong>the</strong> results is required to determine <strong>the</strong> values of <strong>the</strong> wetland, threats andpossible key indicator groups. The <strong>for</strong>mat of such analysis can be based on Section Two – <strong>Wetland</strong>Assessment. Routine collection of in<strong>for</strong>mation is required in order to establish which factors to monitor and<strong>the</strong>n compare data from previous monitoring to identify ecological change. Defining acceptable limits ofchange will be difficult in <strong>the</strong> absence of a detailed knowledge of individual wetland sites. The suggestedwetlands to monitor will also be of value in developing reference sites <strong>for</strong> <strong>the</strong> region.55
BIBLIOGRAPHYA.N.Z.E.C.C (1999). Draft Overview of <strong>the</strong> National Water Quality Management Strategy., Australian and New Zealand Guidlines <strong>for</strong> Freshwaterand Marine Water Quality.Arthington, M. K. (1997). Review of impacts of displaced/introduced fauna associated with inland waters. Canberra, Department <strong>for</strong> Environment:69.Barritt, M. (1982). A rapid appraisal survey of some natural areas on kangaroo Island, South Australia. Adelaide, Nature Conservation Society.Bek, P. A.. Robinson, G. (1991). Sweet Water or Bitter Legacy-Water Quality in New South Wales, Water Quality Unit, Department of WaterResources, Sydney.Biological Database of SA; Reserves and plant populations; Flora. Source <strong>for</strong> status; SA = NPWSA Act 1972, Updated Schedule 1999, REG = Langand Kraehenbuehl, 2001.Brock, M.(1999). Australian freshwater ecology: processes and management, Gleneagles Publishing.Brown, W.(1979). An inventory of research and available in<strong>for</strong>mation on wetlands in Western Australia, Department of Conservation andEnvironment, WA.Butcher, R. (1999). Assessing biodiversity in temporary and permanent wetlands, Pp 50-53 in The O<strong>the</strong>r 99%. The Conservation and Biodiversity ofInvertebrates, ed by W. Ponder and D. Lunney, 1999. Transactions of <strong>the</strong> Royal Zoological Society of New South Wales, Mosman.Butcher, Y.(1997). An overview of <strong>the</strong> conservation of non-marine invertebrates in Australia.Canberra, Environment Australia.Cadwallader, B.(1983). A guide to <strong>the</strong> freshwater fish of Victoria, FD Atkinson Government Printer.Curru<strong>the</strong>rs, S. and Hille, B. (1997). South East <strong>Wetland</strong>s GIS Database, Geographic Analysis and Research Unit, In<strong>for</strong>mation and Data AnalysisBranch, Planning Division, Department of Housing and Urban Development.Davis, M.(1998). <strong>Wetland</strong>s <strong>for</strong> <strong>the</strong> future, Gleneagles Publishing, SA.Defaye, D.(1995). Copepoda, Introduction to <strong>the</strong> Copepoda, SPB Academic Publishing.DEH (2001) Provisional listing of threatened ecosystems of <strong>the</strong> Agricultural Regions <strong>for</strong> South Australia.Department of Conservation and Environment (1980). Guidelines <strong>for</strong> <strong>the</strong> conservation and management of wetlands in Western Australia.,Department of Conservation and Environment, Western Australia.Department of Housing and Urban Development, (1997). Guide to a native vegetation survey using <strong>the</strong> biological survey of South Australiamethodology, Section 3, Geographic Analysis and Research Unit.Dowall., R.(1980). Freshwater fishes of South-Eastern Australia, A.H. & A.W. Reed PTY LTD.Dussart, B. H.(2001). Introduction to <strong>the</strong> Copepoda, Backhuys Publishers.Environment Protection and Biodiversity Conservation Act, 1999Environmental Protection Authority (1993). A guide to wetland management in <strong>the</strong> Swan coastal plain area., Environmental Protection Authority,Perth, Western Australia.Fairwea<strong>the</strong>r, P.G. & Napier (1998). Environmental indicators <strong>for</strong> national state of <strong>the</strong> environment reporting - inland waters. Environment Australia.Farinha, N.(1996). Mediterranean <strong>Wetland</strong> <strong>Inventory</strong>: A Reference Manual., MedWet/Instituto da Coservacao da Natureza/<strong>Wetland</strong>s InternationalPublication, Volume 1, Lisbon and Slimbridge, UK.Finlayson, C.M. and Spiers, A.G. (1999). Techniques <strong>for</strong> enhanced wetland inventory and monitoring. Supervising Scientist, Canberra.Finlayson, C.M. and Eliot, I. (2001). “Ecological Assessment and monitoring of Coastal <strong>Wetland</strong>s in Australia's Wet Dry Tropics: A Paradigm <strong>for</strong>elsewhere?” Coastal Management 29: 105-115.Finlayson, C. M. and Mitchell, D.S. (1999). “Australian wetlands: The monitoring challenge.” <strong>Wetland</strong>s ecology and management 7: 105-112.Geneva, W. H. O (1996). Guidelines <strong>for</strong> drinking-water quality, 2nd ed. Vol. 2. Health criteria and o<strong>the</strong>r supporting in<strong>for</strong>mation pp. 370-373.Greenway, M. (1997) <strong>Wetland</strong>s in a Dry Land: Understanding <strong>for</strong> Management, Albury, New South Wales, 29-30. Environment Australia.Hart, B. T. (1980). Environmental surveys. An Ecological Basis <strong>for</strong> Water Resource Management, Australian National University Press.Heard and Channon (1997) Guide to a native vegetation survey using <strong>the</strong> biological survey of South Australia methodology, Section 3. GeographicAnalysis and Research Unit, Department of Housing and Urban Development.Jackson, J.(1997). State of Habitat Availability and Quality in Inland Waters. Australia: State of <strong>the</strong> Environment Technical Paper Series (InlandWaters), Environment Australia.Jensen, A.(1996). <strong>Wetland</strong>s Atlas of <strong>the</strong> South Australian Murray Valley, Department <strong>for</strong> Environment and Heritage.Liston and Maher, (1997). Water quality <strong>for</strong> maintenance of aquatic ecosystems: Appropriate indicators and analysis. Australia: State of <strong>the</strong>Environment Technical Paper Seriers. (Inland waters)., Environment Australia.57
Lloyd, B.(1986). <strong>Wetland</strong>s & Water Resources of South Australia. Appendix 1. Part 3: South Australian Gulf Drainage Division., ConservationProjects Branch. Department of Environment & Planning.Maher, W. & Liston, P. (1997). Water quality <strong>for</strong> maintenance of aquatic ecosystems: Appropriate indicators and analysis. Australia: State of <strong>the</strong>Environment Technical Paper Series. (Inland waters). Environment Australia.Mat<strong>the</strong>ws, E. (2000). (Draft) Biodiversity Plan <strong>for</strong> <strong>Eyre</strong> <strong>Peninsula</strong>, Department <strong>for</strong> Environment and Heritage, SA.McComb, P.(1988). The Conservation of Australian <strong>Wetland</strong>s, Surrey Beatty & Sons Pty Limited, NSW.Morelli, J. and DeJong, M.(1996). A Directory of Important <strong>Wetland</strong>s in South Australia. Adelaide, South Australian Department of Environment andNatural Resources.Nogrady, T.(1993). Rotifera, guides to identification of <strong>the</strong> Micro Invertebrates of <strong>the</strong> Continental Waters of <strong>the</strong> World., SPB Academic Publishing.NLWRA (National Land and Water Resources Audit) 2001, Australian Dryland Salinity Assessment 2000. Extent, impacts, processes, monitoringand management options, National Land and Water Resources Audit, Australia.Paijmans, K.(1978). A Reconnaissance of four wetland pilot study areas., CSIRO Division of Land Use Research, Canberra.Parker A.J and C.M. Fanning, R. B. F. (1985). Geology in Natural History of <strong>Eyre</strong> <strong>Peninsula</strong>, Editors C.R. Twidale, M.J. Tyler and M.Davis, RoyalSociety of South Australia.Pressey, R. L.(1987). A Survey of wetlands of <strong>the</strong> lower Macleay Floodplain, NSW, NSW National Parks and Wildlife.Raines, J.(1993). Nomination of wetlands of outstanding ornithological importance <strong>for</strong> <strong>the</strong> Register of <strong>the</strong> National Estate. Royal AustralasianOrnithologist Union Database, Western Australia.Ramsar (Ramsar Resolution VII.10 and Annex on <strong>Wetland</strong> Risk Assessment Framework). Ramsar. Rivier, I. K.(1998). The predatory Cladocera(Onychopoda: Podonidae, Polyphemidar, Cercopagidae) and Leptodorida of <strong>the</strong> world., Backhuys Publishers.Robinson, P.(1991). Sweet Water or Bitter Legacy-Water Quality in New South Wales, Water Quality Unit, Department of Water Resources,Sydney.Rolls, D. (1987). A baseline biological monitoring programme <strong>for</strong> <strong>the</strong> urban wetlands of <strong>the</strong> Swan Coastal Plain, WA. Perth, EnvironmentalProtection Authority.Sainty, G. R. (1981). Waterplants of New South Wales, Water Resources Commission NSW.Sainty, G. R.(1994). Waterplants in Australia, South China Printing Co.Schwerdtfeger, P.(1985). 'Climate' in Natural History of <strong>Eyre</strong> <strong>Peninsula</strong>, by C.R. Twidale, M.J. Tyler and M. Davis, Royal Society of South Australia.Sheldon, F. and Walker, K.(2001). “Propagules in dry wetland sediments as indicators of ecological health: effects of salinity.” Regulatedrivers:Research and Management 17: 191-197.Smet, W.(1997). Rotifera, Volume 5: The Dicranophoridae (Monogononta), SPB Academic Publishing.Smirnov (1992). The Macrothricidae of <strong>the</strong> world, SPB Academic Publishing.Sonneman, A.(1988). Freshwater Algae in Australia, Sainty and Associates.Stanton, J. P. (1975). A Preliminary Assessment of <strong>Wetland</strong>s in Queensland, CSIRO Division of Land Use Research, Canberra.Storey, A.W. Lane, J.A.K. Davies, P.M. (1997). Monitoring <strong>the</strong> ecological character of Australia's wetlands of international importance (RAMSARConvention). Western Australian Department of Conservation and Land Management and Biodiversity Group of Environment Australia.Streever, W.(1996). Preliminary example of a sampling design assessment method <strong>for</strong> biomonitoring studies that rely on ordination. INTECOL'S VInternational <strong>Wetland</strong>s Conference., University of Western Australia, Gleneagles Publishing.The National Advisory Committee to Water on <strong>the</strong> Web (2001) http://wow.nrri.umn.eduThompson, M. B.(1986). River Murray <strong>Wetland</strong>s:<strong>the</strong>ir characteristics, significance and management., Nature Conservation Society of SouthAustralia and <strong>the</strong> Department of Environment and Planning, Adelaide.Walker S.J. and Goonan P.M.(2000) Frog Census 2000, Environmental Protection Agency, DEH. South Australia.Walker, G. van der Wel, B. & Leaney, R. Jolly, I.(2000). Assessing <strong>the</strong> impacts of dryland salinity on South Australia's water resources. SouthAustralia, CSIRO Land and Water: 60.Waterwatch Manual (1996). Waterwatch Manual <strong>for</strong> South Australia, South Australian Government Printer.Wea<strong>the</strong>rley, A. H.(1967). Australian inland waters and <strong>the</strong>ir fauna, Australian National University Press, Canberra.Williams, W. D.(1980). Australian Freshwater Life, Globe Press, Victoria.Williams, W. D.(1998). <strong>Wetland</strong>s in a dry land: understanding <strong>for</strong> management., Environment Australia, Biodiversity Group, Canberra.Williams, W.D. (2000). “Biodiversity in temporary wetlands of dryland regions.” Limnology 27: 141-144.58
Williams, W.D.(2001). Salinisation:unplumbed salt in a parched landscape.Web Sites referencedhttp://www.ea.gov.au/parks/nrs/ibraimcr/ibra_95/index.htmlhttp://www.nmnh.si.edu/botany/projects/algae/Imag-Chl.htmhttp://www.who.int/water_sanitation_health/GDWQ/Chemicals/turbidity.htmhttp://www.epa.nsw.gov.au/soe/97/ch3/11.htmhttp://wow.nrri.umn.edu/wow/under/parameters/turbidity.htmlwww.ramsar.org/key_guide-list-e.htmlhttp://ramsar.org/key_guide_risk_e.htmO<strong>the</strong>r useful web sitesWater Watchhttp://www.sa.waterwatch.org.au/Environment Australiahttp://www.ea.gov.au/water/wetlands/<strong>Wetland</strong> Care Australiahttp://www.wetlandcare.com.au/Environmental Protection Agencyhttp://www.environment.sa.gov.auAusRivashttp://ausrivas.canberra.edu.au/Catchment Water Management Boardshttp://www.catchments.net/Invertebrateshttp://www.umesci.maine.edu/ams/inverts.htm59
APPENDIX 1<strong>Wetland</strong> <strong>Inventory</strong> descriptions<strong>Wetland</strong> Reference Number: The wetland reference number is critical <strong>for</strong> clearly defining wetlandlocations within regions of <strong>the</strong> State. The wetland reference number acts as <strong>the</strong> primary key <strong>for</strong> records <strong>for</strong>each wetland, this enables data transfer between databases and GIS tables.<strong>Wetland</strong> Name: The name of <strong>the</strong> site.Ramsar Site: If <strong>the</strong> wetland is listed as a Ramsar site.Description of Site: A general description of <strong>the</strong> location features, closest roads or landmarks.Current Land useOn site: Current human use of <strong>the</strong> designated wetland area.Surrounding area: Human use on land adjacent to <strong>the</strong> wetlands, and more broadly in <strong>the</strong> surroundingcatchment.Tenure/ownershipOn site: Details of land ownership of <strong>the</strong> wetland site if possible.Surrounding: Details of <strong>the</strong> tenure type that is dominant in <strong>the</strong> surrounding areas if possible.Jurisdiction and management authority: The name of <strong>the</strong> body or bodies responsible <strong>for</strong> management of<strong>the</strong> wetland.Complied by: Name of person undertaking data collection.Organisation: Organisation that is managing <strong>the</strong> data collectionDate/time: Date and time of data collection.Region: Geographical region (eg <strong>Eyre</strong> <strong>Peninsula</strong>, Yorke <strong>Peninsula</strong> and Kangaroo Island)Environmental Regions: This refers to broad environmental regions within South Australia as describedby Laut P (1977), or regions described within <strong>the</strong> Regional Biodiversity Plans developed by <strong>the</strong> Department<strong>for</strong> Environment and Heritage (2000 – 2001).Key Bio diversity Areas: The Department <strong>for</strong> Environment and Heritage has developed key biodiversityareas within <strong>the</strong> Regional Biodiversity Plans <strong>for</strong> South Australia. The key biodiversity areas have beendeveloped by analysis of biological assets of <strong>the</strong> area and in<strong>for</strong>mation from community groups. There aresix key biodiversity areas identified within <strong>the</strong> three wetland study regions; <strong>the</strong>se are: coastal wetlandhabitat areas, fragmented habitat areas, grassland habitat, large remnant area, ridgeline systems,threatened habitat area.GPS reading: Taken in Latitude and Longitude or easting and northing.Map Sheet and Reference: Record of map sheet name and number with grid reference if required.Approximate Area: usually recorded after of be<strong>for</strong>e survey by GIS query.Elevation: in meters above sea level. Preferably recorded from GPS and compared with map sheetelevation values.60
Land<strong>for</strong>m Element: Land<strong>for</strong>m element definitions have been adapted from Heard and Channon (1997)Guide to a native vegetation survey using <strong>the</strong> biological survey of South Australia methodology, Section 3.Geographic Analysis and Research Unit, Department of Housing and Urban Development.Sandy Plain: Large, very gently inclined or level element composed of fine grains of wea<strong>the</strong>red rocks ofquartz.Limestone plain: Large, very gently inclined or level element of hard almost horizontally beddedlimestone, which contains at least 80% of <strong>the</strong> carbonates of calcium or magnesium.Rock outcrop: Any exposed area of rock that is inferred to be continuous with underlying bedrock on alarge, very gently inclined or level element.Drainage depression: Level to gently inclined, long, narrow, shallow open depression with smoothlyconcave cross-section, rising to moderately inclined side slopes, eroded or aggraded by sheet wash.Open depression: Land<strong>for</strong>m element that extends at <strong>the</strong> same elevation, or lower, beyond <strong>the</strong> localitywhere it is observed.Closed depression: Land<strong>for</strong>m element that stands below all points in <strong>the</strong> adjacent terrain.Flat: Planar land<strong>for</strong>m element that is nei<strong>the</strong>r a crest nor a depression and is level or very gently inclined(
Salt lake: Lake, which contains a concentration of mineral salts, (predominantly sodium chloride insolution as well as magnesium and calcium sulphate).Swamp: Almost level closed, or almost closed depression with a seasonal or permanent water table at orabove <strong>the</strong> surface, commonly aggraded by over-bank stream flow and sometimes biological (peat)accumulation.Perched swamp: A tract of land that is permanently saturated with moisture and is positioned on anelevated land<strong>for</strong>m.Playa/pan: Large, shallow, level-floored closed depression, intermittently water-filled, but mainly dry dueto evaporation, bounded as a rule by flats aggraded by sheet flow and channelled stream flow.Geological <strong>for</strong>mation name: Name of geological <strong>for</strong>mation defined from <strong>the</strong> physical geography data setsavailable from http://www.atlas.sa.gov.au/Soil types: Soil type definitions have been adapted from Heard, L and Channon, W (1997) Guide to a nativevegetation survey using <strong>the</strong> biological survey of South Australia methodology, Section 3. GeographicAnalysis and Research Unit, Department of Housing and Urban Development.To determine soil texture take a small handful of soil below <strong>the</strong> crust and add water working <strong>the</strong> soil into aan elongated ball (bolus) until it just fails to stick to <strong>the</strong> fingers. The behaviour of <strong>the</strong> bolus and of <strong>the</strong> ribbonproduced by shearing (pressing out) between <strong>the</strong> thumb and <strong>for</strong>efinger characterise <strong>the</strong> texture. Thebehaviour and feel, smoothness or graininess, during bolus <strong>for</strong>mation are also indicative of its texture.Sand: Coherence nil to very slight, cannot be moulded. Sand grains of medium size, single sand grainsadhere to fingers. Commonly less than 5% clay content.Loam: Bolus coherent and ra<strong>the</strong>r spongy, smooth feel when manipulated but with no obvious sandiness.May be somewhat greasy to <strong>the</strong> touch if organic matter in present. Will <strong>for</strong>m a ribbon of about 25mm.Clay Loam, Sandy: Coherent plastic bolus with medium size sand grains visible within a finer matrix,<strong>for</strong>ms a ribbon between 40-50mm. Clay contents between 30% – 35%.Medium clay: Smooth plastic bolus, can be moulded into rods without fracture. Will <strong>for</strong>m a ribbon of 75mm or more. Clay contents between 45% - 55%.Medium heavy clay: Same properties as medium clay but with a higher clay content of 50% or more.Loamy sand: Slight coherence, sand grains of medium size, can be sheared between thumb and<strong>for</strong>efinger to give minimal ribbon of about 5 mm. Approximate clay content of about 5%.Silty loam: Coherent bolus, smooth, often silky when manipulated, will <strong>for</strong>m a ribbon of about 25mm.Clay content between 25% with 25% or more of silt.Silty clay loam: Coherent smooth bolus, plastic and often silky to <strong>the</strong> touch, will <strong>for</strong>m a ribbon of 40-50mm. Clay contents between 30%-35% and with silt 25% or more.Clayey sand: Slight coherence, sand grains of medium size, sticky when wet, many sand grains stick tofingers. Will <strong>for</strong>m a minimal ribbon of 5-15 mm, discolours fingers with clay stain. Clay contents between5%-10%.Sandy clay loam: Strongly coherent bolus, sandy to touch, medium size grains visible in finer matrix, will<strong>for</strong>m ribbon of 25 – 40mm. Clay contents between 20% - 30%.Light clay: Plastic bolus, smooth to touch, slight resistance to shearing between thumb and <strong>for</strong>e finger,will <strong>for</strong>m ribbon of 50 – 75 mm. Clay content between 35% - 40%.Heavy Clay: Smooth plastic bolus, handles like stiff plasticine, can be moulded into rods without fracture,has firm resistance to ribboning shear. Will <strong>for</strong>m a ribbon of 75 mm or more. Clay contents of 50% ormore.Sandy loam: Bolus coherent but very sandy to touch, will <strong>for</strong>m a ribbon of 15-25 mm, dominant sandgrains are of medium size and are readily visible. Clay contents between 10% - 20%.62
Clay loam: Coherent plastic bolus, smooth to manipulate and will <strong>for</strong>m a ribbon of 40 – 50 mm. Claycontents between 30% and 35%.Light medium clay: Plastic bolus, smooth to touch, slight to moderate resistance to ribboning shear, will<strong>for</strong>m a ribbon of about 75 mm.Peat: Brownish or blackish fibrous substance produced by anaerobic decay of vegetation and found inboggy areas.Comments: Any comments regarding soil structure, surface materials, rock contents or o<strong>the</strong>r soil attributes.Source of water supply: The main sources of water that enter <strong>the</strong> water body, most commonly acombination of catchment run-off, ground-water and rainfall.Rainfall estimate: Isohyet in<strong>for</strong>mation gained from <strong>the</strong> Bureau of Meteorology <strong>for</strong> annual average rainfall.Also easily accessed by overlaying GIS isohyet in<strong>for</strong>mation on <strong>the</strong> wetlands.Dominant riparian vegetation association: Describes <strong>the</strong> dominant or co-dominant over storey speciesand understorey species.Significance – why <strong>the</strong> wetland is important: Details any significance of <strong>the</strong> wetland within its regionalsetting or ecological function.Noteworthy flora: Threatened species: threatened flora at national or State level that occur on <strong>the</strong> site(includes any threatened species identifies under national or State legislation, ANZECC lists or actionplans). Composition in<strong>for</strong>mation on <strong>the</strong> composition of any plant species or communities <strong>for</strong> which <strong>the</strong>wetland is particularly important.Noteworthy fauna: Threatened species: list of threatened fauna at national or State level that are presentat <strong>the</strong> site. (includes any threatened species identifies under national or State legislation, ANZECC lists oraction plans). Composition: in<strong>for</strong>mation regarding composition of important fauna that may inhabit <strong>the</strong>wetland permanently or seasonally including migratory species. An indication of population sizes, breedingcolonies, migration stopovers is also given where available.Land Degradation: disturbances or threats are defined as any direct or indirect human activities at <strong>the</strong> siteor in <strong>the</strong> site or in <strong>the</strong> catchment area that may have a detrimental effect on <strong>the</strong> ecological character of <strong>the</strong>wetland. The effect may be a low level disturbance (eg low level grazing) or a major threat (eg waterdiversion schemes). Examples include disturbance by stock, water extraction, river regulation, siltation,salinity, urban development, drainage, pollution, excessive human activity, and impact of invasive species.There are several typical types of land degradation that may affect wetlands; <strong>the</strong>se are listed as a standardtemplate within <strong>the</strong> survey.• Access tracks • Borrow pits/Quarry• Cleared land • Drains• Fire breaks • Fence lines• Off-Road vehicles • Power lines• Rubbish dumping • Slashing/clearance• Pollution • Watering points• Pest vertebrate presence • Grazing damage• Altered water flows • <strong>Wetland</strong> drainageComments: Clarification of <strong>the</strong> severity of <strong>the</strong> threats and o<strong>the</strong>r comments.Potential disturbances: Any threats that could impact on <strong>the</strong> wetland in <strong>the</strong> future, <strong>for</strong> example, a plannedchange in adjoining land use.63
Conservation measures taken and measures proposed: Details of conservation measures beingundertaken at <strong>the</strong> site (<strong>for</strong> example, fencing or revegetation) and <strong>the</strong> names of any protected areasestablished at or around <strong>the</strong> wetland. Details of management plans <strong>for</strong> <strong>the</strong> site and status of <strong>the</strong> site interms of National Estate, Ramsar or World Heritage listing can also be included.Current scientific research: Outline any research activities by scientific bodies such as CSIRO oruniversities or o<strong>the</strong>r recognised research organisations.Current conservation education: Documents <strong>the</strong> existence of interpretive facilities, use of <strong>the</strong> area byschool groups or o<strong>the</strong>r organisations.Recreation and tourism: Records recreation facilities present on <strong>the</strong> site and if <strong>the</strong>re are tourism uses orvalues with <strong>the</strong> site.Social and Cultural Values: Documents pre-European and European historical and social values of <strong>the</strong>site.References: Lists relevant references associated with <strong>the</strong> site.Aquatic Vegetative ClassesThis parameter provides a snap shot of aquatic vegetation structure, vegetation classes recorded include:• Algal • Floating vascular• Aquatic moss • Unknown submergent• Rooted vascular • Unknown surface• Floating leavedAquatic Flora SampleRecords any aquatic vegetation sample collected with <strong>the</strong> wetland number, wetland name, GPS location,and habitat location. Samples should be placed into a snap lock plastic bag with water and labels placedinside and outside <strong>the</strong> bag. If field trips are longer than <strong>for</strong> one day, samples should be dried and pressedthat day. Pressed samples will need <strong>the</strong> paper changed every o<strong>the</strong>r day to avoid <strong>the</strong> specimen rotting. ThePlant Biodiversity Centre can assist with plant identification and a good reference books <strong>for</strong> aquatic plantidentification include Waterplants in Australia by G.R. Sainty (1994) and Aquatic and wetland plants by NickRomanowski (1998).Aquatic Fauna SampleCollecting Sample Material: This is achieved by two methods.1. Plankton Net. This is a small round net of approx. 200-250um pore size. Attached to <strong>the</strong> net is a lengthof string. One end of <strong>the</strong> string is tied to <strong>the</strong> plankton net. The o<strong>the</strong>r should be tied to <strong>the</strong> user of <strong>the</strong> net.The net is thrown into <strong>the</strong> water and is pulled through <strong>the</strong> water, towards <strong>the</strong> user. This procedure is doneseveral times until sufficient sample material is collected.If <strong>the</strong> water is too shallow <strong>the</strong>n <strong>the</strong> net may be used by holding <strong>the</strong> metal rim and scooped through <strong>the</strong>water until sufficient sample material is collected in <strong>the</strong> plastic vial at <strong>the</strong> end of <strong>the</strong> net.The sample material is <strong>the</strong>n transferred from <strong>the</strong> sample vial to ano<strong>the</strong>r vial, and 40% <strong>for</strong>malin is added to<strong>the</strong> sample to make up a mixture of approx.10% Formalin and 90% sample fluid.2. Hand Net. The use of <strong>the</strong> hand net is a simple method. This is used in weedy habitats or shallow areaswhere <strong>the</strong> plankton net may become stuck or lost on objects. The net is used to prod at <strong>the</strong> base ofvegetation and is run closely to <strong>the</strong> bottom of shallow water bodies. This is done over approx. 10-20 metresdistance to obtain a representative sample from <strong>the</strong> water body.64
The material in <strong>the</strong> net <strong>the</strong>n is transferred to one or two sample vials.Washing <strong>the</strong> Nets: This is done between sampling of each site in an attempt to clean <strong>the</strong> net ofinvertebrates to stop cross “contamination” of samples between sites. Cleaning of <strong>the</strong> net between sites isachieved by simply washing <strong>the</strong> net in <strong>the</strong> water of <strong>the</strong> site, without <strong>the</strong> sample vial attached. Ideally thisshould be done be<strong>for</strong>e and after a sample is taken.Labelling Sample Vials: This is extremely important and should be done in a legible manner. The labelshould clearly and legibly be written upon and in<strong>for</strong>mation recorded should be clearly stated.In<strong>for</strong>mation recorded includes:• <strong>Wetland</strong> number• Name of wetland• Date of Sample• Grid Reference of site• Method of collection (hand net or plankton net).Material preservation of sample: material collected should be preserved with approximately 10% <strong>for</strong>malin assoon as possible after <strong>the</strong> sample is collected. This stops decomposition of <strong>the</strong> sample and also many of<strong>the</strong> invertebrates from eating each o<strong>the</strong>r. Formalin is used as many of <strong>the</strong> microinvertebrates become softand mushy, denaturing in <strong>the</strong> 70% alcohol solution, used to preserve macroinvertebrates and vertebrates.The <strong>for</strong>malin supplied is 40% by volume. This should be added to <strong>the</strong> sample material to make upapproximately 10% <strong>for</strong>malin and 90% sample material. This is only a guide and should be used by <strong>the</strong>sampler with a degree of care.Formalin is a dangerous chemical and is a fixative. Do not inhale it and wash your hands after usethoroughly. Read instructions on <strong>the</strong> label be<strong>for</strong>e use.Water phys-chemistryFive standard water chemistry parameters are collected; <strong>the</strong>se are described below.PH : is recorded using a Hanna HI 9025 pH meter. The meter is placed into <strong>the</strong> water body (ensuringthat <strong>the</strong> probes do not touch <strong>the</strong> substrate). The reading is <strong>the</strong>n given on <strong>the</strong> display. Calibration andmaintenance of <strong>the</strong> pH unit is often needed, <strong>the</strong>se procedures are outlined in <strong>the</strong> pH manual suppliedwith <strong>the</strong> unit.Conductivity: is recorded using a Hanna HI 9635 meter. This meter can measure in <strong>the</strong> 0 to 199 µS/cmrange. It can be used to measure any sample from deionised water to highly saline water. The meter isplaced in <strong>the</strong> water body ensuring that <strong>the</strong> probe does not touch <strong>the</strong> substrate and <strong>the</strong> reading is givenon <strong>the</strong> display when stable. Calibration and maintenance procedures required are outlined in <strong>the</strong> manual.Turbidity: is recorded using a Hanna HI 93703 portable microprocessor turbidity meter. The unit isdesigned to per<strong>for</strong>m measurements according to <strong>the</strong> ISO 7027 International Standard. The instrumentfunctions by passing a beam of light through a vial containing <strong>the</strong> sample being measured. A sensor,positioned at 90º with respect to <strong>the</strong> direction of light, detects <strong>the</strong> amount of light scattered by <strong>the</strong>undissolved particles present in <strong>the</strong> sample. These readings are given in NTU units. The manualaccompanying <strong>the</strong> unit outlines measurement, calibration and maintenance procedures.Dissolved O²: is recorded using a Hanna HI 9142 dissolved oxygen meter. Dissolved oxygen is indicatedin tenths of parts per million (ppm=mg/l). The dissolved oxygen probe has a membrane covering <strong>the</strong>polarographic sensors and a built in <strong>the</strong>rmistor <strong>for</strong> temperature measurements and compensation. Thethin permeable membrane isolates <strong>the</strong> sensor elements from <strong>the</strong> testing solution, but allows oxygen toenter. When a voltage is applied across <strong>the</strong> sensor, oxygen that has passed through <strong>the</strong> membranereacts causing current to flow, allowing <strong>the</strong> determination of oxygen content.65
Water Temperature: Water temperature is read from <strong>the</strong> pH or Dissolved Oxygen meter.Rapid assessment (conservation values)The rapid assessment component of <strong>the</strong> survey provides a quick snap shot of <strong>the</strong> vegetation associationsand condition within different riparian habitats. O<strong>the</strong>r parameters such as aquatic fauna and wetlandcondition is also recorded.Aquatic Fauna: is a subjective score according to <strong>the</strong> abundance and diversity of invertebrates, fish andbirds located within or on <strong>the</strong> water body. Low (1) refers to no fish or birds with little or no invertebrate presence. Moderate (3) refers to some bird presence and good vertebrate abundance, fish usually are not present. High (5) indicates good bird and invertebrate diversity and abundance with <strong>the</strong> presence of fish.Aquatic Vegetation: records <strong>the</strong> abundance and diversity of aquatic vegetation. Low (1) indicates no or very little aquatic vegetation. Moderate (3) indicates some aquatic vegetation cover ei<strong>the</strong>r in <strong>the</strong> <strong>for</strong>m of floating or rooted vegetation. High (5) indicates good diversity of aquatic vegetation with a range of rooted vegetation such as reedsand rushes and floating vegetation such as water ribbons.Riparian VegetationRiparian vegetation is assessed at three zones, <strong>the</strong>se are <strong>the</strong> toe of bank (Low water – High water), bank (high water mark – buffer) and buffer (top of <strong>the</strong> bank to <strong>the</strong> buffer which can extend between 10 meters and 100 meters).The vegetation association <strong>for</strong> each zone consists of <strong>the</strong> dominant or co-dominant over storey species andunderstorey species. The vegetation association <strong>for</strong> each zone is scored considering <strong>the</strong> level ofdisturbance and vegetation cover within each zone.The vegetation association scoring system consists of: Degraded or no vegetation (1) with less than 30% vegetation cover, with high level of disturbance. Natural (3) between 30 – 75% vegetation cover, with little disturbance. Intact (5) over 75% vegetation cover with little or no disturbance.<strong>Wetland</strong> ConditionThe wetland score should reflect <strong>the</strong> previous rapid assessment scores <strong>for</strong> aquatic fauna, aquaticvegetation and riparian vegetation values. The combination of <strong>the</strong>se values and <strong>the</strong> interpretation of o<strong>the</strong>rsparameters recorded during <strong>the</strong> survey (such as land degradation and water chemistry) <strong>for</strong>m <strong>the</strong> basis of<strong>the</strong> wetland condition score.The wetland score consists of: Degraded (1) those sites that have a high level of disturbance and received low rapid assessmentscores. Natural (3) those sites that have little disturbance, received moderate to high rapid assessment scoresand that are sites usually protected within <strong>the</strong> reserve system or by private conservation.66
Pristine (5) those sites with no obvious sign of disturbance, scored very highly in <strong>the</strong> rapid assessmentand are <strong>for</strong>mally conserved within <strong>the</strong> reserve system.67
Photographic recordsPhotographic records <strong>for</strong> this survey have been recorded by digital camera in JPEG and BITMAP <strong>for</strong>mat.The following records should be kept when using a digital camera. It is recommended that a Laptopcomputer be taken on surveys <strong>for</strong> ease of cataloguing photographs.All pictures need <strong>the</strong> following in<strong>for</strong>mation recorded:• Picture number and wetland number• Direction and features if relevant• Photographer name and date.ANZECC wetland criteriaThis criteria is used <strong>for</strong> determining nationally important wetlands in Australia, and <strong>for</strong>m <strong>the</strong> bases <strong>for</strong> <strong>the</strong>inclusion in <strong>the</strong> Directory. These criteria are those agreed to by <strong>the</strong> ANZECC <strong>Wetland</strong>s Network in 1994.A wetland may be considered nationally important if it meets at least one of <strong>the</strong> following criteria:• It is a good example of a wetland type occurring within a biogeographic region in Australia.• It is a wetland which plays an important ecological or hydrological role in <strong>the</strong> natural functioning of amajor wetland system/complex.• It is a wetland which is important as <strong>the</strong> habitat <strong>for</strong> animal taxa at a vulnerable stage in <strong>the</strong>ir life cycles,or provides a refuge when adverse conditions such as drought prevail.• The wetland supports 1% or more of <strong>the</strong> national populations of any native plant or animal taxa.• The wetland supports native plant or animal taxa or communities which are considered endangered orvulnerable at <strong>the</strong> national level.• The wetland is of outstanding historical or cultural significance.Many of <strong>the</strong> sites in <strong>the</strong> Directory meet more than one of <strong>the</strong> criteria. Application of <strong>the</strong> criteria to individualwetland sites involves a degree of subjectivity. Not only may certain aspects of a site’s significance beinterpreted differently by different investigators, but in<strong>for</strong>mation gaps often exist which make it difficult tojudge whe<strong>the</strong>r or not a site meets a particular criterion.The Interim Biogeographic Regionalisation <strong>for</strong> Australia (IBRA) is used as <strong>the</strong> framework <strong>for</strong> applyingCriterion 1, which identifies wetlands that are unique or representative within a biogeographic region inAustralia.<strong>Wetland</strong> typeThe definition of a wetland used in <strong>the</strong> survey is one adopted by <strong>the</strong> Ramsar convention under Article 1.1.“<strong>Wetland</strong>s are areas of marsh, fen, peatland or water, whe<strong>the</strong>r natural or artificial, permanent of temporary,with water that is static or flowing, fresh, brackish or salt, including areas of marine water <strong>the</strong> depth of whichat low tide does not exceed six meters.”Within this definition, <strong>the</strong> wetland classification system used in <strong>the</strong> Directory of Important <strong>Wetland</strong>sidentifies 40 different wetland types in three categories: A-Marine and Coastal Zone wetlands, B-Inlandwetlands, and C-Human-made wetlands. This wetland survey does not include Category A – Marine andCoastal Zone wetlands .68
The system is based on that used by <strong>the</strong> Ramsar Convention in describing <strong>Wetland</strong>s of InternationalImportance, but was modified slightly to suit <strong>the</strong> Australian situation.A – Marine and Coastal Zone wetlands• Marine waters - permanent shallow waters less than six metres deep at low tide, includes sea bays straits• Subtidal aquatic beds, includes kelp beds, sea-grasses, tropical marine meadows• Coral reefs• Rocky marine shores, includes rocky offshore islands, sea cliffs• Sand, shingle or pebble beaches, includes sand bars, spits, sandy islets• Estuarine waters, permanent waters of estuaries and estuarine systems of deltas• Intertidal mud, sand or salt flats• Intertidal marshes, includes salt marshes, salt meadows, saltings, raised salt marshes, tidal brackish andfreshwater marshes• Intertidal <strong>for</strong>ested wetlands, includes mangrove swamps, nipa swamps, tidal freshwater swamps <strong>for</strong>ests• Brackish to saline lagoons and marshes with one or more relatively narrow connections with <strong>the</strong> sea• Freshwater lagoons and marshes in <strong>the</strong> coastal zone• Non tidal freshwater <strong>for</strong>ested wetlandsB – Inland wetlands• Permanent rivers and streams includes waterfalls• Seasonal and irregular rivers and streams• Inland deltas(permanent)• Riverine floodplains, includes river flats, flooded river basins, seasonally flooded grassland, savanna andpalm savanna• Permanent freshwater lakes (8 ha) includes large oxbow lakes• Seasonal/intermittent freshwater lakes (>8 ha) floodplain lakes• Permanent saline /brackish lakes• Seasonal/intermittent saline lakes• Permanent freshwater ponds (