3.1 Agency ExpendituresThis section <strong>of</strong> the Resource Book presents how the expenditures <strong>of</strong> the agency ororganizations responsible for managing a park, river, trail, or greenway can contribute tothe local economy. Agency expenditures contribute to economic activity by providingpayrolls <strong>and</strong> support to a myriad <strong>of</strong> businesses. Some <strong>of</strong> the major economic sectors thatagency expenditures support include utility services, insurance, vehicles, sporting goods,lumber <strong>and</strong> building materials, legal agencies <strong>and</strong> service, chemical lubricant <strong>and</strong> gasolinesupplies, food purchases, <strong>and</strong> playground equipment.3.1.1 Level <strong>of</strong> ExpendituresThe managing organizations support the local <strong>and</strong> regional economy by providing jobs <strong>and</strong>purchasing supplies <strong>and</strong> services to develop, operate, <strong>and</strong> maintain parks or trails <strong>and</strong>conduct related improvements. Expenditures can be made for capital outlay, currentoperations, interest on debt, <strong>and</strong> insurance benefits, among other things. Benefits to thelocal community are greater if supplies <strong>and</strong> services are purchased from local businesses.The following examples illustrate the level <strong>of</strong> expenditures which potentially impact thelocal community. The American River Parkway in California accounted for nearly $5 million inexpenditures by the County <strong>of</strong> Sacramento Department <strong>of</strong> Regional <strong>Parks</strong>,Recreation <strong>and</strong> Open Space in fiscal year 2003-04.The American River Parkwayis comprised <strong>of</strong> 6,035 acres <strong>of</strong> l<strong>and</strong> <strong>and</strong> water with five major day use park sites,several group campsites, a nature center, two golf courses, numerous riveraccess points <strong>and</strong> boat launch ramps, <strong>and</strong> 62 miles for walking, biking <strong>and</strong>horseback riding. Approximately $1,096,770 <strong>of</strong> the expenditures was made forservices <strong>and</strong> supplies, <strong>and</strong> $3,807,016 for personnel salaries <strong>and</strong> benefits.Expenditures for services <strong>and</strong> supplies range from pr<strong>of</strong>essional planningservices to paper products. Personnel include permanent <strong>and</strong> part-timemaintenance staff to provide trash pick up, litter removal, restroom cleaning,trail maintenance, regular mowing <strong>of</strong> turfed areas, cleaning <strong>of</strong> picnic sites, <strong>and</strong>general maintenance <strong>of</strong> park facilities; park interpretive specialist staff toprovide interpretive <strong>and</strong> educational programs at the nature center; <strong>and</strong> ParkRanger peace <strong>of</strong>ficer staff to provide law enforcement along the Parkway(American River Parkway, 2004). The city <strong>of</strong> Boulder, CO <strong>Greenways</strong> system is comprised <strong>of</strong> a series <strong>of</strong> corridorsalong riparian areas. The <strong>Greenways</strong> Capital Improvements Program (CIP)budget is $450,000 annually <strong>and</strong> the Streets <strong>and</strong> Bikeways Maintenance workgroup has a budget <strong>of</strong> $267,388 per year including personnel expenses formaintaining the 28.5 miles <strong>of</strong> both <strong>Greenways</strong> <strong>and</strong> non-<strong>Greenways</strong> paths.Finally, the Transportation Division’s budget for major maintenance <strong>of</strong>bikeways in Boulder is $175,000. This is utilized to replace bridges <strong>and</strong>significant sections <strong>of</strong> paths (<strong>Greenways</strong> 2005 - 2010 Capital ImprovementsProgram). Several California agencies were surveyed to determine the average cost9
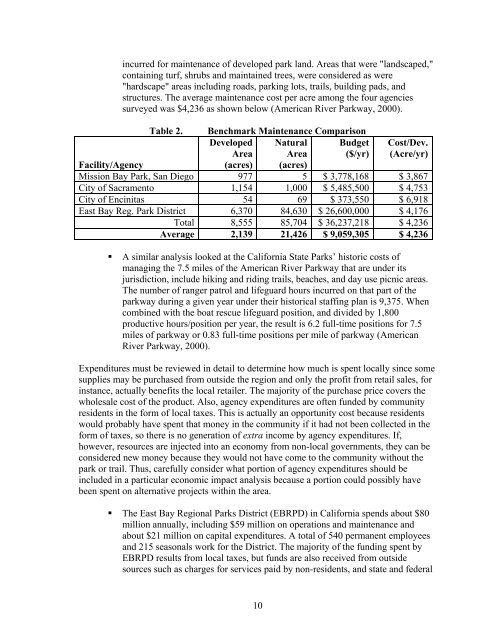
incurred for maintenance <strong>of</strong> developed park l<strong>and</strong>. Areas that were "l<strong>and</strong>scaped,"containing turf, shrubs <strong>and</strong> maintained trees, were considered as were"hardscape" areas including roads, parking lots, trails, building pads, <strong>and</strong>structures. The average maintenance cost per acre among the four agenciessurveyed was $4,236 as shown below (American River Parkway, 2000).Table 2.Benchmark Maintenance ComparisonDeveloped Natural BudgetArea Area ($/yr)(acres) (acres)Cost/Dev.(Acre/yr)Facility/AgencyMission Bay Park, San Diego 977 5 $ 3,778,168 $ 3,867City <strong>of</strong> Sacramento 1,154 1,000 $ 5,485,500 $ 4,753City <strong>of</strong> Encinitas 54 69 $ 373,550 $ 6,918East Bay Reg. Park District 6,370 84,630 $ 26,600,000 $ 4,176Total 8,555 85,704 $ 36,237,218 $ 4,236Average 2,139 21,426 $ 9,059,305 $ 4,236A similar analysis looked at the California State <strong>Parks</strong>’ historic costs <strong>of</strong>managing the 7.5 miles <strong>of</strong> the American River Parkway that are under itsjurisdiction, include hiking <strong>and</strong> riding trails, beaches, <strong>and</strong> day use picnic areas.The number <strong>of</strong> ranger patrol <strong>and</strong> lifeguard hours incurred on that part <strong>of</strong> theparkway during a given year under their historical staffing plan is 9,375. Whencombined with the boat rescue lifeguard position, <strong>and</strong> divided by 1,800productive hours/position per year, the result is 6.2 full-time positions for 7.5miles <strong>of</strong> parkway or 0.83 full-time positions per mile <strong>of</strong> parkway (AmericanRiver Parkway, 2000).Expenditures must be reviewed in detail to determine how much is spent locally since somesupplies may be purchased from outside the region <strong>and</strong> only the pr<strong>of</strong>it from retail sales, forinstance, actually benefits the local retailer. The majority <strong>of</strong> the purchase price covers thewholesale cost <strong>of</strong> the product. Also, agency expenditures are <strong>of</strong>ten funded by communityresidents in the form <strong>of</strong> local taxes. This is actually an opportunity cost because residentswould probably have spent that money in the community if it had not been collected in theform <strong>of</strong> taxes, so there is no generation <strong>of</strong> extra income by agency expenditures. If,however, resources are injected into an economy from non-local governments, they can beconsidered new money because they would not have come to the community without thepark or trail. Thus, carefully consider what portion <strong>of</strong> agency expenditures should beincluded in a particular economic impact analysis because a portion could possibly havebeen spent on alternative projects within the area. The East Bay Regional <strong>Parks</strong> District (EBRPD) in California spends about $80million annually, including $59 million on operations <strong>and</strong> maintenance <strong>and</strong>about $21 million on capital expenditures. A total <strong>of</strong> 540 permanent employees<strong>and</strong> 215 seasonals work for the District. The majority <strong>of</strong> the funding spent byEBRPD results from local taxes, but funds are also received from outsidesources such as charges for services paid by non-residents, <strong>and</strong> state <strong>and</strong> federal10
- Page 1: ECONOMIC IMPACTS OF PARKS, RIVERS,
- Page 4 and 5: AcknowledgementsI am grateful to ma
- Page 6 and 7: 3.5.5 Sources of Information.......
- Page 8 and 9: Table 28. Hiking/Walking Organizati
- Page 10 and 11: 1 IntroductionParks, rivers, trails
- Page 12 and 13: Table 1.SectionAgency ExpendituresC
- Page 14 and 15: provide communities with economic,
- Page 16 and 17: the most current information on the
- Page 20 and 21: grants. About 25% of capital expend
- Page 22 and 23: The Marin Conservation Corps (MCC)
- Page 24 and 25: already been implemented and is ope
- Page 26 and 27: Table 5.Net Benefit Per Participant
- Page 28 and 29: WEST VIRGINIAWISCONSINEarthCorpsFed
- Page 30 and 31: contracts that gross over $800 mill
- Page 32 and 33: 3.2.2 Special EventsRevenue enhanci
- Page 34 and 35: park experience to an audience who
- Page 36 and 37: you have the opportunity to determi
- Page 38 and 39: Use good survey methods. The better
- Page 40 and 41: California. A Report to The Sierra
- Page 42 and 43: powered activities 3 , a participan
- Page 44 and 45: Table 11. 2003 Sport Footwear Purch
- Page 46 and 47: 3.3.4 Fish and Wildlife-Related Rec
- Page 48 and 49: EQUIPMENT AND OTHER EXPENSESTotal $
- Page 50 and 51: Table 17. Estimates of Retail Expen
- Page 52 and 53: Table 19. U.S. Ski & Snowboard Indu
- Page 54 and 55: and from services related to the Pa
- Page 56 and 57: o $60 million in Harris County, TX,
- Page 58 and 59: League ofAmericanBicyclistsNational
- Page 60 and 61: SportingGoodsManufacturersAssociati
- Page 62 and 63: necessarily better, especially in s
- Page 64 and 65: Perspective. Available at http://ww
- Page 66 and 67: o Washington: $209 milliono West Vi
- Page 68 and 69:
Economic Output Retail Sales Salari
- Page 70 and 71:
Economic Output Retail Sales Salari
- Page 72 and 73:
Table 35. Economic Impact of Sportf
- Page 74 and 75:
All Anglers Non-Resident/Tourist An
- Page 76 and 77:
Table 37. Per Capita Travel Receipt
- Page 78 and 79:
their decision to return in the fut
- Page 80 and 81:
Table 39. Visitors and Spending in
- Page 82 and 83:
2003). Data from California Departm
- Page 84 and 85:
over 2003, despite high gas prices,
- Page 86 and 87:
management changes or actions are e
- Page 88 and 89:
accommodations used, and other trip
- Page 90 and 91:
http://www.ncdot.org/transit/bicycl
- Page 92 and 93:
3.5 Estimating the Effects of Spend
- Page 94 and 95:
“leakage” of money from the reg
- Page 96 and 97:
Keep in mind that multipliers are s
- Page 98 and 99:
3.5.4 How to Use These Rationales i
- Page 100 and 101:
economy, only those expenditures th
- Page 102 and 103:
For example, be aware of the differ
- Page 104 and 105:
3.6 Health Care and FitnessThis sec
- Page 106 and 107:
active, approximately $575 million
- Page 108 and 109:
already had one heart attacko Impro
- Page 110 and 111:
uilt as part of sound policy to pro
- Page 112 and 113:
accounting for 14 million disabilit
- Page 114 and 115:
park amenities available or do not
- Page 116 and 117:
National Coalitionfor PromotingPhys
- Page 118 and 119:
100% of all health benefits to a si
- Page 120 and 121:
Pratt M, Macera CA, Wang G. 2000. H
- Page 122 and 123:
costs than normal weight; moderate
- Page 124 and 125:
References for Additional Informati
- Page 126 and 127:
3.7 Benefit EstimationParks, rivers
- Page 128 and 129:
Table 47.Forecasted Average Benefit
- Page 130 and 131:
Table 48.CriteriaRecreationExperien
- Page 132 and 133:
people using carefully designed and
- Page 134 and 135:
special government funds for causes
- Page 136 and 137:
Loomis, J. B., and White, D.S. 1996
- Page 138 and 139:
Economic Assessment for the Necedah
- Page 140 and 141:
Commercial UsesExpenditures byResid
- Page 142 and 143:
Outcomes Expenditures by GGNRA mana
- Page 144 and 145:
local transportation admissions and
- Page 146 and 147:
3.8.8 Educational ValueWhile it may
- Page 148 and 149:
the same municipality that are furt
- Page 150 and 151:
that do require storm water managem
- Page 152 and 153:
Summary of ActionsSimilar to corpor
- Page 154 and 155:
3.9 Resource Book AppendicesSeveral
- Page 156 and 157:
6. Spending in the area. Please rep
- Page 158 and 159:
local economy aren’t bringing in
- Page 160 and 161:
4 ConclusionIn 1995, the National P