


Create successful ePaper yourself
Turn your PDF publications into a flip-book with our unique Google optimized e-Paper software.
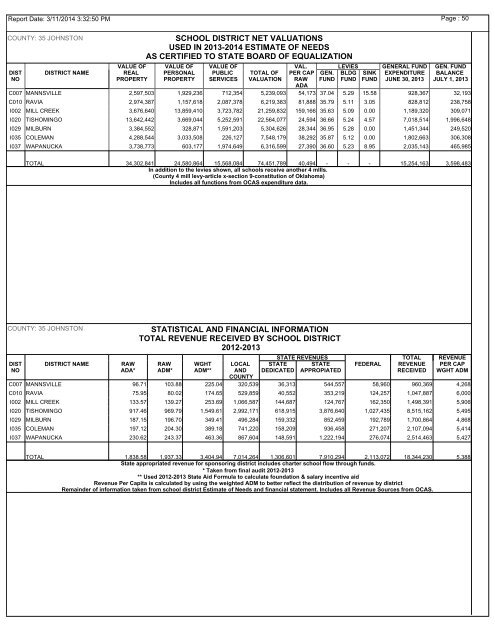
<strong>Report</strong> Date: 3/11/2014 3:32:50 PMPage : 50COUNTY: 35 JOHNSTONDISTNODISTRICT NAMESCHOOL DISTRICT NET VALUATIONSUSED IN 20<strong>13</strong>-2014 ESTIMATE OF NEEDSAS CERTIFIED TO STATE BOARD OF EQUALIZATIONVALUE OF VALUE OF VALUE OF VAL. LEVIES GENERAL FUND GEN. FUNDREAL PERSONAL PUBLIC TOTAL OF PER CAP GEN. BLDG SINK EXPENDITURE BALANCEPROPERTY PROPERTY SERVICES VALUATION RAW FUND FUND FUND JUNE 30, 20<strong>13</strong> JULY 1, 20<strong>13</strong>ADAC007 MANNSVILLE 2,597,503 1,929,236 712,354 5,239,093 54,173 37.04 5.29 15.58 928,367 32,193C010 RAVIA 2,974,387 1,157,618 2,087,378 6,219,383 81,888 35.79 5.11 3.05 828,812 238,758I002 MILL CREEK 3,676,640 <strong>13</strong>,859,410 3,723,782 21,259,832 159,166 35.63 5.09 0.00 1,189,320 309,071I020 TISHOMINGO <strong>13</strong>,642,442 3,669,044 5,252,591 22,564,077 24,594 36.66 5.24 4.57 7,018,514 1,996,648I029 MILBURN 3,384,552 328,871 1,591,203 5,304,626 28,344 36.95 5.28 0.00 1,451,344 249,520I035 COLEMAN 4,288,544 3,033,508 226,127 7,548,179 38,292 35.87 5.12 0.00 1,802,663 306,308I037 WAPANUCKA 3,738,773 603,177 1,974,649 6,316,599 27,390 36.60 5.23 8.95 2,035,143 465,985TOTAL 34,302,841 24,580,864 15,568,084 74,451,789 40,494 - - - 15,254,163 3,598,483In addition to the levies shown, all schools receive another 4 mIlls.(County 4 mill levy-article x-section 9-constitution of Oklahoma)Includes all functions from OCAS expenditure data.COUNTY: 35 JOHNSTONDISTNODISTRICT NAMERAWADA*STATISTICAL AND FINANCIAL INFORMATIONTOTAL REVENUE RECEIVED BY SCHOOL DISTRICT<strong>2012</strong>-20<strong>13</strong>RAWADM*WGHTADM**LOCALANDCOUNTYSTATE REVENUES TOTAL REVENUESTATE STATE FEDERAL REVENUE PER CAPDEDICATED APPROPIATEDRECEIVED WGHT ADMC007 MANNSVILLE 96.71 103.88 225.04 320,539 36,3<strong>13</strong> 544,557 58,960 960,369 4,268C010 RAVIA 75.95 80.02 174.65 529,859 40,552 353,219 124,257 1,047,887 6,000I002 MILL CREEK <strong>13</strong>3.57 <strong>13</strong>9.27 253.69 1,066,587 144,687 124,767 162,350 1,498,391 5,906I020 TISHOMINGO 917.46 969.79 1,549.61 2,992,171 618,915 3,876,640 1,027,435 8,515,162 5,495I029 MILBURN 187.15 196.70 349.41 496,284 159,332 852,459 192,789 1,700,864 4,868I035 COLEMAN 197.12 204.30 389.18 741,220 158,209 936,458 271,207 2,107,094 5,414I037 WAPANUCKA 230.62 243.37 463.36 867,604 148,591 1,222,194 276,074 2,514,463 5,427TOTAL 1,838.58 1,937.33 3,404.94 7,014,264 1,306,601 7,910,294 2,1<strong>13</strong>,072 18,344,230 5,388State appropriated revenue for sponsoring district includes charter school flow through funds.* Taken from final audit <strong>2012</strong>-20<strong>13</strong>** Used <strong>2012</strong>-20<strong>13</strong> State Aid Formula to calculate foundation & salary incentive aidRevenue Per Capita is calculated by using the weighted ADM to better reflect the distribution of revenue by districtRemainder of information taken from school district Estimate of Needs and financial statement. Includes all Revenue Sources from OCAS.