PDF Download Link (best for mobile devices) - Oceaneering
PDF Download Link (best for mobile devices) - Oceaneering
PDF Download Link (best for mobile devices) - Oceaneering
- No tags were found...

Create successful ePaper yourself
Turn your PDF publications into a flip-book with our unique Google optimized e-Paper software.
Financial Highlights($ in thousands, except per share amounts)2011 2010 % IncreaseRevenue $2,192,663 $1,917,045 14.4%Gross Margin 508,759 466,320 9.1%Operating Income 334,831 309,500 8.2%Net Income 235,658 200,531 17.5%Diluted Earnings Per Share $2.16 $1.82 18.7%For 2011 <strong>Oceaneering</strong> reported record earnings and EPS. We achieved <strong>best</strong> ever operating income from our ROV andSubsea Products segments. Our ability to produce outstanding results was largely attributable to our global focus ondeepwater and subsea completion activity.2011 ReviewOperationsWe achieved record ROV operatingincome <strong>for</strong> the eighth consecutive year.We funded organic growth andacquisition opportunities at a recordsettingpace. Our capital expenditureswere almost two-and-a-half times theaverage we invested during the previousfive years.Our investment in acquisitions wasthree times what we spent in totalduring the 2006 through 2010 period.These included the largest acquisitionin the history of the company.We secured a term field support vesselservices contract <strong>for</strong> work offshoreAngola commencing in February 2012.This contract represents a significantgeographic expansion with considerablebacklog <strong>for</strong> our Subsea Projects business.Share Per<strong>for</strong>manceOur share price rose 25% duringthe year.Our 2011 share price percentageincrease was larger than any of theother companies in the Oil ServiceSector Index (OSX), which bycomparison declined 12%.Our annual year-end share pricepercentage change has outper<strong>for</strong>medthe OSX in eight of the past ten years.Over this decade our stock price hasincreased on average 32% per year,twice that of the OSX.Our market capitalization reached$5 billion <strong>for</strong> the first time duringthe year.We initiated a regular quarterly cashdividend in May.2011 Annual Report 1
This is my first Letter to Shareholdersand I am pleased to report that we achievedrecord EPS in 2011. I am grateful <strong>for</strong> the<strong>Oceaneering</strong> team that continues to exceland make previous records history.Letter to ShareholdersM. Kevin McEvoyOur per<strong>for</strong>mance was largely attributable to ourglobal focus on deepwater and subsea completionactivity, and capability to supply a wide range of theservices and products required to support the safe ef<strong>for</strong>ts ofour customers. We are committed to our customers’ successand our results reflect their recognition of our ability toprovide value to them.Our results were highlighted by <strong>best</strong> ever operatingincome from our RemotelyOperated Vehicles (ROV) andSubsea Products segments.Compared to 2010, ROVresults improved on higherinternational demand <strong>for</strong>our services and the expansion of our fleet. Subsea Productsgrowth was broad-based, led by better umbilical plantthroughput, higher Installation and Workover Control Systemservices, and growth in demand <strong>for</strong> our subsea hardwareand tooling.In May we initiated a regular quarterly dividend of$0.15 per common share to return a portion of our earningsto our shareholders. This underscores our confidence in<strong>Oceaneering</strong>’s financial strength and future businessprospects. We believe this will not compromise our abilityto pursue organic growth and acquisition opportunities toexpand <strong>Oceaneering</strong>’s asset base and earnings capability.In fact, during the year we continued to fund theseopportunities at a record-setting pace. Our 2011 capitalexpenditures of $527 million were almost two-and-a-halftimes the average we invested during the previous five years.Our investment in acquisitions of $292 million was threetimes what we spent in total on acquisitions during the 2006through 2010 period.Our acquisitions included $220 million in late Decemberto purchase AGR Field Operations Holdings AS, a providerof asset integrity, maintenance, subsea engineering, and fieldoperations services, primarily to the oil and gas industry.This acquisition will significantly increase our Asset Integritybusiness, particularly in Norway, and provides us subseainspection tooling to offer in other geographic markets. Ourorganic growth investments in 2011 included upgrading andexpanding our ROV fleet, as we placed 24 new vehicles intoservice during the year, and completing the conversion ofthe Ocean Patriot to a dynamically positioned saturationdiving vessel.In addition to our capital expenditures, during 2011we repurchased 500,000 shares of our common stock <strong>for</strong>$17.5 million and paid $48.7 millionof cash dividends. Our balance sheetremained conservatively capitalized.At year end, we had approximately$100 million of cash, $120 million ofdebt, $180 million available underour revolving credit facility, and $1.6 billion of equity.2 <strong>Oceaneering</strong> International, Inc.
In December we secured a three-year field supportvessel services contract from BP <strong>for</strong> work offshore Angola,commencing in February 2012. Under the contract, projectmanagement, engineering, and two chartered vessels, eachequipped with two <strong>Oceaneering</strong> work class ROVs andassociated tooling, will be supplied. This contractrepresents a significant geographic expansion withconsiderable backlog <strong>for</strong> our Subsea Projects business.For 2012 our EPS guidance range is $2.45 to $2.65,as we expect another record earnings year. For our servicesand products, we anticipate continued internationaldemand growth and a moderate rebound in overallactivity in the U.S. Gulf of Mexico. Compared to 2011,we anticipate all of our operating business segmentswill achieve higher operating income.Looking beyond 2012, our belief that the oil andgas industry will continue to invest in deepwater remainsunchanged. A recentindustry report <strong>for</strong>ecaststotal annual worldwideexploration and productionspending to grow nearly50% by 2015, while capitalexpenditures on deepwater projects are projected to morethan double.Deepwater remains one of the <strong>best</strong> frontiers <strong>for</strong> addinglarge hydrocarbon reserves with high production flowrates at relatively low finding and development costs.There<strong>for</strong>e, we anticipate that demand <strong>for</strong> our deepwaterservices and products will continue to rise and believe ourbusiness prospects <strong>for</strong> the next several years are promising.Given our outlook, we plan to expand our ability toparticipate in the deepwater market by continuing to groworganically and making additional acquisitions. For 2012we <strong>for</strong>ecast generating over $550 million of earningsbe<strong>for</strong>e interest, taxes, depreciation and amortization(EBITDA). Our projected cash flow and our balance sheetprovide us with ample resources to invest in <strong>Oceaneering</strong>’sgrowth. Our capital expenditure estimate <strong>for</strong> 2012,excluding acquisitions, is $200 million to $225 million.We intend to look at acquisitions within our market nichesand would particularly like to expand our Subsea Productssegment offerings, especially where we can add a servicescomponent.This is an exciting time <strong>for</strong> <strong>Oceaneering</strong>. I recognize andthank our employees who accomplished our record results.Their commitment to safely providehigh-quality solutions to ourcustomers’ needs is the foundation<strong>for</strong> our continued success. Duringthe year our work<strong>for</strong>ce grew byabout 1,400 people, or 17%. We arelooking <strong>for</strong>ward to the contribution they will make to ouroperations and growth.In recognition of our record financial per<strong>for</strong>mance,actions we took to enhance shareholder value, and ourfuture business prospects, the price of <strong>Oceaneering</strong>’s stockrose by 25% during the year. Our share price percentageincrease was larger than any of theother companies in the Oil ServiceSector Index (OSX), which bycomparison declined 12%. Ourannual share price percentage changehas outper<strong>for</strong>med the OSX in eightof the past ten years. Over this decade our stock price hasincreased on average 32% per year, twice that of the OSX.During 2011 our market capitalization reached $5 billion.I was appointed to my current position in May afterserving <strong>Oceaneering</strong> <strong>for</strong> over 30 years in various capacities.I thank my predecessor, T. Jay Collins, <strong>for</strong> the greatcondition of our company at the time of my appointment.Jay remains on our Board of Directors and we look <strong>for</strong>wardto his continued contributions.I am looking <strong>for</strong>ward to leading <strong>Oceaneering</strong> toanother record year in 2012.M. Kevin McEvoyPresident and Chief Executive Officer2011 Annual Report 3
Directors and Officers<strong>Oceaneering</strong> LocationsDirectorsT. Jay CollinsFormer Chief Executive Officer of<strong>Oceaneering</strong> International, Inc.Jerold J. DesRocheAn Owner of National Power CompanyDavid S. HookerChairman of Houlder Limited, Ocean Hover Limitedand Avoco Secure Ltd., and a Director of Aminex plc andHelium Enterprises Ltd.John R. HuffChairman of <strong>Oceaneering</strong> International, Inc., and aDirector of KBR, Inc. and Suncor Energy Inc.D. Michael HughesOwner of The Broken Arrow Ranch and Affiliated BusinessesM. Kevin McEvoyPresident and Chief Executive Officer of<strong>Oceaneering</strong> International, Inc.Harris J. PappasPresident of Pappas Restaurants, Inc. and aDirector of Luby’s, Inc.Executive OfficersM. Kevin McEvoyPresident and Chief Executive OfficerMarvin J. MiguraExecutive Vice PresidentKnut EriksenSenior Vice President, Subsea ProductsW. Cardon GernerSenior Vice President, Chief Financial Officer andChief Accounting OfficerClyde W. HewlettSenior Vice President, Subsea ProjectsKevin F. KerinsSenior Vice President, ROVsDavid K. LawrenceVice President, General Counsel, and SecretaryCorporate Headquarters<strong>Oceaneering</strong> International, Inc.11911 FM 529Houston, Texas 77041-3000Telephone: (713) 329-4500Fax: (713) 329-4951Regional Headquarters<strong>Oceaneering</strong> International, Inc.5004 Railroad AvenueMorgan City, Louisiana 70380Telephone: (985) 329-3900Fax: (985) 329-3266<strong>Oceaneering</strong> International Services Limited<strong>Oceaneering</strong> HousePitmedden Road, DyceAberdeen AB21 0DP, ScotlandTelephone: (44-1224) 758500Fax: (44-1224) 758519<strong>Oceaneering</strong> International Dubai LLCAl Moosa Tower 2, Suite 15Sheikh Zayed RoadDubai, United Arab EmiratesTelephone: (971-4) 311-7500Fax: (971-4) 331-0800<strong>Oceaneering</strong> Advanced Technologies7001 Dorsey RoadHanover, Maryland 21076Telephone: (443) 459-3700Fax: (443) 459-3980Marine Production Systems do Brasil Ltda.Avenida Rio Branco, 123 / 14th FloorCentro – Rio de Janeiro, RJ20040-0005, BrasilTelephone: (55-21) 2517-7100Fax: (55-21) 2517-7102<strong>Oceaneering</strong> International Pte LtdNo. 1 Kwong Min RoadJurong, Singapore 628704Telephone: (65) 6261 3211Fax: (65) 6261 3230<strong>Oceaneering</strong> ASJåttåvågen, HinnaPB 80244068 StavangerNorwayTelephone: (47) 51 82 51 00Fax: (47) 51 82 52 90<strong>Oceaneering</strong> Australia Pty. Ltd.Level 4190 St. Georges TerracePerth, WA 6000AustraliaPhone: (61-8) 9463 5200Fax: (61-8) 9463 52994 <strong>Oceaneering</strong> International, Inc.
2011 Financial Section<strong>Oceaneering</strong> International, Inc.2011 Annual Report 5
PERFORMANCE GRAPHThe following graph compares our total shareholder return to the Standard & Poor's 500Stock Index ("S&P 500") and the weighted average return generated by a peer group fromDecember 31, 2006 through December 31, 2011. The peer group companies <strong>for</strong> thisper<strong>for</strong>mance graph are Global Industries, Ltd. (until its acquisition by Technip onDecember 1, 2011), Halliburton Company, McDermott International, Inc., Cal DiveInternational, Inc., Bristow Group Inc., Acergy S.A. (including after the combination ofAcergy S.A. and Subsea 7 Inc. to create Subsea 7 S.A. on January 7, 2011) andTidewater, Inc.It is assumed in the graph that: (1) $100 was invested in <strong>Oceaneering</strong> Common Stock, theS&P 500 and the Peer Group on December 31, 2006; (2) the peer group investment isweighted based on the market capitalization of each individual company within the peergroup at the beginning of each period; and (3) any dividends are reinvested. Theshareholder return shown is not necessarily indicative of future per<strong>for</strong>mance.$300$200$100$012/31/2006 12/31/07 12/31/08 12/31/09 12/31/10 12/31/11<strong>Oceaneering</strong> International, Inc. S&P 500 Index Peer GroupDecember 31,2006 2007 2008 2009 2010 2011<strong>Oceaneering</strong> 100.00 169.65 73.40 147.41 185.47 234.81S&P 500 100.00 105.49 66.46 84.05 96.71 98.76Peer Group 100.00 136.85 54.40 95.03 131.83 108.932011 Annual Report 7
<strong>Oceaneering</strong> Common StockOur common stock is listed on the New York Stock Exchange under the symbol OII. Wesubmitted to the New York Stock Exchange during 2011 a certification of our Chief ExecutiveOfficer regarding compliance with the Exchange's corporate governance listing standards. Wealso included as exhibits to our annual report on Form 10-K, as filed with the SEC, thecertifications of our principal executive officer and principal financial officer required underSection 302 of the Sarbanes-Oxley Act of 2002.In June 2011, we effected a two-<strong>for</strong>-one stock split in the <strong>for</strong>m of a stock dividend. All historicalshare and per share data in this annual report reflect this stock split.The following table sets out, <strong>for</strong> the periods indicated, the high and low sales prices <strong>for</strong> ourcommon stock as reported on the New York Stock Exchange (consolidated transaction reportingsystem):For the quarter ended:2011 2010High Low High LowMarch 31 $ 45.55 $ 34.72 $ 33.06 $ 25.65June 30 46.19 35.46 34.30 19.88September 30 45.04 32.71 27.46 21.55December 31 49.26 31.77 38.43 25.81On February 9, 2012, there were 376 holders of record of our common stock. On that date, theclosing sales price, as quoted on the New York Stock Exchange, was $52.45. In 2011, wedeclared quarterly cash dividends of $0.15 per share in each of the second, third and fourthquarters. It is our intent to continue to pay a quarterly cash dividend; however, payment of futurecash dividends will be at the discretion of our board of directors in accordance with applicablelaw, after taking into account various factors, including our financial condition, earnings, capitalrequirements, legal requirements, regulatory constraints, industry practice and any other factorsthat our board of directors believes are relevant.In February 2010, our Board of Directors approved a plan to repurchase up to 12,000,000 sharesof our common stock. Through December 31, 2011 under this plan, we repurchased 2,700,000shares of our common stock <strong>for</strong> $67.0 million. We did not repurchase any shares in the fourthquarter of 2011.8 <strong>Oceaneering</strong> International, Inc.
Selected Financial DataThe following table sets <strong>for</strong>th certain selected historical consolidated financial data and should beread in conjunction with Management's Discussion and Analysis of Financial Condition andResults of Operation and our Consolidated Financial Statements and Notes included in thisreport. The following in<strong>for</strong>mation may not be indicative of our future operating results.Results of Operations:Year Ended December 31,(in thousands, except per share amounts) 2011 2010 2009 2008 2007Revenue $ 2,192,663 $ 1,917,045 $ 1,822,081 $ 1,977,421 $ 1,743,080Cost of services and products 1,683,904 1,450,725 1,384,355 1,512,621 1,329,795Gross margin 508,759 466,320 437,726 464,800 413,285Selling, general and administrativeexpense 173,928 156,820 145,610 147,242 123,662Income from operations $ 334,831 $ 309,500 $ 292,116 $ 317,558 $ 289,623Net income $ 235,658 $ 200,531 $ 188,353 $ 199,386 $ 180,374Diluted earnings per share 2.16 1.82 1.70 1.78 1.61Depreciation and amortization,including impairment charges 151,227 153,651 122,945 115,029 93,776Capital expenditures, includingbusiness acquisitions 526,645 207,180 175,021 252,277 233,795Other Financial Data:As of December 31,(in thousands, except ratios) 2011 2010 2009 2008 2007Working capital ratio 1.96 2.24 2.25 2.09 1.98Working capital $ 482,747 $ 543,646 $ 485,592 $ 390,378 $ 331,594Total assets 2,400,544 2,030,506 1,880,287 1,670,020 1,531,440Long-term debt 120,000 — 120,000 229,000 200,000Shareholders’ equity 1,557,962 1,390,215 1,224,323 967,654 915,3102011 Annual Report 9
Management's Discussion and Analysis of Financial Condition and Results of OperationsCertain statements in this annual report, including, without limitation, statements regarding thefollowing matters are <strong>for</strong>ward-looking statements made pursuant to the safe harbor provisions ofthe Private Securities Litigation Re<strong>for</strong>m Act of 1995:• our business strategy;• our plans <strong>for</strong> future operations;• industry conditions;• our expectations about 2012 earnings per share and segment operating results, and thefactors underlying those expectations, including our expectations about demand <strong>for</strong> ourdeepwater oilfield services and products as a result of the factors we specify in the"Overview" below;• projections relating to floating rigs to be placed in service and subsea tree orders;• the adequacy of our liquidity and capital resources to support our operations andinternally generated growth initiatives;• our projected capital expenditures <strong>for</strong> 2012;• our plans to add ROVs to our fleet;• our belief that our goodwill will not be impaired during 2012;• the adequacy of our accruals <strong>for</strong> uninsured expected liabilities from workers'compensation, maritime employer's liability and general liability claims;• our belief that our total unrecognized tax benefits will not significantly increase ordecrease in the next 12 months;• our expectations about the cash flows from our investment in Medusa Spar LLC, andthe factors underlying those expectations;• our backlog; and• our expectations regarding the effect of inflation in the near future.These <strong>for</strong>ward-looking statements are subject to various risks, uncertainties and assumptions,including those we refer to under the headings "Risk Factors" and "Cautionary StatementConcerning Forward-Looking Statements" in Part I of our annual report on Form 10-K as filedwith the SEC. Although we believe that the expectations reflected in such <strong>for</strong>ward-lookingstatements are reasonable, because of the inherent limitations in the <strong>for</strong>ecasting process, aswell as the relatively volatile nature of the industries in which we operate, we can give noassurance that those expectations will prove to have been correct. Accordingly, evaluation ofour future prospects must be made with caution when relying on <strong>for</strong>ward-looking in<strong>for</strong>mation.OverviewThe table that follows sets out our revenue and operating results <strong>for</strong> 2011, 2010 and 2009.Year Ended December 31,(dollars in thousands) 2011 2010 2009Revenue $ 2,192,663 $ 1,917,045 $ 1,822,081Gross Margin 508,759 466,320 437,726Gross Margin % 23 % 24 % 24 %Operating Income 334,831 309,500 292,116Operating Income % 15 % 16 % 16 %Net Income 235,658 200,531 188,353During 2011, we generated approximately 89% of our revenue, and 96% of our operatingincome, from services and products we provided to the oil and gas industry. In 2011, ourrevenue increased by 14%, with the largest increase occurring in our Subsea Productssegment. Our Subsea Products segment revenue increased 40% from higher umbilical plantthroughput and specialty product sales.The $236 million consolidated net income we earned in 2011 was the highest in our history.The $35 million increase from 2010 net income was attributable to higher profit contributionsfrom our Subsea Products segment, which had $34 million more operating income on10 <strong>Oceaneering</strong> International, Inc.
$221 million more revenue, and our ROV segment, which had $13 million more operatingincome on $93 million more revenue.In 2011, we invested in the following major capital projects:• business acquisitions totaling $292 million, principally in our Asset Integrity and SubseaProducts segments;• additions of and upgrades to our work-class ROVs;• expenditures <strong>for</strong> added capacity and geographic expansion in our Subsea Productssegment; and• conversion of the Ocean Patriot to a dynamically positioned saturation diving vesseland completion of its saturation diving system in our Subsea Projects business.We expect our 2012 diluted earnings per share to be in the range of $2.45 to $2.65, ascompared to $2.16 in 2011. We anticipate continued international demand growth and amoderate rebound in overall activity in the U.S. Gulf of Mexico. Compared to 2011, in 2012 weare <strong>for</strong>ecasting an increase in ROV operating income as a result of a higher average fleet sizeand increased demand offshore West Africa and in the U.S. Gulf of Mexico.We use our ROVs in the offshore oil and gas industry to per<strong>for</strong>m a variety of underwater tasks,including drill support, installation and construction support, pipeline inspection and surveys andsubsea production facility inspection, repair and maintenance. The largest percentage of ourROVs has historically been used to provide drill support services.There<strong>for</strong>e, the number of floating drilling rigs on hire is a leading market indicator <strong>for</strong> thisbusiness. The following table shows average floating rigs under contract and our ROVutilization.2011 2010 2009Average number of floating rigs under contract 238 220 208ROV days on hire (in thousands) 73 69 69ROV utilization 77 % 75 % 79 %Demand <strong>for</strong> floating rigs is our primary driver of future growth prospects. According to industrydata published by ODS-Petrodata, at the end of 2011, there were 284 floating drilling rigs in theworld, with 260 of the rigs under contract and 69% of the rigs contracted through 2012. Sixtyeightadditional floating rigs were on order, with 45 scheduled to be delivered through 2013, and28 of these 68 have been contracted long-term, <strong>for</strong> an average term of approximately sevenyears. We estimate approximately 24 floating rigs will be placed in service during 2012, and wehave ROV contracts on eight of those. Competitors have the ROV contracts on nine rigs,leaving seven contract opportunities.In addition to floating rig demand, subsea tree completions are another leading indicator of thestrength of the deepwater market and the primary demand driver <strong>for</strong> our Subsea Products lines.According to industry data published by Quest Offshore Resources, Inc., there were less than600 subsea completions be<strong>for</strong>e 1990, approximately 1,100 in the decade of the 1990s,approximately 3,100 in the decade of the 2000s, and Quest <strong>for</strong>ecasts over 5,000 <strong>for</strong> the decadeof the 2010s. Quest also projects the global market <strong>for</strong> subsea tree orders is expected toincrease 58% in the 2011-2015 time period compared to the previous five years.2011 Annual Report 11
Critical Accounting Policies and EstimatesWe have based the following discussion and analysis of our financial condition and results ofoperations on our consolidated financial statements, which we have prepared in con<strong>for</strong>mity withaccounting principles generally accepted in the United States. These principles require us tomake various estimates, judgments and assumptions that affect the reported amounts of assetsand liabilities at the date of the financial statements and the reported amounts of revenue andexpense during the periods we present. We base our estimates on historical experience,available in<strong>for</strong>mation and other assumptions we believe to be reasonable under thecircumstances. On an ongoing basis, we evaluate our estimates; however, our actual resultsmay differ from these estimates under different assumptions or conditions. The followingdiscussion summarizes the accounting policies we believe (1) require our management's mostdifficult, subjective or complex judgments and (2) are the most critical to our reporting of resultsof operations and financial position.Revenue Recognition. We recognize our revenue according to the type of contract involved.On a daily basis, we recognize revenue under contracts that provide <strong>for</strong> specific time, materialand equipment charges, which we bill periodically, ranging from weekly to monthly.We account <strong>for</strong> significant fixed-price contracts, which we enter into mainly in our SubseaProducts segment, and occasionally in our Subsea Projects and Advanced Technologiessegments, using the percentage-of-completion method. In 2011, we accounted <strong>for</strong> 16% of ourrevenue using the percentage-of-completion method. In determining whether a contract shouldbe accounted <strong>for</strong> using the percentage-of-completion method, we consider whether:• the customer provides specifications <strong>for</strong> the construction of facilities or production ofgoods or <strong>for</strong> the provision of related services;• we can reasonably estimate our progress towards completion and our costs;• the contract includes provisions as to the en<strong>for</strong>ceable rights regarding the goods orservices to be provided, consideration to be received and the manner and terms ofpayment;• the customer can be expected to satisfy its obligations under the contract; and• we can be expected to per<strong>for</strong>m our contractual obligations.Under the percentage-of-completion method, we recognize estimated contract revenue basedon costs incurred to date as a percentage of total estimated costs. Changes in the expectedcost of materials and labor, productivity, scheduling and other factors affect the total estimatedcosts. Additionally, external factors, including weather or other factors outside of our control,may also affect the progress and estimated cost of a project's completion and, there<strong>for</strong>e, thetiming of income and revenue recognition. We routinely review estimates related to ourcontracts and reflect revisions to profitability in earnings immediately. If a current estimate oftotal contract cost indicates an ultimate loss on a contract, we recognize the projected loss infull when we determine it. In prior years, we have recorded adjustments to earnings as a resultof revisions to contract estimates. Although we are continually striving to accurately estimateour contract costs and profitability, adjustments to overall contract costs could be significant infuture periods.We recognize the remainder of our revenue when persuasive evidence of an arrangementexists, delivery has occurred or services have been rendered, price is fixed or determinable andcollection is reasonably assured.Long-lived Assets. We evaluate our property and equipment <strong>for</strong> impairment whenever eventsor changes in circumstances indicate that the carrying amounts may not be appropriate. Webase these evaluations on a comparison of the assets' carrying values to <strong>for</strong>ecasts ofundiscounted cash flows associated with the assets or quoted market prices. If an impairmenthas occurred, we recognize a loss <strong>for</strong> the difference between the carrying amount and the fairvalue of the asset. Our expectations regarding future sales and undiscounted cash flows arehighly subjective, cover extended periods of time and depend on a number of factors outsideour control, such as changes in general economic conditions, laws and regulations.Accordingly, these expectations could differ significantly from year to year. In 2010, werecorded a $5.2 million impairment charge as additional depreciation to adjust the carrying12 <strong>Oceaneering</strong> International, Inc.
value of our vessel held <strong>for</strong> sale, The Per<strong>for</strong>mer, to its fair value less estimated costs to sell.We completed the sale in July 2010 <strong>for</strong> approximately the vessel's reduced carrying value.The Per<strong>for</strong>mer was included in our Subsea Projects segment, and the impairment and result ofits sale are included in the gross margin and operating income in the Subsea Projects segment.We charge the costs of repair and maintenance of property and equipment to operations asincurred, while we capitalize the costs of improvements that extend asset lives or functionality.Goodwill. We account <strong>for</strong> business combinations using the acquisition method of accounting,with the acquisition price being allocated to the assets acquired and liabilities assumed basedon their fair market values at the date of acquisition. In September 2011, the FinancialAccounting Standards Board ("FASB") issued an update regarding goodwill impairment testing.Under the update, an entity has the option to first assess qualitative factors to determinewhether the existence of events or circumstances leads to a determination that it is more likelythan not that the fair value of a reporting unit is less than its carrying amount. If, after assessingthe totality of events or circumstances, an entity determines it is not more likely than not that thefair value of a reporting unit is less than its carrying amount, per<strong>for</strong>ming the two-step impairmenttest is unnecessary. However, if an entity concludes otherwise, then it is required to per<strong>for</strong>mthe first step of the two-step impairment test. This update is effective <strong>for</strong> us January 1, 2012,and earlier adoption is permitted. We have elected to adopt this update early and apply it in2011. The provisions of the update have not had a material effect on our financial position orresults of operations. Prior to this FASB update, we tested the goodwill attributable to each ofour reporting units <strong>for</strong> impairment annually, or more frequently whenever events or changes incircumstances indicated that the carrying amounts may not have been appropriate. Weestimated fair value of the reporting units using both an income approach, which considers adiscounted cash flow model, and a market approach. For reporting units with significantgoodwill, we do not believe our goodwill will be impaired during 2012.Loss Contingencies. We self-insure <strong>for</strong> workers' compensation, maritime employer's liabilityand comprehensive general liability claims to levels we consider financially prudent, and beyondthe self-insurance level of exposure, we carry insurance, which can be by occurrence or in theaggregate. We determine the level of accruals <strong>for</strong> claims exposure by reviewing our historicalexperience and current year claim activity. We do not record accruals on a present-value basis.We review larger claims with insurance adjusters and establish specific reserves <strong>for</strong> knownliabilities. We establish an additional reserve <strong>for</strong> incidents incurred but not reported to us <strong>for</strong>each year using our estimates and based on prior experience. We believe we have establishedadequate accruals <strong>for</strong> uninsured expected liabilities arising from those obligations. However, itis possible that future earnings could be affected by changes in our estimates relating to thesematters.We are involved in various claims and actions against us, most of which are covered byinsurance. We believe that our ultimate liability, if any, that may result from these claims andactions will not materially affect our financial position, cash flows or results of operations.Income Taxes. Our tax provisions are based on our expected taxable income, statutory ratesand tax-planning opportunities available to us in the various jurisdictions in which we operate.Determination of taxable income in any jurisdiction requires the interpretation of the related taxlaws. We are at risk that a taxing authority's final determination of our tax liabilities may differfrom our interpretation. Our effective tax rate may fluctuate from year to year as our operationsare conducted in different taxing jurisdictions, the amount of pre-tax income fluctuates and ourestimates regarding the realizability of items such as <strong>for</strong>eign tax credits may change. In 2011,2010 and 2009, we recorded reductions of income tax expense of $0.9 million, $1.0 million and$0.3 million, respectively, resulting from a combination of expiring statutes of limitations and theresolution of uncertain tax positions related to certain tax liabilities we recorded in prior years.Current income tax expense represents either nonresident withholding taxes or the liabilitiesexpected to be reflected on our income tax returns <strong>for</strong> the current year, while the net deferredincome tax expense or benefit represents the change in the balance of deferred tax assets orliabilities as reported on our balance sheet.2011 Annual Report 13
We establish valuation allowances to reduce deferred tax assets when it is more likely than notthat some portion or all of the deferred tax assets will not be realized in the future. We currentlyhave no valuation allowances. While we have considered estimated future taxable income andongoing prudent and feasible tax-planning strategies in assessing the need <strong>for</strong> the valuationallowances, changes in these estimates and assumptions, as well as changes in tax laws, couldrequire us to provide <strong>for</strong> valuation allowances <strong>for</strong> our deferred tax assets. These provisions <strong>for</strong>valuation allowances would impact our income tax provision in the period in which suchadjustments are identified and recorded.We account <strong>for</strong> any applicable interest and penalties on uncertain tax positions as a componentof our provision <strong>for</strong> income taxes on our financial statements. We charged $0.4 million toincome tax expense in 2011 <strong>for</strong> penalties and interest <strong>for</strong> uncertain tax positions, which broughtour total liabilities <strong>for</strong> penalties and interest on uncertain tax positions to $4.4 million on ourbalance sheet at December 31, 2011. Including associated <strong>for</strong>eign tax credits and penaltiesand interest, we have accrued a net total of $5.6 million in the caption "other long-termliabilities" on our balance sheet at December 31, 2011 <strong>for</strong> unrecognized tax benefits. Alladditions or reductions to those liabilities affect our effective income tax rate in the periods ofchange.We do not believe that the total of unrecognized tax benefits will significantly increase ordecrease in the next 12 months.For a summary of our major accounting policies and a discussion of recently adoptedaccounting standards, please see Note 1 to our Consolidated Financial Statements.Liquidity and Capital ResourcesWe consider our liquidity and capital resources adequate to support our operations andinternally-generated growth initiatives. At December 31, 2011, we had working capital of$483 million, including cash and cash equivalents of $106 million. Additionally, we had$180 million available through a revolving credit facility under a credit agreement (the "CreditAgreement"), which we replaced in January 2012 with a new credit agreement (the "2012 CreditAgreement") that extends to January 2017. Our maximum borrowings and our total interestcosts under the Credit Agreement during the year ended December 31, 2011 were $120 millionand $42,000, respectively. Our net cash provided by operating activities was $289 million,$442 million and $418 million <strong>for</strong> 2011, 2010 and 2009, respectively.Simultaneously with the execution of the 2012 Credit Agreement and pursuant to its terms, werepaid all amounts outstanding under, and terminated, the Credit Agreement. The 2012 CreditAgreement provides <strong>for</strong> a five-year, $300 million revolving credit facility. Subject to certainconditions, the aggregate commitments under the facility may be increased by up to$200 million by obtaining additional commitments from existing and/or new lenders. Borrowingsunder the facility may be used <strong>for</strong> working capital and general corporate purposes. The facilityexpires on January 6, 2017. Revolving borrowings under the facility bear interest at an adjustedbase rate or the eurodollar Rate (as defined in the agreement), at our option, plus an applicablemargin. Depending on our debt to capitalization ratio, the applicable margin varies (1) in thecase of adjusted base rate advances, from 0.125% to 0.750% and (2) in the case of eurodollaradvances, from 1.125% to 1.750%.The 2012 Credit Agreement contains various covenants which we believe are customary <strong>for</strong>agreements of this nature, including, but not limited to, restrictions on the ability of each of ourrestricted subsidiaries to incur unsecured debt, as well as restrictions on our ability and theability of each of our restricted subsidiaries to incur secured debt, grant liens, make certaininvestments, make distributions, merge or consolidate, sell assets, enter into transactions withaffiliates and enter into certain restrictive agreements. We are also subject to an interestcoverage ratio and a debt to capitalization ratio. The 2012 Credit Agreement includescustomary events and consequences of default.14 <strong>Oceaneering</strong> International, Inc.
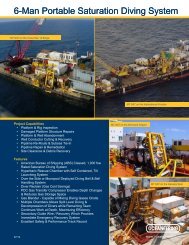
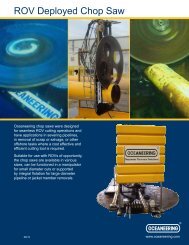
Our capital expenditures, including business acquisitions, <strong>for</strong> 2011, 2010 and 2009 were$527 million, $207 million and $175 million, respectively. Capital expenditures in 2011 includedexpenditures <strong>for</strong>: the acquisition of AGR Field Operations Holdings AS and subsidiaries("AGR FO") <strong>for</strong> $220 million, which are in our Asset Integrity and Subsea Projects segments;Norse Cutting and Abandonment AS ("NCA") <strong>for</strong> $50 million and Mechanica AS <strong>for</strong> $17 million,which are in our Subsea Products segment; additions and upgrades to our ROV fleet; andconversion of the Ocean Patriot to a dynamically positioned saturation diving vessel andcompletion of its saturation diving system in our Subsea Projects segment. Capitalexpenditures in 2010 included expenditures <strong>for</strong>: additions and upgrades to our ROV fleet; twovessels and a saturation diving system in our Subsea Project segment; a business acquisition inour Subsea Products segment; and modifications to our Brazil umbilical manufacturing facility.Capital expenditures in 2009 included expenditures <strong>for</strong>: additions and upgrades to our ROVfleet; the construction of our own facility to produce control umbilicals <strong>for</strong> our ROVs; andexpansion of our specialty subsea products business in <strong>for</strong>eign markets.Our capital expenditures during 2011, 2010 and 2009 included $136 million, $109 million and$147 million, respectively, in our ROV segment, principally <strong>for</strong> additions and upgrades to ourROV fleet to expand the fleet and replace units we retired and <strong>for</strong> facilities infrastructure tosupport our growing ROV fleet size. We plan to continue adding ROVs at levels we determineappropriate to meet market opportunities as they arise. We added 24, 22 and 30 ROVs to ourfleet and disposed of 16, 10 and nine units during 2011, 2010 and 2009, respectively, andtransferred one to our Advanced Technologies segment in 2011, resulting in a total of 267 workclasssystems in the fleet at December 31, 2011.In 2006, we chartered a large deepwater vessel, the Ocean Intervention III, <strong>for</strong> three years, withextension options <strong>for</strong> up to six additional years. The initial three-year term of the charter beganin May 2007, and the term has been extended to May 2012, and we expect to contract <strong>for</strong>continued use of this vessel. We also chartered an additional larger deepwater vessel, theOlympic Intervention IV, <strong>for</strong> an initial term of five years, which began in the third quarter of 2008.We outfitted each of these larger deepwater vessels with two of our high-specification workclassROVs, and we have utilized these vessels to per<strong>for</strong>m subsea hardware installation andinspection, repair and maintenance projects, and to conduct well intervention services in theultra-deep waters of the U.S. Gulf of Mexico. In 2012, we are mobilizing the OceanIntervention III to Angola and have chartered the Bourbon Oceanteam 101 to work on a threeyearfield support contract. The customer <strong>for</strong> this contract has the option <strong>for</strong> us to provide athird vessel and has options to extend the contract <strong>for</strong> two additional one-year periods.Our principal source of cash from operating activities is our net income, adjusted <strong>for</strong> the noncashexpenses of depreciation and amortization, deferred income taxes and noncashcompensation under our restricted stock plans. Our $289 million, $442 million and $418 millionof cash provided from operating activities in 2011, 2010 and 2009, respectively, were affectedby cash increases/(decreases) of $(100) million, $12 million, and $12 million, respectively, ofchanges in accounts receivable, $(11) million, $(1) million and $3 million, respectively, ofchanges in inventory and $(0.1) million, $(30) million and $1 million, respectively, in changes inother operating assets. In 2011, the increase in accounts receivable was largely attributable toincreased revenue in the fourth quarter of 2011 compared to the corresponding quarter of 2010,and the mix of revenue with a higher percentage of our 2011 revenue coming from ourinternational operations. In 2010, the change in other operating assets related to increases inrefundable income taxes and prepaid expenses.In 2011, we used $483 million in investing activities, with $527 million used to make the capitalexpenditures and business acquisitions described above, while we received $44 million from thesales of assets, primarily our offshore production system, the Ocean Legend.In 2010, we used $192 million in investing activities, including $109 million to upgrade and addadditional units to our ROV fleet, $42 million to increase our Subsea Products capabilities,including an acquisition <strong>for</strong> $17 million, and $44 million in our Subsea Projects segment,including expenditures <strong>for</strong> an additional vessel equipped with a saturation diving system and areplacement diving service vessel.2011 Annual Report 15
In 2009, we used $162 million in investing activities, including $147 million on growing andupgrading our ROV operations.In 2010 and 2009, we received $0.7 million and $1.9 million, respectively, in cash flow fromfinancing activities as proceeds from the sale of our common stock pursuant to the exercise ofemployee stock options. At December 31, 2010, we no longer had any stock optionsoutstanding, and we have had no further stock option activity since then. In addition, in 2011,2010 and 2009, we received $1.3 million, $1.7 million and $2.5 million, respectively, of taxbenefit realized from tax deductions in excess of financial statement expense related to ourstock-based compensation plans. For a description of our incentive plans, see Note 8 to ourConsolidated Financial Statements.In February 2010, our Board of Directors approved a plan to repurchase up to 12,000,000shares of our common stock. The timing and amount of any repurchases will be determined byour management. We expect that any shares repurchased under the new plan will be held astreasury stock <strong>for</strong> future use. The plan does not obligate us to repurchase any particularnumber of shares. Through December 31, 2011, we repurchased 2,700,000 shares at a cost of$67 million under the plan, including the 500,000 shares we repurchased <strong>for</strong> $17.5 millionduring 2011. As of December 31, 2011, we retained 2,799,118 shares we had repurchasedunder this and a prior plan. We expect that shares we reissue will be primarily in connectionwith our stock-based compensation plans.Because of our significant <strong>for</strong>eign operations, we are exposed to currency fluctuations andexchange rate risks. We generally minimize these risks primarily through matching, to theextent possible, revenue and expense in the various currencies in which we operate.Cumulative translation adjustments as of December 31, 2011 relate primarily to our netinvestments in, including long-term loans to, our <strong>for</strong>eign subsidiaries. A stronger U.S. dollaragainst the U.K. pound sterling and the Norwegian kroner would result in lower operatingincome. See Item 7A – "Quantitative and Qualitative Disclosures About Market Risk."Results of OperationsIn<strong>for</strong>mation on our business segments is shown in Note 7 of the Notes to ConsolidatedFinancial Statements included in this report.16 <strong>Oceaneering</strong> International, Inc.
Oil and Gas. The table that follows sets out revenue and profitability <strong>for</strong> the business segmentswithin our Oil and Gas business.Year Ended December 31,(dollars in thousands) 2011 2010 2009Remotely Operated VehiclesRevenue $ 755,033 $ 662,105 $ 649,228Gross Margin 260,287 247,619 237,023Gross Margin % 34 % 37 % 37 %Operating Income 224,705 211,725 207,683Operating Income % 30 % 32 % 32 %Days available 94,999 91,667 86,527Utilization % 77 % 75 % 79 %Subsea ProductsRevenue 770,212 549,233 487,726Gross Margin 207,804 161,081 115,056Gross Margin % 27 % 29 % 24 %Operating Income 142,184 108,522 60,526Operating Income % 18 % 20 % 12 %Backlog at end of period 382,000 384,000 321,000Subsea ProjectsRevenue 167,477 247,538 274,607Gross Margin 42,004 56,165 84,657Gross Margin % 25 % 23 % 31 %Operating Income 32,662 46,910 75,404Operating Income % 20 % 19 % 27 %Asset IntegrityRevenue 266,577 223,469 216,140Gross Margin 46,109 41,698 41,125Gross Margin % 17 % 19 % 19 %Operating Income 30,560 25,893 26,443Operating Income % 11 % 12 % 12 %Total Oil and GasRevenue $ 1,959,299 $ 1,682,345 $ 1,627,701Gross Margin 556,204 506,563 477,861Gross Margin % 28 % 30 % 29 %Operating Income 430,111 393,050 370,056Operating Income % 22 % 23 % 23 %In response to continued increasing demand to support deepwater drilling and construction andproduction maintenance work, we have continued to build new ROVs. These new vehicles aredesigned <strong>for</strong> use around the world in water depths of 10,000 feet or more. We added 24, 22and 30 ROVs in 2011, 2010 and 2009, respectively, while disposing of 35 units over the threeyearperiod and transferring one to our Advanced Technologies segment in 2011. We plan tocontinue adding ROVs at levels we determine appropriate to meet market opportunities.2011 Annual Report 17
For 2011, our ROV revenue and operating income increased over 2010 from increased days onhire, as we had more systems available and had higher utilization due to increased internationaldemand. Our operating income margin decreased as a result of geographic mix, as ouraggregate international ROV operations have lower margins than our U.S. Gulf of Mexicooperations.For 2010, our ROV revenue and operating income increased 2% over 2009 from increasedrevenue per day-on-hire. Good cost controls helped us keep margin percentages flat despitelower utilization. We grew our ROV fleet size to 267 at December 31, 2011 from 260 atDecember 31, 2010 and 248 at December 31, 2009.We anticipate ROV operating income to increase in 2012 as a result of an increase in days onhire, with an increase in our fleet utilization to 80% or more, from increased demand offshoreWest Africa and in the U.S. Gulf of Mexico. We anticipate adding 20 to 25 vehicles in 2012 andretiring four to six, which should add to our days available and days on hire over 2011.Our Subsea Products operating income <strong>for</strong> 2011 increased over 2010 on better umbilical plantthroughput, higher installation and workover control system ("IWOCS") services, and growth indemand <strong>for</strong> our subsea hardware and tooling, partially due to our acquisition of NCA in March2011. Our operating margin percentage was lower due to product mix, with umbilicals being ahigher percentage of Subsea Products revenue in 2011.Our Subsea Products operating income and margin percentage <strong>for</strong> 2010 increased over 2009,due to manufacturing process improvements and cost reductions, improved umbilical plantthroughput, and higher demand <strong>for</strong> subsea field development hardware, ROV tooling rentalsand IWOCS services. Our 2009 operating income and margins were also adversely affected by$5.5 million of unexpected costs we incurred in the third quarter on two blowout preventercontrol systems.We anticipate our Subsea Products segment operating income in 2012 to be higher than in2011, as we expect increased tooling demand and throughput in our umbilical plants. OurSubsea Products backlog was $382 million at December 31, 2011, about the same level it wasat December 31, 2010.Our 2011 Subsea Projects revenue and operating income declined from 2010 due to lowerdemand <strong>for</strong> our shallow water diving and deepwater vessel services in the U.S. Gulf of Mexico.In 2011, we recorded a gain of $19.6 million on the sale of the Ocean Legend, a <strong>mobile</strong> offshoreproduction system.Our 2010 Subsea Projects revenue and operating income declined from 2009 due to lowerdemand <strong>for</strong> our services on hurricane damage-related repair projects and our phased exit of the<strong>mobile</strong> offshore production systems business. In 2010, we recorded a $5.2 million impairmentcharge to adjust the carrying value of our vessel, The Per<strong>for</strong>mer, to its fair value less estimatedcosts to sell. We completed the sale in 2010 <strong>for</strong> approximately the vessel's reduced carryingvalue.We anticipate our 2012 operating income <strong>for</strong> Subsea Projects to be higher than in 2011 on aninternational expansion of our deepwater vessel capabilities to work <strong>for</strong> BP plc offshore Angola,the addition of AGR FO's operations in Australia, and a gradual demand recovery in the U.S.Gulf of Mexico.Our Asset Integrity revenue and operating income were higher in 2011 than in 2010 on higherservice demand in Europe and Central Asia. Our Asset Integrity segment operating incomeresults in 2010 were similar to those in 2009. We expect that our Asset Integrity segmentrevenue and operating income will be higher in 2012, primarily as a result of our acquisition ofAGR FO in December 2011.18 <strong>Oceaneering</strong> International, Inc.
Advanced Technologies. The table that follows sets out revenue and profitability <strong>for</strong> thissegment.Year Ended December 31,(dollars in thousands) 2011 2010 2009Revenue $ 233,364 $ 234,700 $ 194,380Gross Margin 33,774 32,510 25,128Gross Margin % 14 % 14 % 13 %Operating Income 16,661 16,934 12,366Operating Income % 7 % 7 % 6 %Our Advanced Technologies segment operating income results in 2011 were similar to those in2010. Our Advanced Technologies segment's 2010 revenue and operating income were higherthan 2009 due to higher levels of entertainment industry contracts, U.S. Navy engineeringservices and Department of Defense manufacturing projects.We anticipate our Advanced Technologies 2012 operating income will be higher than that of2011 due to higher levels of entertainment industry contracts and improved execution on U.S.Navy vessel service work.Unallocated Expenses. Our unallocated expenses, i.e., those not associated with a specificbusiness segment, within gross margin consist of expenses related to our incentive anddeferred compensation plans, including restricted stock and bonuses, as well as other generalexpenses. Through 2010, a portion of our restricted stock expense varied with the market priceof our common stock. Our unallocated expenses within operating income consist of thosewithin gross margin plus general and administrative expenses related to corporate functions.The table that follows sets out our unallocated expenses.Year Ended December 31,(dollars in thousands) 2011 2010 2009Gross margin expenses $ (81,219) $ (72,753) $ (65,263)% of revenue 4 % 4 % 4 %Operating expenses (111,941 ) (100,484 ) (90,306)% of revenue 5 % 5 % 5 %Our unallocated gross margin and operating expenses increased in each of 2011 and 2010,primarily due to higher compensation related to incentive plans. In 2011, we also incurredadditional expenses associated with acquisition-related activities and international taxrestructuring.Other. The table that follows sets <strong>for</strong>th our significant financial statement items below theoperating income line.Year Ended December 31,(dollars in thousands) 2011 2010 2009Interest income $ 888 $ 580 $ 694Interest expense, net of amounts capitalized (1,096) (6,010 ) (7,781)Equity earnings of unconsolidated affiliates 3,801 2,078 3,242Other income (expense), net (539) (926 ) 1,504Provision <strong>for</strong> income taxes 102,227 104,691 101,422Interest expense decreased in 2011 and 2010, primarily from lower interest rates on LIBORbasedborrowings under our revolving credit agreement and term loan, and lower debt levels.We did not capitalize any interest in 2011. We capitalized $0.3 million of interest in 2010 andless than $0.1 million of interest in 2009. Interest expense in 2010 included $2.9 million toterminate an interest rate hedge.2011 Annual Report 19
We earn equity income from our 50% investment in Medusa Spar LLC. Medusa Spar LLCowns 75% of a production spar in the U.S. Gulf of Mexico and earns its revenue from feescharged on production processed through the facility. Throughput increased in 2011 over 2010due to additional wells added to the spar. Throughput decreased in 2010 due to normalproduction declines.We expect Medusa Spar LLC revenue will decline in 2012 due to normal rates of well decline.Medusa Spar LLC's revenue could be increased if the operator of the producing wells receivesregulatory approval to start producing from other zones in the existing wells, which areanticipated to have higher flow rates than the currently-producing zones, or is able to connectmore wells to the spar.Included in other income (expenses), net are <strong>for</strong>eign currency transaction gains/(losses) of$(0.4) million, $(2.8) million and $2.0 million <strong>for</strong> 2011, 2010 and 2009, respectively. In 2010, wealso earned a fee of $2.1 million <strong>for</strong> serving as the stalking horse bidder in an asset auctionproceeding.Our effective tax rate, including <strong>for</strong>eign, state and local taxes, was 30.3%, 34.3%, and 35.0% <strong>for</strong>2011, 2010 and 2009, respectively, which included a combination of expiring statutes oflimitations and the resolution of uncertain tax positions of $0.9 million, $1.0 million and$0.3 million, respectively, related to certain tax liabilities we recorded in prior years. Theprimary difference between our 2011 effective tax rate of 30.3% and the federal statutory rate of35% reflects our intent to indefinitely reinvest in certain of our international operations.There<strong>for</strong>e, we are no longer providing <strong>for</strong> U.S. taxes on a portion of our <strong>for</strong>eign earnings. Theeffective tax rate of 30.3% in our financial statements <strong>for</strong> 2011 is a result of our effective rate of31.5% adjusted by $4.9 million of additional tax benefits, primarily attributable to amending prioryears' U.S. federal income tax returns to reflect a broader interpretation of our pre-tax incomeeligible <strong>for</strong> certain deductions allowable <strong>for</strong> oil and gas construction activities, and tax effectingthe $19.6 million gain on the sale of the Ocean Legend at the U.S. federal statutory rate of 35%.We anticipate our effective tax rate in 2012 will be approximately 31.5%.Off-Balance Sheet ArrangementsWe do not have any off-balance sheet arrangements, as defined by SEC rules.Contractual ObligationsAt December 31, 2011, we had payments due under contractual obligations as follows:(dollars in thousands)Payments due by periodLong-term DebtTotal 2012 2013-2014 2015-2016 After 2016$ 120,000 $ — $ — $ — $ 120,000Operating Leases 137,468 48,662 40,308 16,846 31,652Purchase Obligations 208,858 208,858 — — —Other Long-term Obligations reflected on ourbalance sheet under GAAP 54,427 1,376 2,883 3,037 47,131TOTAL $ 520,753 $ 258,896 $ 43,191 $ 19,883 $ 198,783In 2012, we chartered a vessel and crew <strong>for</strong> three years with two one-year options <strong>for</strong> our fieldoperations contract in Angola. Total charter hire will be $94 million <strong>for</strong> the first three years.At December 31, 2011, we had outstanding purchase order commitments totaling $209 million,including approximately $22 million <strong>for</strong> specialized steel tubes to be used in our manufacturingof steel tube umbilicals by our Subsea Products segment and $7 million <strong>for</strong> ROV winches. Wehave ordered the specialized steel tubes in advance to meet expected sales commitments. Thewinches have been ordered <strong>for</strong> new ROVs and <strong>for</strong> anticipated replacements due to normal wearand tear. Should we decide not to accept delivery of the steel tubes, we would incurcancellation charges of at least 10% of the amount canceled.20 <strong>Oceaneering</strong> International, Inc.
In 2001, we entered into an agreement with our Chairman (the "Chairman") who was also thenour Chief Executive Officer. That agreement was amended in 2006 and in 2008. Pursuant tothe amended agreement, the Chairman relinquished his position as Chief Executive Officer inMay 2006 and began his post-employment service period on December 31, 2006, whichcontinued through August 15, 2011, during which service period the Chairman, acting as anindependent contractor, agreed to serve as nonexecutive Chairman of our Board of Directors.The agreement provides the Chairman with post-employment benefits <strong>for</strong> ten years followingAugust 15, 2011. The agreement also provides <strong>for</strong> medical coverage on an after-tax basis tothe Chairman, his spouse and children <strong>for</strong> their lives. We recognized the net present value ofthe post-employment benefits over the expected service period. Our total accrued liabilities,current and long-term, under this post-employment benefit were $7.3 million and $7.6 million atDecember 31, 2011 and 2010, respectively.Effects of Inflation and Changing PricesOur financial statements are prepared in accordance with generally accepted accountingprinciples in the United States, using historical U.S. dollar accounting, or historical cost.Statements based on historical cost, however, do not adequately reflect the cumulative effect ofincreasing costs and changes in the purchasing power of the dollar, especially during times ofsignificant and continued inflation.In order to minimize the negative impact of inflation on our operations, we attempt to cover theincreased cost of anticipated changes in labor, material and service costs, either through anestimate of those changes, which we reflect in the original price, or through price escalationclauses in our contracts. Inflation has not had a material effect on our revenue or income fromoperations in the past three years, and no such effect is expected in the near future.Quantitative and Qualitative Disclosures About Market RiskWe are currently exposed to certain market risks arising from transactions we have entered intoin the normal course of business. These risks relate to interest rate changes and fluctuations in<strong>for</strong>eign exchange rates. We do not believe these risks are material. We have not entered intoany market risk sensitive instruments <strong>for</strong> speculative or trading purposes. We currently have nooutstanding hedges or similar instruments. We typically manage our exposure to interest ratechanges through the use of a combination of fixed- and floating-rate debt. See Note 5 of Notesto Consolidated Financial Statements included in this report <strong>for</strong> a description of our revolvingcredit facility and interest rates on our borrowings. We believe significant interest rate changeswould not have a material near-term impact on our future earnings or cash flows.Because we operate in various oil and gas exploration and production regions in the world, weconduct a portion of our business in currencies other than the U.S. dollar. The functionalcurrency <strong>for</strong> several of our international operations is the applicable local currency. A strongerU.S. dollar against the U.K. pound sterling and the Norwegian kroner would result in loweroperating income. We manage our exposure to changes in <strong>for</strong>eign exchange rates principallythrough arranging compensation in U.S. dollars or freely convertible currency and, to the extentpossible, by limiting compensation received in other currencies to amounts necessary to meetobligations denominated in those currencies. We use the exchange rates in effect as of thebalance sheet date to translate assets and liabilities as to which the functional currency is thelocal currency, resulting in translation adjustments that we reflect as accumulated othercomprehensive income or loss in the shareholders' equity section of our Consolidated BalanceSheets. We recorded adjustments of $(18.4) million, $1.9 million and $56.3 million to our equityaccounts in 2011, 2010 and 2009, respectively. Negative adjustments reflect the net impact ofthe strengthening of the U.S. dollar against various <strong>for</strong>eign currencies <strong>for</strong> locations where thefunctional currency is not the U.S. dollar. Conversely, positive adjustments reflect the effect of aweakening dollar.We recorded <strong>for</strong>eign currency transaction gains (losses) of $(0.4) million, $(2.8) million and$2.0 million that are included in Other income (expense), net in our Consolidated IncomeStatements in 2011, 2010 and 2009, respectively.2011 Annual Report 21
Controls and ProceduresDisclosure Controls and ProceduresIn accordance with Rules 13a-15 and 15d-15 under the Securities Exchange Act of 1934, asamended (the “Exchange Act"), we carried out an evaluation, under the supervision and withthe participation of management, including our principal executive officer and principal financialofficer, of the effectiveness of our disclosure controls and procedures (as that term is defined inRules 13a-15(e) and 15d-15(e) under the Exchange Act) as of the end of the period covered bythis report. Based on that evaluation, our principal executive officer and principal financialofficer concluded that our disclosure controls and procedures were effective as ofDecember 31, 2011 to provide reasonable assurance that in<strong>for</strong>mation required to be disclosedin our reports filed or submitted under the Exchange Act is recorded, processed, summarizedand reported within the time periods specified in the Securities and Exchange Commission'srules and <strong>for</strong>ms. There has been no change in our internal control over financial reporting thatoccurred during the quarter ended December 31, 2011 that has materially affected, or isreasonably likely to materially affect, our internal control over financial reporting.Management's Report on Internal Control Over Financial ReportingOur management is responsible <strong>for</strong> establishing and maintaining adequate internal control overfinancial reporting (as that term is defined in Rules 13a-15(f) and 15d-15(f) under the ExchangeAct). Our internal control over financial reporting is a process designed to provide reasonable,but not absolute, assurance regarding the reliability of financial reporting and the preparation offinancial statements <strong>for</strong> external reporting purposes in accordance with accounting principlesgenerally accepted in the United States of America. We developed our internal control overfinancial reporting through a process in which our management applied its judgment inassessing the costs and benefits of various controls and procedures, which, by their nature, canprovide only reasonable assurance regarding the control objectives. You should note that thedesign of any system of controls is based in part on various assumptions about the likelihood offuture events, and we cannot assure you that any system of controls will succeed in achievingits stated goals under all potential future conditions, regardless of how remote. Because of itsinherent limitations, internal control over financial reporting may not prevent or detectmisstatements. Also, projections of any evaluation of effectiveness to future periods are subjectto the risk that controls may become inadequate because of changes in conditions, or that thedegree of compliance with the policies and procedures may deteriorate.Under the supervision and with the participation of our management, including our principalexecutive, financial and accounting officers, we have conducted an evaluation of theeffectiveness of our internal control over financial reporting based on the framework in "InternalControl – Integrated Framework” issued by the Committee of Sponsoring Organizations of theTreadway Commission. This evaluation included a review of the documentation surroundingour financial reporting controls, an evaluation of the design effectiveness of these controls,testing of the operating effectiveness of these controls and an evaluation of our overall controlenvironment. We have excluded from this evaluation the internal controls of AGR FieldOperations Holdings AS and subsidiaries, which were acquired in December 2011 and,excluding goodwill, accounted <strong>for</strong> approximately 2% of our total consolidated total assets atDecember 31, 2011 and less than 1% of our consolidated operating income <strong>for</strong> the year endedDecember 31, 2011. Based on that evaluation, our management has concluded that ourinternal control over financial reporting was effective as of December 31, 2011.Ernst & Young LLP, the independent registered public accounting firm that audited our financialstatements, has audited our internal control over financial reporting, as stated in their reportwhich follows.22 <strong>Oceaneering</strong> International, Inc.
Report of Independent Registered Public Accounting FirmThe Board of Directors and Shareholders of <strong>Oceaneering</strong> International, Inc.We have audited <strong>Oceaneering</strong> International, Inc. and Subsidiaries' internal control over financialreporting as of December 31, 2011, based on criteria established in Internal Control-IntegratedFramework issued by the Committee of Sponsoring Organizations of the Treadway Commission(the COSO criteria). <strong>Oceaneering</strong> International, Inc. and Subsidiaries' management isresponsible <strong>for</strong> maintaining effective internal control over financial reporting, and <strong>for</strong> itsassessment of the effectiveness of internal control over financial reporting included in theaccompanying Management's Report on Internal Control Over Financial Reporting. Ourresponsibility is to express an opinion on the company's internal control over financial reportingbased on our audit.We conducted our audit in accordance with the standards of the Public Company AccountingOversight Board (United States). Those standards require that we plan and per<strong>for</strong>m the audit toobtain reasonable assurance about whether effective internal control over financial reportingwas maintained in all material respects. Our audit included obtaining an understanding ofinternal control over financial reporting, assessing the risk that a material weakness exists,testing and evaluating the design and operating effectiveness of internal control based on theassessed risk, and per<strong>for</strong>ming such other procedures as we considered necessary in thecircumstances. We believe that our audit provides a reasonable basis <strong>for</strong> our opinion.A company's internal control over financial reporting is a process designed to providereasonable assurance regarding the reliability of financial reporting and the preparation offinancial statements <strong>for</strong> external purposes in accordance with generally accepted accountingprinciples. A company's internal control over financial reporting includes those policies andprocedures that (1) pertain to the maintenance of records that, in reasonable detail, accuratelyand fairly reflect the transactions and dispositions of the assets of the company; (2) providereasonable assurance that transactions are recorded as necessary to permit preparation offinancial statements in accordance with generally accepted accounting principles, and thatreceipts and expenditures of the company are being made only in accordance withauthorizations of management and directors of the company; and (3) provide reasonableassurance regarding prevention or timely detection of unauthorized acquisition, use, ordisposition of the company's assets that could have a material effect on the financialstatements.Because of its inherent limitations, internal control over financial reporting may not prevent ordetect misstatements. Also, projections of any evaluation of effectiveness to future periods aresubject to the risk that controls may become inadequate because of changes in conditions, orthat the degree of compliance with the policies or procedures may deteriorate.As indicated in the accompanying Management's Report on Internal Control Over FinancialReporting, management's assessment of and conclusion on the effectiveness of internal controlover financial reporting did not include the internal controls of AGR Field Operations HoldingsAS and subsidiaries, which are included in the 2011 consolidated financial statements of<strong>Oceaneering</strong> International, Inc. and, excluding goodwill, constituted approximately 2% ofconsolidated total assets as of December 31, 2011 and less than 1% of consolidated operatingincome <strong>for</strong> the year then ended. Our audit of internal control over financial reporting of<strong>Oceaneering</strong> International, Inc. and Subsidiaries also did not include an evaluation of theinternal control over financial reporting of AGR Field Operations Holdings AS and subsidiaries.2011 Annual Report 23
In our opinion, <strong>Oceaneering</strong> International, Inc. and Subsidiaries maintained, in all materialrespects, effective internal control over financial reporting as of December 31, 2011, based onthe COSO criteria.We also have audited, in accordance with the standards of the Public Company AccountingOversight Board (United States), the consolidated balance sheets of <strong>Oceaneering</strong> International,Inc. and Subsidiaries as of December 31, 2011 and 2010, and the related consolidatedstatements of income, comprehensive income, cash flows, and shareholders' equity <strong>for</strong> each ofthe three years in the period ended December 31, 2011 of <strong>Oceaneering</strong> International, Inc. andSubsidiaries and our report dated February 24, 2012 expressed an unqualified opinion thereon.Houston, TexasFebruary 24, 201224 <strong>Oceaneering</strong> International, Inc.
INDEX TO FINANCIAL STATEMENTS AND SCHEDULESIndex to Financial StatementsReport of Independent Registered Public Accounting FirmConsolidated Balance SheetsConsolidated Statements of IncomeConsolidated Statements of Comprehensive IncomeConsolidated Statements of Cash FlowsConsolidated Statements of Shareholders’ EquityNotes to Consolidated Financial StatementsSelected Quarterly Financial Data (unaudited)REPORT OF INDEPENDENT REGISTERED PUBLIC ACCOUNTING FIRMTo the Board of Directors and Shareholders of <strong>Oceaneering</strong> International, Inc.We have audited the accompanying consolidated balance sheets of <strong>Oceaneering</strong>International, Inc. and Subsidiaries (the Company) as of December 31, 2011 and 2010,and the related consolidated statements of income, comprehensive income, cash flows,and shareholders’ equity <strong>for</strong> each of the three years in the period endedDecember 31, 2011. These financial statements are the responsibility of the Company’smanagement. Our responsibility is to express an opinion on these financial statementsbased on our audits.We conducted our audits in accordance with the standards of the Public CompanyAccounting Oversight Board (United States). Those standards require that we plan andper<strong>for</strong>m the audit to obtain reasonable assurance about whether the financial statementsare free of material misstatement. An audit includes examining, on a test basis, evidencesupporting the amounts and disclosures in the financial statements. An audit alsoincludes assessing the accounting principles used and significant estimates made bymanagement, as well as evaluating the overall financial statement presentation. Webelieve that our audits provide a reasonable basis <strong>for</strong> our opinion.In our opinion, the consolidated financial statements referred to above present fairly, in allmaterial respects, the consolidated financial position of <strong>Oceaneering</strong> International, Inc.and Subsidiaries at December 31, 2011 and 2010, and the consolidated results of theiroperations and their cash flows <strong>for</strong> each of the three years in the period endedDecember 31, 2011, in con<strong>for</strong>mity with U.S. generally accepted accounting principles.We have also audited, in accordance with the standards of the Public CompanyAccounting Oversight Board (United States), <strong>Oceaneering</strong> International, Inc. andSubsidiaries’ internal control over financial reporting as of December 31, 2011, based oncriteria established in Internal Control – Integrated Framework issued by the Committeeof Sponsoring Organizations of the Treadway Commission and our report datedFebruary 24, 2012 expressed an unqualified opinion thereon.Houston, TexasFebruary 24, 20122011 Annual Report 25
OCEANEERING INTERNATIONAL, INC. AND SUBSIDIARIESCONSOLIDATED BALANCE SHEETSDecember 31,(in thousands, except share data) 2011 2010ASSETSCurrent Assets:Cash and cash equivalents $ 106,142 $ 245,219Accounts receivable, net of allowances <strong>for</strong> doubtfulaccounts of $594 and $5,655 549,812 424,014Inventory 255,095 236,517Other current assets 73,073 77,752Total Current Assets 984,122 983,502Property and Equipment, at cost 1,772,017 1,631,109Less accumulated depreciation 878,709 844,736Other Assets:Net Property and Equipment 893,308 786,373Goodwill 333,471 143,234Investments in unconsolidated affiliates 49,607 51,820Other non-current assets 140,036 65,577Total Other Assets 523,114 260,631Total Assets $ 2,400,544 $ 2,030,506LIABILITIES AND SHAREHOLDERS' EQUITYCurrent Liabilities:Accounts payable $ 111,381 $ 85,572Accrued liabilities 335,161 314,410Income taxes payable 54,833 39,874Total Current Liabilities 501,375 439,856Long-term Debt 120,000 —Other Long-term Liabilities 221,207 200,435Commitments and ContingenciesShareholders’ Equity:Common Stock, par value $0.25 per share; 180,000,000shares authorized; 110,834,088 shares issued 27,709 27,709Additional paid-in capital 202,619 193,277Treasury stock; 2,799,118 and 2,603,324 shares, at cost (71,700 ) (61,385 )Retained earnings 1,426,525 1,239,574Accumulated other comprehensive income (27,191 ) (8,960 )Total Shareholders' Equity 1,557,962 1,390,215Total Liabilities and Shareholders' Equity $ 2,400,544 $ 2,030,506The accompanying Notes are an integral part of these Consolidated FinancialStatements.26 <strong>Oceaneering</strong> International, Inc.
OCEANEERING INTERNATIONAL, INC. AND SUBSIDIARIESCONSOLIDATED STATEMENTS OF INCOMEYear Ended December 31,(in thousands, except per share data) 2011 2010 2009Revenue $ 2,192,663 $ 1,917,045 $ 1,822,081Cost of services and products 1,683,904 1,450,725 1,384,355Gross Margin 508,759 466,320 437,726Selling, general and administrative expense 173,928 156,820 145,610Income from Operations 334,831 309,500 292,116Interest income 888 580 694Interest expense, net of amounts capitalized (1,096 ) (6,010 ) (7,781 )Equity earnings of unconsolidated affiliates 3,801 2,078 3,242Other income (expense), net (539 ) (926 ) 1,504Income be<strong>for</strong>e Income Taxes 337,885 305,222 289,775Provision <strong>for</strong> income taxes 102,227 104,691 101,422Net Income $ 235,658 $ 200,531 $ 188,353Cash Dividends declared per Share $ 0.45 $ — $ —Basic Earnings per Share $ 2.18 $ 1.83 $ 1.71Diluted Earnings per Share $ 2.16 $ 1.82 $ 1.70The accompanying Notes are an integral part of these Consolidated FinancialStatements.2011 Annual Report 27
OCEANEERING INTERNATIONAL, INC. AND SUBSIDIARIESCONSOLIDATED STATEMENTS OF COMPREHENSIVE INCOME(in thousands)Year Ended December 31,2011 2010 2009Net Income $ 235,658 $ 200,531 $ 188,353Other comprehensive income, net of tax:Foreign currency translation adjustments (18,374) 1,893 56,333Pension-related adjustments 143 285 (1,812)Change in fair value of interest rate hedge andother — 2,428 629Other comprehensive income (18,231) 4,606 55,150Comprehensive Income $ 217,427 $ 205,137 $ 243,503The accompanying Notes are an integral part of these Consolidated FinancialStatements.28 <strong>Oceaneering</strong> International, Inc.
OCEANEERING INTERNATIONAL, INC. AND SUBSIDIARIESCONSOLIDATED STATEMENTS OF CASH FLOWSYear Ended December 31,(in thousands) 2011 2010 2009Cash Flows from Operating Activities:Net income $ 235,658 $ 200,531 $ 188,353Adjustments to reconcile net income to net cashprovided by operating activities:Depreciation and amortization 151,227 153,651 122,945Deferred income tax provision 7,502 31,184 21,631Net gain on sales of property and equipment (24,188 ) (2,758 ) (305 )Noncash compensation 12,529 8,490 6,369Distributions from unconsolidated affiliates greaterthan earnings 2,262 5,569 5,194Excluding the effects of acquisitions, increase(decrease) in cash from:Accounts receivable (99,537) 12,104 11,568Inventory (11,492 ) (827 ) 3,365Other operating assets (62 ) (30,074 ) 1,202Currency translation effect on working capital (10,589 ) 6,519 16,215Accounts payable and accrued liabilities 8,968 56,100 8,036Income taxes payable 14,484 (6,485 ) 25,578Other operating liabilities 1,810 7,846 8,083Total adjustments to net income 52,914 241,319 229,881Net Cash Provided by Operating Activities 288,572 441,850 418,234Cash Flows from Investing Activities:Purchases of property and equipment (235,028) (185,262) (175,021 )Business acquisitions, net of cash acquired (291,617) (21,918) —Dispositions of property and equipment and equityinvestment 43,874 15,284 12,535Net Cash Used in Investing Activities (482,771) (191,896) (162,486 )Cash Flows from Financing Activities:Net proceeds (payments) from revolving creditfacility 120,000 (100,000) (4,000)Payments of 6.72% Senior Notes — (20,000) (20,000)Payments of Term Loan — — (85,000 )Proceeds from issuance of common stock — 693 1,880Excess tax benefits from stock-based compensation 1,320 1,741 2,523Cash dividends (48,707 ) — —Purchases of treasury stock (17,491) (49,520) —Net Cash Provided by (Used in) FinancingActivities 55,122 (167,086) (104,597 )Net Increase (Decrease) in Cash and CashEquivalents (139,077) 82,868 151,151Cash and Cash Equivalents—Beginning ofPeriod 245,219 162,351 11,200Cash and Cash Equivalents—End of Period $ 106,142 $ 245,219 $ 162,351The accompanying Notes are an integral part of these Consolidated FinancialStatements.2011 Annual Report 29
OCEANEERING INTERNATIONAL, INC. AND SUBSIDIARIESCONSOLIDATED STATEMENTS OF SHAREHOLDERS’ EQUITYAccumulated OtherComprehensive Income (Loss)Common StockAdditionalFair Value CurrencyIssuedPaid-in Treasury Retained of Hedging Translation(in thousands) Shares Amount Capital Stock Earnings Instruments Adjustments Pension TotalBalance,December 31, 2008 110,834 $ 27,709 $ 210,390 $ (52,419 ) $ 850,690 $ (3,057 ) $ (63,489 ) $ (2,170 ) $ 967,654Net Income— — — — 188,353 — — — 188,353OtherComprehensiveIncome — — — — — 629 56,333 (1,812 ) 55,150Restricted stock unitactivity — — (7,989 ) 16,752 — — — — 8,763Restricted stockactivity — — (1,781 ) 1,781 — — — — —Stock optionsexercised — — (4,210 ) 6,090 — — — — 1,880Tax benefits fromstock plans — — 2,523 — — — — — 2,523Balance,December 31, 2009 110,834 27,709 198,933 (27,796 ) 1,039,043 (2,428 ) (7,156 ) (3,982 ) 1,224,323Net Income— — — — 200,531 — — — 200,531OtherComprehensiveIncome — — — — — 2,428 1,893 285 4,606Restricted stock unitactivity — — (4,027 ) 11,868 — — — — 7,841Restricted stockactivity — — (1,781 ) 1,781 — — — — —Stock optionsexercised — — (1,589 ) 2,282 — — — — 693Tax benefits fromstock plans — — 1,741 — — — — — 1,741Treasury stockpurchases,2,200,000 shares — — — (49,520 ) — — — — (49,520 )Balance,December 31, 2010 110,834 27,709 193,277 (61,385 ) 1,239,574 — (5,263 ) (3,697 ) 1,390,215Net Income— — — — 235,658 — — — 235,658OtherComprehensiveIncome — — — — — — (18,374 ) 143 (18,231 )Restricted stock unitactivity — — 9,532 5,667 — — — — 15,199Restricted stockactivity — — (1,509 ) 1,509 — — — — —Tax benefits fromstock plans — — 1,319 — — — — — 1,319Cash dividends— — — — (48,707 ) — — — (48,707 )Treasury stockpurchases, 500,000shares — — — (17,491 ) — — — — (17,491 )Balance,December 31, 2011 110,834 $ 27,709 $ 202,619 $ (71,700 ) $ 1,426,525 $ — $ (23,637 ) $ (3,554 ) $ 1,557,962The accompanying Notes are an integral part of these Consolidated Financial Statements.30 <strong>Oceaneering</strong> International, Inc.
NOTES TO CONSOLIDATED FINANCIAL STATEMENTS1. SUMMARY OF MAJOR ACCOUNTING POLICIESPrinciples of Consolidation. The consolidated financial statements include the accountsof <strong>Oceaneering</strong> International, Inc. and our 50% or more owned and controlledsubsidiaries. We also consolidate entities that are determined to be variable interestentities if we determine that we are the primary beneficiary; otherwise, we account <strong>for</strong>these entities using the equity method of accounting. We use the equity method toaccount <strong>for</strong> our investments in unconsolidated affiliated companies of which we own anequity interest of between 20% and 50% and as to which we have significant influence,but not control, over operations. All significant intercompany accounts and transactionshave been eliminated.Stock Split. On May 6, 2011, our Board of Directors declared a two-<strong>for</strong>-one stock split,which was effected in the <strong>for</strong>m of a stock dividend of our common stock to ourshareholders of record at the close of business on May 19, 2011. The stock dividendwas distributed on June 10, 2011. All historical share and per share data in thesefinancial statements reflect this stock split. The total number of authorized shares of ourcommon stock and its par value per share were unchanged by this stock split. We haverestated shareholders' equity to give retroactive recognition of the stock split <strong>for</strong> allperiods presented by reclassifying an amount equal to the par value of the additionalshares issued through the stock dividend from additional paid-in capital to common stock.Repurchase Plan. In February 2010, our Board of Directors approved a plan torepurchase up to 12,000,000 shares of our common stock. Through December 31, 2011under this plan, we repurchased 2,700,000 shares of our common stock <strong>for</strong> $67 million.Use of Estimates. The preparation of financial statements in con<strong>for</strong>mity with accountingprinciples generally accepted in the United States requires that our management makeestimates and assumptions that affect the reported amounts of assets and liabilities,disclosure of contingent assets and liabilities at the date of the financial statements andthe reported amounts of revenue and expense during the reporting period. Actual resultscould differ from those estimates.Reclassifications. Certain amounts from prior periods have been reclassified to con<strong>for</strong>mwith the current year presentation.Cash and Cash Equivalents. Cash and cash equivalents include demand deposits andhighly liquid investments with original maturities of three months or less from the date ofthe investment.Accounts Receivable – Allowances <strong>for</strong> Doubtful Accounts. We determine the need <strong>for</strong>allowances <strong>for</strong> doubtful accounts using the specific identification method. We do notgenerally require collateral from our customers.Inventory. Inventory is valued at lower of cost or market. We determine cost using theweighted-average method.Property and Equipment. We provide <strong>for</strong> depreciation of property and equipment on thestraight-line method over estimated useful lives of eight years <strong>for</strong> ROVs, three to 20 years2011 Annual Report 31
<strong>for</strong> marine services equipment (such as vessels and diving equipment), and three to 25years <strong>for</strong> buildings, improvements and other equipment.We charge the costs of repair and maintenance of property and equipment to operationsas incurred, while we capitalize the costs of improvements that extend asset lives orfunctionality.We capitalize interest on assets where the construction period is anticipated to be morethan three months. We did not capitalize any interest in 2011. We capitalized$0.3 million of interest in 2010 and less than $0.1 million of interest in 2009. We do notallocate general administrative costs to capital projects. Upon the disposition of propertyand equipment, the related cost and accumulated depreciation accounts are relieved andany resulting gain or loss is included as an adjustment to cost of services and products.Our management periodically, and upon the occurrence of a triggering event, reviews therealizability of long-lived assets, excluding goodwill and indefinite-lived intangibles, whichare held and used by us, to determine whether any events or changes in circumstancesindicate that the carrying amount of the asset may not be recoverable. For long-livedassets to be held and used, we base our evaluation on impairment indicators such as thenature of the assets, the future economic benefit of the assets, any historical or futureprofitability measurements and other external market conditions or factors that may bepresent. If such impairment indicators are present or other factors exist that indicate thatthe carrying amount of the asset may not be recoverable, we determine whether animpairment has occurred through the use of an undiscounted cash flows analysis of theasset at the lowest level <strong>for</strong> which identifiable cash flows exist. If an impairment hasoccurred, we recognize a loss <strong>for</strong> the difference between the carrying amount and the fairvalue of the asset. For assets held <strong>for</strong> sale or disposal, the fair value of the asset ismeasured using fair market value less cost to sell. Assets are classified as held-<strong>for</strong>-salewhen we have a plan <strong>for</strong> disposal of certain assets and those assets meet the held <strong>for</strong>sale criteria. In 2010, we recorded a $5.2 million impairment charge as additionaldepreciation to adjust the carrying value of our vessel held <strong>for</strong> sale, The Per<strong>for</strong>mer, to itsfair value less estimated costs to sell. We completed the sale in 2010 <strong>for</strong> approximatelythe vessel’s reduced carrying value. This impairment charge was recorded in our cost ofservices and products in our Subsea Projects segment.Business Acquisitions. We account <strong>for</strong> business combinations using the acquisitionmethod of accounting, with the acquisition price being allocated to the assets acquiredand liabilities assumed based on their fair market values at the date of acquisition.32 <strong>Oceaneering</strong> International, Inc.
The following table presents the cost (net of cash acquired) and the amounts ofassociated goodwill, other intangible assets, and other assets net of liabilities assumed<strong>for</strong> the business acquisitions we made in 2011:(in thousands) Cost GoodwillOtherIntangibleAssetsOther,netNorse Cutting and Abandonment AS $ 50,296 $ 17,777 $ 15,945 $ 16,574AGR Field Operations Holdings AS 220,011 165,201 32,067 22,743Mechanica AS 17,214 8,877 5,360 2,977Other 4,096 1,959 — 2,137Total Business Acquisitions $ 291,617 $ 193,814 $ 53,372 $ 44,431On March 31, 2011, we purchased Norse Cutting and Abandonment AS ("NCA"), aNorwegian oilfield technology company that specializes in providing subsea toolingservices used in the plugging, abandonment and decommissioning of offshore oil andgas production plat<strong>for</strong>ms and subsea wellheads. In addition, NCA per<strong>for</strong>ms specializedmaintenance and repair services on production plat<strong>for</strong>ms in the North Sea. NCA'sbusiness is split approximately evenly between the North Sea and the U.S. Gulf ofMexico. The acquisition included a small, non-strategic business operation we intendedto sell when we purchased NCA. During 2011, we sold that operation, making the netacquisition price of the retained NCA operations $50 million. We have accounted <strong>for</strong> thisnet acquisition by allocating the purchase price to the assets acquired and liabilitiesassumed based on their estimated fair values at the date of acquisition. Our goodwill, allnondeductible <strong>for</strong> income tax purposes, associated with the acquisition was $18 million,and other intangible assets were $16 million. This purchase price allocation ispreliminary and based on in<strong>for</strong>mation currently available to us, and is subject to changewhen we obtain final asset and liability valuations. The results of operations of NCA areincluded in our consolidated statements of income from the date of acquisition.On December 20, 2011, we purchased AGR Field Operations Holdings AS andsubsidiaries (collectively, "AGR FO"), which we believe is Norway's largest asset integritymanagement service provider on offshore production plat<strong>for</strong>ms, onshore facilities, andpipelines. AGR FO employs subsea technology to per<strong>for</strong>m internal and externalinspections of subsea hardware. AGR FO also has a substantial operating presence inAustralia where it operates and maintains offshore and onshore oil and gas productionfacilities <strong>for</strong> customers and provides subsea engineering services and operates anoffshore logistics supply base. We incurred, and charged to expense, approximately$2 million of transaction costs associated with this acquisition.We have accounted <strong>for</strong> this acquisition by allocating the purchase price to the assetsacquired and liabilities assumed based on their estimated fair values at the date ofacquisition. Our goodwill, all nondeductible <strong>for</strong> income tax purposes, associated with theacquisition was $165 million, and other intangible assets were $32 million. This purchaseprice allocation is preliminary and based on in<strong>for</strong>mation currently available to us, and issubject to change when we obtain final asset and liability valuations. As we acquiredAGR FO late in December 2011, its results of operations are included in our consolidatedstatements of income from the date of acquisition, but the 2011 results were not material.Generally, AGR FO's Norwegian assets and operations are in our Asset Integrity2011 Annual Report 33
segment and its Australian assets and operations are in our Subsea Projects segment.Our consolidated results of operations on an unaudited pro <strong>for</strong>ma basis, as thoughAGR FO had been acquired on January 1, 2010, are as follows:(in millions, except per share figures) 2011 2010Pro <strong>for</strong>ma revenue $ 2,385.6 $ 2,094.0Pro <strong>for</strong>ma net income 239.5 200.8Pro <strong>for</strong>ma diluted earnings per share 2.20 1.83The above amounts are based on certain assumptions and estimates that we believe arereasonable. The pro <strong>for</strong>ma results reflect events occurring as a direct result of thepurchase and do not necessarily represent results which would have occurred if theacquisition had taken place on the basis assumed above, nor are they indicative of theresults of future combined operations.On December 27, 2011, we purchased Mechanica AS, a design and fabrication companyspecializing in remotely operated subsea tools <strong>for</strong> the offshore oil and gas industry, <strong>for</strong>$17 million. We have accounted <strong>for</strong> this acquisition by allocating the purchase price tothe assets acquired and liabilities assumed based on their estimated fair values at thedate of acquisition. Our goodwill, all nondeductible <strong>for</strong> income tax purposes, associatedwith the acquisition was $9 million, and other intangible assets were $5 million. Thispurchase price allocation is preliminary and based on in<strong>for</strong>mation currently available tous, and is subject to change when we obtain final asset and liability valuations. As weacquired Mechanica AS late in December 2011, its results of operations are included inour consolidated statements of income from the date of acquisition, but the 2011 resultswere not material.We also made several smaller acquisitions during the periods presented.Except <strong>for</strong> AGR FO, the above acquisitions were not material. As a result, we have notincluded pro <strong>for</strong>ma in<strong>for</strong>mation related to those acquisitions in this report.Goodwill and Intangible Assets. In September 2011, the FASB issued an updateregarding goodwill impairment testing. Under the update, an entity has the option to firstassess qualitative factors to determine whether the existence of events or circumstancesleads to a determination that it is more likely than not that the fair value of a reporting unitis less than its carrying amount. Our reporting units are the operating units one levelbelow our business segments, except <strong>for</strong> ROVs and Asset Integrity, which are tested assingle reporting units. If, after assessing the totality of events or circumstances, an entitydetermines it is not more likely than not that the fair value of a reporting unit is less thanits carrying amount, per<strong>for</strong>ming the two-step impairment test is unnecessary. However, ifan entity concludes otherwise, then it is required to per<strong>for</strong>m the first step of the two-stepimpairment test. This update is effective <strong>for</strong> us January 1, 2012, and earlier adoption ispermitted. We have elected to adopt this update early and we applied it in 2011. Theprovisions of the update have not had a material effect on our financial position or resultsof operations. We tested the goodwill attributable to each of our reporting units <strong>for</strong>impairment as of December 31, 2010 and 2009 and concluded that there was noimpairment. We estimated fair value using discounted cash flow methodologies and34 <strong>Oceaneering</strong> International, Inc.
market comparable in<strong>for</strong>mation. The only changes in our reporting units' goodwill duringthe periods presented are from business acquisitions, as discussed above, and currencyexchange rate changes. For more in<strong>for</strong>mation regarding goodwill by business segment,see Note 7.Intangible assets, primarily acquired in connection with business combinations, includetrade names, intellectual property and customer relationships and are being amortizedwith a weighted average remaining life of approximately 12 years.Revenue Recognition. We recognize our revenue according to the type of contractinvolved. On a daily basis, we recognize revenue under contracts that provide <strong>for</strong>specific time, material and equipment charges, which we bill periodically, ranging fromweekly to monthly.We account <strong>for</strong> significant fixed-price contracts, which we enter into mainly in our SubseaProducts segment, and to a lesser extent in our Subsea Projects and AdvancedTechnologies segments, using the percentage-of-completion method. In 2011, weaccounted <strong>for</strong> 16% of our revenue using the percentage-of-completion method. Indetermining whether a contract should be accounted <strong>for</strong> using the percentage-ofcompletionmethod, we consider whether:• the customer provides specifications <strong>for</strong> the construction of facilities or productionof goods or <strong>for</strong> the provision of related services;• we can reasonably estimate our progress towards completion and our costs;• the contract includes provisions as to the en<strong>for</strong>ceable rights regarding the goodsor services to be provided, consideration to be received and the manner andterms of payment;• the customer can be expected to satisfy its obligations under the contract; and• we can be expected to per<strong>for</strong>m our contractual obligations.Under the percentage-of-completion method, we recognize estimated contract revenuebased on costs incurred to date as a percentage of total estimated costs. Changes in theexpected cost of materials and labor, productivity, scheduling and other factors affect thetotal estimated costs. Additionally, external factors, including weather or other factorsoutside of our control, also affect the progress and estimated cost of a project’scompletion and, there<strong>for</strong>e, the timing of income and revenue recognition. We routinelyreview estimates related to our contracts and reflect revisions to profitability in earningsimmediately. If a current estimate of total contract cost indicates an ultimate loss on acontract, we recognize the projected loss in full when we determine it. Although we arecontinually striving to accurately estimate our contract costs and profitability, adjustmentsto overall contract costs could be significant in future periods.We recognize the remainder of our revenue when persuasive evidence of anarrangement exists, delivery has occurred or services have been rendered, price is fixedor determinable and collection is reasonably assured.Revenue in Excess of Amounts Billed is classified as accounts receivable and relates torecoverable costs and accrued profits on contracts in progress. Billings in Excess ofRevenue Recognized on uncompleted contracts are classified in accrued liabilities.2011 Annual Report 35
Revenue in Excess of Amounts Billed on uncompleted fixed-price contracts accounted <strong>for</strong>using the percentage-of-completion method is summarized as follows:December 31,(in thousands) 2011 2010Revenue recognized $ 271,233 $ 262,602Less: Billings to customers (252,745) (238,473)Revenue in excess of amounts billed $ 18,488 $ 24,129Billings in Excess of Revenue Recognized on uncompleted fixed-price contractsaccounted <strong>for</strong> using the percentage-of-completion method are summarized as follows:December 31,(in thousands) 2011 2010Amounts billed to customers $ 78,876 $ 90,315Less: Revenue recognized (42,952 ) (45,144 )Billings in excess of revenue recognized $ 35,924 $ 45,171Stock-Based Compensation. We recognize all share-based payments to directors,officers and employees over their vesting periods in the income statement based on theirestimated fair values.The Compensation Committee of our Board of Directors has expressed its intention torefrain from using stock options as a component of compensation <strong>for</strong> our executiveofficers and other employees <strong>for</strong> the <strong>for</strong>eseeable future. Additionally, our Board ofDirectors has expressed its intention to refrain from using stock options as a componentof nonemployee director compensation <strong>for</strong> the <strong>for</strong>eseeable future. No stock options havebeen granted since 2005, and we no longer have any stock options outstanding. Formore in<strong>for</strong>mation on our employee benefit plans, see Note 8.Income Taxes. We provide income taxes at appropriate tax rates in accordance with ourinterpretation of the respective tax laws and regulations after review and consultation withour internal tax department, tax advisors and, in some cases, legal counsel in variousjurisdictions. We provide <strong>for</strong> deferred income taxes <strong>for</strong> differences between carryingamounts of assets and liabilities <strong>for</strong> financial and tax reporting purposes. Our policy is toprovide <strong>for</strong> deferred U.S. income taxes on <strong>for</strong>eign income only to the extent such incomeis not to be indefinitely reinvested in <strong>for</strong>eign entities. We provide a valuation allowanceagainst deferred tax assets when it is more likely than not that the asset will not berealized.We recognize the benefit <strong>for</strong> a tax position if the benefit is more likely than not to besustainable upon audit by the applicable taxing authority. If this threshold is met, the taxbenefit is then measured and recognized at the largest amount that is greater than 50percent likely of being realized upon ultimate settlement. We account <strong>for</strong> any applicableinterest and penalties on uncertain tax positions as a component of our provision <strong>for</strong>income taxes on our financial statements.36 <strong>Oceaneering</strong> International, Inc.
Foreign Currency Translation. The functional currency <strong>for</strong> several of our <strong>for</strong>eignsubsidiaries is the applicable local currency. Results of operations <strong>for</strong> <strong>for</strong>eignsubsidiaries with functional currencies other than the U.S. dollar are translated into U.S.dollars using average exchange rates during the period. Assets and liabilities of these<strong>for</strong>eign subsidiaries are translated into U.S. dollars using the exchange rates in effect atthe balance sheet date, and the resulting translation adjustments are recognized inaccumulated other comprehensive income as a component of shareholders' equity. All<strong>for</strong>eign currency transaction gains and losses are recognized currently in theConsolidated Statements of Income. We recorded $(0.4) million, $(2.8) million and$2.0 million of <strong>for</strong>eign currency transaction gains (losses) in 2011, 2010 and 2009,respectively, and those amounts are included as a component of Other income(expense), net.Based on changes in the economic facts and circumstances of our operations in Brazil,we have changed the functional currency of our Brazilian subsidiary from the U.S. dollarto the Brazilian real effective January 1, 2011. This change had no material effect on ourfinancial statements.Earnings Per Share. The table that follows presents our earnings per share calculations.Year Ended December 31,2011 2010 2009(in thousands, except per share data)Basic earnings per share:Net income per consolidated statements of income $ 235,658 $ 200,531 $ 188,353Income allocable to participating securities — (709 ) (1,324 )Earnings allocable to common shareholders $ 235,658 $ 199,822 $ 187,029Basic shares outstanding 108,308 109,119 109,532Basic earnings per share $ 2.18 $ 1.83 $ 1.71Diluted earnings per share:Net income per consolidated statements of income $ 235,658 $ 200,531 $ 188,353Income allocable to participating securities — (706 ) (1,318 )Earnings allocable to diluted common shareholders $ 235,658 $ 199,825 $ 187,035Diluted shares outstanding 109,001 109,535 110,053Diluted earnings per share $ 2.16 $ 1.82 $ 1.70Financial Instruments. We recognize all derivative instruments as either assets orliabilities in the balance sheet and measure those instruments at fair value. Subsequentchanges in fair value are reflected in current earnings or other comprehensive income,depending on whether a derivative instrument is designated as part of a hedge2011 Annual Report 37
elationship and, if it is, the type of hedge relationship. As of December 31, 2011, we hadno derivative instruments in effect.New Accounting Standards. In October 2009, the Financial Accounting Standards Board("FASB") issued an update regarding accounting <strong>for</strong> revenue involving multipledeliverablearrangements that will, in certain circumstances, require sellers to account <strong>for</strong>more products or services ("deliverables") separately rather than as a combined unit.This update establishes a selling price hierarchy <strong>for</strong> determining the selling price of adeliverable. The update also replaces the term fair value in the revenue allocationguidance with selling price to clarify that the allocation of revenue is based on entityspecificassumptions rather than assumptions of a marketplace participant. The updateeliminates the residual method of allocation and requires that arrangement considerationbe allocated at the inception of the arrangement to all deliverables using the relativeselling price method. The update requires that a seller determine its <strong>best</strong> estimatedselling price in a manner that is consistent with that used to determine the price to sell thedeliverable on a stand-alone basis. The update does not prescribe any specific methodsthat sellers must use to accomplish this objective, but provides guidance.For us, the update was effective prospectively <strong>for</strong> revenue arrangements entered into ormaterially modified on or after January 1, 2011. The provisions of the update have nothad a material effect on our financial position or results of operations.In June 2011, the FASB issued an update to allow an entity the option to present the totalof comprehensive income, the components of net income, and the components of othercomprehensive income in either a single continuous statement of comprehensive incomeor two separate but consecutive statements. Under either option, an entity is required topresent each component of net income along with total net income, each component ofother comprehensive income along with a total <strong>for</strong> other comprehensive income, and atotal amount <strong>for</strong> comprehensive income. This update eliminates the option to present thecomponents of other comprehensive income as part of the statement of changes instockholders' equity. This update does not change the items that are required to bereported in other comprehensive income or when an item of other comprehensive incomemust be reclassified to net income and is required to be applied retrospectively. Thisupdate is effective <strong>for</strong> us January 1, 2012. Early adoption is permitted. We have electedto adopt this update and we are reporting the total of comprehensive income, thecomponents of net income, and the components of other comprehensive income in twoseparate consecutive statements.In September 2011, the FASB issued an update regarding an employer's participation ina multiemployer pension plan. For employers that participate in multiemployer pensionplans, the update requires an employer to provide additional quantitative and qualitativedisclosures. The amended disclosures provide users with more detailed in<strong>for</strong>mationabout an employer's involvement in multiemployer pension plans, including:• the significant multiemployer plans in which an employer participates, includingthe plan names and identifying numbers;• the level of an employer's participation in the significant multiemployer plans,including the employer's contributions made to the plans and an indication ofwhether the employer's contributions represent more than 5 percent of the totalcontributions made to the plans by all contributing employers;38 <strong>Oceaneering</strong> International, Inc.
• the financial health of the significant multiemployer plans, including an indicationof the funded status, whether funding improvement plans are pending orimplemented, and whether any plan has imposed surcharges on thecontributions to the plan; and• the nature of the employer commitments to the plans, including when thecollective-bargaining agreements that require contributions to the significantplans are set to expire and whether those agreements require minimumcontributions be made to the plans.This update was effective <strong>for</strong> us December 31, 2011. We have no materialmultiemployer pension plans.2. INVESTMENTS IN UNCONSOLIDATED AFFILIATESOur investments in unconsolidated affiliates consisted of the following:December 31,(in thousands) 2011 2010 2009Medusa Spar LLC $ 49,480 $ 51,820 $ 57,388Other 127 — 1,348$ 49,607 $ 51,820 $ 58,736In 2003, we purchased a 50% equity interest in Medusa Spar LLC <strong>for</strong> $43.7 million.Medusa Spar LLC owns a 75% interest in a production spar plat<strong>for</strong>m in the U.S. Gulf ofMexico. Medusa Spar LLC's revenue is derived from processing oil and gas production<strong>for</strong> a fee based on the volumes processed through the plat<strong>for</strong>m (throughput).Medusa Spar LLC financed its acquisition of its 75% interest in the production sparplat<strong>for</strong>m using approximately 50% debt and 50% equity from its equity holders. The debtwas repaid in 2008. We believe our maximum exposure to loss from our investment inMedusa Spar LLC is our $49.5 million investment. Medusa Spar LLC is a variableinterest entity. We are not the primary beneficiary of Medusa Spar LLC, since we do notown a controlling interest, nor do we manage the operations of the asset it owns. As weare not the primary beneficiary, we are accounting <strong>for</strong> our investment inMedusa Spar LLC under the equity method of accounting. Summarized 100% financialin<strong>for</strong>mation relative to Medusa Spar LLC follows.2011 Annual Report 39
December 31,(in thousands) 2011 2010 2009Medusa Spar LLCCondensed Balance SheetsASSETSCash and cash equivalents $ 2,904 $ 217 $ 949Other current assets 5,302 3,189 4,116Property and Equipment, net 91,073 100,551 110,028Total Assets $ 99,279 $ 103,957 $ 115,093LIABILITIES AND MEMBERS’ EQUITYCurrent Liabilities $ 18 $ 18 $ 17Members’ Equity 99,261 103,939 115,076Total Liabilities and Members’ Equity $ 99,279 $ 103,957 $ 115,093Condensed Statements of OperationsRevenue $ 17,536 $ 13,816 $ 16,143Depreciation (9,478) (9,478) (9,478)General and Administrative (72) (71) (70)Net Income $ 7,986 $ 4,267 $ 6,595Our 50% share of the underlying equity of the net assets of Medusa Spar LLC isapproximately equal to its carrying value. Our 50% share of the cumulative undistributedearnings of Medusa Spar LLC was $7.8 million and $10.2 million at December 31, 2011and 2010, respectively. We received cash distributions of $6.3 million, $7.7 million and$8.5 million from Medusa Spar LLC in 2011, 2010 and 2009, respectively.3. INCOME TAXESOur provisions <strong>for</strong> income taxes and our cash taxes paid are as follows:Year Ended December 31,(in thousands) 2011 2010 2009Current:Domestic $ 14,027 $ 16,501 $ 10,659Foreign 80,698 57,006 69,132Total current 94,725 73,507 79,791Deferred:Domestic 8,934 19,730 12,029Foreign (1,432 ) 11,454 9,602Total deferred 7,502 31,184 21,631Total provision <strong>for</strong> income taxes $ 102,227 $ 104,691 $ 101,422Cash taxes paid $ 72,825 $ 121,440 $ 54,50440 <strong>Oceaneering</strong> International, Inc.
The components of income be<strong>for</strong>e income taxes are as follows:Year Ended December 31,(in thousands) 2011 2010 2009Domestic $ 41,831 $ 87,776 $ 65,174Foreign 296,054 217,446 224,601Income be<strong>for</strong>e income taxes $ 337,885 $ 305,222 $ 289,775As of December 31, 2011 and 2010, our worldwide deferred tax assets, liabilities and netdeferred tax liabilities were as follows:December 31,(in thousands) 2011 2010Deferred tax assets:Deferred compensation $ 26,923 $ 24,791Deferred income 11,588 19,808Accrued expenses 8,647 6,675Other 4,875 5,360Gross deferred tax assets 52,033 56,634Valuation allowance — —Total deferred tax assets $ 52,033 $ 56,634Deferred tax liabilities:Property and equipment $ 88,657 $ 74,832Unremitted <strong>for</strong>eign earnings 58,195 62,373Basis difference in equity investments 15,518 17,177Other 26,477 13,580Total deferred tax liabilities $ 188,847 $ 167,962Net deferred income tax liability $ 136,814 $ 111,328Our net deferred tax liability is reflected within our balance sheet as follows:December 31,(in thousands) 2011 2010Deferred tax liabilities $ 157,532 $ 139,822Current deferred tax assets (20,718) (28,494)Net deferred income tax liability $ 136,814 $ 111,328We believe it is more likely than not that all our deferred tax assets are realizable. Weconduct business through several <strong>for</strong>eign subsidiaries and, although we expect ourconsolidated operations to be profitable, there is no assurance that profits will be earned2011 Annual Report 41
in entities or jurisdictions that have net operating loss carry<strong>for</strong>wards available. Theprimary difference between our 2011 effective tax rate of 30.3% and the federal statutoryrate of 35% reflects our intent to indefinitely reinvest in certain of our internationaloperations. There<strong>for</strong>e, we are no longer providing <strong>for</strong> U.S. taxes on a portion of our<strong>for</strong>eign earnings. The effective tax rate of 30.3% in our financial statements <strong>for</strong> 2011 is aresult of our effective rate of 31.5% adjusted by $4.9 million of additional tax benefits,primarily attributable to amending prior years' U.S. federal income tax returns to reflect abroader interpretation of our pre-tax income eligible <strong>for</strong> certain deductions allowable <strong>for</strong>oil and gas construction activities, and tax effecting the $19.6 million gain on the sale ofthe Ocean Legend at the U.S. federal statutory rate of 35%. The primary differencebetween our 2010 effective tax rate of 34.3% and the federal statutory rate of 35% is thelesser federal tax rate applied to our U.S. manufacturing profits. Income taxes, computedby applying the federal statutory income tax rate to income be<strong>for</strong>e income taxes, are notmaterially different than our actual provisions <strong>for</strong> income taxes <strong>for</strong> 2009.We consider $132 million of unremitted earnings of our <strong>for</strong>eign subsidiaries to beindefinitely reinvested. It is not practical <strong>for</strong> us to compute the amount of additional U.S.tax that would be due on this amount. We have provided deferred income taxes on the<strong>for</strong>eign earnings we expect to repatriate.We recognize the benefit <strong>for</strong> a tax position if the benefit is more likely than not to besustainable upon audit by the applicable taxing authority. If this threshold is met, the taxbenefit is then measured and recognized at the largest amount that is greater than 50%likely of being realized upon ultimate settlement.We account <strong>for</strong> any applicable interest and penalties on uncertain tax positions as acomponent of our provision <strong>for</strong> income taxes on our financial statements. We charged$0.4 million, $0.2 million and $0.5 million to income tax expense in 2011, 2010 and 2009,respectively, <strong>for</strong> penalties and interest on uncertain tax positions, which brought our totalliabilities <strong>for</strong> penalties and interest on uncertain tax positions to $4.4 million and$4.0 million on our balance sheets at December 31, 2011 and 2010, respectively.Including associated <strong>for</strong>eign tax credits and penalties and interest, we have accrued a nettotal of $5.6 million in the caption "other long-term liabilities" on our balance sheet <strong>for</strong>unrecognized tax benefits at December 31, 2011. All additions or reductions to thoseliabilities affect our effective income tax rate in the periods of change.A reconciliation of the beginning and ending amount of gross unrecognized tax benefits,not including associated <strong>for</strong>eign tax credits and penalties and interest, is as follows:Year Ended December 31,(in thousands) 2011 2010 2009Beginning of year $ 9,991 $ 9,488 $ 8,402Additions based on tax positions related to thecurrent year 947 1,296 1,361Reductions <strong>for</strong> expiration of statutes of limitations (834) (793) (81)Settlements — — (194)Balance at end of year $ 10,104 $ 9,991 $ 9,488We do not believe that the total of unrecognized tax benefits will significantly increase ordecrease in the next 12 months.42 <strong>Oceaneering</strong> International, Inc.
We file a consolidated U.S. federal income tax return <strong>for</strong> <strong>Oceaneering</strong> International, Inc.and our domestic subsidiaries. We conduct our international operations in a number oflocations that have varying laws and regulations with regard to income and other taxes,some of which are subject to interpretation. Our management believes that adequateprovisions have been made <strong>for</strong> all taxes that will ultimately be payable, although finaldetermination of tax liabilities may differ from our estimates.Our tax returns are subject to audit by taxing authorities in multiple jurisdictions. Theseaudits often take years to complete and settle. The following lists the earliest tax yearsopen to examination by tax authorities where we have significant operations:JurisdictionPeriodsUnited States 2007United Kingdom 2009Norway 2001Angola 2006Nigeria 2005Brazil 2006Australia 2008Canada 20082011 Annual Report 43
4. SELECTED BALANCE SHEET AND INCOME STATEMENT INFORMATIONThe following is in<strong>for</strong>mation regarding selected balance sheet accounts:December 31,(in thousands) 2011 2010Inventory:Inventory <strong>for</strong> remotely operated vehicles $ 135,297 $ 119,106Other inventory, primarily raw materials 119,798 117,411Total $ 255,095 $ 236,517Other Current Assets:Deferred income taxes $ 20,718 $ 28,494Prepaid expenses 52,355 49,258Total $ 73,073 $ 77,752Other Non-Current Assets:Intangible assets $ 70,611 $ 22,208Cash surrender value of life insurance policies 38,318 36,339Long-term portion of accounts receivable, net 21,658 —Other 9,449 7,030Total $ 140,036 $ 65,577Accrued Liabilities:Payroll and related costs $ 191,430 $ 168,476Accrued job costs 51,296 50,323Deferred revenue, including billings in excess of revenuerecognized 52,132 68,131Other 40,303 27,480Total $ 335,161 $ 314,410Other Long-Term Liabilities:Deferred income taxes $ 157,532 $ 139,822Supplemental Executive Retirement Plan 34,768 32,341Accrued post-employment benefit obligations 13,935 14,245Other 14,972 14,027Total $ 221,207 $ 200,43544 <strong>Oceaneering</strong> International, Inc.
Additional Income Statement DetailThe following schedule shows our revenue, costs and gross margins by services andproducts:Year Ended December 31,(in thousands) 2011 2010 2009Revenue:Services $ 1,369,614 $ 1,277,795 $ 1,275,263Products 823,049 639,250 546,818Total revenue 2,192,663 1,917,045 1,822,081Cost of Services and Products:Services 999,396 916,495 897,654Products 603,289 461,477 421,438Unallocated expenses 81,219 72,753 65,263Total cost of services and products 1,683,904 1,450,725 1,384,355Gross margin:Services 370,218 361,300 377,609Products 219,760 177,773 125,380Unallocated expenses (81,219) (72,753) (65,263)Total gross margin $ 508,759 $ 466,320 $ 437,7265. DEBTLong-term Debt consisted of the following:December 31,(in thousands) 2011 2010Revolving credit facility $ 120,000 $ —Long-term Debt $ 120,000 $ —As of December 31, 2011, we had a $300 million revolving credit facility under anagreement (the "Credit Agreement") that extended to January 2012. We had to pay acommitment fee ranging from 0.125% to 0.175% on the unused portion of the facility,depending on our debt-to-capitalization ratio. The commitment fees are included asinterest expense in our consolidated financial statements. Under the Credit Agreement,we had the option to borrow at LIBOR plus a margin ranging from 0.50% to 1.25%,depending on our debt-to-capitalization ratio, or at the agent bank's prime rate. AtDecember 31, 2011, we had $120 million of borrowings outstanding under the CreditAgreement and $180 million available <strong>for</strong> borrowing. The weighted average interest rateon all our outstanding borrowings was 0.8% at December 31, 2011.2011 Annual Report 45
On January 6, 2012, we entered into a credit agreement with a group of banks (the "2012Credit Agreement") and terminated the Credit Agreement. Simultaneously with theexecution of the 2012 Credit Agreement and pursuant to its terms, we repaid all amountsoutstanding under, and terminated, the Credit Agreement. The 2012 Credit Agreementprovides <strong>for</strong> a five-year, $300 million revolving credit facility. Subject to certainconditions, the aggregate commitments under the facility may be increased by to up to$200 million by obtaining additional commitments from existing and/or new lenders.Borrowings under the facility may be used <strong>for</strong> working capital and general corporatepurposes. The facility expires on January 6, 2017. Revolving borrowings under thefacility bear interest at an adjusted base rate or the Eurodollar Rate (as defined in theagreement), at our option, plus an applicable margin. Depending on our debt tocapitalization ratio, the applicable margin varies (1) in the case of adjusted base rateadvances, from 0.125% to 0.750% and (2) in the case of eurodollar advances, from1.125% to 1.750%. The adjusted base rate is the greater of (1) the per annum rateestablished by administrative agent as its prime rate, (2) the federal funds rate plus0.50% and (3) the one-month Eurodollar Rate plus 1%.The 2012 Credit Agreement contains various covenants which we believe are customary<strong>for</strong> agreements of this nature, including, but not limited to, restrictions on the ability ofeach of our restricted subsidiaries to incur unsecured debt, as well as restrictions on ourability and the ability of each of our restricted subsidiaries to incur secured debt, grantliens, make certain investments, make distributions, merge or consolidate, sell assets,enter into transactions with affiliates and enter into certain restrictive agreements. We arealso subject to an interest coverage ratio and a debt to capitalization ratio. The 2012Credit Agreement includes customary events and consequences of default.We made cash interest payments of $1.1 million, $7.2 million and $8.9 million in 2011,2010 and 2009, respectively. Cash interest payments, and interest expense, in 2010include $2.9 million to terminate an interest rate hedge.6. COMMITMENTS AND CONTINGENCIESLease CommitmentsAt December 31, 2011, we occupied several facilities under noncancellable operatingleases expiring at various dates through 2025. Future minimum rentals under all of ouroperating leases, including vessel rentals, are as follows:(in thousands)2012 $ 48,6622013 26,5392014 13,7692015 9,9302016 6,916Thereafter 31,652Total Lease Commitments $ 137,46846 <strong>Oceaneering</strong> International, Inc.
Rental expense, which includes hire of vessels, specialized equipment and real estaterental, was approximately $73 million, $69 million and $74 million in 2011, 2010 and2009, respectively.In 2012, we chartered a vessel and crew <strong>for</strong> three years with two one-year options <strong>for</strong> ourfield operations contract in Angola. Total charter hire will be $94 million <strong>for</strong> the first threeyears.InsuranceWe self-insure <strong>for</strong> workers' compensation, maritime employer's liability andcomprehensive general liability claims to levels we consider financially prudent, andbeyond the self-insurance level of exposure, we carry insurance, which can be byoccurrence or in the aggregate. We determine the level of accruals <strong>for</strong> claims exposureby reviewing our historical experience and current year claim activity. We do not recordaccruals on a present-value basis. We review larger claims with insurance adjusters andestablish specific reserves <strong>for</strong> known liabilities. We establish an additional reserve <strong>for</strong>incidents incurred but not reported to us <strong>for</strong> each year using our estimates and based onprior experience. We believe we have established adequate accruals <strong>for</strong> uninsuredexpected liabilities arising from those obligations. However, it is possible that futureearnings could be affected by changes in our estimates relating to these matters.LitigationVarious actions and claims are pending against us, most of which are covered byinsurance. Although we cannot predict the ultimate outcome of these matters, we believethe ultimate liability, if any, that may result from these actions and claims will notmaterially affect our results of operations, cash flow or financial position.Letters of CreditWe had $38 million and $30 million in letters of credit outstanding as ofDecember 31, 2011 and 2010, respectively, as guarantees in <strong>for</strong>ce <strong>for</strong> self-insurancerequirements and various per<strong>for</strong>mance and bid bonds, which are usually <strong>for</strong> the durationof the applicable contract.2011 Annual Report 47
Financial Instruments and Risk ConcentrationIn the normal course of business, we manage risks associated with <strong>for</strong>eign exchangerates and interest rates through a variety of strategies, including the use of hedgingtransactions. As a matter of policy, we do not use derivative instruments unless there isan underlying exposure.Other financial instruments that potentially subject us to concentrations of credit risk areprincipally cash and cash equivalents and accounts receivable. The carrying values ofcash and cash equivalents and bank borrowings approximate their fair values due to theshort maturity of those instruments or the short-term duration of the associated interestrate periods. Accounts receivable are generated from a broad group of customers,primarily from within the energy industry, which is our major source of revenue. Due totheir short-term nature, carrying values of our accounts receivable and accounts payableapproximate fair market value.One customer in Angola owed us $40 million at December 31, 2011 and $56 million atDecember 31, 2010, all of which is overdue. We completed the work on the contractsrelated to this receivable in the first quarter of 2010. Based on our past history with thiscustomer, we believe this receivable ultimately will be collected. During 2011, based onour current estimate of when the receivable will be collected, we reduced the net carryingvalue of the receivable by $3 million to reflect a present value estimate and reclassified$22 million to Other non-current assets on our balance sheet at December 31, 2011,which represents the amount we believe will be collected more than one year from thebalance sheet date. The $3 million adjustment was charged against our earnings as areduction of revenue in our Subsea Projects segment.48 <strong>Oceaneering</strong> International, Inc.
7. OPERATIONS BY BUSINESS SEGMENT AND GEOGRAPHIC AREABusiness Segment In<strong>for</strong>mationWe are a global oilfield provider of engineered services and products, primarily to theoffshore oil and gas industry, with a focus on deepwater applications. Through the use ofour applied technology expertise, we also serve the defense and aerospace industries.Our Oil and Gas business consists of Remotely Operated Vehicles ("ROVs"), SubseaProducts, Subsea Projects and Asset Integrity. Our ROV segment provides submersiblevehicles operated from the surface to support offshore oil and gas exploration, productionand construction activities. Our Subsea Products segment supplies a variety of built-toorderspecialty subsea hardware. Our Subsea Projects segment provides multiservicevessels, oilfield diving and support vessel operations, which are used primarily ininspection, repair and maintenance and installation activities, and a <strong>mobile</strong> offshoreproduction system, through a 50% interest in an entity which holds a 75% interest in thesystem. With the acquisition of AGR FO in December 2011, we also operate andmaintain offshore and onshore oil and gas production facilities, provide subseaengineering services, and operate an offshore logistics supply base in Australia. OurAsset Integrity segment, which was previously named Inspection, provides asset integritymanagement and assessment services and nondestructive testing and inspection. Werenamed Inspection to Asset Integrity to more appropriately describe the services we areproviding after our acquisition of AGR FO. Our Advanced Technologies businessprovides project management, engineering services and equipment <strong>for</strong> applications innon-oilfield markets. Unallocated Expenses are those not associated with a specificbusiness segment. These consist of expenses related to our incentive and deferredcompensation plans, including restricted stock and bonuses, as well as other generalexpenses, including corporate administrative expenses.There are no differences in the basis of segmentation or in the basis of measurement ofsegment profit or loss in the year ended December 31, 2011 from those used in ourconsolidated financial statements <strong>for</strong> the years ended December 31, 2010 and 2009,except <strong>for</strong> the change in the name of Inspection to Asset Integrity.2011 Annual Report 49
The table that follows presents Revenue, Income from Operations, Depreciation andAmortization Expense and Equity Earnings of Unconsolidated Affiliates by businesssegment:Year Ended December 31,(in thousands) 2011 2010 2009RevenueOil and GasRemotely Operated Vehicles $ 755,033 $ 662,105 $ 649,228Subsea Products 770,212 549,233 487,726Subsea Projects 167,477 247,538 274,607Asset Integrity 266,577 223,469 216,140Total Oil and Gas 1,959,299 1,682,345 1,627,701Advanced Technologies 233,364 234,700 194,380Total $ 2,192,663 $ 1,917,045 $ 1,822,081Income from OperationsOil and GasRemotely Operated Vehicles $ 224,705 $ 211,725 $ 207,683Subsea Products 142,184 108,522 60,526Subsea Projects 32,662 46,910 75,404Asset Integrity 30,560 25,893 26,443Total Oil and Gas 430,111 393,050 370,056Advanced Technologies 16,661 16,934 12,366Unallocated Expenses (111,941) (100,484) (90,306)Total $ 334,831 $ 309,500 $ 292,116Depreciation and Amortization ExpenseOil and GasRemotely Operated Vehicles $ 100,089 $ 86,232 $ 68,022Subsea Products 31,299 27,956 24,133Subsea Projects 8,024 25,826 19,011Asset Integrity 5,689 4,098 3,794Total Oil and Gas 145,101 144,112 114,960Advanced Technologies 3,134 4,588 2,526Unallocated Expenses 2,992 4,951 5,459Total $ 151,227 $ 153,651 $ 122,945Equity Earnings of Unconsolidated AffiliatesSubsea Projects $ 3,937 $ 2,078 $ 3,242Subsea Products (136) — —Total $ 3,801 $ 2,078 $ 3,24250 <strong>Oceaneering</strong> International, Inc.
We determine income from operations <strong>for</strong> each business segment be<strong>for</strong>e interest incomeor expense, other income (expense) and provision <strong>for</strong> income taxes. We do not consideran allocation of these items to be practical.During 2011, we sold the Ocean Legend, a <strong>mobile</strong> offshore production system. The saleresulted in a gain of $19.6 million, which we recognized as a reduction of the costs ofservices and products in our Subsea Projects segment.Depreciation and amortization expense <strong>for</strong> Subsea Projects in 2010 includes animpairment charge of $5.2 million in the first quarter to reduce the carrying value of ourvessel held <strong>for</strong> sale, The Per<strong>for</strong>mer, to its fair value, less estimated costs to sell. In thethird quarter of 2010, we sold the vessel <strong>for</strong> approximately its reduced carrying value.During 2010, revenue from one customer, BP plc and subsidiaries in our oil and gasbusiness segments, accounted <strong>for</strong> 12% of our total consolidated revenue. No individualcustomer accounted <strong>for</strong> more than 10% of our consolidated revenue during 2011 or2009.2011 Annual Report 51
The following table presents Assets, Property and Equipment and Goodwill by businesssegment as of the dates indicated:December 31,(in thousands) 2011 2010AssetsOil and GasRemotely Operated Vehicles $ 861,059 $ 774,011Subsea Products 659,211 511,406Subsea Projects 338,205 249,259Asset Integrity 284,159 90,357Total Oil and Gas 2,142,634 1,625,033Advanced Technologies 62,627 54,378Corporate and Other 195,283 351,095Total $ 2,400,544 $ 2,030,506Property and Equipment, netOil and GasRemotely Operated Vehicles $ 517,098 $ 488,581Subsea Products 184,911 159,505Subsea Projects 141,178 109,761Asset Integrity 30,327 15,238Total Oil and Gas 873,514 773,085Advanced Technologies 9,272 6,143Corporate and Other 10,522 7,145Total $ 893,308 $ 786,373GoodwillOil and GasRemotely Operated Vehicles $ 26,908 $ 27,125Subsea Products 112,817 87,492Asset Integrity 183,292 18,163Total Oil and Gas 323,017 132,780Advanced Technologies 10,454 10,454Total $ 333,471 $ 143,234All assets specifically identified with a particular business segment have beensegregated. Cash and cash equivalents, certain other current assets, certaininvestments and other assets have not been allocated to particular business segmentsand are included in Corporate and Other.52 <strong>Oceaneering</strong> International, Inc.
The following table presents Capital Expenditures, including business acquisitions, bybusiness segment <strong>for</strong> the periods indicated:Year Ended December 31,(in thousands) 2011 2010 2009Capital ExpendituresOil and GasRemotely Operated Vehicles $ 135,770 $ 109,377 $ 146,707Subsea Products 100,824 41,802 13,694Subsea Projects 64,803 43,506 2,817Asset Integrity 212,951 9,551 6,611Total Oil and Gas 514,348 204,236 169,829Advanced Technologies 5,757 2,351 3,234Corporate and Other 6,540 593 1,958Total $ 526,645 $ 207,180 $ 175,0212011 Annual Report 53
Geographic Operating AreasThe following table summarizes certain financial data by geographic area:Year Ended December 31,(in thousands) 2011 2010 2009RevenueForeign:Norway $ 310,891 $ 212,854 $ 230,874West Africa 284,642 260,377 280,707United Kingdom 256,565 156,114 156,748Asia and Australia 217,094 136,518 135,721Brazil 155,532 135,510 97,401Other 93,325 72,157 60,610Total Foreign 1,318,049 973,530 962,061United States 874,614 943,515 860,020Total $ 2,192,663 $ 1,917,045 $ 1,822,081Long-Lived AssetsForeign:Norway $ 436,043 $ 165,942 $ 170,617West Africa 120,732 106,028 95,326United Kingdom 65,830 70,730 63,334Asia and Australia 72,518 76,835 76,622Brazil 99,709 79,484 63,653Other 30,633 28,569 20,490Total Foreign 825,465 527,588 490,042United States 552,639 483,078 487,453Total $ 1,378,104 $ 1,010,666 $ 977,495Revenue is based on location where services are per<strong>for</strong>med and products aremanufactured.8. EMPLOYEE BENEFIT PLANS AND SHAREHOLDER RIGHTS PLANRetirement Investment PlansWe have several employee retirement investment plans that, taken together, cover mostof our full time employees. The <strong>Oceaneering</strong> Retirement Investment Plan is a 401(k)plan in which U.S. employees may participate by deferring a portion of their grossmonthly salary and directing us to contribute the deferred amount to the plan. We matcha portion of the employees' deferred compensation. Our contributions to the 401(k) planwere $14.5 million, $13.9 million and $13.2 million <strong>for</strong> the plan years endedDecember 31, 2011, 2010 and 2009, respectively.54 <strong>Oceaneering</strong> International, Inc.
We also make matching contributions to other <strong>for</strong>eign employee savings plans similar innature to a 401(k) plan. In 2011, 2010 and 2009, these contributions, principally relatedto plans associated with U.K. and Norwegian subsidiaries, were $9.6 million, $7.1 millionand $6.3 million, respectively.The <strong>Oceaneering</strong> International, Inc. Supplemental Executive Retirement Plan coversselected key management employees and executives, as approved by the CompensationCommittee of our Board of Directors (the "Compensation Committee"). Under this plan,we accrue an amount determined as a percentage of the participant's gross monthlysalary and the amounts accrued are treated as if they are invested in one or moreinvestment vehicles pursuant to this plan. Expenses related to this plan during 2011,2010 and 2009 were $3.4 million, $3.3 million and $3.5 million, respectively.We have defined benefit plans covering some of our employees in the U.K. and Norway.There are no further benefits accruing under the U.K. plan, and the Norway plan is closedto new participants. The projected benefit obligations <strong>for</strong> both plans were $25 million and$24 million, at December 31, 2011 and 2010, respectively, and the fair values of the planassets (using Level 2 inputs) <strong>for</strong> both plans were $19 million and $17 million atDecember 31, 2011 and 2010, respectively.Incentive and Stock Option PlansUnder our 2010 Incentive Plan (the "Incentive Plan"), shares of our common stock aremade available <strong>for</strong> awards to employees and nonemployee members of our Board ofDirectors.The Incentive Plan is administered by the Compensation Committee; however, the fullBoard of Directors makes determinations regarding awards to nonemployee directorsunder the Incentive Plan. The Compensation Committee or our Board of Directors, asapplicable, determines the type or types of award(s) to be made to each participant andsets <strong>for</strong>th in the related award agreement the terms, conditions and limitations applicableto each award. Stock options, stock appreciation rights and stock and cash awards maybe made under the Incentive Plan. There are no options outstanding under the IncentivePlan. Under the Incentive Plan, a stock option must have a term not exceeding sevenyears from the date of grant and must have an exercise price of not less than the fairmarket value of a share of our common stock on the date of grant. The CompensationCommittee may not: (1) grant, in exchange <strong>for</strong> a stock option, a new stock option havinga lower exercise price; or (2) reduce the exercise price of a stock option. We have notgranted any stock options since 2005 and the Compensation Committee has expressedits intention to refrain from using stock options as a component of employeecompensation <strong>for</strong> our executive officers and other employees <strong>for</strong> the <strong>for</strong>eseeable future.Additionally, the Board of Directors has expressed its intention to refrain from using stockoptions as a component of nonemployee director compensation <strong>for</strong> the <strong>for</strong>eseeablefuture.In 2011, 2010 and 2009, the Compensation Committee granted awards of per<strong>for</strong>manceunits under the Incentive Plan and a prior plan to certain of our key executives andemployees, and our Board of Directors granted per<strong>for</strong>mance units under the IncentivePlan and a prior plan to our Chairman of the Board of Directors. The per<strong>for</strong>mance unitsawarded are scheduled to vest in full on the third anniversary of the award date, or prorata over three years if the participant meets certain age and years of service2011 Annual Report 55
equirements. The Compensation Committee and the Board of Directors have approvedspecific financial goals and measures (as defined in the Per<strong>for</strong>mance Award Goals andMeasures), based on our cumulative cash flow from operations and a comparison ofreturn on invested capital and cost of capital <strong>for</strong> each of the three-year periods endingDecember 31, 2013, 2012 and 2011 to be used as the basis <strong>for</strong> the final value of theper<strong>for</strong>mance units. The final value of each per<strong>for</strong>mance unit granted in 2011 and 2010may range from $0 to $150 and the final value of each per<strong>for</strong>mance unit granted in 2009may range from $0 to $125. Upon vesting and determination of value, the value of theper<strong>for</strong>mance units will be payable in cash. As of December 31, 2011, there were393,025 per<strong>for</strong>mance units outstanding.There was no stock option activity during the year ended December 31, 2011. Thefollowing is a summary of our stock option activity <strong>for</strong> the two years endedDecember 31, 2010:Shares underOptionWeightedAverageExercise PriceAggregateIntrinsic ValueBalance at December 31, 2008 305,800 $ 8.55Granted — —Exercised (218,800) 8.60 $ 3,257,000Forfeited (5,000) 8.57Balance at December 31, 2009 82,000 8.44Granted — —Exercised (82,000) 8.44 $ 1,858,000Forfeited — —Balance at December 31, 2010 — $ —We received $0.7 million and $1.9 million from the exercise of stock options in 2010 and2009, respectively. The excess tax benefit realized from tax deductions from stockoptions <strong>for</strong> 2010 and 2009 was $0.9 million and $0.9 million, respectively. Excess taxbenefits from share-based compensation are classified as a cash outflow in cash flowsfrom operating activities and an inflow in cash flows from financing activities in thestatement of cash flows.Restricted Stock Plan In<strong>for</strong>mationDuring 2011, 2010 and 2009, the Compensation Committee granted restricted units ofour common stock to certain of our key executives and employees. During 2011, 2010and 2009, our Board of Directors granted restricted units of our common stock to ourChairman of the Board of Directors (our "Chairman") and restricted common stock to ourother nonemployee directors. Over 50% of the grants made in 2011 to our employeesand over 60% of the grants made in 2010 and 2009 to our employees vest in full on thethird anniversary of the award date, conditional upon continued employment. Theremainder of the grants made to employees and all the grants made to our Chairmanvest pro rata over three years, as these participants meet certain age and years-ofservicerequirements. For the grants to each of the participant employees and the56 <strong>Oceaneering</strong> International, Inc.
Chairman, the participant will be issued a share of our common stock <strong>for</strong> the participant'svested restricted stock units at the earlier of three years or, if the participant vestedearlier after meeting the age and service requirements, at termination of employment orservice. The grants to our nonemployee directors vest in full on the first anniversary ofthe award date conditional upon continued service as a director. Pursuant to grants ofrestricted common stock units to our employees made prior to 2005, at the time of eachvesting, a participant received a tax-assistance payment. Our tax assistance paymentswere $1.8 million in 2010 and $3.7 million in 2009. There were no tax assistancepayments in 2011. In April 2009, the Compensation Committee adopted a policy that<strong>Oceaneering</strong> will not provide U.S. federal income tax gross-up payments to any of itsdirectors or executive officers in connection with future awards of restricted stock or stockunits. This policy had no effect on existing change-in-control agreements with several ofour executive officers or the existing service agreement with our Chairman, which provide<strong>for</strong> tax gross-up payments that could become applicable to such future awards in limitedcircumstances, such as following a change in control of our company. Since August2010, there have been no outstanding awards that provide <strong>for</strong> tax gross-up payments.The tax benefit realized from tax deductions in excess of financial statement expensewas $1.3 million, $0.8 million and $1.6 million in 2011, 2010 and 2009, respectively.The following is a summary of our restricted stock and restricted stock unit activity <strong>for</strong>2011, 2010 and 2009:NumberWeightedAverageFair ValueAggregateIntrinsic ValueBalance at December 31, 2008 1,649,500 $ 17.37Granted 411,850 15.53Issued (752,500) 11.97 $ 14,239,000Forfeited (65,800) 20.71Balance at December 31, 2009 1,243,050 19.86Granted 421,850 29.58Issued (595,790) 16.23 $ 16,673,000Forfeited (24,960) 24.73Balance at December 31, 2010 1,044,150 25.74Granted 463,400 41.26Issued (379,952) 30.81 $ 15,563,000Forfeited (36,748 ) 27.77Balance at December 31, 2011 1,090,850 $ 30.49The restricted stock units granted in 2011, 2010 and 2009 carry no voting rights and nodividend rights. Each grantee of shares of restricted common stock is deemed to be therecord owner of those shares during the restriction period, with the right to vote andreceive any dividends on those shares.Effective January 1, 2006, the unvested portions of our grants of restricted stock unitswere valued at their estimated fair values as of their respective grant dates. The grants2011 Annual Report 57
in 2011, 2010 and 2009 were subject only to vesting conditioned on continuedemployment or service as a nonemployee director; there<strong>for</strong>e, these grants were valued atthe grant date fair market value using the closing price of our stock on the New YorkStock Exchange.Compensation expense under the restricted stock plans was $29.9 million, $25.5 millionand $23.8 million <strong>for</strong> 2011, 2010 and 2009, respectively. As of December 31, 2011, wehad $11.5 million of future expense to be recognized related to our restricted stock unitplans over a weighted average remaining life of 1.8 years.Post-Employment BenefitIn 2001, we entered into an agreement with our Chairman who was also then our ChiefExecutive Officer. That agreement was amended in 2006 and in 2008. Pursuant to theamended agreement, the Chairman relinquished his position as Chief Executive Officer inMay 2006 and began his post-employment service period on December 31, 2006, whichcontinued through August 15, 2011, during which service period the Chairman, acting asan independent contractor, agreed to serve as nonexecutive Chairman of our Board ofDirectors. The agreement provides the Chairman with post-employment benefits <strong>for</strong> tenyears following August 15, 2011. The agreement also provides <strong>for</strong> medical coverage onan after-tax basis to the Chairman, his spouse and children <strong>for</strong> their lives. We recognizedthe net present value of the post-employment benefits over the expected service period.Our total accrued liabilities, current and long-term, under this post-employment benefitwere $7.3 million and $7.6 million at December 31, 2011 and 2010, respectively.As part of the arrangements relating to the Chairman's post-employment benefits, weestablished an irrevocable grantor trust, commonly known as a "rabbi trust," to providethe Chairman greater assurance that we will set aside an adequate source of funds tofund payment of the post-retirement benefits under this agreement, including the medicalcoverage benefits payable to the Chairman, his spouse and their children <strong>for</strong> their lives.In connection with establishment of the rabbi trust, we contributed to the trust a lifeinsurance policy on the life of the Chairman, which we had previously obtained, and weagreed to continue to pay the premiums due on that policy. When the life insurancepolicy matures, the proceeds of the policy will become assets of the trust. If the value ofthe trust exceeds $4 million, as adjusted by the consumer price index, at any time afterJanuary 1, 2012, the excess may be paid to us. However, because the trust isirrevocable, the assets of the trust are generally not available to fund our futureoperations until the trust terminates, which is not expected to be during the lives of theChairman, his spouse or their children. Furthermore, no tax deduction will be available<strong>for</strong> our contributions to the trust; however, we may benefit from future tax deductions <strong>for</strong>benefits actually paid from the trust (although benefit payments from the trust are notexpected to occur in the near term, because we expect to make direct payments of thosebenefits <strong>for</strong> the <strong>for</strong>eseeable future).Stockholder Rights PlanWe adopted a Stockholder Rights Plan on November 20, 1992, which was amended andrestated as of November 16, 2001. The Stockholder Rights Plan expired onNovember 16, 2011.58 <strong>Oceaneering</strong> International, Inc.
SELECTED QUARTERLY FINANCIAL DATA (UNAUDITED)(in thousands, except per share data)Year Ended December 31, 2011Quarter Ended March 31 June 30 Sept. 30 Dec. 31 TotalRevenue $ 470,420 $ 545,838 $ 602,208 $ 574,197 $ 2,192,663Gross profit 98,801 126,116 153,096 130,746 508,759Income from operations 61,067 81,674 109,622 82,468 334,831Net income 42,070 56,693 78,578 58,317 235,658Diluted earnings per share $ 0.39 $ 0.52 $ 0.72 $ 0.54 $ 2.16Weighted average numberof diluted sharesoutstanding 109,002 109,147 108,928 108,671 109,001Year Ended December 31, 2010Quarter Ended March 31 June 30 Sept. 30 Dec. 31 TotalRevenue $ 435,170 $ 464,303 $ 516,274 $ 501,298 $ 1,917,045Gross profit 99,705 123,503 125,619 117,493 466,320Income from operations 62,329 85,374 88,055 73,742 309,500Net income 39,243 54,317 59,177 47,794 200,531Diluted earnings per share $ 0.35 $ 0.49 $ 0.54 $ 0.44 $ 1.82Weighted average numberof diluted sharesoutstanding 110,449 110,371 108,665 108,663 109,5352011 Annual Report 59
Forward-Looking StatementsAll statements in this report that express a belief, expectation, or intention are<strong>for</strong>ward-looking statements made pursuant to the safe harbor provisions of the PrivateSecurities Litigation Re<strong>for</strong>m Act of 1995. These <strong>for</strong>ward-looking statements are basedon current in<strong>for</strong>mation at the time this report was written and expectations thatinvolve a number of risks, uncertainties, and assumptions. Among the factors thatcould cause the actual results to differ materially from those indicated in the<strong>for</strong>ward-looking statements are: industry conditions; prices of crude oil and naturalgas; <strong>Oceaneering</strong>’s ability to obtain and the timing of new projects; operating risks;changes in government regulations; technological changes; and changes in competitivefactors. Should one or more of these risks or uncertainties materialize, or shouldthe assumptions underlying the <strong>for</strong>ward-looking statements prove incorrect, actualoutcomes could vary materially from those indicated. These and other risks are fullydescribed in <strong>Oceaneering</strong>’s annual report on Form 10-K <strong>for</strong> the year endedDecember 31, 2011 and other periodic filings with the Securities and ExchangeCommission.Form 10-KThe entire Form 10-K, as filed with the Securities and Exchange Commission, maybe accessed through the <strong>Oceaneering</strong> website, www.oceaneering.com, by selecting"Investor Relations," then "SEC Financial Reports," then selecting the desired report,or may be obtained by writing to:David K. LawrenceSecretary<strong>Oceaneering</strong> International, Inc.11911 FM 529Houston, TX 77041-3000The use in this report of such terms as <strong>Oceaneering</strong>, company, group, organization, we, us, our,and its, or references to specific entities, is not intended to be a precise description of corporaterelationships.60 <strong>Oceaneering</strong> International, Inc.
General In<strong>for</strong>mationCorporate Office<strong>Oceaneering</strong> International, Inc.11911 FM 529Houston, TX 77041-3000Telephone: (713) 329-4500Fax: (713) 329-4951www.oceaneering.comStock Symbol: OIIStock traded on NYSECUSIP Number: 675232102Please direct communications concerningstock transfer requirements or lostcertificates to our transfer agent.Transfer Agent and RegistrarComputershare Trust Company, N.A.P.O. Box 43078Providence, RI 02940-3078Overnight Deliveries:250 Royall StreetCanton, MA 02021-1011OII Account In<strong>for</strong>mationwww.computershare.comTelephone: (781) 575-2879Hearing Impaired/TDD: (800) 952-9245Annual Shareholders’ MeetingDate: May 4, 2012Time: 8:30 a.m. CDTLocation: <strong>Oceaneering</strong> International, Inc.11911 FM 529Houston, TX 77041Independent Public AccountantsErnst & Young LLP5 Houston Center1401 McKinney, Suite 1200Houston, TX 77010-4035CounselBaker Botts L.L.P.One Shell Plaza910 Louisiana StreetHouston, TX 77002-4995
<strong>Oceaneering</strong> International, Inc.11911 FM 529Houston, TX 77041-3000Telephone: (713) 329-4500Fax: (713) 329-4951www.oceaneering.com