Performance of the IDEXX Catalyst Dx® Chemistry ... - NetNews
Performance of the IDEXX Catalyst Dx® Chemistry ... - NetNews
Performance of the IDEXX Catalyst Dx® Chemistry ... - NetNews
- No tags were found...

Create successful ePaper yourself
Turn your PDF publications into a flip-book with our unique Google optimized e-Paper software.
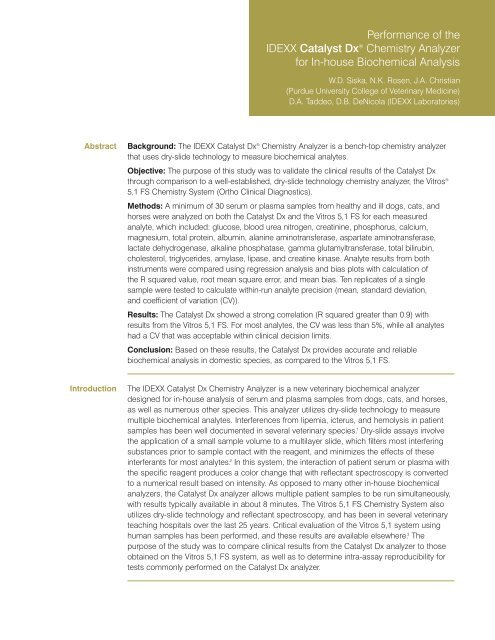
<strong>Performance</strong> <strong>of</strong> <strong>the</strong><strong>IDEXX</strong> <strong>Catalyst</strong> Dx ® <strong>Chemistry</strong> Analyzer(Purdue University College <strong>of</strong> Veterinary Medicine)D.A. Taddeo, D.B. DeNicola (<strong>IDEXX</strong> Laboratories)AbstractBackground: The <strong>IDEXX</strong> <strong>Catalyst</strong> Dx ® Objective: The purpose <strong>of</strong> this study was to validate <strong>the</strong> clinical results <strong>of</strong> <strong>the</strong> <strong>Catalyst</strong> Dx ®5,1 FS <strong>Chemistry</strong> System (Ortho Clinical Diagnostics).Methods: A minimum <strong>of</strong> 30 serum or plasma samples from healthy and ill dogs, cats, andhorses were analyzed on both <strong>the</strong> <strong>Catalyst</strong> Dx and <strong>the</strong> Vitros 5,1 FS for each measuredanalyte, which included: glucose, blood urea nitrogen, creatinine, phosphorus, calcium,magnesium, total protein, albumin, alanine aminotransferase, aspartate aminotransferase,lactate dehydrogenase, alkaline phosphatase, gamma glutamyltransferase, total bilirubin,cholesterol, triglycerides, amylase, lipase, and creatine kinase. Analyte results from bothinstruments were compared using regression analysis and bias plots with calculation <strong>of</strong><strong>the</strong> R squared value, root mean square error, and mean bias. Ten replicates <strong>of</strong> a singleand coefficient <strong>of</strong> variation (CV)).Results: The <strong>Catalyst</strong> Dx showed a strong correlation (R squared greater than 0.9) withresults from <strong>the</strong> Vitros 5,1 FS. For most analytes, <strong>the</strong> CV was less than 5%, while all analyteshad a CV that was acceptable within clinical decision limits.Conclusion: Based on <strong>the</strong>se results, <strong>the</strong> <strong>Catalyst</strong> Dx provides accurate and reliablebiochemical analysis in domestic species, as compared to <strong>the</strong> Vitros 5,1 FS.IntroductionThe <strong>IDEXX</strong> <strong>Catalyst</strong> Dx <strong>Chemistry</strong> Analyzer is a new veterinary biochemical analyzermultiple biochemical analytes. Interferences from lipemia, icterus, and hemolysis in patientsamples has been well documented in several veterinary species. 1 <strong>the</strong> application <strong>of</strong> a small sample volume to a multilayer slide, which filters most interferingsubstances prior to sample contact with <strong>the</strong> reagent, and minimizes <strong>the</strong> effects <strong>of</strong> <strong>the</strong>seinterferants for most analytes. 2 In this system, <strong>the</strong> interaction <strong>of</strong> patient serum or plasma with<strong>the</strong> specific reagent produces a color change that with reflectant spectroscopy is convertedanalyzers, <strong>the</strong> <strong>Catalyst</strong> Dx analyzer allows multiple patient samples to be run simultaneously,with results typically available in about 8 minutes. The Vitros 5,1 FS <strong>Chemistry</strong> System alsoteaching hospitals over <strong>the</strong> last 25 years. Critical evaluation <strong>of</strong> <strong>the</strong> Vitros 5,1 system usinghuman samples has been performed, and <strong>the</strong>se results are available elsewhere. 3 Thepurpose <strong>of</strong> <strong>the</strong> study was to compare clinical results from <strong>the</strong> <strong>Catalyst</strong> Dx analyzer to thosetests commonly performed on <strong>the</strong> <strong>Catalyst</strong> Dx analyzer.
MethodsSamples: All patient samples were canine, feline, or equine serum or plasma that wasremaining after primary diagnostic testing at ei<strong>the</strong>r <strong>the</strong> Purdue University Veterinary TeachingHospital (PUVTH) or at <strong>the</strong> North Grafton <strong>IDEXX</strong> Reference Laboratory (<strong>IDEXX</strong>). InitialC for1 week after initial diagnostic analysis, thawed, and <strong>the</strong>n reanalyzed for <strong>the</strong> analyte <strong>of</strong>interest within 4 hours on both <strong>the</strong> <strong>Catalyst</strong> Dx and <strong>the</strong> Vitros 5,1 FS system. After <strong>the</strong>initial assessment, characterized clinical specimens from <strong>the</strong> PUVTH and <strong>IDEXX</strong> wereobtained to assure that sufficient spread over <strong>the</strong> complete dynamic range <strong>of</strong> each analytedays prior to analysis on both instruments, which was performed in <strong>the</strong> same manner. Allsamples were analyzed in <strong>the</strong> PUVTH by one author (W.D.S.) or an experienced laboratorytechnician, according to manufacturer instructions.Method comparison: Analytes for which method comparison was performed includedglucose (GLU), blood urea nitrogen (BUN), creatinine (CREA), phosphorus (PHOS), calcium(Ca), magnesium (Mg), total protein (TP), albumin (ALB), alanine aminotransferase (ALT),aspartate aminotransferase (AST), lactate dehydrogenase (LDH), alkaline phosphatase(ALKP), gamma glutamyltransferase (GGT), total bilirubin (TB), cholesterol (CHOL),triglycerides (TRIG), amylase (AMYL), lipase (LIPA), and creatine kinase (CK). For eachwhich included a broad range <strong>of</strong> results similar to those that might be routinely encounteredin healthy and ill veterinary patients. For each analyte, correlation plots were constructed,with calculation <strong>of</strong> <strong>the</strong> R 2 value and root mean square error.Precision analysis:multiple target concentrations <strong>of</strong> each analyte were selected in advance to represent low,“normal,” and high values for that test. For most analytes, two patient samples with resultsin close proximity to each target concentration for <strong>the</strong> analyte were selected, with10 replicates <strong>of</strong> <strong>the</strong> assay run on <strong>the</strong> <strong>Catalyst</strong> Dx analyzer. Mean, standard deviation, andcoefficients <strong>of</strong> variation (CV) were calculated for each precision run.ResultsMethod comparison: Correlation and bias plots for selected analytes that are commonlyevaluated using <strong>the</strong> <strong>Catalyst</strong> Dx analyzer are shown in Figure 1. These analytes and <strong>the</strong>irrespective R 2 ALKP (0.95), AST (0.99), GGT (0.96), BUN (0.99), LIPA (0.93), AMYL (0.94) and CK (0.96).PHOS (0.99), CA (0.94), Mg (0.91), LDH (0.96), TBIL (0.99), CHOL (0.99), and TRIG (0.95).Precision analysis: In order to determine <strong>the</strong> precision for each assay, means, standardcorrespond to results for each analyte expected to fall in a typical reference interval areshown in Table 2. CVs were also calculated for precision runs with target concentrationsexpected to be significantly outside a typical reference interval to ensure acceptablereproducibility at concentrations likely to occur in disease states. The majority <strong>of</strong> %CVs wereless than 1% and nearly all were 2.5% or less, which included all runs for ALB, ALKP, AMYL,AST, BUN, CA, CHOL, CK, CREA, GLU, LIPA, MG, PHOS, TP, and TRIG. Of those remaining
Results (cont.)Table 1. Comparison <strong>of</strong> results from <strong>the</strong><strong>Catalyst</strong> Dx analyzer and Vitros system.Table 2. Results from <strong>the</strong> <strong>Catalyst</strong> Dxprecision analysis.Test N R2 MSE Test Mean SD %CVALB 0.95 0.2 ALB 3.0 0.04 1.2ALKP 0.95 94 ALKP 2.0 1.2ALT 59 0.98 31 ALT 5.4 AMYL 51 0.94 98 AMYL 1239 25.3 2.0AST 65 0.99 24 AST 135 0.9 BUN 55 0.99 1.1 BUN 20 0.2 1.0CA 45 0.94 0.4 CA 10.0 0.06 0.6CHOL 39 0.99 6.6 CHOL 223 1.9 0.9CK 53 0.96 90 CK 194 1.1 0.6CREA 0.98 0.4 CREA 1.2 0.01 0.9GGT 44 0.96 GGT 39 1.8 4.3GLU 69 0.99 6.6 GLU 115 0.4 0.4LDH 48 0.96 103 LDH 400 15.4 3.9LIPA 32 0.93 126 LIPA 4.0 0.6MG 48 0.91 0.1 MG 2.0 0.045 2.3PHOS 0.99 0.2 PHOS 4.6 0.03 TBIL 50 0.99 0.4 TBIL 0.5 0.04 TP 48 0.2 TP 0.04 0.6TRIG 88 0.95 TRIG 132 0.5Discussionpreventive screening <strong>of</strong> healthy patients and evaluation <strong>of</strong> ill patients. Therefore, results fromsuch instruments must be consistent and reliable, and ideally should <strong>of</strong>fer rapid sampleindustry standard aids in <strong>the</strong> assessment <strong>of</strong> an analyzer’s accuracy, while precision analysisis essential to demonstrate reproducibility <strong>of</strong> results. In this study, results from <strong>the</strong> <strong>Catalyst</strong> Dx<strong>Chemistry</strong> Analyzer correlated well with results from <strong>the</strong> Vitros 5,1 FS <strong>Chemistry</strong> System.Precision was shown to be high for most analytes, with %CVs typically less than 5%, even foranalyte concentrations at high and low ends <strong>of</strong> <strong>the</strong> possible clinical results spectrum.Based on <strong>the</strong> findings <strong>of</strong> this study, <strong>the</strong> <strong>Catalyst</strong> Dx provides consistent results for <strong>the</strong> analytesevaluated in this study and <strong>the</strong>se results correlate well with an established veterinary teachinghospital analyzer.*
Figure 1. Scatter (Passing and Bablok regression) plots for <strong>Catalyst</strong> Dx and Vitros results obtained from canine, feline, and equine blood (95% confidenceinterval). In scatter plots, <strong>the</strong> solid black line is <strong>the</strong> regression line, <strong>the</strong> gray dashed line is <strong>the</strong> confidence interval curve.References:1. Jacobs RM, Lumsden JH, Grift E. Effects <strong>of</strong> bilirubinemia, hemolysis, and lipemia on clinical chemistryanalytes in bovine, canine, equine, and feline sera. Can Vet J. 1992;33:605–608.2 Rebar AH, Christian JA. Advanced Diagnostics: Getting reference laboratory results with an in-house bloodchemistry analyzer. NAVC Clinician’s Brief. 2007;11:29–30.3 Aufenanger J, Sonntag O. Evaluation <strong>of</strong> <strong>the</strong> Vitros 5,1 FS analyzer in a large clinical laboratory: comparison<strong>of</strong> methods using different specimens and chemistry systems. J Lab Med. 2009;33:22–32.All o<strong>the</strong>r ®/TM marks are owned by <strong>IDEXX</strong> Laboratories, Inc. or its affiliates in <strong>the</strong>United States and/or o<strong>the</strong>r countries.The <strong>IDEXX</strong> Privacy Policy is available at idexx.com.