Assurance de qualité pour le cancer rectal – phase 2 ...
Assurance de qualité pour le cancer rectal – phase 2 ...
Assurance de qualité pour le cancer rectal – phase 2 ...

You also want an ePaper? Increase the reach of your titles
YUMPU automatically turns print PDFs into web optimized ePapers that Google loves.
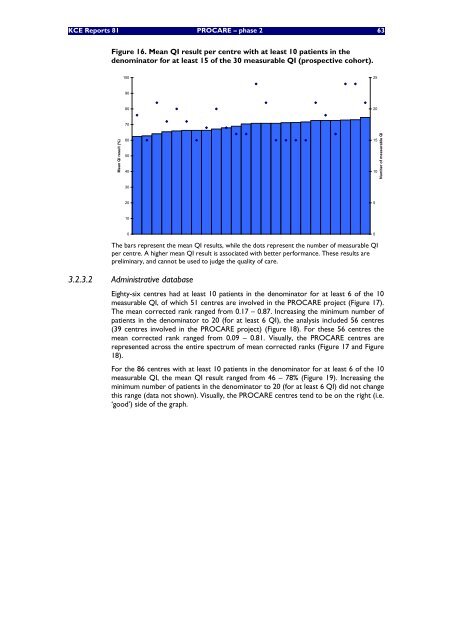
KCE Reports 81 PROCARE <strong>–</strong> <strong>phase</strong> 2 63Figure 16. Mean QI result per centre with at <strong>le</strong>ast 10 patients in the<strong>de</strong>nominator for at <strong>le</strong>ast 15 of the 30 measurab<strong>le</strong> QI (prospective cohort).1002590802070Mean QI result (%)6050401510Number of measurab<strong>le</strong> QI302051000The bars represent the mean QI results, whi<strong>le</strong> the dots represent the number of measurab<strong>le</strong> QIper centre. A higher mean QI result is associated with better performance. These results arepreliminary, and cannot be used to judge the quality of care.3.2.3.2 Administrative databaseEighty-six centres had at <strong>le</strong>ast 10 patients in the <strong>de</strong>nominator for at <strong>le</strong>ast 6 of the 10measurab<strong>le</strong> QI, of which 51 centres are involved in the PROCARE project (Figure 17).The mean corrected rank ranged from 0.17 <strong>–</strong> 0.87. Increasing the minimum number ofpatients in the <strong>de</strong>nominator to 20 (for at <strong>le</strong>ast 6 QI), the analysis inclu<strong>de</strong>d 56 centres(39 centres involved in the PROCARE project) (Figure 18). For these 56 centres themean corrected rank ranged from 0.09 <strong>–</strong> 0.81. Visually, the PROCARE centres arerepresented across the entire spectrum of mean corrected ranks (Figure 17 and Figure18).For the 86 centres with at <strong>le</strong>ast 10 patients in the <strong>de</strong>nominator for at <strong>le</strong>ast 6 of the 10measurab<strong>le</strong> QI, the mean QI result ranged from 46 <strong>–</strong> 78% (Figure 19). Increasing theminimum number of patients in the <strong>de</strong>nominator to 20 (for at <strong>le</strong>ast 6 QI) did not changethis range (data not shown). Visually, the PROCARE centres tend to be on the right (i.e.‘good’) si<strong>de</strong> of the graph.