Broadcasting And Mobile Towers - Analysys Mason
Broadcasting And Mobile Towers - Analysys Mason
Broadcasting And Mobile Towers - Analysys Mason

You also want an ePaper? Increase the reach of your titles
YUMPU automatically turns print PDFs into web optimized ePapers that Google loves.
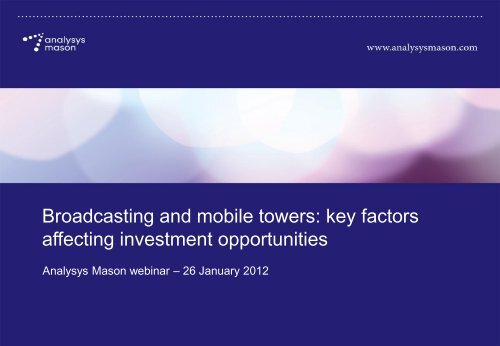
<strong>Broadcasting</strong> and mobile towers: key factorsaffecting investment opportunities<strong>Analysys</strong> <strong>Mason</strong> webinar – 26 January 201221454-482
2Introducing our presentersMarco CordoniPartnerTower market demand and supplyTerry NormanPrincipal AnalystFacts and figures on traffic and costsLluís BorrellPartner<strong>Broadcasting</strong> tower opportunities21454-482
3Briefing agendaMarco Cordoni: Tower market demand and supplyTerry Norman: Facts and figures on traffic and costsLluís Borrell: <strong>Broadcasting</strong> tower opportunities21454-482
4ContentsMarco Cordoni: Tower market demand and supplyDrivers of demand for sitesSupply of towersTenancy ratio for tower companiesPricing considerations for tower companiesCost considerations for tower companies21454-482
Market demand for towersThe demand for towers is driven by a variety offactors, some of which vary by market maturityDriver Emerging markets Developed marketsRelevance Effect Relevance EffectCommercial Coverage MarketstructureCapacity for voice traffic Capacity for data traffic Fixed wireless entrants <strong>Mobile</strong> data entrants Technical 3G roll-out WiMAX/LTE roll-out / /Multi-technology/band equipment Availability of rooftops Regulatory Rural broadband targets 521454-482Nil Low Medium Medium-High HighKey: Positive impact Neutral impact Negative impact
Drivers of demand for sites • Market structureNew data players are emerging and are likely tostimulate tower demandDeveloped markets(mobile data as complement to fixed)Regulators are reserving spectrum for newentrants to build competition in mobile broadband• Belgium: 2100MHz reserved for new entrants inthe 2011 3G auction (Tecteo Telenet). 2600MHzcould be reserved for new entrants in the 20114G auction• France: fourth 3G licence issued in 2009 (Free)• Netherlands: 2012 auction reserves a 10MHzblock at 800MHz for each of two new entrants• Sweden: spectrum caps on existing operators in2.6GHz auction as a way to attract new entrantsin 2008 (Intel Capital Corporation)Emerging markets(fixed wireless data substitution effect)Poor fixed-line infrastructure encouragesthe entry of fixed wireless operators• WiMAX/LTE: numerous operators are launchingfixed-wireless services in the bigger cities ofAfrican countries (e.g. Nigeria, Tanzania andUganda), in India and in many Latin Americancountries6Spectrum auction rules may attract new entrantsthat are likely to require towersAn increase in tower demand, initially in urbanareas, is likely as new operators focus onurban deployments21454-482
Drivers of demand for sites • TechnologyThe spectrum bands used for 3G and 4G siteshave different impacts on demand for towers4G (WiMAX/LTE)800MHz 2600MHz (or higher) 2100MHzDeveloped markets• Most European countrieshave undergone digitalswitchover and releaseddigital dividend spectrumDeveloped/emerging markets• Some European countries are notswitching off analogue TV until2015 (e.g. Poland); LTE is likely tobe launched in 2600MHz• Operators in emerging markets(e.g. Africa) are also launchingWiMAX in this or higher bands3G (HSPA)Emerging markets• Operators are stillrolling out 3G networksin emerging markets7• Good propagationcharacteristics meansthere is limited demandfor new towers (colocationon existing ones)• Only a small part of 3G/4G base station coverage expansiontranslates into incremental demand for towers.• However, with 3G/4G sites having smaller radii than 2G sites,there will be need for 3G/4G-only in-fill sites21454-482
MultiplecabinetsSinglecabinetDrivers of demand for sites • TechnologyNew RAN equipment and antenna systems coulderode the demand for towersVendors have developed antennasthat can run multiple services andbands(e.g. tri-band 2.2GHz 3G and900/1800MHz 2G and dual band2G 900/1800MHz), allowingdifferent technologies to run on thesame antenna and feeder systemsLegacySeparate antennaand feedersDual band: GSM 900MHz + 1800MHzCommon antenna,separate feedersNewCommon antennaand feederMulti-technology RAN equipment: 2G and 3G8New RAN equipment has alsobeen developed, with the ability torun multiple technologies (2G, 3Gand LTE) in one cabinetLegacyNewOperators may not require additional tower space to deploy new networks21454-482
Drivers of demand for sites • RegulationBroadband targets could raise demand for ruraltowers in developed markets92020 European Commissionbroadband target: broadbandfor all EU citizens by 2013High cost ofrural fixedbroadbandDigitaldivideNational broadband targetsto provide basic broadbandservices to all citizensGovernmentsimpose ruralcoverageobligationsWireless ruralbroadbandservices• France: 800MHz licensees must cover 99.6% within 15 years• Germany: 800MHz licensees must roll out to rural areas first• Sweden: one 800MHz licence must provide at least 1Mbit/s to alist of (rural) addresses• UK: following the 2012 auction, one 800MHz licensee must cover95% of the populationDemand fortowers inrural areas21454-482
10ContentsMarco Cordoni: Tower market demand and supplyDrivers of demand for sitesSupply of towersTenancy ratio for tower companiesPricing considerations for tower companiesCost considerations for tower companies21454-482
Supply of towersBesides self-build, towers can be shared betweenMNOs or sourced from tower companiesRegionNorthAmericaEuropeLatinAmericaMiddleEastAfricaSharing between operators (JV)Outsourcing to tower companiesExamples Degree Examples Degree• Not prevalent• Telefónica O2 and Vodafonein Germany, Ireland, Spainand the UK• Ecuador• Multiple deals in Kuwait,Qatar and UAE• Agreements in Kenya,Morocco and South Africa• Prevalent ownership of tower assets byindependent tower companies• The tower company model, althoughimportant, is not as prevalent as in the USA• Independent tower companies in Brazil andMexico• Not prevalent• Increasingly dominant in Nigeria, Tanzania,Ghana and South Africa11Asia &Pacific• Three mobile operators inChina share cell-sitefacilities• Strong in Australia, India and Indonesia.Bangladesh, Bhutan, Nepal and Pakistan arefollowing India’s independent TowerCo modelKey:Nil Low Medium Medium-High High21454-482
CommercialRegulatorySupply of towersSeveral factors affect operators’ propensity toshare/outsource sites, and may vary by marketDriverDeveloped marketsEmerging marketsRelevance Effect Relevance EffectCost reduction Raise cash Focus on core services Roll-out speed Coverage differentiation Tower build restrictions 12Mandated/encouraged site-sharing Nil Low Medium Medium-High HighKey: Positive impact Neutral impact Negative impact21454-482
Supply of towers • CommercialAn MNO renting 75% of its sites from towercompanies can reduce its Year 1 costs by 60%13Renting sites reducesbuild capexAfter five years, MNOs canexperience up to 20% opexdeficit compared toself-owned sitesThe value oftower companies to MNOsis sensitive to the break-evenpoint that depends on therelative capex and opexAssumes an MNO rolling out 10 000 sitesin a developed country21454-482Source: <strong>Analysys</strong> <strong>Mason</strong>’s research division
Supply of towers • CommercialMNOs are spinning off towers to raise cash andfocus on key servicesOperator problemExpensive external debt financing(e.g. high leverage following earlierinvestments/M&A activity)Rationale to spin off tower assetsRelease cash for re-investmentin new technologies or coverage14Difficulty creating value from servicesFocus on core servicesOperator Country Acquirer Rationale to spin off towersOptus Australia CCI Focus on customer serviceZain Africa Bharti Pay off some of the debt taken on following M&ATigo Ghana Helios Improve capital and operating efficiency; focus on core activitiesMTN Ghana ATC Reduce costs (network roll-out and passive infrastructure)Cell C SA ATC Generate cash and enhance quality and network coverageSprint USA TowerCo Focus on core servicesT-<strong>Mobile</strong> USA Planned Finance roll-out of an LTE network21454-482Source: Tower company websites, operator websites,news articles and press releases
Supply of towers • RegulatoryTower build restrictions may force operators toseek alternatives for colocationBuild restrictions imposed by national or local authoritiesaffect the ability to build towersDeveloped markets• France: Paris town hall prevents operatorsfrom building new sites• UK: towers require planning commissionapproval• USA: local community zoning approvalrequired; often restrictions put into placeEmerging markets• Ghana: no build permit unless the closesttower is >400m away• Kenya: new tower only allowed if equipmentcannot be accommodated on an existingtower• Nigeria: towers above 30m height requireapproval15• Restrictions on building towers increases operators’ willingness to share tower space withcompetitors:‒ this is especially relevant in cases where restrictions are so prohibitive that they impact theoperators’ ability to build towers altogether21454-482
EncouragedMandatedSupply of towers • RegulatoryRegulation surrounding site-sharing canencourage or force operators to co-locateRegulators around the world are implementing regulationthat encourages or mandates site-sharing between operatorsDeveloped markets• New Zealand: mobile site-sharing ismandatory upon request by an MNO• EU: site-sharing encouraged through theEU Framework AgreementEmerging markets• Ecuador: mandated site-sharing• China: mobile operators are required toshare cell-sites• Jordan: operators required to provideinfrastructure sharing/colocation• India: guidelines promoting infrastructuresharing• Bangladesh: infrastructure sharingguidelines to maximise use and avoidnetwork duplication1621454-482
Supply of towersComplexities of negotiating with competitorsencourage the use of TowerCo servicesDriverNegotiationcomplexitiesw/competitorsEffect onuse of towercompaniesRationale• Factors such as level of sharing and structure of JV/site swapcomplicate the operator site-sharing model.JV/site swaps tend to be more adversarial in terms ofnegotiation, potentially at greater risk of failure17ContractualagreementTime to marketAssetownership• Tower company contracts provide cost certainty, allowingoperators to forecast costs more accurately. They imply lowercapex but higher opex than site-sharing JV/site-swap betweenoperators• MNOs are able to offer services sooner which is particularlyrelevant for new entrants. It also allows them to meetregulatory coverage requirements faster• A site-sharing JV provides operators with greater control oftheir assets21454-482
Decreasing level of investmentrestrictions in telecoms infrastructureSupply of towers18FDI restrictions concerning towers could, in somecases, reduce investment opportunitiesCountryFDI restrictionsIndonesiaGhanaIndia• As of 2008, foreign investment in companies owning anddeveloping telecoms towers is banned and ownershipmust be 100% Indonesian• Foreign companies that already built towers had twoyears (as of 2008) to comply with the 2008 regulations• As of March 2011, the Ministry of Communicationsissued a new directive under which Ghanaians must ownat least 30% of companies providing infrastructureservices for telecoms operators• As of 2009, 100% FDI is permitted in telecominfrastructure companies, subject to the Indian ForeignInvestment Promotion approval21454-482Source: Press releases
19ContentsMarco Cordoni: Tower market demand and supplyDrivers of demand for sitesSupply of towersTenancy ratio for tower companiesPricing considerations for tower companiesCost considerations for tower companies21454-482
American <strong>Towers</strong> - FY 09American <strong>Towers</strong> - FY 08GTLI - FY 10Crown Castle - Group - FY 10Crown Castle - Group - FY 09American <strong>Towers</strong> - FY 10Bharti Airtel - India - FY 09East Europe TowerCo SEP 11African TowerCo 1 FY 10Crown Castle - Group - FY 08African TowerCo 2 FY 10EBITDA margin (%)Tenancy ratio for tower companiesTenancy ratios are a key value driver for a towercompany3.002.502.001.50Benchmark of tower companies’tenancy ratiosEmerging marketsDeveloped markets70%60%50%Benchmark of tenancy ratio vs.EBITDA marginATC2010 2009 200820102008200920AfricanTowerCo 1Crown Castle1.0040%0.500.0030%20%AfricanTowerCo 2East EuropeTowerCo10%FY120%0.5 1.0 1.5 2.0 2.5 3.0 3.5Tenancy ratio21454-482Lower incremental cost vs. price for additional tenancies results inan increasing EBITDA margin with tenancy ratio
% of sites% of sites% of MTN sites% of Vodafone sites25% of sites% of sites% of Tigo sites% of Airtel sites25Tenancy ratio for tower companies21Operators with lower coverage are more likely touse tower companies, increasing tenancy ratios35%30%25%20%15%10%5%0%Relatively high coverageShortest distance between Operator 1Shortest distance between Operator 2sites in Africa (km)sites in Africa (km)7%32%13%58% of sites locatedwithin 2km6%3% 3% 2% 3% 3% 2% 4% 6%4% 4% 2% 3% 2% 1% 0%35%30%25%20%15%10%5%0%0%18% 18% 11%47% of sites locatedwithin 2km8%4% 2% 2% 2% 1% 2% 2% 4% 5% 5%3% 3% 3%4%35%30%25%20%15%10%5%0%1%Shortest distance between Operator 3sites in Africa (km)6%17%11%35% of sites locatedwithin 2km4% 3% 2% 3% 2% 3% 3% 4% 4% 4% 4%Relatively low coverage12%6% 5% 3%35%30%25%20%15%10%5%0%Shortest distance between Operator 4sites in Africa (km)0%10%17%34% of sites locatedwithin 2km7% 8% 9% 1% 1% 1% 1% 3% 3% 3% 2% 2%11% 9%6% 6%21454-482
% of Vodafone sites% of sites% of sites% of Vodafone sites5kTenancy ratio for tower companiesThe attractiveness of the sites in a tower company’sportfolio is a key factor in tenancy ratiosTower company vs. Operator 2 sitesin main city in AfricaDistance from tower company’s sites to the nearestOperator 2 sites in main city in Africa (km)20%16%12%8%4%0%2%18%16% 16%14%12% 12%8%4%48% within400m0% 0% 0% 0% 0% 0% 0% 0% 0% 0%22TowerCoOperator 2Tower company vs. Operator 4 sitesin main city in AfricaTowerCoOperator 4Distance from tower company’s sites to nearestOperator 4 sites in main city in Africa (km)20%16%12%8%4%0%2%14%12% 12%10%10% 10% 10%8%4%10%34% within400m0% 0% 0% 0% 0% 0% 0% 0%21454-482
Tenancy ratio for tower companiesEstimating site demand requires complexmodellingCalculated for each year from 2011 to 20202G spectrumallocations23Population bysettlementPenetration bygeotypeMarket shareby operatorSubscribers bysettlement andoperator2Gsubscribers bysettlement andoperator3Gsubscribers bysettlement andoperatorCalculated once only, then phased by yearCell radius bytechnologyand frequencybandEstimatedradius bysettlementSites requiredby settlementfor blanketcoverageAnnual rolloutprioritised byun-servedpopulation2G usage bygeotype andoperator2G usage bysettlement andoperator3G usage bysettlement andoperator3G usage bygeotype andoperator2G sitecapacity byoperator2G capacitysites requiredby settlementand operator3G capacitysites requiredby settlementand operator3G sitecapacity byoperator3G spectrumallocationsTotal capacitysites requiredby settlementand operatorMaximum ofcapacity andcoverage sitesExistingtowers byoperator andsettlementOwn sitesavailable bysettlementAnnual towermarket shareby settlementAllocate co-lotenants bytower marketsharesSplit B2S sitesaccording totower marketsharesCalculatetenancy ratiosper settlement21454-482Source: <strong>Analysys</strong> <strong>Mason</strong>
24ContentsMarco Cordoni: Tower market demand and supplyDrivers of demand for sitesSupply of towersTenancy ratio for tower companiesPricing considerations for tower companiesCost considerations for tower companies21454-482
USD per year (thousands)African TowerCo 1African TowerCo 2SBAATCCBWKEEast Europe TowerCo 2015East Europe TowerCo 2011ITEast Europe TowerCo 2015 discountEast Europe TowerCo 2011 discountMGGTLAfrican TowerCo 3Pricing considerations for tower companiesRental fees typically follow price escalationmechanisms outlined in binding contracts4035302520151050Rental fees for anchor tenantsvary between markets……with escalation mechanisms in place asper the colocation contractsEasternEuropeTower companiesAfrican125African2Inflation Exchange rate Fuel cost ARPU Emerging marketsDeveloped markets21454-482Source: <strong>Analysys</strong> <strong>Mason</strong>, operator reports
DiscountOperator AOperator BOperator COperator DOperator EOperator FOperator GOperator HPricing considerations for tower companiesAdditional tenants often pay lower prices thananchor tenants due to building costs16%Benchmarks for discounts for additional tenants15%2614%13% 13%12%11%10%8%6%8%8%7%6%5%7% 7%4%3%2%0%Discount for 2nd operatorDiscount for 3rd operator21454-482
Pricing considerations for tower companies3G/4G colocation may result in a small revenueupside but typically no increase in tenanciesExamples Pricing structure Effect onrevenuesEast Europeantower companyAfrican towercompany 1African towercompany 2Indian towercompany• One base fee accommodates six antennas for both 2G and 3Gtechnologies for ~USD1550 per month• One base fee accommodates three antennas only for 2Gtechnology for ~USD2800 per month• Additional ~USD800 per month to accommodate threeadditional antennas for both 2G and 3G technologies• Anchor tenant base fee accommodates three antennas for~USD3000 per month and right to install additional equipmentat no extra charge• Base fee accommodates 2G technology for ~USD650 permonth• Additional ~USD110 per month for an overlay 3G BTS3G operators are not likely to pay standard monthly rentals for an overlay 3G networktherefore incremental revenues from new technologies are likely to be small2721454-482
ContentsMarco Cordoni: Tower market demand and supplyDrivers of demand for sitesSupply of towersTenancy ratio for tower companiesPricing considerations for tower companiesCost considerations for tower companies21454-482
100%90%80%70%60%50%40%30%20%10%0%Cost considerations for tower companiesTower companies’ cost structures varysignificantly across markets1%41%58%100%90%80%70%60%50%40%30%20%10%29%57%14%0%0%111African TowerCo 1 African TowerCo 2 Operations East & European Maintenance Insurance TowerCo& OthersInsurance & OtherInsurance and OtherFuelOperation & MaintenanceFuel & ElectricityOperations and maintenanceOther expensesDirect cost breakdown of tower companiesOperation and maintenanceFuel & electricityFuel & ElectrictyOperations and MaintenanceOther expensesIn some emerging markets, fuel is a key cost component as towers are either not connectedto a power grid or the power grid is unreliable, requiring diesel generators100%90%80%70%60%50%40%30%20%10%82%18%Operations and MaintenanceOther expenses2921454-482
USD (thousands)USDCost considerations for tower companiesTower companies incur significant capex for newtowers but minimal capex for new tenantsBuild capex lies between USD150 000 andUSD173 000 per tower …200180160140120100806040200173167 166161155 152 150…additional colocation capex could reach~USD10 000 per new tenant12,00010,0008,0006,0004,0002,000OutdoorIndoor300AfricanTowerCo 1 -outdoor tenantAfricanTowerCo 1 -indoor tenantAfricanTowerCo 221454-482
Valuation per Tower(USD ‘000)Optus AustraliaCrown Castle InternationalWTTIL IndiaQuippoIndia XcelAmerican TowerAircel IndiaGTLITigo GhanaHeliosEssar IndiaAmerican TowerTTML IndiaQuippoGTLiCellC South AfricaAmerican TowerStarcooms NigeriaSWAPTigo TanzaniaHeliosMTN GhanaAmerican TowerTigo DRCHeliosCost considerations for tower companiesThe valuation of each tower varies significantlyacross markets31250200193Average USD139 000per tower197229170150153134131100501021077498113Reliance Infratel103No. towersundertransaction0700 5000 1660 17 500 750 4500 2535 ~50 000 3200 407 1020 1876 7292000 Dec-08 May-09 Jan-10 Feb-10 Mar-10 Sep-10 Nov-10 Dec-1021454-482
32Briefing agendaMarco Cordoni: Tower market demand and supplyTerry Norman: Facts and figures on traffic and costsLluís Borrell: <strong>Broadcasting</strong> tower opportunities21454-482
33ContentsTerry Norman: Facts and figures on traffic and costsThe commercial context for network sharing and towercompaniesThe cost to support traffic growthCost savings through network sharing<strong>Analysys</strong> <strong>Mason</strong> Research21454-482
Connections (billion)Traffic (MB per month)The commercial context for network sharing and tower companiesGlobally, connection numbers and the traffic perconnection are increasing• Traffic is expected to increase to892MB per connection per month indeveloped markets (CAGR 31%) …• … and to 301MB per month inemerging markets (CAGR 28%)• Connections worldwide will growfrom 5 billion to 7 billion (CAGR 7%)• Penetration has almost reachedsaturation in developed markets• In emerging markets, the number ofconnections is expected to growsubstantially900700500300100Average wireless network trafficper connection worldwide-1002011 2012 2013 2014 2015 2016World Developed markets Emerging marketsAverage number of wirelessnetwork connections worldwide8765432102011 2012 2013 2014 2015 20163421454-482Source: <strong>Analysys</strong> <strong>Mason</strong>, 2011World Developed markets Emerging markets
Revenue per gigabyte(USD)Traffic (PB per month)The commercial context for network sharing and tower companiesTraffic is growing at 42% per annum, but datarevenue per GB is falling at 18% per annum• We expect mobile traffic to growfrom 570PB to 3243PB per monthby 2016 (CAGR 42%)• Revenue is falling at 18% perannum• Assuming operators continue usingthe flat-rate pricing model, wepredict revenue of less than USD4per GB by 2016 in both developedand emerging markets• The degree to which tiered pricing isadopted in the future will affect thisforecast21454-482Source: <strong>Analysys</strong> <strong>Mason</strong>, 2011Traffic from mobile connections worldwide35003000250020001500100014121050002011 2012 2013 2014 2015 2016World Developed markets Emerging markets8642Revenue per GB of mobilebroadband traffic worldwide02011 2012 2013 2014 2015 2016World Developed markets Emerging markets35
36ContentsTerry Norman: Facts and figures on traffic and costsThe commercial context for network sharing and towercompaniesThe cost to support traffic growthCost savings through network sharing<strong>Analysys</strong> <strong>Mason</strong> Research21454-482
Billions (USD)Billions (USD)The cost to support traffic growthHow much will it cost to build the networks todeliver 42% traffic growth?50403020100Forecast RAN capex spend forWestern European operator*2011 2012 2013 2014 2015 2016Forecast RAN capex spend for WesternEuropean operator with 50% cost reduction*1210864202011 2012 2013 2014 2015 2016• If operators service demand bysimply building more sites the costwill grow dramatically• Within five years, their RANexpenditure will be eight times whatit is today• Alternatively, operators could deploynetwork cost reduction strategies• A realistic increase in network spendcan only be achieved if operators cuttheir network carriage costs byaround 50%37LTE (data)UMTS (data)21454-482*GSM, UMTS (R '99 and HSPA), MIMO, Dual Carrier, LTESource: <strong>Analysys</strong> <strong>Mason</strong>, 2011
The cost to support traffic growthKey requirements: upgrade to HSPA+, acquirespectrum, deploy LTE and reduce costs• Operators will employ a mix of the following to reduce costs: upgrade existing HSPA base stations to HSPA+ as required buy spectrum as it becomes available; deploy 800MHz and 900MHz deploy LTE (mass-market deployment from 2013) employ self-optimising networks maximise use of network capacity management and optimisationtechniques deploy small cell solutions (active network offloading) – enhanced capacity,25–30% savings per site vs. building new sites offload as much traffic as possible onto indoor (fixed broadband) network share networks: 20–30% cost savings with passive sharing3821454-482
39ContentsTerry Norman: Facts and figures on traffic and costsThe commercial context for network sharing and towercompaniesThe cost to support traffic growthCost savings through network sharing<strong>Analysys</strong> <strong>Mason</strong> Research21454-482
Cost savings through network sharing40Network or infrastructure sharing comes in manydifferent forms …No sharingPassive(site)sharingSite share+ jointroll-outActivenetworksharingSpectrumsharingDeeper(core)sharingIncreased network sharingSeparate sitesShared sitesShared sitesShared sitesShared sitesShared sitesSeparateplanningSeparateplanningJoint planningJoint planningJoint planningJoint planningSeparatebase stationsSeparatebase stationsSeparatebase stationsNetwork sharingNetwork sharingNetwork sharingSeparatespectrumSeparatespectrumSeparatespectrumSeparatespectrumSharedspectrumSharedspectrumSeparatecore networkSeparatecore networkSeparatecore networkSeparatecore networkSeparatecore networkSharedcore networkIncreased cost savings (and risk)21454-482
Cost savings through network sharing… and offers considerable cost-savingopportunities45%40%35%30%25%20%15%10%5%0%21454-482Land rentTypical opex costs per siteH/W / S/W annual supportElectricity/DieselMW backhaul annual costsRF engineering support costsPower maintenanceMaintenance manpowerSparesManagement (G&A)InsuranceSecurityOther expenses (fees)Transportation45%40%35%30%25%20%15%10%5%0%Source: <strong>Analysys</strong> <strong>Mason</strong>, 2011Building, rigging, andmaterialsTypical capex costs per sitePowerDevelopedNode B/BTSNetwork testingSite acquisition anddesignEmergingMicrowave backhaulSparesRouter pricing41
Cost savings through network sharingAs an example, we examine potential savingsunder two RAN-sharing scenarios• We consider the costs and benefits over five years of two different types ofRAN sharing• Scenario A is a joint-venture: a new build, with roll-out of an LTE network. Atotal of 2500 sites are deployed, evenly spread over five years• Scenario B is a consolidation of two mature networks in an emergingmarket – for example, two GSM networks: we modelled two cases where the site count is reduced evenly over fiveyears, by either 1000 or 1500 sites• For both scenarios, we modelled passive sharing only• On each site, the operators share the mast or pole, cabin and utilities, but eachhas a separate antenna, eNode B and backhaul4221454-482
Percentage savingPercentage savingCost savings through network sharing43Results show potential savings are substantial inboth the joint-venture new build …Scenario A: Cumulative capex and opexsavings in a developed market35%Scenario A: Cumulative capex and opexsavings in an emerging market18%30%25%16%14%12%20%10%15%8%10%6%4%5%2%0%Year 1 Year 2 Year 3 Year 4 Year 50%Year 1 Year 2 Year 3 Year 4 Year 5CapexOpexCapexOpex21454-482Source: <strong>Analysys</strong> <strong>Mason</strong>, 2010
Annual perceentage opex savingRatio of opex saving to annual capex spendCost savings through network sharing44… and for the consolidation of two networksScenario B: Cumulative opex savingsin an emerging market16%Scenario B: Ratio of annual opex saving tocapex spend in an emerging market1.214%1.012%10%8%0.80.66%4%2%0%Year 1 Year 2 Year 3 Year 4 Year 51500 site case 1000 site case0.40.20.0Year 1 Year 2 Year 3 Year 4 Year 51000 sites 1500 sites Break-even line21454-482Source: <strong>Analysys</strong> <strong>Mason</strong>, 2010
Site countPercentage of poulation coverageSite countPercentage of poulation coverageCost savings through network sharingIn the UK, Vodafone and O 2 have used passivesharing to reduce costsSite count and population coverage:Orange UK14000120001009080Site count and population coverage:Vodafone and O 2 UK1400012000100908045100008000706050100008000706050600040600040400020003020104000200030201021454-48202007 2010Orangepercentage population coverage Orange(2007 to 2010)0Source: <strong>Analysys</strong> <strong>Mason</strong>, 2011Site count0VodafoneO22007 2010Percentage population coverage2007−2010VodafoneO20
Site countPercentage of poulation coverageCost savings through network sharingT-<strong>Mobile</strong> and Three have saved costs andextended coverage through active sharing• The extension to coverage hashelped Three move to pole position incarrying data. It claims to carry 70%of the country’s mobile broadbanddata traffic• Handover and roaming handoverhave been very challenging tomanage• A frequency converter was needed toshift Three’s carrier to within 20MHzof T-<strong>Mobile</strong>’s to allow MORAN to beimplemented• It is rumoured that as many as 4500T-<strong>Mobile</strong> sites are awaitingdecommissioning21454-482Source: <strong>Analysys</strong> <strong>Mason</strong>, 20111400012000100008000600040002000Site count and population coverage:Three and T-<strong>Mobile</strong>03 UKT-<strong>Mobile</strong>2007 201010080604020percentage population coverage 3 UK(2007 to 2010)percentage population coverage T-<strong>Mobile</strong>(2007 to 2010)046
Cost savings through network sharing47Other important considerations (drivers)Cost saving and coverage extension• <strong>Mobile</strong> Broadband Network Limited (MBNL) in the UK has a unique activenetwork-sharing agreement because it covers the consolidation of establishedsites, as well as the development of new sites. Consolidation is a notoriouslytroublesome processExtending coverage into rural areas• In Spain, Orange and Vodafone have an active network-sharing agreementthat was devised to develop mobile broadband coverage in rural areas21454-482
Cost savings through network sharing48Other important considerations (drivers)An evolutionary path for obsolete technologies – e.g. CDMA (WiMAX?)• The case of Bell Mobility and TELUS in Canada demonstrates the potential forestablished partnerships to deepen, and for sharing to pave the upgrade pathfor CDMA operatorsA route to market for operators that fail to win a licence• EVN Telecom and Hanoi Telecom (Vietnamobile) in Vietnam demonstrate thatoperators can use a sharing arrangement in order jointly to acquire a 3GlicenceCost-effective LTE roll-out• Net4Mobility in Sweden, which was the first LTE network-sharing agreement tobe announced21454-482
Cost savings through network sharingInfrastructure sharing brings benefits thatencourage support from regulators …• Consumer benefits: more widespread mobile services, faster network roll-out,increased choice of suppliers and lower cost of services• Sharing offers a cost-effective means of delivering mobile broadband servicesto rural communities which helps bridge the digital divide• May stimulate competition: e.g. shifting the focus of operators’ differentiationfrom coverage towards services, or by enabling new entrants to launch theirservices more rapidly• Environmental benefits: decrease in number of cell-sites, which reduces visualimpact and lowers energy consumption if power supplies shared• Pooling spectrum for RAN or backhaul operation is sometimes allowed, tooptimise the use of national spectral resources. However, operators are oftenrequired to use their assigned frequencies as a condition of RAN sharing4921454-482
Cost savings through network sharing50… and regulation is increasingly supportive• Passive infrastructure sharing is permitted in many countries worldwide• Active infrastructure sharing is less commonly supported, but isbecoming more widely considered, especially because of its potentialbenefits for rural broadband21454-482
Cost savings through network sharing51Examples of passive sharingCountry Date DetailsPoland July 2011 Polska Telefonia Cyfrowa (T-<strong>Mobile</strong>), and PTK Centertel (Orange) formed50:50 JV NetWorkS! to manage an infrastructure sharing agreement. Around3500 sites will be dismantled in the next three yearsDenmarkIrelandUnitedKingdomGermanyBelgiumFranceAustriaSwedenPolandCzech Rep.Denmark June 2011 TeliaSonera and Telenor will give each other access to their respectivenetwork towers in areas where they would otherwise have had to build theirown. The two companies will also establish a common infrastructurecompany that will operate the joint networkAustria April 2011 T-<strong>Mobile</strong> and Orange announced a network partnership agreementconcerning the joint use of their existing 3G infrastructure in rural areasCzechRepublicFebruary2011Telefónica O2 and T-<strong>Mobile</strong> signed an agreement on sharing 3G networks.The six-year cooperation covers infrastructureBelgium October 2009 BASE (KPN Group Belgium) and Mobistar agreed to jointly acquire and buildnew sites for their respective mobile networksSpainItalyItaly August 2009 Vodafone and Telecom Italia <strong>Mobile</strong> agreed to share passive infrastructure.The agreement covers existing and future passive network equipment, suchas civil works, electricity poles and pylons and energy systemsItaly July 2009 Telecom Italia <strong>Mobile</strong> and 3 struck a site sharing deal. This included: poles,cables, electricity supply and conditioning systems and other civilinfrastructureThis table represents only a selection of examples of passive infrastructure sharing. Omissionsinclude passive sharing agreements in the Netherlands and Cyprus which have been supersededby mergers and acquisitions while other deals have been superseded by active and active+sharing agreementsSpain,Germany,UK,March 2009Telefónica O2 and Vodafone, announced that they would share infrastructurein several European markets in an effort to cut costs and protect profitmarginsSpain January 2008 France Telecom’s Orange and TeliaSonera’s Xfera Moviles (operating underthe Yoigo banner) announced a five year agreement to share their networkinfrastructure in Spain21454-482Source: <strong>Analysys</strong> <strong>Mason</strong>, 2011
Cost savings through network sharing52Examples of active sharingCountry Date DetailsPoland July 2011 Polska Telefonia Cyfrowa (T-<strong>Mobile</strong>), and PTK Centertel (Orange) formed50:50 JV NetWorkS! to manage a RAN sharing agreementUnitedKingdomSwedenPolandFrance October 2010 Agreement between SFR, Orange, and Bouygues Telecom for 3G (HSPA+at 900 Mhz) active Radio Access Network (RAN) sharingUKUKDecember2007February2010T-<strong>Mobile</strong> and H3G founded a 50:50 JV company, MBNL, to consolidate their3G networks, with estimated cost savings of around GBP2 billionOrange and T-<strong>Mobile</strong> agreed to spectrum and RAN sharing. 10 000 basestations to be fitted with Huawei's FlexiRAN architectureSweden April 2009 Tele2 and Telenor formed a JV, Net4Mobility, to build shared national LTEand GSM networksFranceSpainNovember2006RAN-sharing agreement Orange and Vodafone for towns with populationsbelow 25 000Spain21454-482Source: <strong>Analysys</strong> <strong>Mason</strong>, 2011
Cost savings through network sharing53Even deeper sharing – spectrum sharingCountry Date Details StatusSwedenPoland July 2011 Polska Telefonia Cyfrowa (T-<strong>Mobile</strong>), and PTK Centertel(Orange) formed 50:50 JV NetWorkS! to manage a RANsharing agreementFranceOctober2010Agreement between SFR, Orange, and BouyguesTelecom for 3G (HSPA+ at 900 Mhz) active Radio AccessNetwork (RAN) sharingAround 3500 siteswill be dismantledin the next threeyears.ActiveUnitedKingdomUKDecember2007T-<strong>Mobile</strong> and H3G founded a 50:50 JV company, MBNL,to consolidate their 3G networks, with estimated costsavings of around GBP2 billionActiveFranceUKFebruary2010Orange and T-<strong>Mobile</strong> agreed to spectrum and RANsharing. 10,000 base stations to be fitted with Huawei’sFlexiRAN architectureActiveSpainSweden April 2009 Tele2 and Telenor formed a JV, Net4Mobility, to buildshared national LTE and GSM networksSpainNovember2006RAN-sharing agreement France Telecom and Vodafonefor towns with populations below 25 000ActiveActive21454-482Source: <strong>Analysys</strong> <strong>Mason</strong>, 2011
54ContentsTerry Norman: Facts and figures on traffic and costsThe commercial context for network sharing and towercompaniesThe cost to support traffic growthCost savings through network sharing<strong>Analysys</strong> <strong>Mason</strong> Research21454-482
<strong>Analysys</strong> <strong>Mason</strong> Research55We offer a vast portfolio of subscription researchprogrammesResearch practicesResearch programmesResearch programmesConsumerServicesFixed Broadband<strong>Mobile</strong> Broadband<strong>Mobile</strong> Contentand ApplicationsVoiceEnterpriseServicesEnterprise (focusing on M2M, cloud services and SMEs)RegionalMarketsEuropeCountryReportsCoreForecastsTelecomsMarket MatrixThe MiddleEast andAfricaAsia–PacificAsia–PacificIndia WirelessIndiaValue-AddedServicesNetworkTechnologiesFixed NetworksWireless NetworksSpectrumTelecomsSoftwareBillingInfrastructureSolutionsServiceAssuranceTelecoms SoftwareStrategiesCustomer CareTelecoms SoftwareMarket SharesServiceFulfilmentTelecoms SoftwareForecastsService DeliveryPlatform StrategiesService ProviderStrategies• <strong>Analysys</strong> <strong>Mason</strong>’s portfolio of research programmes offers a mixture of qualitative and quantitative market intelligence, to which manyof the world’s leading network operators, vendors, regulators and investors subscribe. Core outputs include:‒ annual five-year forecasts for all regions globally and at country level for 30 European countries and 28 Asia–Pacific and theMiddle East and Africa countries covering all aspects of services, subscribers and revenue‒ annual or quarterly data for all regions globally and at country level (as above) that provides historic service, subscriber andrevenue data, ongoing tracking of market share and leading offers for key services21454-482
<strong>Analysys</strong> <strong>Mason</strong> Research56Related publications from <strong>Analysys</strong> <strong>Mason</strong>Recent publications• Wireless network traffic worldwide: forecasts and analysis 2011–2016• Spectrum: valuing that which has no intrinsic value• Fixed Internet traffic worldwide: forecasts and analysis 2011–2016Forthcoming publications• The case for Wi-Fi offload• The changing shape of the radio access network and the impact ofsmall cell solutions• Site sharing is becoming increasingly important to MNOs in the MiddleEast21454-482
57Briefing agendaMarco Cordoni: Tower market demand and supplyTerry Norman: Facts and figures on traffic and costsLluís Borrell: <strong>Broadcasting</strong> tower opportunities21454-482
58ContentsLluís Borrell: <strong>Broadcasting</strong> tower opportunitiesWhy?Initial considerationsTrends and challenges – impact on investment caseFuture opportunities21454-482
Why?<strong>Broadcasting</strong> tower investments have gainedmomentum over the last 12 monthsM&A momentum – Four transactions worth in total over EUR1.1 billion• Date: December 2010CzechRepublicPolandNetherlandsSpain• Target: CRA• Buyer: Macquarie• Seller: Falcon (Mid Europa)• Deal value: around EUR574 million (source: The Australian)• Date: March 2011• Target: Emitel• Buyer: Montagu• Seller: Telekom Polska• Deal value: around EUR432 million (source: unquote.com)• Date: June 2011• Target: Alticom• Buyer: Infracapital• Seller: TDF• Deal value: around EUR100 million from TDF (source: Telecompaper)• Date: October 2011• Target: Axion (regional player)• Buyer: Antin Infrastructure Partners• Seller: TDF• Deal value: around EUR115 million (source: InfraNews)5921454-482
60ContentsLluís Borrell: <strong>Broadcasting</strong> tower opportunitiesWhy?Initial considerationsTrends and challenges – impact on investment caseFuture opportunities21454-482
Initial considerations • European broadcasting towers 61<strong>Broadcasting</strong> towers in Europe – some initialconsiderations<strong>Broadcasting</strong> tower companies in Europe are different from typicaltower companies such as American <strong>Towers</strong>• Different service mix• Greater readiness to outsource the transmission network• Stronger importance of regulation21454-482
Initial considerations • European broadcasting towersTerrestrial remains the most important TVdistribution platform in the EU …HHs terrestrial positionin selected EU countries (2009/2010)• Terrestrial remains the mostimportant TV distribution platformin the EU:e.g. more than 33% ofhouseholds• In some countries, terrestrial is asecond platform and enjoys agood position:e.g. Finland• In some countries, terrestrialplays a limited role, well behindcable and satellite6221454-482Main distribution platformSecond distribution platformThird and fourth distribution platformSource: Ofcom, EAO, national regulators
Initial considerations • European broadcasting towers… DTT/DSO has been a major driver of change inEurope and will continue to be so until 2015• DTT/DSO has had a significanteffect on the structure of the TVmarket• More than 13 countries havealready successfully completedthe analogue switch-off• In the majority of EU countries,the transition is in progress andis expected to be completed by2013Progress of DSO in Europe63ASO completeAnalogue switch-off (ASO) underwayDSO not formally launched21454-482Source: DigiTAG, Ofcom, <strong>Analysys</strong> <strong>Mason</strong>
Initial considerations • European broadcasting towers<strong>Broadcasting</strong> tower companies are the mostcommon in Europe but other options exist …SICRTPTVI21454-482Ownership of main terrestrialbroadcast network operatorsRTE NLAbertisArqivaNorkringTeracomAlticomTV channelsTelecoms groups<strong>Broadcasting</strong> tower companiesNorkringTeracomMedia BroadcastDigitaLeviraTDF Swisscom ORS Antenna HungáriaNorkringOiVMediasetRaiWayČeské RadiokomunikaceDigea• <strong>Broadcasting</strong> tower companies arethe most common approach acrossEurope• In some markets, major telecomsgroups provide broadcasting towerservices• TV channels have their ownbroadcasting infrastructure in a fewcountriesSource: Ofcom, EAO, national regulators64
Initial considerations • European broadcasting towers… they can occupy different positions in thevalue chain and use various modelsStandard market structure – one main broadcasting tower operator65ChannelsMultiplexingDistribution to towers<strong>Broadcasting</strong> towersFrance TDF TDFSpain Abertis Telecom Abertis TelecomNetherlandsAlticomUK Arqiva Arqiva ArqivaCzechRepublicCRa CRa CRaVertically integrated market structure – several broadcasting tower operatorsChannelsMultiplexingDistribution<strong>Broadcasting</strong>ItalyRAI DTTchannelsRai, RaiWay RaiWay21454-482Source: Public sources, <strong>Analysys</strong> <strong>Mason</strong>
Initial considerations • European broadcasting towersThe long-term sustainability of DTT is determinedby a number of factorsSuccess of DTT66Content• Breadth and quality of content on DTT: number of channels availability of premium content pay-TV offerings• All this is determined by the willingness ofbroadcasters to join the DTT platformQuality• Technology and quality of service (QoS) forDTT vis-à-vis other platforms: coverage possibility/need for a return path QoSPrices• Affordability of DTT is more favourablethan other digital platforms, in terms of: set-up prices (one-off payments ofset-top boxes (STBs), otherequipment such asdishes and connections) recurring (e.g. monthly) feesPlatforms• Development of other platforms tomaintain a competitive edge: technological improvements to enablecontent-rich services imposition of regulatory measures21454-482
Initial considerations • European broadcasting towersSMP remedies are often, but not always, imposedto favour competitionTypical process for SMP designation and remedies671Market/submarketdefinition2Three-criteria testFailedNo ex-ante regulation(but ex-post could apply)PassedEx-ante regulationapplicable3SMPRemedies• Transparency• Non discrimination• Obligation to publish a reference offer• Access obligation• Price control (methodology usually not specified)21454-482Source: <strong>Analysys</strong> <strong>Mason</strong>
68ContentsLluís Borrell: <strong>Broadcasting</strong> tower opportunitiesWhy?Initial considerationsTrends and challenges – impact on investment caseFuture opportunities21454-482
Trends and challenges • Impact on investment caseTrends and challenges – key issues to beinvestigated69Selected key factors Key issues RelativeimportanceRole of DTT as a platformDominant and marginal role and impact on pricingDTT/DSOMUXes (capacity)Broadcasters economics –traditional and newOver-the-top services growthValue chain positionSpectrum/HDTV/Pay DTTRadio – DABRegulatory evolutionIncumbent or challengerProgress against DSOPotential for growth or reductionPressure on number of clients and revenue per clientThreat to viability of the platform in the short or longtermRevenue and margin opportunityNeutral or potential upsidePotential for analogue radio switch-off?Potential for ex-ante or ex-post pressureExtent of reliance on incumbent networkLow21454-482HighSource: <strong>Analysys</strong> <strong>Mason</strong>
Pay DTT householdpenetration (%)200820092010201120122013201420152016Trends and challenges • Impact on investment caseFTA DTT model is based on large presence butniche pay-DTT model can also succeedForecast of pay-DTT household penetration (%) in selected countries25%7020%15%10%5%0%European averageFranceItalyNetherlandsSpainUK• FTA DTT has been most successful in countries where terrestrialwas the main historical platform• Except for Italy and Sweden (c. 15% of households), pay DTThas had limited success typically: penetration of less than 10% of households it has had little impact on the overall pay-TV market21454-482Source: <strong>Analysys</strong> <strong>Mason</strong>
Penetration as % of TV setsTrends and challenges • Impact on investment caseDTT role can significantly increase when taking intoaccount secondary TV sets• In the UK, over 25% of HHshad a secondary TV set relianton terrestrial• Secondary TV sets seem alsoto be an important element forcountries with limitedpenetration of DTT for primarysets like GermanyUK penetration of analogue terrestrial onprimary and secondary TV sets, 2006–1070%60%50%40%30%20%63.9%21.4%50.4%39.5%31.0%24.4%7110%13.6%11.2%8.7% 7.3%0%2006 2007 2008 2009 2010Analogue terrestrial on primaryAnalogue terrestrial on secondary21454-482Source: Ofcom digital progress update Q4/10
Trends and challenges • Impact on investment caseDTT spectrum can be awarded at different levelscreating different business modelsUK – Distribution of multiplexesand transmissionMUX 1 MUX 2 MUX A MUX B MUX C MUX DFrance – Distribution of multiplexesand transmission72MUX 1 MUX 2 MUX 3 MUX 4 MUX 5 MUX 6TV channelsBBC1,BBC2,CBBC,BBC3,BBC News,BBC RedButtonITV1, ITV1+1, ITV2,Channel 4,Channel4+1, More4,E4,Channel 5,RabbitITV3, QVC, bidtv, ITV2+1, E4,5*, 5 USA,Quest,Challenge,CITV, TeletextHols, 1-2-1DatingBBC4,CBeebies,BBCParliamentPick TV,Dave, Daveja vu, E4+1,The BigDeal,Create andCraft, Pricedrop,GemsTV, PickTV+1, FoodNetworkYesterday,Film4,4Music, Viva,Ideal World,ITV4, Rocks& Co, RussiaToday, AlJazeeraEnglish, SkyTextTV Channels(licenceholder)France 2France 3France ÔFrance 5LCP/Public SénatLocal TVFrance 4 Canal +I-Télé Canal+ HDBFM TV Canal +Direct 8 CinemaDirect Star Canal +Gulli SportTPS StarPlanète+CFootM6W9ParisPremièreNT1Arte HDTF1 HD TF1France 2 HD ArteM6 HD TMCTF6LC1EurosportFranceNRJ 12Multiplex(licenceholder)ModulationschemeBBC Digital 3&4(ITV + C4)SDN(ITV)BBCArqiva(NGW)Arqiva(NGW)16-QAM 64-QAM 64-QAM 16 QAM 16QAM 16QAMMultiplexmanagerCompressiontechnologySociété deGestion duRéseau(FranceTélévisions)NouvellesTVNumériques(Lagardere)Cm. DuNumériqueHertzien(Canal Plus)MPEG-2 MPEG-2 MPEG-4 MPEG-2/MPEG-4Multi 4 Multiplex R5 SMR6 (TF1)(Sociétéopératrice dumultiplex R4)MPEG-4MPEG-2/MPEG-4MultiplextransmissionproviderArqivaMultiplextransmissionproviderTDF and, to a lesser extent, Towercast21454-482Source: DTT channel/service allocation by multiplex,Digital TV Group (DTG)
Trends and challenges • Impact on investment caseWith DTT/DSO, EU broadcasting markets are gettingmore competitive in number of TV channelsEvolution of competition level (HHI*)by market in selected countries (2004–09)2,5002,0001,5001,00050021454-482DenmarkSpainSwedenAustriaItaly• Overall, as a guideline, if: HHI>1800, a market is concentrated 1800>HHI >1000, a market is moderatelyconcentrated HHI
EUR millionTrends and challenges • Impact on investment case74DTT/DSO and financial crisis are putting pressureon broadcasters – TowerCos are somehow isolated21454-4822,0001,8001,6001,4001,2001,0008006004002000Evolution of operating revenues for Europe’s majorcommercial TV groups, at 2005 prices (2001–10)-35% -45% -14% -21% -21%A3 ITV TF1 TV4 RTL2001 2002 2003 2004 2005 2006 2007 2008 2009 2010Operating budget cuts could put pressure on transmission costs but they arerelatively small for larger players (only a few % of revenues)Source: EAO, EIU, <strong>Analysys</strong> <strong>Mason</strong>. Excludes Mediaset,whose revenues include many other elementsRevenuegrowth,2006–10
Trends and challenges • Impact on investment caseSustainability of TV channels on DTT might beassessed based on broadcasters’ economics75Selected examplesDTT transmission costsas % revenuesLong-term sustainability?Historical broadcaster A Less than 1% DTT costs are not main concernHistorical broadcaster B Less than 3% DTT costs are not main concernHistorical broadcaster C Less than 3% DTT costs are not main concernNew broadcaster A Less than 20% DTT costs are significant butbroadcaster might be able to copewith itNew broadcaster B Between 20% and 40% It might require some innovativepricing to favor a new entrantFuture new broadcaster More than 40% Unlikely to be sustainable long term –probably requires closer look intoincremental revenues21454-482Source: <strong>Analysys</strong> <strong>Mason</strong>
PB per monthTrends and challenges • Impact on investment caseOTT might challenge DTT in the long term asvendors forecast an explosion of video trafficInternet video traffic in Europe (2010–15) • Internet video-to-TV traffic will increase100009000800070006000500040003000200010000Central and EasternEuropeWestern Europe2010 2011 2012 2013 2014 201514-fold in Western Europe and 24-fold inEastern Europe between 2010 and 2015• In the UK, consumption of video deliveredthrough the Internet to a video screen will risefrom 8% of total Internet video traffic in 2010 to14% in 2015• In Germany, Internet video will account formore than half of all Internet consumption by2013• In France, 67% of broadband connections willexceed 10Mbit/s in 2015, up from 36% today• The average broadband speed in Central andEastern Europe in 2015 will be 20Mbit/sWith a 58% CAGR over five years, this forecast would support an aggressive anddisruptive development in connected TV space7621454-482Source: Cisco VNI Forecasts 2011
Consumption of online video vs TV (min)Trends and challenges • Impact on investment caseOnly if you consider OTT to substitute linear TV thismight pose a threat – this seems long termScenario 1 – Online video iscomplementary to traditional TV250Scenario 2 – Online video as asubstitute for traditional TV77200150100500TVOnline Video21454-482
Trends and challenges • Impact on investment case78ConclusionSelected key factorsRole of DTT as a platformDTT/DSOMUXes (capacity)Broadcasters’ economics –traditional and newOver-the-top services growthLicensing/Value chain positionSpectrum/HDTV/Pay DTTRadio – DABRegulatory evolutionIncumbent or challengerComments and lessonsPotential for both large penetration (FTA) and smallpenetration (pay TV)Significant change pre- and post-DSODifferent models exists – this will affect the revenue andmargin profilesNew TV channels economics will be more difficult and mightneed innovative commercial approachesProbably long term but needs to be assessed on a case-bycasebasisVery different models can be developedDigital dividend could be negativeUnlikely in the short to medium termDifferent approaches based on market definitionVery different models as incumbent or challenger21454-482Source: <strong>Analysys</strong> <strong>Mason</strong>
79ContentsLluís Borrell: <strong>Broadcasting</strong> tower opportunitiesWhy?Initial considerationsTrends and challenges – impact on investment caseFuture opportunities21454-482
Future opportunitiesDivestment and State sales could trigger newtransactions in 2012 and beyond? [1/2]CountryFor discussion – Selected main tower companies, shareholders andpotential transaction rationaleMain broadcastingtowercoMain shareholder(s)Type of tower companyPotentialtransactionrationale?Austria ORS ORF (60%), Medicur Holding (40%) TV channel State sale?80Belgium Norkring België Telenor Telecoms operator Non-core?Croatia OIV Republic of Croatia <strong>Broadcasting</strong> towerco State sale?CzechRepublicČeskéRadiokomunikaceMacquarie Infrastructure <strong>Broadcasting</strong> towerco RecenttransactionDenmark Teracom Danmark Teracom Group (Swedish state) <strong>Broadcasting</strong> towerco State sale?Estonia Levira TDF (49%) / Estonian State (51%) <strong>Broadcasting</strong> towerco Divestment?Finland Digita TDF <strong>Broadcasting</strong> towerco Divestment?France TDF TPG Capital <strong>Broadcasting</strong> towerco Unlikely?Germany Media Broadcast TDF <strong>Broadcasting</strong> towerco Divestment?Greece Digea Mega, ANT1, Alpha, Alter, Star, m andSkaiTV channelOutsourcing?Likely?21454-482Less likely?Unlikely?
Future opportunitiesDivestment and State sales could trigger newtransactions in 2012 and beyond? [2/2]CountryFor discussion – Selected main tower companies, shareholders andpotential transaction rationaleMain broadcastingtowercoMain shareholder(s)Type of tower companyPotentialtransactionrationale?Ireland RTÉ NL RTE – Irish state TV channel State sale?Italy RAI Way RAI – Italian state TV channel State sale?ElettronicaIndustrialeMediaset TV channel Outsourcing?Netherlands Alticom Infracapital <strong>Broadcasting</strong> towerco RecenttransactionNorway Norkring Telenor Telecoms operator Non core?Portugal RTP RTP – Portuguese State TV channel State sale?SIC SIC – Impresa TV channel Outsourcing?TVI TVI – Grupo PRISA TV channel Outsourcing?Slovenia Norkring d.o.o Telenor Telecoms operator Non core?Spain Abertis La Caixa, ACS, CVC <strong>Broadcasting</strong> towerco Follow up recentchangesSweden Teracom Teracom Group (Swedish State) <strong>Broadcasting</strong> towerco State sale?UK Arqiva CPPIB (48%), Macquarie (32%) <strong>Broadcasting</strong> towerco Unlikely?81Likely?21454-482Less likely?Unlikely?
82Contact detailsMarco CordoniPartnermarco.cordoni@analysysmason.com<strong>Analysys</strong> <strong>Mason</strong>Bush House, North West WingAldwychLondon WC2B 4PJUKTel: +44 (0)845 600 5244Fax: +44 (0)20 7395 9001Terry NormanPrincipal Analystterry.norman@analysysmason.com<strong>Analysys</strong> <strong>Mason</strong>Bush House, North West WingAldwychLondon WC2B 4PJUKTel: +44 (0)845 600 5244Fax: +44 (0)20 7395 9001Lluís BorrellPartnerlluis.borrell@analysysmason.com<strong>Analysys</strong> <strong>Mason</strong>José Abascal 44 4°28003 MadridSpainTel: +34 91 399 5016Fax: +34 91 451 8071www.analysysmason.com21454-482